TECSYS Inc. · TSX:TCS
TECSYS — Q3 2023 Earnings Presentation
23 slides from TECSYS's earnings presentation, March 2023

Slide 1: Investor Presentation Q3 2023
Investor Presentation Q3 2023 Committed to a Connected World
Slide 2: Safe Harbour
Safe Harbour The statements in this presentation relating to matters that are not historical fact are forward- looking statements that are based on management's beliefs and assumptions. Such statements are not guarantees of future performance, and are subject to a number of uncertainties, including
Slide 3: Our story is all about our customers
Our story is all about our customers Our Purpose: To empower good companies to be great. Our Position: To clarify uncertainty in the supply chain. Our Mission: To equip supply chain greatness. Our Vision: That good companies have the space to thrive. 3
Slide 4: Visionary provider of supply chain technology for the world's most complex supply networks
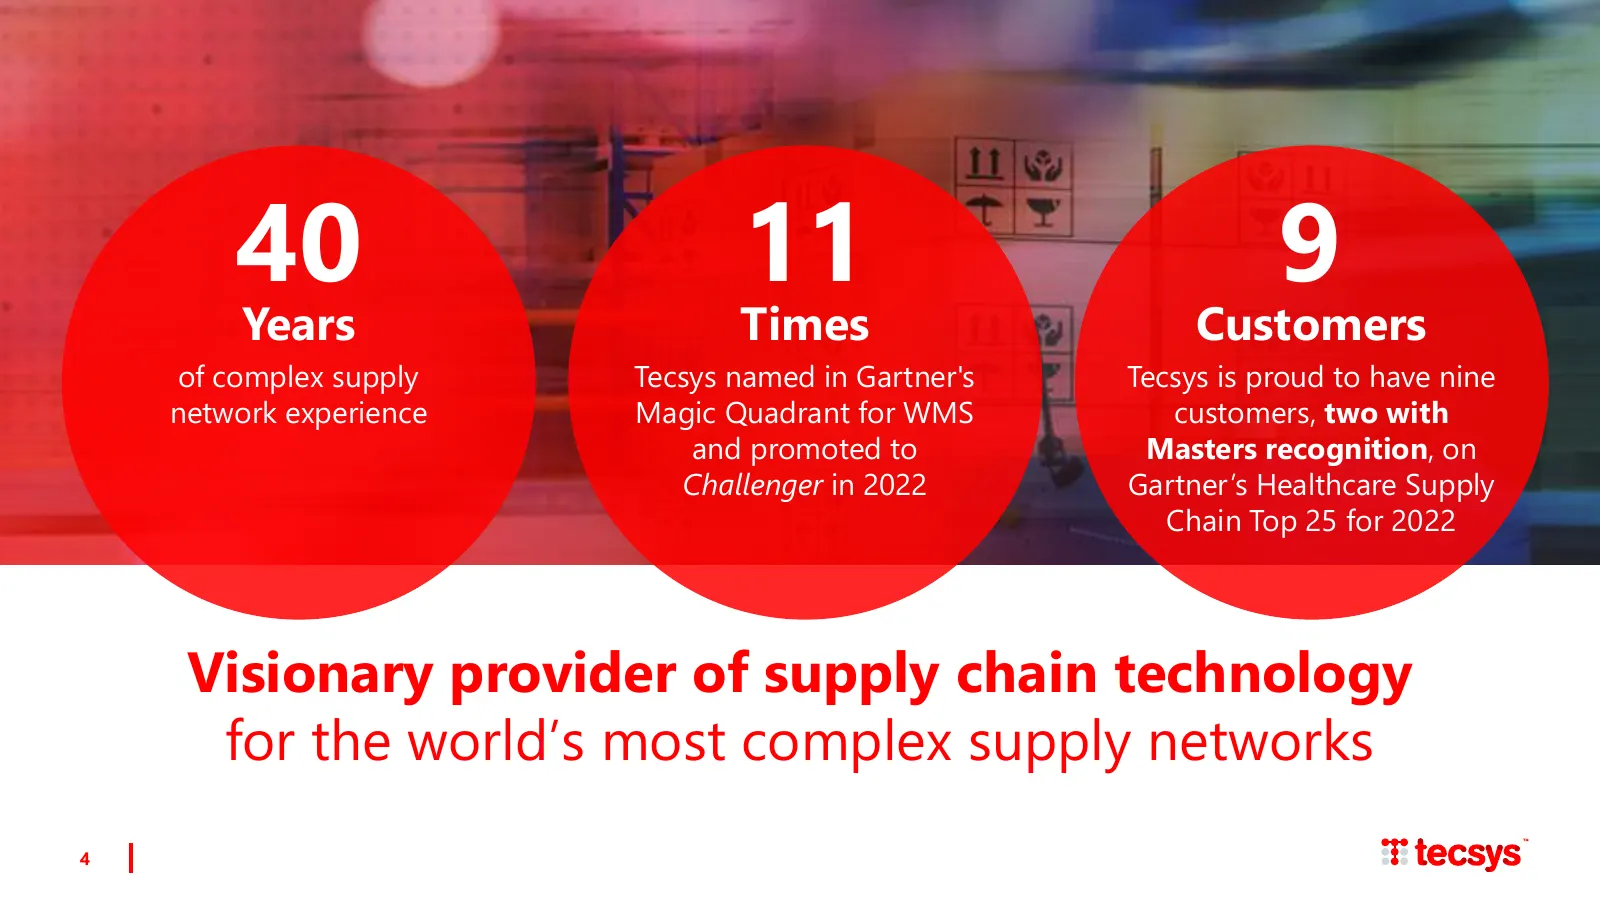
40 11 9 Years Times Customers of complex supply Tecsys named in Gartner's Tecsys is proud to have nine network experience Magic Quadrant for WMS customers, two with and promoted to Masters recognition, on Challenger in 2022 Gartner’s Healthcare Supply Chain Top 25 for 2022 Visionary provider of supp
Slide 5: Global Reach
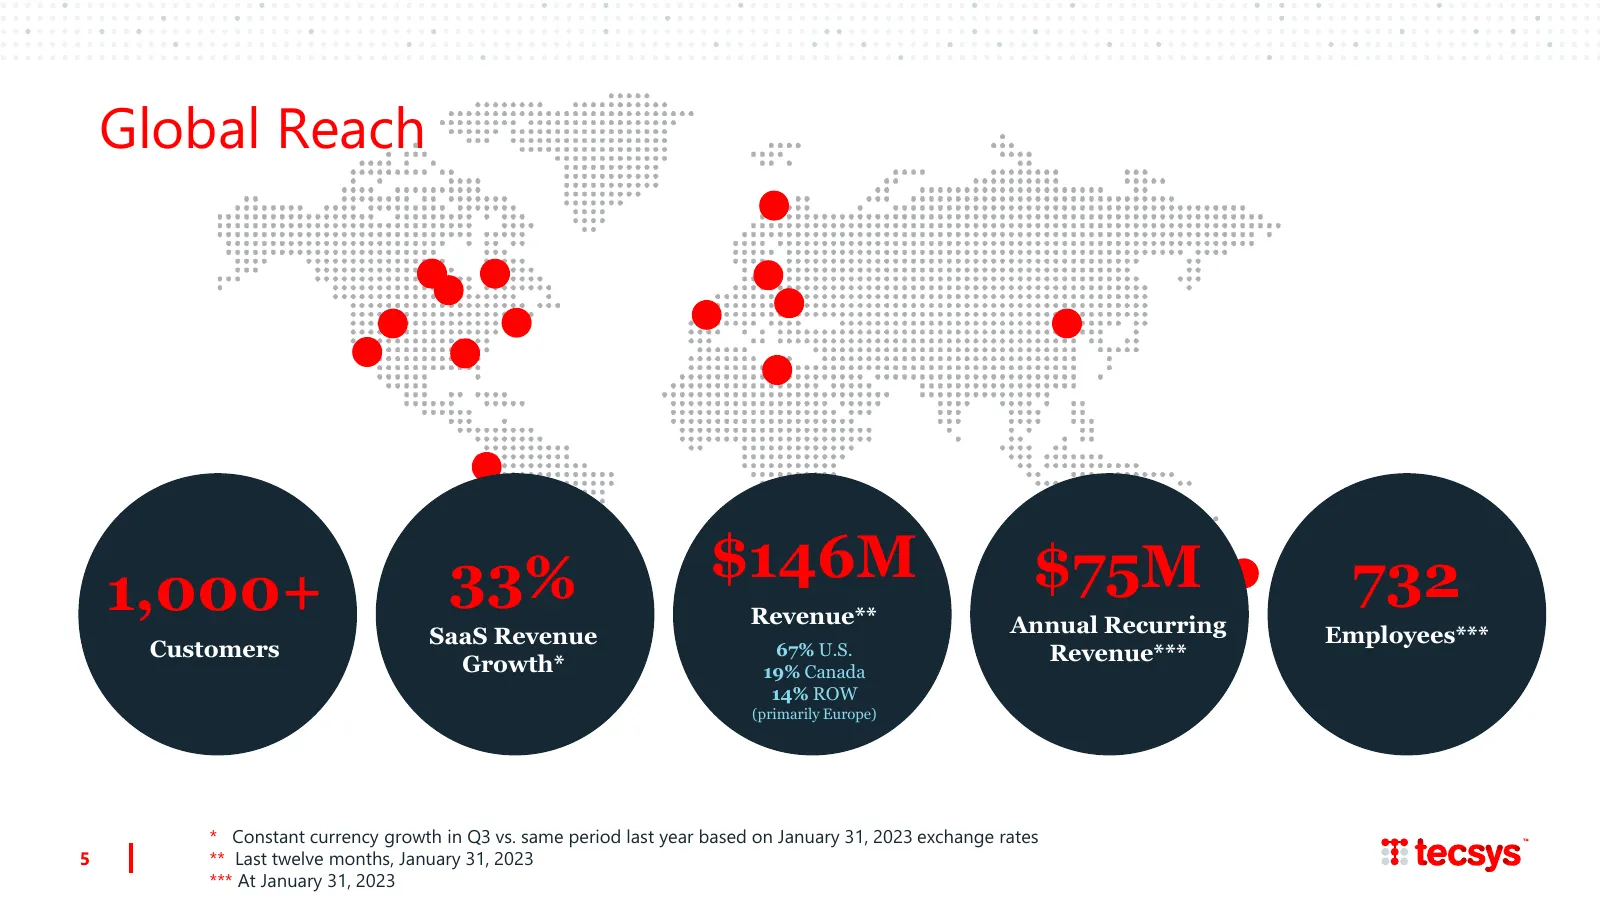
Global Reach 33% $146M $75M 732 1,000+ Revenue** Annual Recurring SaaS Revenue Employees*** Customers 67% U.S. Revenue*** Growth* 19% Canada 14% ROW (primarily Europe) * Constant currency growth in Q3 vs. same period last year based on January 31, 2023 exchange rates 5 ** Last twelve months, January
Slide 6: End-to-end Integrated Supply Chain Management Solutions
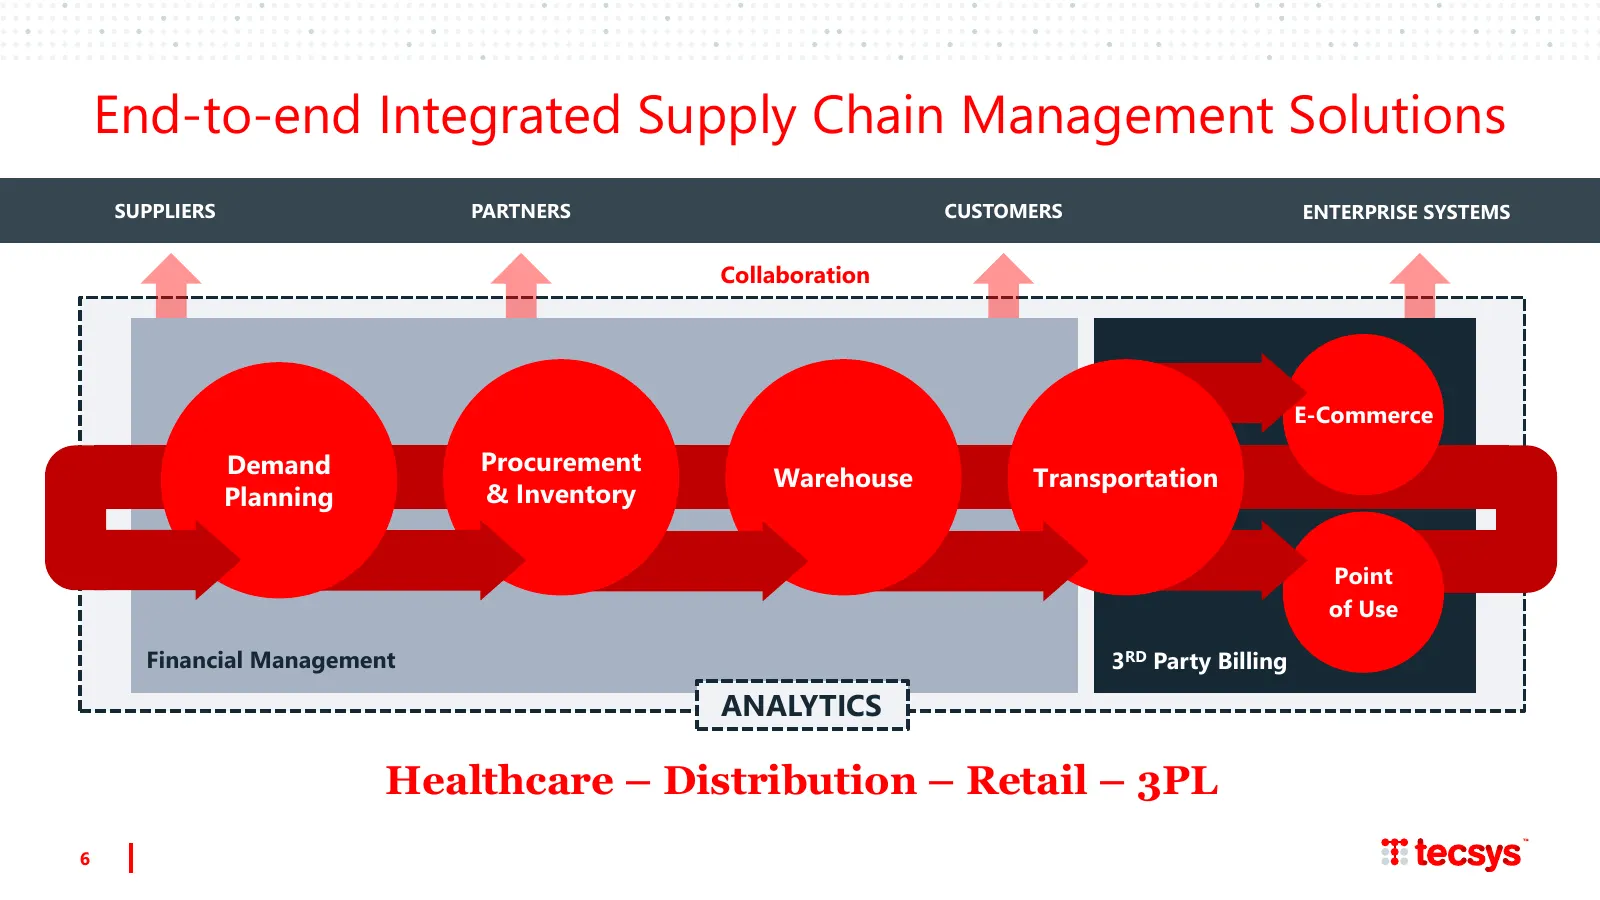
End-to-end Integrated Supply Chain Management Solutions SUPPLIERS PARTNERS CUSTOMERS ENTERPRISE SYSTEMS Collaboration E-Commerce Demand Procurement Warehouse Transportation Planning & Inventory Point of Use Financial Management 3RD Party Billing ANALYTICS Healthcare – Distribution – Retail – 3PL 6
Slide 7: Tecsys Momentum
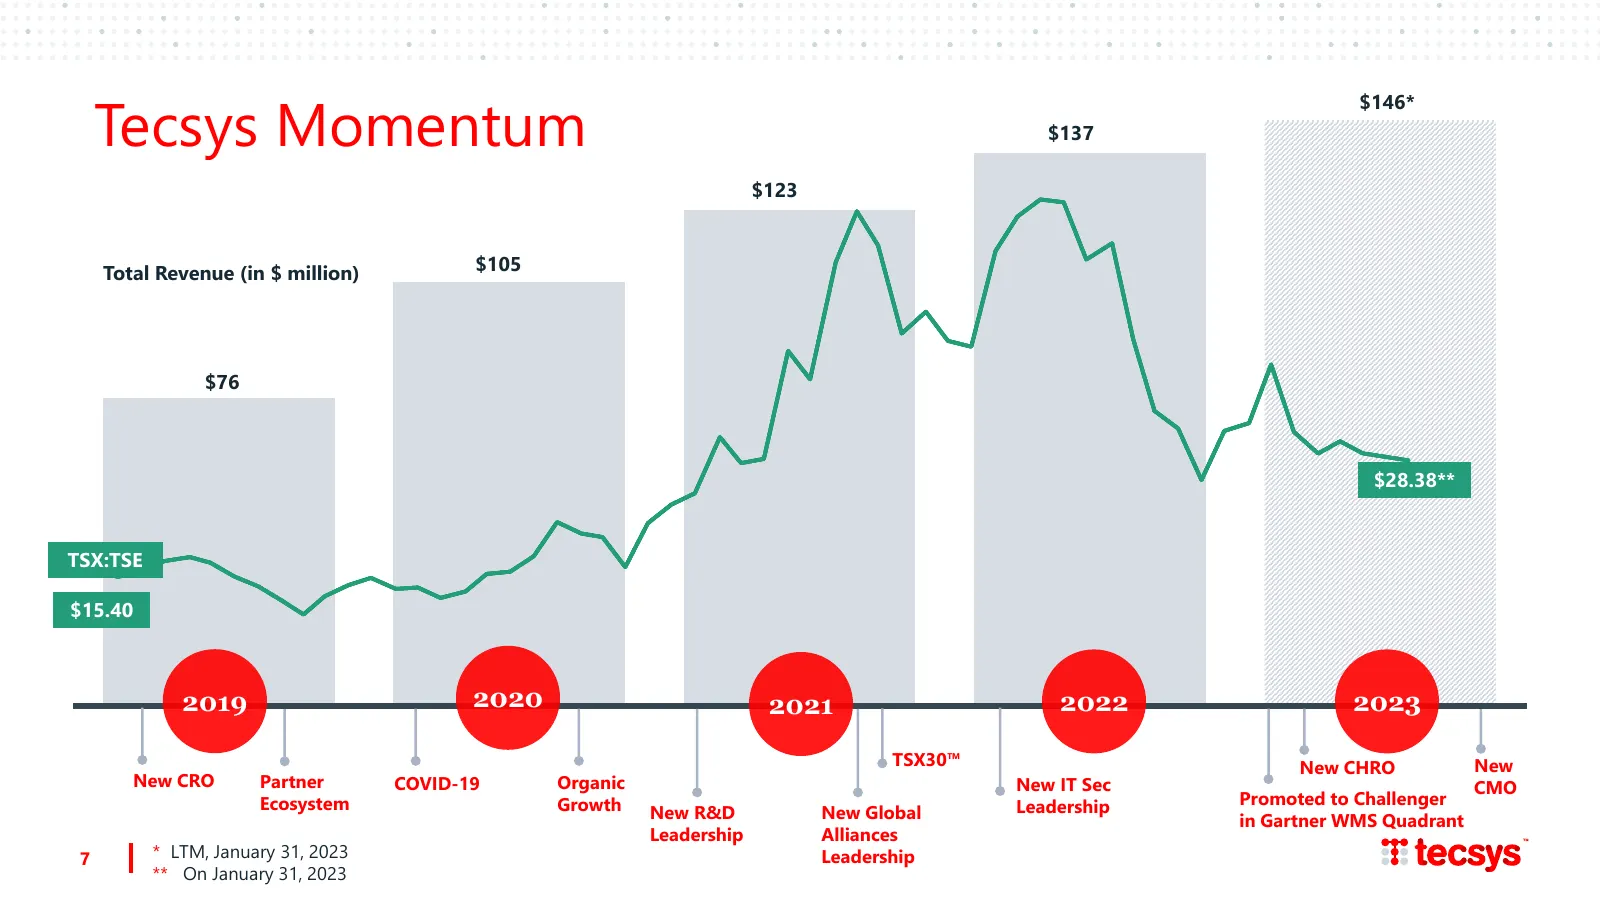
Tecsys Momentum $146* $137 $123 Total Revenue (in $ million) $105 $76 $28.38** TSX:TSE $15.40 2019 2020 2021 2022 2023 TSX30™ New CHRO New New CRO Partner COVID-19 Organic New IT Sec CMO Ecosystem Growth Leadership Promoted to Challenger New R&D New Global in Gartner WMS Quadrant Leadership Alliance
Slide 8: Key Markets
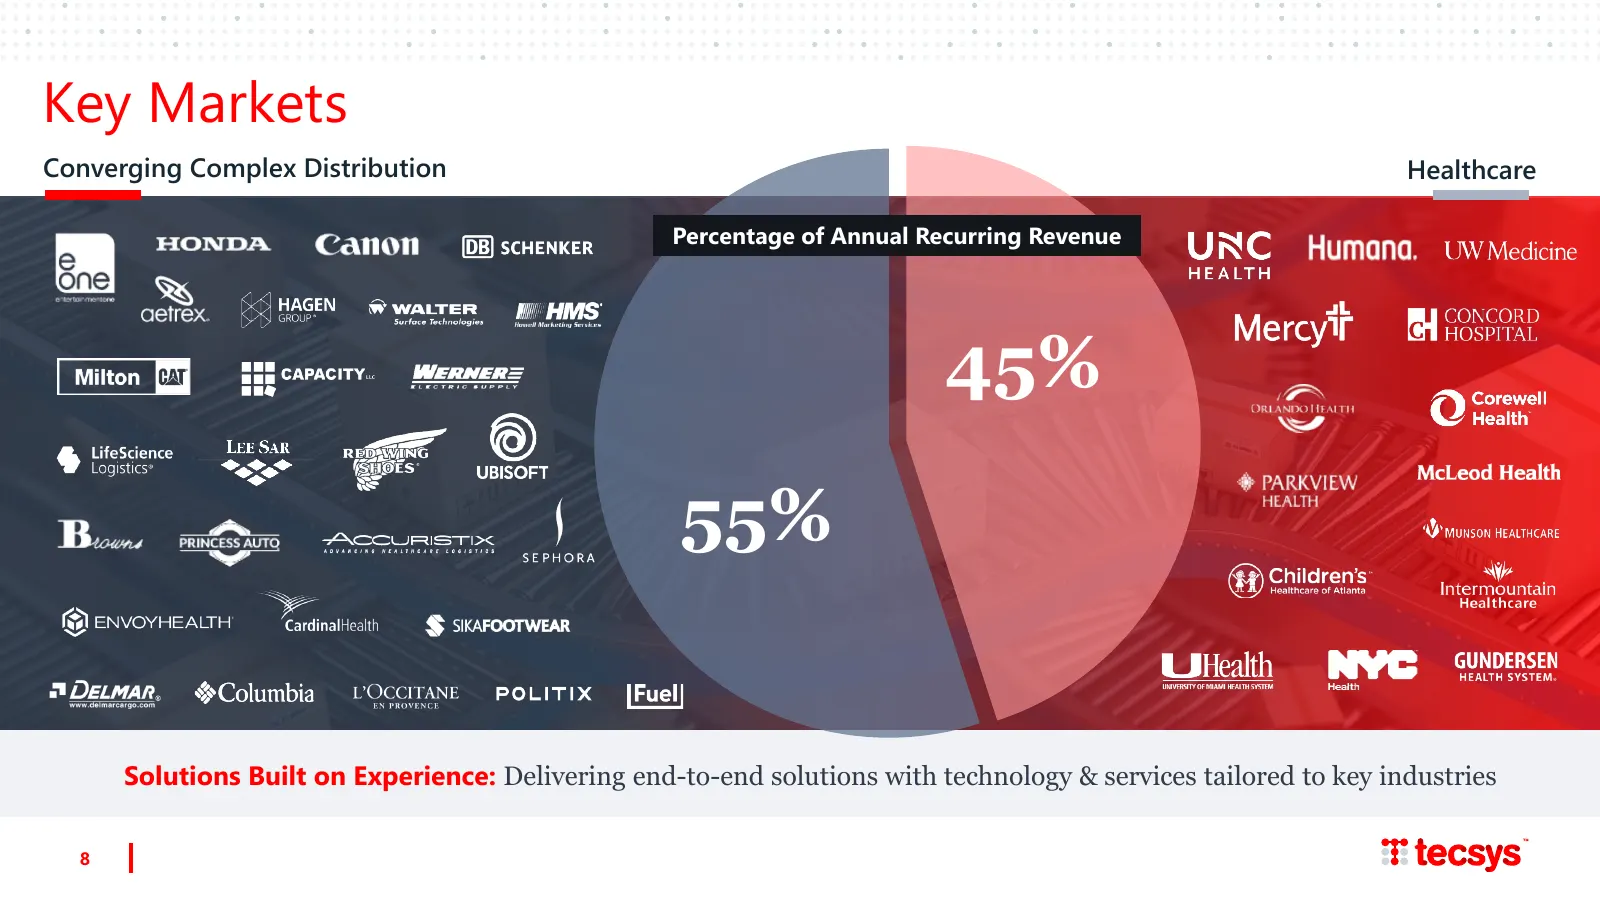
Key Markets Converging Complex Distribution Healthcare Percentage of Annual Recurring Revenue 45% 55% Solutions Built on Experience: Delivering end-to-end solutions with technology & services tailored to key industries 8
Slide 9: COVID-19 Exposed Weaknesses in Healthcare Supply Chains
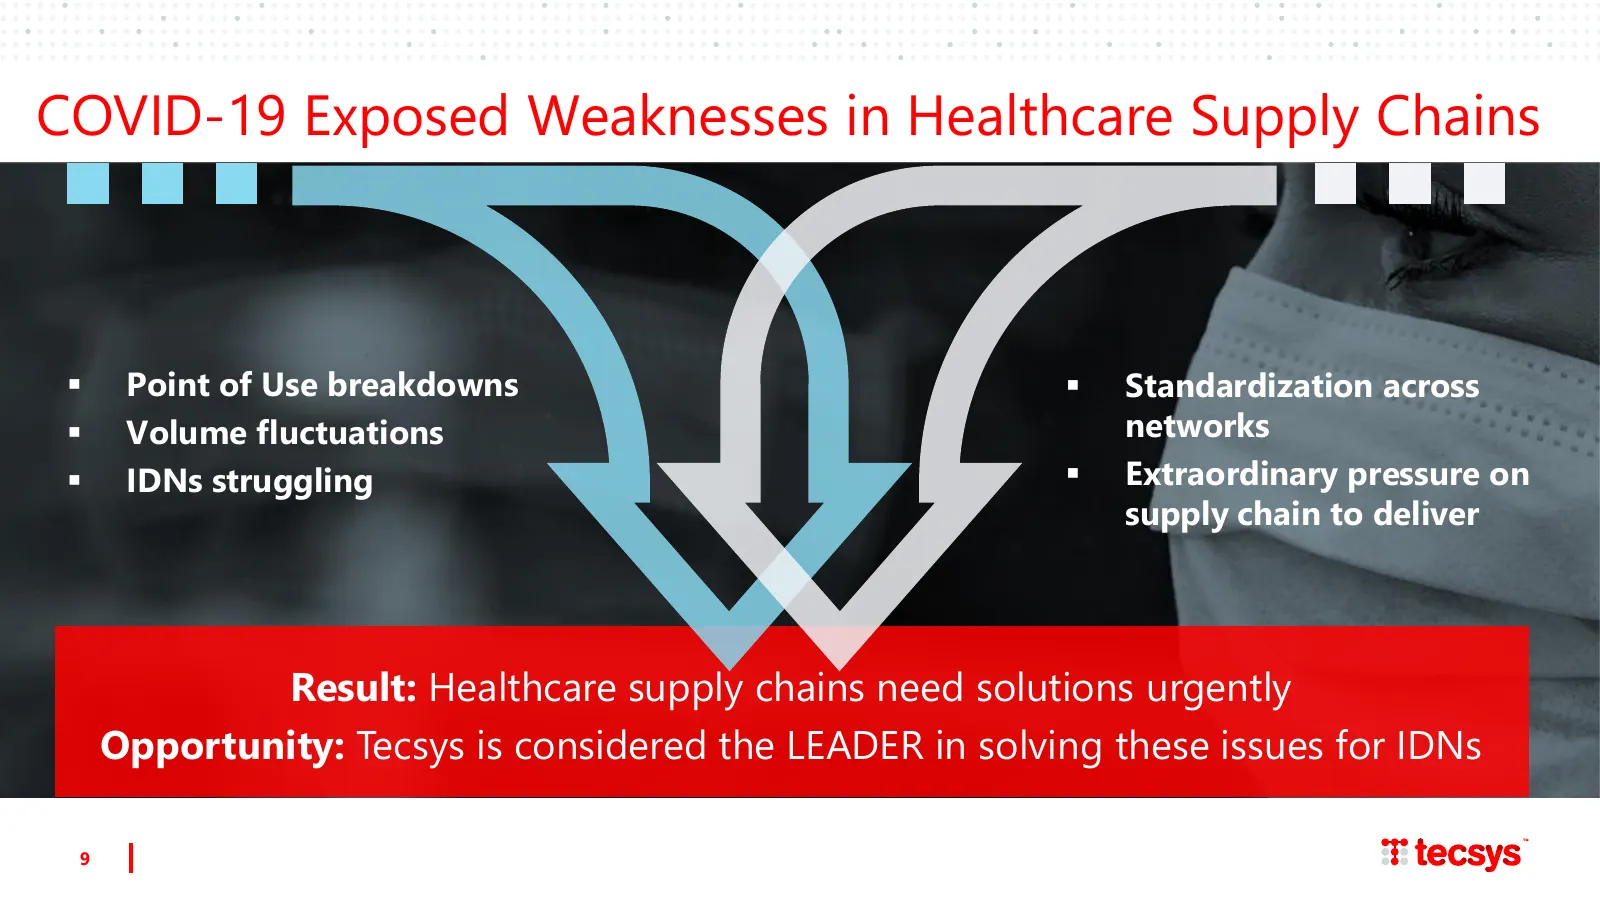
COVID-19 Exposed Weaknesses in Healthcare Supply Chains ▪ Point of Use breakdowns ▪ Standardization across ▪ Volume fluctuations networks ▪ IDNs struggling ▪ Extraordinary pressure on supply chain to deliver Result: Healthcare supply chains need solutions urgently Opportunity: Tecsys is considered t
Slide 10: Healthcare Market Opportunity
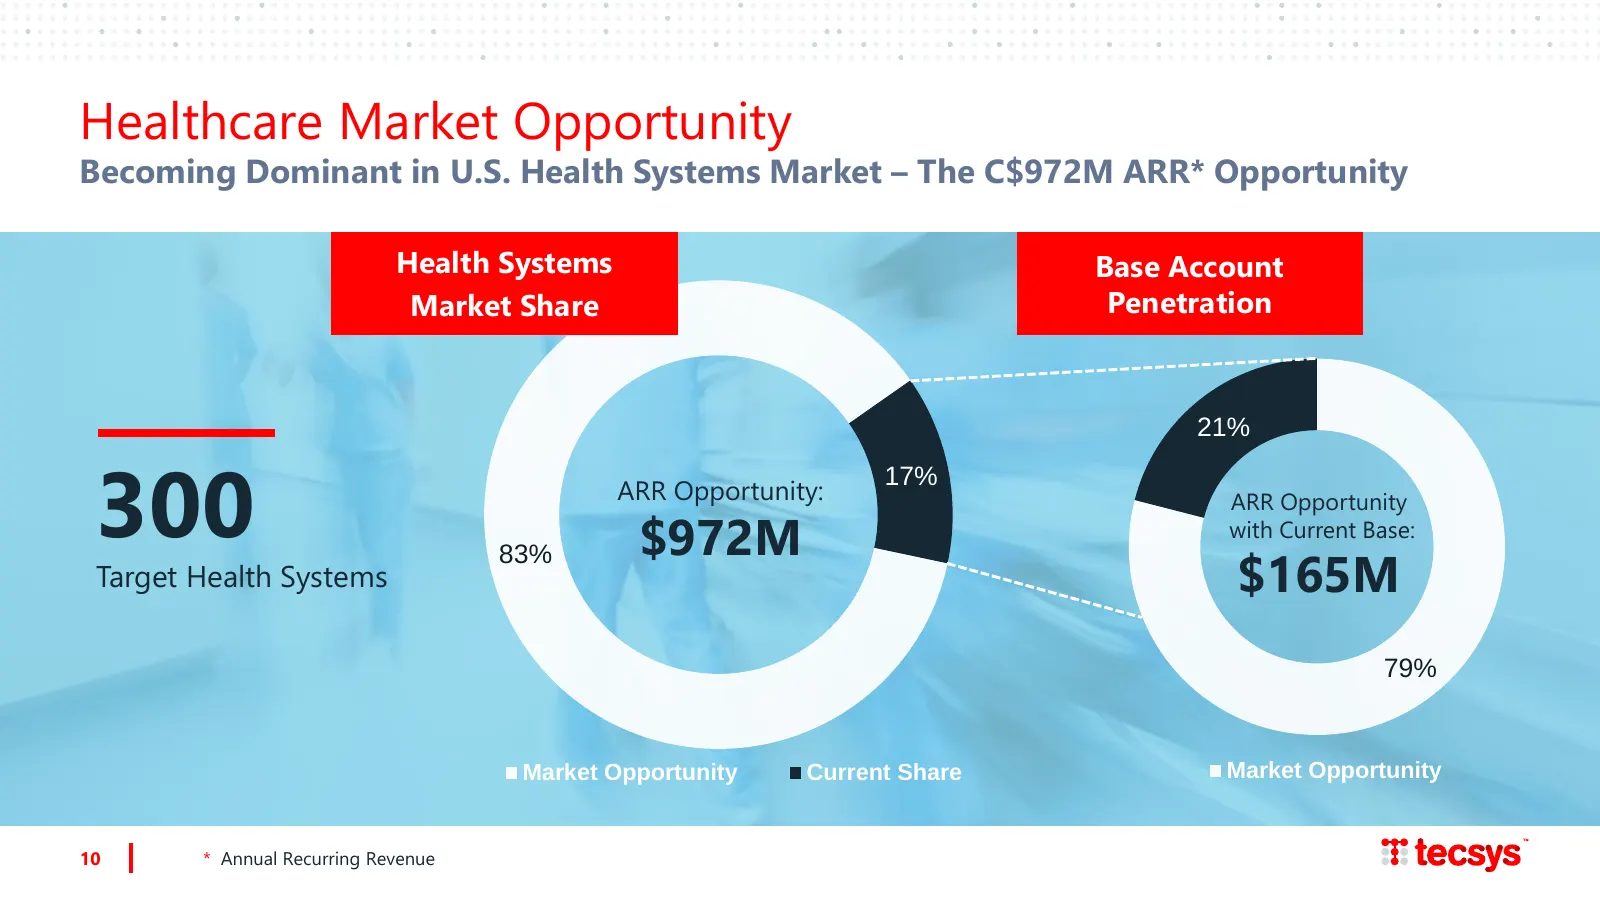
Healthcare Market Opportunity Becoming Dominant in U.S. Health Systems Market – The C$972M ARR* Opportunity Health Systems Base Account Market Share Penetration 21% 300 17% ARR Opportunity: ARR Opportunity $972M with Current Base: $165M 83% Target Health Systems 79% Market Opportunity Current Share
Slide 11: Brand Owner/Retail Convergence Drives Opportunity in Complex Distribution
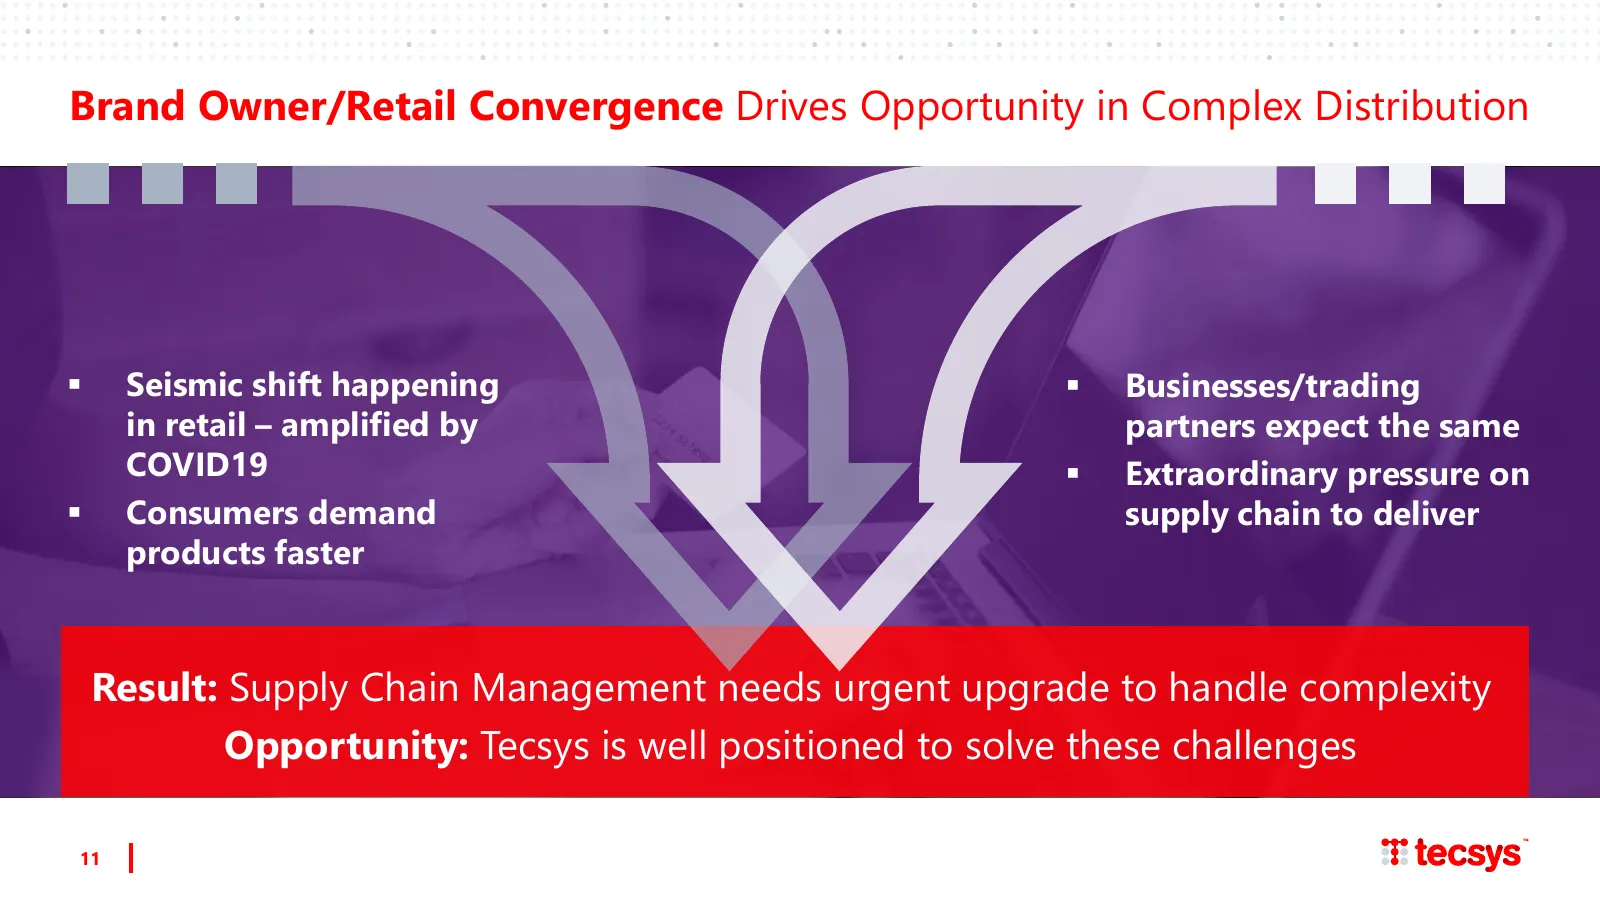
Brand Owner/Retail Convergence Drives Opportunity in Complex Distribution ▪ Seismic shift happening ▪ Businesses/trading in retail – amplified by partners expect the same COVID19 ▪ Extraordinary pressure on ▪ Consumers demand supply chain to deliver products faster Result: Supply Chain Management ne
Slide 12: Distribution Convergence Market Opportunity – $6B
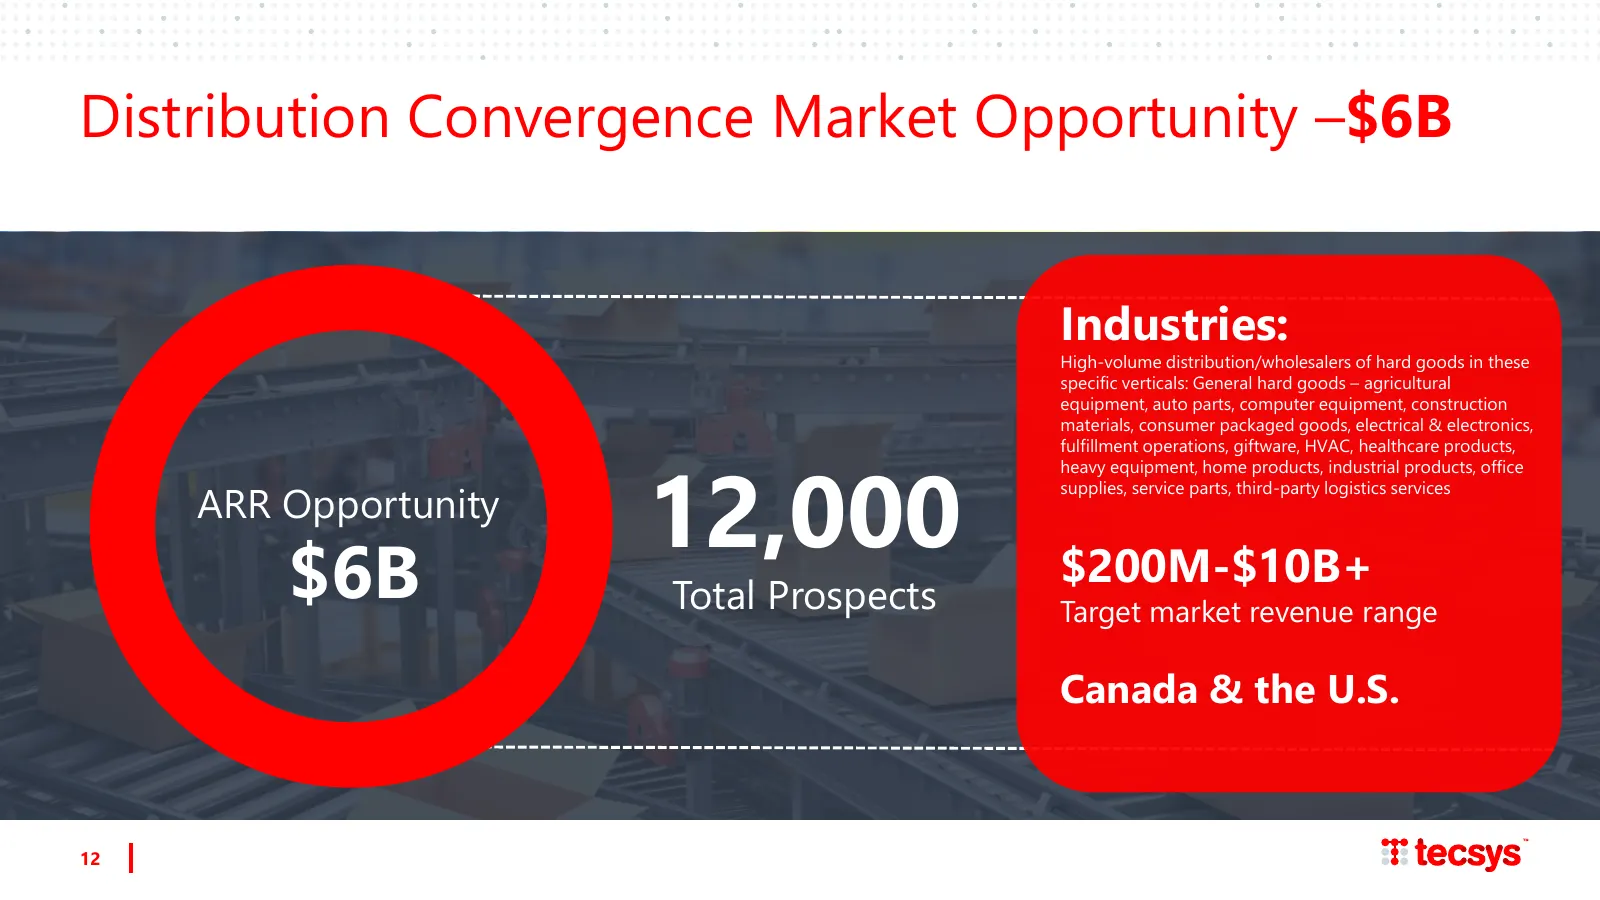
Distribution Convergence Market Opportunity –$6B Industries: High-volume distribution/wholesalers of hard goods in these specific verticals: General hard goods – agricultural equipment, auto parts, computer equipment, construction materials, consumer packaged goods, electrical & electronics, fulfill
Slide 13: Partner Ecosystem - Accelerate Growth
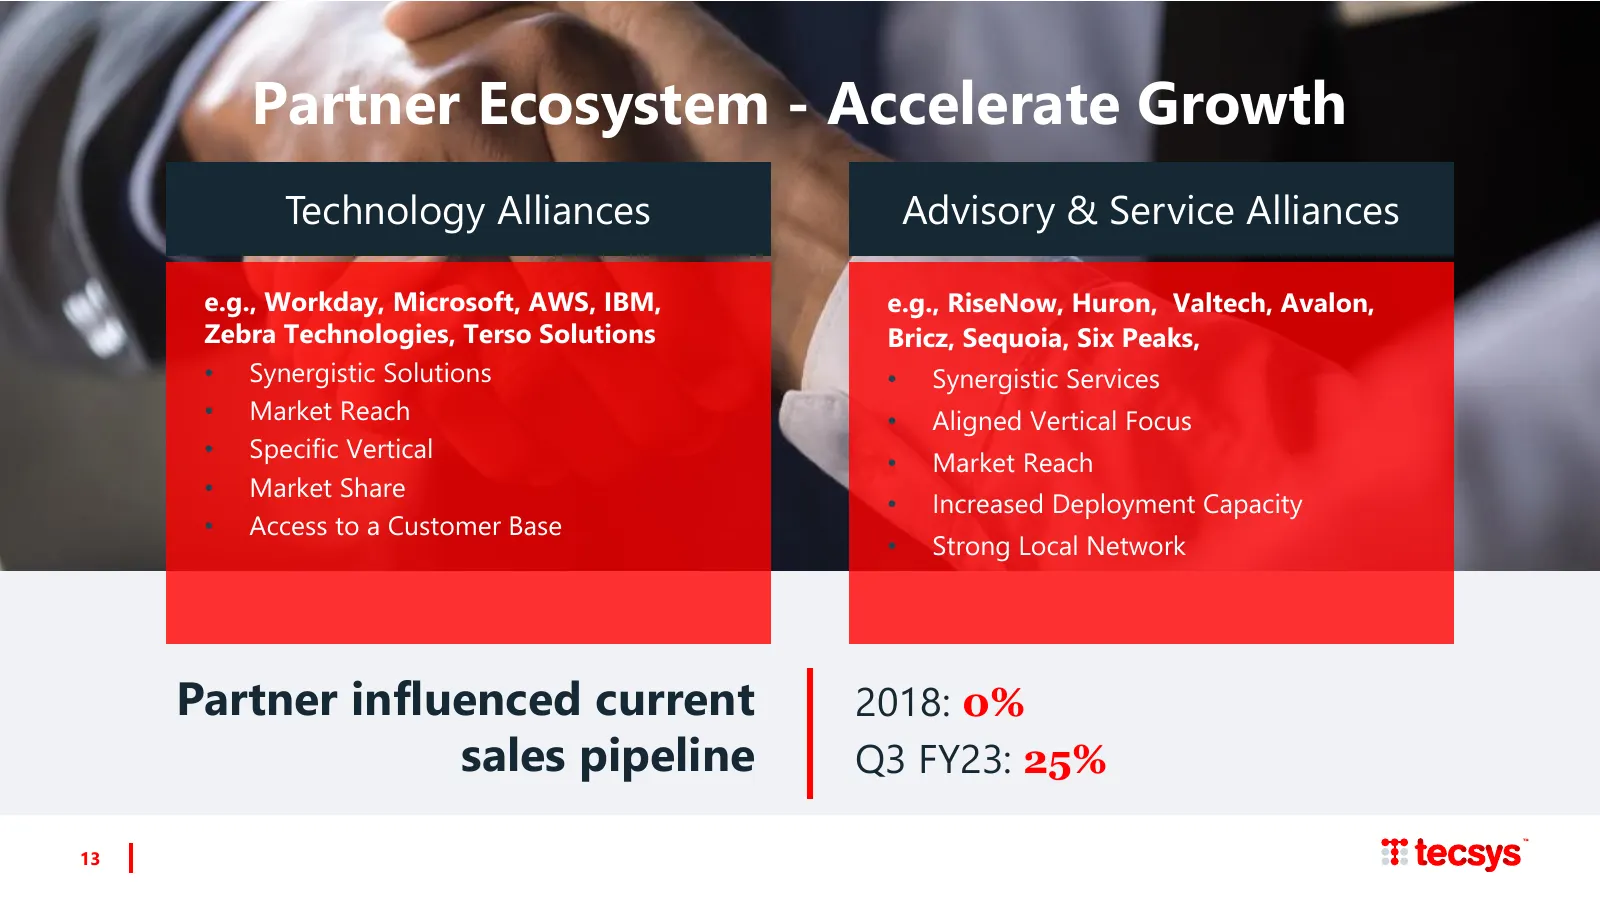
Partner Ecosystem - Accelerate Growth Technology Alliances Advisory & Service Alliances e.g., Workday, Microsoft, AWS, IBM, e.g., RiseNow, Huron, Valtech, Avalon, Zebra Technologies, Terso Solutions Bricz, Sequoia, Six Peaks, • Synergistic Solutions • Synergistic Services • Market Reach • Aligned Ve
Slide 14: Building Annual Recurring Revenue (ARR)
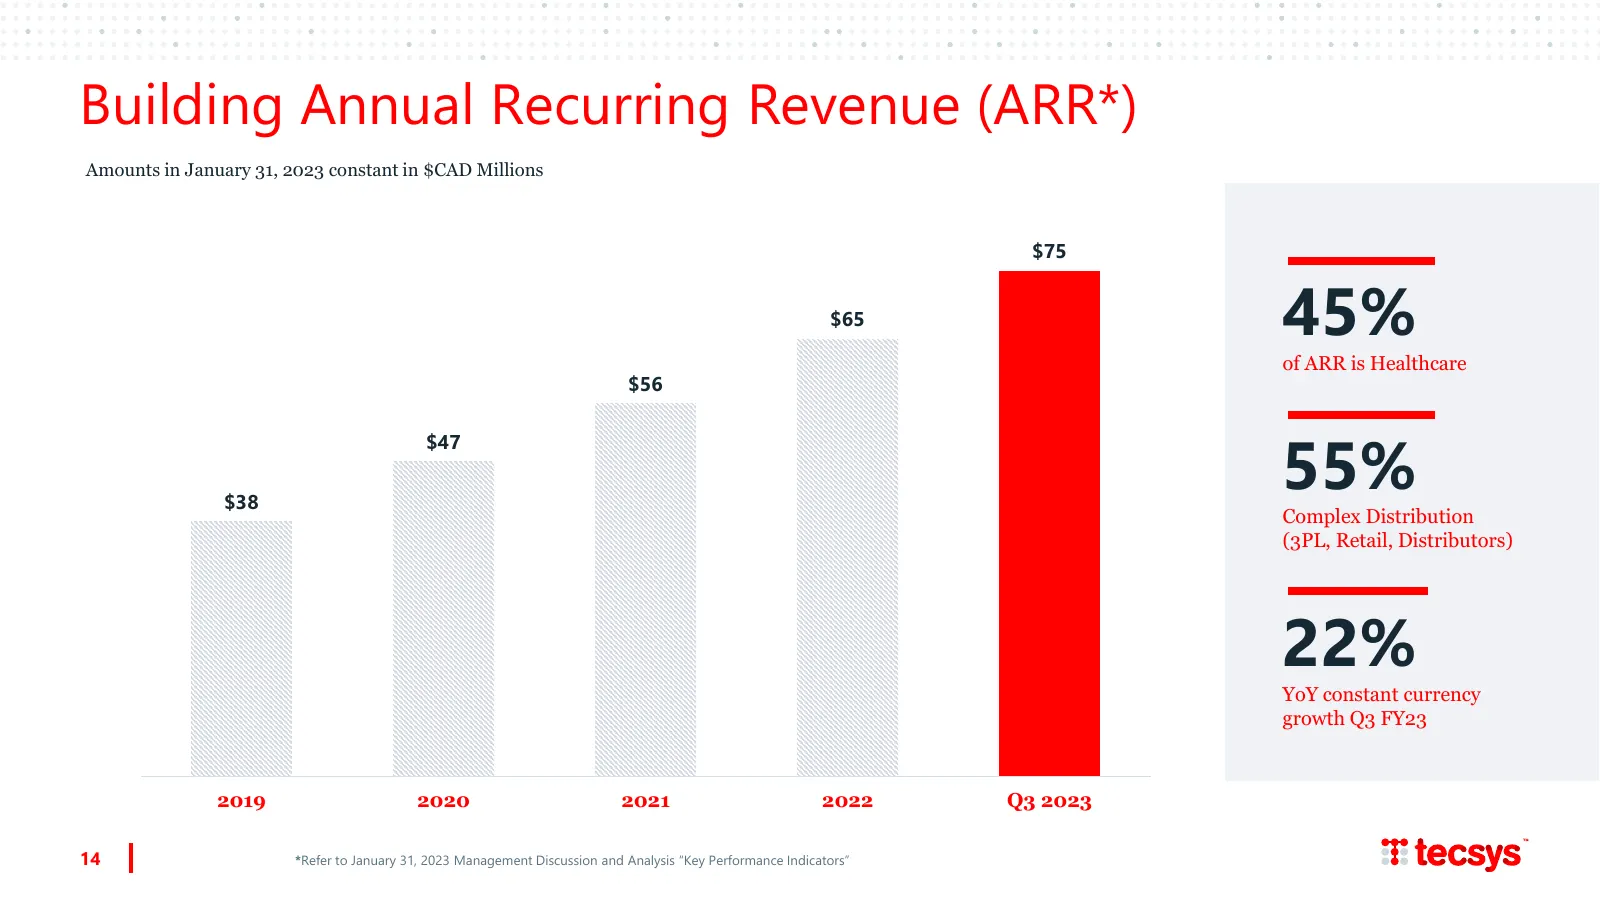
Building Annual Recurring Revenue (ARR*) Amounts in January 31, 2023 constant in $CAD Millions $80 $75 $70 $65 45% of ARR is Healthcare $60 $56 55% $50 $47 $40 $38 Complex Distribution (3PL, Retail, Distributors) $30 $20 22% YoY constant currency $10 growth Q3 FY23 $0 2019 2020 2021 2022 Q3 2023 14
Slide 15: Annual Recurring Revenue Net Retention Rate
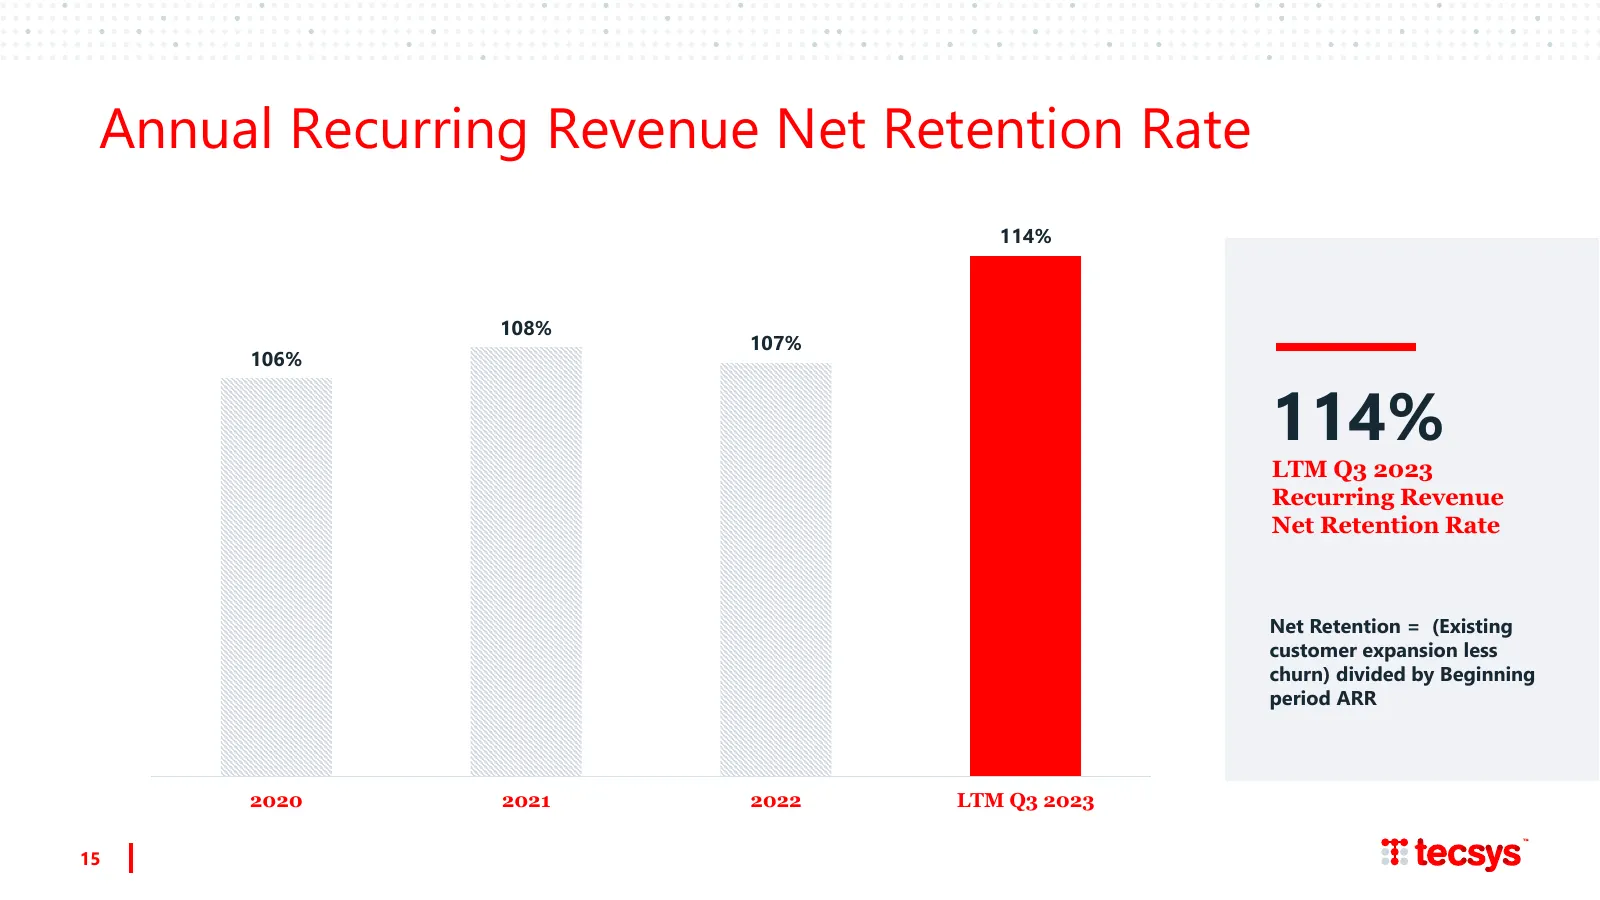
Annual Recurring Revenue Net Retention Rate 115% 114% 110% 108% 107% 106% 114% 105% 100% LTM Q3 2023 Recurring Revenue Net Retention Rate 95% 90% Net Retention = (Existing customer expansion less churn) divided by Beginning 85% period ARR 80% 2020 2021 2022 LTM Q3 2023 15
Slide 16: SaaS Growth Driving Increase in Recurring Revenue Mix
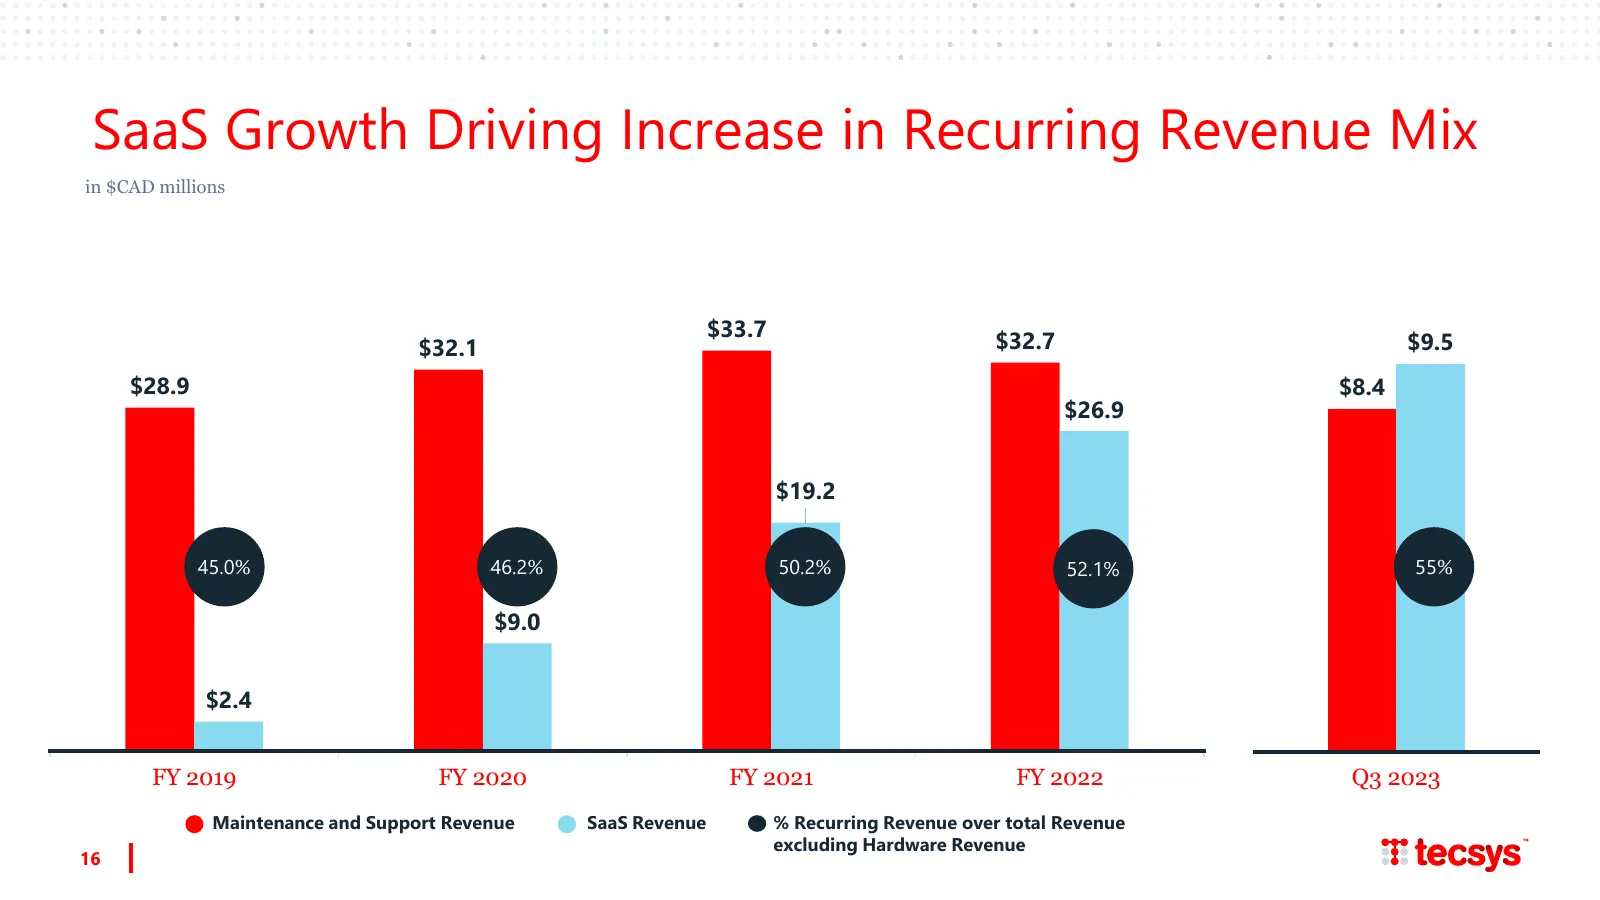
SaaS Growth Driving Increase in Recurring Revenue Mix in $CAD millions $33.7 $32.1 $32.7 $9.5 $28.9 $8.4 $26.9 $19.2 45.0% 46.2% 50.2% 52.1% 55% $9.0 $2.4 FY 2019 FY 2020 FY 2021 FY 2022 Q3 2023 Maintenance and Support Revenue SaaS Revenue % Recurring Revenue over total Revenue excluding Hardware Re
Slide 17: Strong & Growing SaaS Backlog
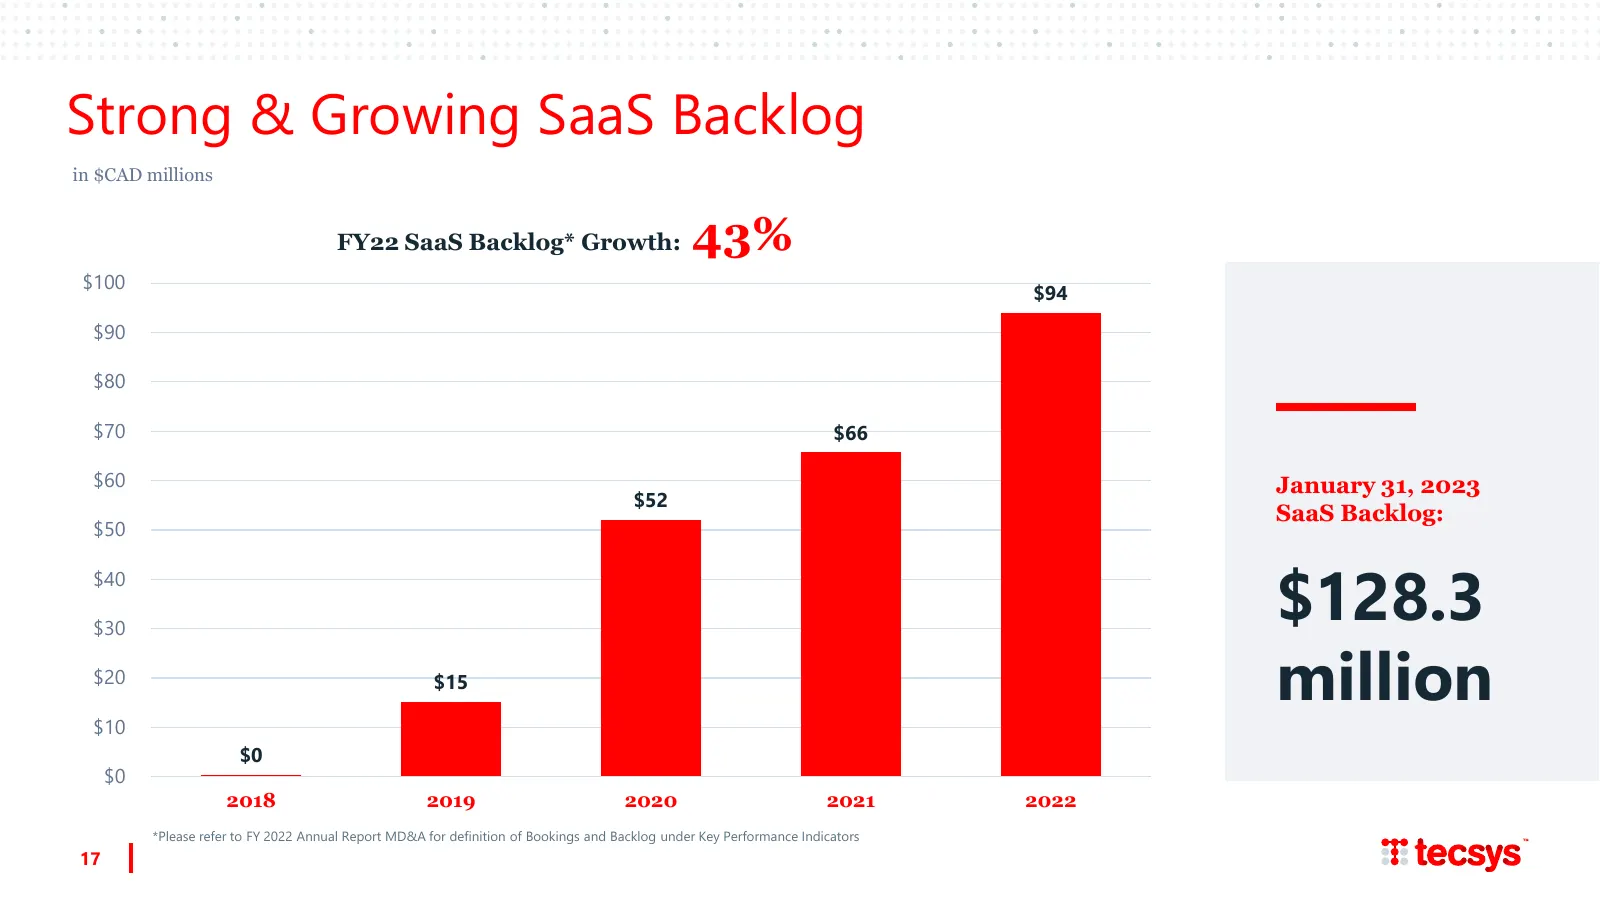
Strong & Growing SaaS Backlog in $CAD millions FY22 SaaS Backlog* Growth: 43% $100 $94 $90 $80 $70 $66 $60 January 31, 2023 $52 SaaS Backlog: $50 $128.3 $40 $30 $20 $15 million $10 $0 $0 2018 2019 2020 2021 2022 *Please refer to FY 2022 Annual Report MD&A for definition of Bookings and Backlog under
Slide 18: Sales & Marketing – Creating Recurring Margin and Value
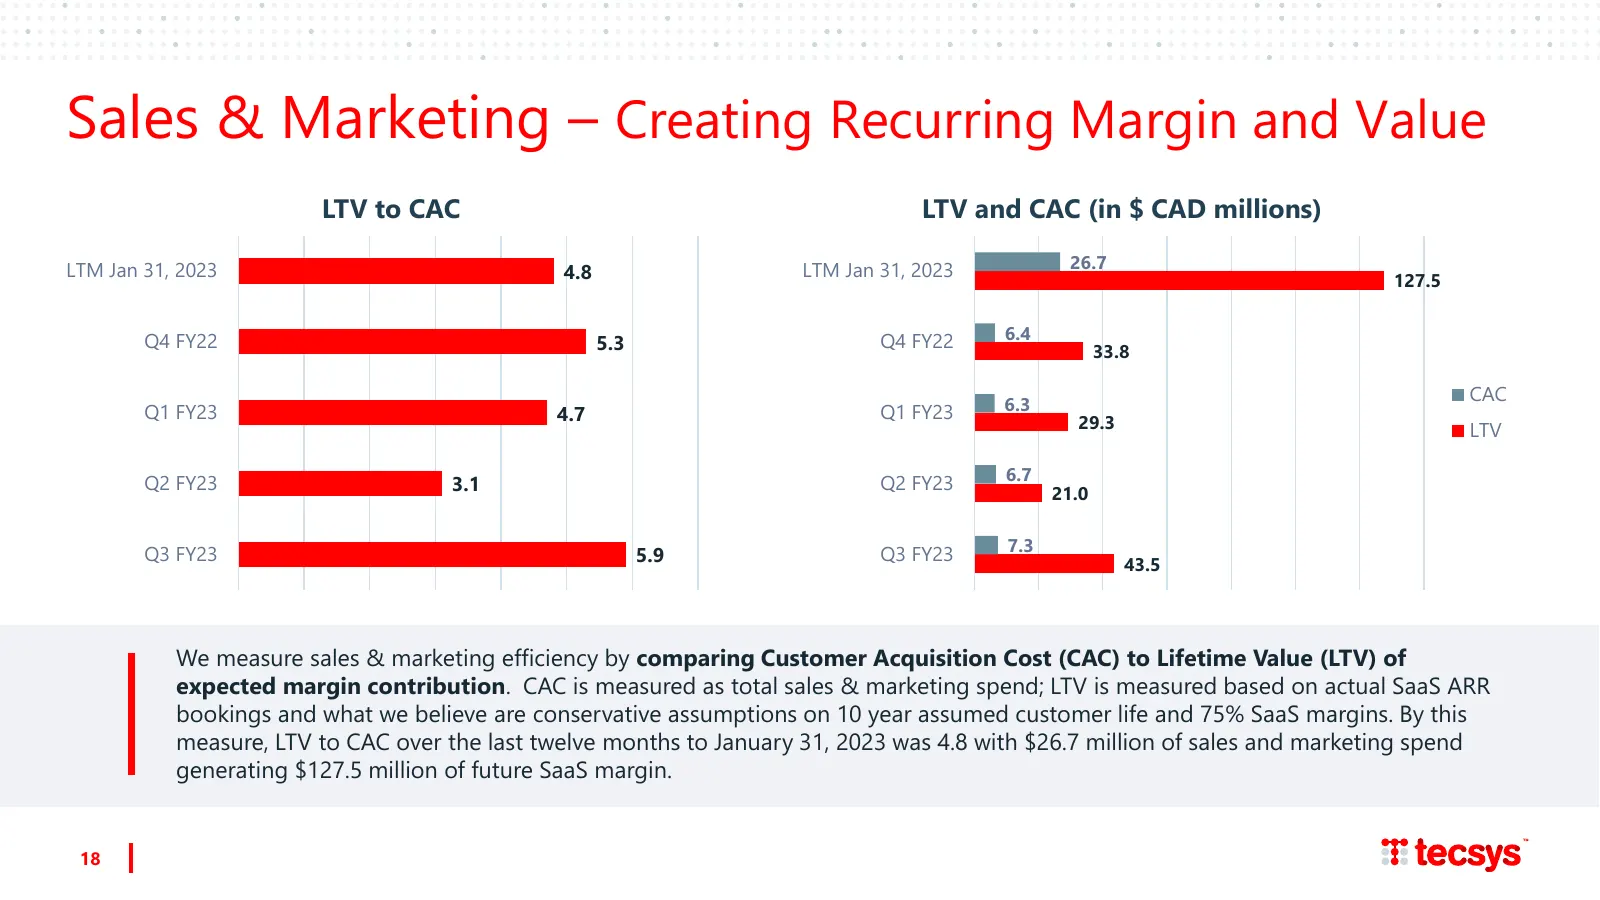
Sales & Marketing – Creating Recurring Margin and Value LTV to CAC LTV and CAC (in $ CAD millions) LTM Jan 31, 2023 LTM Jan 31, 2023 26.7 4.8 127.5 Q4 FY22 Q4 FY22 6.4 5.3 33.8 6.3 CAC Q1 FY23 4.7 Q1 FY23 29.3 LTV Q2 FY23 Q2 FY23 6.7 3.1 21.0 Q3 FY23 Q3 FY23 7.3 5.9 43.5 We measure sales & marketing
Slide 19: Projected SaaS Margin Expansion
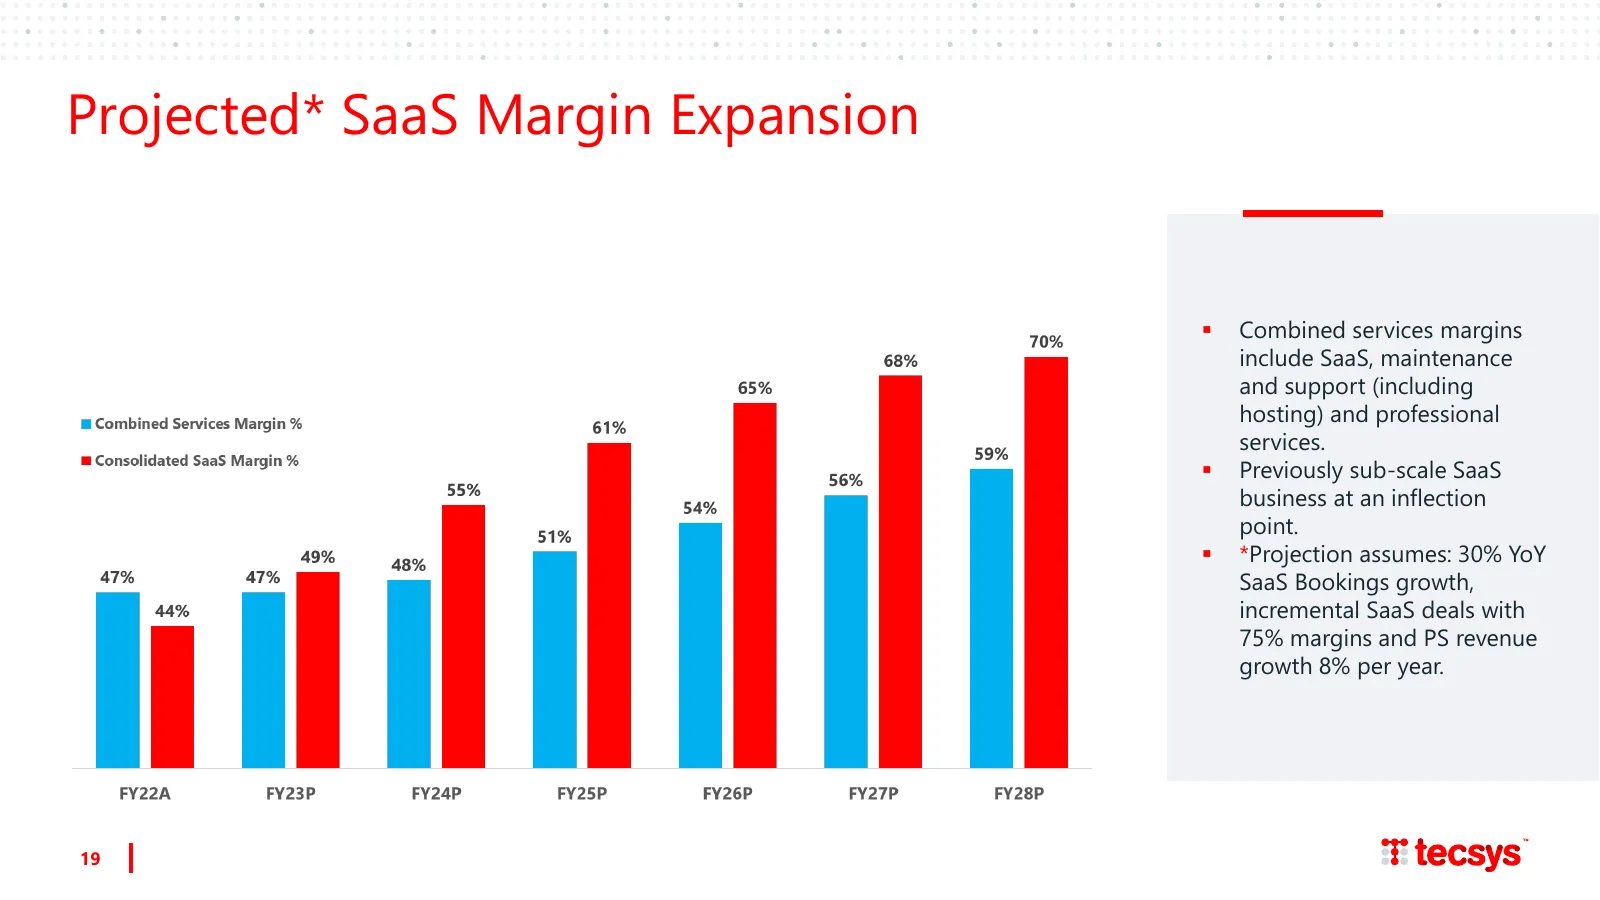
Projected* SaaS Margin Expansion ▪ Combined services margins include SaaS, maintenance and support (including hosting) and professional services. ▪ Previously sub-scale SaaS business at an inflection point. ▪ *Projection assumes: 30% YoY SaaS Bookings growth, incremental SaaS deals with 75% margins

Slide 20: Corporate Information
Corporate Information
Slide 21: Financial Highlights
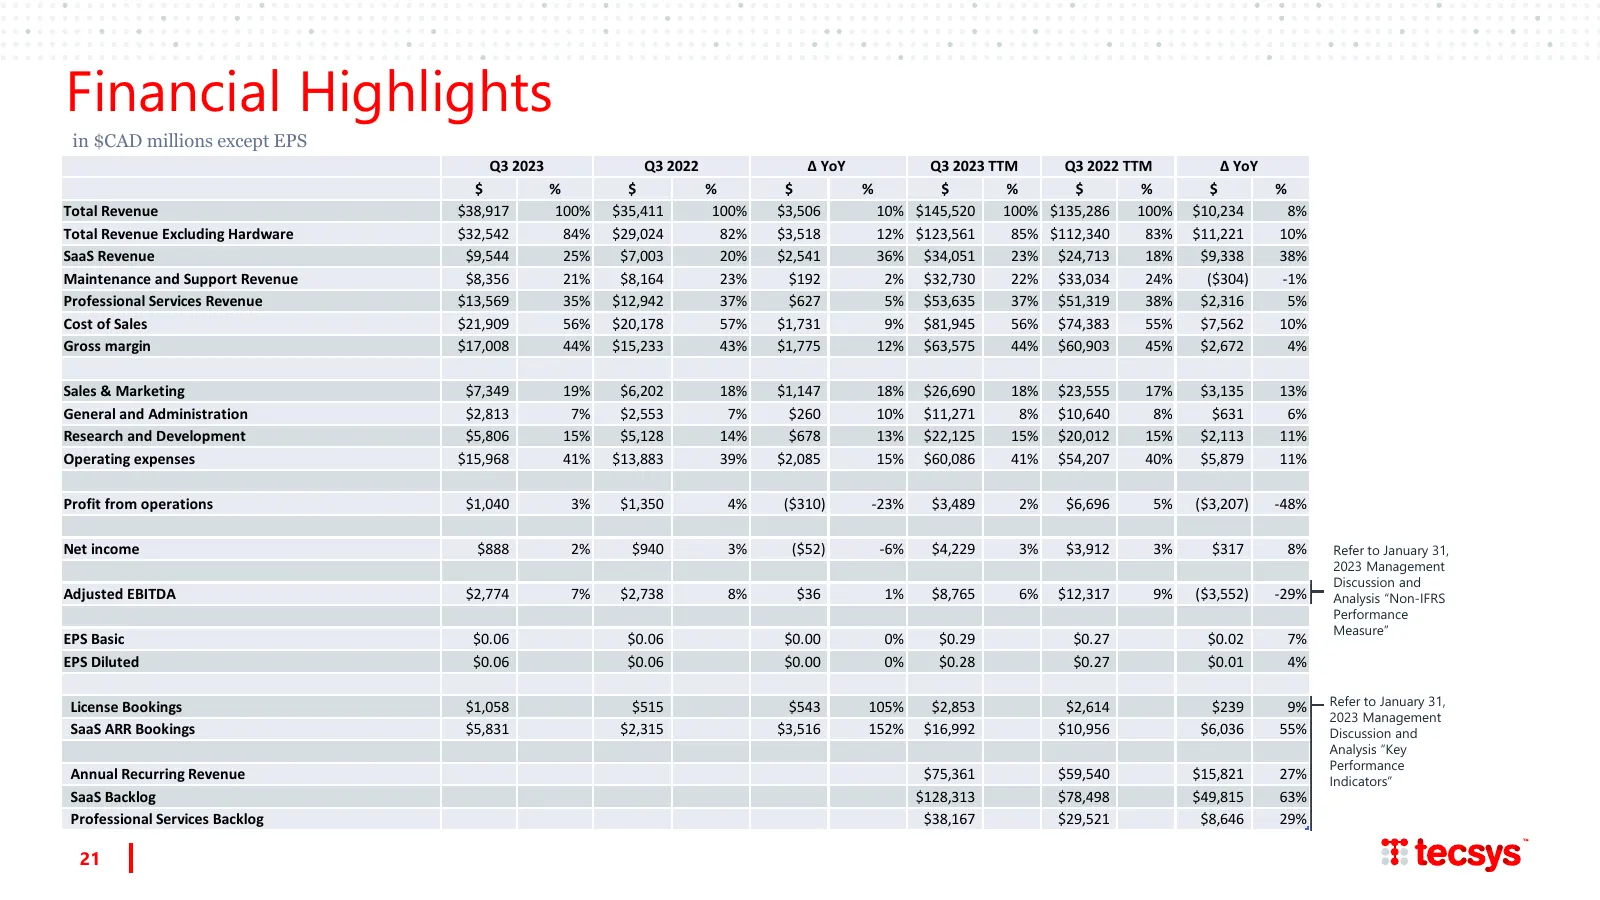
Financial Highlights in $CAD millions except EPS Q3 2023 Q3 2022 Δ YoY Q3 2023 TTM Q3 2022 TTM Δ YoY $ % $ % $ % $ % $ % $ % Total Revenue $38,917 100% $35,411 100% $3,506 10% $145,520 100% $135,286 100% $10,234 8% Total Revenue Excluding Hardware $32,542 84% $29,024 82% $3,518 12% $123,561 85% $112
Slide 22: Corporate Overview
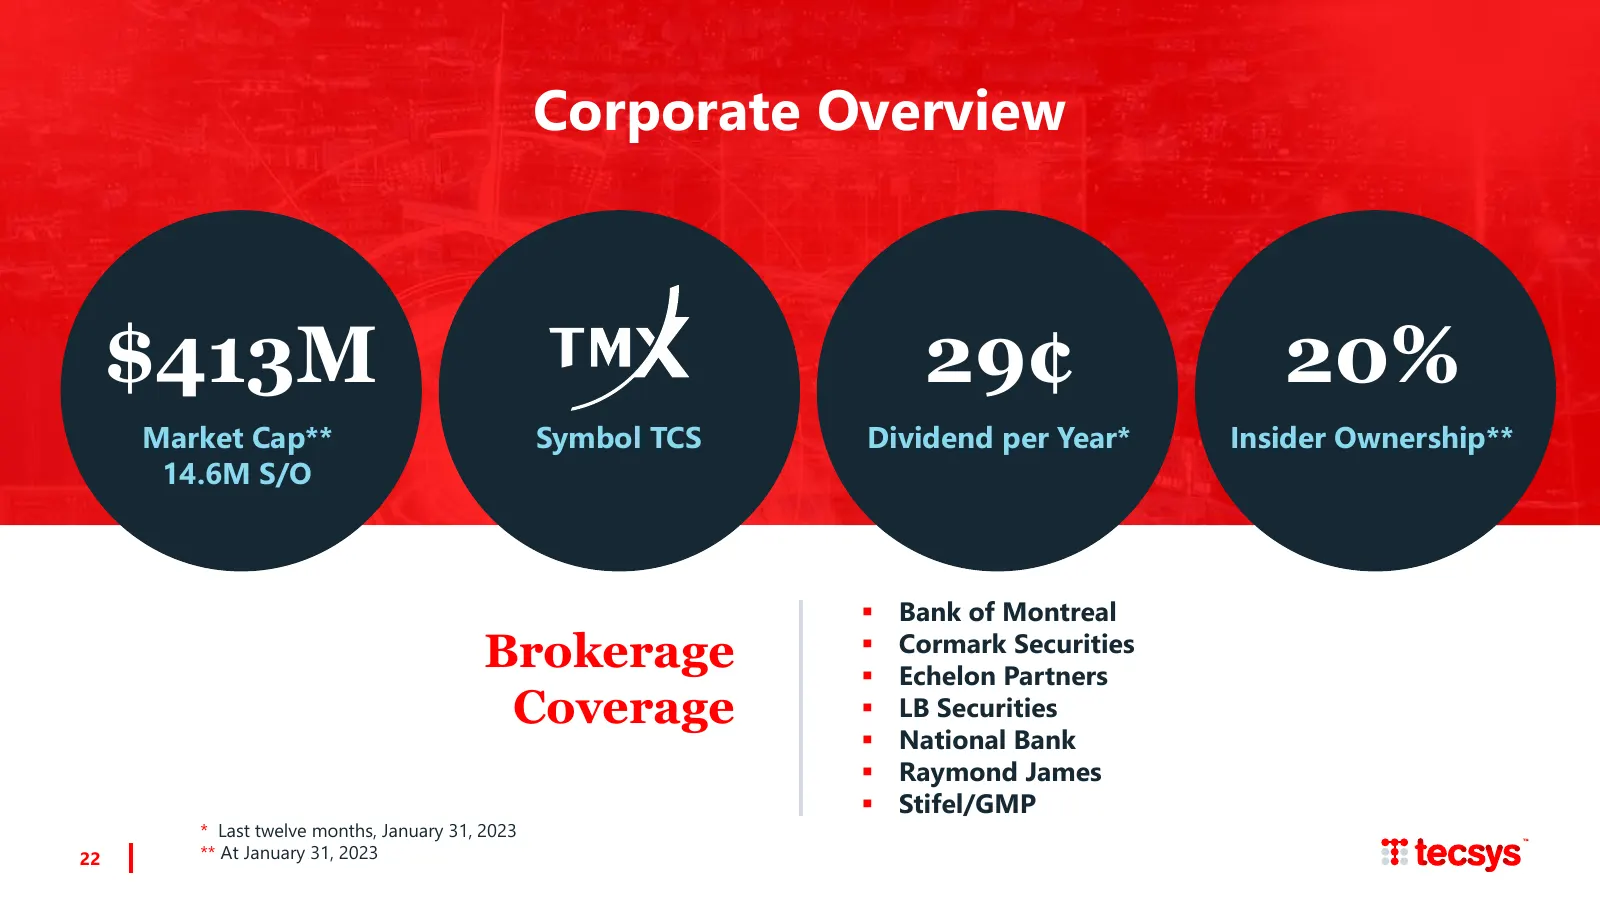
Corporate Overview $413M 29¢ 20% Market Cap** Symbol TCS Dividend per Year* Insider Ownership** 14.6M S/O ▪ Bank of Montreal Brokerage ▪ ▪ Cormark Securities Echelon Partners Coverage ▪ LB Securities ▪ National Bank ▪ Raymond James ▪ Stifel/GMP * Last twelve months, January 31, 2023 22 ** At January
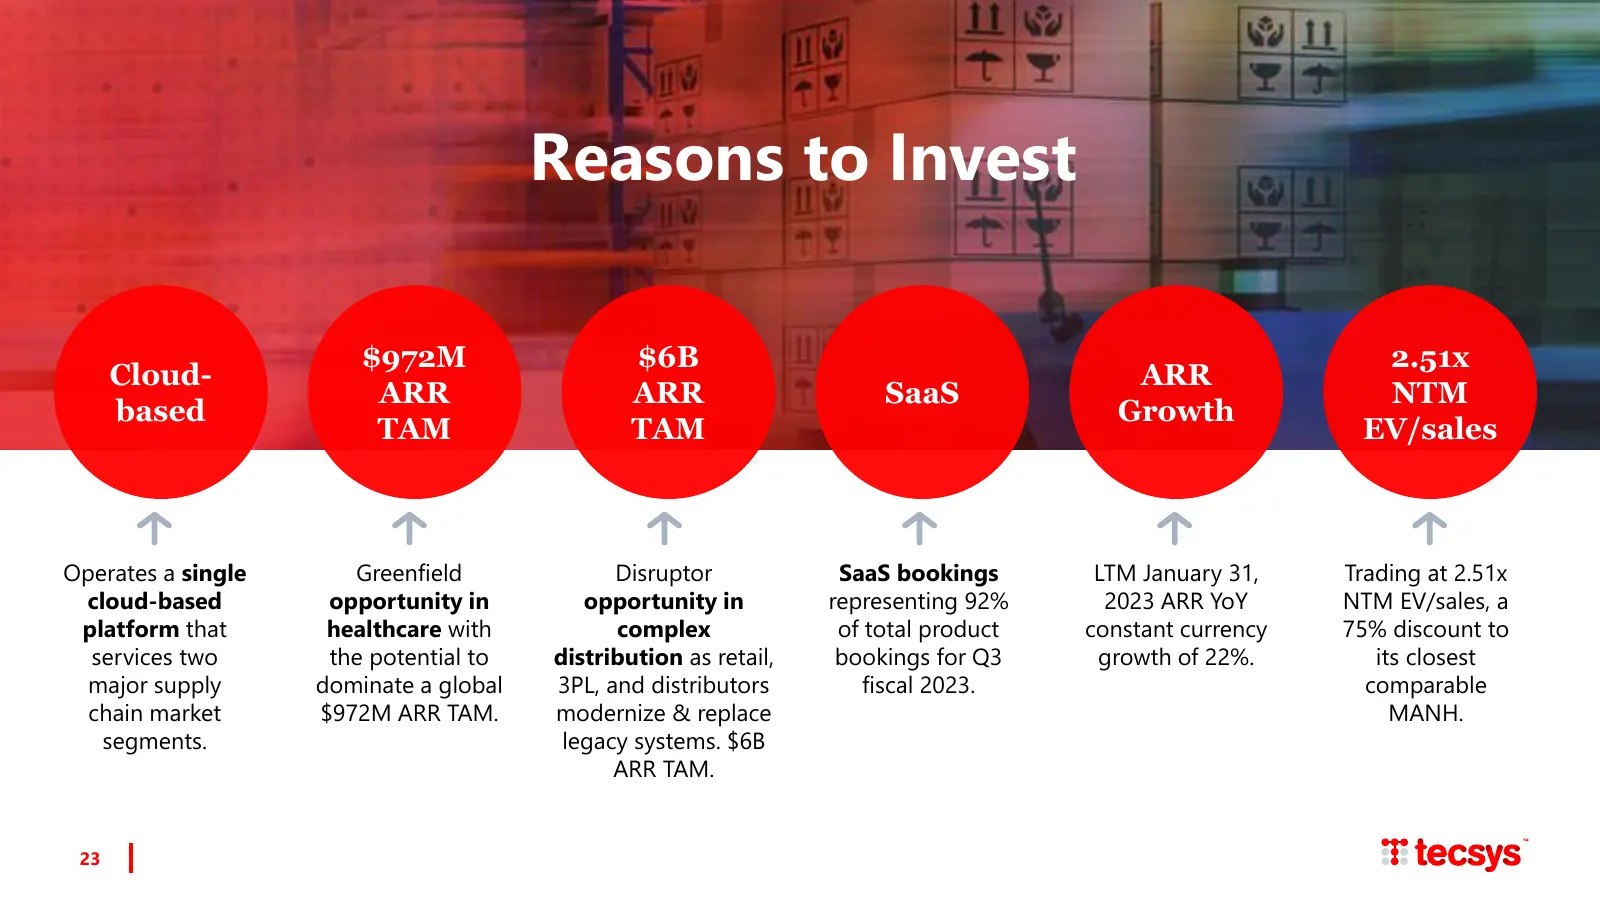
Slide 23: Reasons to Invest
Reasons to Invest $972M $6B 2.51x Cloud- ARR ARR ARR SaaS NTM based Growth TAM TAM EV/sales Operates a single Greenfield Disruptor SaaS bookings LTM January 31, Trading at 2.51x cloud-based opportunity in opportunity in representing 92% 2023 ARR YoY NTM EV/sales, a platform that healthcare with comp
Source: Internet Archive copy of infohub.tecsys.com
More decks from TECSYS Inc.
 Q1 2027 Earnings Presentation22 slides · Sep 11, 2026
 Q4 2026 Earnings Presentation22 slides · Jun 30, 2026
 Q3 2026 Earnings Presentation23 slides · Mar 5, 2026
 Q2 FY2026 Earnings Presentation23 slides · December 2025
 Q1 2026 Earnings Presentation23 slides · Sep 5, 2025
 Q4 2025 Earnings Presentation21 slides · June 2025