Agora SA · GPW:AGO
Agora SA — Q4 2012 Earnings Presentation
20 slides from Agora SA's earnings presentation, Oct 11, 2013
Slide 1: Investor presentation: Financial and market performance 4Q 2012
Investor presentation Financial and market performance 4Q 2012
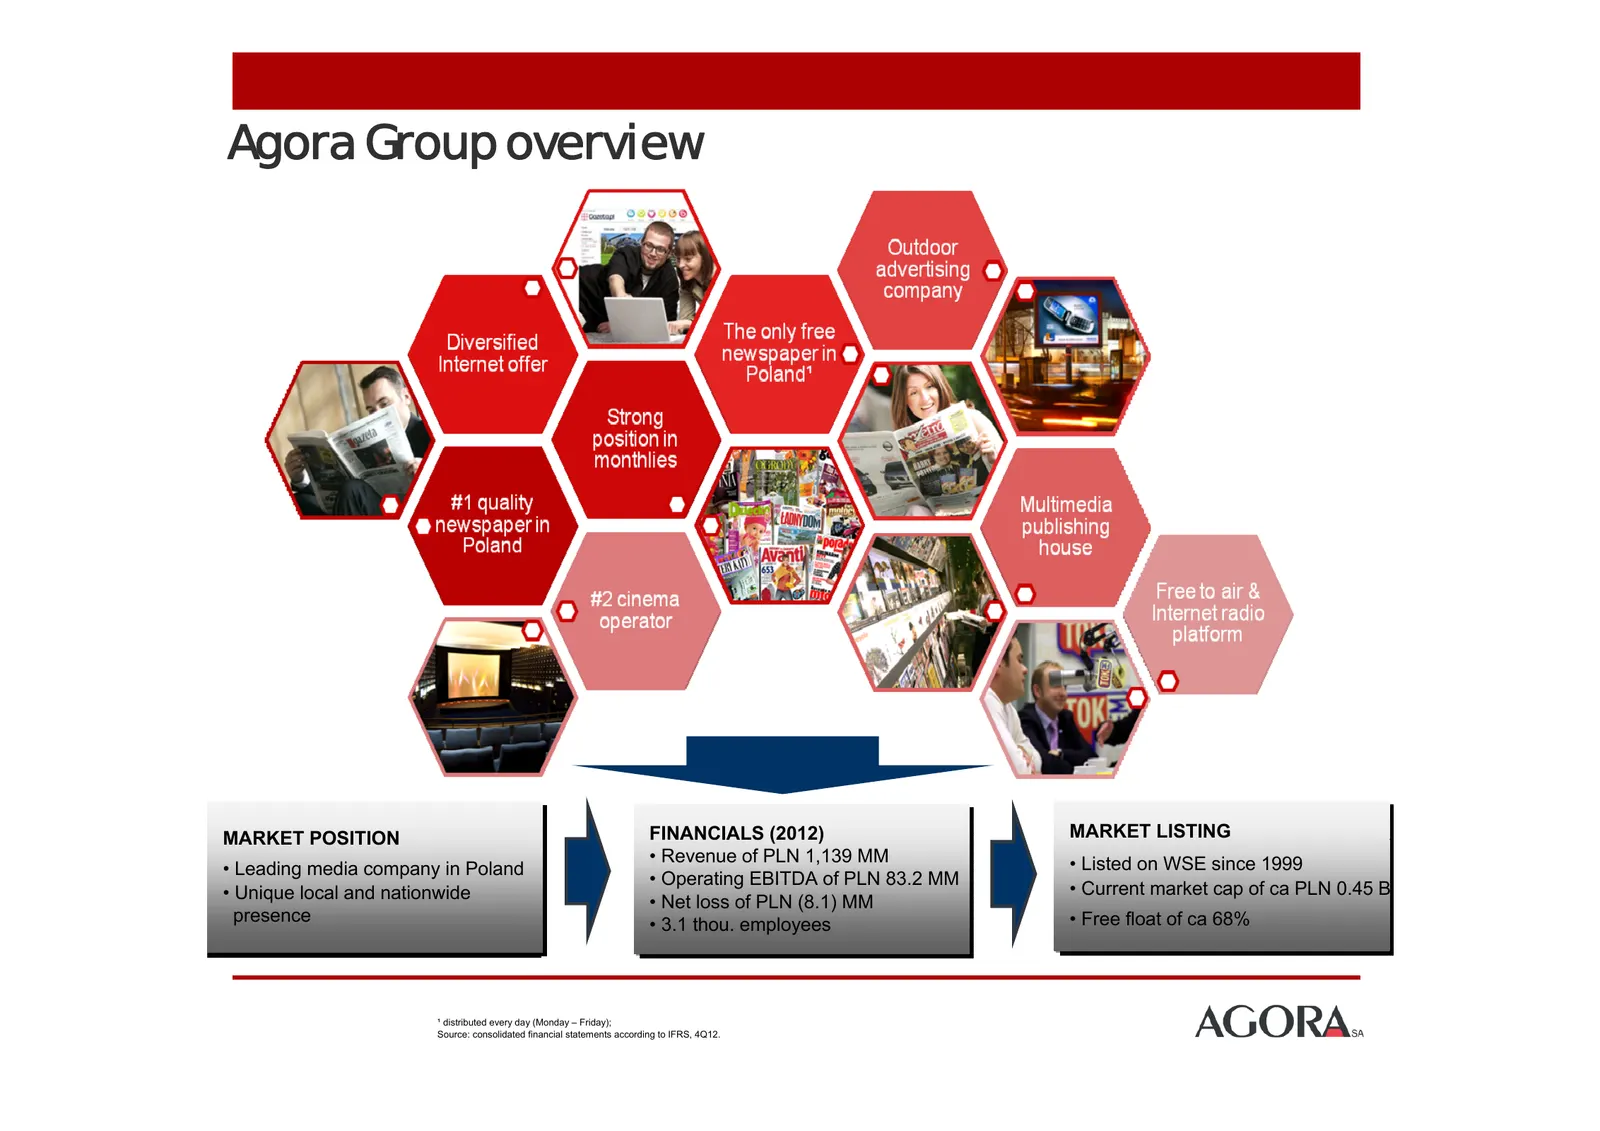
Slide 2: Agora Group overview
Agora Group overview MARKET FINANCIALS FINANCIALS(1H10)² FINANCIALS (2012) (1H10)² (2012) MARKET MARKETLISTING MARKET LISTING LISTING MARKETPOSITION MARKET POSITION POSITION •••Revenue Revenue of PLN529 Revenue of of PLN PLN 1,139 529 1,139MM MM MMMM •••Listed •••Leading Leading media Leadingmedia c
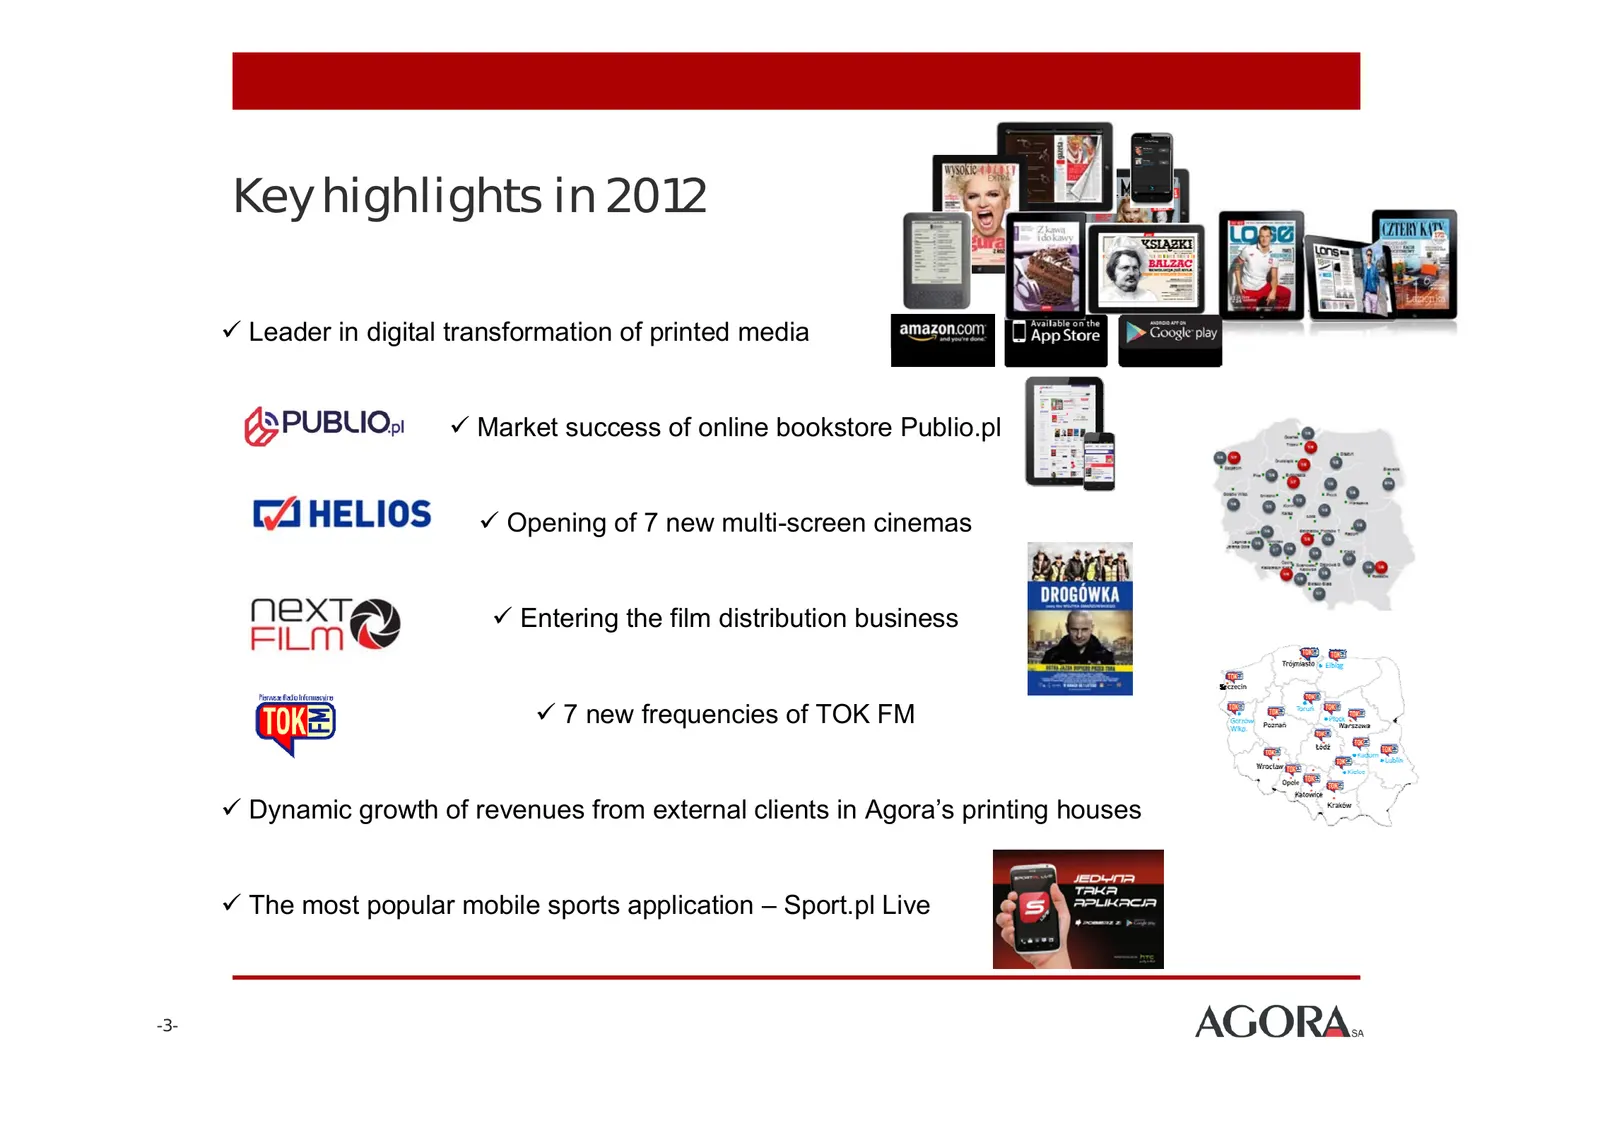
Slide 3: Key highlights in 2012
Key highlights in 2012 Leader in digital transformation of printed media Market success of online bookstore Publio.pl Opening of 7 new multi-screen cinemas Entering the film distribution business 7 new frequencies of TOK FM Dynamic growth of revenues from external clients in Agora’s prin
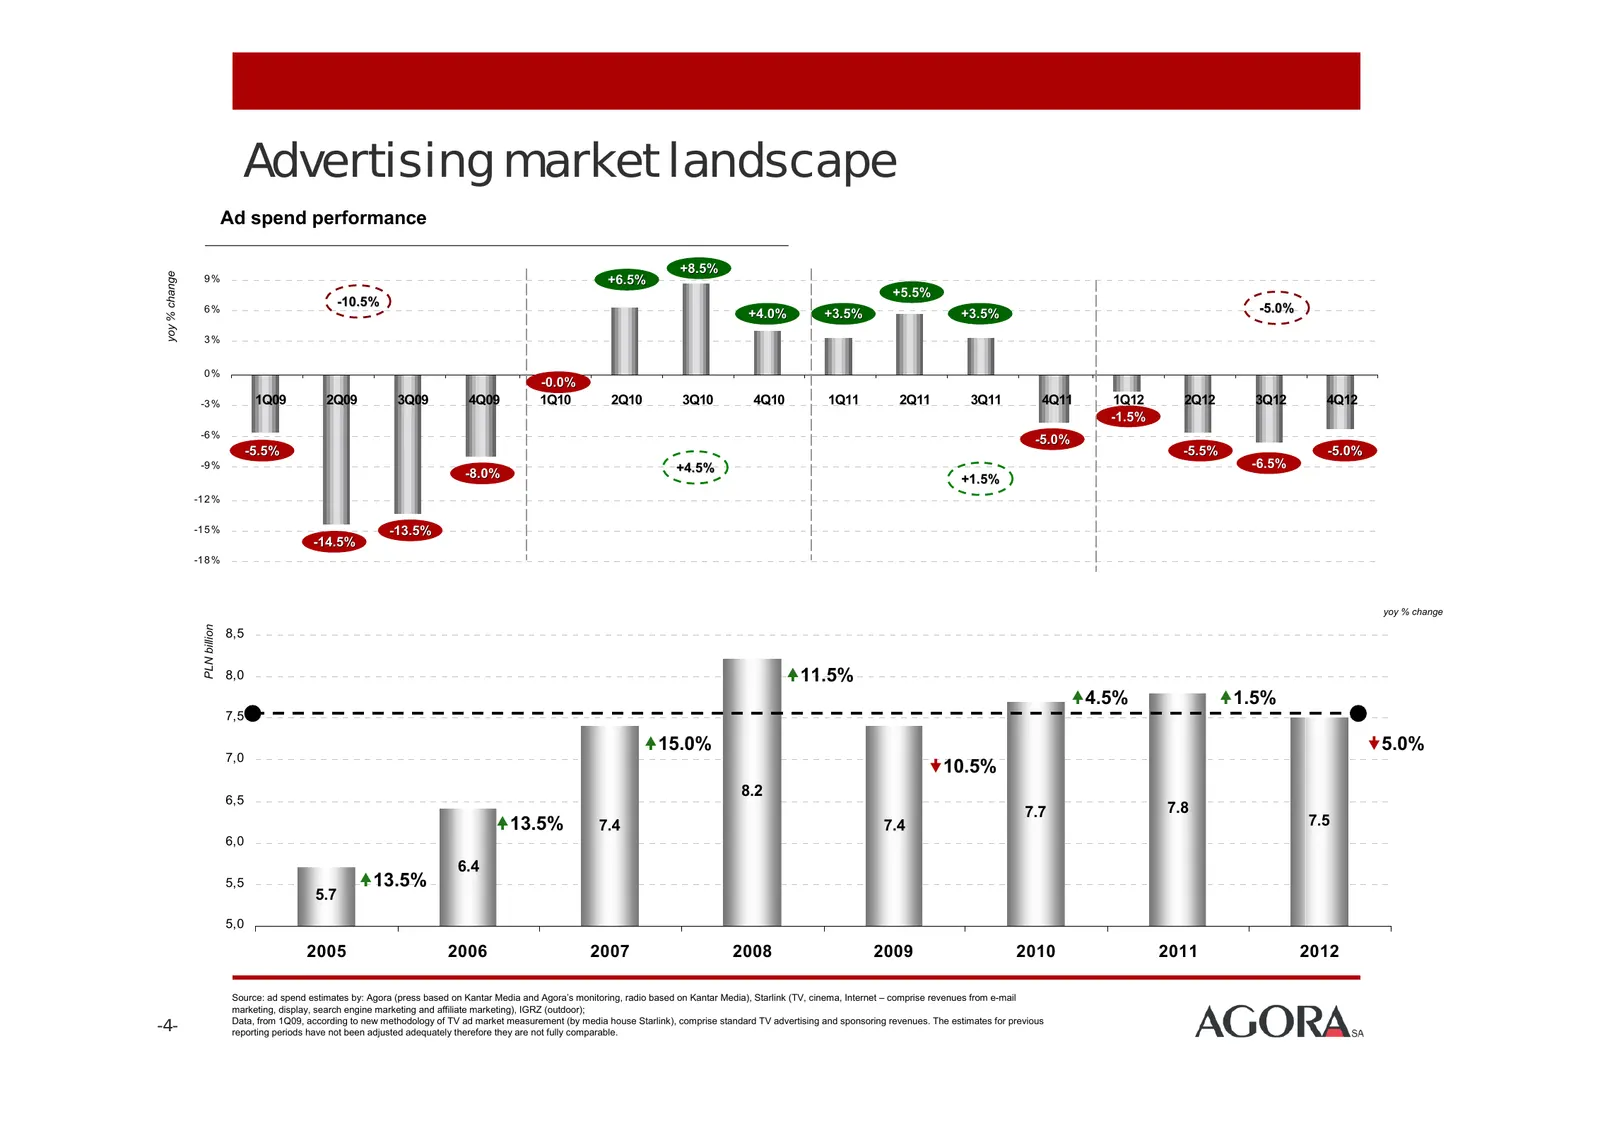
Slide 4: Advertising market landscape
Advertising market landscape Ad spend performance +8. +8.5% yoy % change 9% +6. +6.5% +5. +5.5% 6% -10.5% 0.5% -5.0% +4. +4.0% +3. +3.5% +3. +3.5% 3% 0% -0.0% -3 % 1Q09 2Q09 3Q09 4Q09 1Q10 2Q10 3Q10 4Q10 1Q11 2Q11 3Q11 4Q11 1Q12 2Q12 3Q12 4Q12 -1.5% -6 % -5.0% 5.0% -5.5% 5.5% -5.5% -5.0% .0% -9 % +4
Slide 5: Advertising market landscape
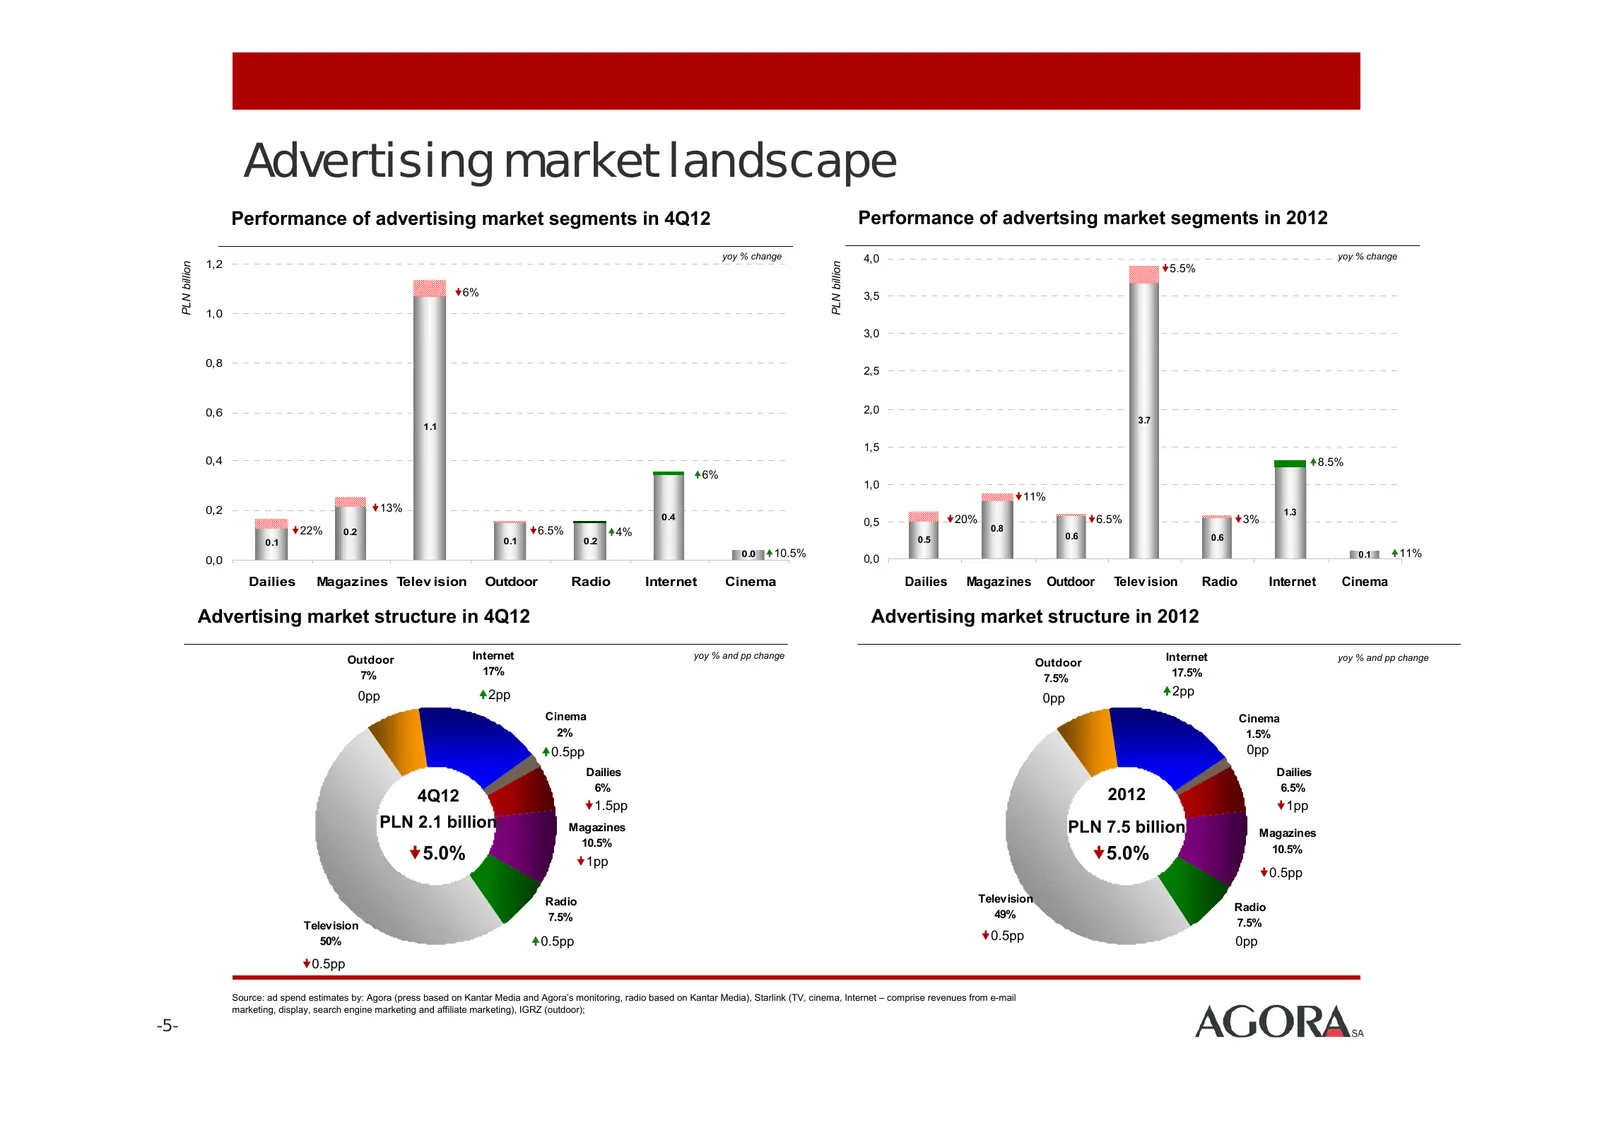
Advertising market landscape Performance of advertising market segments in 4Q12 Performance of advertsing market segments in 2012 yoy % change 4,0 yoy % change 1,2 PLN billion PLN billion 5.5% 6% 3,5 1,0 3,0 0,8 2,5 0,6 2,0 3.7 1.1 1,5 0,4 8.5% 6% 1,0 11% 0,2 13% 1.3 0.4 20% 6.5% 3% 0,5 22
Slide 6: Estimates of advertising market changes in 2013
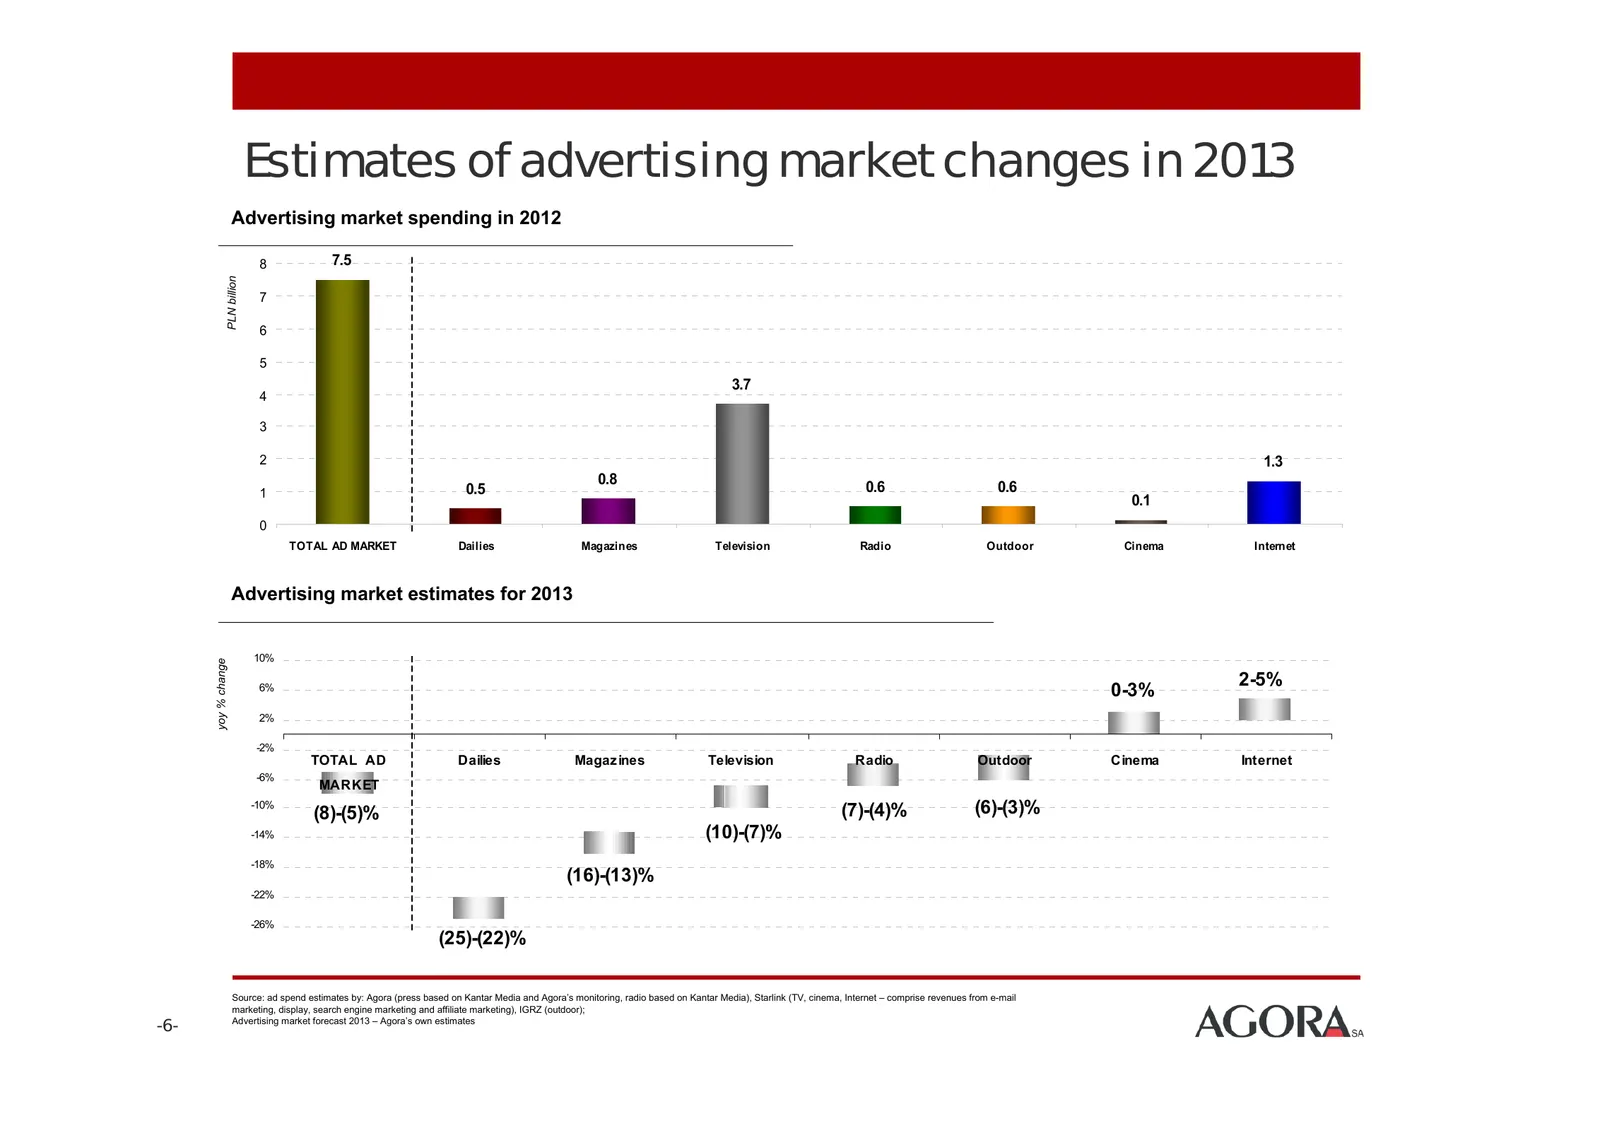
Estimates of advertising market changes in 2013 Advertising market spending in 2012 8 7.5 PLN billion 7 6 5 3.7 4 3 2 1.3 0.8 1 0.5 0.6 0.6 0.1 0 TOTAL AD MARKET Dailies Magazines Television Radio Outdoor Cinema Internet Advertising market estimates for 2013 10% yoy % change 2-5% 6% 0-3% 2% -2% TOTA
Slide 7: Financial performance of the Agora Group
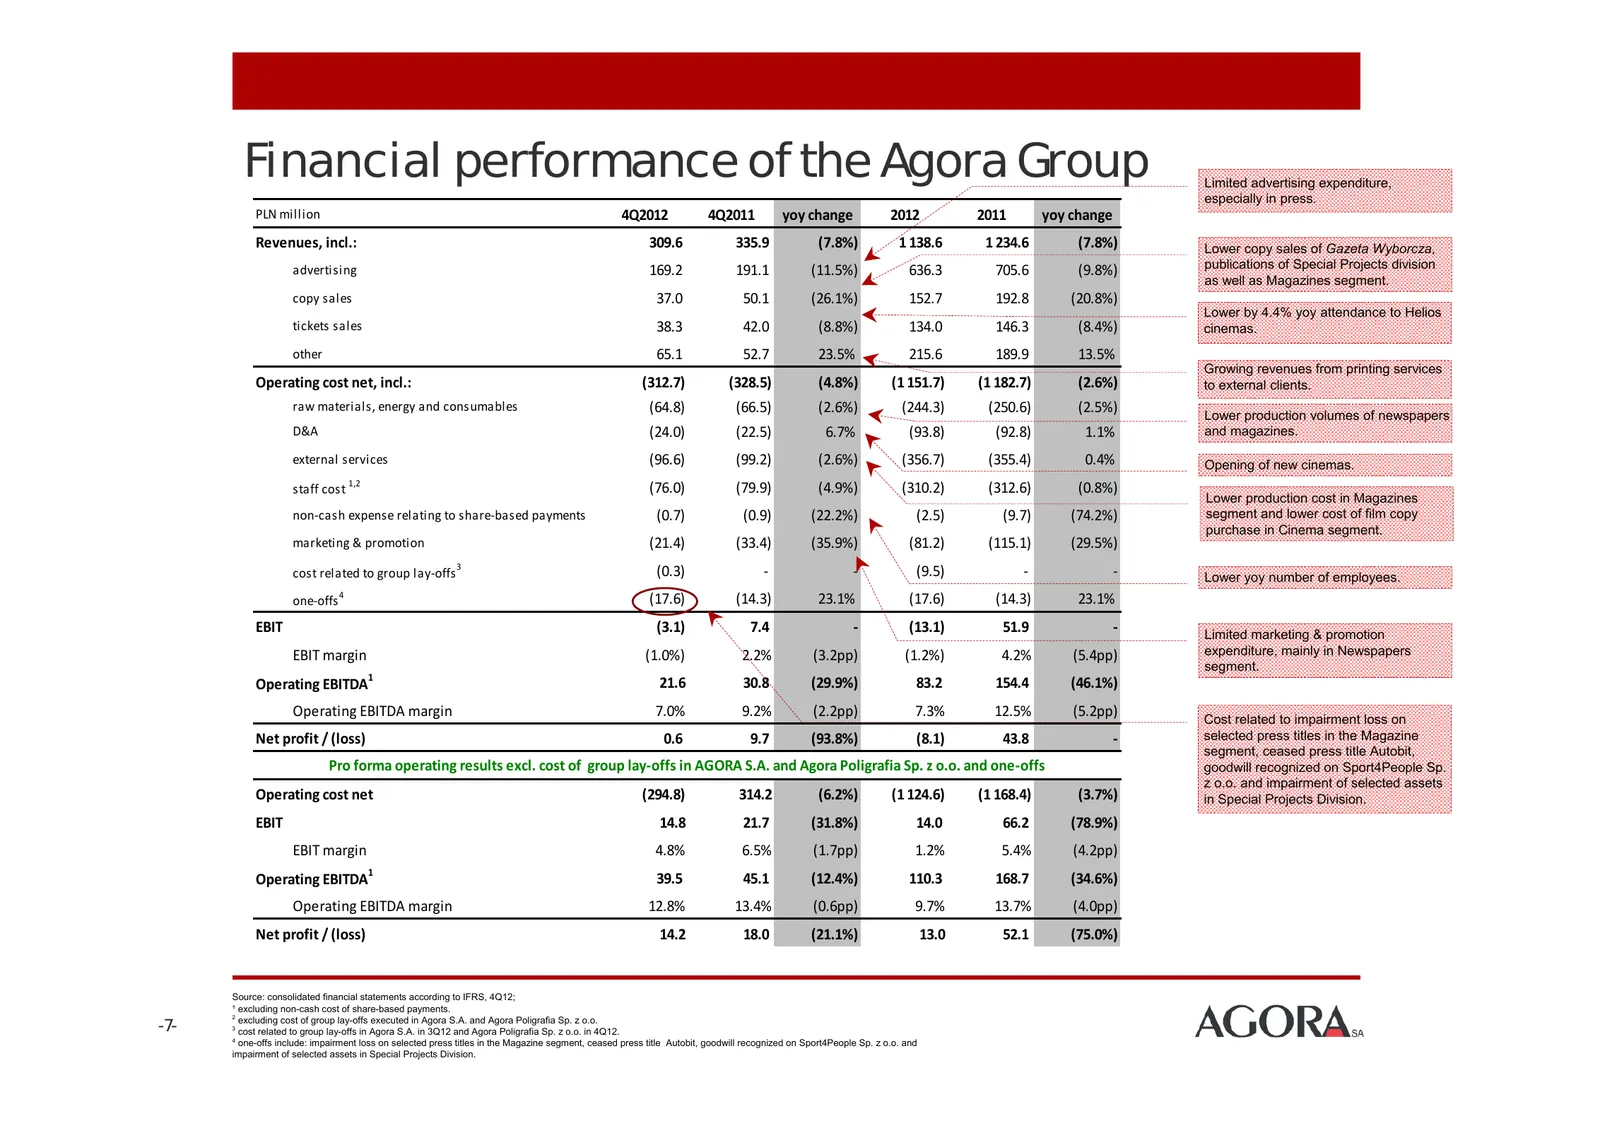
Financial performance of the Agora Group Limited advertising expenditure, especially in press. PLN million 4Q2012 4Q2011 yoy change 2012 2011 yoy change Revenues, incl.: 309.6 335.9 (7.8%) 1 138.6 1 234.6 (7.8%) Lower copy sales of Gazeta Wyborcza, advertising 169.2 191.1 (11.5%) 636.3 705.6 (9.8%)
Slide 8: Influence of one-offs on the Group's financial results
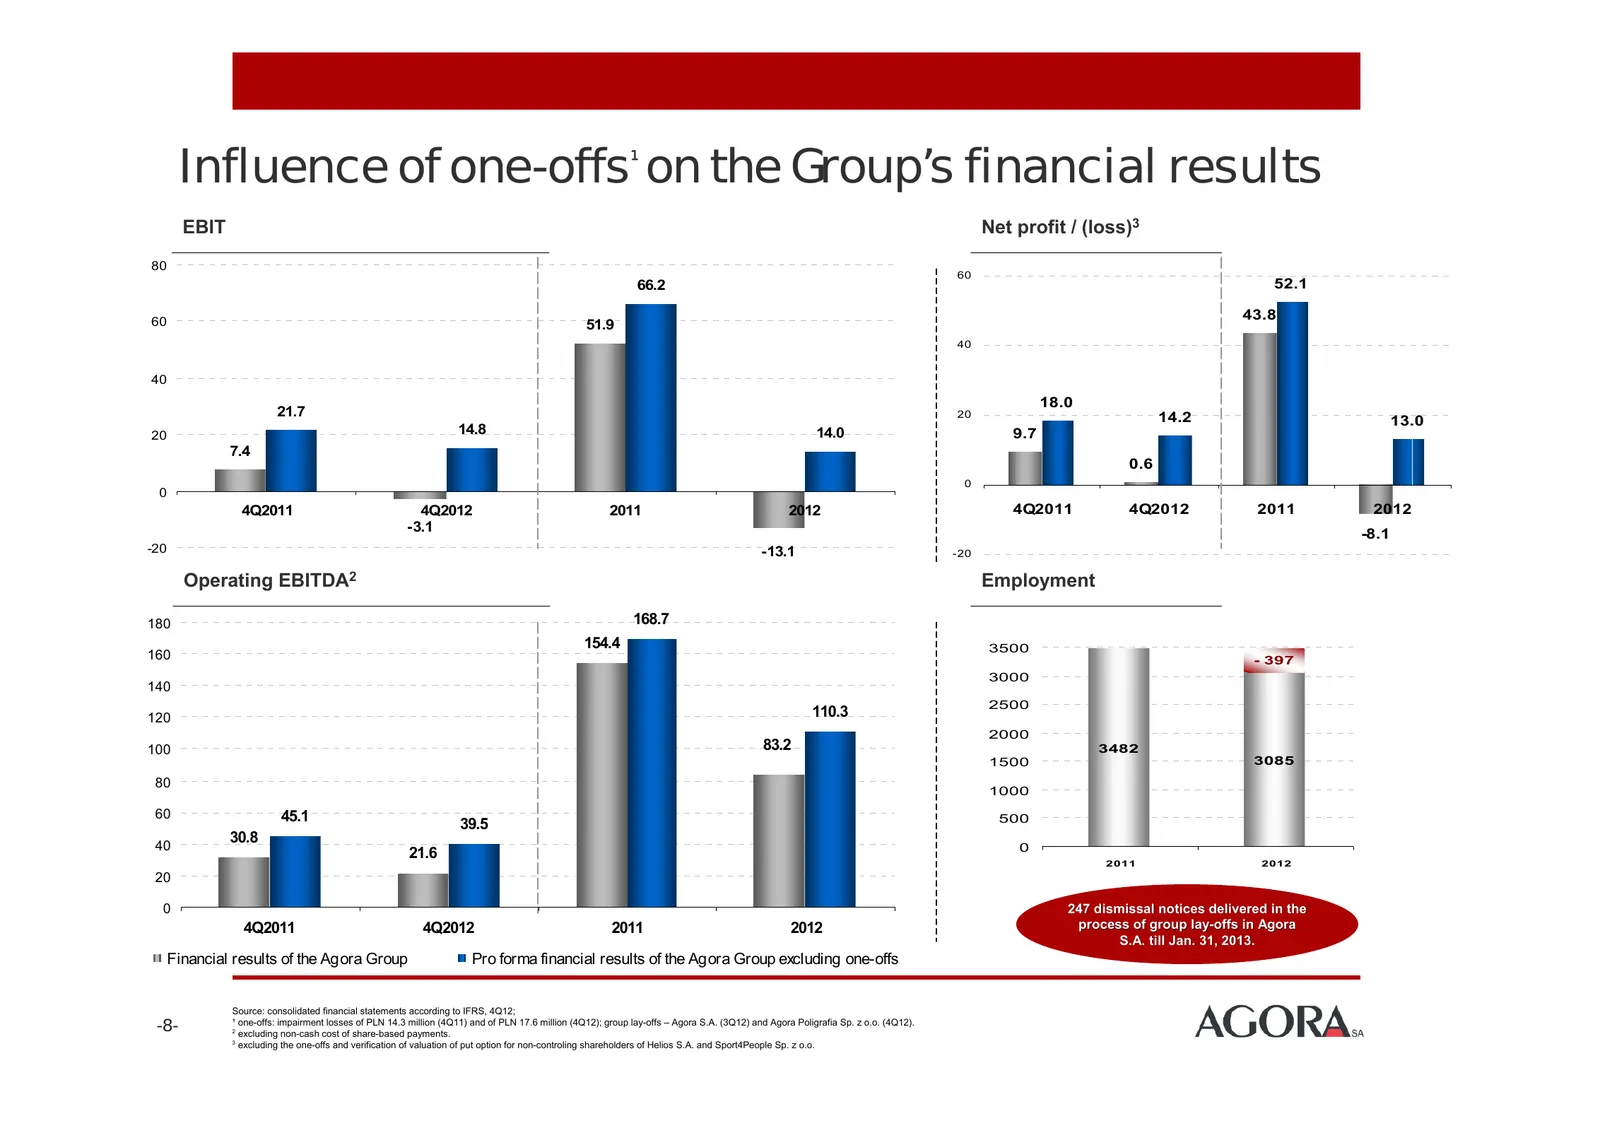
Influence of one-offs on the Group’s financial results 1 EBIT Net profit / (loss)3 80 60 66.2 52.1 60 43.8 51.9 40 40 18.0 21.7 20 14.2 13.0 20 14.8 14.0 9.7 7.4 0.6 0 0 4Q2011 4Q2012 2011 2012 4Q2011 4Q2012 2011 2012 -3.1 -8.1 -20 -13.1 -20 Operating EBITDA2 Employment 180 168.7 154.4 3500 160 - 39
Slide 9: Segment performance: Newspapers
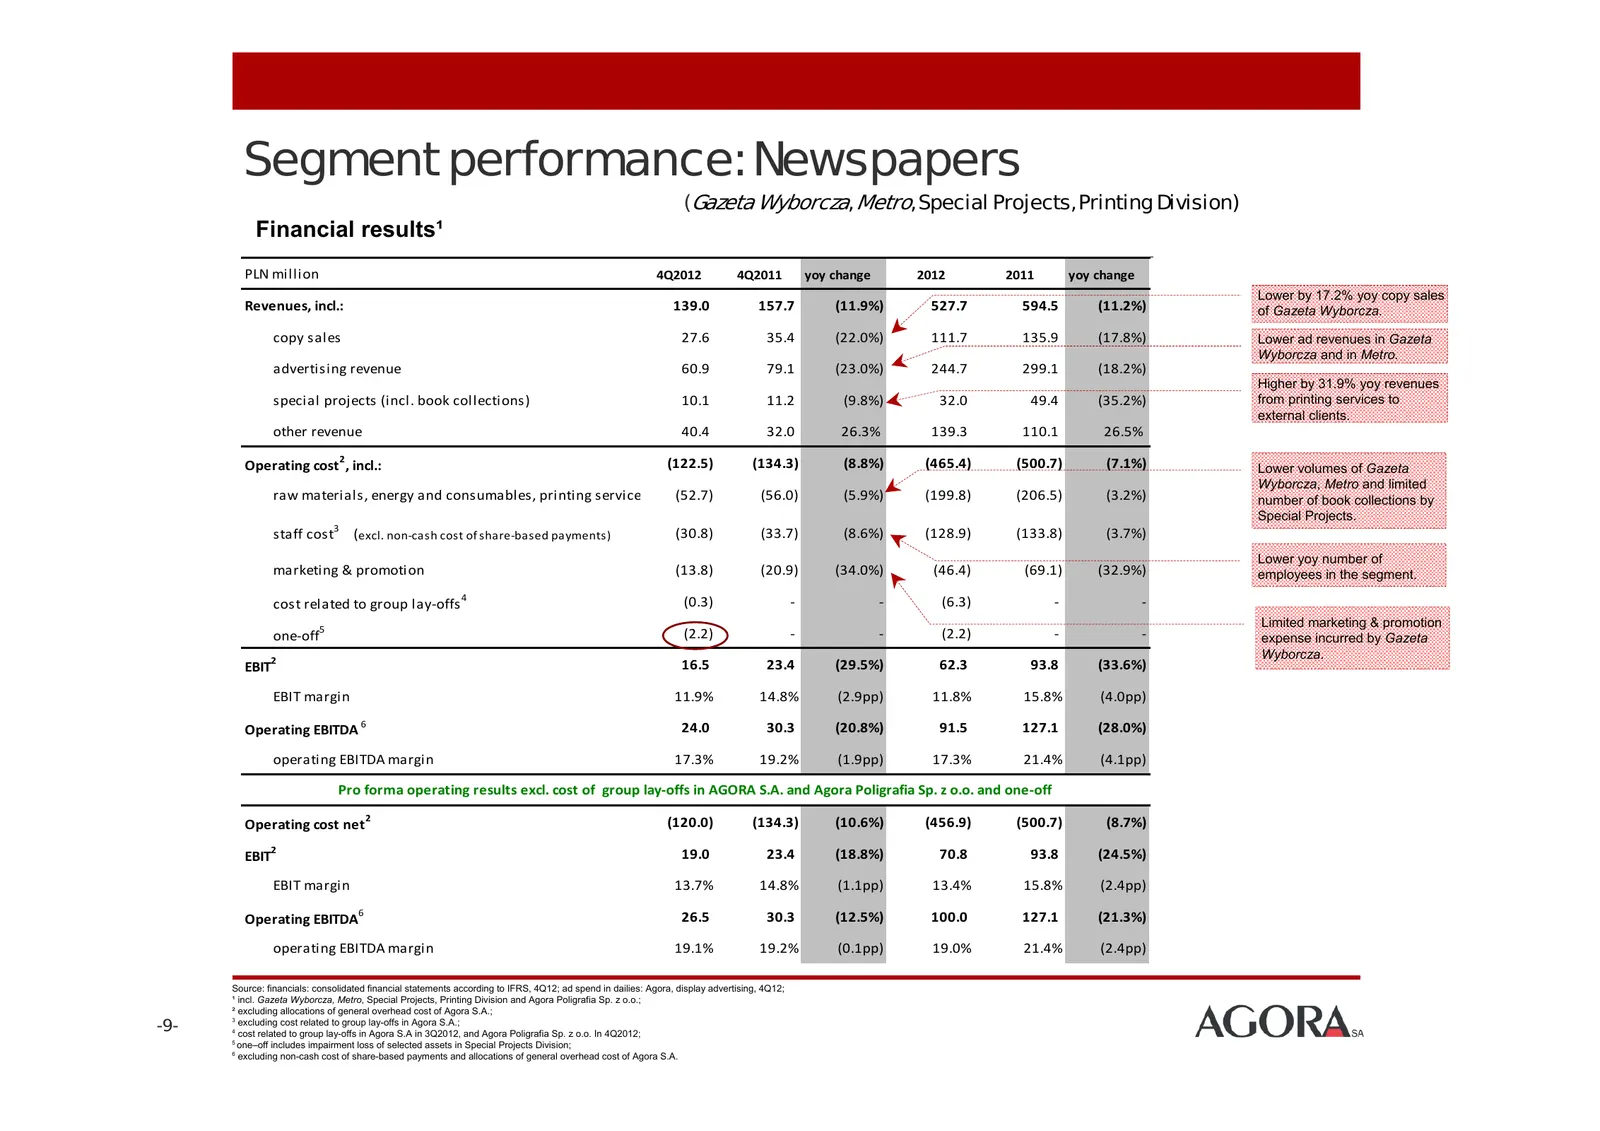
Segment performance: Newspapers (Gazeta Wyborcza, Metro, Special Projects, Printing Division) Financial results¹ PLN million 4Q2012 4Q2011 yoy change 2012 2011 yoy change Lower by 17.2% yoy copy sales Revenues, incl.: 139.0 157.7 (11.9%) 527.7 594.5 (11.2%) of Gazeta Wyborcza. copy sales 27.6 35.4 (
Slide 10: Position of Gazeta Wyborcza in dailies segment
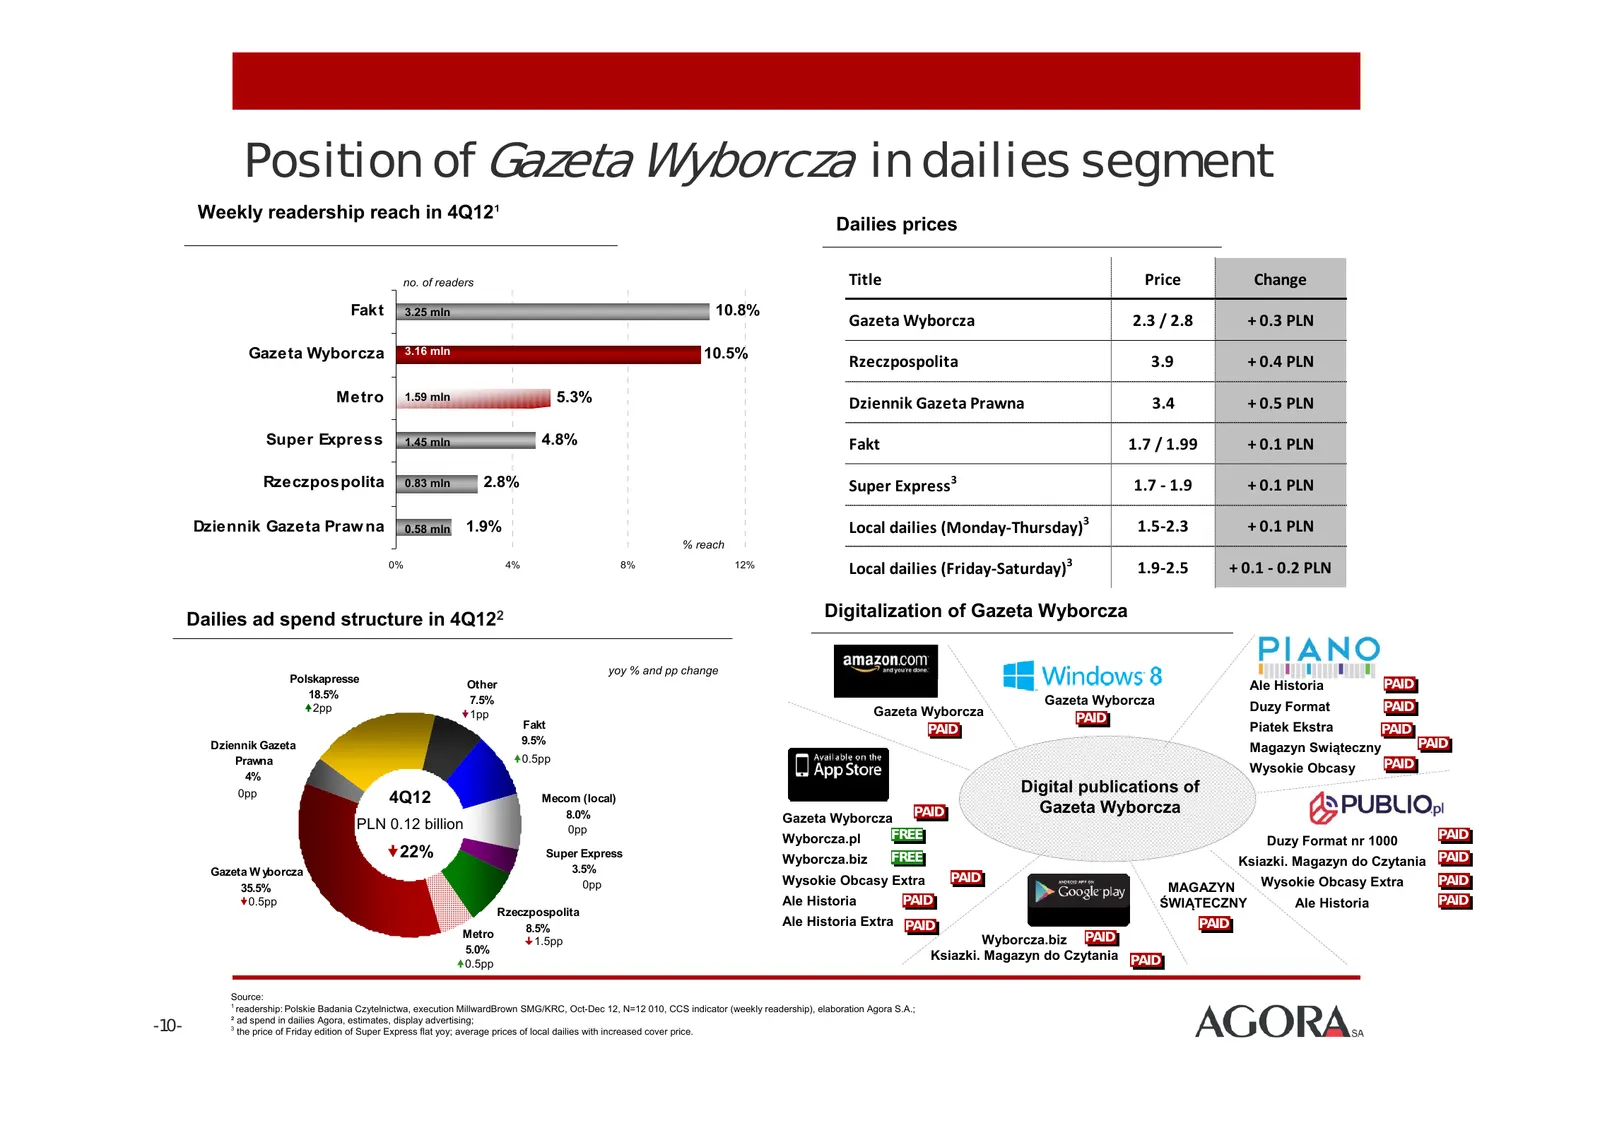
Position of Gazeta Wyborcza in dailies segment Weekly readership reach in 4Q12¹ Dailies prices no. of readers Title Price Change Fakt 3.25 mln 10.8% Gazeta Wyborcza 2.3 / 2.8 + 0.3 PLN Gazeta Wyborcza 3.16 mln 10.5% Rzeczpospolita 3.9 + 0.4 PLN Metro 1.59 mln 5.3% Dziennik Gazeta Prawna 3.4 + 0.5 PL
Slide 11: Metro and Special Projects
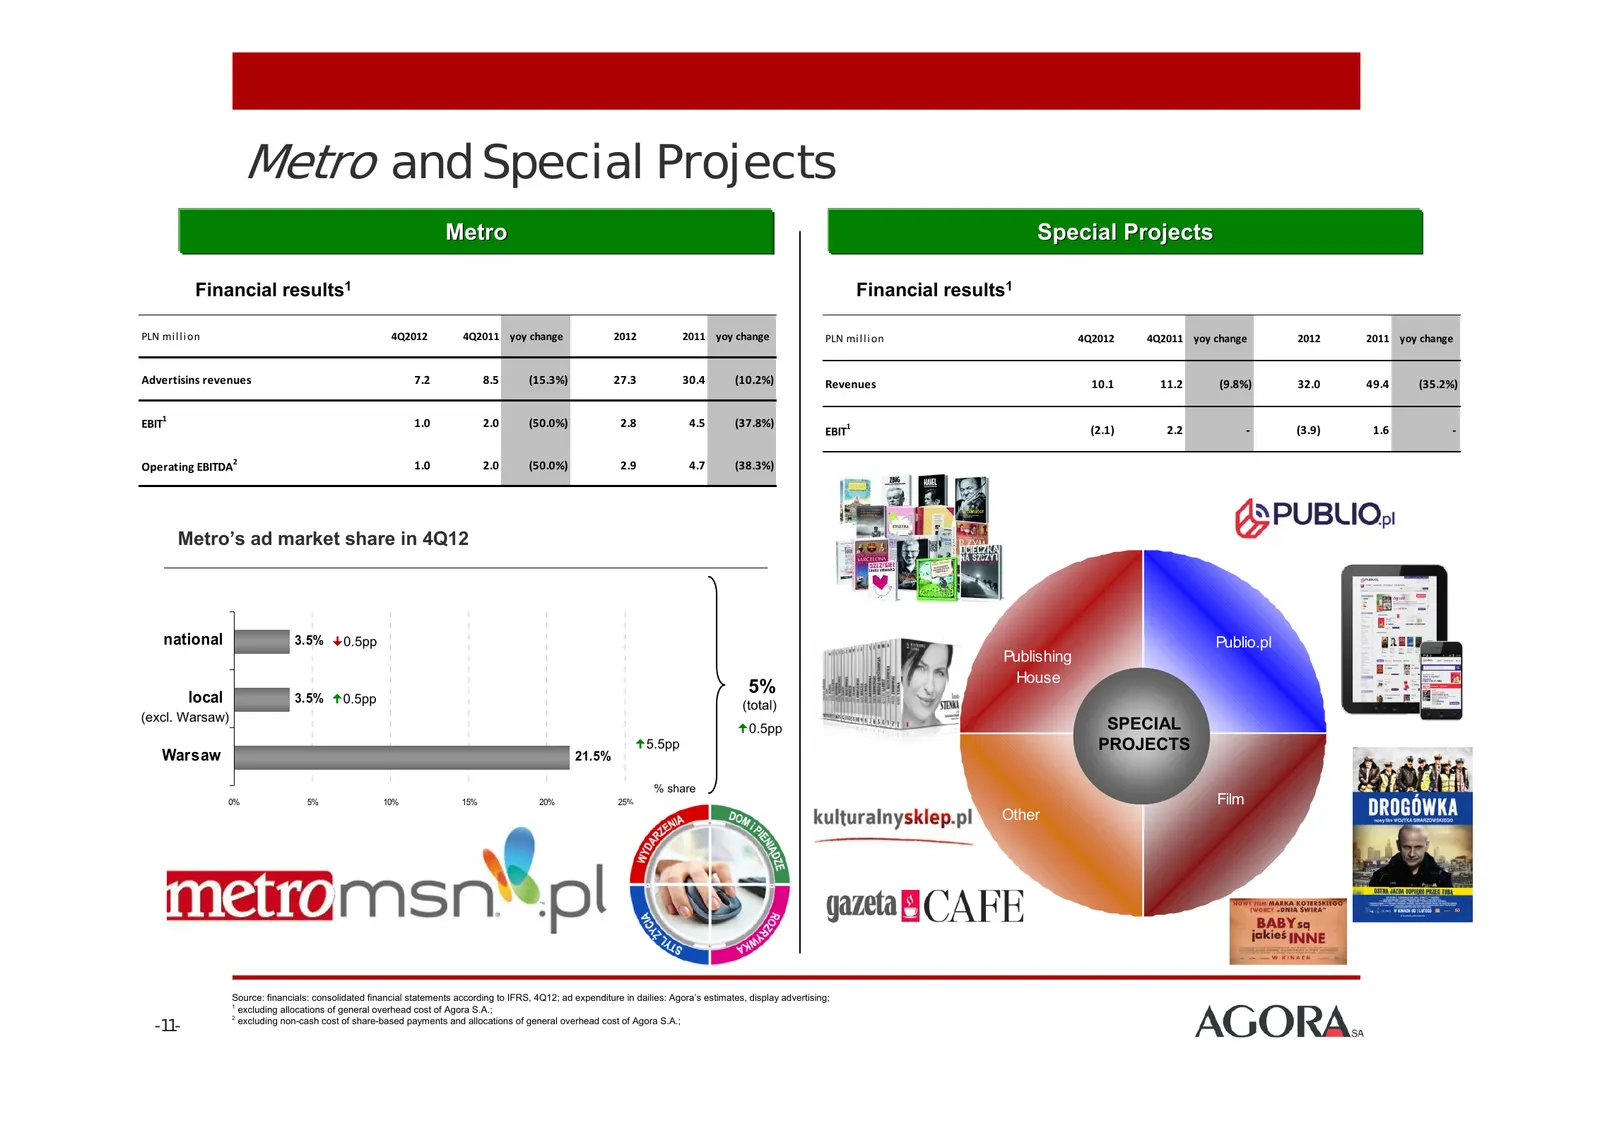
Metro and Special Projects Metro Special Projects Projects Financial results1 Financial results1 PLN mi lli on 4Q2012 4Q2011 yoy change 2012 2011 yoy change PLN mi lli on 4Q2012 4Q2011 yoy change 2012 2011 yoy change Advertisins revenues 7.2 8.5 (15.3%) 27.3 30.4 (10.2%) Revenues 10.1 11.2 (9.8%) 32
Slide 12: Segment performance: Internet
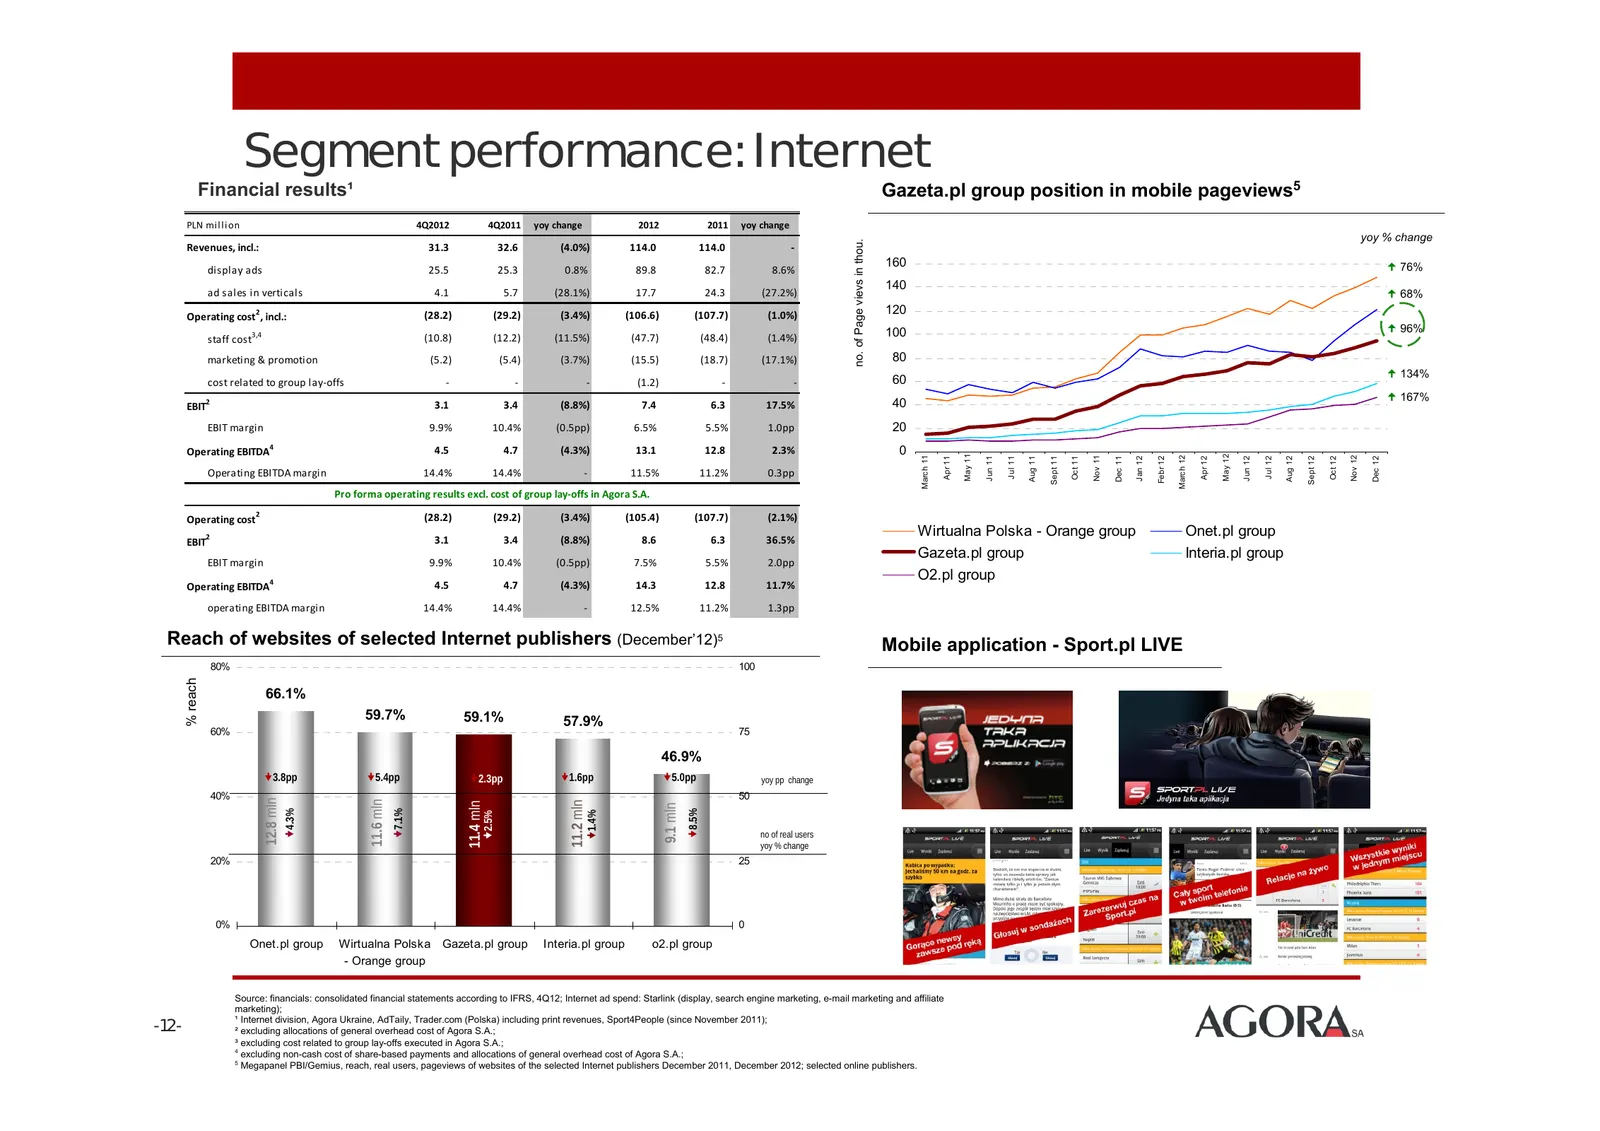
Segment performance: Internet Financial results¹ Gazeta.pl group position in mobile pageviews5 PLN mi l l i on 4Q2012 4Q2011 yoy change 2012 2011 yoy change yoy % change no. of Page vievs in thou. Revenues, incl.: 31.3 32.6 (4.0%) 114.0 114.0 ‐ 160 76% display ads 25.5 25.3 0.8% 89.8 82.7 8.6% 140
Slide 13: Segment performance: Cinema
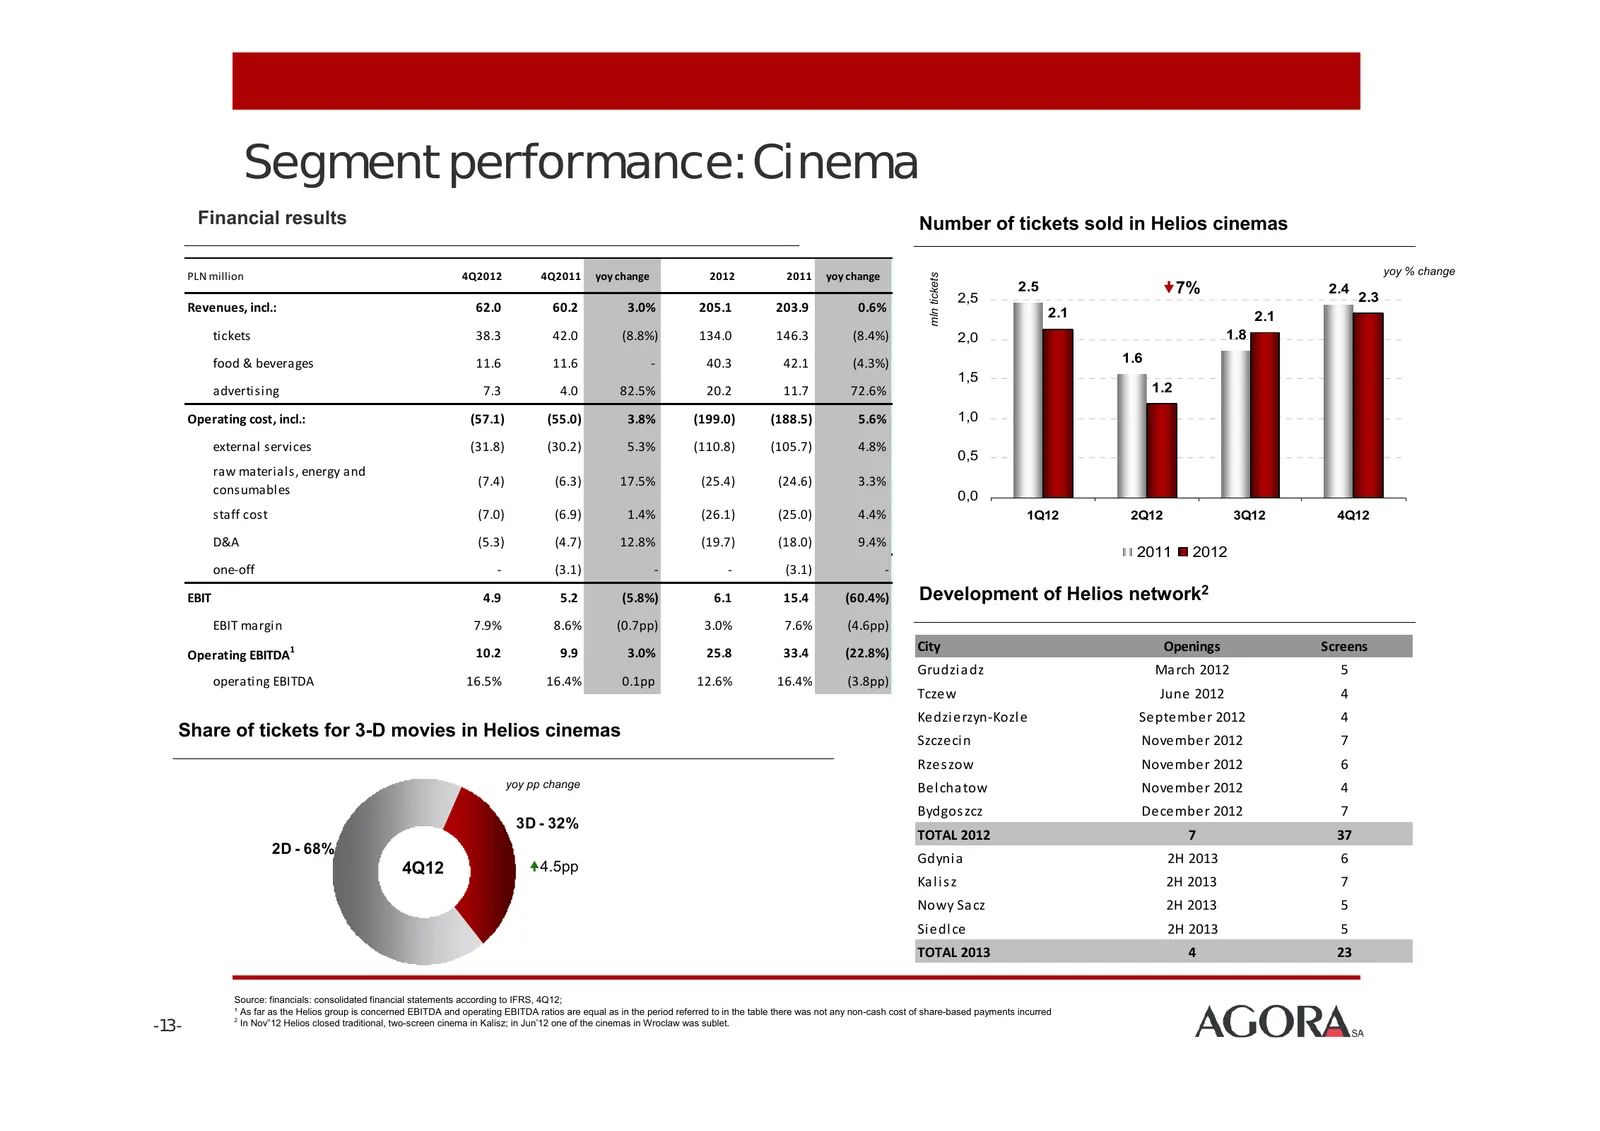
Segment performance: Cinema Financial results Number of tickets sold in Helios cinemas PLN million 4Q2012 4Q2011 yoy change 2012 2011 yoy change yoy % change mln tickets 2.5 7% 2.4 2.3 2,5 Revenues, incl.: 62.0 60.2 3.0% 205.1 203.9 0.6% 2.1 2.1 tickets 38.3 42.0 (8.8%) 134.0 146.3 (8.4%) 2,0 1.8 f
Slide 14: Segment performance: Outdoor
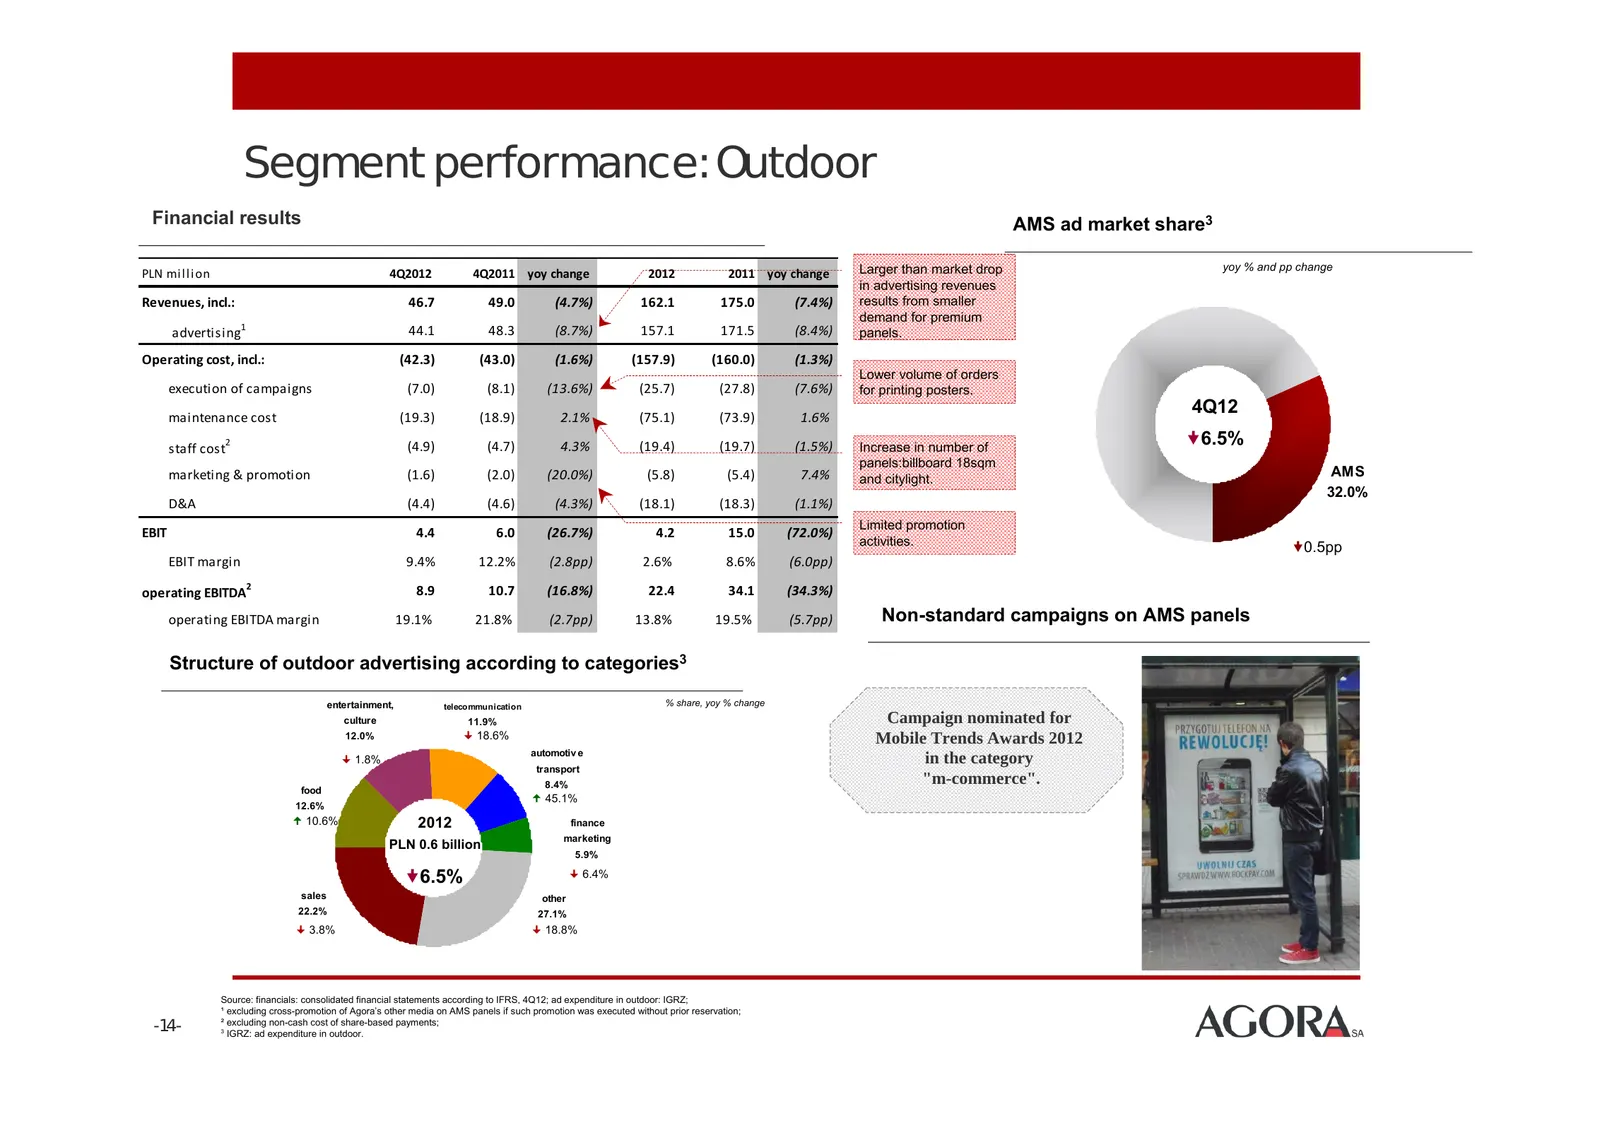
Segment performance: Outdoor Financial results AMS ad market share3 Larger than market drop yoy % and pp change PLN mi l l i on 4Q2012 4Q2011 yoy change 2012 2011 yoy change in advertising revenues Revenues, incl.: 46.7 49.0 (4.7%) 162.1 175.0 (7.4%) results from smaller demand for premium 1 adverti
Slide 15: Segment performance: Radio
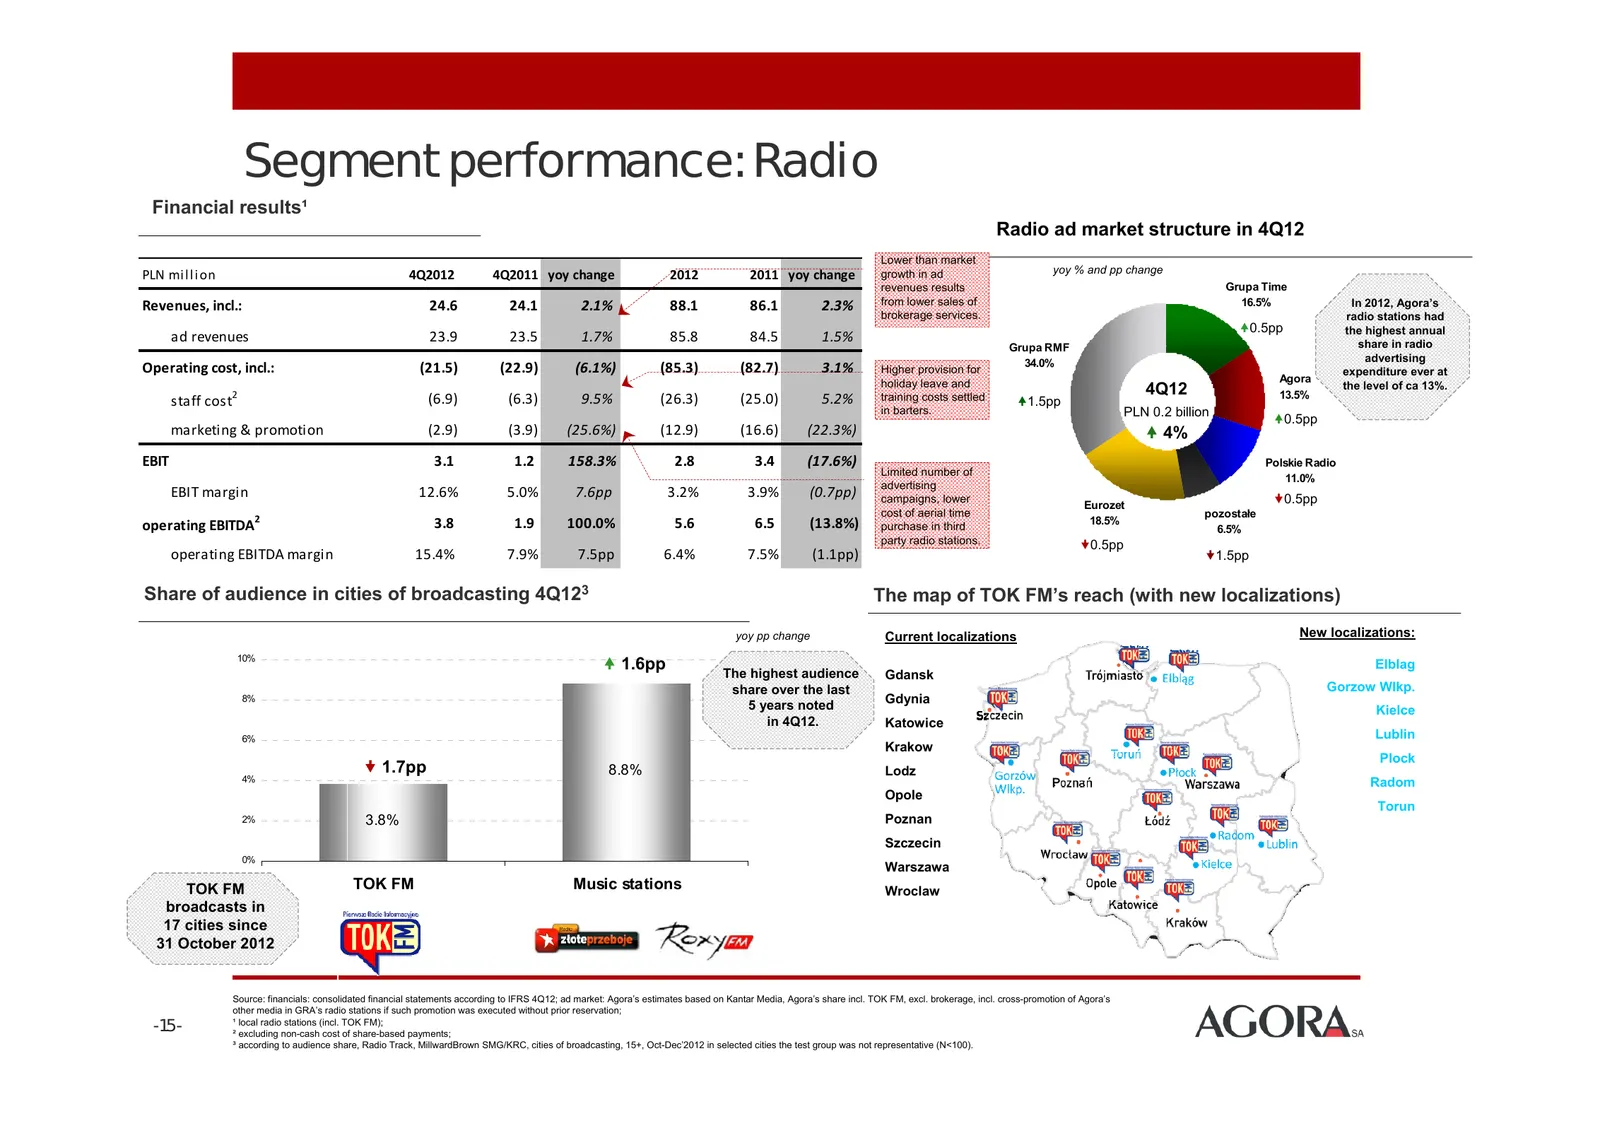
Segment performance: Radio Financial results¹ Radio ad market structure in 4Q12 Lower than market PLN mi l l i on 4Q2012 4Q2011 yoy change 2012 2011 yoy change growth in ad yoy % and pp change revenues results Grupa Time Revenues, incl.: 24.6 24.1 2.1% 88.1 86.1 2.3% from lower sales of 16.5% In 201
Slide 16: Segment performance: Magazines
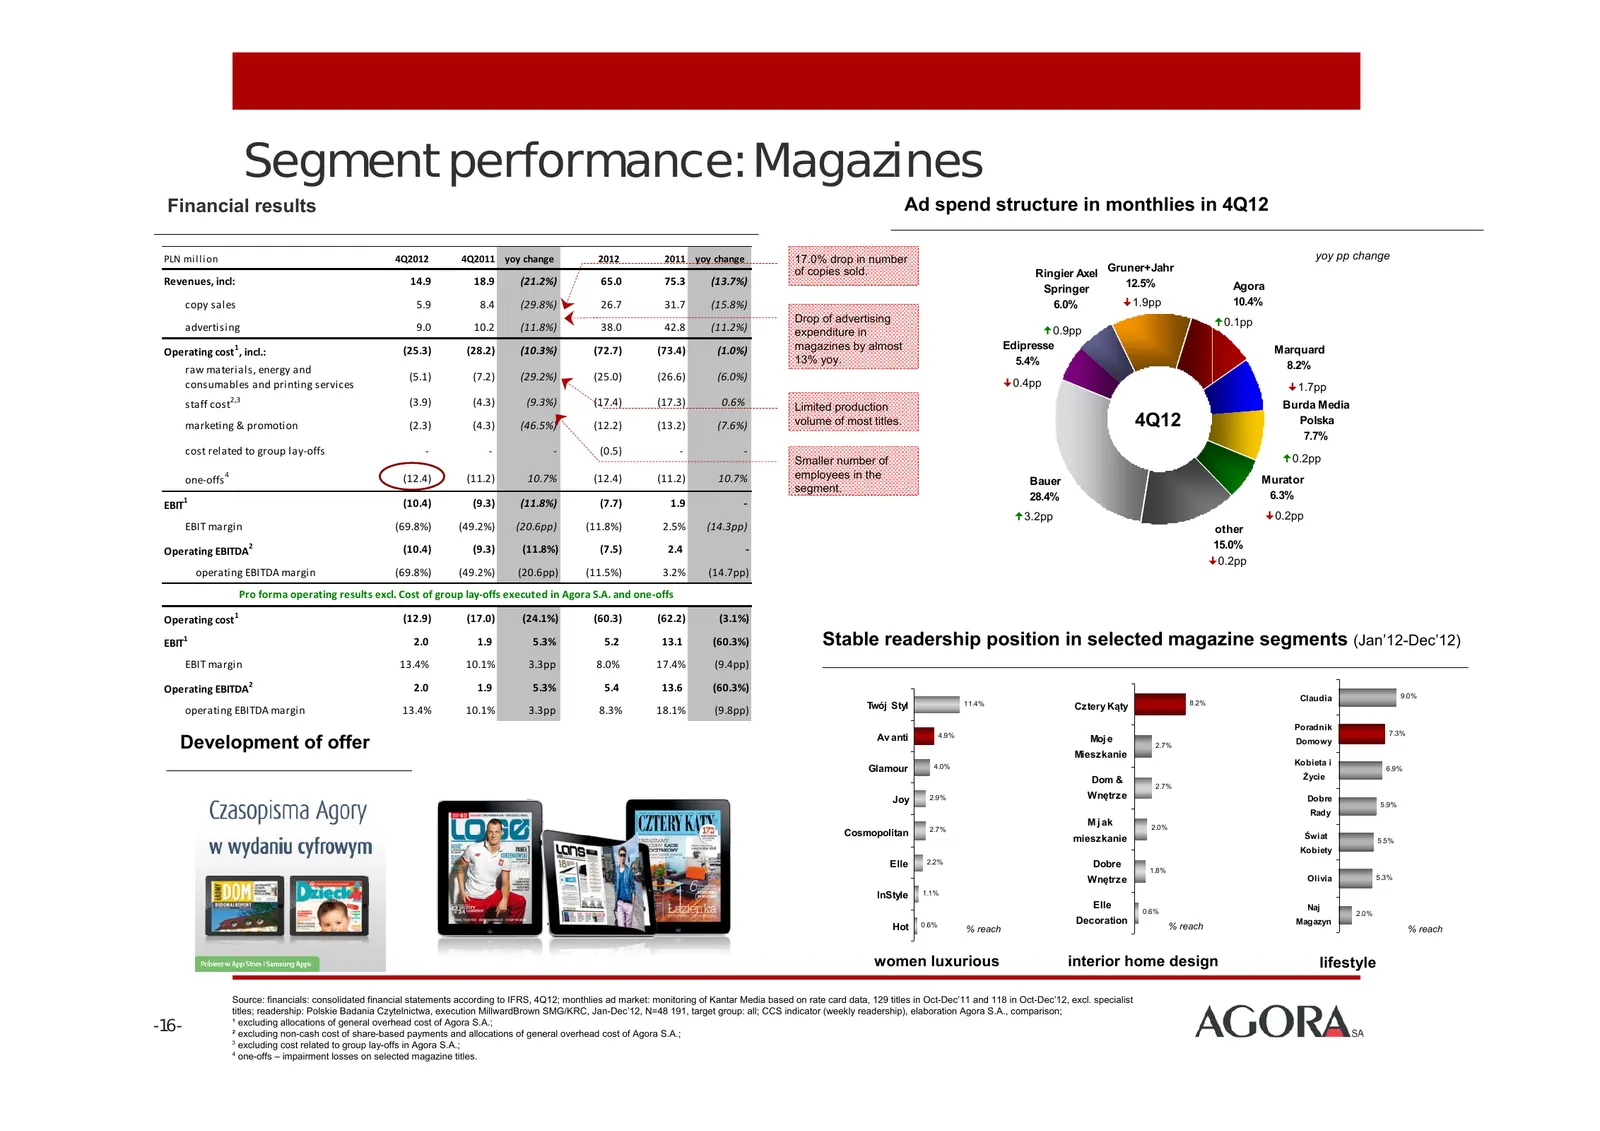
Segment performance: Magazines Financial results Ad spend structure in monthlies in 4Q12 PLN mi l l i on 4Q2012 4Q2011 yoy change 2012 2011 yoy change 17.0% drop in number yoy pp change of copies sold. Gruner+Jahr Ringier Axel Revenues, incl: 14.9 18.9 (21.2%) 65.0 75.3 (13.7%) 12.5% Agora Springer
Slide 17: Main objectives of the Agora Group in 2013
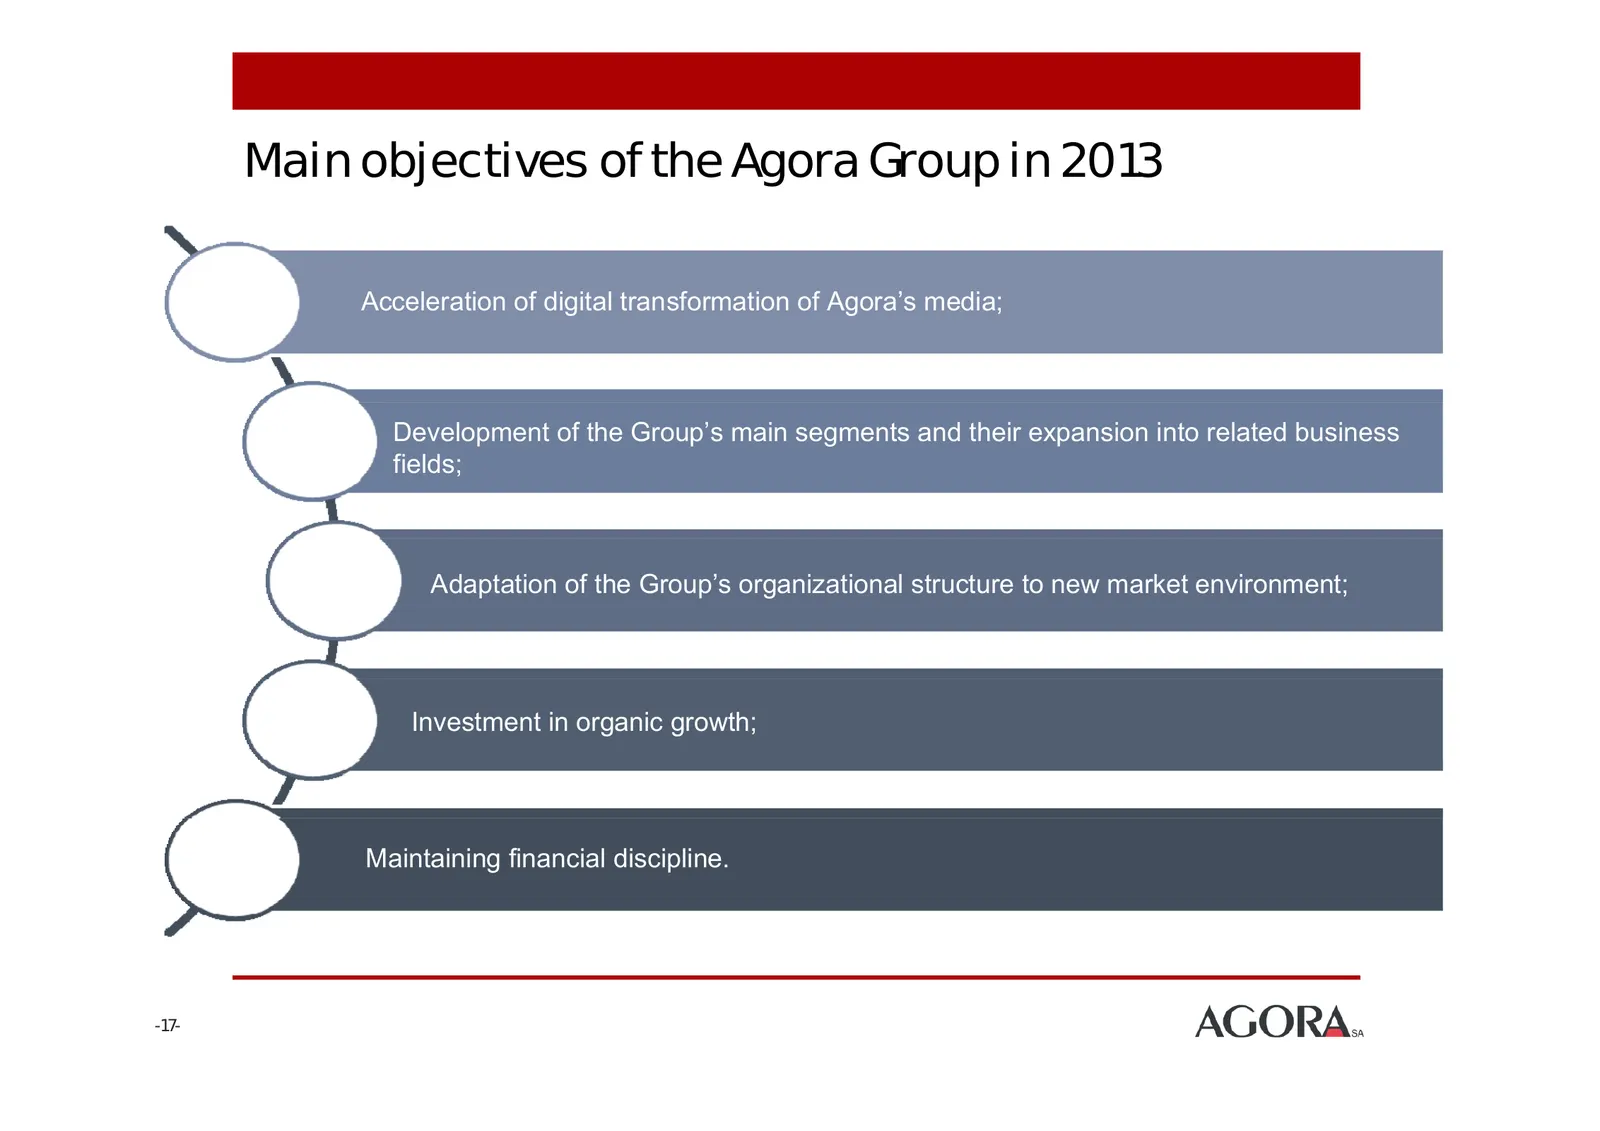
Main objectives of the Agora Group in 2013 Acceleration of digital transformation of Agora’s media; Development of the Group’s main segments and their expansion into related business fields; Adaptation of the Group’s organizational structure to new market environment; Investment in organic growth; M
Slide 18: Examples of pro bono activities in 2012
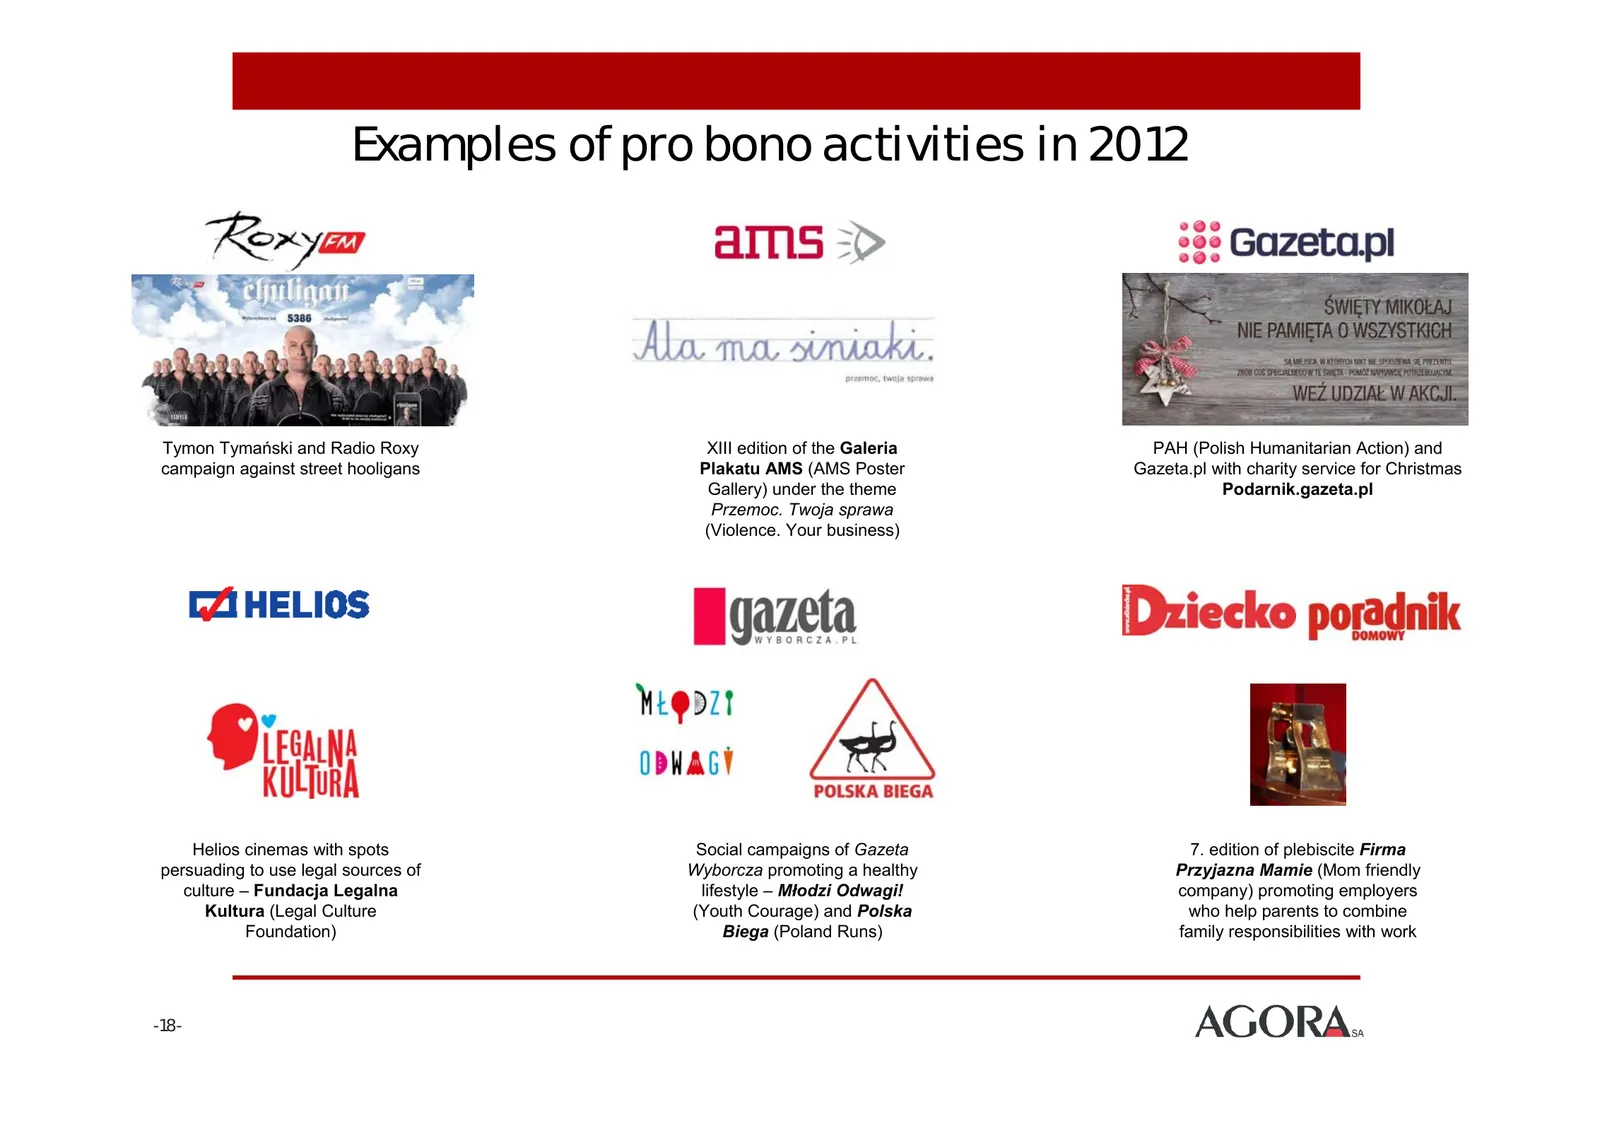
Examples of pro bono activities in 2012 Tymon Tymański and Radio Roxy XIII edition of the Galeria PAH (Polish Humanitarian Action) and campaign against street hooligans Plakatu AMS (AMS Poster Gazeta.pl with charity service for Christmas Gallery) under the theme Podarnik.gazeta.pl Przemoc. Twoja spr
Slide 19: Most significant awards and distinctions in 2012
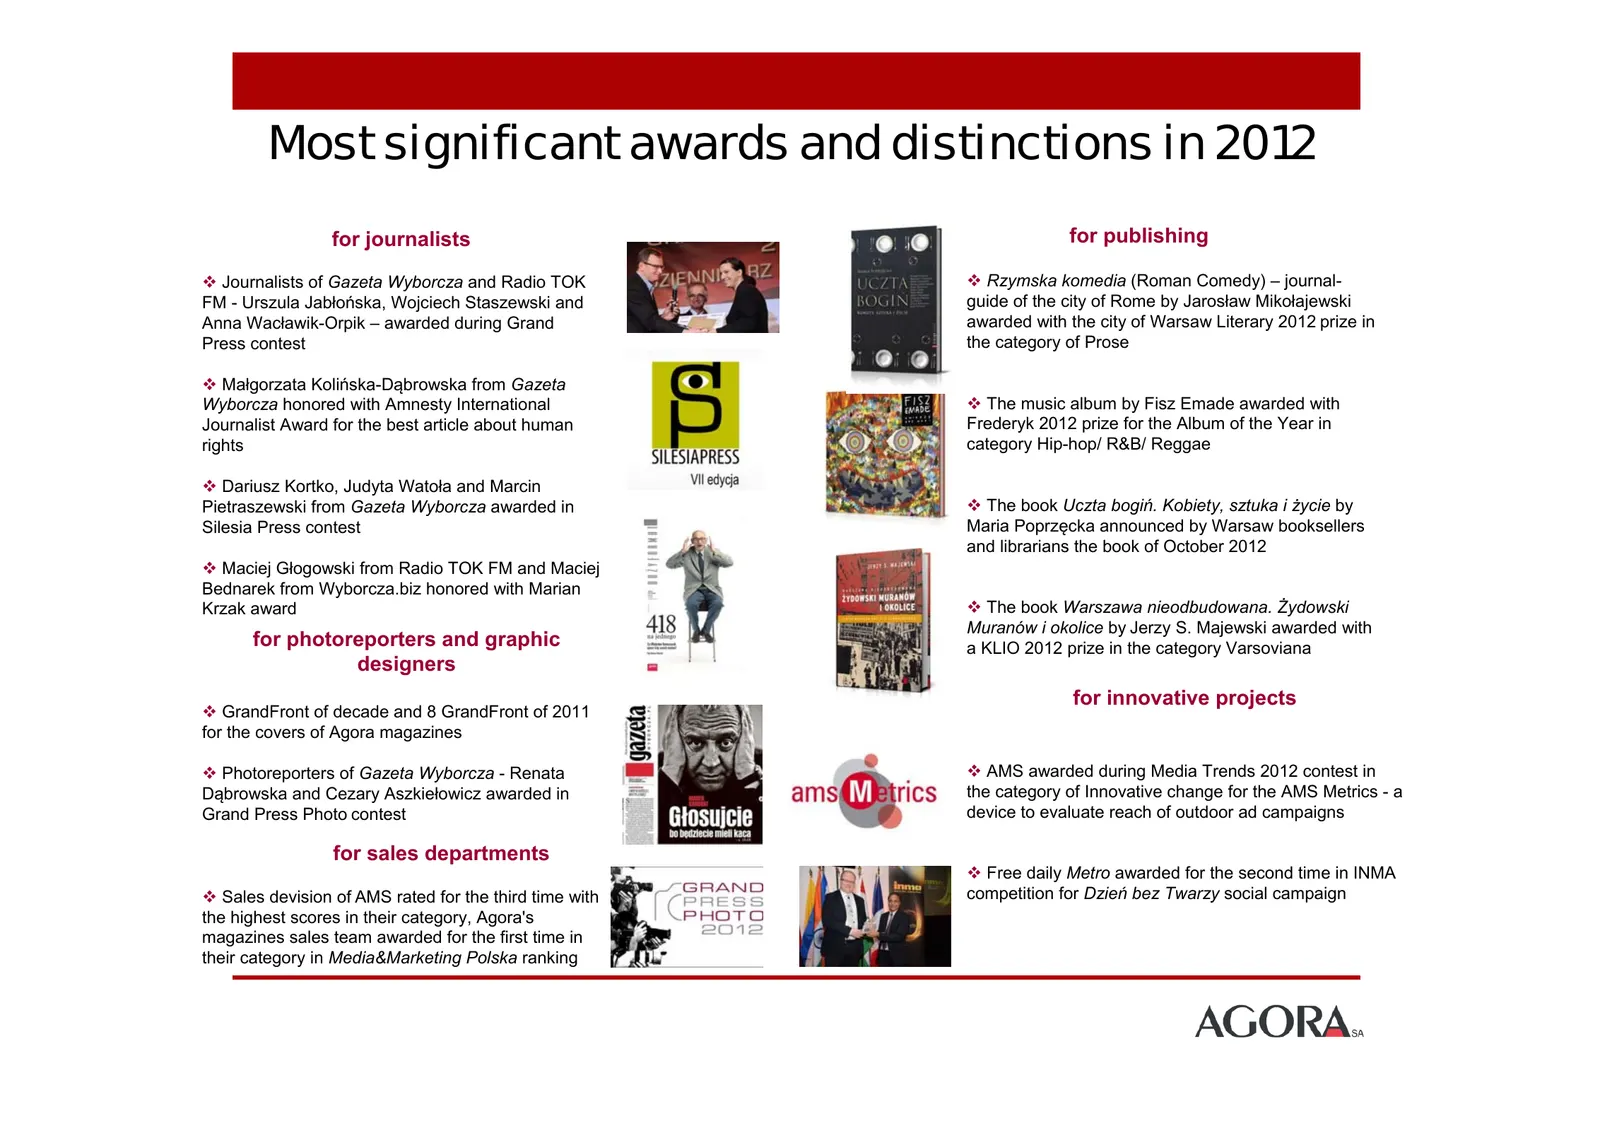
Most significant awards and distinctions in 2012 for journalists for publishing Journalists of Gazeta Wyborcza and Radio TOK Rzymska komedia (Roman Comedy) – journal- FM - Urszula Jabłońska, Wojciech Staszewski and guide of the city of Rome by Jarosław Mikołajewski Anna Wacławik-Orpik – awarded
Slide 20: Disclaimer
This presentation has been prepared by Agora SA (the "Company"). The data and information contained on the individual slides do not show a complete or coherent financial analysis, nor present the commercial offer of the Company and serve for information purposes only. A detailed description of the b
Source: Internet Archive copy of agora.pl
More decks from Agora SA
 Q2 2026 Earnings Presentation18 slides · Aug 13, 2026
 Q1 2026 Earnings Presentation8 slides · May 26, 2026
 FY2025 Earnings Presentation33 slides · Mar 20, 2026
 Q4 2025 Earnings Presentation7 slides · Mar 2, 2026
 Q3 2025 Earnings Presentation28 slides · Nov 19, 2025
 Q3 2025 Earnings Presentation22 slides · Nov 19, 2025