NewSoft Technology Corporation · TPEX:5202
NewSoft Technology — Investor Presentation (December 2017)
22 slides from NewSoft Technology's investor presentation, Dec 19, 2017
Slide 1: Corporate Introduction
NewSoft Corporate Introduction Technology www.newsoft.com.tw Stock Code: 5202
Slide 2: Disclaimer
Disclaimer Please note that this presentation includes prospective statements. These statements are based on our current expectations. Actual results may differ. The company has no obligation to update these prospective statements in the future. 2017/12/19 1
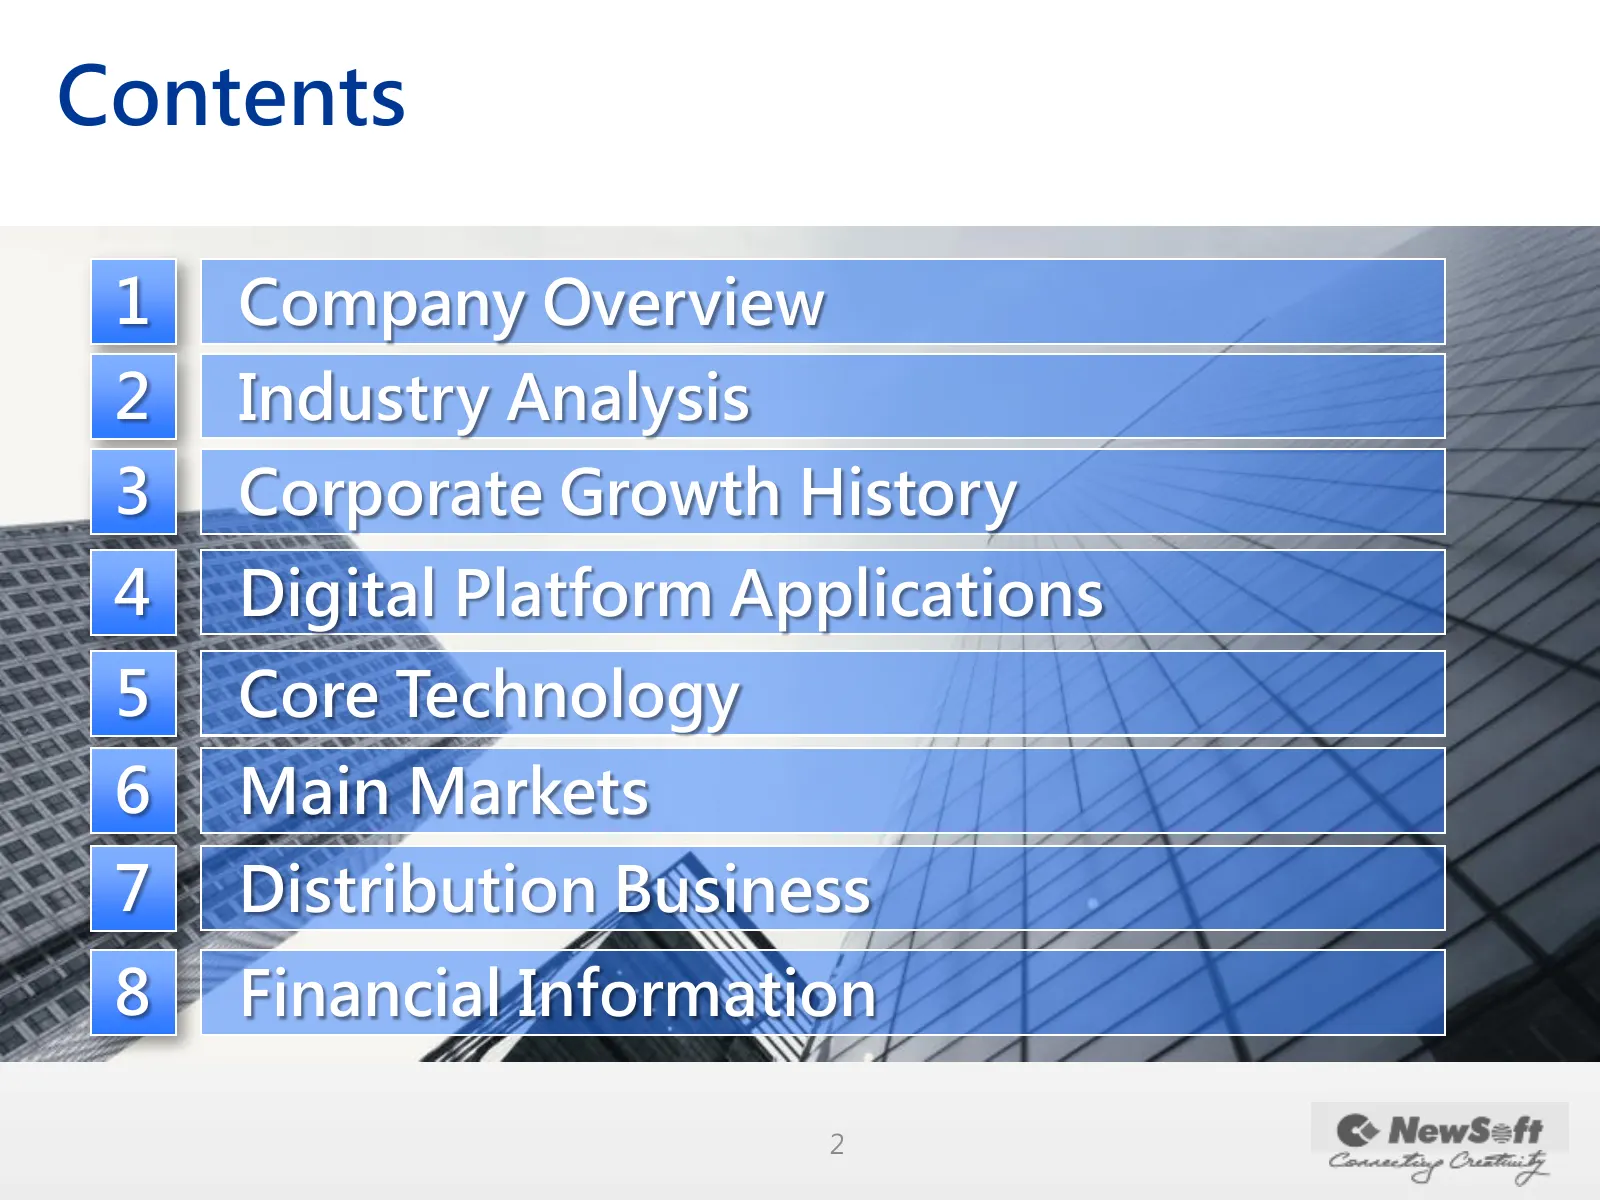
Slide 3: Contents
Contents 1 Company Overview 2 Industry Analysis 3 Corporate Growth History 4 Digital Platform Applications 5 Core Technology 6 Main Markets 7 Distribution Business 8 Financial Information 2
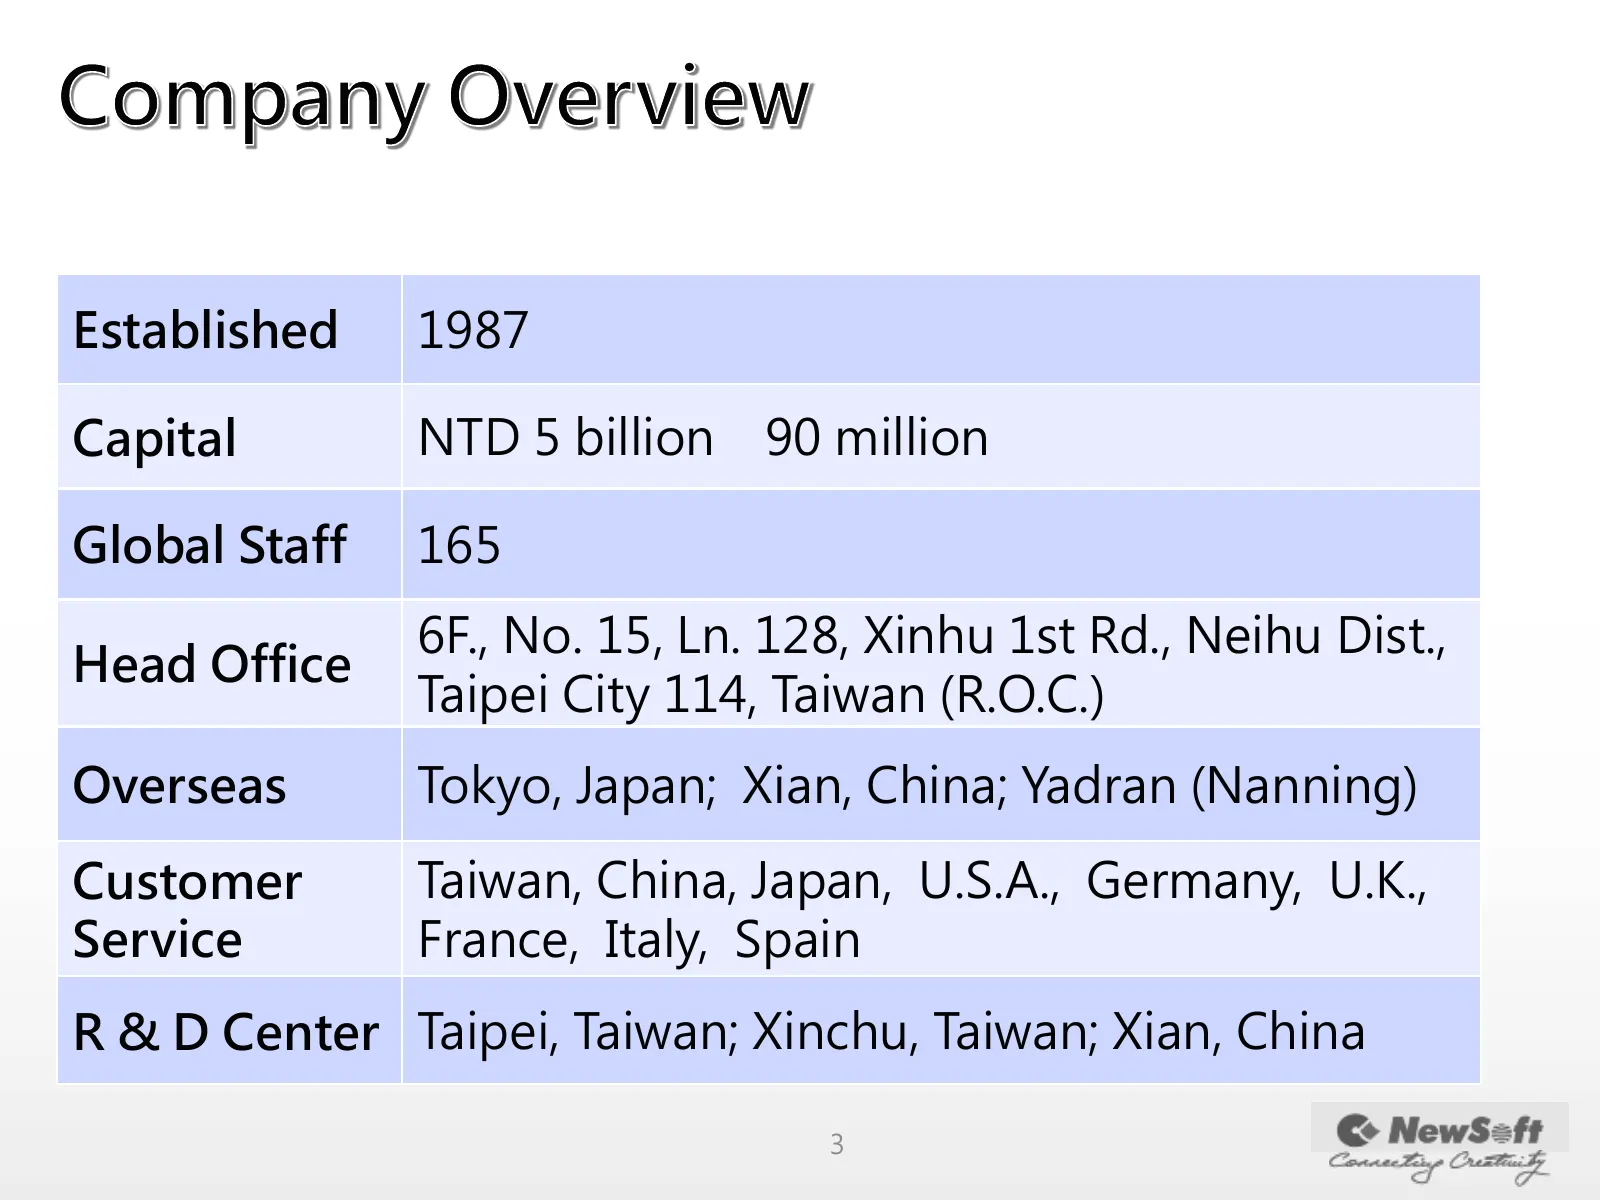
Slide 4: Company Overview: Established 1987, Capital NTD 5 billion
Established 1987 Capital NTD 5 billion 90 million Global Staff 165 6F., No. 15, Ln. 128, Xinhu 1st Rd., Neihu Dist., Head Office Taipei City 114, Taiwan (R.O.C.) Overseas Tokyo, Japan; Xian, China; Yadran (Nanning) Customer Taiwan, China, Japan, U.S.A., Germany, U.K., Service France, Italy, Spain R
Slide 5: Industry Analysis
Industry Analysis Digital Transformation of the Economy 4 [ <3 NewS=ft
Slide 6: 10 Important Technology Trends
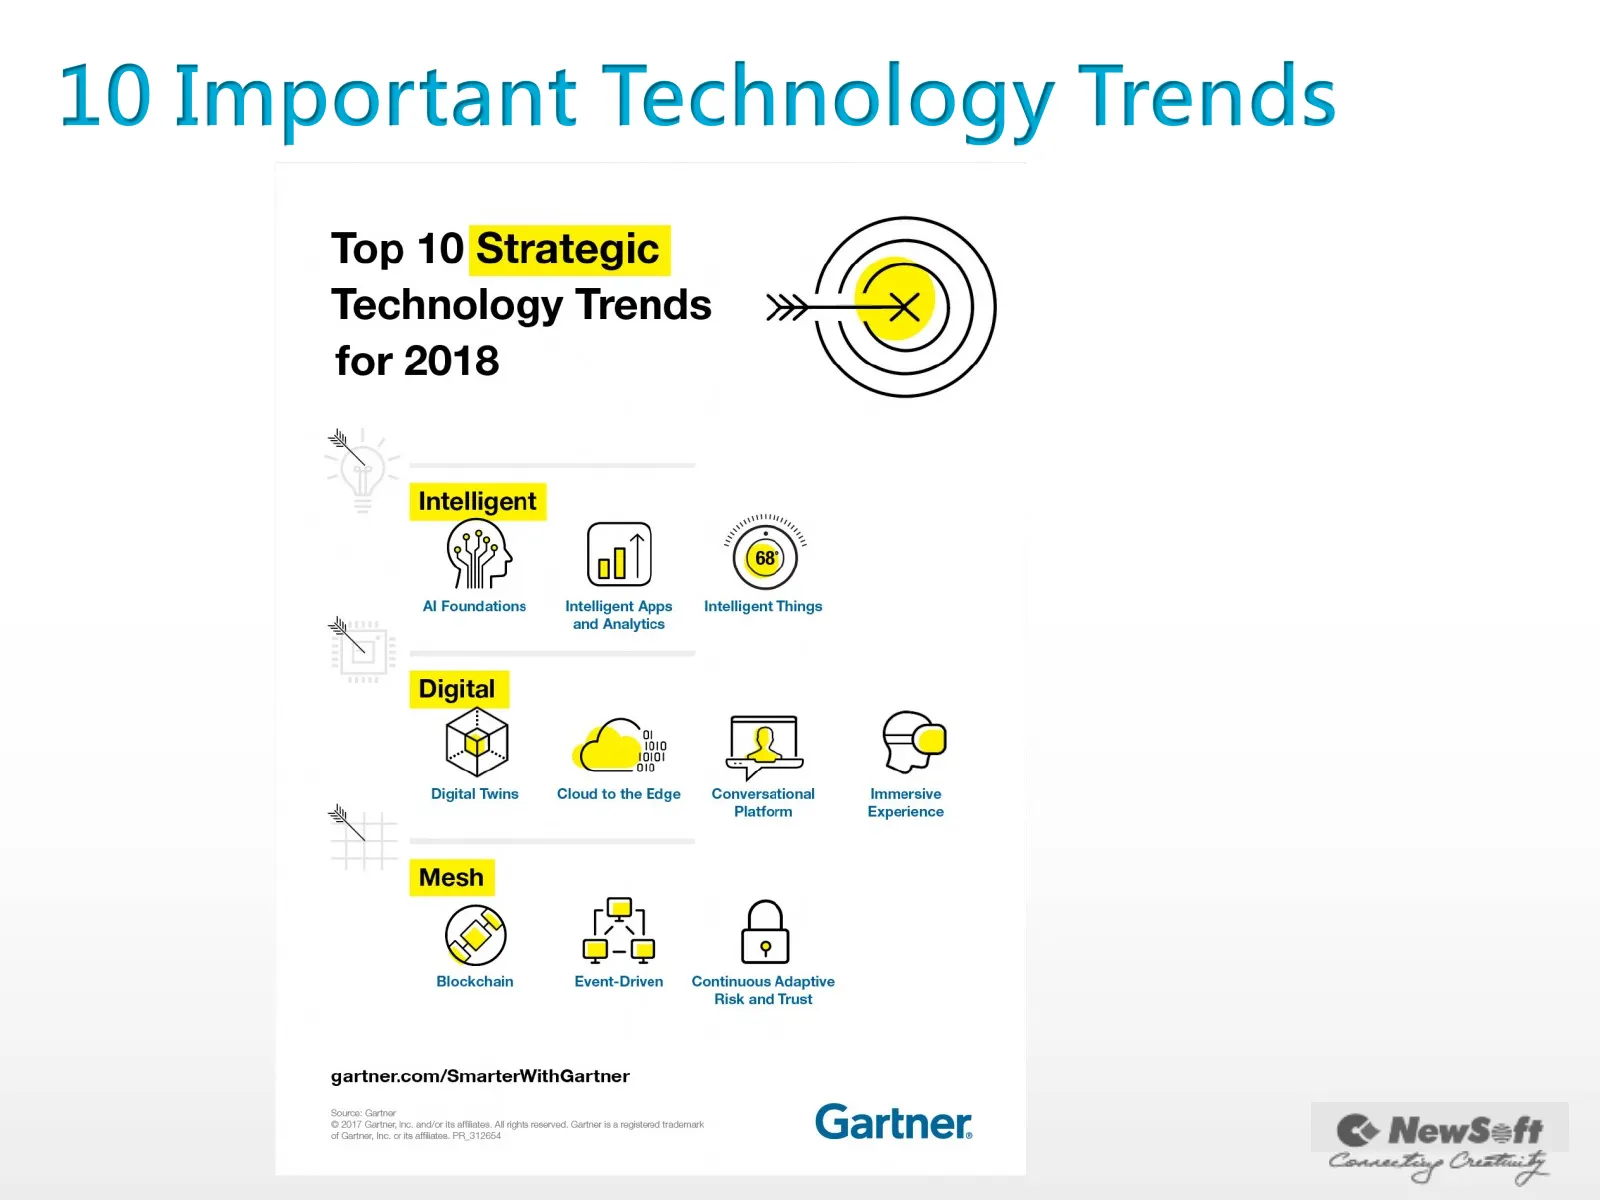
10 Important Technology Trends 5
Slide 7: IT Management and Challenges
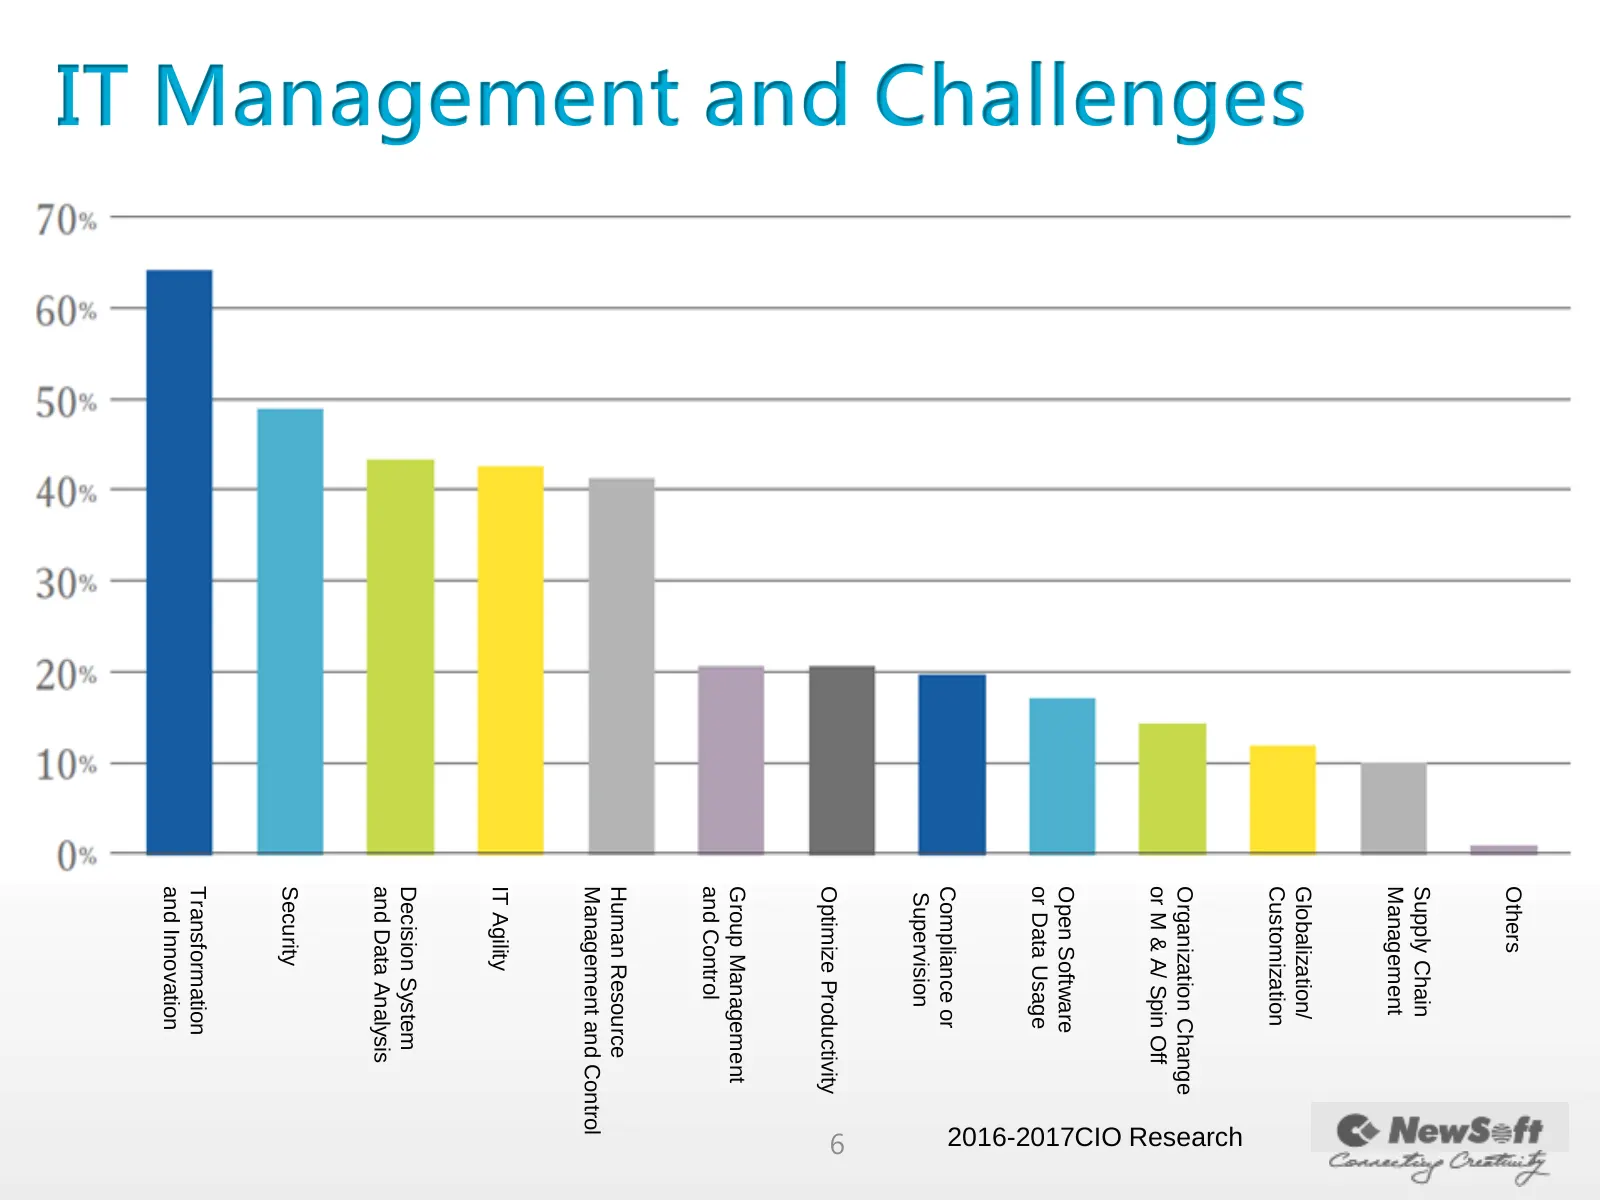
Others Supply Chain Management Globalization/ IT Management and Challenges Customization 2016-2017CIO Research Organization Change or M & A/ Spin Off Open Software or Data Usage Compliance or Supervision 6 Optimize Productivity Group Management and Control Human Resource Management and Control IT Ag
Slide 8: Corporate Growth History
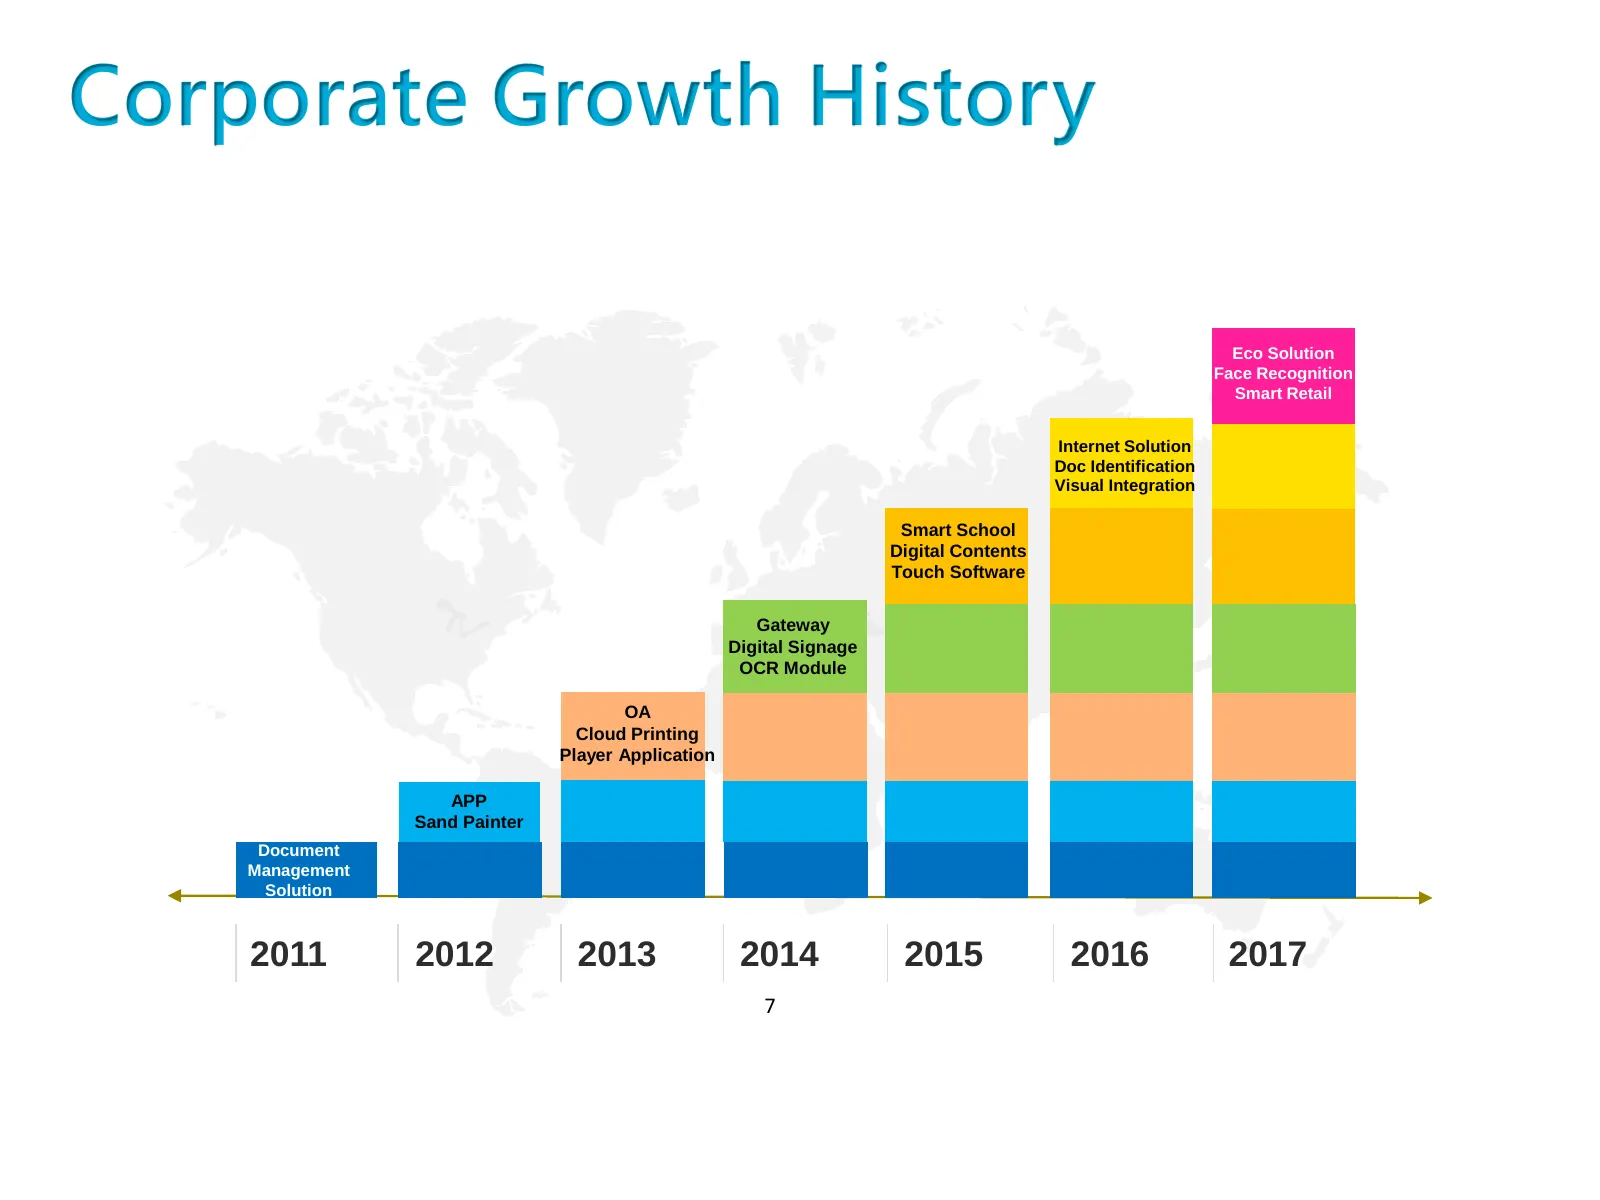
Corporate Growth History Eco Solution Face Recognition Smart Retail Internet Solution Doc Identification Visual Integration Smart School Digital Contents Touch Software Gateway Digital Signage OCR Module OA Cloud Printing Player Application APP Sand Painter Document Management Solution 2011 2012 201
Slide 9: Business Scope
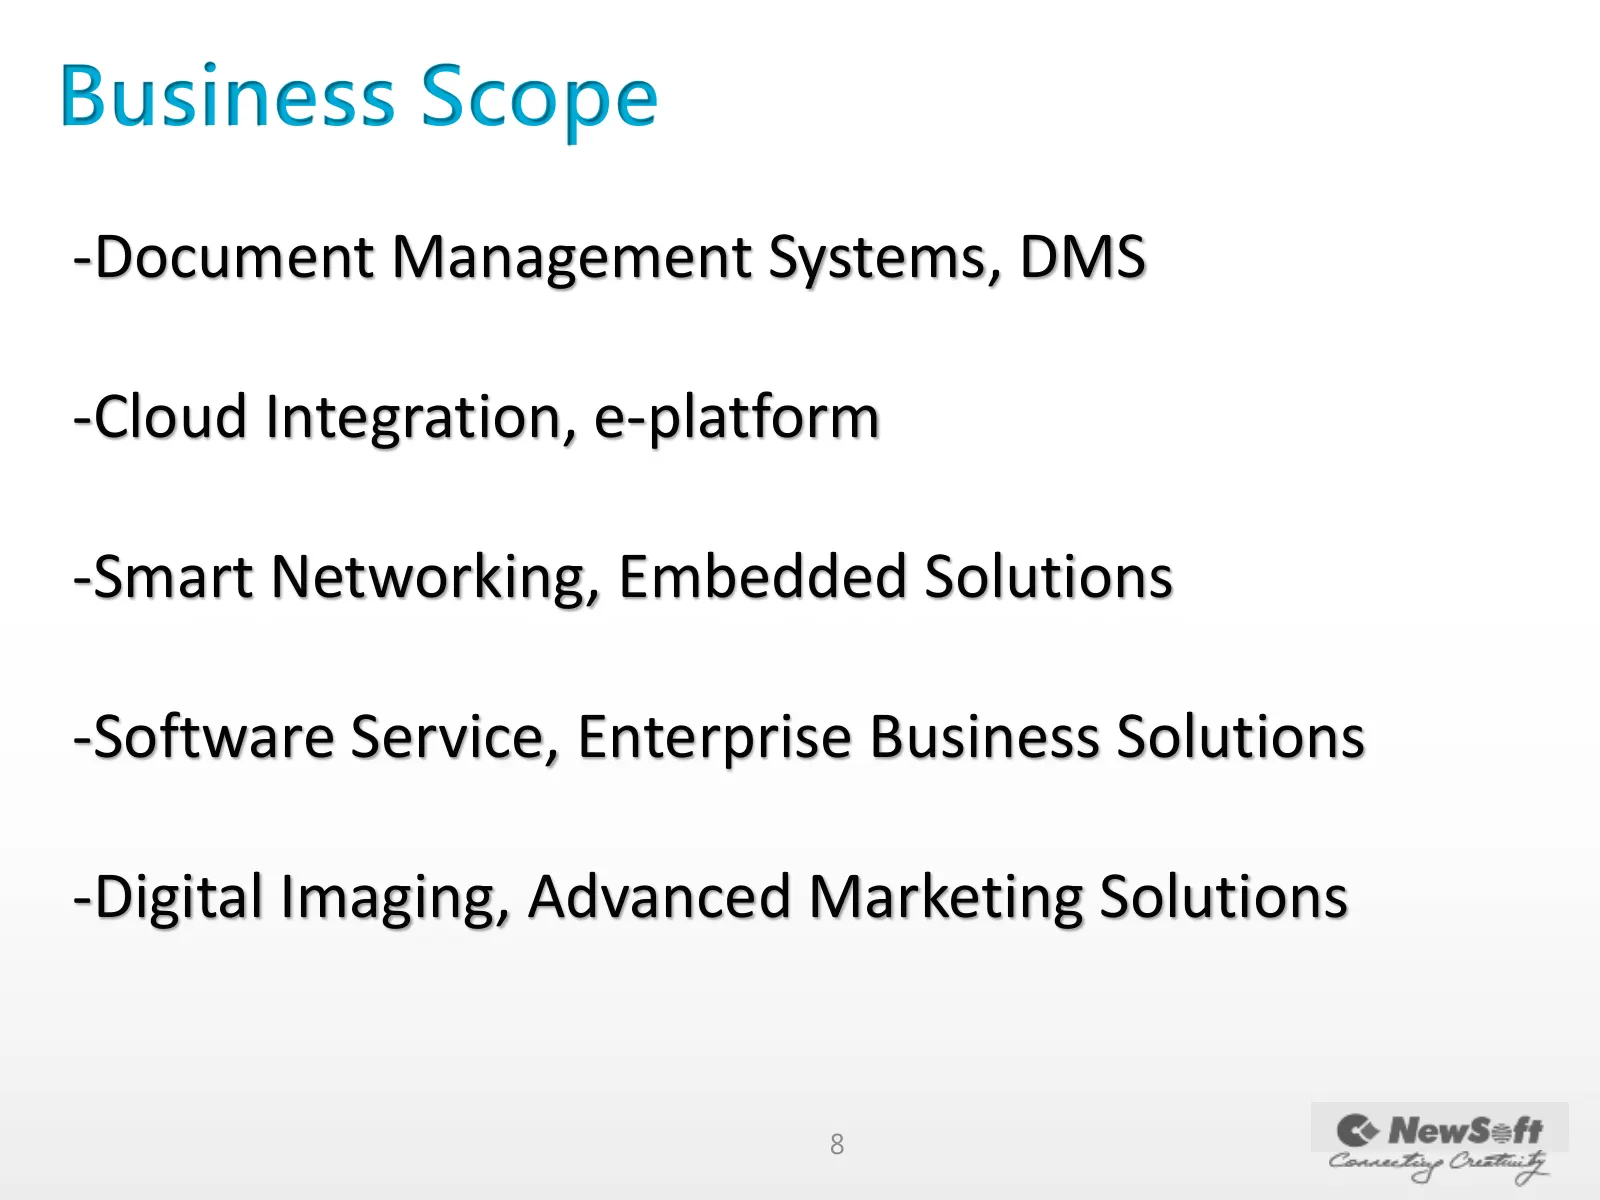
Business Scope -Document Management Systems, DMS -Cloud Integration, e-platform -Smart Networking, Embedded Solutions -Software Service, Enterprise Business Solutions -Digital Imaging, Advanced Marketing Solutions 8
Slide 10: Core Technology
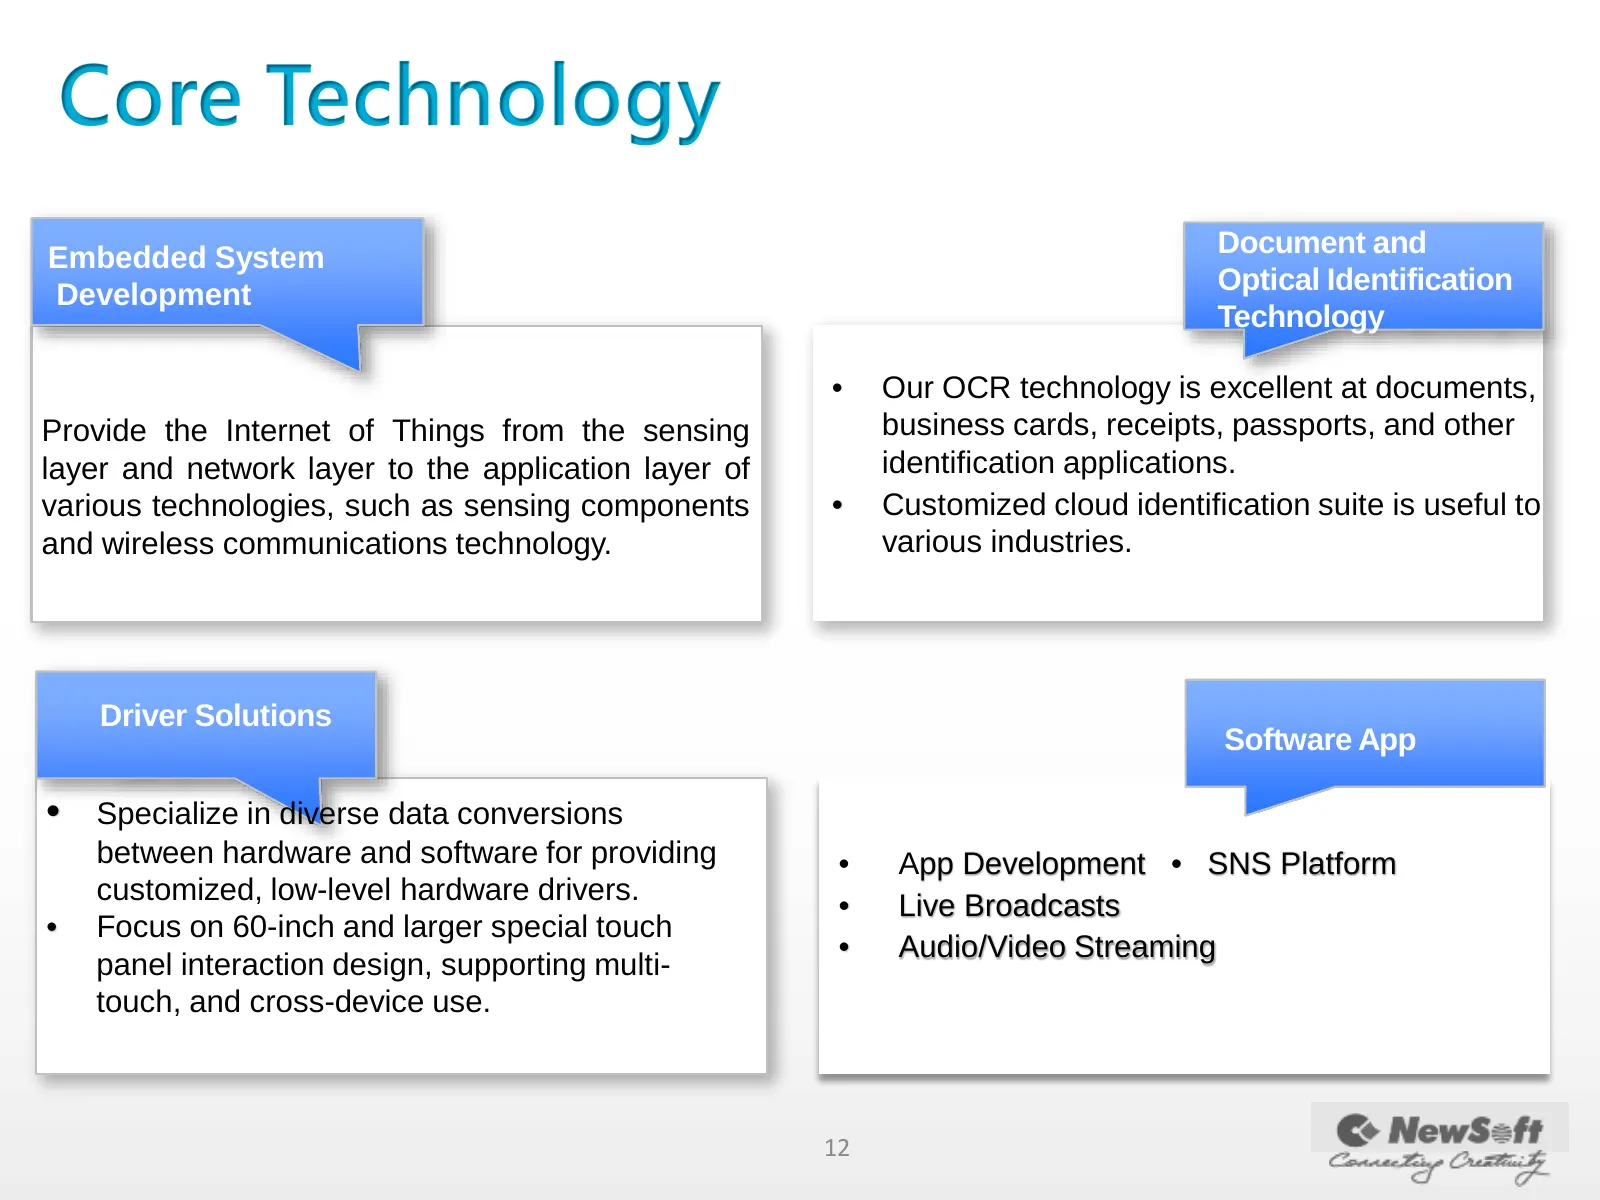
Core Technology Embedded System Document and Development Optical Identification Technology • Our OCR technology is excellent at documents, Provide the Internet of Things from the sensing business cards, receipts, passports, and other layer and network layer to the application layer of identification
Slide 11: Information Integration
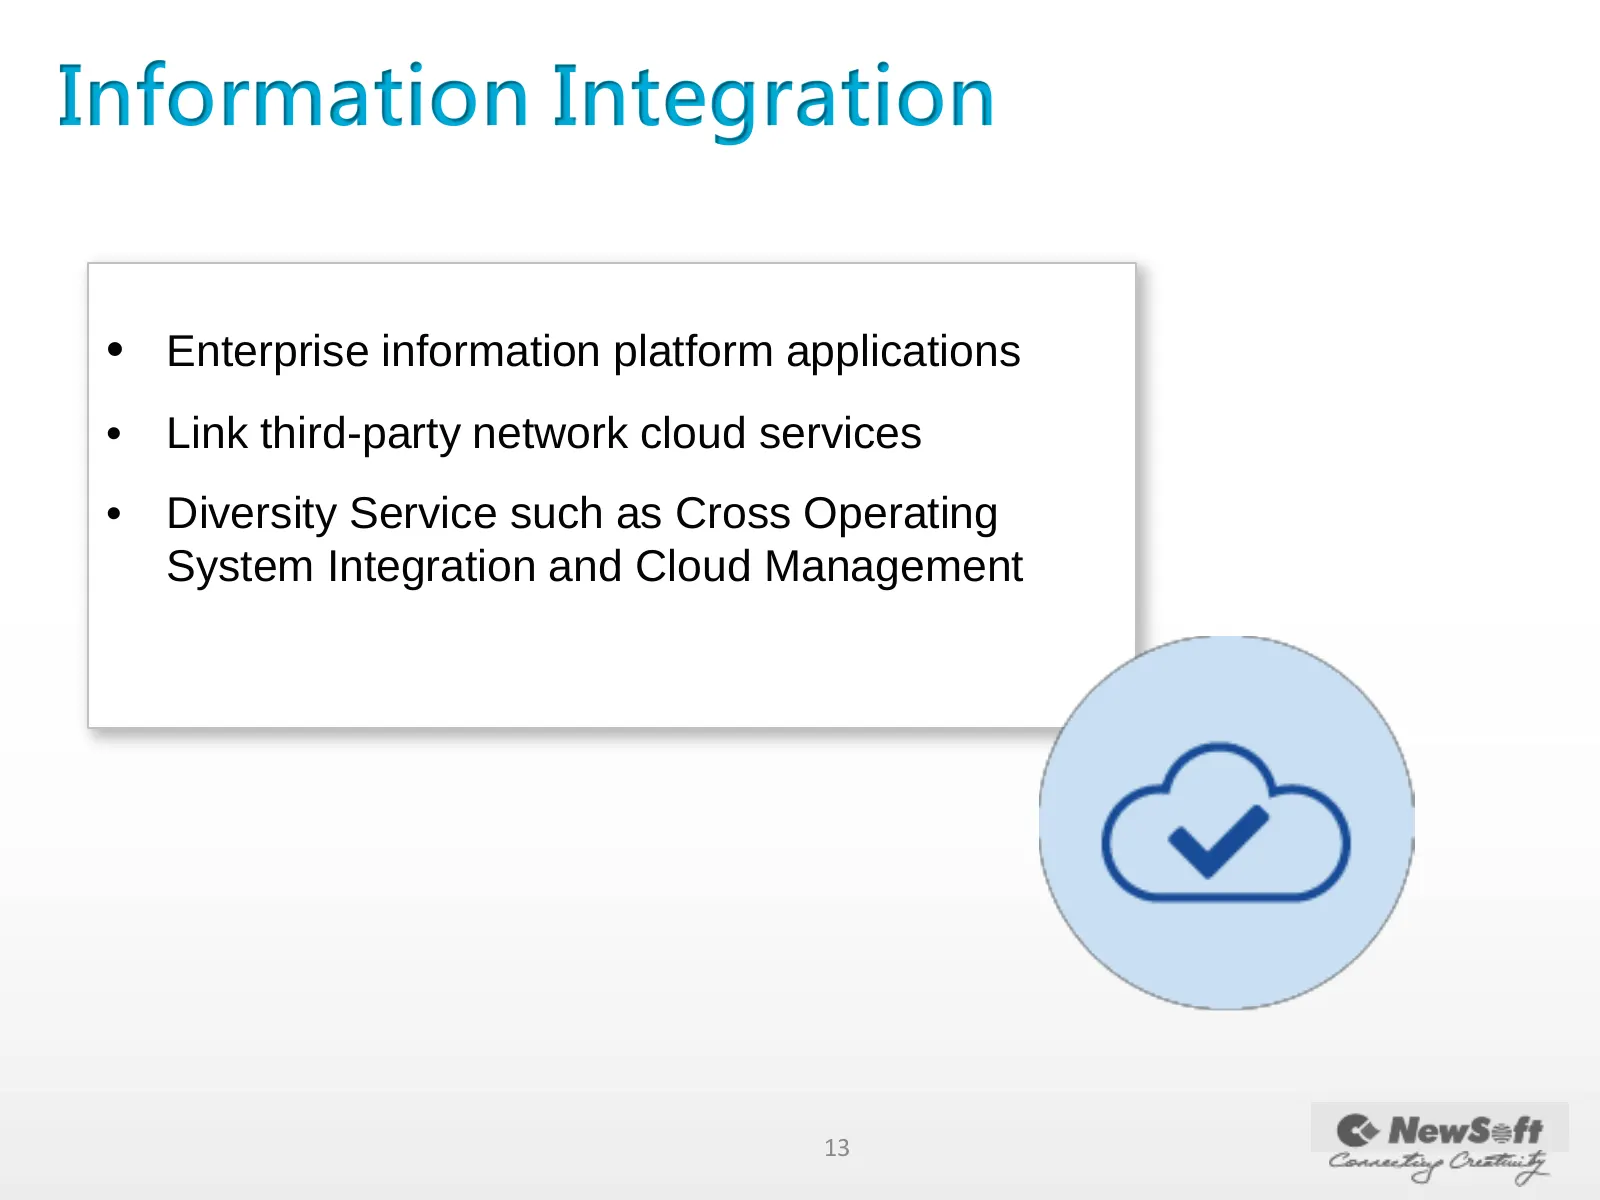
Information Integration • Enterprise information platform applications • Link third-party network cloud services • Diversity Service such as Cross Operating System Integration and Cloud Management 13
Slide 12: Main Markets
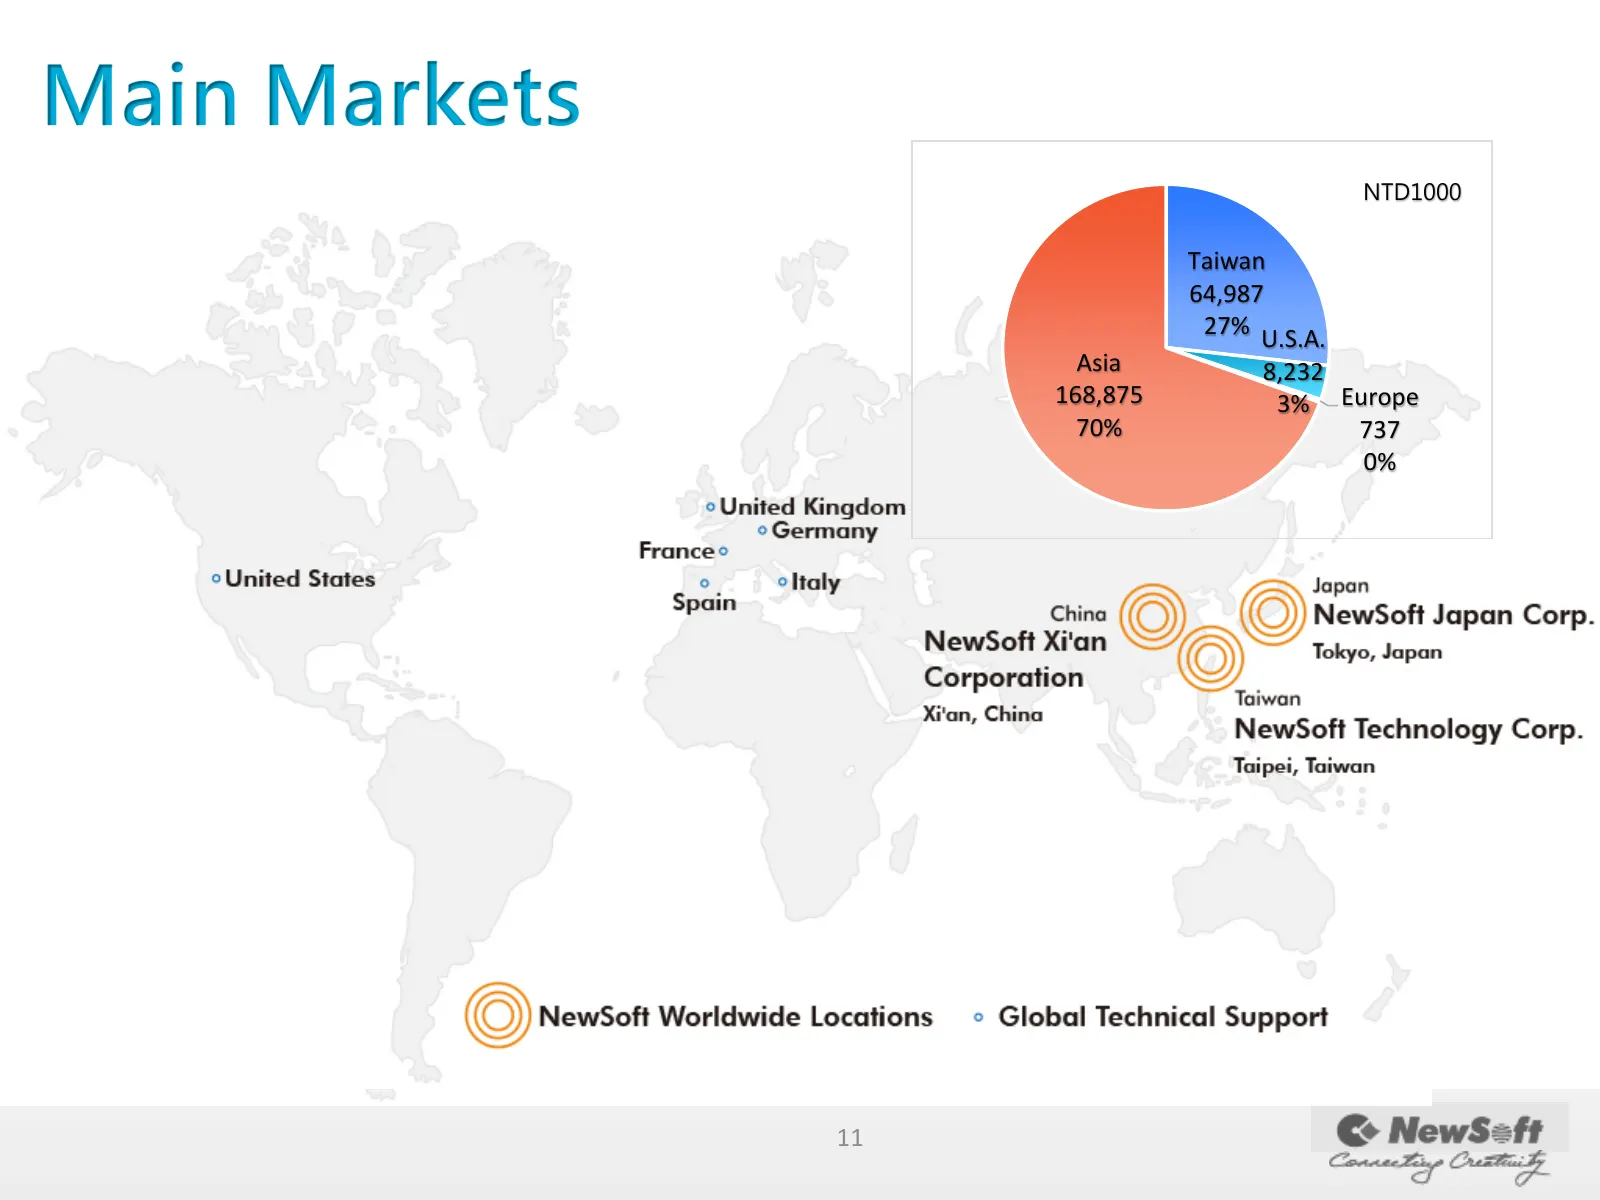
Main Markets NTD1000 Taiwan 64,987 27% U.S.A. Asia 8,232 168,875 3% Europe 70% 737 0% 11
Slide 13: Distribution Business
Distribution Business -China Oral Health Care Market -Yadran (Nannin) Oral Health Care Distribution -Dental Clinic Smart Service Platform 12
Slide 14: Yadran Bioscience and Technology Corp.
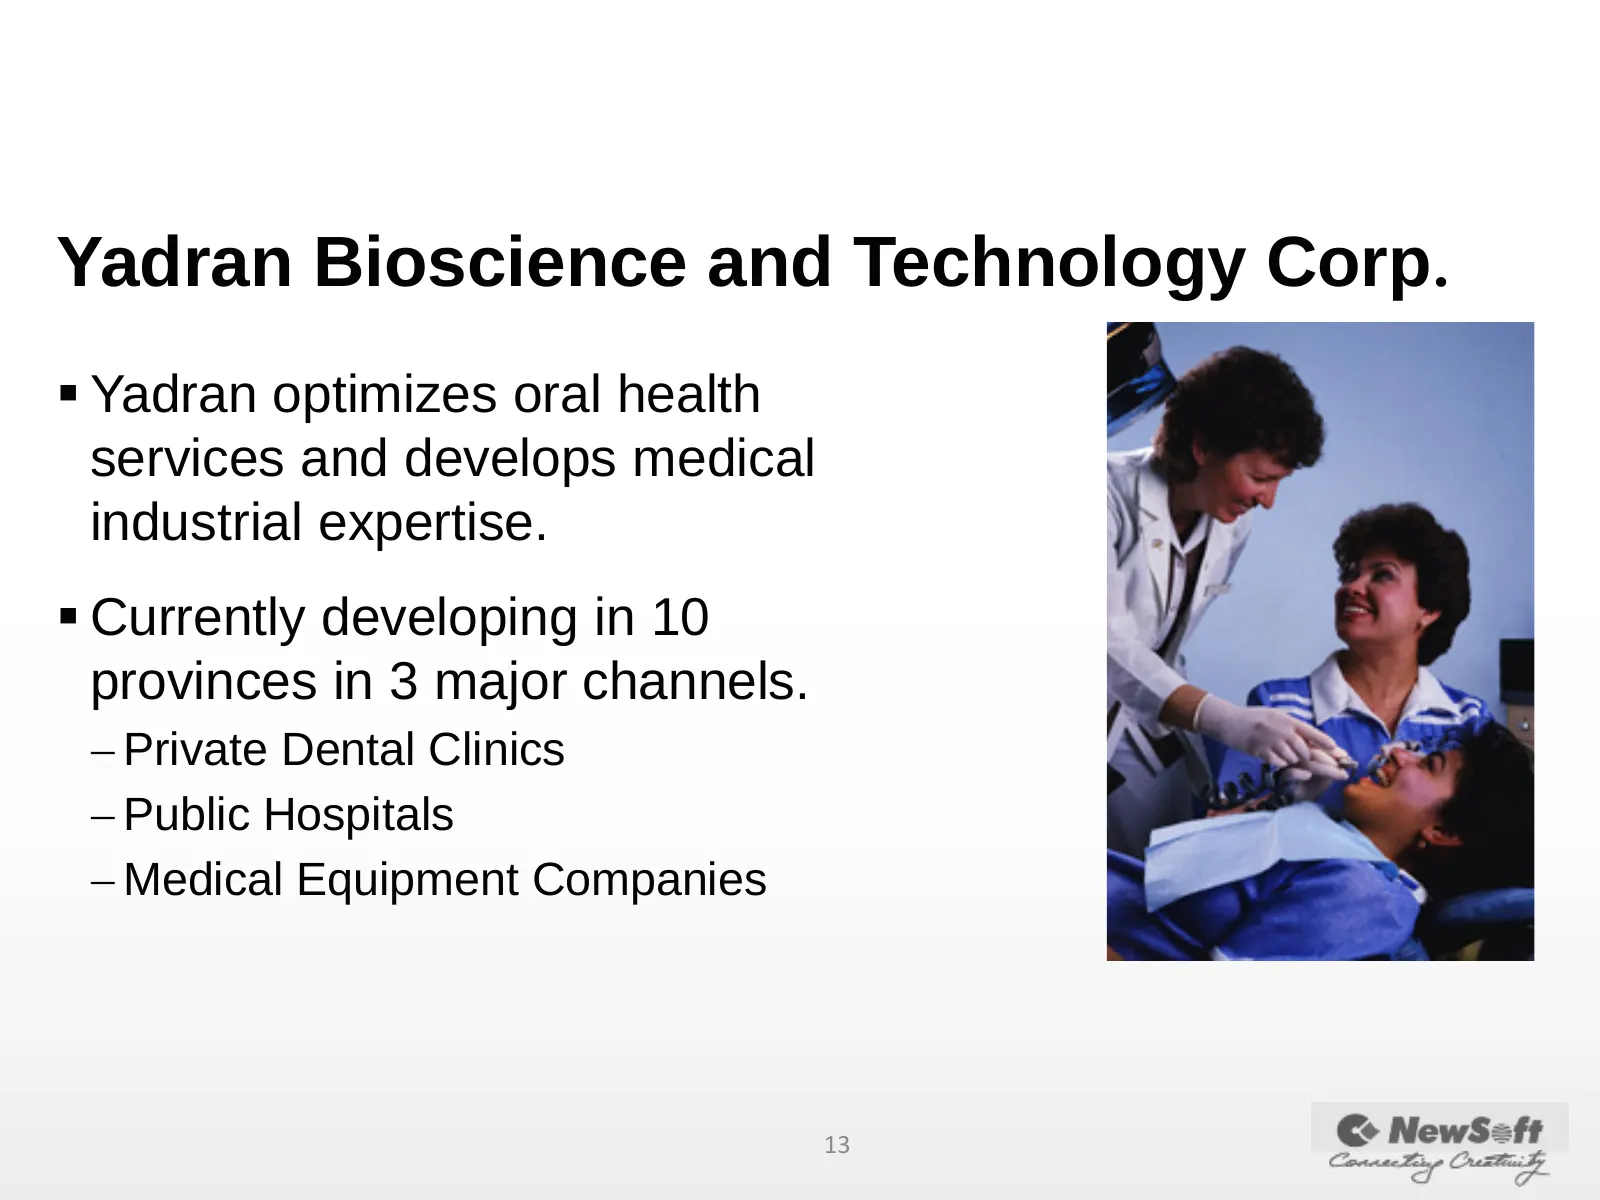
Yadran Bioscience and Technology Corp. Yadran optimizes oral health services and develops medical industrial expertise. Currently developing in 10 provinces in 3 major channels. − Private Dental Clinics − Public Hospitals − Medical Equipment Companies 13
Slide 15: 2017 Jan. to Sept. Consolidated Operating Revenue
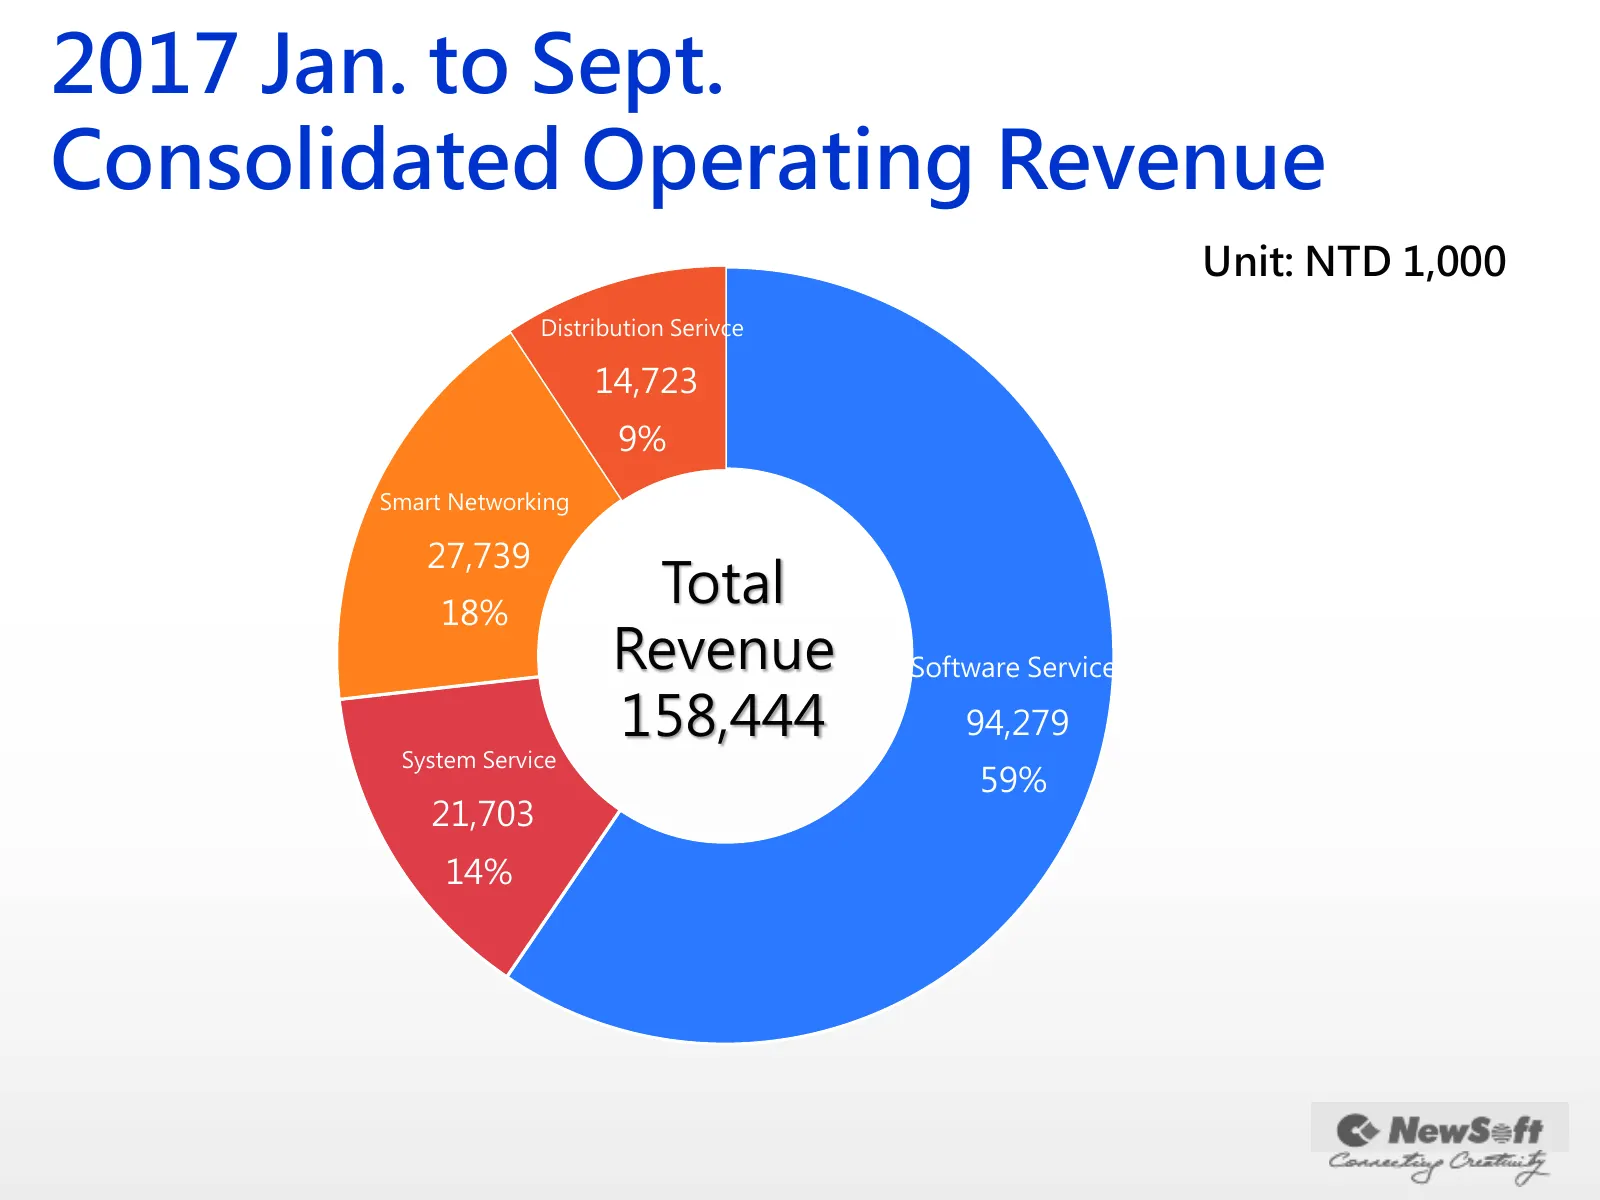
2017 Jan. to Sept. Consolidated Operating Revenue Unit: NTD 1,000 Distribution Serivce 14,723 9% Smart Networking 27,739 18% Total Revenue Software Service 158,444 94,279 System Service 59% 21,703 14%
Slide 16: 2017 Consolidated Operating Revenue
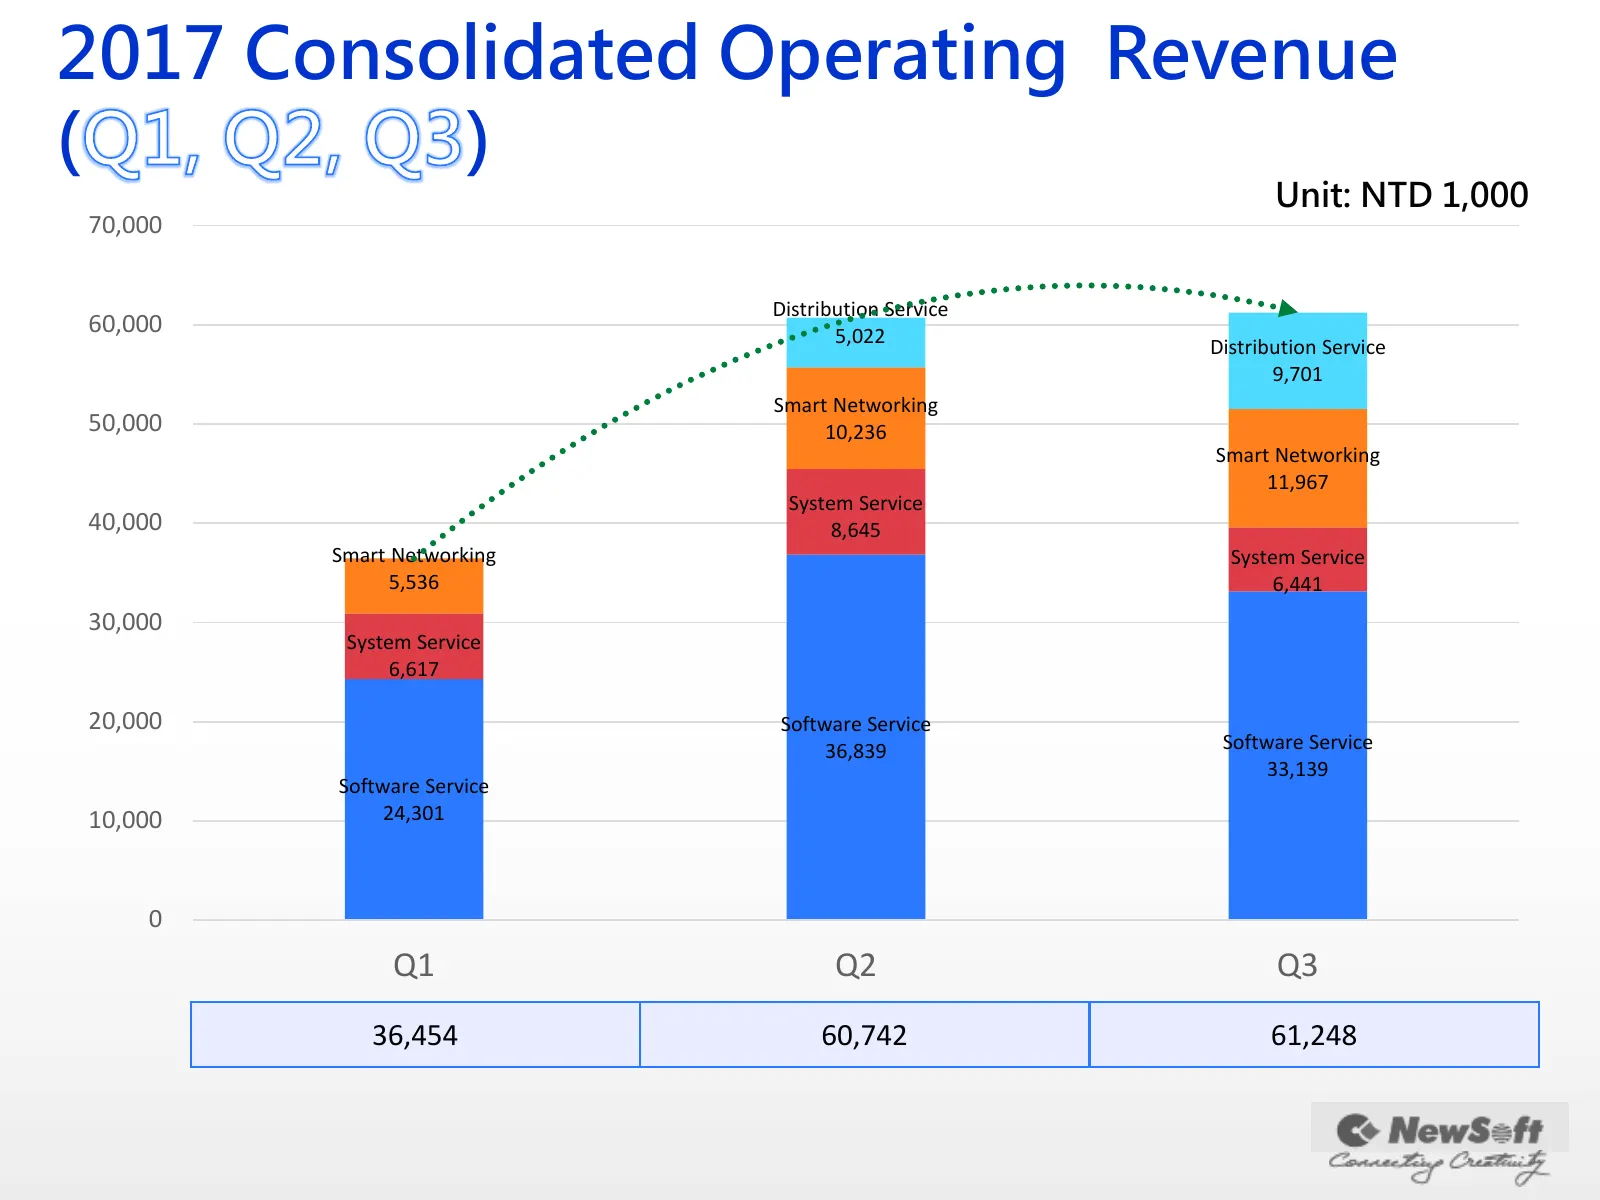
2017 Consolidated Operating Revenue ( ) Unit: NTD 1,000 70,000 Distribution Service 60,000 5,022 Distribution Service 9,701 Smart Networking 50,000 10,236 Smart Networking 11,967 System Service 40,000 8,645 Smart Networking System Service 5,536 6,441 30,000 System Service 6,617 20,000 Software Servi
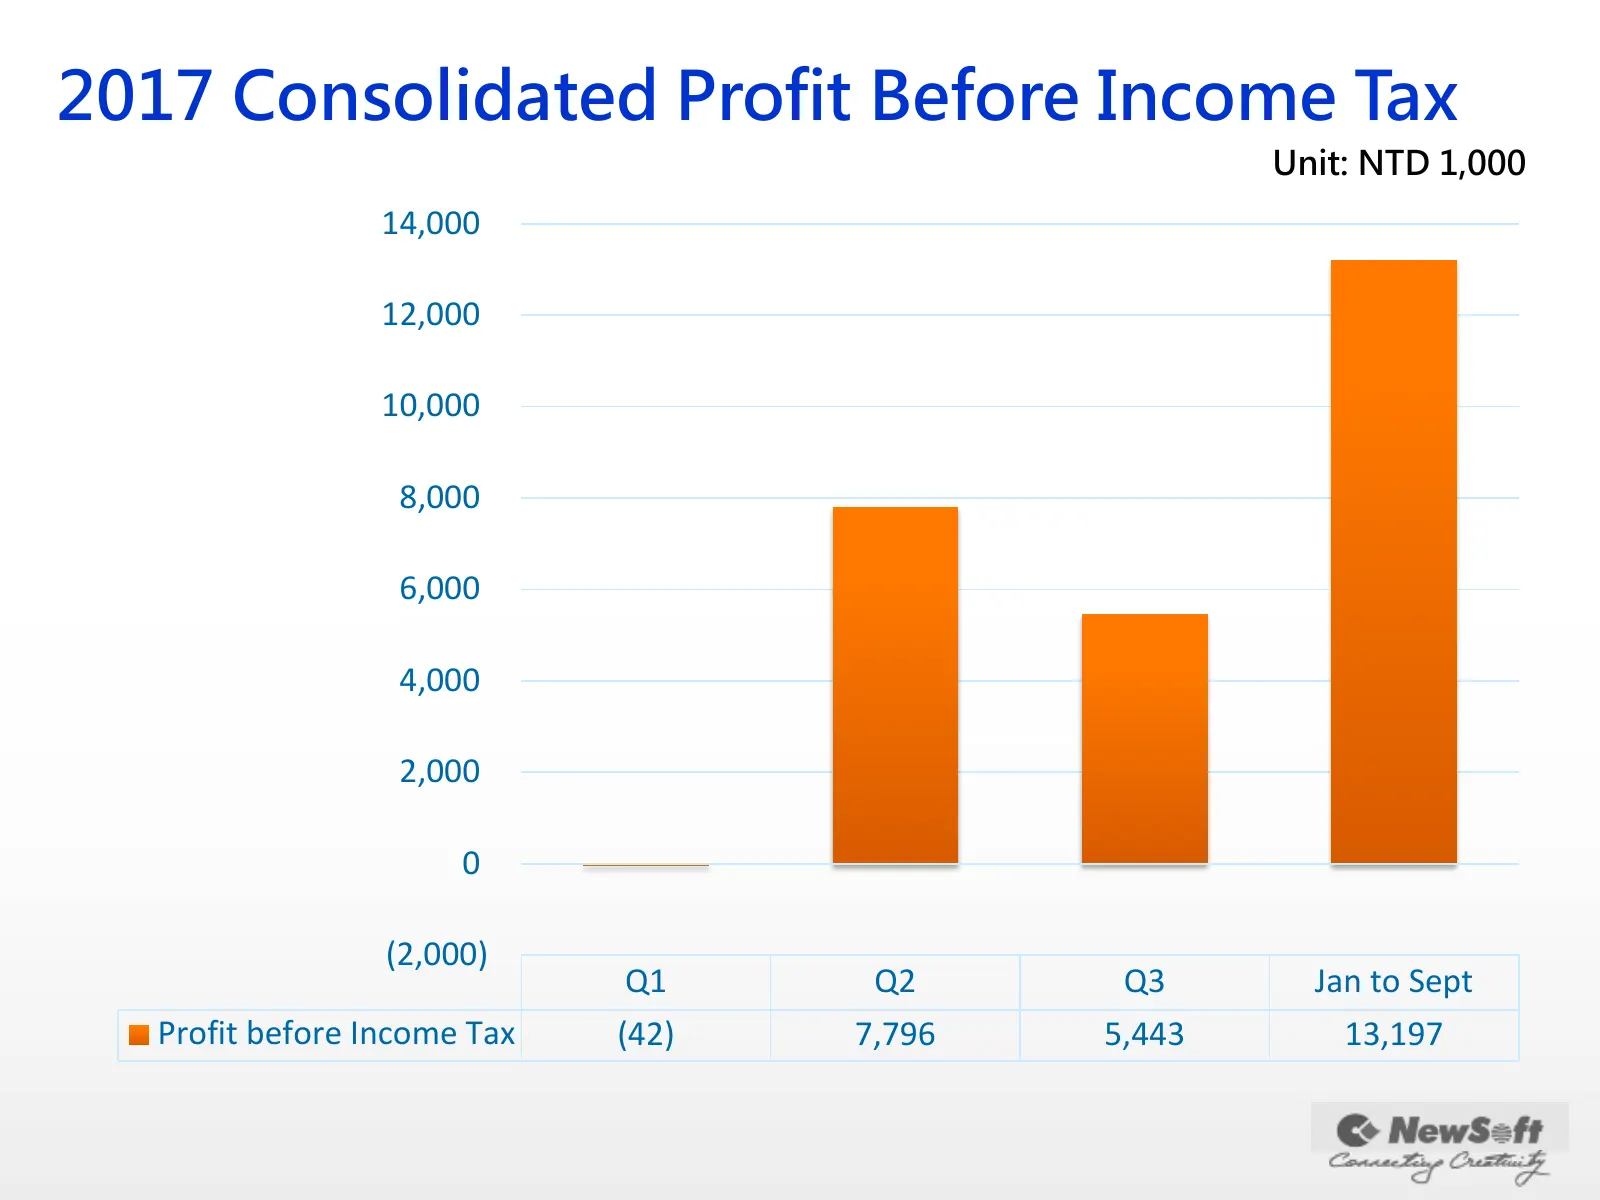
Slide 17: 2017 Consolidated Profit Before Income Tax
2017 Consolidated Profit Before Income Tax Unit: NTD 1,000 14,000 12,000 10,000 8,000 6,000 4,000 2,000 0 (2,000) Q1 Q2 Q3 Jan to Sept Profit before Income Tax (42) 7,796 5,443 13,197
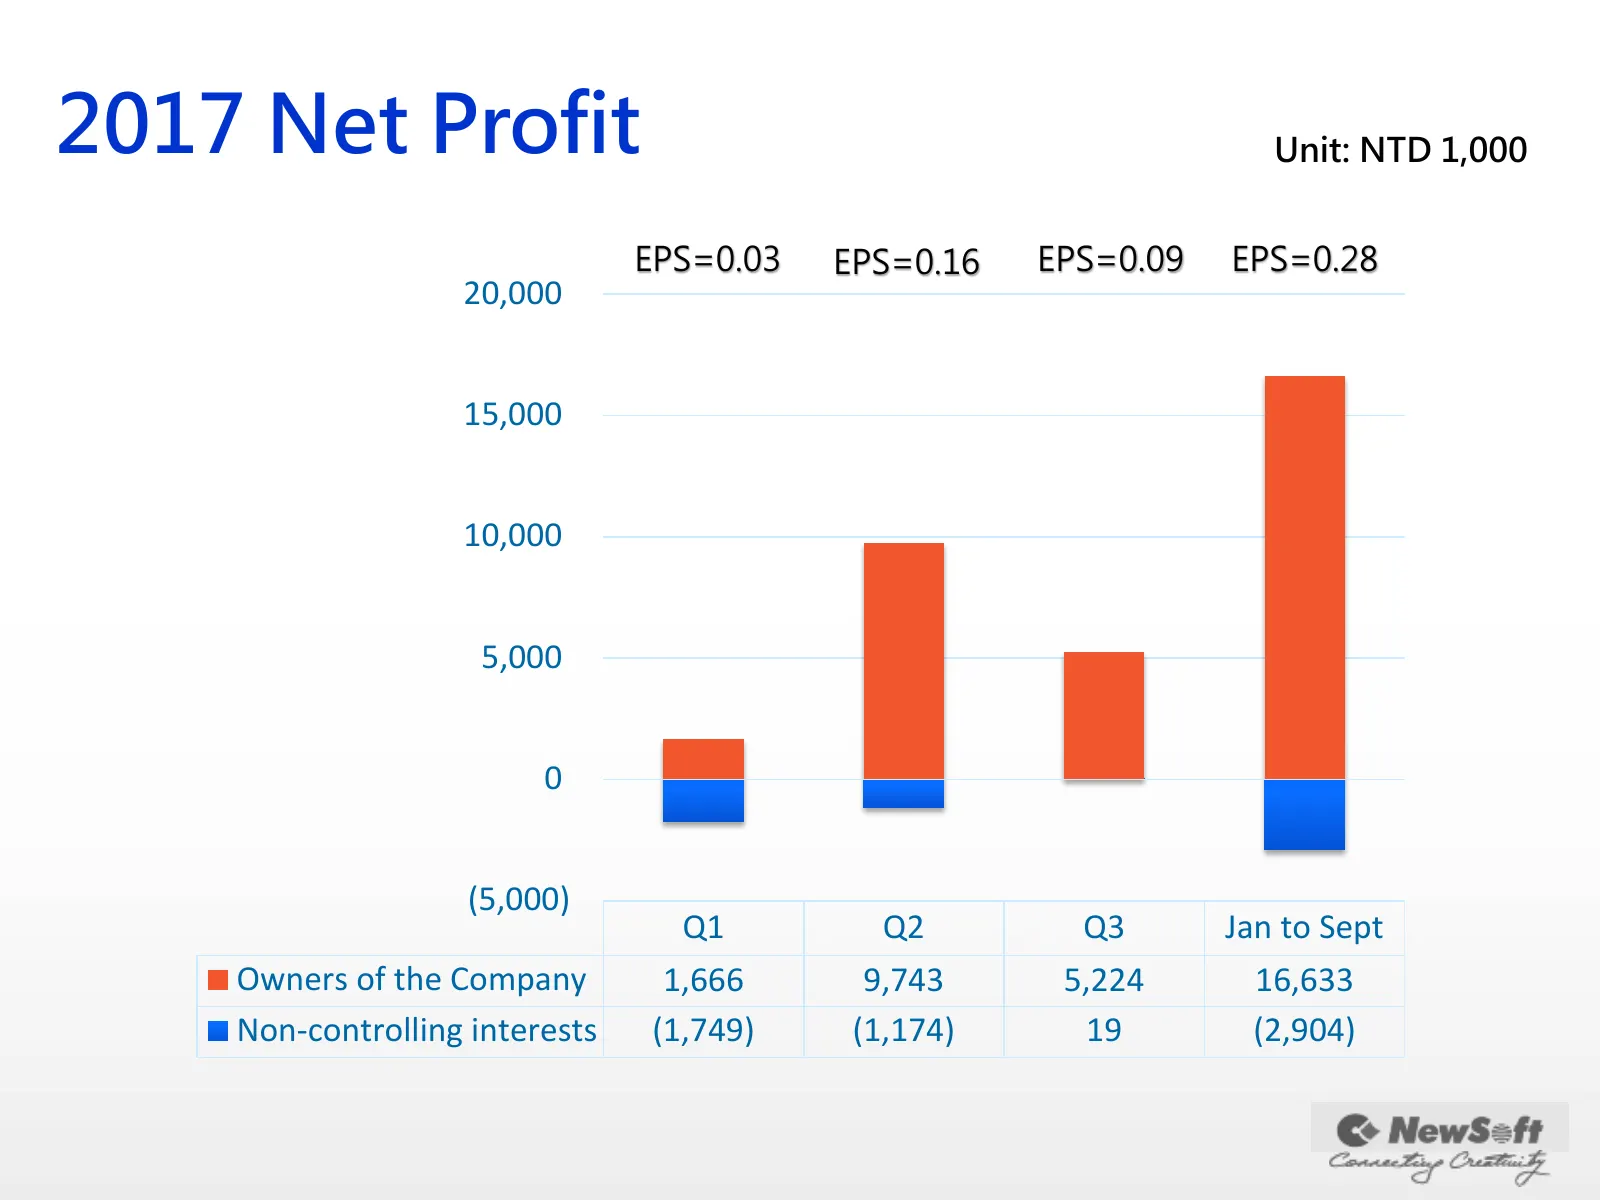
Slide 18: 2017 Net Profit
2017 Net Profit Unit: NTD 1,000 EPS=0.03 EPS=0.16 EPS=0.09 EPS=0.28 20,000 15,000 10,000 5,000 0 (5,000) Q1 Q2 Q3 Jan to Sept Owners of the Company 1,666 9,743 5,224 16,633 Non-controlling interests (1,749) (1,174) 19 (2,904)
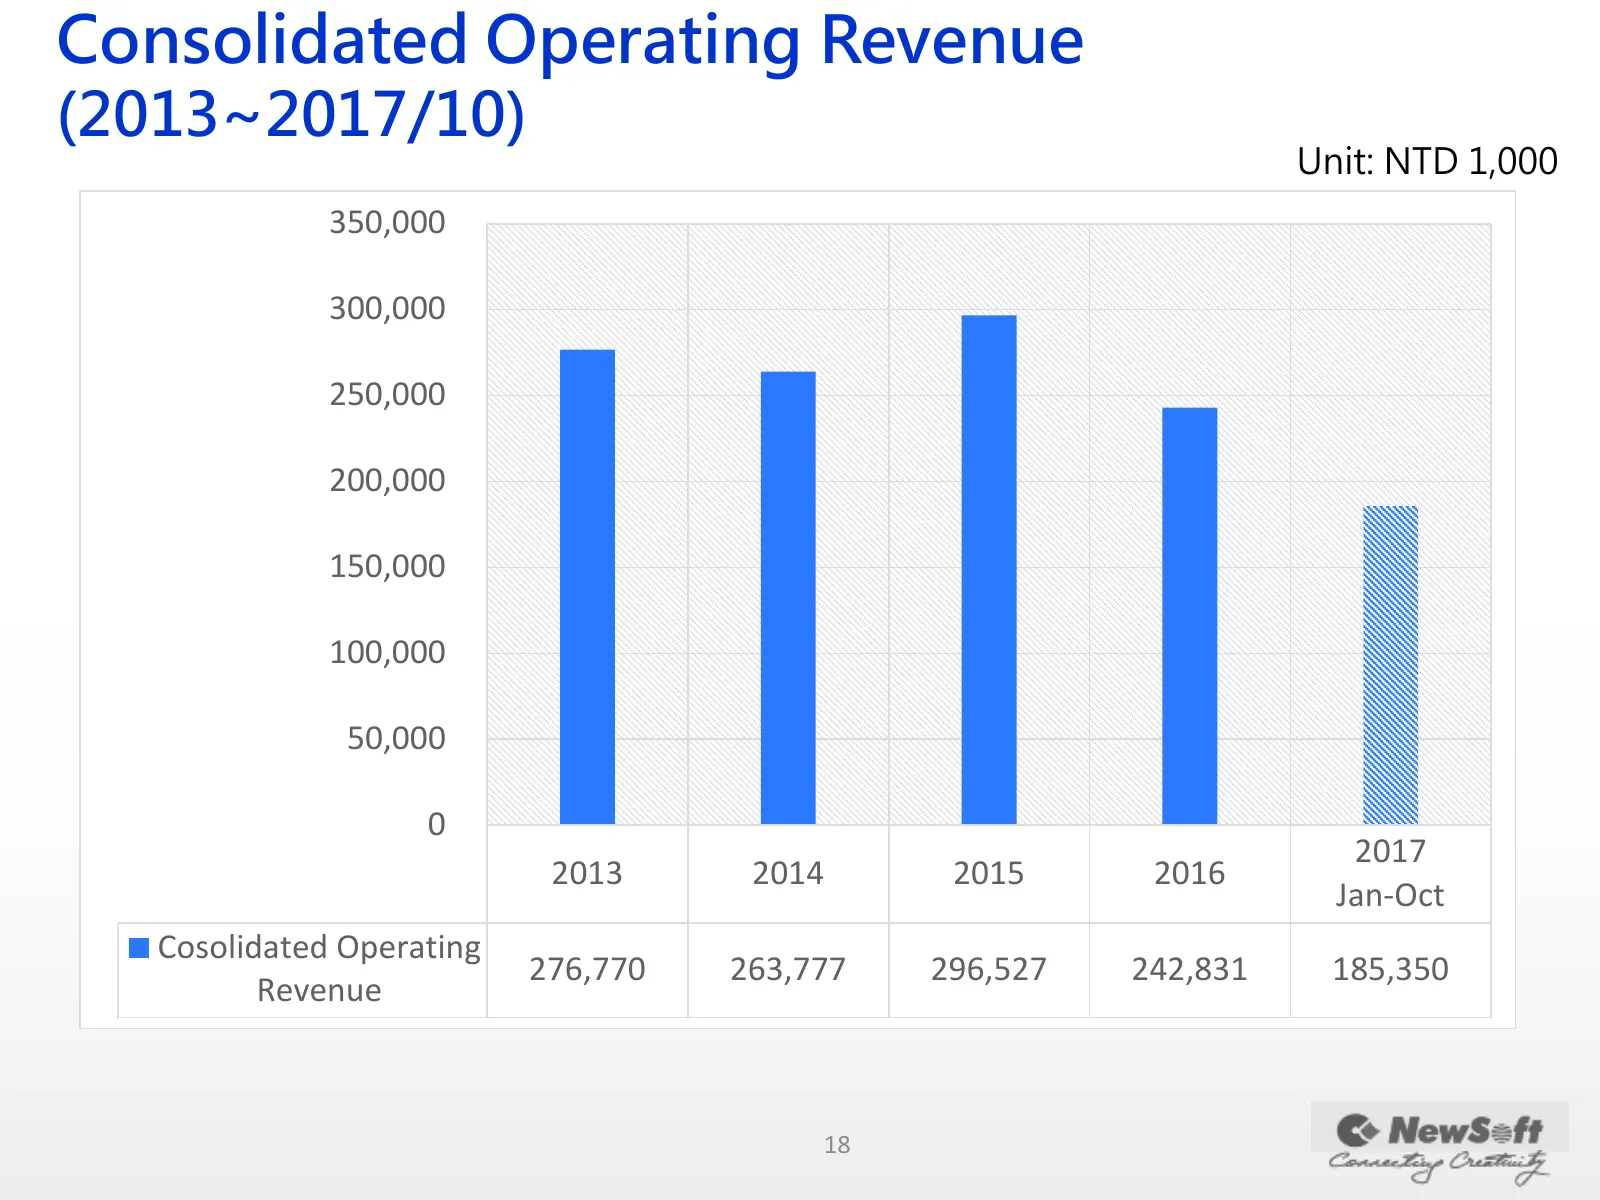
Slide 19: Consolidated Operating Revenue (2013~2017/10)
Consolidated Operating Revenue (2013~2017/10) Unit: NTD 1,000 350,000 300,000 250,000 200,000 150,000 100,000 50,000 0 2017 2013 2014 2015 2016 Jan-Oct Cosolidated Operating 276,770 263,777 296,527 242,831 185,350 Revenue 18
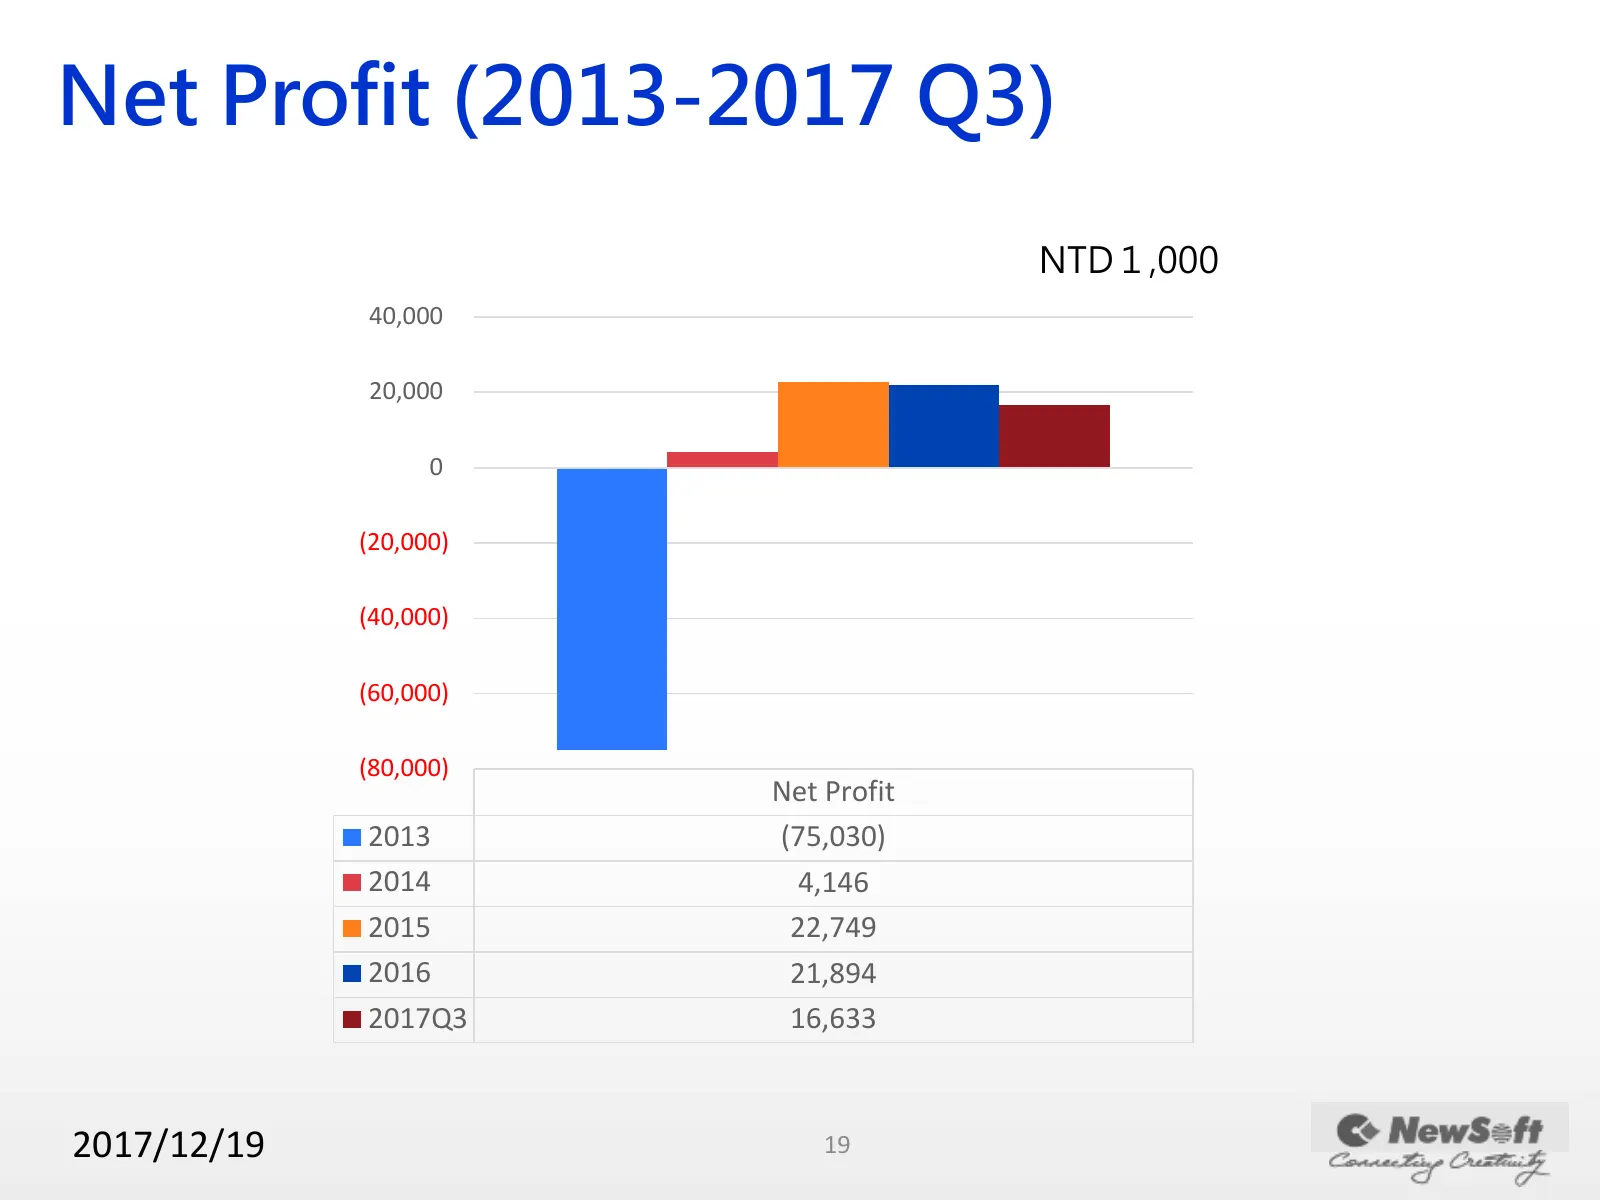
Slide 20: Net Profit (2013-2017 Q3)
Net Profit (2013-2017 Q3) NTD1,000 40,000 20,000 0 (20,000) (40,000) (60,000) (80,000) Net Profit 2013 (75,030) 2014 4,146 2015 22,749 2016 21,894 2017Q3 16,633 2017/12/19 19
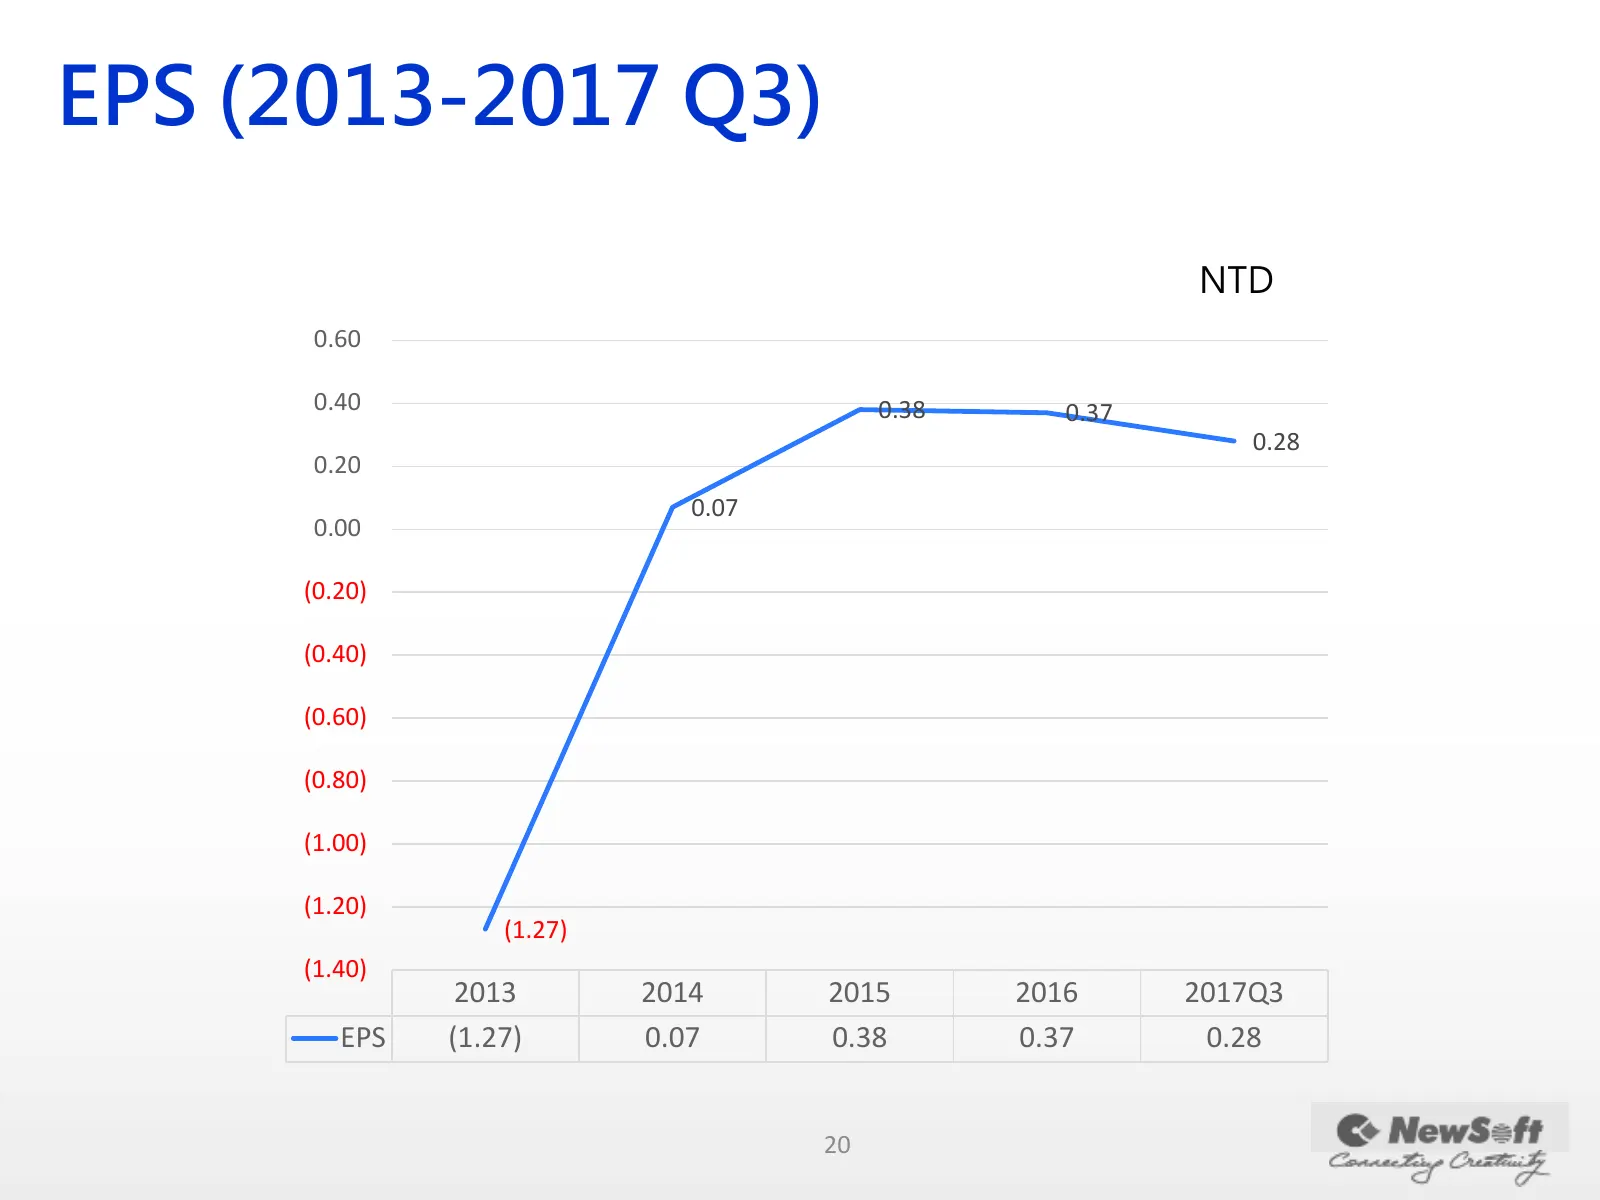
Slide 21: EPS (2013-2017 Q3)
EPS (2013-2017 Q3) NTD 0.60 0.40 0.38 0.37 0.28 0.20 0.07 0.00 (0.20) (0.40) (0.60) (0.80) (1.00) (1.20) (1.27) (1.40) 2013 2014 2015 2016 2017Q3 EPS (1.27) 0.07 0.38 0.37 0.28 20

Slide 22: Co NewSzft < |
Co NewSzft < | YW - call
Source: company website
More decks from NewSoft Technology Corporation
 Q2 2026 Earnings Presentation27 slides · Aug 24, 2026
 Investors Conference 202526 slides · Dec 15, 2025
 Q2 2025 Earnings Presentation24 slides · Aug 25, 2025
 Investor Presentation (May 2024)18 slides · May 2024
 Investor Conference (December 2022)17 slides · Dec 27, 2022
 Investor Presentation (December 2019)16 slides · Dec 24, 2019