Washington Banking — D.A. Davidson Financial Services Conference 2011
22 slides from Washington Banking's conference presentation, May 11, 2011
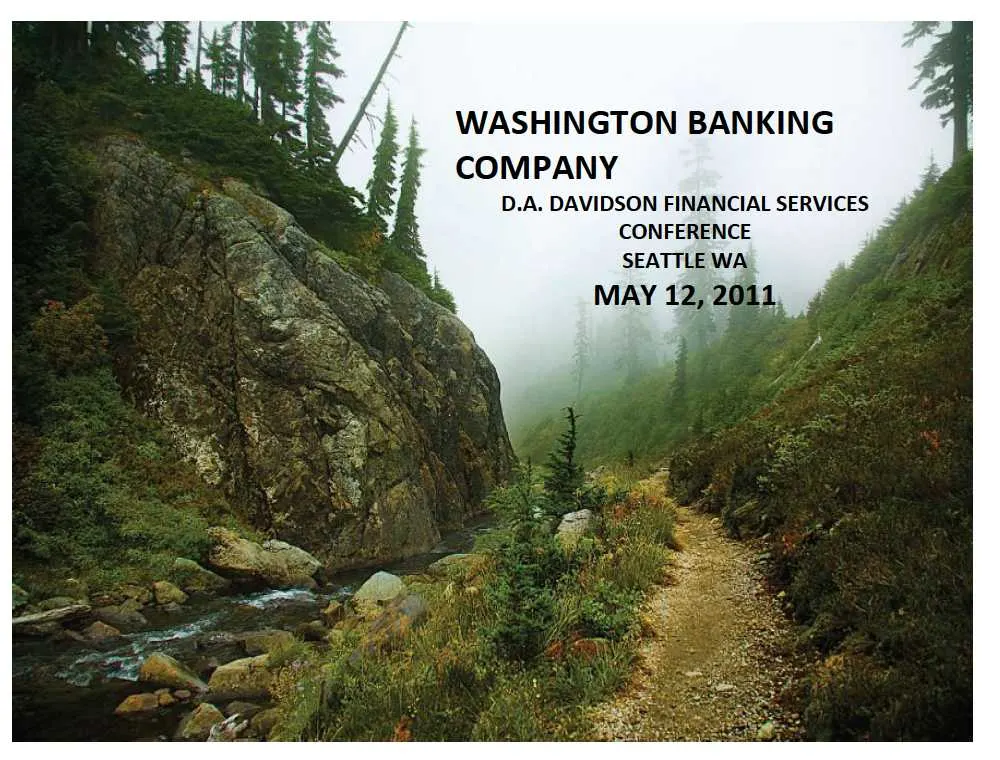
Slide 1: Washington Banking Company – D.A. Davidson Financial Services Conference
WASHINGTON BANKING COMPANY D.A. DAVIDSON FINANCIAL SERVICES CONFERENCE SEATTLE WA MAY 12, 2041
Slide 2: Safe Harbor Statement
® Safe Harbor Statement This communication may contain forward-looking statements that are subject to risks and uncertainties. These forward-looking statements describe management's expectations regarding future events and developments such as the transition of City Bank and North County Bank operat
Slide 3: Washington Banking Company Profile
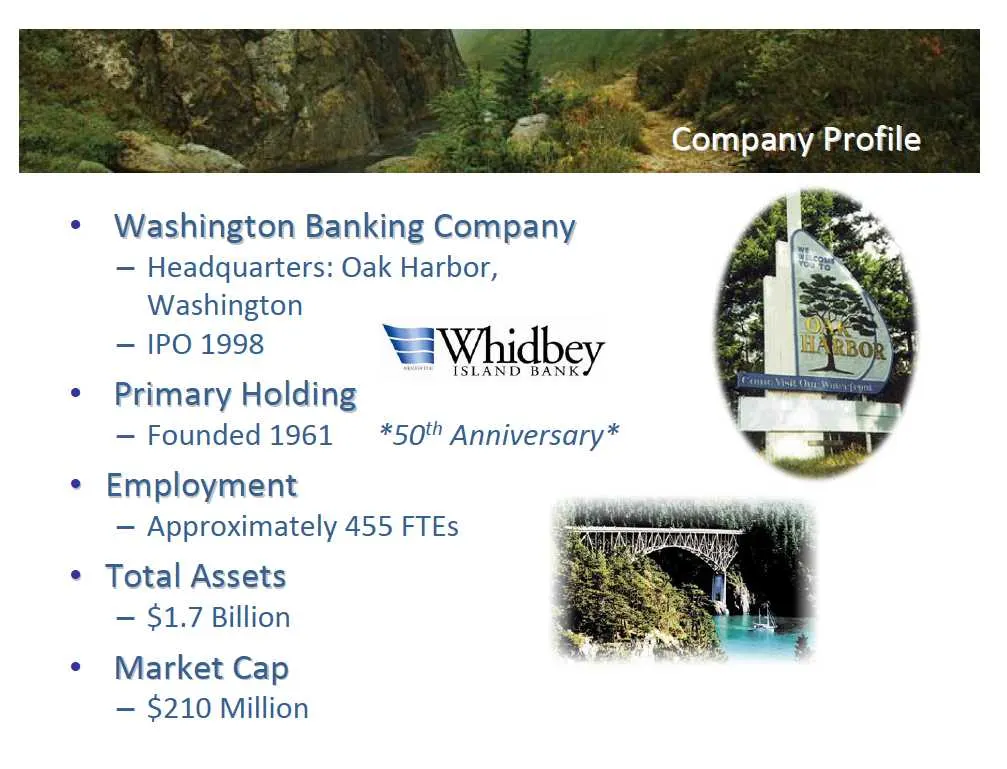
e e e Washington Banking Company — Headquarters: Oak Harbor, Washington -ipo1998 = Whidbey . ; ISLAND BANK Primary Holding — Founded 1961 *50" Anniversary* Employment — Approximately 455 FTEs Total Assets — $1.7 Billion Market Cap — §210 Million Company Profile
Slide 4: Footprint
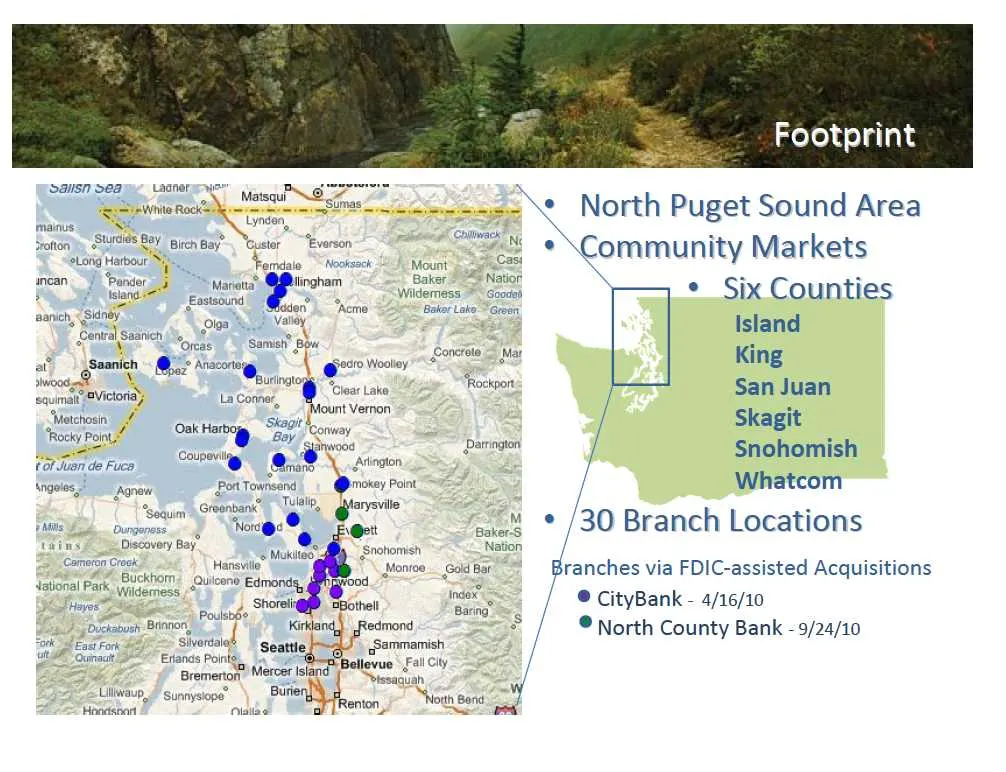
Footprint Sasn Sea = ‘Simas. Matsqu SO" sens a Reeth Puget Sound Area manus: iP I ‘Sturdiés Bay > % rs aR SEE NG Sopony, SMBH 88Y ren Bay, Youster ‘Everson : ommunity Markets “oor, ke Biv Baker J Naor . . sean sd Mana Z ede ae rte, = Ae * Six Counties a) ete 2 - Jaden ‘Acme Bakar Lake Green peo é —
Slide 5: 2010 Highlights
2010 Highlights FDIC-Assisted Acquisition of CityBank, April 2010 FDIC-Assisted Acquisition of North County Bank, Sept 2010 Relocated Mount Vernon branch from in-store to stand-alone Added Commercial Lending Teams Increased cash dividend to shareholders Listed in SNLs Top 100 Best-Performing Communi
Slide 6: Acquisitions: CityBank
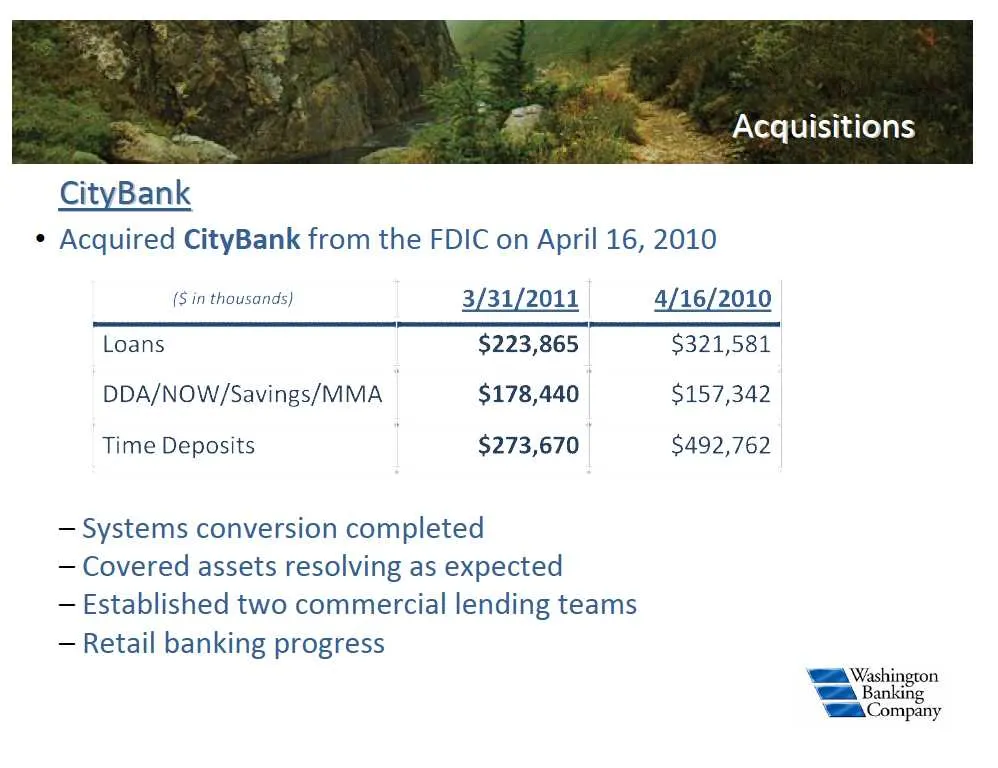
Acquisitions CityBank * Acquired CityBank from the FDIC on April 16, 2010 ($ in thousands) 3/31/2011 4/16/2010 oars ”~*~CS~S~S~*~S~«S BBO S832 DDA/NOW/Savings/MMA $178,440 $157,342 Time Deposits $273,670 $492,762 — Systems conversion completed — Covered assets resolving as expected — Established two
Slide 7: Acquisitions: North County Bank
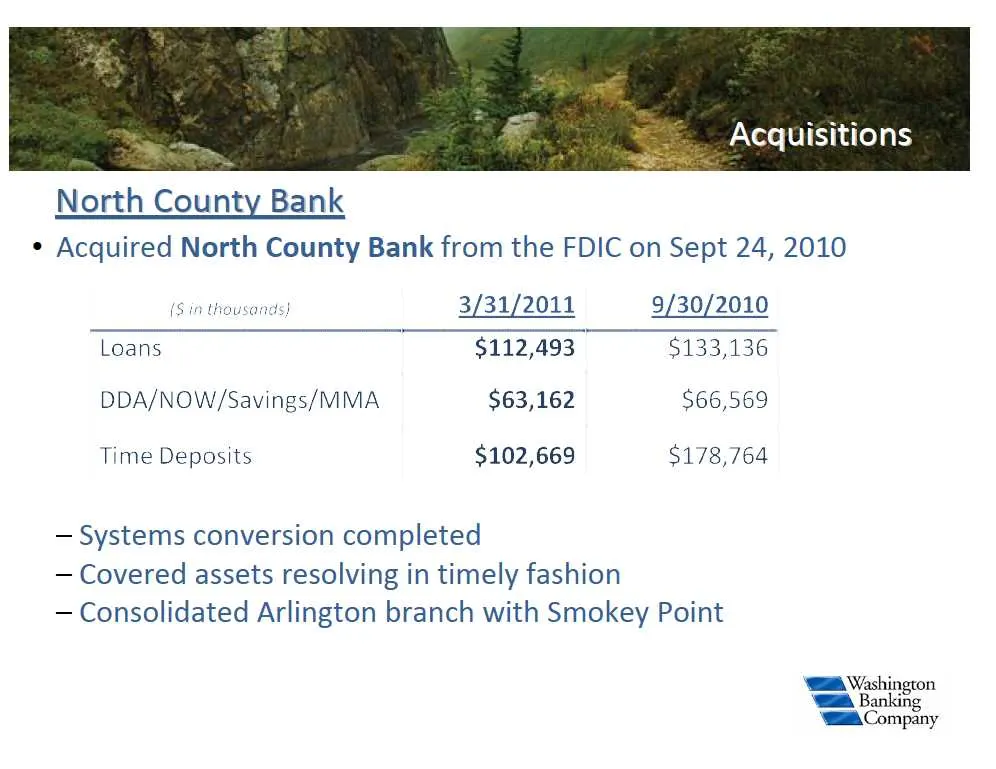
Acquisitions North County Bank ¢ Acquired North County Bank from the FDIC on Sept 24, 2010 (Sinu 3/31/2011 9/30/2010 Loans $112,493 $133,136 DDA/NOW/Savings/MMA $63,162 $66,569 Time Deposits $102,669 $178,764 — Systems conversion completed — Covered assets resolving in timely fashion — Consolidated
Slide 8: Financial Highlights
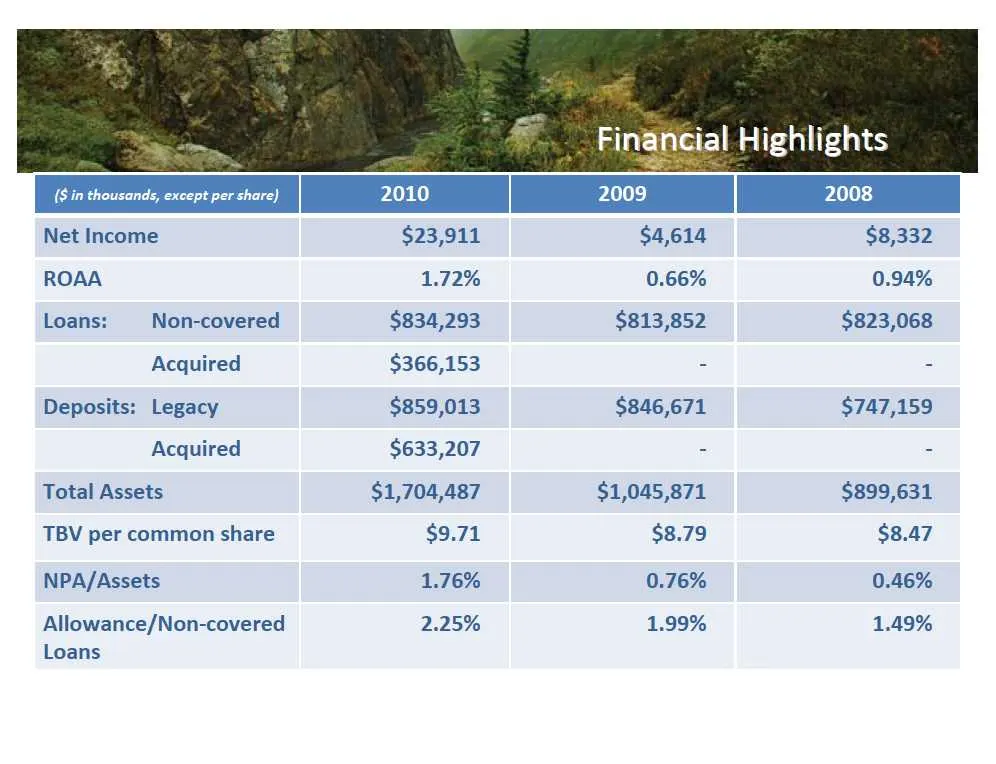
Finaneial Highlights Net Income $23,911 $4,614 $8,332 ROAA 1.72% 0.66% 0.94% Loans: Non-covered $834,293 $813,852 $823,068 Acquired $366,153 - - Deposits: Legacy $859,013 $846,671 $747,159 Acquired $633,207 - - Total Assets $1,704,487 $1,045,871 $899,631 TBV per common share $9.71 $8.79 $8.47 NPA/As
Slide 9: Portfolio Diversity
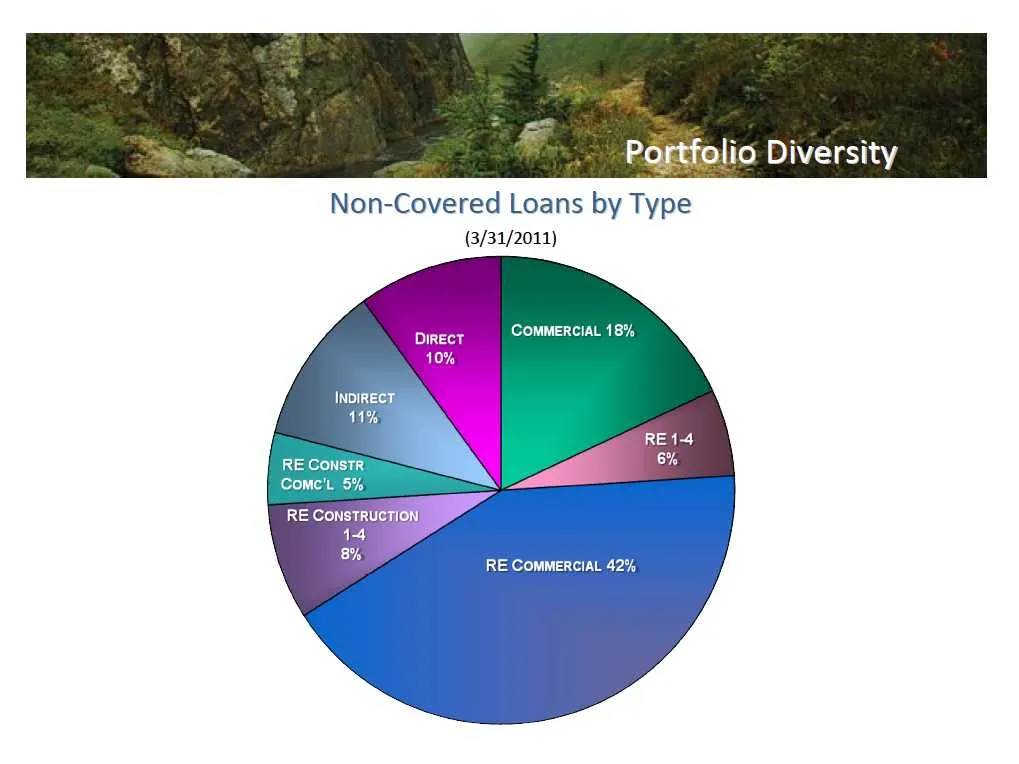
Portfolio Diversity Non-Covered Loans by Type (3/31/2011) COMMERCIAL 18%
Slide 10: Deposit Mix
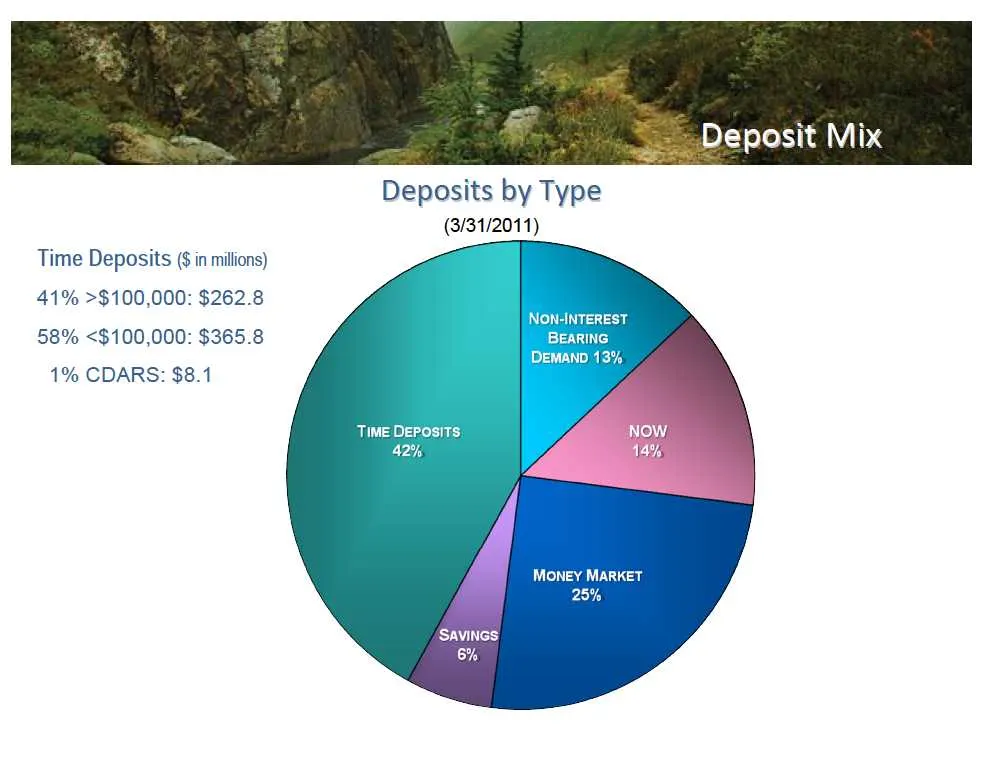
Deposit Mix Deposits by Type (3/31/2011) Time Deposits (§ in millions) 41% >$100,000: $262.8 58% <$100,000: $365.8 1% CDARS: $8.1
Slide 11: NIM Stability
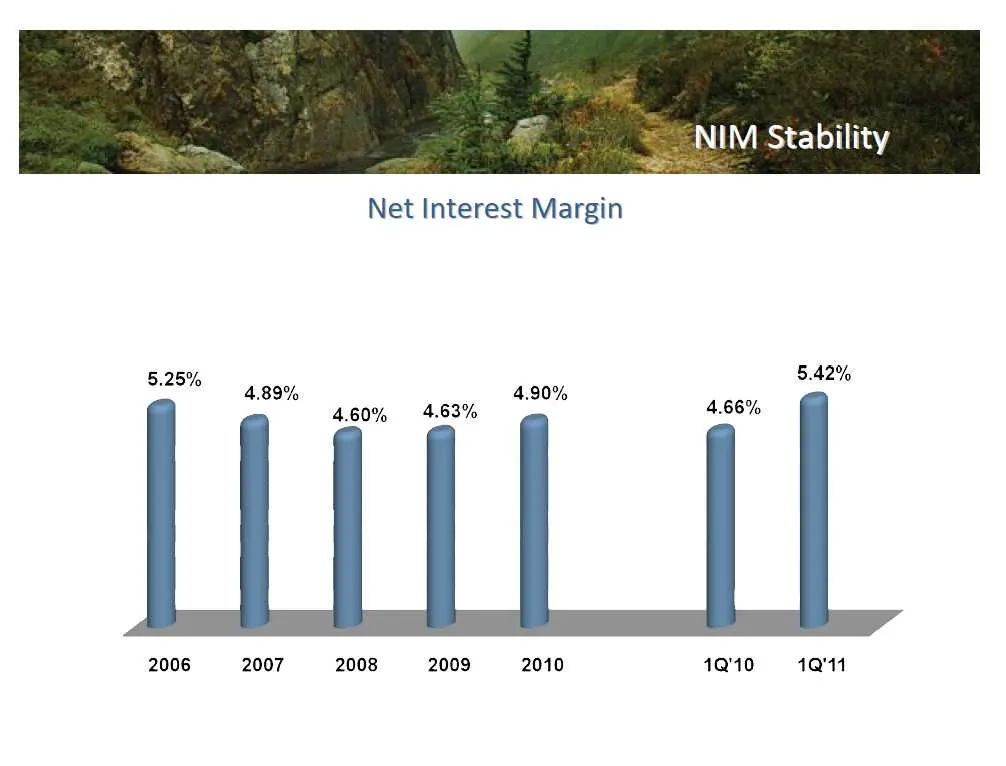
NIM Stability Net Interest Margin 5.25% 5.42% 4.89% 4.90% 4.60% 4.63% 2006 2007 2008 2009 2010 1Q'10 1Q'11
Slide 12: Cost-Management
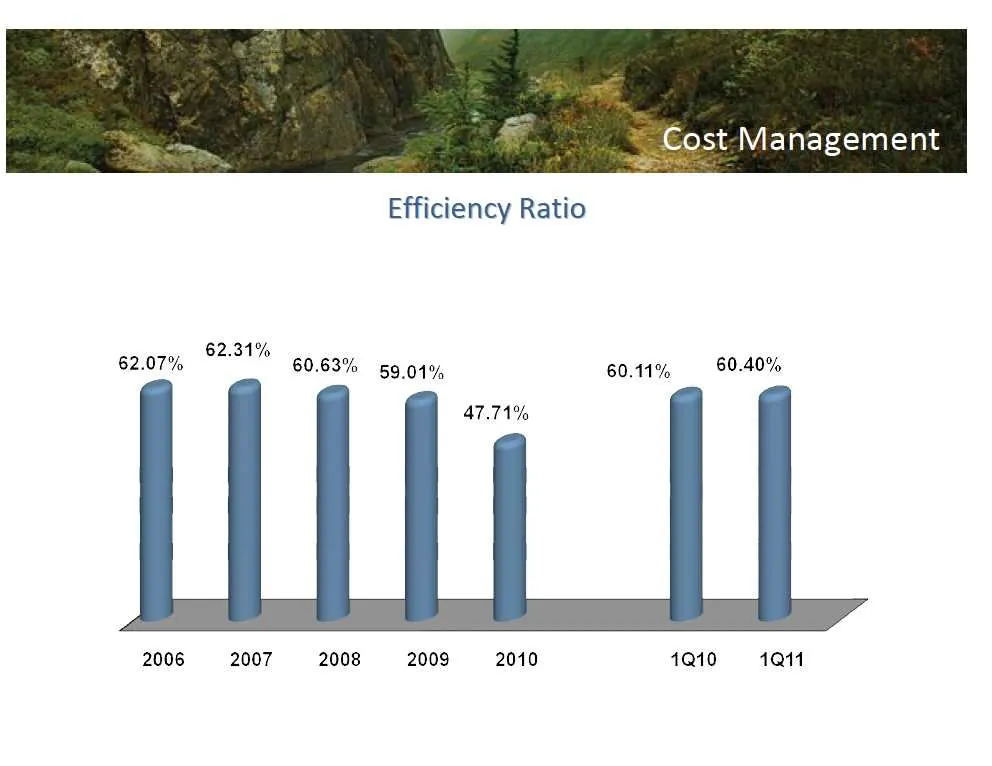
Cost-Management Efficiency Ratio 62.31% 62.07% 60.63% 59.01% 60.11% 0.40% 47.71% 2006 2007 2008 2009 2010 1Q10 1Q11
Slide 13: Credit Quality
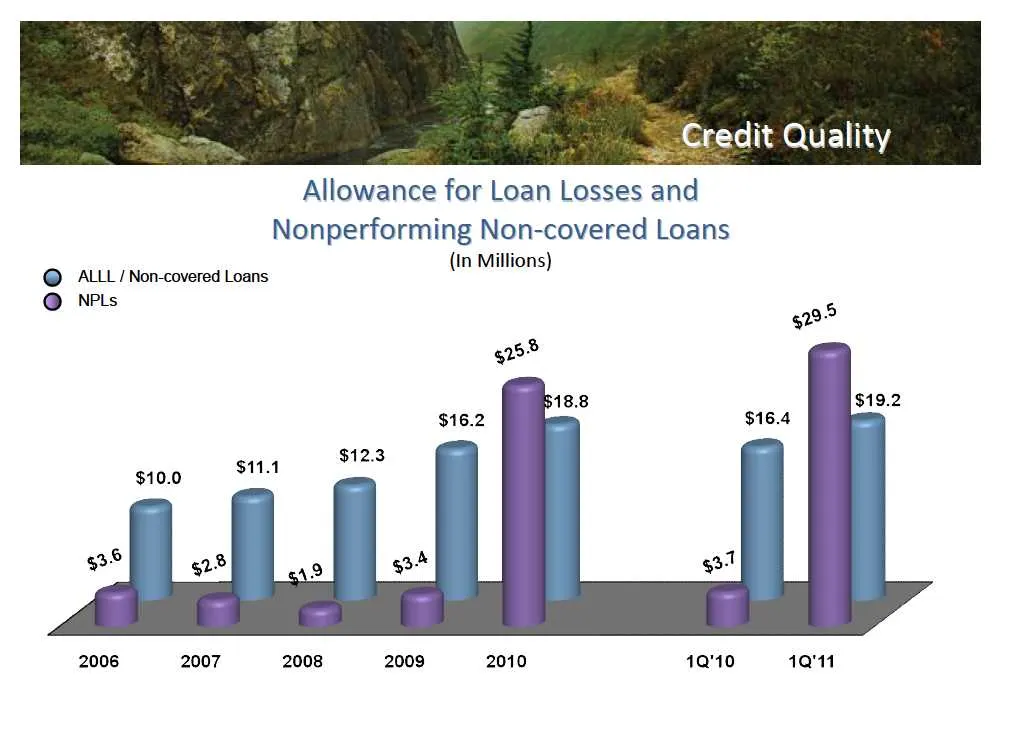
Credit Quality Allowance for Loan Losses and Nonperforming Non-covered Loans (In Millions) @ ALLL! Non-covered Loans NPL: @ NPs 98 grt 2006 2007 2008 2009 2010 1Q'10 10°11
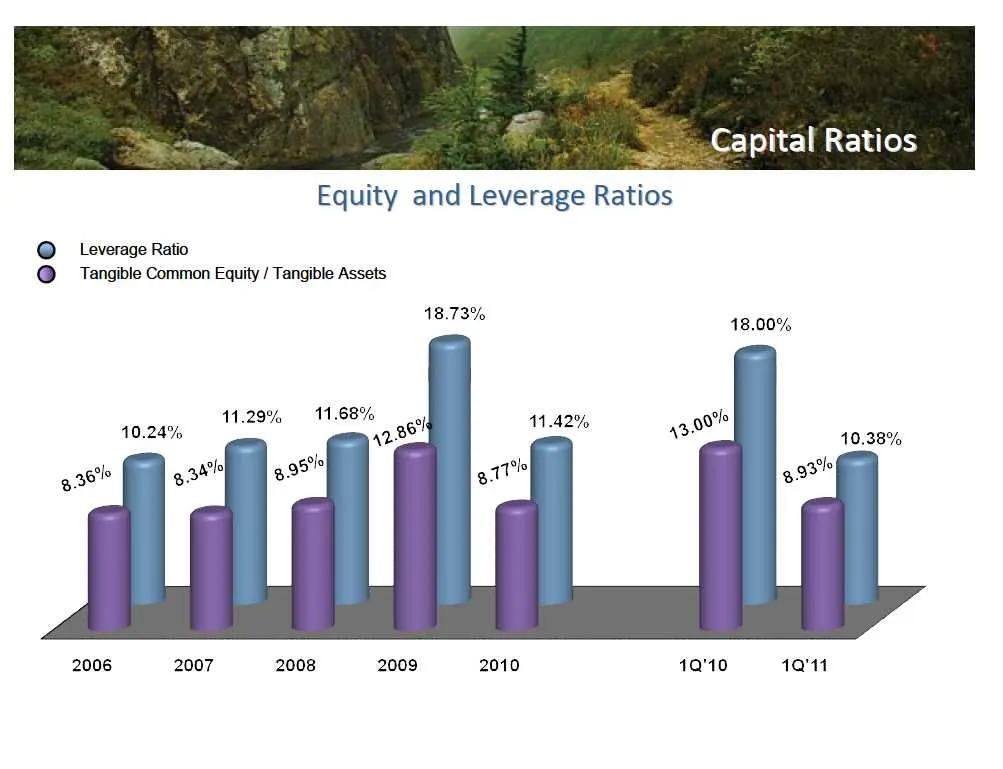
Slide 14: Capital Ratios
Capital Ratios Equity and Leverage Ratios @ Leverage Ratio @ Tangible Common Equity / Tangible Assets 18.73% 18.00% 11.68% 11.29% 2006 2007 2008 2009 2010 1Q110 10°11
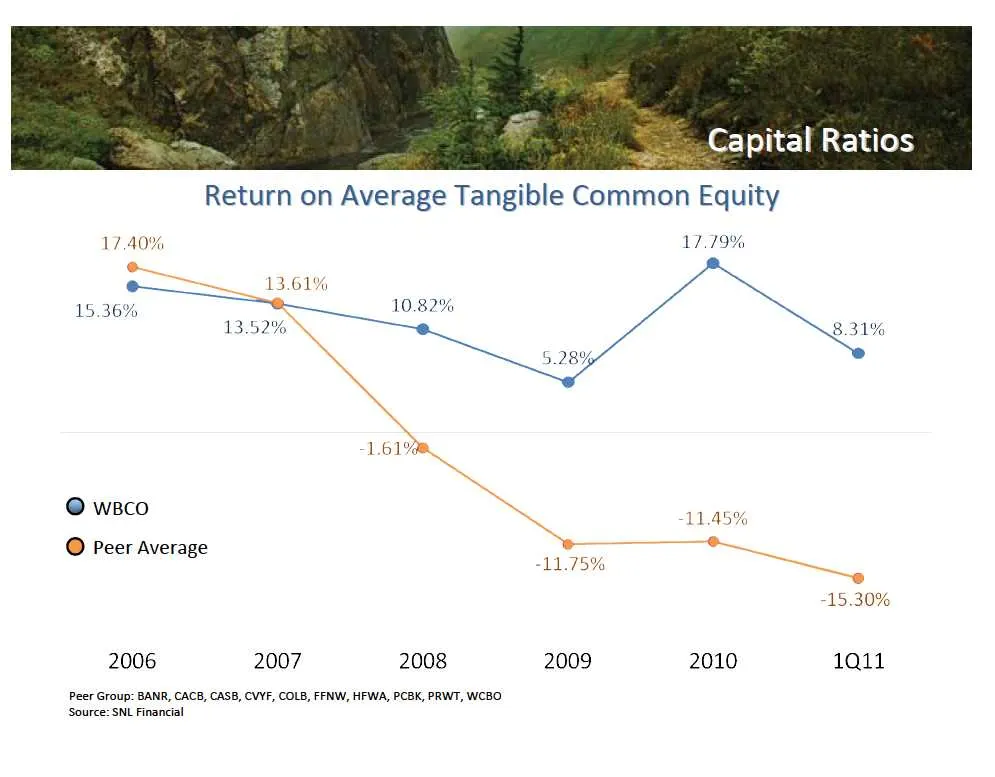
Slide 15: Return on Average Tangible Common Equity
Capital Ratios Return on Average Tangible Common Equity 17.40% 17.79% 15.36% ~ 10.82% 13.52% \ ane 1.61% @ waco © Peer Average en -15.30% 2006 2007 2008 2009 2010 1Q11 Peer Group: BANR, CACB, CASB, CVF, COLB, FFNW, HFWA, PCBK, PRWT, WCBO Source: SNL Financial
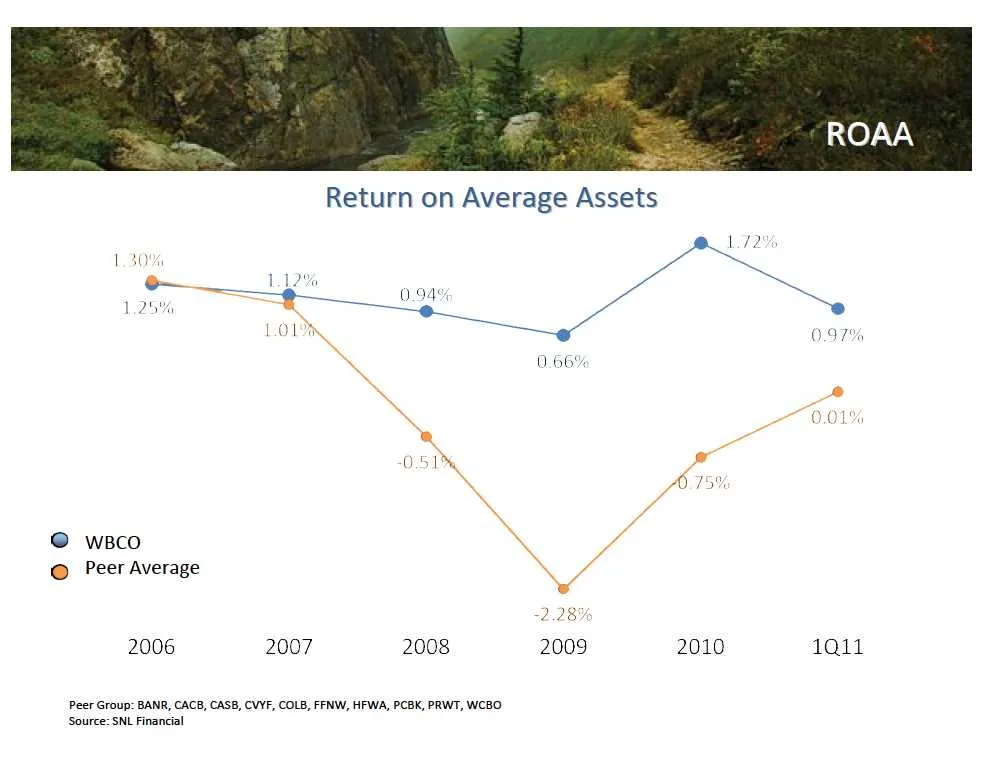
Slide 16: Return on Average Assets
Return on Average Assets \ 0.66% \ ry \ Sots \ / @ wsco % fo Peer Average he = Ww -2.28% 2006 2007 2008 2009 2010 1Qi1 Peer Group: BANR, CACB, CASB, CVYF, COLB, FFNW, HFWA, PCBK, PRWT, WCBO Source: SNL Financial
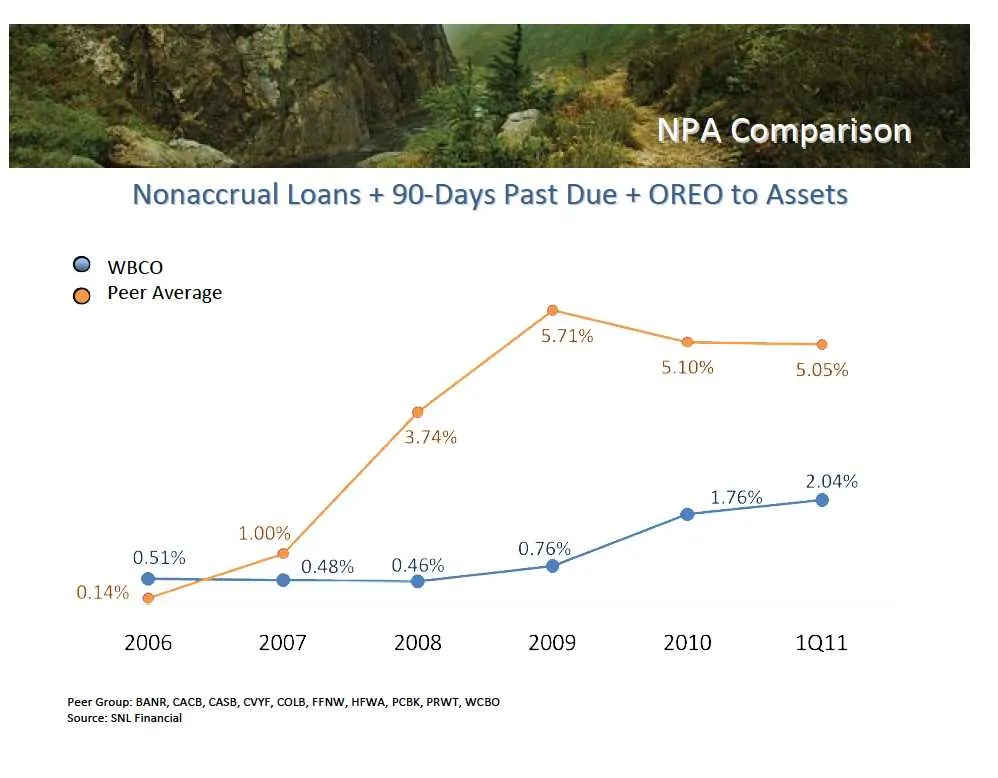
Slide 17: NPA Comparison
NPA Comparison Nonaccrual Loans + 90-Days Past Due + OREO to Assets @ wsco @ Peer Average 5.10% 5.05% 2.04% 1.00% 0.51% 0.46% 0.14% @& 2006 2007 2008 2009 2010 1Q11 Peer Group: BANR, CACB, CASB, CVYF, COLB, FFNW, HFWA, PCBK, PRWT, WCBO Source: SNL Financial
Slide 18: Losses Comparison
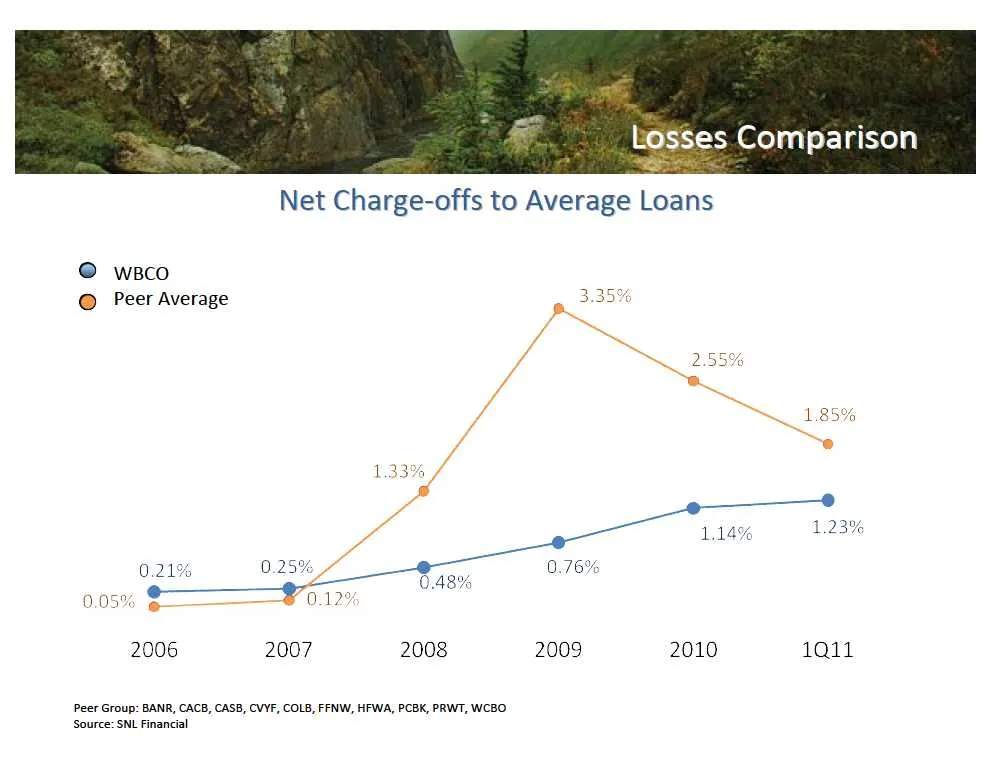
bosses Comparison Net Charge-offs to Average Loans @ wsco @ Peer Average 2006 2007 2008 2009 2010 1Q11 Peer Group: BANR, CACB, CASB, CVYF, COLB, FFNW, HFWA, PCBK, PRWT, WCBO. Source: SNL Financial
Slide 19: 2011 Strategies
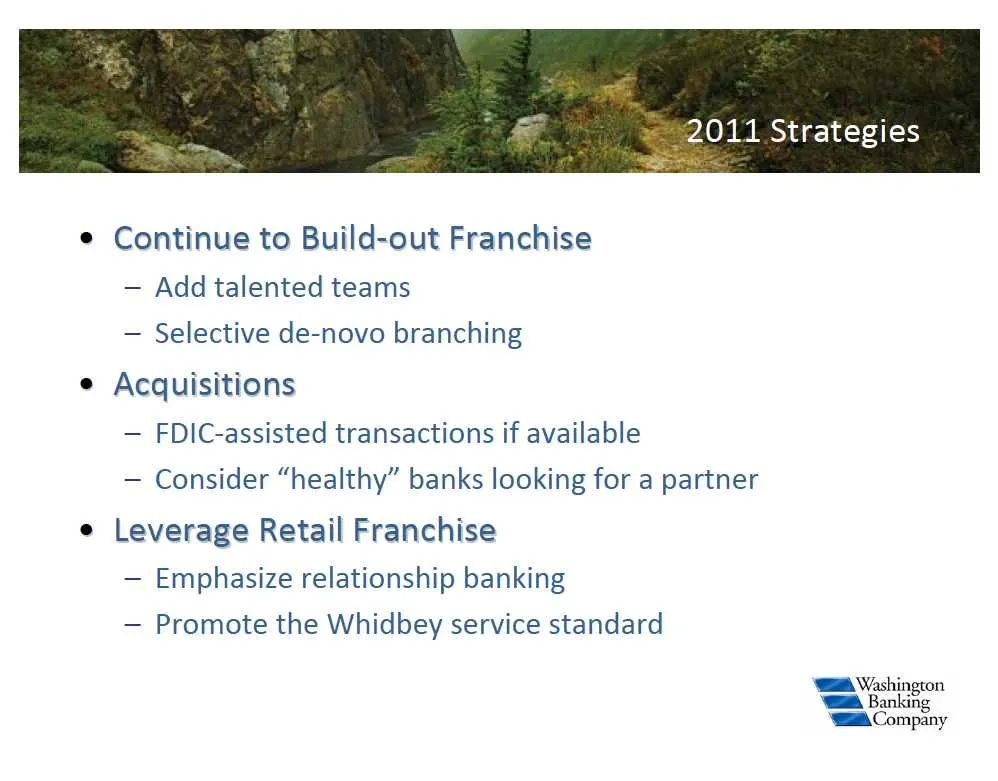
2011 Strategies © Continue to Build-out Franchise — Add talented teams — Selective de-novo branching e Acquisitions — FDIC-assisted transactions if available — Consider “healthy” banks looking for a partner e Leverage Retail Franchise — Emphasize relationship banking — Promote the Whidbey service st
Slide 20: WBCO Performance Recognition
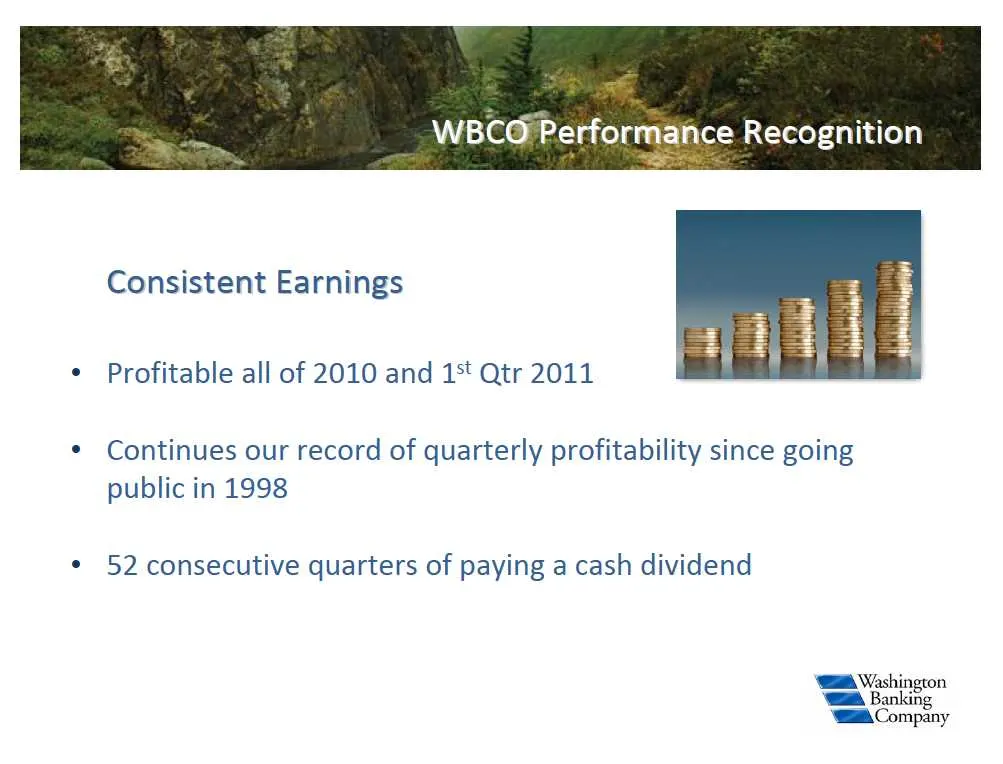
WBCG Performance Recognition Consistent Earnings Profitable all of 2010 and 1% Qtr 2011 Continues our record of quarterly profitability since going public in 1998 52 consecutive quarters of paying a cash dividend {SBA Washington "WHA Banking ‘WA Company
Slide 21: 5-yr Performance
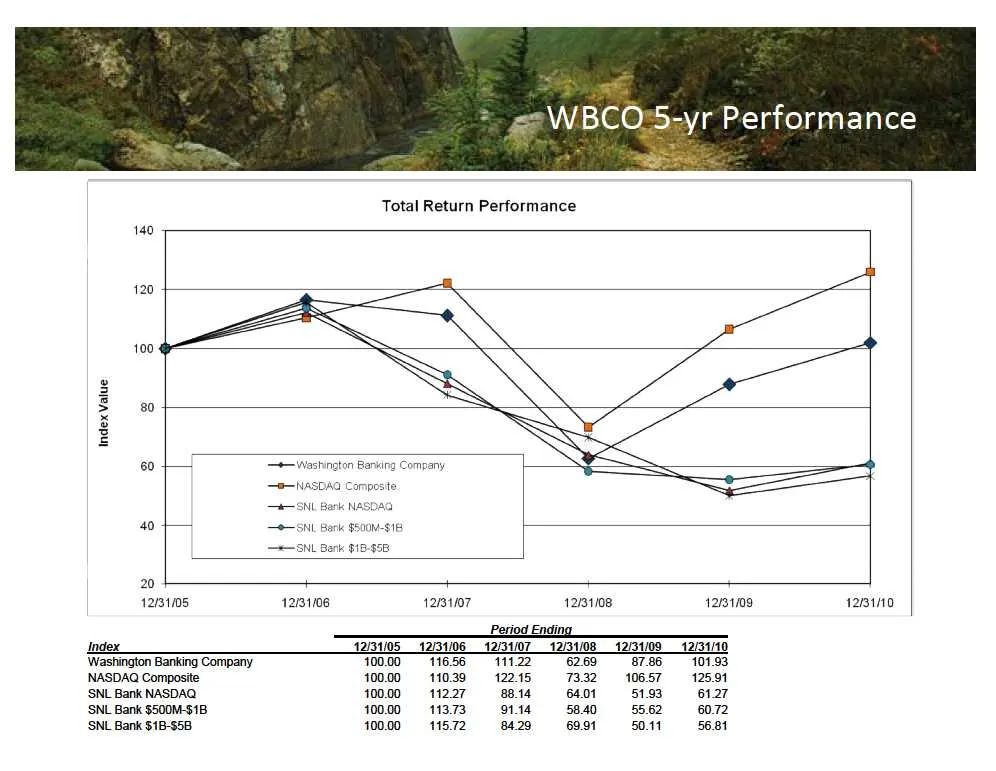
== BCOs5-yr Performance Total Return Performance 7 a z " oe ‘Washington Banking Company 100.00 116.56 111.22 62.69 87.86 101.93 ‘SNL Bank $18-$58 100.00 1157284296991 5011 56.81
Slide 22: Questions & Answers
Questions & Answers AA Washington "Wl Banking ‘GEA Company
Source: SEC EDGAR · 8-K filed May 11, 2011