Columbia Property Trust — Investor Presentation (November 2017)
30 slides from Columbia Property Trust's investor presentation, Nov 14, 2017

Slide 1: Investor Presentation November 2017
1 11. 2017 INVESTOR PRESENTATION
Slide 2: Forward-Looking Statements
2 FORWARD-LOOKING STATEMENTS Certain statements contained in this presentation other than historical facts may be considered forward-looking statements. Such statements include, in particular, statements about our plans, strategies, and prospects, and are subject to certain risks and uncertainties,
Slide 3: Columbia Property Trust
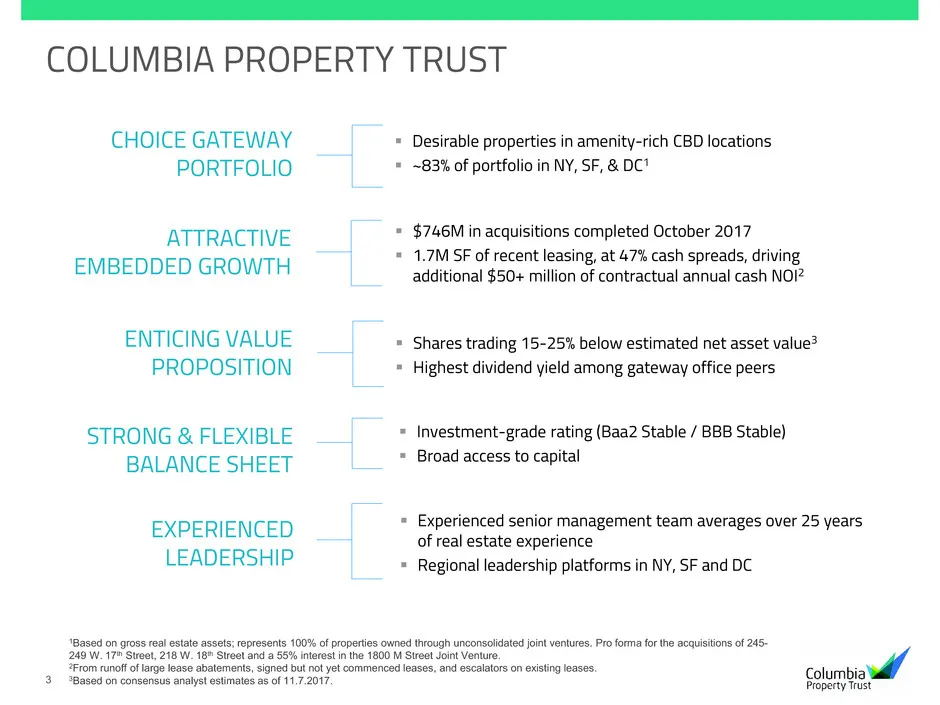
3 COLUMBIA PROPERTY TRUST Shares trading 15-25% below estimated net asset value3 Highest dividend yield among gateway office peers ENTICING VALUE PROPOSITION Experienced senior management team averages over 25 years of real estate experience Regional leadership platforms in NY, SF and DC EXP
Slide 4: Desirable Buildings in Prime Gateway Locations
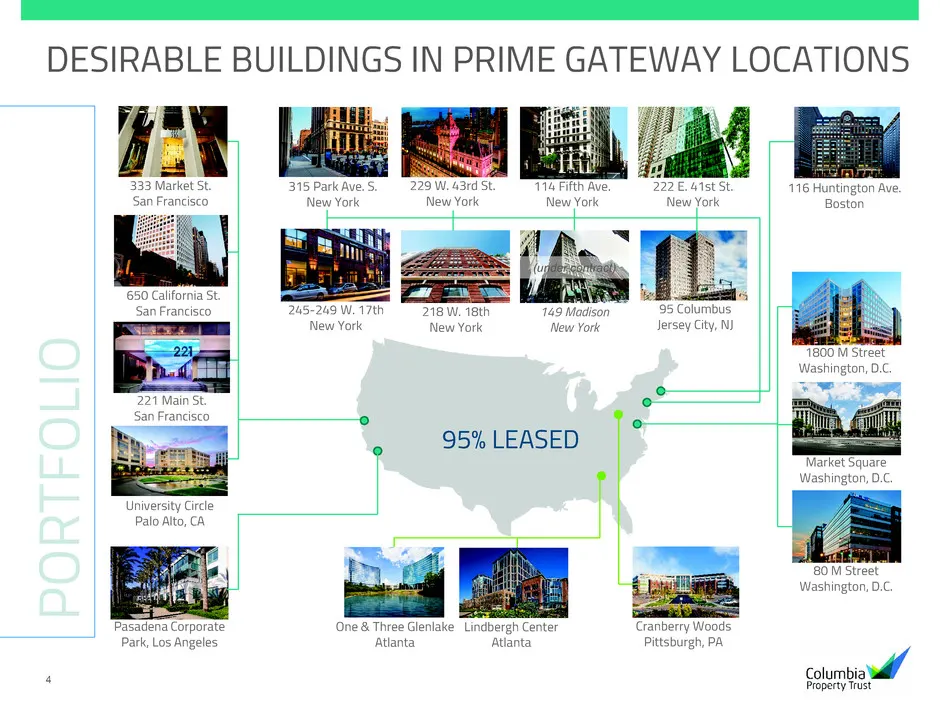
4 DESIRABLE BUILDINGS IN PRIME GATEWAY LOCATIONS PO R TF O LI O 333 Market St. San Francisco Pasadena Corporate Park, Los Angeles 222 E. 41st St. New York 650 California St. San Francisco University Circle Palo Alto, CA 95% LEASED 114 Fifth Ave. New York 229 W. 43rd St. New York 95 Columbus Jersey C
Slide 5: Core Markets Overview
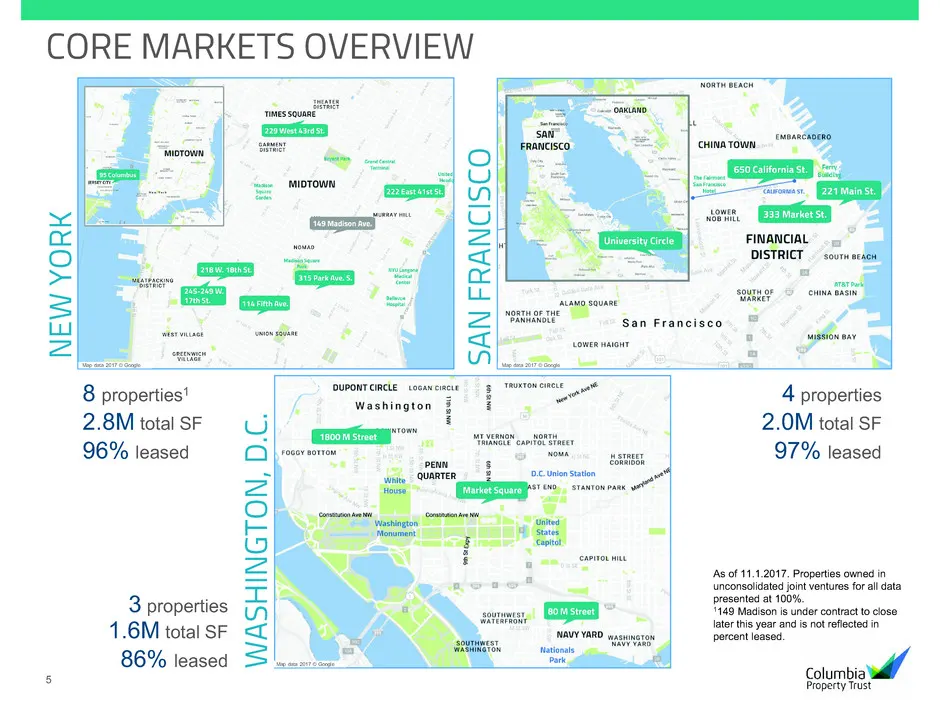
5 CORE MARKETS OVERVIEW As of 11.1.2017. Properties owned in unconsolidated joint ventures for all data presented at 100%. 1149 Madison is under contract to close later this year and is not reflected in percent leased. 8 properties1 2.8M total SF 96% leased 4 properties 2.0M total SF 97% leased 3 pr
Slide 6: External Growth Driven by Recent Acquisitions
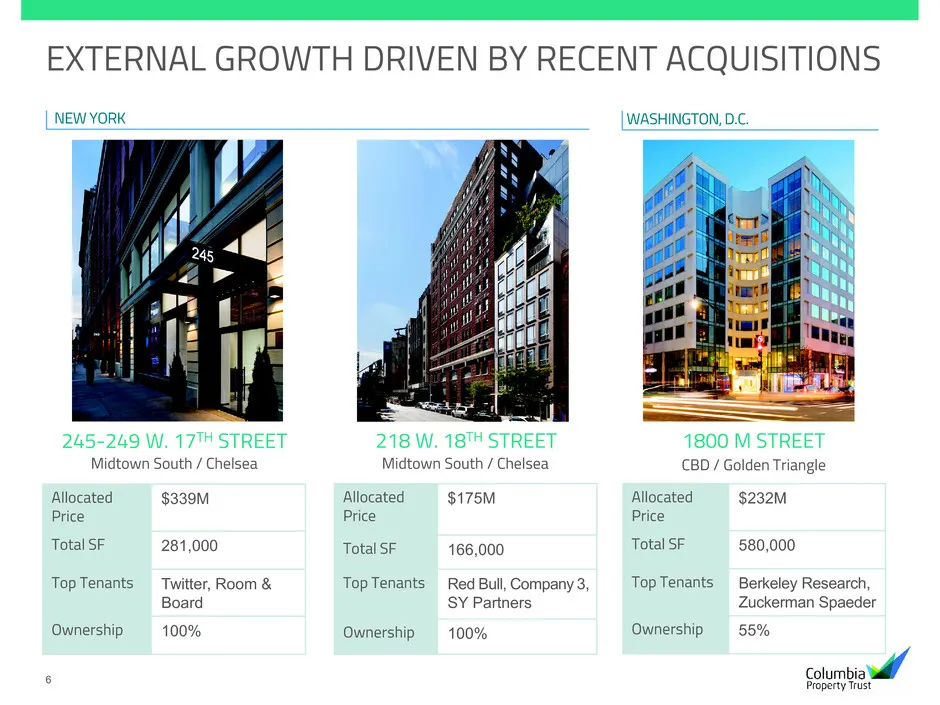
6 EXTERNAL GROWTH DRIVEN BY RECENT ACQUISITIONS 245-249 W. 17TH STREET Midtown South / Chelsea 218 W. 18TH STREET 1800 M STREET Midtown South / Chelsea CBD / Golden Triangle Allocated Price $339M Total SF 281,000 Top Tenants Twitter, Room & Board Ownership 100% Allocated Price $175M Total SF 166,000
Slide 7: Internal Growth Driven by Recent Leasing Achievements
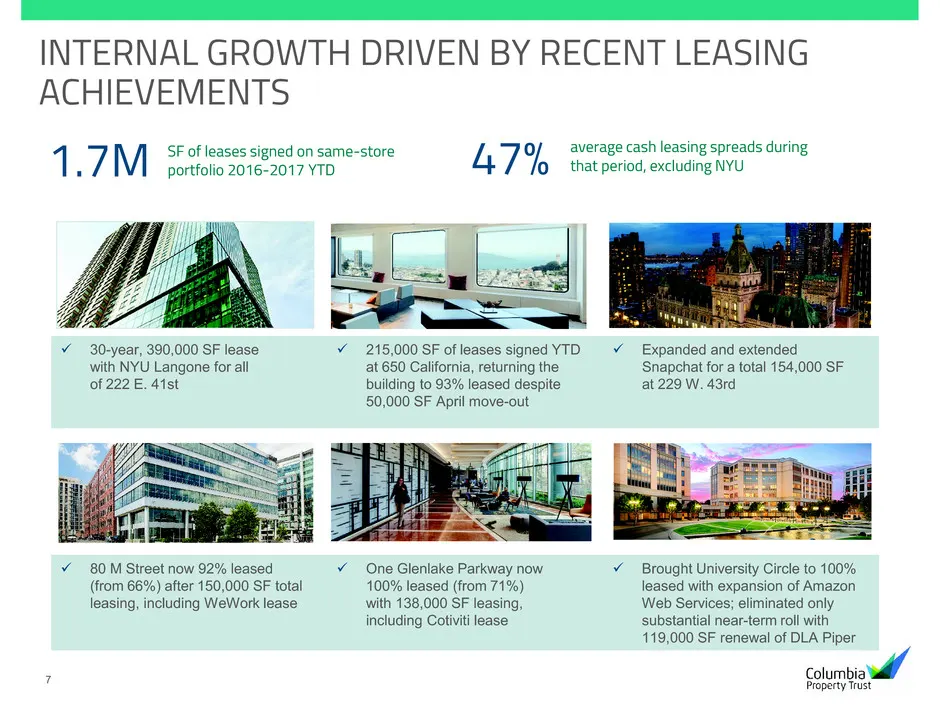
7 INTERNAL GROWTH DRIVEN BY RECENT LEASING ACHIEVEMENTS 1.7M 30-year, 390,000 SF lease with NYU Langone for all of 222 E. 41st 215,000 SF of leases signed YTD at 650 California, returning the building to 93% leased despite 50,000 SF April move-out Expanded and extended Snapchat for a total 154
Slide 8: Additional Growth from Vacancy & Near-Term Lease Rollover
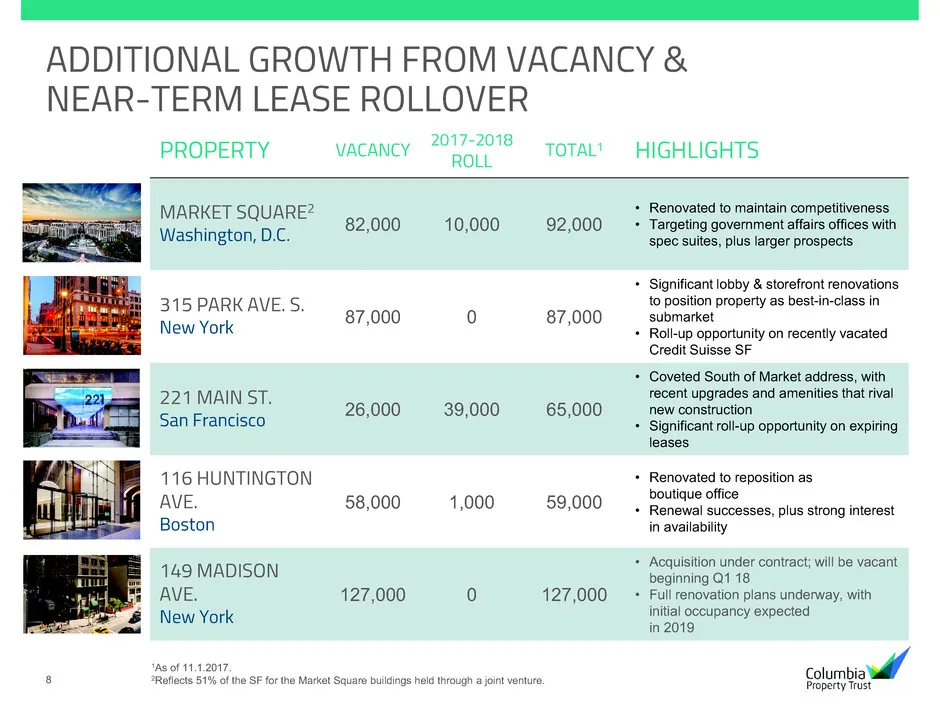
8 ADDITIONAL GROWTH FROM VACANCY & NEAR-TERM LEASE ROLLOVER PROPERTY VACANCY 2017-2018ROLL TOTAL 1 HIGHLIGHTS MARKET SQUARE2 Washington, D.C. 82,000 10,000 92,000 • Renovated to maintain competitiveness • Targeting government affairs offices with spec suites, plus larger prospects 315 PARK AVE. S. N
Slide 9: NOI Bridge – Cash Rents
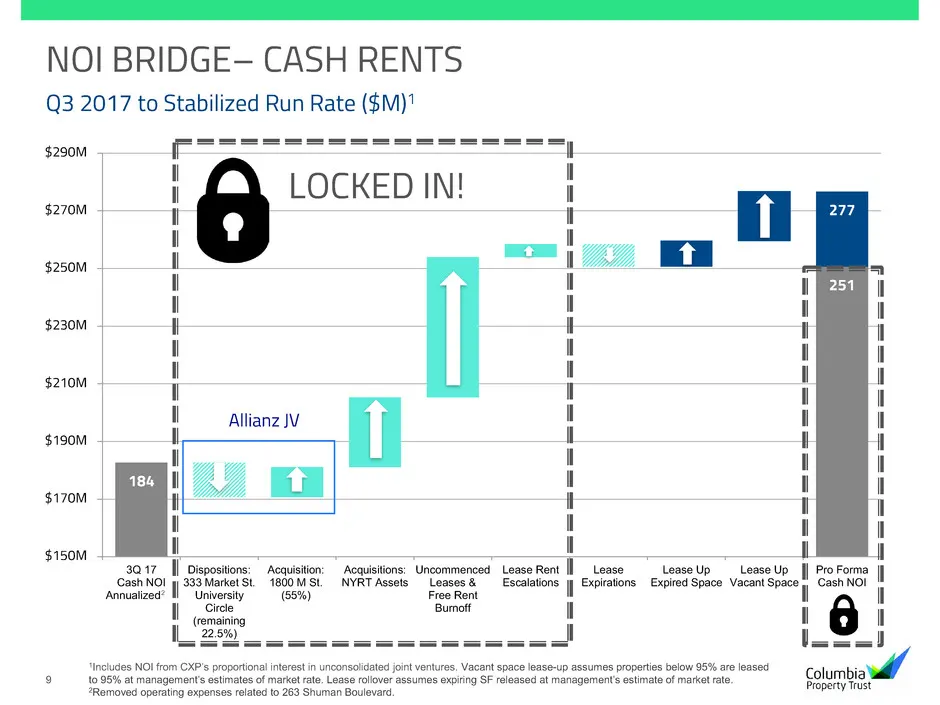
9 184 251 277 $150M $170M $190M $210M $230M $250M $270M $290M 3Q 17 Cash NOI Annualized (2) Dispositions: 333 Market St. University Circle (remaining 22.5%) Acquisition: 1800 M St. (55%) Acquisitions: NYRT Assets Uncommenced Leases & Free Rent Burnoff Lease Rent Escalations Lease Expirations Lease U
Slide 10: Embedded Contractual Growth with Limited Near-Term Rollover
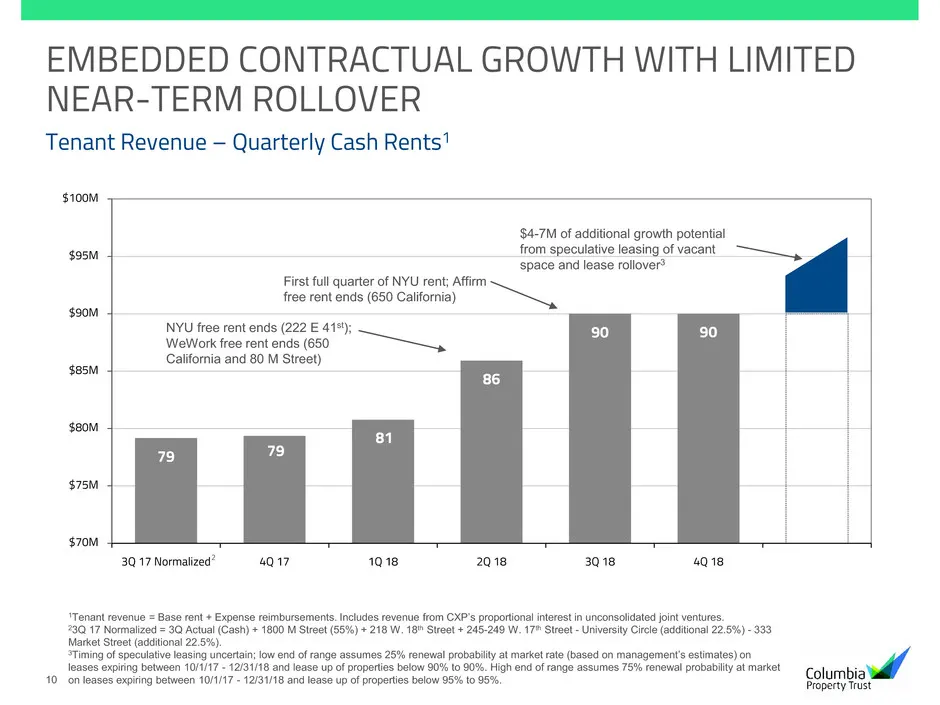
10 EMBEDDED CONTRACTUAL GROWTH WITH LIMITED NEAR-TERM ROLLOVER Tenant Revenue – Quarterly Cash Rents1 1Tenant revenue = Base rent + Expense reimbursements. Includes revenue from CXP’s proportional interest in unconsolidated joint ventures. 23Q 17 Normalized = 3Q Actual (Cash) + 1800 M Street (55%) +
Slide 11: Net Asset Value and Implied Cap Rate
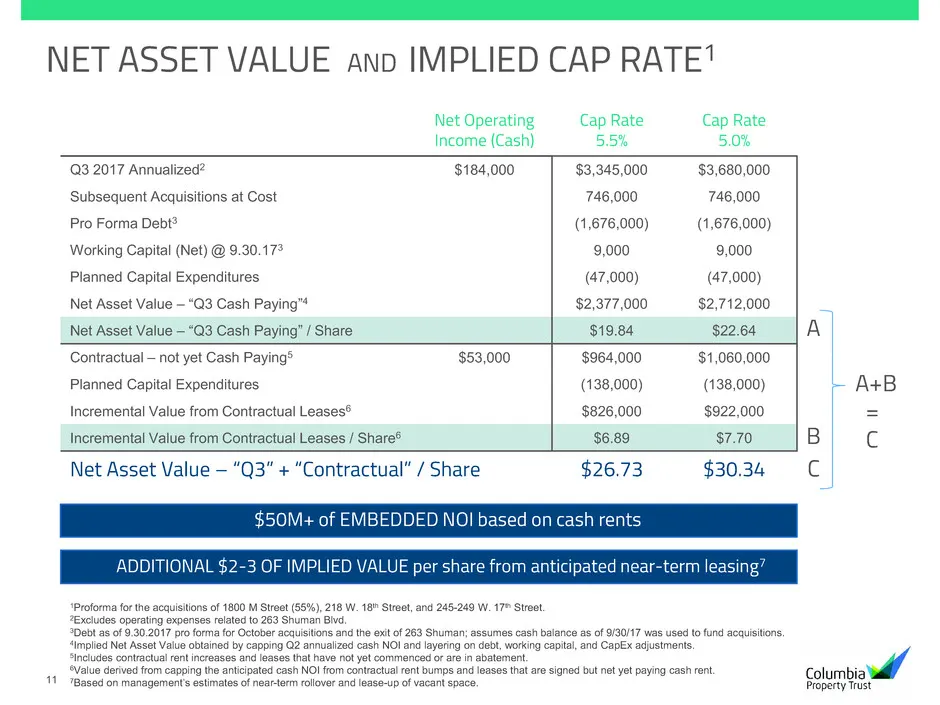
11 NET ASSET VALUE AND IMPLIED CAP RATE1 1Proforma for the acquisitions of 1800 M Street (55%), 218 W. 18th Street, and 245-249 W. 17th Street. 2Excludes operating expenses related to 263 Shuman Blvd. 3Debt as of 9.30.2017 pro forma for October acquisitions and the exit of 263 Shuman; assumes cash b
Slide 12: Highest Yield & Projected Earnings Growth Among Gateway Peers
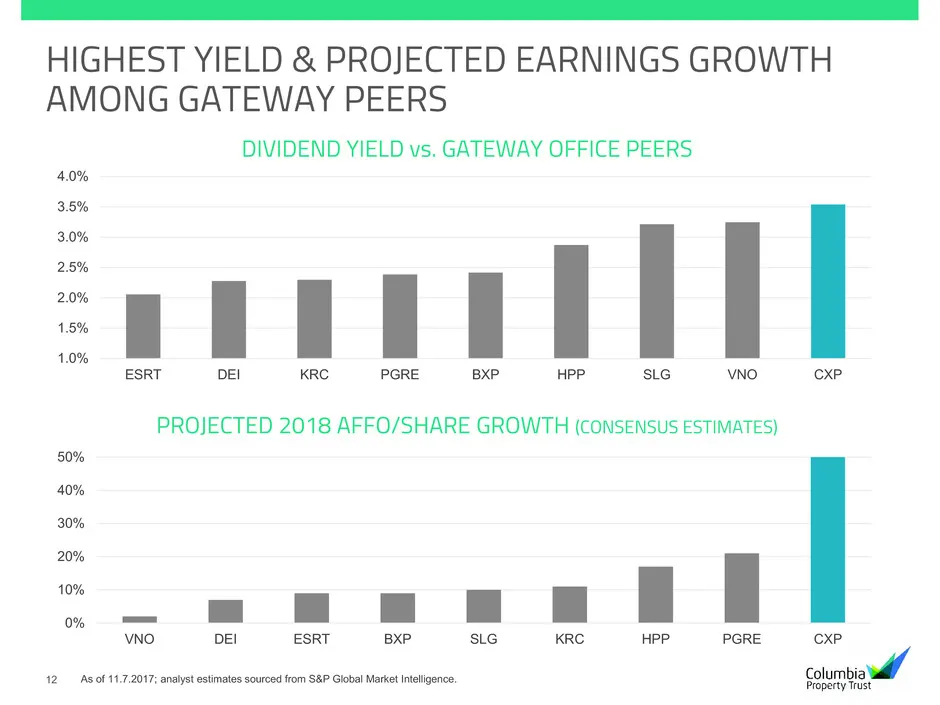
12 HIGHEST YIELD & PROJECTED EARNINGS GROWTH AMONG GATEWAY PEERS As of 11.7.2017; analyst estimates sourced from S&P Global Market Intelligence. 1.0% 1.5% 2.0% 2.5% 3.0% 3.5% 4.0% ESRT DEI KRC PGRE BXP HPP SLG VNO CXP DIVIDEND YIELD vs. GATEWAY OFFICE PEERS 0% 10% 20% 30% 40% 50% VNO DEI ESRT BXP SL
Slide 13: Stable & Flexible Balance Sheet
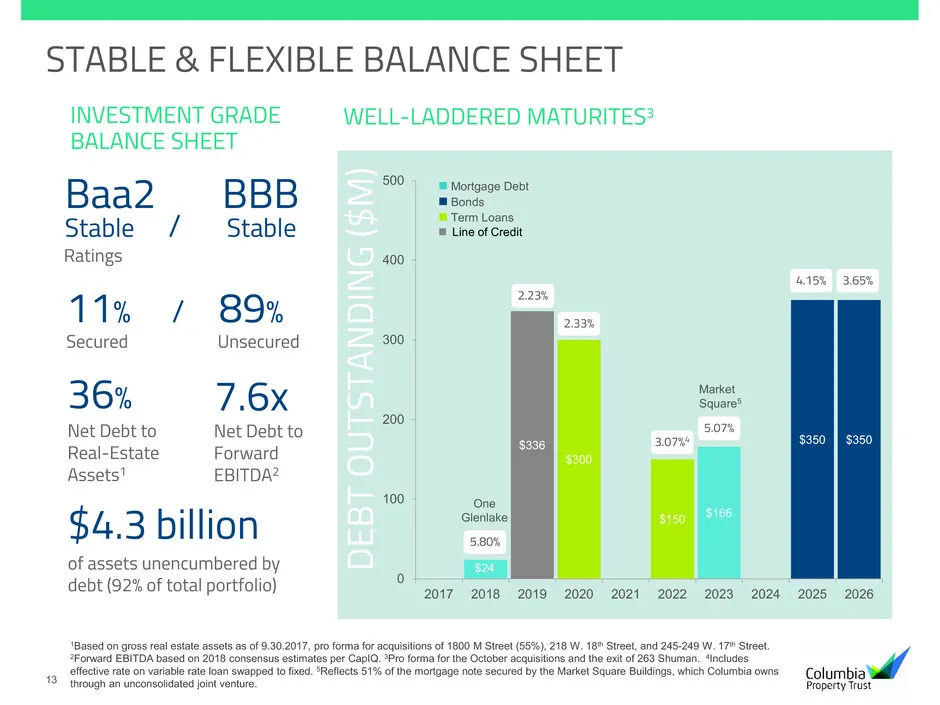
13 $24 $166 $336 $300 $150 $350 $350 0 100 200 300 400 500 2017 2018 2019 2020 2021 2022 2023 2024 2025 2026 STABLE & FLEXIBLE BALANCE SHEET INVESTMENT GRADE BALANCE SHEET 11% / 89% Secured Unsecured 36% Net Debt to Real-Estate Assets1 Baa2 Stable / Ratings BBB Stable 7.6x Net Debt to Forward EBITDA
Slide 14: Diversified Base of High Quality Tenants
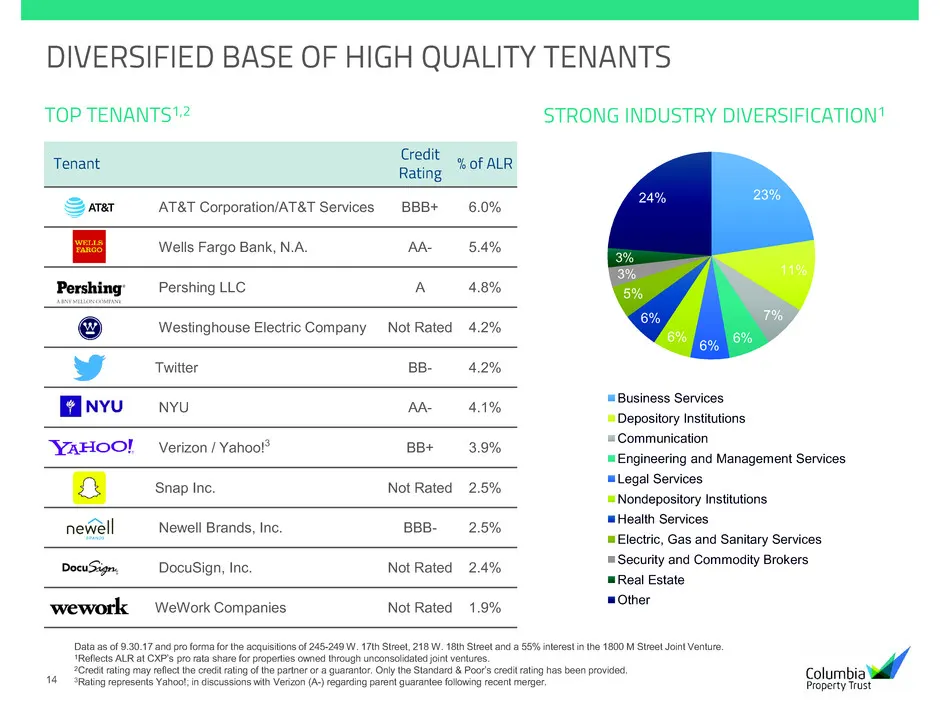
14 DIVERSIFIED BASE OF HIGH QUALITY TENANTS STRONG INDUSTRY DIVERSIFICATION1 Data as of 9.30.17 and pro forma for the acquisitions of 245-249 W. 17th Street, 218 W. 18th Street and a 55% interest in the 1800 M Street Joint Venture. 1Reflects ALR at CXP’s pro rata share for properties owned through u
Slide 15: Strategic Joint Venture with Allianz Real Estate
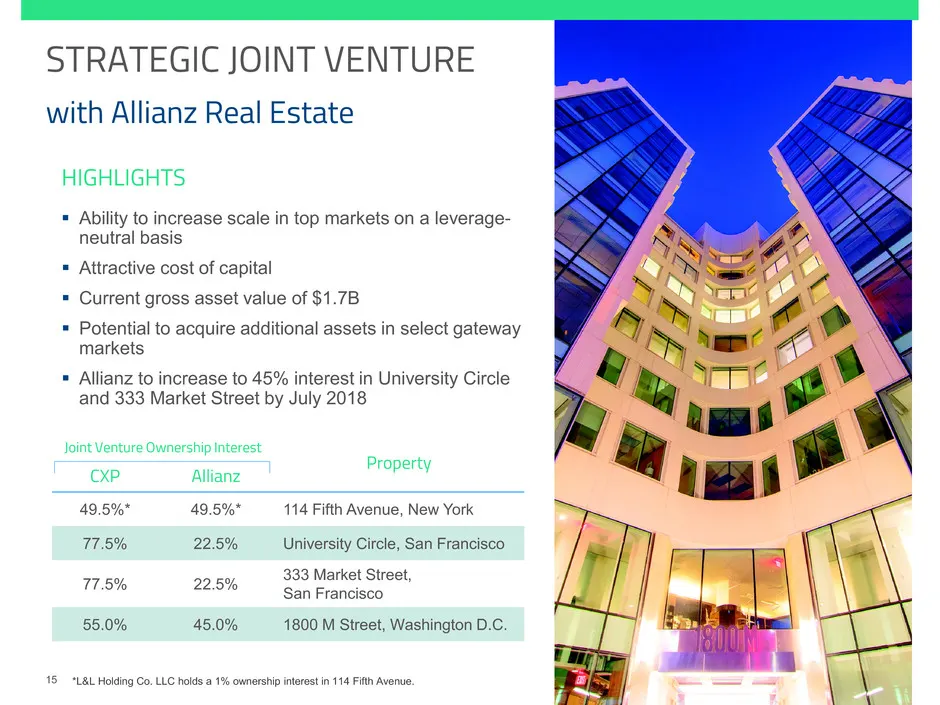
15 STRATEGIC JOINT VENTURE with Allianz Real Estate HIGHLIGHTS Ability to increase scale in top markets on a leverage- neutral basis Attractive cost of capital Current gross asset value of $1.7B Potential to acquire additional assets in select gateway markets Allianz to increase to 45% int

Slide 16: Appendix – For More Information
16 APPENDIX FOR MORE INFORMATION Columbia Property Trust INVESTOR RELATIONS 404.465.2227 ir@columbia.reit www.columbia.reit
Slide 17: NOI Bridge – GAAP Rents
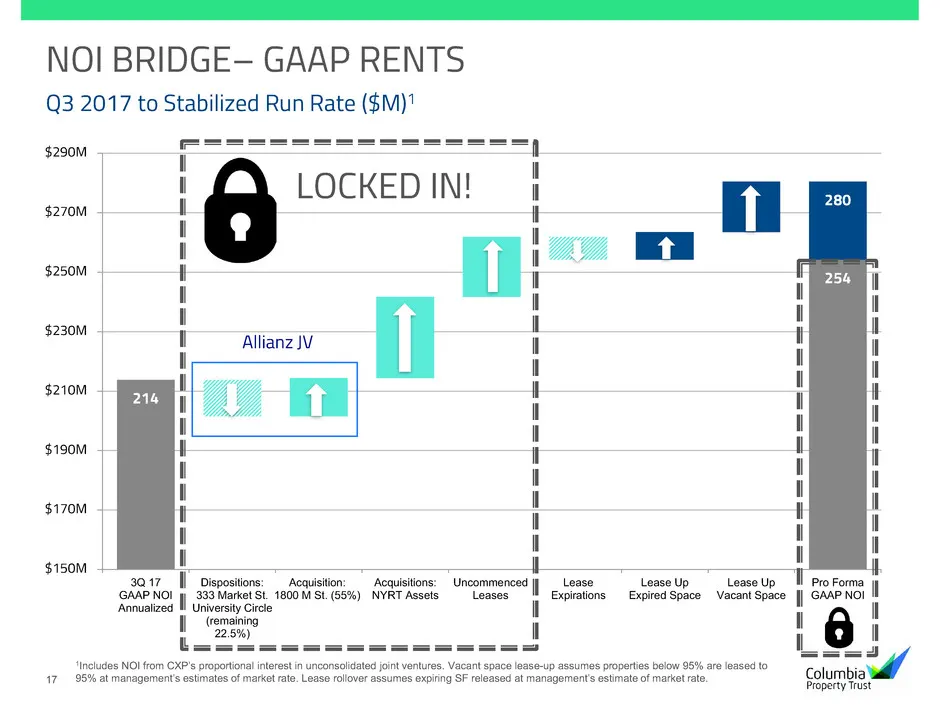
17 214 254 280 $150M $170M $190M $210M $230M $250M $270M $290M 3Q 17 GAAP NOI Annualized Dispositions: 333 Market St. University Circle (remaining 22.5%) Acquisition: 1800 M St. (55%) Acquisitions: NYRT Assets Uncommenced Leases Lease Expirations Lease Up Expired Space Lease Up Vacant Space Pro Form
Slide 18: Embedded Contractual Growth – Quarterly GAAP Rents
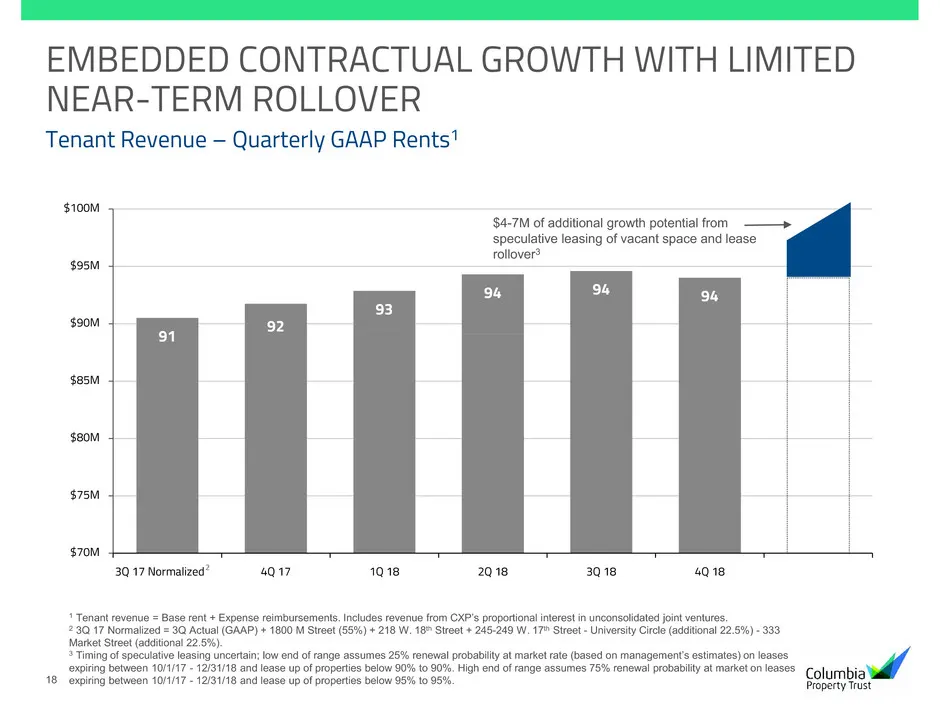
18 91 92 93 94 94 94 $70M $75M $80M $85M $90M $95M $100M 3Q 17 Normalized (2) 4Q 17 1Q 18 2Q 18 3Q 18 4Q 18 8382 $4-7M of additional growth potential from speculative leasing of vacant space and lease rollover3 2 EMBEDDED CONTRACTUAL GROWTH WITH LIMITED NEAR-TERM ROLLOVER Tenant Revenue – Quarterly
Slide 19: Future Growth Through Redevelopment
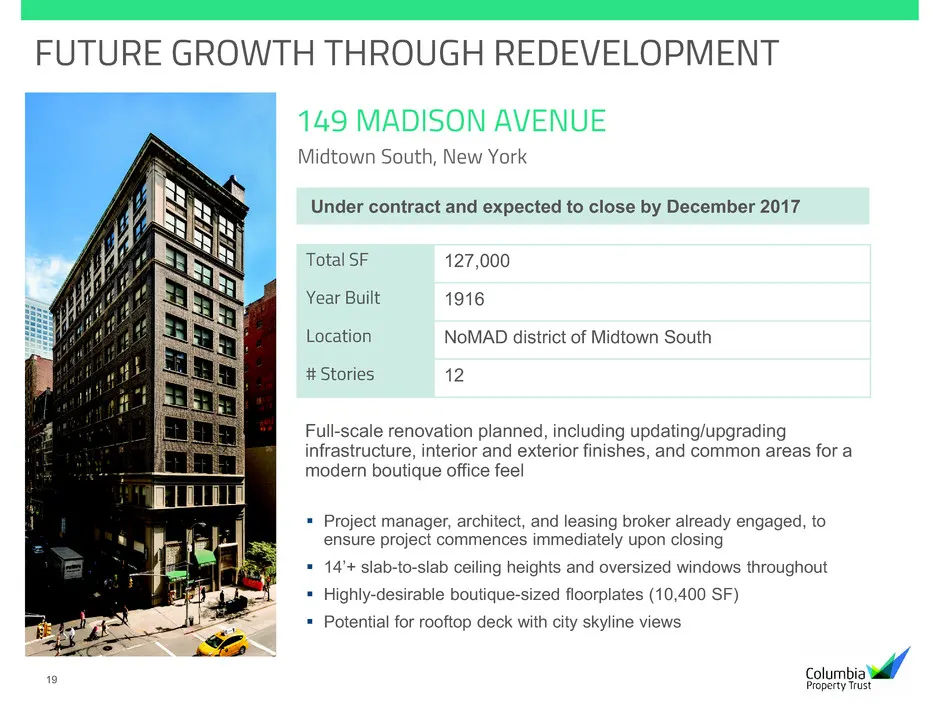
19 FUTURE GROWTH THROUGH REDEVELOPMENT Project manager, architect, and leasing broker already engaged, to ensure project commences immediately upon closing 14’+ slab-to-slab ceiling heights and oversized windows throughout Highly-desirable boutique-sized floorplates (10,400 SF) Potential for
Slide 20: Embedded Growth from Signed Leases
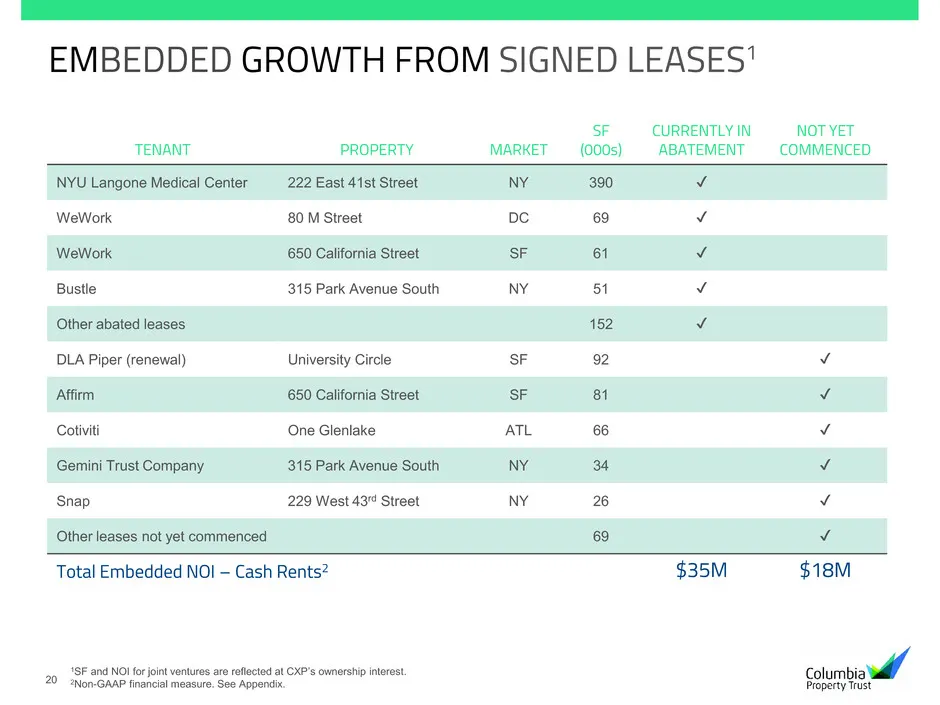
20 EMBEDDED GROWTH FROM SIGNED LEASES1 TENANT PROPERTY MARKET SF (000s) CURRENTLY IN ABATEMENT NOT YET COMMENCED NYU Langone Medical Center 222 East 41st Street NY 390 ✔ WeWork 80 M Street DC 69 ✔ WeWork 650 California Street SF 61 ✔ Bustle 315 Park Avenue South NY 51 ✔ Other abated leases 152 ✔ DLA
Slide 21: Embedded Internal Growth, with Limited Near-Term Rollover
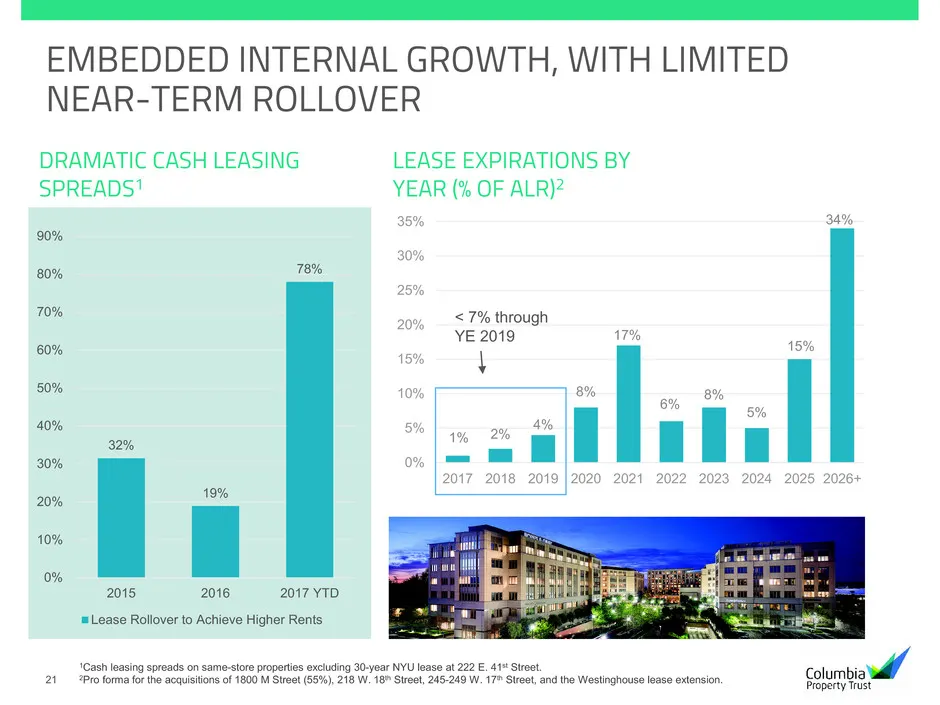
21 EMBEDDED INTERNAL GROWTH, WITH LIMITED NEAR-TERM ROLLOVER 1% 2% 4% 8% 17% 6% 8% 5% 15% 34% 0% 5% 10% 15% 20% 25% 30% 35% 2017 2018 2019 2020 2021 2022 2023 2024 2025 2026+ 32% 19% 78% 0% 10% 20% 30% 40% 50% 60% 70% 80% 90% 2015 2016 2017 YTD Lease Rollover to Achieve Higher Rents 1Cash leasing sp
Slide 22: Leasing Success Case Studies
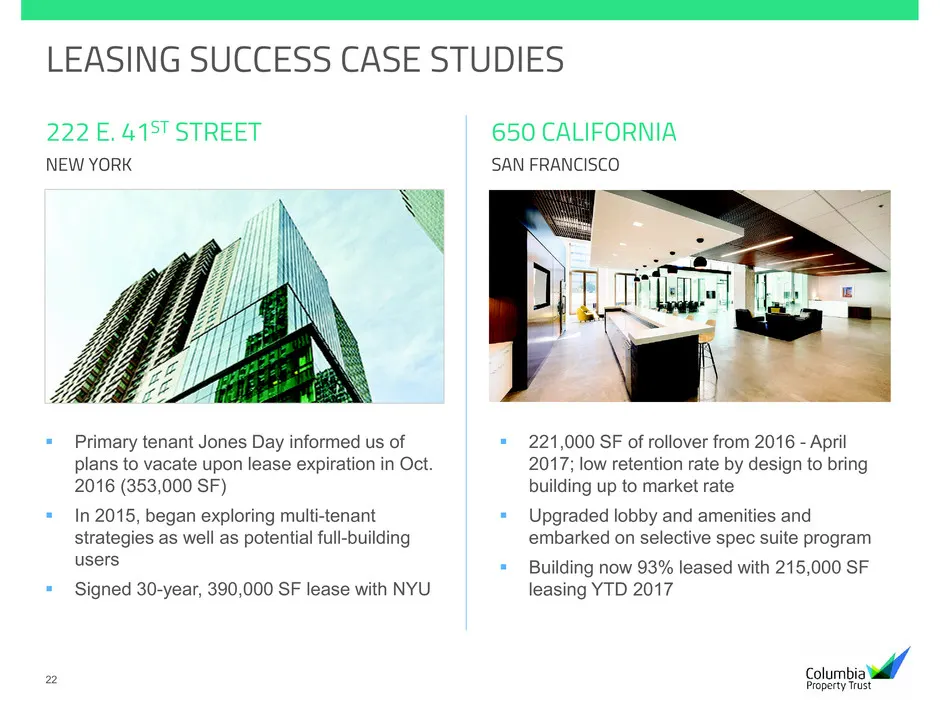
22 LEASING SUCCESS CASE STUDIES 650 CALIFORNIA SAN FRANCISCO 222 E. 41ST STREET NEW YORK Primary tenant Jones Day informed us of plans to vacate upon lease expiration in Oct. 2016 (353,000 SF) In 2015, began exploring multi-tenant strategies as well as potential full-building users Signed 30-y
Slide 23: Leasing Success Case Studies
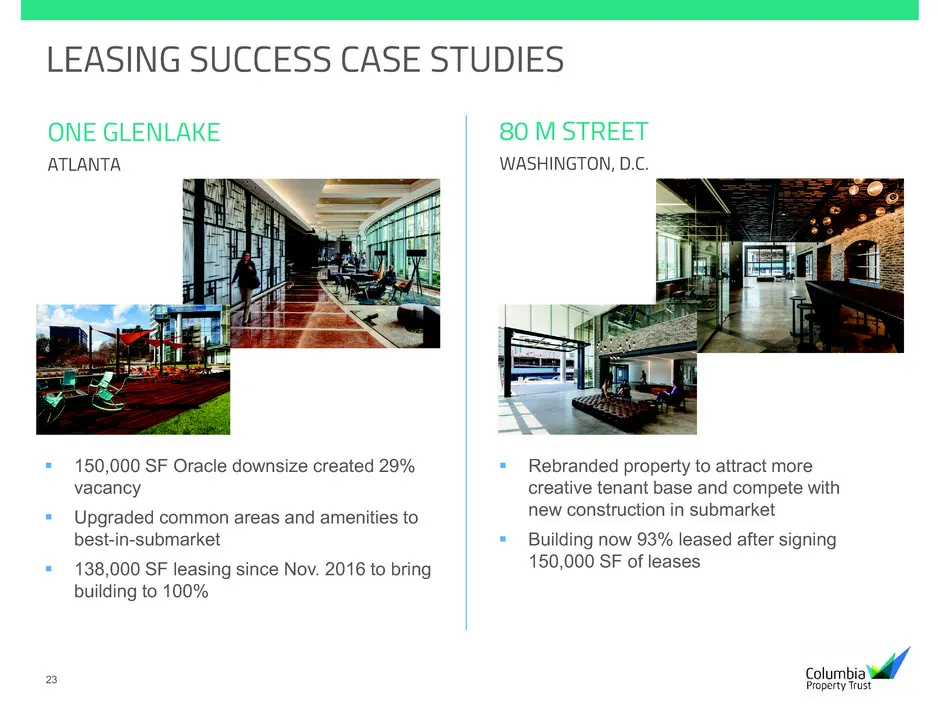
23 LEASING SUCCESS CASE STUDIES Rebranded property to attract more creative tenant base and compete with new construction in submarket Building now 93% leased after signing 150,000 SF of leases ONE GLENLAKE ATLANTA 80 M STREET WASHINGTON, D.C. 150,000 SF Oracle downsize created 29% vacancy U
Slide 24: Leasing Success Case Studies
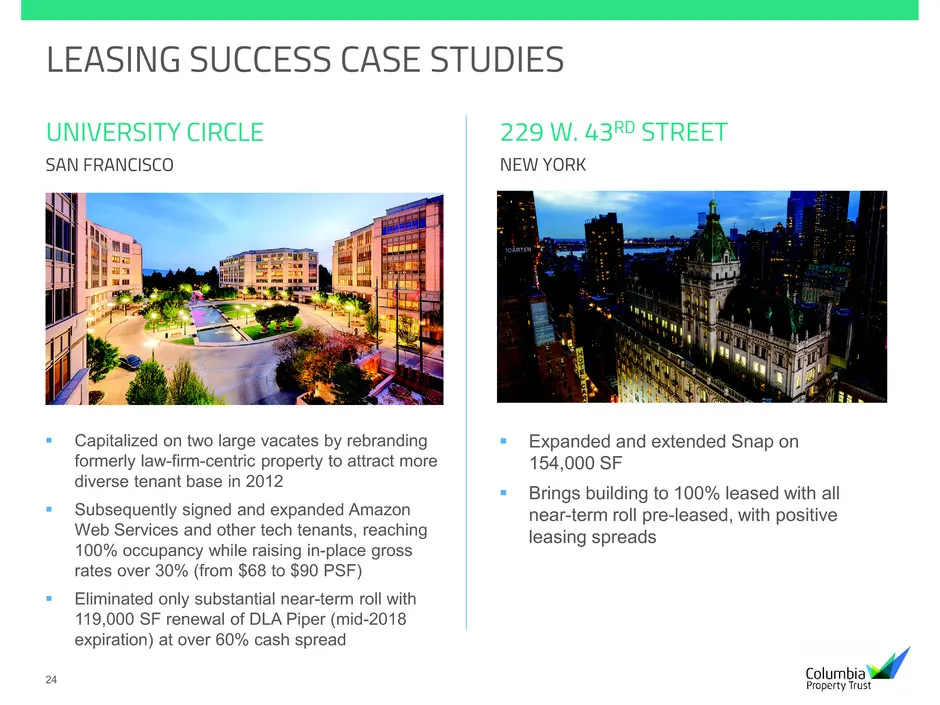
24 LEASING SUCCESS CASE STUDIES 229 W. 43RD STREET NEW YORK Expanded and extended Snap on 154,000 SF Brings building to 100% leased with all near-term roll pre-leased, with positive leasing spreads Capitalized on two large vacates by rebranding formerly law-firm-centric property to attract mor
Slide 25: Experienced Corporate and Regional Leadership
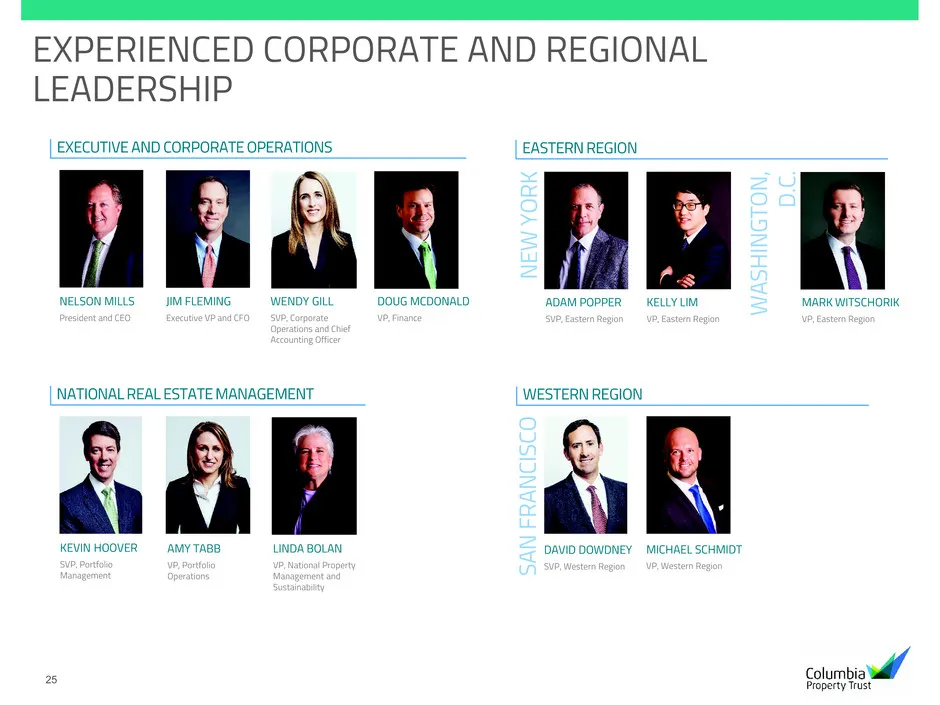
25 EXPERIENCED CORPORATE AND REGIONAL LEADERSHIP ADAM POPPER SVP, Eastern Region EXECUTIVE AND CORPORATE OPERATIONS NATIONAL REAL ESTATE MANAGEMENT EASTERN REGION WESTERN REGION N EW Y O R K KELLY LIM VP, Eastern Region MARK WITSCHORIK VP, Eastern Region DAVID DOWDNEY SVP, Western Region MICHAEL SCH
Slide 26: Reconciliations: Non-GAAP to Comparable GAAP Measures
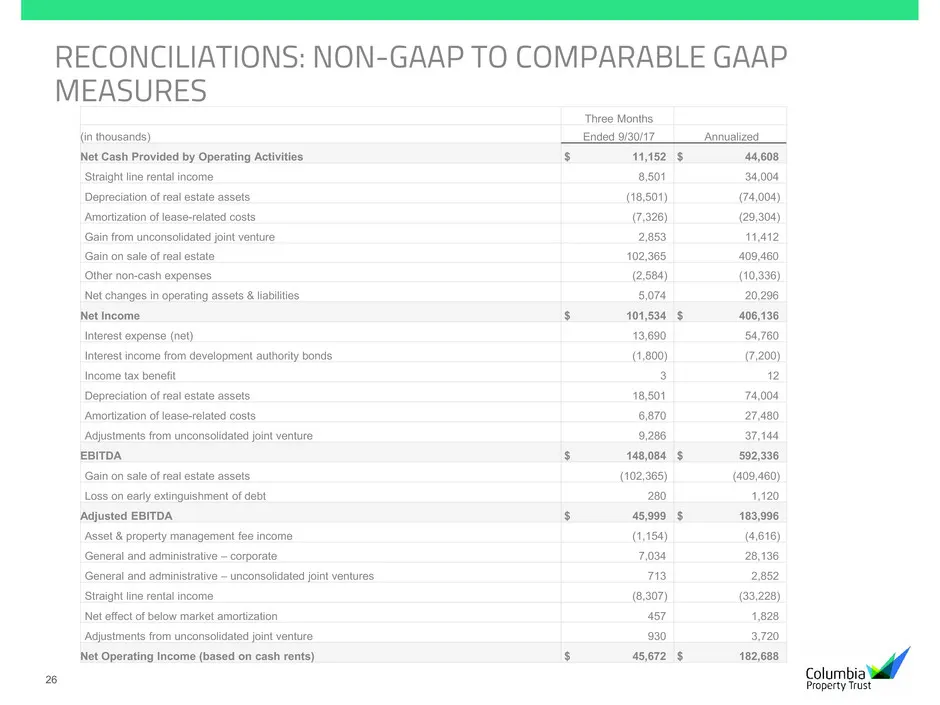
26 RECONCILIATIONS: NON-GAAP TO COMPARABLE GAAP MEASURES Three Months (in thousands) Ended 9/30/17 Annualized Net Cash Provided by Operating Activities $ 11,152 $ 44,608 Straight line rental income 8,501 34,004 Depreciation of real estate assets (18,501) (74,004) Amortization of lease-related costs
Slide 27: Reconciliations: Non-GAAP to Comparable GAAP Measures (continued)
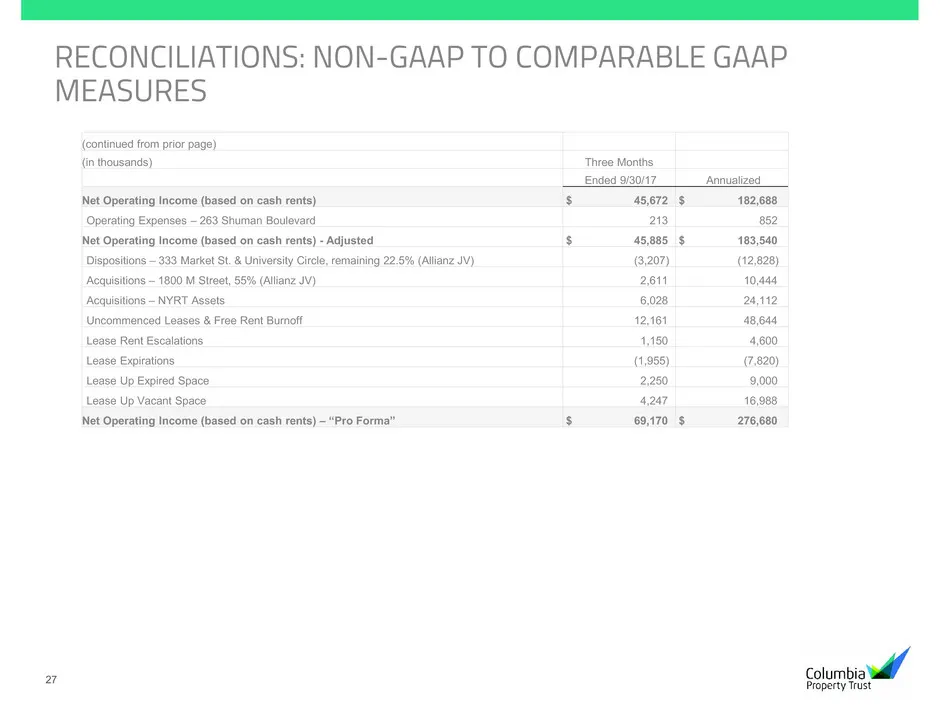
27 RECONCILIATIONS: NON-GAAP TO COMPARABLE GAAP MEASURES (continued from prior page) (in thousands) Three Months Ended 9/30/17 Annualized Net Operating Income (based on cash rents) $ 45,672 $ 182,688 Operating Expenses – 263 Shuman Boulevard 213 852 Net Operating Income (based on cash rents) - Adjus
Slide 28: Reconciliations: Non-GAAP to Comparable GAAP Measures
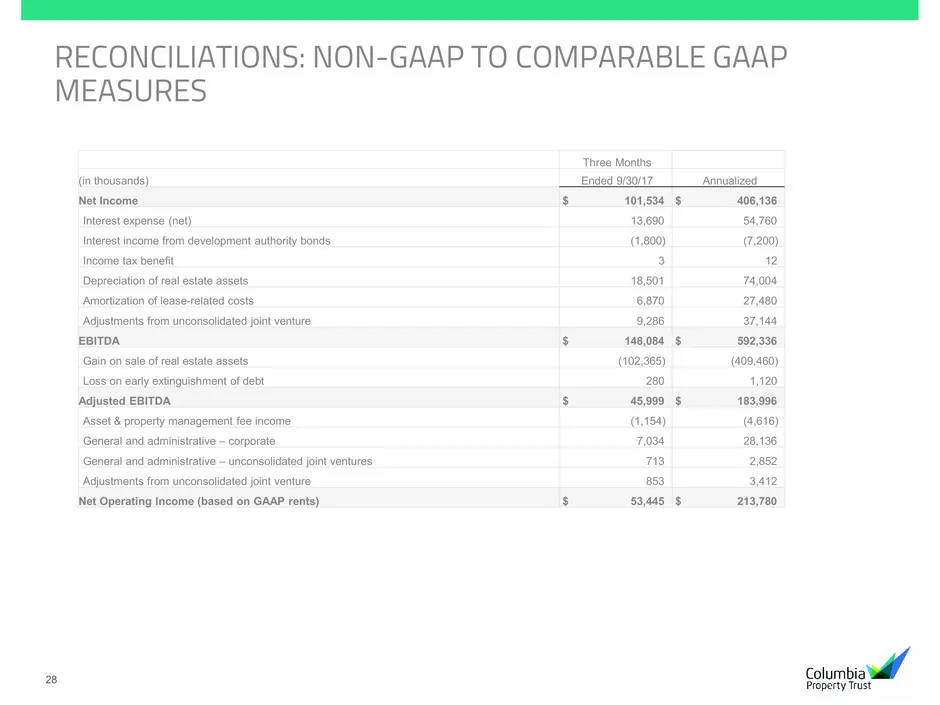
28 RECONCILIATIONS: NON-GAAP TO COMPARABLE GAAP MEASURES Three Months (in thousands) Ended 9/30/17 Annualized Net Income $ 101,534 $ 406,136 Interest expense (net) 13,690 54,760 Interest income from development authority bonds (1,800) (7,200) Income tax benefit 3 12 Depreciation of real estate asset
Slide 29: Reconciliations: Non-GAAP to Comparable GAAP Measures (continued)
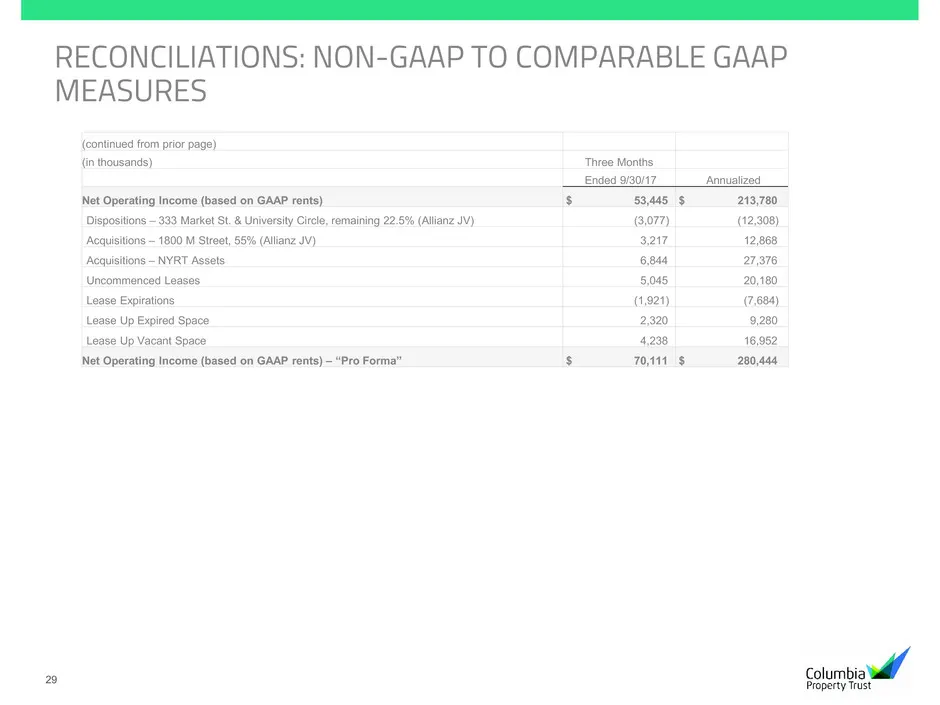
29 RECONCILIATIONS: NON-GAAP TO COMPARABLE GAAP MEASURES (continued from prior page) (in thousands) Three Months Ended 9/30/17 Annualized Net Operating Income (based on GAAP rents) $ 53,445 $ 213,780 Dispositions – 333 Market St. & University Circle, remaining 22.5% (Allianz JV) (3,077) (12,308) Acq
Slide 30: Reconciliations: Non-GAAP to Comparable GAAP Measures
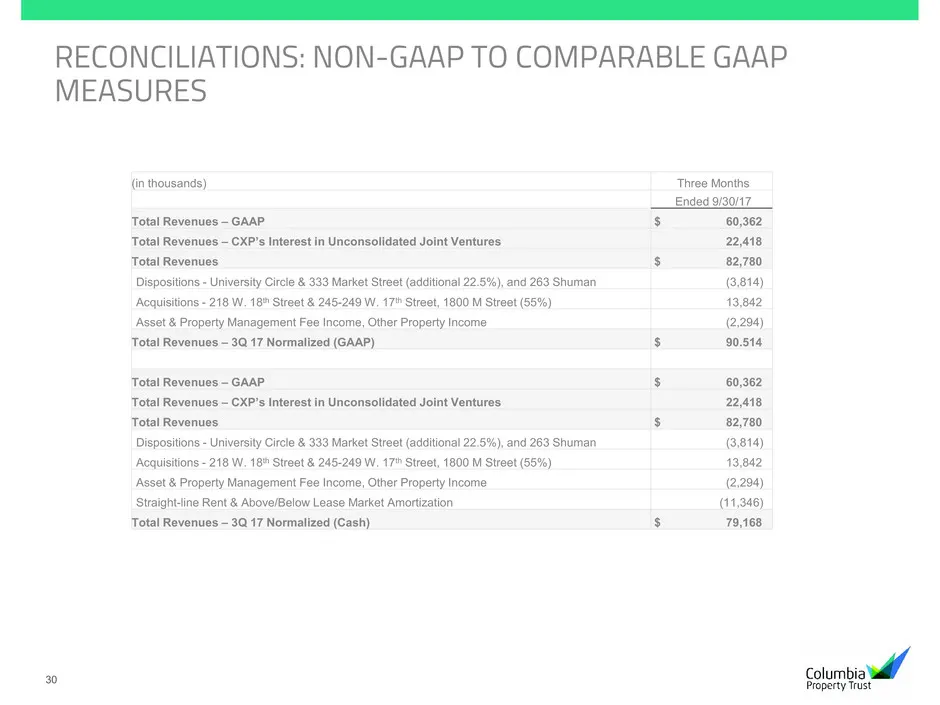
30 RECONCILIATIONS: NON-GAAP TO COMPARABLE GAAP MEASURES (in thousands) Three Months Ended 9/30/17 Total Revenues – GAAP $ 60,362 Total Revenues – CXP’s Interest in Unconsolidated Joint Ventures 22,418 Total Revenues $ 82,780 Dispositions - University Circle & 333 Market Street (additional 22.5%), a
Source: SEC EDGAR · 8-K filed Nov 14, 2017
More decks from Columbia Property Trust Inc
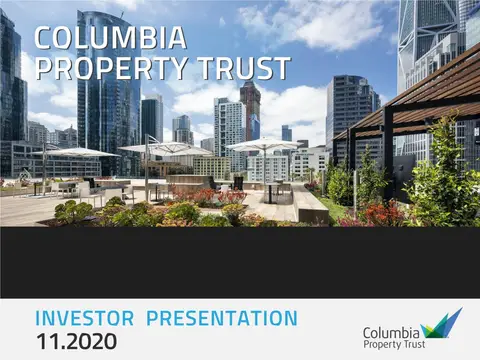 Investor Presentation (November 2020)33 slides · Nov 17, 2020
 Investor Presentation (August 2020)34 slides · Aug 31, 2020
 Investor Presentation (June 2020)34 slides · Jun 1, 2020
 Investor Presentation (February 2020)29 slides · Feb 26, 2020
 Corporate Update (December 2019)12 slides · Dec 3, 2019
 Investor Presentation (November 2019)28 slides · Nov 12, 2019