MainSource Financial Group Inc
MainSource Financial — Shareholder Meeting (April 2010)
74 slides from MainSource Financial's shareholder meeting presentation, Apr 29, 2010

Slide 1: MainSource Financial Group
PN MainSource FINANCIAL GROUP To be the Premier Financial Services Company in the Midwest.
Slide 2: Welcome 2010 Annual Meeting of Shareholders
Welcome 2010 Annual Meeting of Shareholders Robert E. Hoptry, Chairman
Slide 3: Introduction of Director Nominees
Introduction of Director Nominees Philip A. Frantz
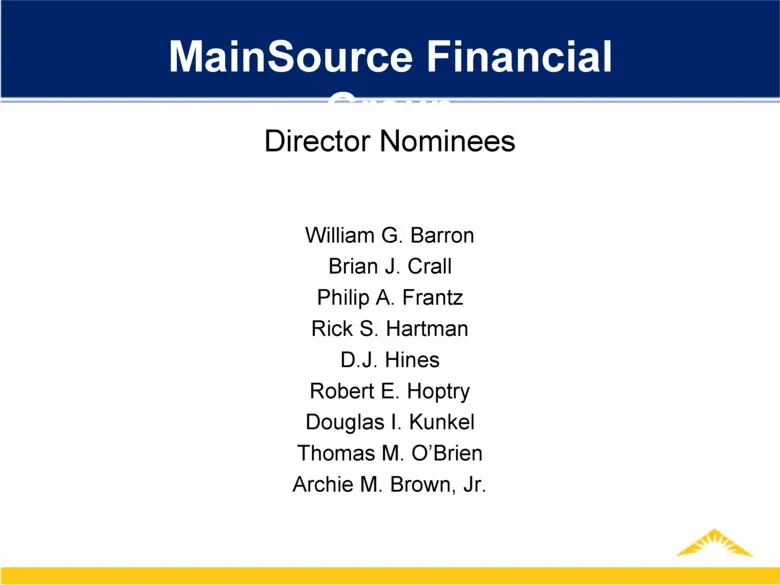
Slide 4: Director Nominees
Director Nominees William G. Barron Brian J. Crall Philip A. Frantz Rick S. Hartman D.J. Hines Robert E. Hoptry Douglas I. Kunkel Thomas M. O’Brien Archie M. Brown, Jr. MainSource Financial Group
Slide 5: Advisory Vote on Executive Compensation Policies and Procedures
Advisory Vote on Executive Compensation Policies and Procedures
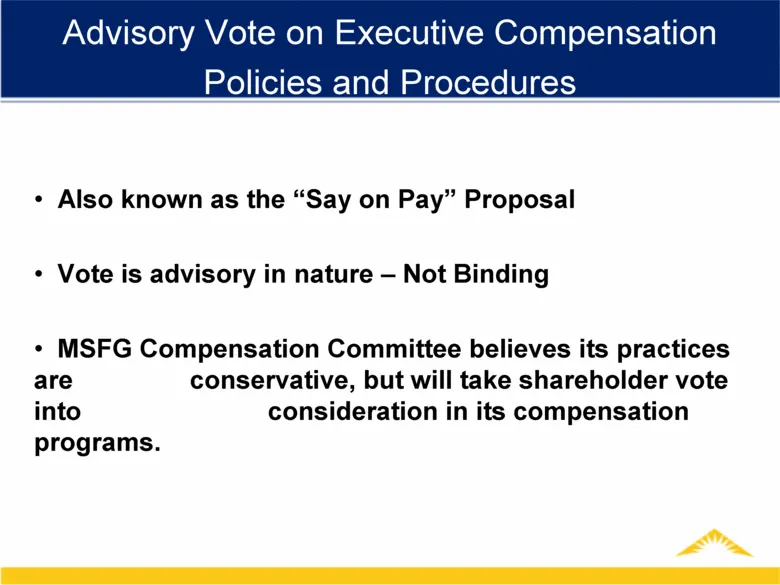
Slide 6: Advisory Vote on Executive Compensation (Say on Pay)
Advisory Vote on Executive Compensation Policies and Procedures Also known as the “Say on Pay” Proposal Vote is advisory in nature – Not Binding MSFG Compensation Committee believes its practices are conservative, but will take shareholder vote into consideration in its compensation programs.
Slide 7: Ratification of Crowe Horwath LLP
Ratification of Crowe Horwath LLP
Slide 8: Introductions
Introductions
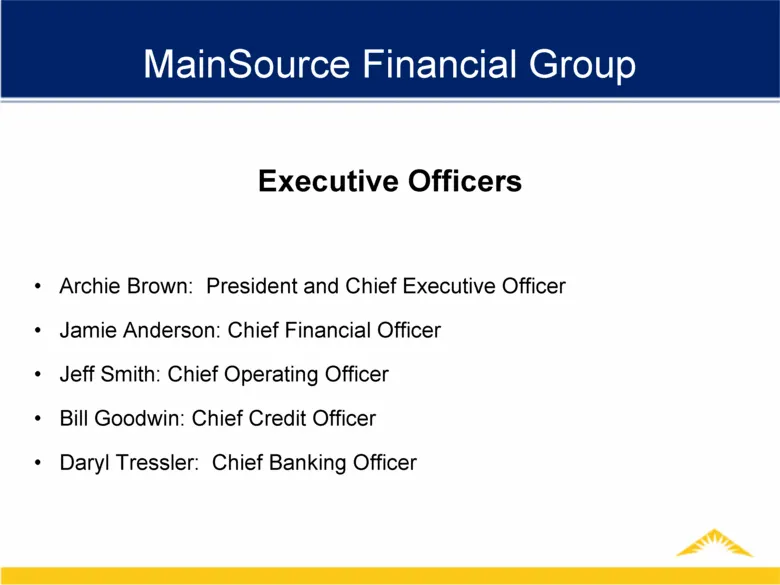
Slide 9: MainSource Financial Group Executive Officers
MainSource Financial Group Executive Officers Archie Brown: President and Chief Executive Officer Jamie Anderson: Chief Financial Officer Jeff Smith: Chief Operating Officer Bill Goodwin: Chief Credit Officer Daryl Tressler: Chief Banking Officer
Slide 10: Affiliate Directors
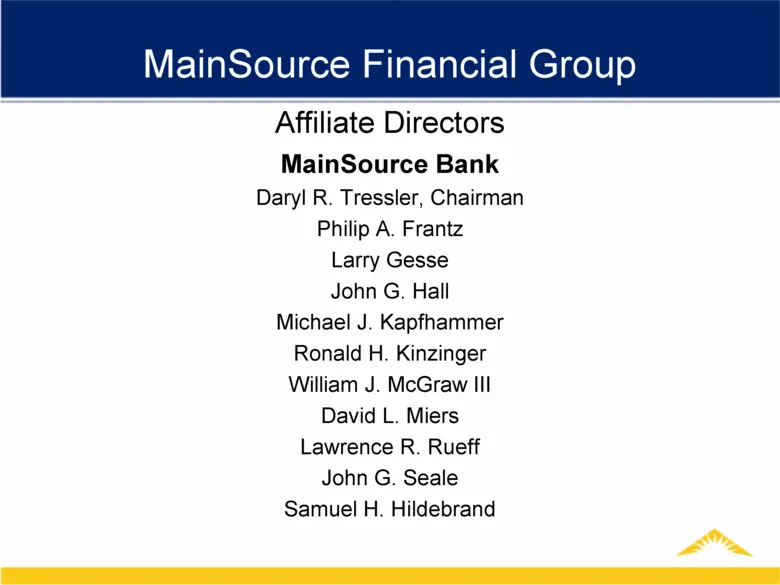
MainSource Financial Group Affiliate Directors MainSource Bank Daryl R. Tressler, Chairman Philip A. Frantz Larry Gesse John G. Hall Michael J. Kapfhammer Ronald H. Kinzinger William J. McGraw III David L. Miers Lawrence R. Rueff John G. Seale Samuel H. Hildebrand
Slide 11: Results of Shareholder Vote
Results of Shareholder Vote
Slide 12: Official Business Meeting Concluded
Official Business Meeting Concluded
Slide 13: 2009 Financial Performance
2009 Financial Performance Jamie Anderson Chief Financial Officer
Slide 14: Disclosure Regarding Forward Looking Statements
Disclosure Regarding Forward Looking Statements This presentation may include forward-looking statements regarding, among other things, MainSource’s business strategy, financial position and prospects, dividend policy, business results, strategic initiatives, credit quality including reserve levels,
Slide 15: 2009 Balance Sheet
2009 Balance Sheet
Slide 16: Total Assets (As of Year End)
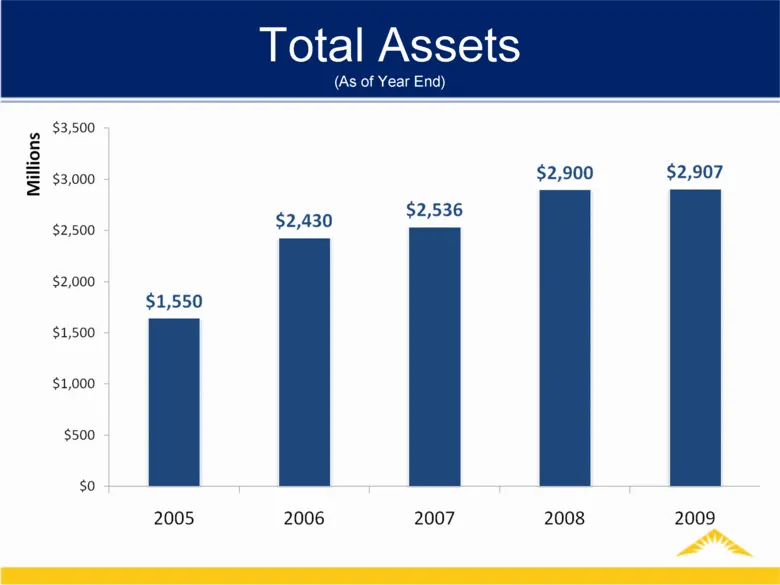
Millions $3,500 $3,000 $2,500 $2,000 $1,500 $1,000 $500 $0 $1,550 2005 Total Assets (As of Year End) $2,900 $2,907 2006 2007 2008 2009
Slide 17: Largest Indiana Bank Holding Companies By Asset Size
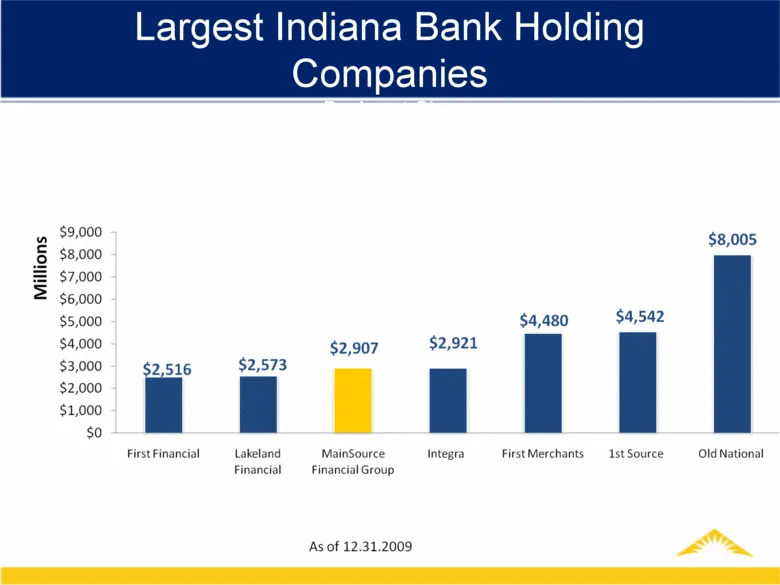
Largest Indiana Bank Holding Companies By Asset Size
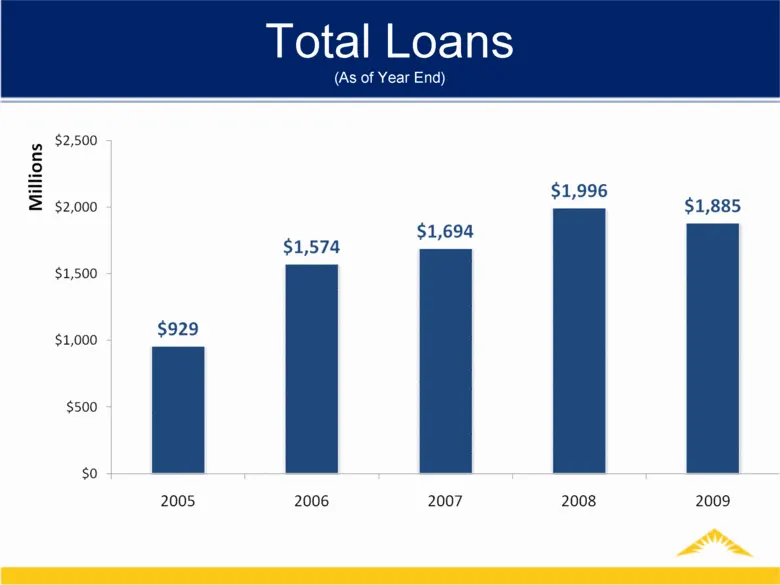
Slide 18: Total Loans (As of Year End)
Millions $2,500 $2,000 $1,500 $1,000 $500 so $929 2005 Total Loans (As of Year End) $1,996 $1,885 $1,574 $1,694 2006 2007 2008 2009
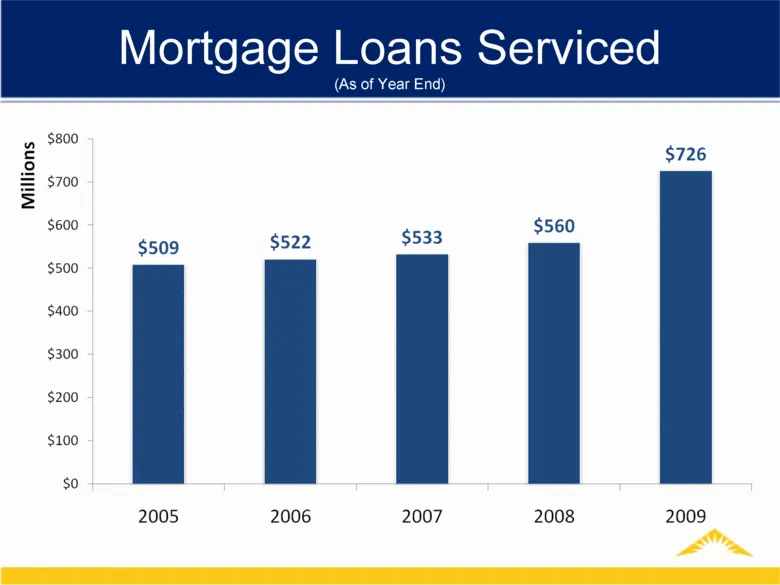
Slide 19: Mortgage Loans Serviced (As of Year End)
Mortgage Loans Serviced (As of Year End)
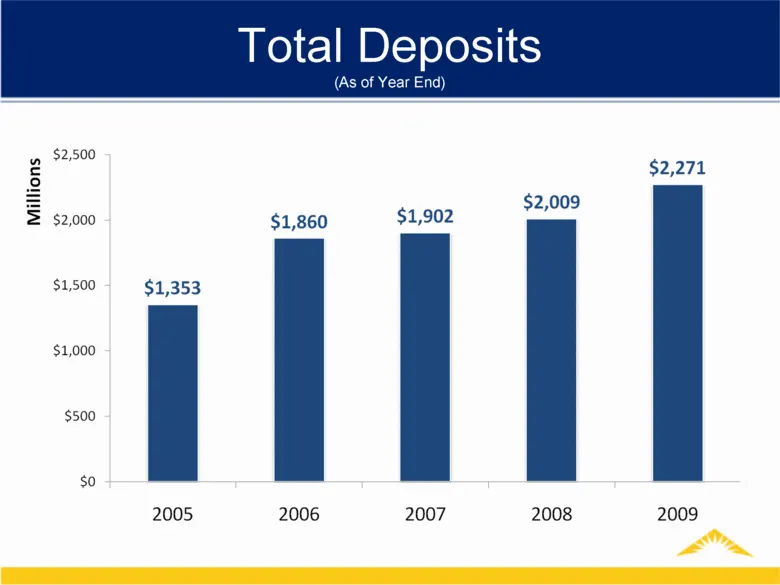
Slide 20: Total Deposits (As of Year End)
Total Deposits (As of Year End)
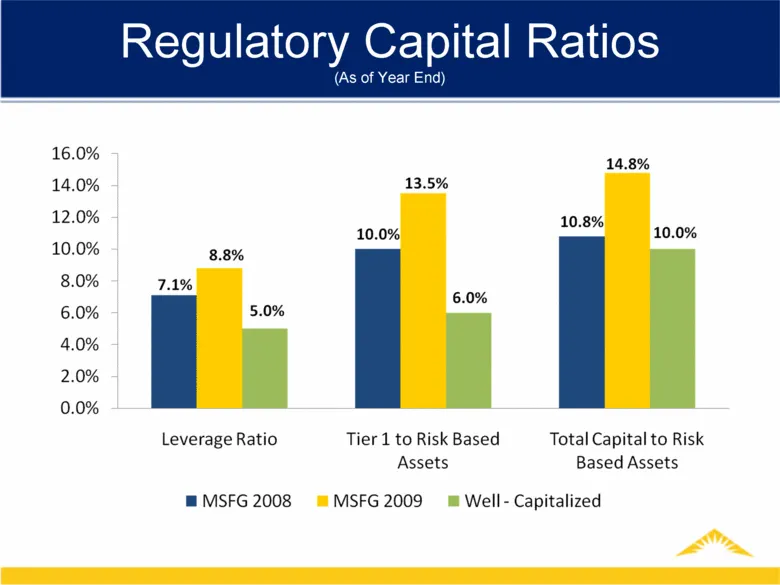
Slide 21: Regulatory Capital Ratios (As of Year End)
Regulatory Capital Ratios (As of Year End)
Slide 22: 2009 Operating Results
2009 Operating Results
Slide 23: 2009 Reported Net Loss
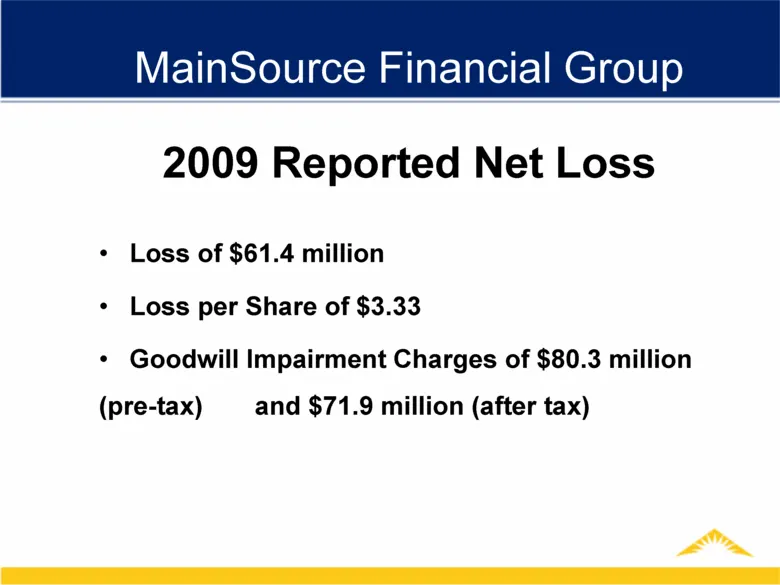
MainSource Financial Group 2009 Reported Net Loss Loss of $61.4 million Loss per Share of $3.33 Goodwill Impairment Charges of $80.3 million (pre-tax) and $71.9 million (after tax)
Slide 24: Goodwill and Goodwill Impairment Charges
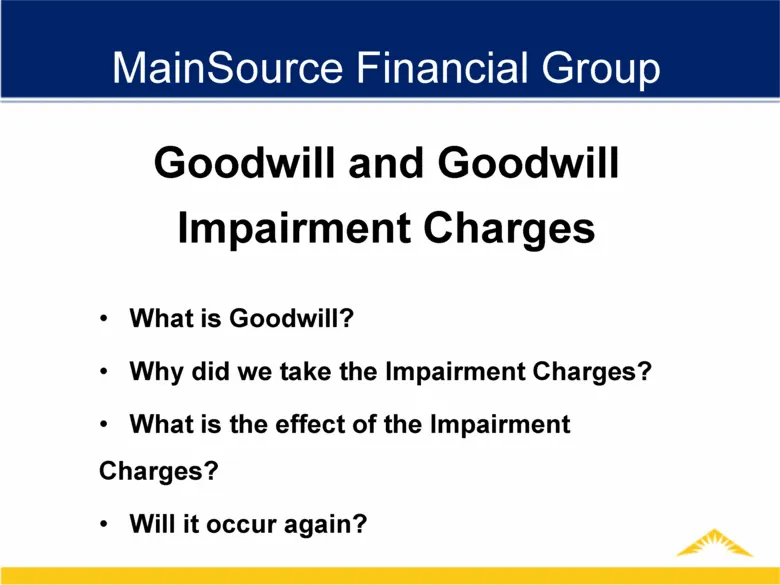
MainSource Financial Group Goodwill and Goodwill Impairment Charges What is Goodwill? Why did we take the Impairment Charges? What is the effect of the Impairment Charges? Will it occur again?
Slide 25: Net Operating Income (Excludes Goodwill Impairment)
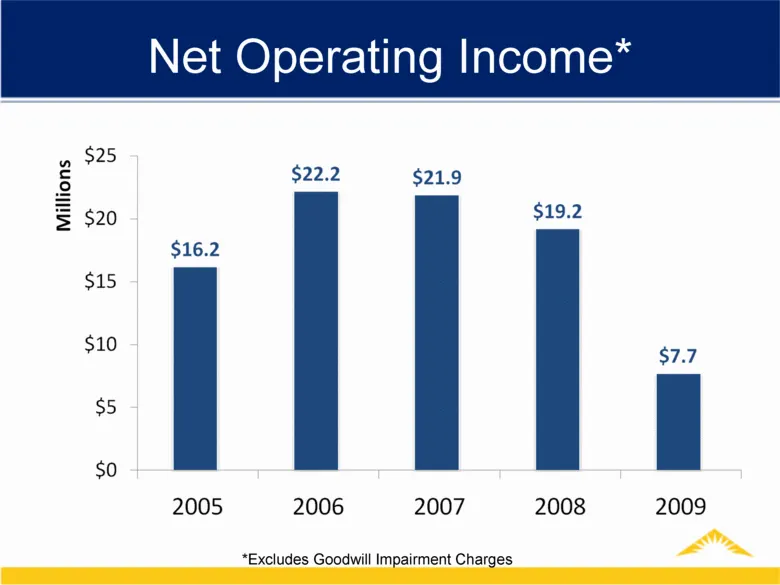
Net Operating Income* *Excludes Goodwill Impairment Charges
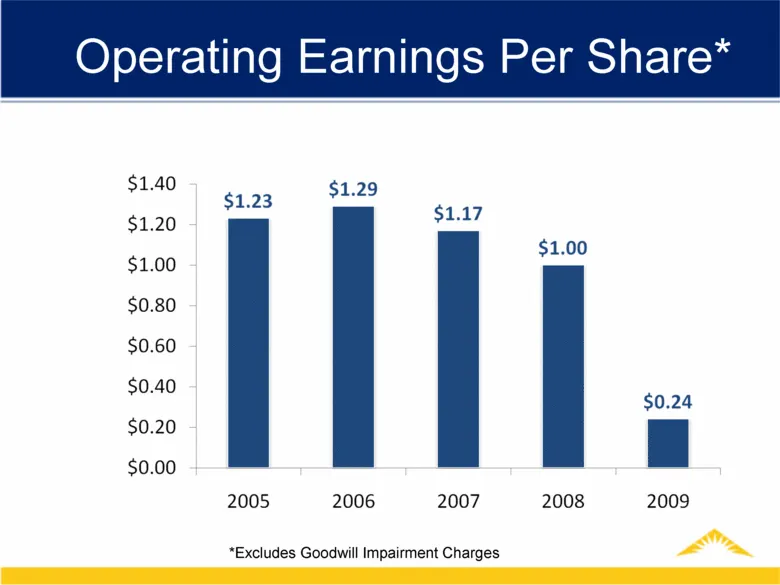
Slide 26: Operating Earnings Per Share
Operating Earnings Per Share* *Excludes Goodwill Impairment Charges
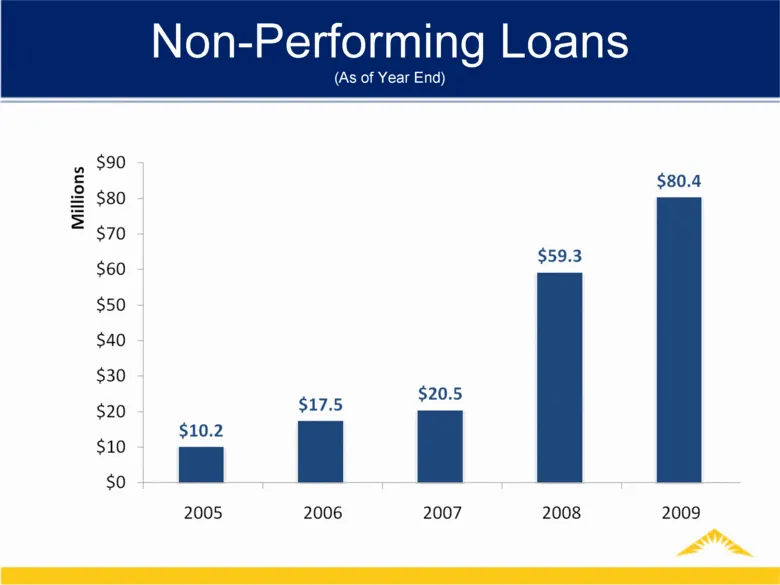
Slide 27: Non-Performing Loans (As of Year End)
Non-Performing Loans (As of Year End)
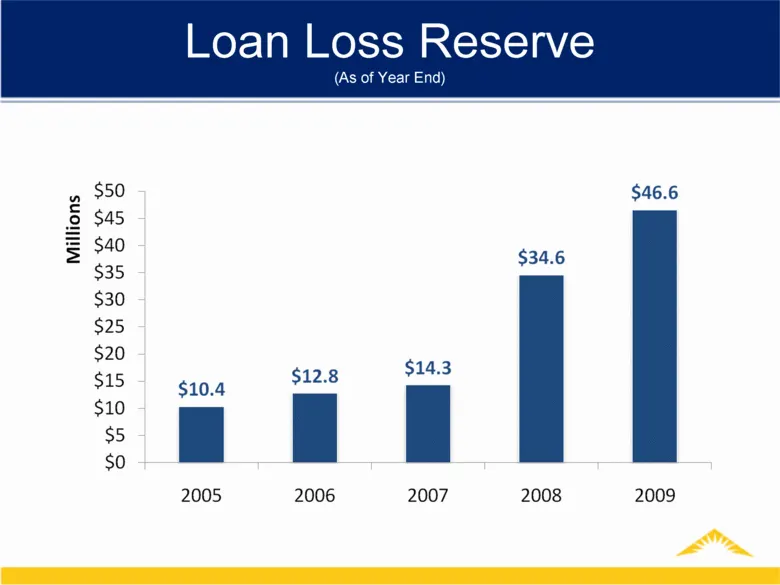
Slide 28: Loan Loss Reserve (As of Year End)
Loan Loss Reserve (As of Year End)
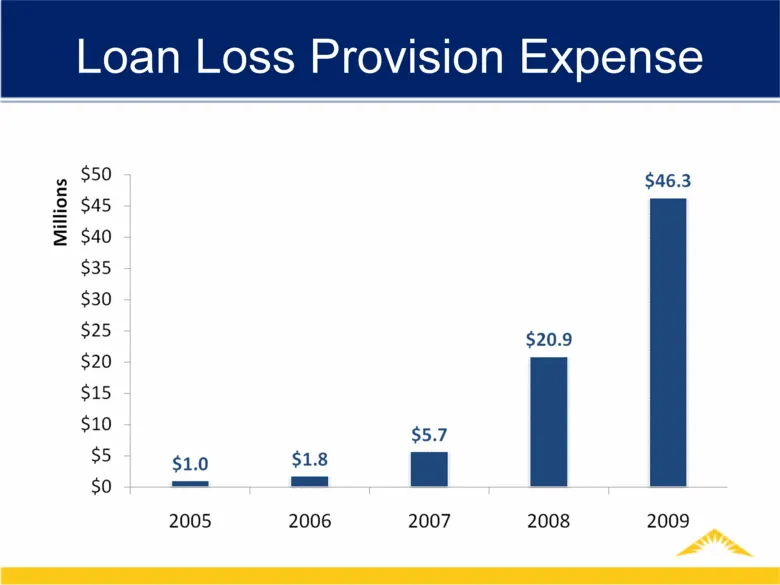
Slide 29: Loan Loss Provision Expense
ions Mill Loan Loss Provision Expense $50 $45 $40 $35 $30 $25 $20 $15 $10 $5 $0 $46.3 $20.9 $5.7 [ $1.8 — 2006 2007 2008 2009 Am
Slide 30: Net Revenue
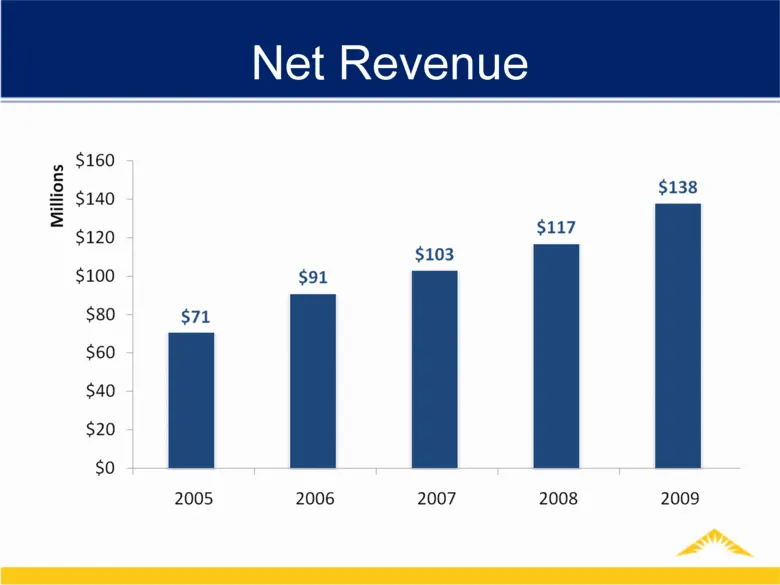
Net Revenue $160 $138 $140 $120 $117 $103 $100 $91 $80 $71 $60 $40 $20 $0 2005 2006 2007 2008 2009 Millions
Slide 31: Net Interest Margin
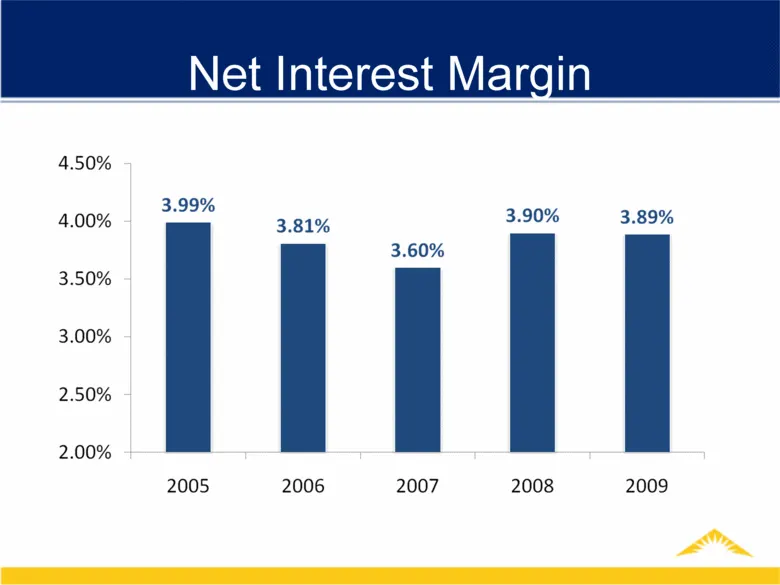
4.50% 4.00% 3.50% 3.00% 2.50% 2.00% Net Interest Margi 3.99% 2005 3.81% 2006 3.60% 2007 3.90% 2008 3.89% 2009
Slide 32: Non-Interest Income
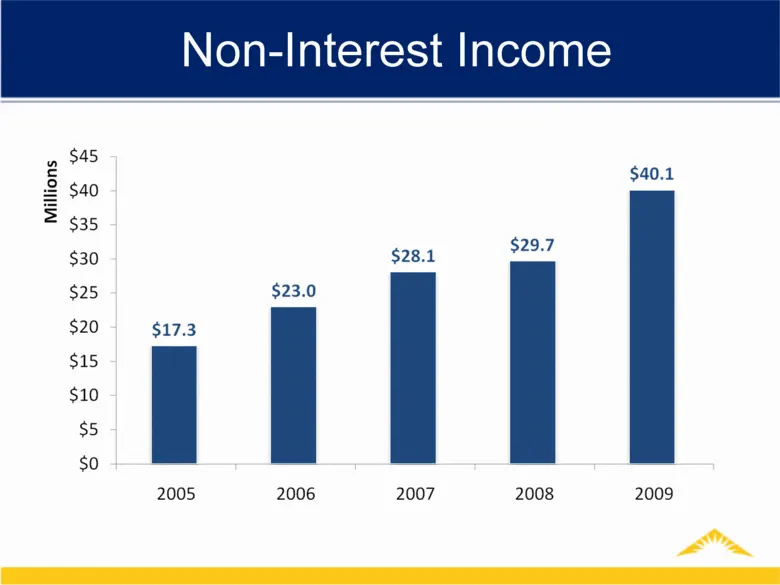
Millions unuunnnunon wou FPF ENN Gost S&2ounseaunsgausga Non-Interest Income $40.1 $28.1 $29.7 $23.0 $17.3 L 2005 2006 2007 2008 2009
Slide 33: Efficiency Ratio
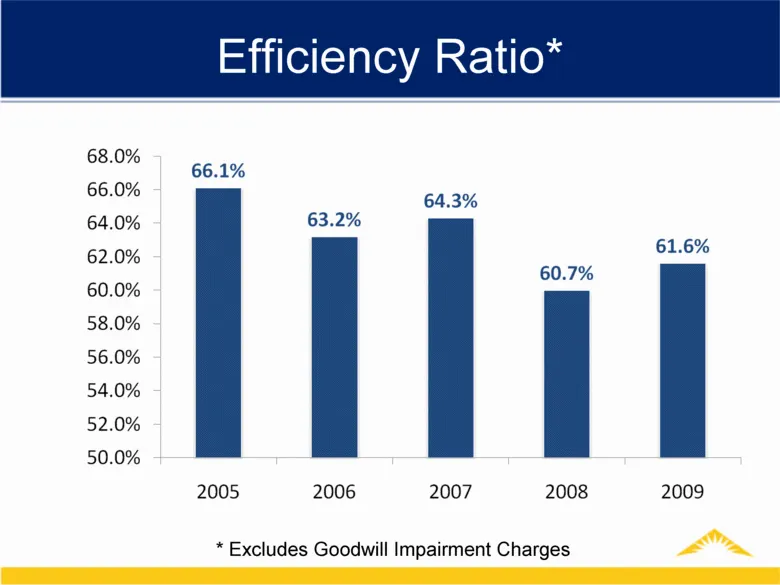
Efficiency Ratio* * Excludes Goodwill Impairment Charges
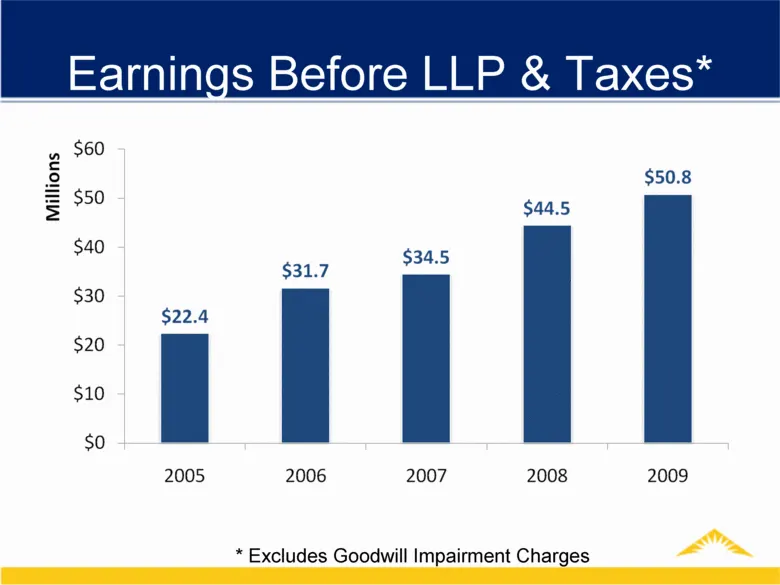
Slide 34: Earnings Before LLP & Taxes
Earnings Before LLP & Taxes* * Excludes Goodwill Impairment Charges
Slide 35: MainSource Financial Group NASDAQ Stock Symbol MSFG
MainSource Financial Group NASDAQ Stock Symbol MSFG
Slide 36: 2009 Stock Performance
2009 Stock Performance
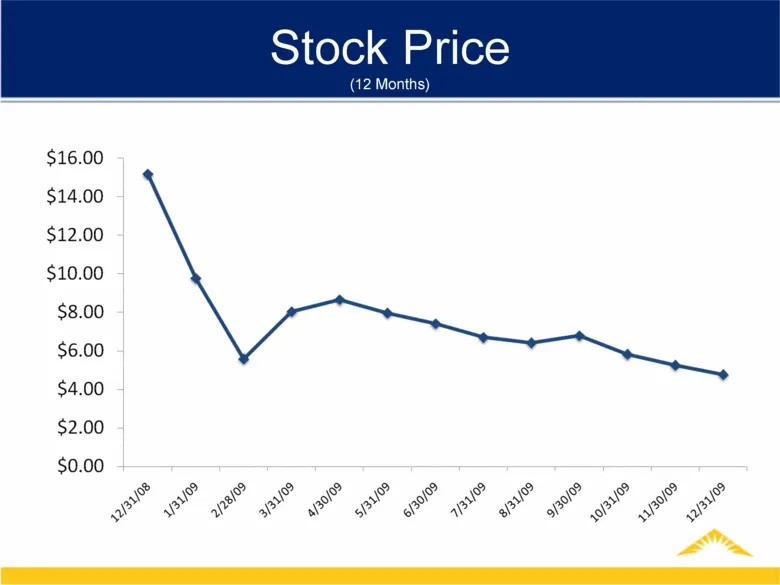
Slide 37: Stock Price (12 Months)
Stock Price (12 Months)
Slide 38: 2009 – April 23, 2010 Stock Performance
2009 – April 23, 2010 Stock Performance
Slide 39: Stock Price (15 Months)
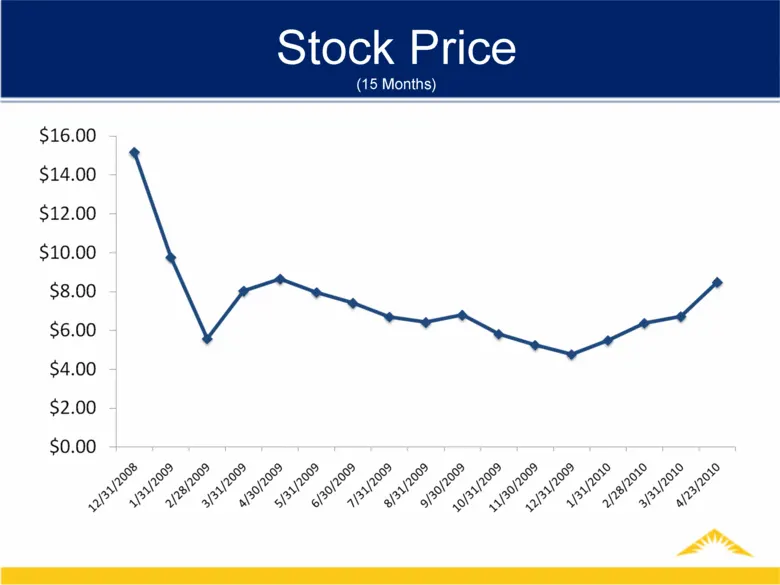
$16.00 $14.00 $12.00 $10.00 $8.00 $6.00 $4.00 $2.00 $0.00 Stock Price (15 Months) BP PF FF FF HF HF HF oF FP Ft FPP Pe x FF FF PF 8 FF oF Fer yr e ae
Slide 40: Factors Affecting Stock Price
Factors Affecting Stock Price
Slide 41: 2010 Outlook
2010 Outlook Archie M. Brown, Jr.
Slide 42: Credit Quality
Credit Quality
Slide 43: Indiana Unemployment Rate
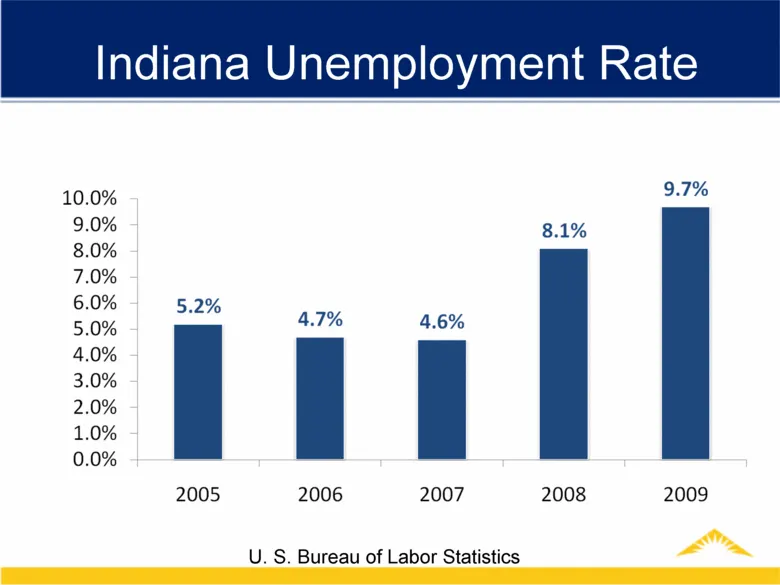
Indiana Unemployment Rate U. S. Bureau of Labor Statistics
Slide 44: New Home Sales - Midwest
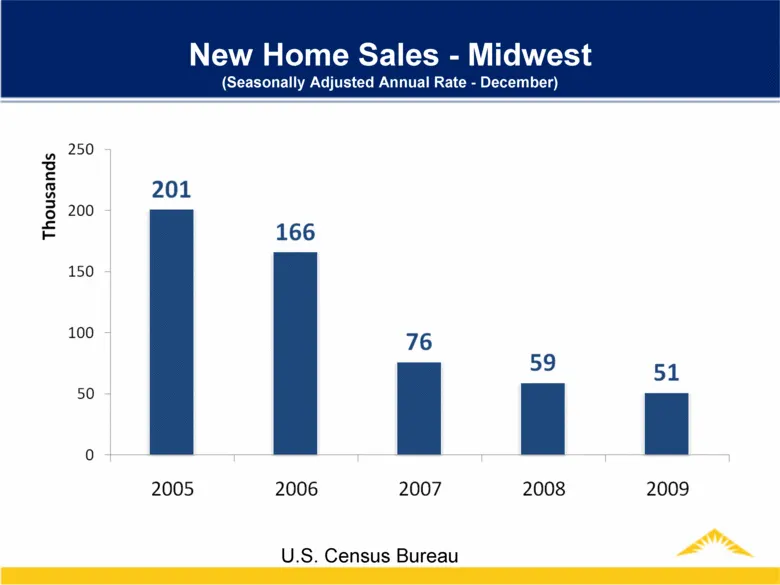
New Home Sales - Midwest (Seasonally Adjusted Annual Rate - December) U.S. Census Bureau
Slide 45: Months Supply – New Homes
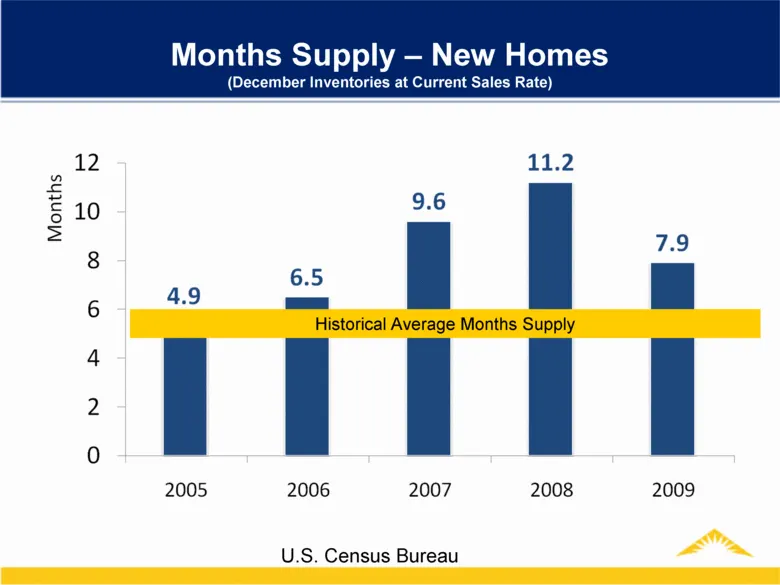
Months Supply – New Homes (December Inventories at Current Sales Rate) Historical Average Months Supply U.S. Census Bureau
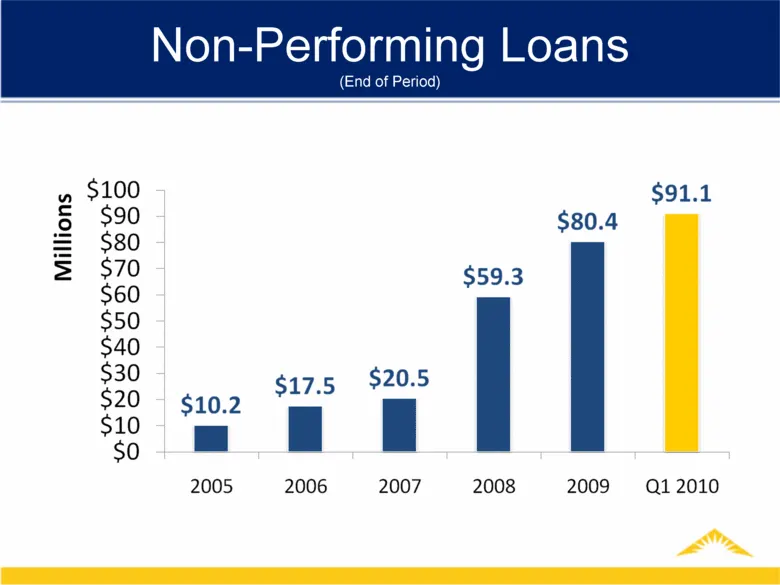
Slide 46: Non-Performing Loans (End of Period)
Non-Performing Loans (End of Period)
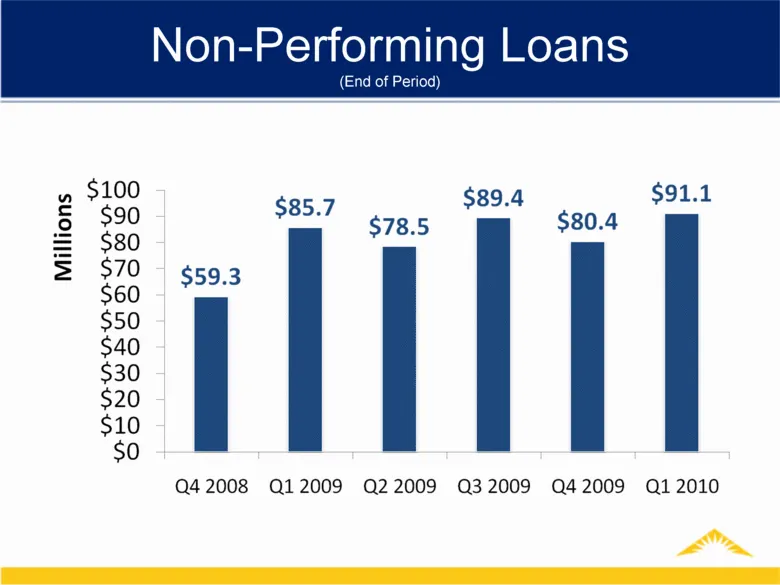
Slide 47: Non-Performing Loans (End of Period)
Non-Performing Loans (End of Period)
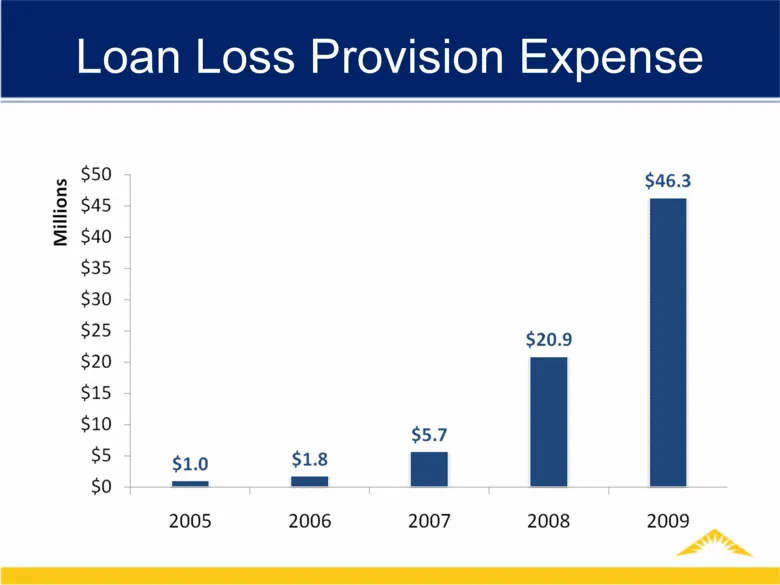
Slide 48: Loan Loss Provision Expense
ions Mill Loan Loss Provision Expense $50 $45 $40 $35 $30 $25 $20 $15 $10 $5 $0 $46.3 $20.9 $5.7 [ $1.8 — 2006 2007 2008 2009 Am
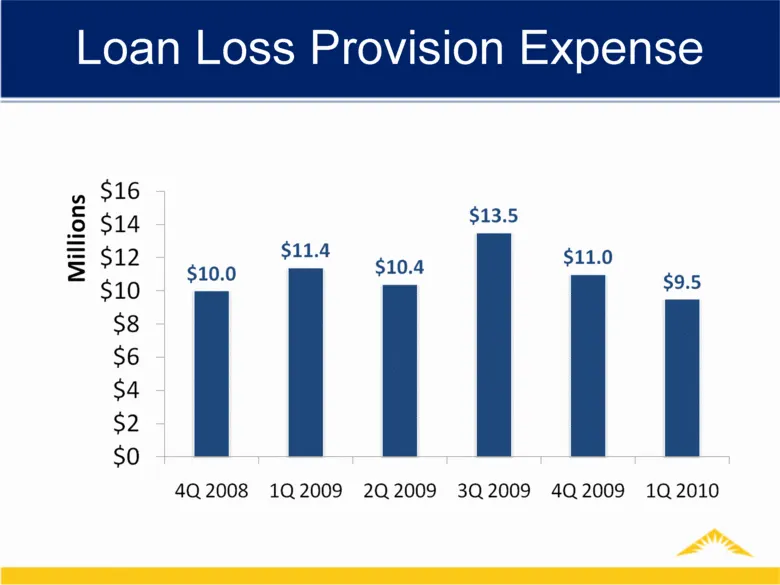
Slide 49: Loan Loss Provision Expense (Quarterly)
Loan Loss Provision Expense 5 $14 $13.5 $8 $6 $4 $2 so 40.2008 102009 2Q2009 3Q2009 4Q2009 1Q2010
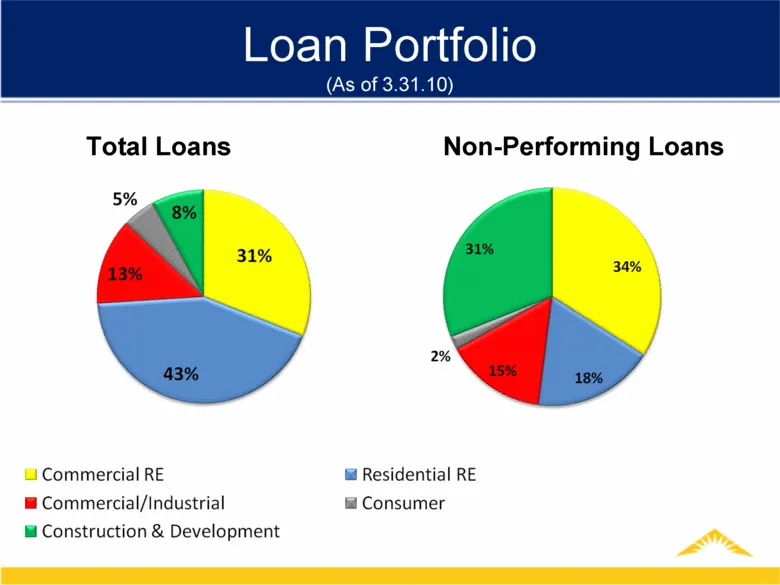
Slide 50: Loan Portfolio (As of 3.31.10)
Loan Portfolio (As of 3.31.10) Total Loans Non-Performing Loans
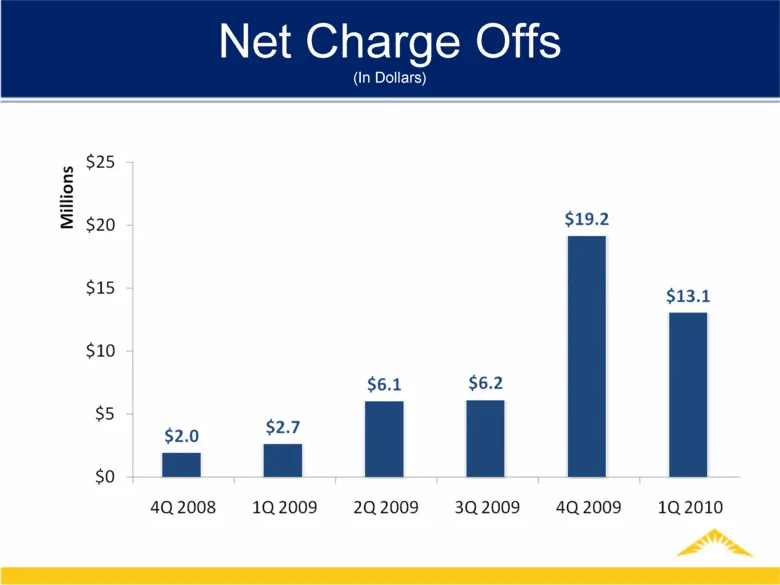
Slide 51: Net Charge Offs
Net Charge Offs (In Dollars) wn N a Millions $19.2 wn N 6 un a $13.1 wn =) $6.1 $6.2 = ia [| [ I 4Q 2008 1Q 2009 2Q2009 3Q 2009 4Q 2009 1Q 2010 un a wD oS
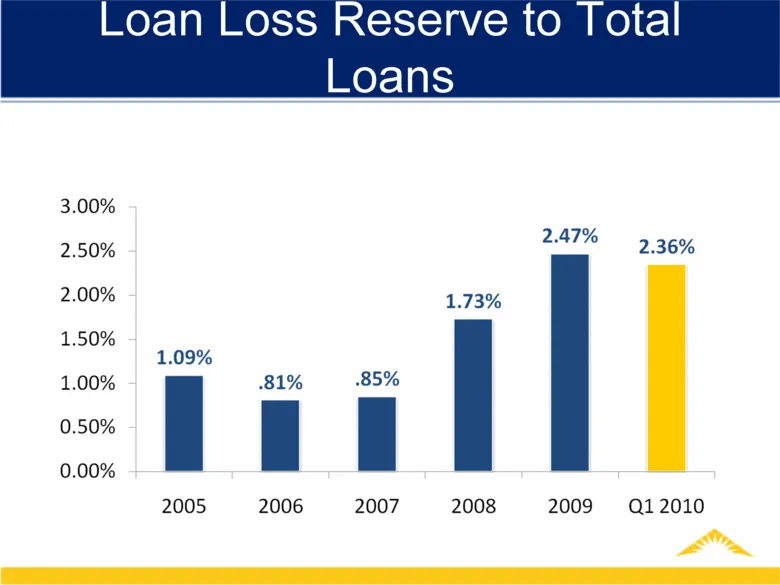
Slide 52: Loan Loss Reserve to Total Loans
Loan Loss Reserve to Total Loans (End of Period)
Slide 53: Credit Outlook
Credit Outlook
Slide 54: Dividend Information
Dividend Information
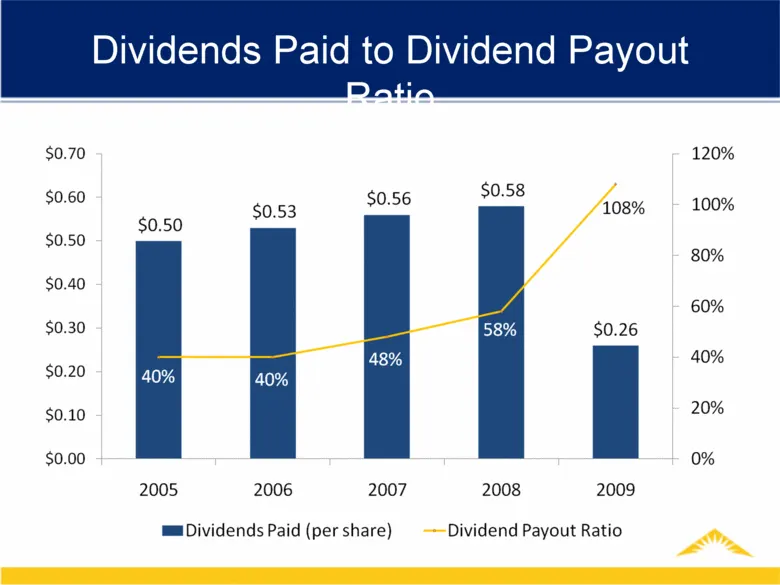
Slide 55: Dividends Paid to Dividend Payout Ratio
Dividends Paid to Dividend Payout Ratio
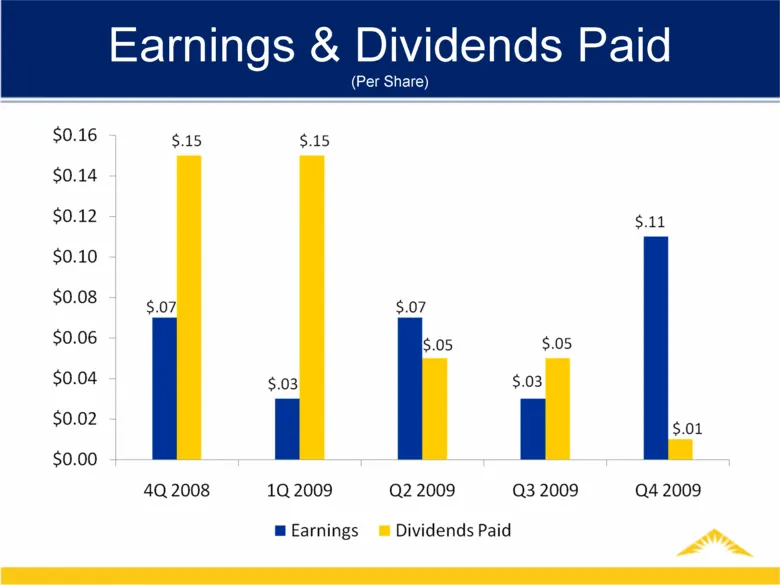
Slide 56: Earnings & Dividends Paid (Per Share)
Earnings & Dividends Paid (Per Share)
Slide 57: Dividend Outlook
Dividend Outlook
Slide 58: Capital Purchase Program Update
Capital Purchase Program Update
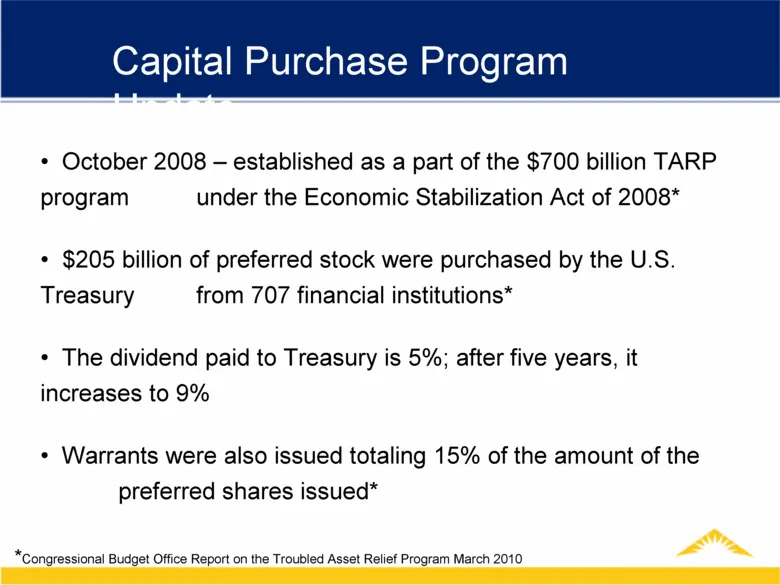
Slide 59: Capital Purchase Program Update
October 2008 – established as a part of the $700 billion TARP program under the Economic Stabilization Act of 2008* $205 billion of preferred stock were purchased by the U.S. Treasury from 707 financial institutions* The dividend paid to Treasury is 5%; after five years, it increases to 9% Warrants
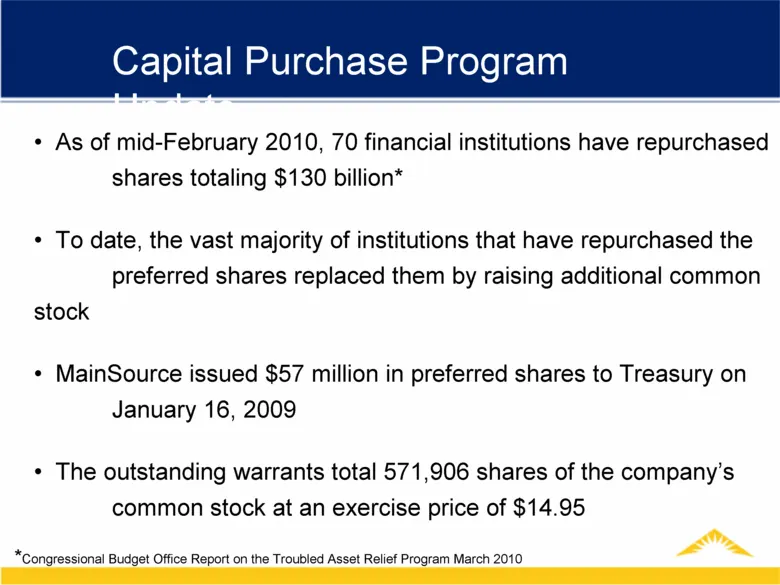
Slide 60: Capital Purchase Program Update
As of mid-February 2010, 70 financial institutions have repurchased shares totaling $130 billion* To date, the vast majority of institutions that have repurchased the preferred shares replaced them by raising additional common stock MainSource issued $57 million in preferred shares to Treasury on Ja
Slide 61: Capital Purchase Program - Plans for Repayment
Capital Purchase Program - Plans for Repayment
Slide 62: 2010 Strategic Priorities
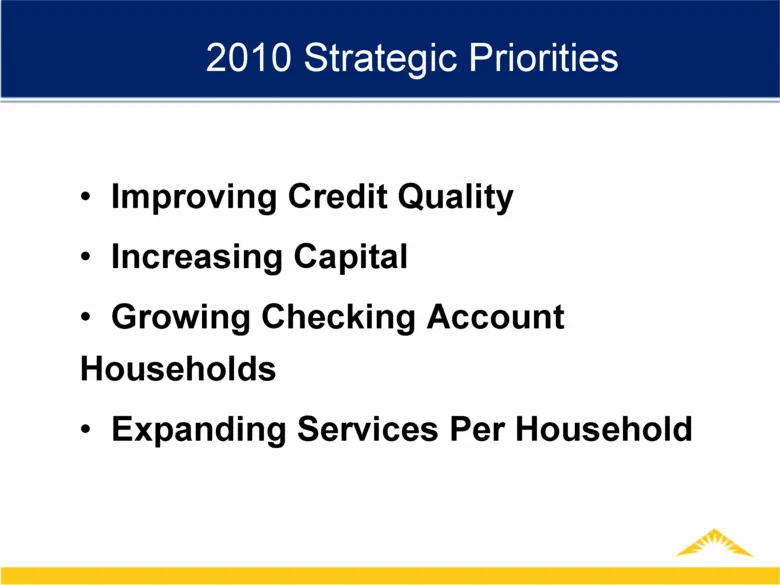
2010 Strategic Priorities Improving Credit Quality Increasing Capital Growing Checking Account Households Expanding Services Per Household
Slide 63: 2010 Strategic Priorities: Improving Credit Quality
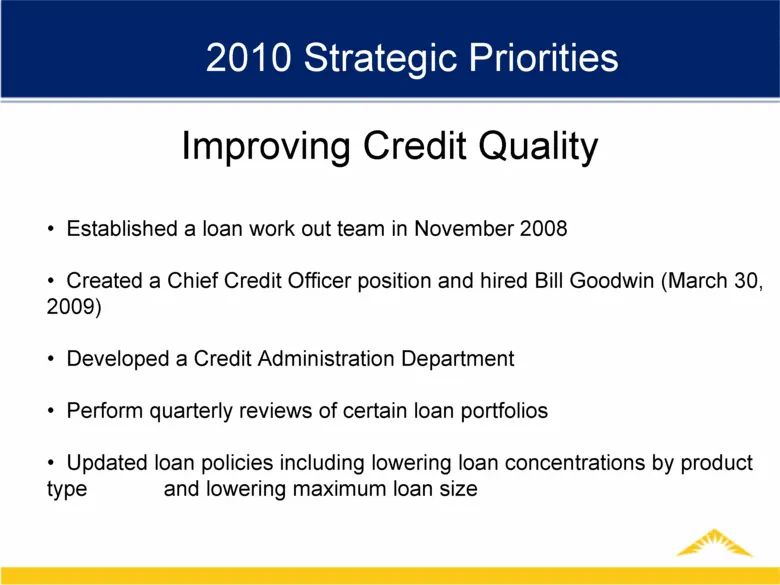
2010 Strategic Priorities Improving Credit Quality Established a loan work out team in November 2008 Created a Chief Credit Officer position and hired Bill Goodwin (March 30, 2009) Developed a Credit Administration Department Perform quarterly reviews of certain loan portfolios Updated loan policies
Slide 64: 2010 Strategic Priorities: Improving Credit Quality
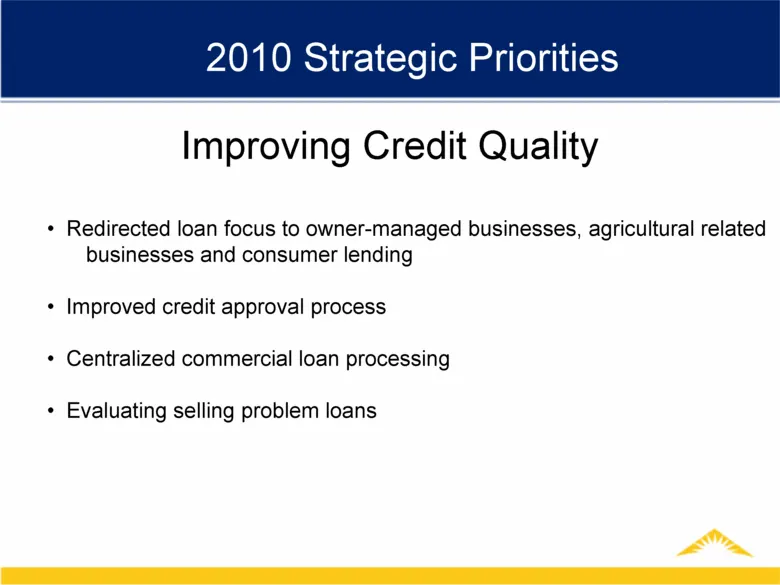
2010 Strategic Priorities Improving Credit Quality Redirected loan focus to owner-managed businesses, agricultural related businesses and consumer lending Improved credit approval process Centralized commercial loan processing Evaluating selling problem loans
Slide 65: 2010 Strategic Priorities: Increasing Capital
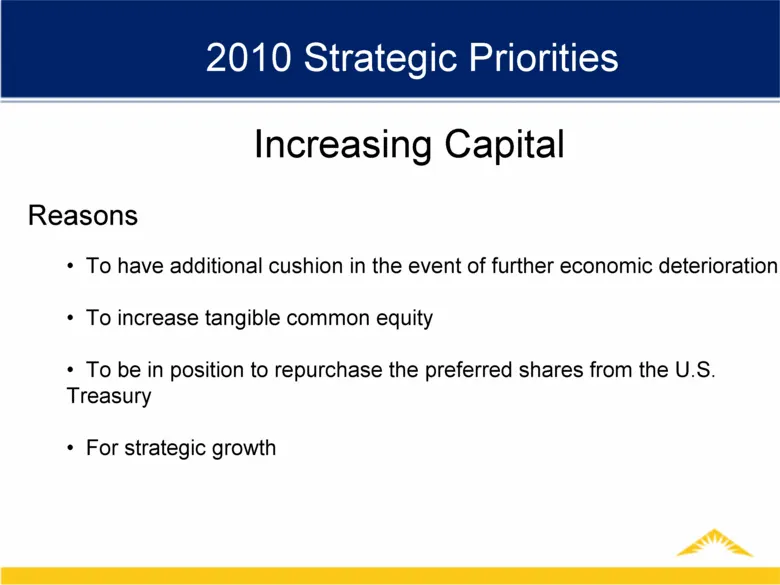
2010 Strategic Priorities Increasing Capital Reasons To have additional cushion in the event of further economic deterioration To increase tangible common equity To be in position to repurchase the preferred shares from the U.S. Treasury For strategic growth
Slide 66: 2010 Strategic Priorities: Increasing Capital
2010 Strategic Priorities Increasing Capital Actions to Increase Capital Reduced common stock quarterly dividend per share to $.01 (December 2009) Improve Earnings (Improve Credit Quality) Possible future capital raise (TBD)
Slide 67: 2010 Strategic Priorities: Checking Household Growth
2010 Strategic Priorities Checking Household Growth
Slide 68: 2010 Strategic Priorities: New Checking Accounts Opened
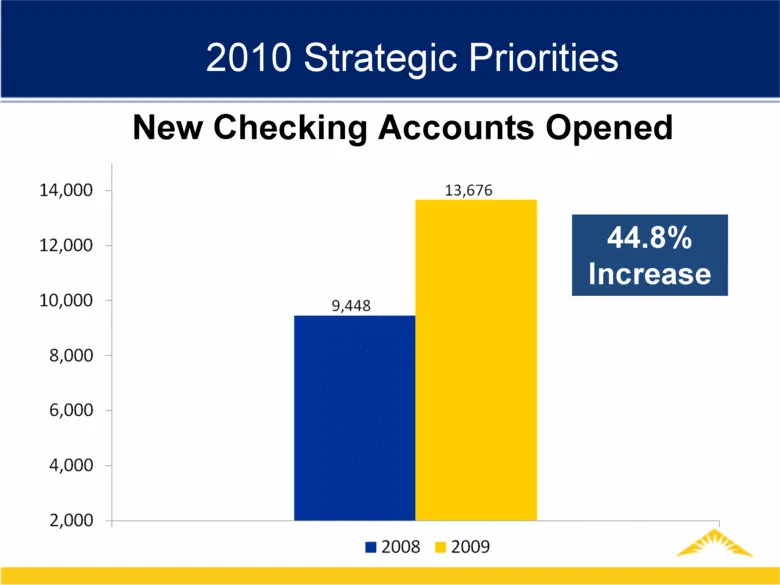
2010 Strategic Priorities 44.8% Increase New Checking Accounts Opened
Slide 69: 2010 Strategic Priorities: Checking Household Growth
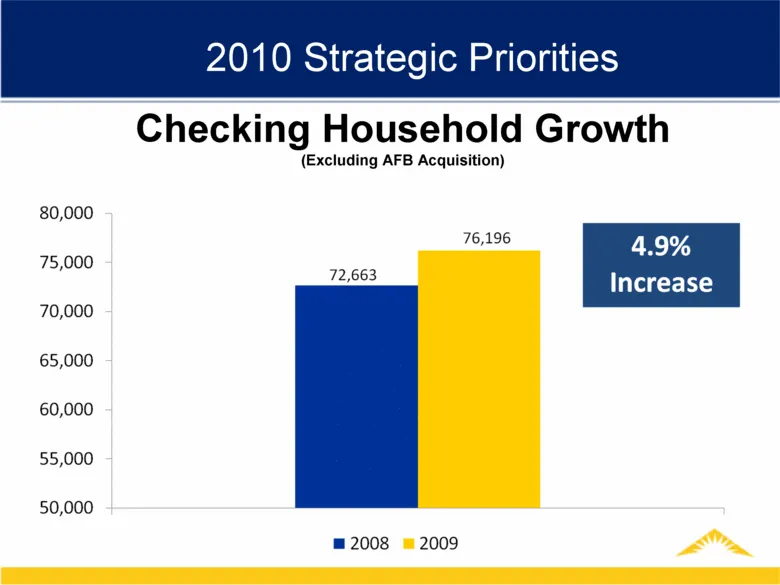
2010 Strategic Priorities Checking Household Growth (Excluding AFB Acquisition) 4.9% Increase 2008 2009
Slide 70: 2010 Strategic Priorities: Expanding Services Per Household
2010 Strategic Priorities Expanding Services Per Household
Slide 71: Questions
Questions
Slide 72: Non-GAAP Measures
Non-GAAP Measures This presentation contains certain financial information determined by methods other than in accordance with accepted accounting principles generally accepted in the United States (GAAP). Such non-GAAP financial measures include the following: operating net income (excluding goodwi
Slide 73: Non-GAAP Reconciliation
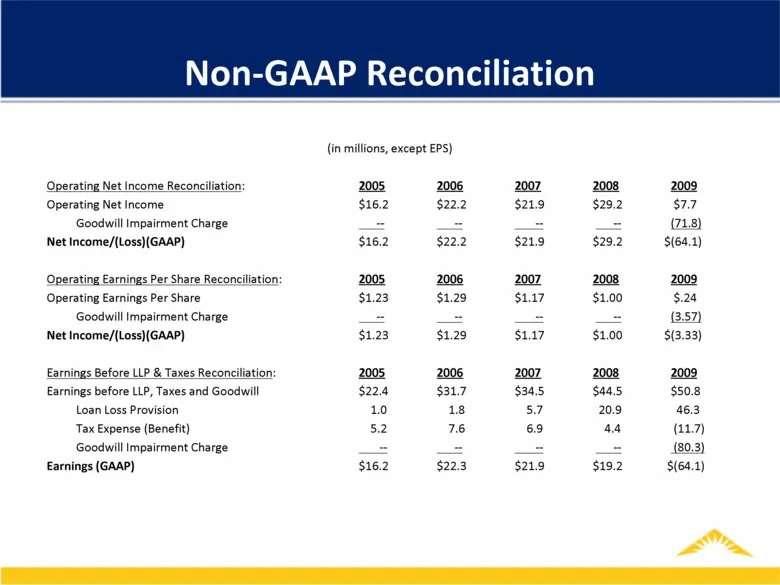
Non-GAAP Reconciliation (in millions, except EPS) Operating Net Income Reconciliation: 2005 2006 2007 2008 2009 Operating Net Income $16.2 $22.2 $21.9 $29.2 $7.7 Goodwill Impairment Charge -- -- -- -- (71.8) Net Income/(Loss)(GAAP) $16.2 $22.2 $21.9 $29.2 $(64.1) Operating Earnings Per Share Reconci

Slide 74: MainSource Financial Group
<M, MainSource FINANCIAL GROUP
Source: SEC EDGAR · 8-K filed Apr 29, 2010
More decks from MainSource Financial Group Inc
 Merger or Acquisition (October 2017)25 slides · Oct 31, 2017
 Merger or Acquisition (July 2017)23 slides · Jul 31, 2017
 Merger or Acquisition (July 2017)19 slides · Jul 26, 2017
 Shareholder Meeting (May 2017)67 slides · May 3, 2017
 Merger or Acquisition (December 2016)7 slides · Dec 19, 2016
 Investor Presentation (September 2016)34 slides · Sep 22, 2016