Approach Resources — KeyBanc Capital Markets Bus Tour (September 2011)
30 slides from Approach Resources's conference presentation, Sep 21, 2011
Slide 1: KeyBanc Capital Markets Bus Tour
KeyBanc Capital Markets Bus Tour SEPTEMBER 21, 2011
Slide 2: Forward-looking statements
Forward-looking statements This presentation contains forward-looking statements within the meaning of Section 27A of the Securities Act of 1933 and Section 21E of the Securities Exchange Act of 1934. All statements, other than statements of historical facts, included in this presentation that addre
Slide 3: AREX Overview and Asset Overview
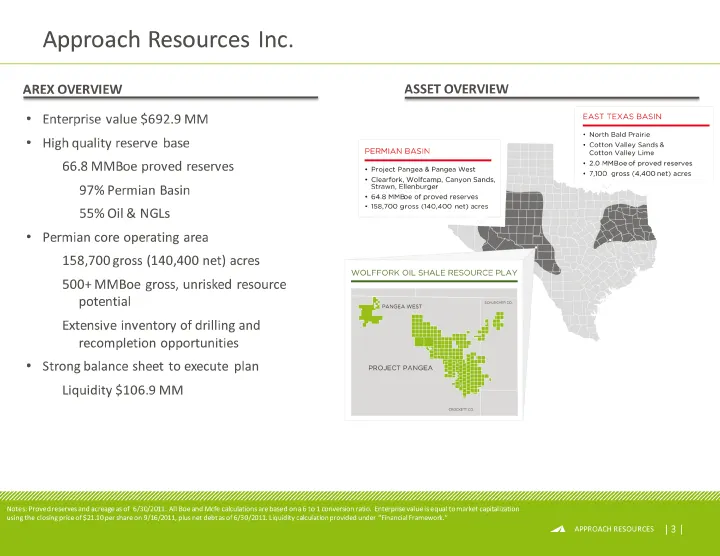
Approach Resources Inc. Notes: Proved reserves and acreage as of 6/30/2011. All Boe and Mcfe calculations are based on a 6 to 1 conversion ratio. Enterprise value is equal to market capitalization using the closing price of $21.10 per share on 9/16/2011, plus net debt as of 6/30/2011. Liquidity calc
Slide 4: Track Record of Reserve and Production Growth
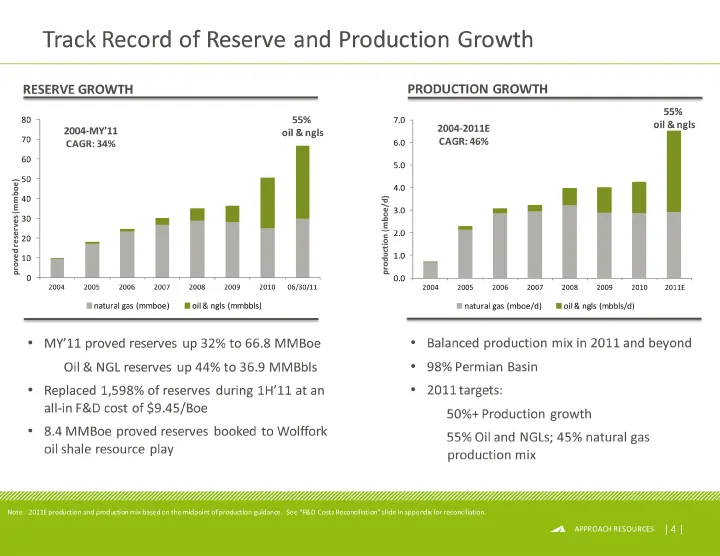
(CHART) (CHART) Note: 2011E production and production mix based on the midpoint of production guidance. See "F&D Costs Reconciliation" slide in appendix for reconciliation. Track Record of Reserve and Production Growth RESERVE GROWTH PRODUCTION GROWTH MY'11 proved reserves up 32% to 66.8 MMBoe Oil &
Slide 5: Permian Basin - World Class Petroleum Basin
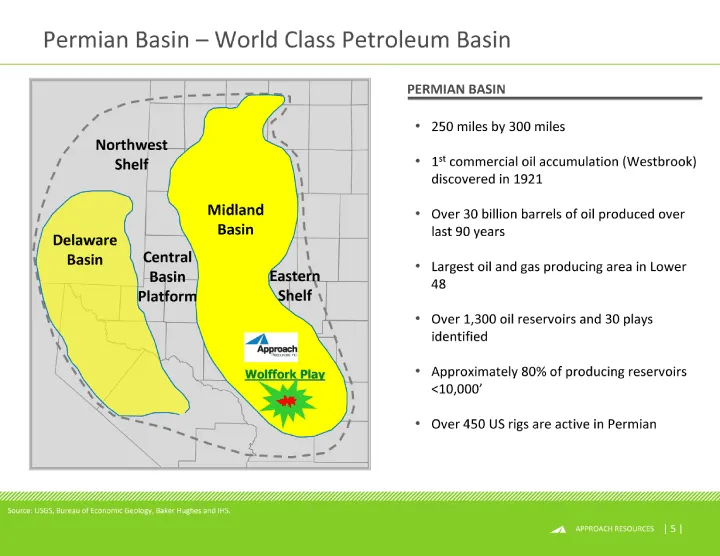
Midland Basin Delaware Basin Central Basin Platform Northwest Shelf Eastern Shelf Wolffork Play 250 miles by 300 miles 1st commercial oil accumulation (Westbrook) discovered in 1921 Over 30 billion barrels of oil produced over last 90 years Largest oil and gas producing area in Lower 48 Over 1,300 o
Slide 6: AREX Acreage Position - Favorably Located in the Permian Basin
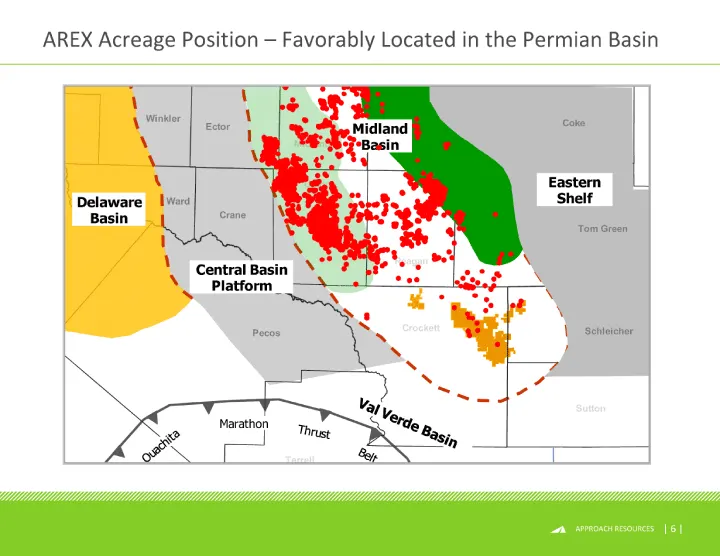
AREX Acreage Position - Favorably Located in the Permian Basin
Slide 7: AREX Acreage Position - Permian Basin
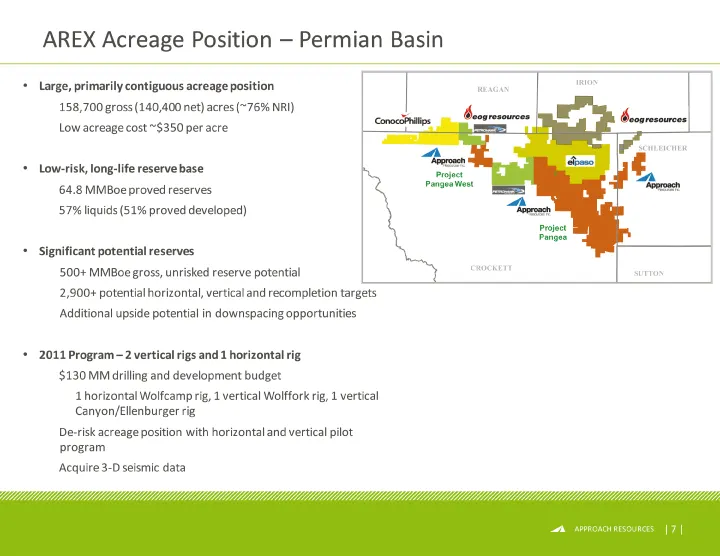
AREX Acreage Position - Permian Basin Large, primarily contiguous acreage position 158,700 gross (140,400 net) acres (~76% NRI) Low acreage cost ~$350 per acre Low-risk, long-life reserve base 64.8 MMBoe proved reserves 57% liquids (51% proved developed) Significant potential reserves 500+ MMBoe gro
Slide 8: Wolfcamp Shale Name Convention - Southern Midland Basin
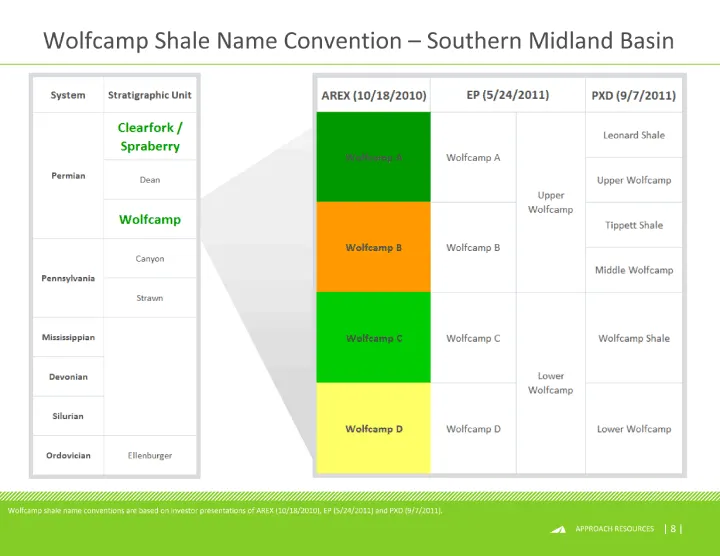
Wolfcamp Shale Name Convention - Southern Midland Basin Wolfcamp shale name conventions are based on investor presentations of AREX (10/18/2010), EP (5/24/2011) and PXD (9/7/2011).
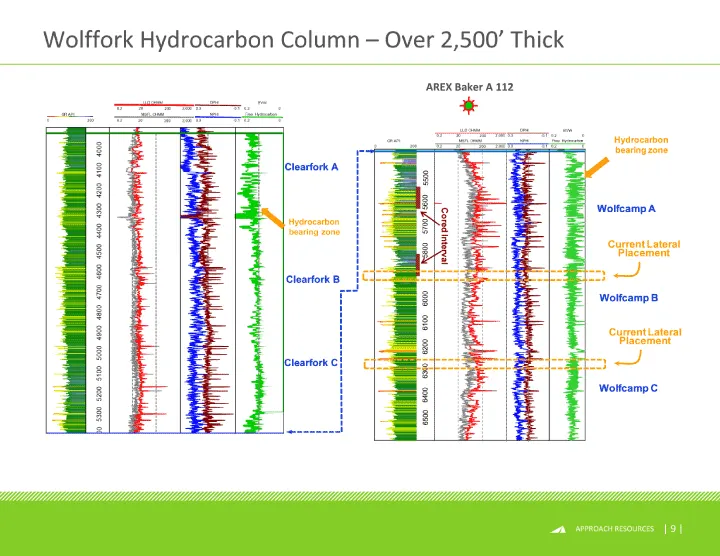
Slide 9: Wolffork Hydrocarbon Column - Over 2,500' Thick
Clearfork A Clearfork B Clearfork C Hydrocarbon bearing zone Wolffork Hydrocarbon Column - Over 2,500' Thick AREX Baker A 112
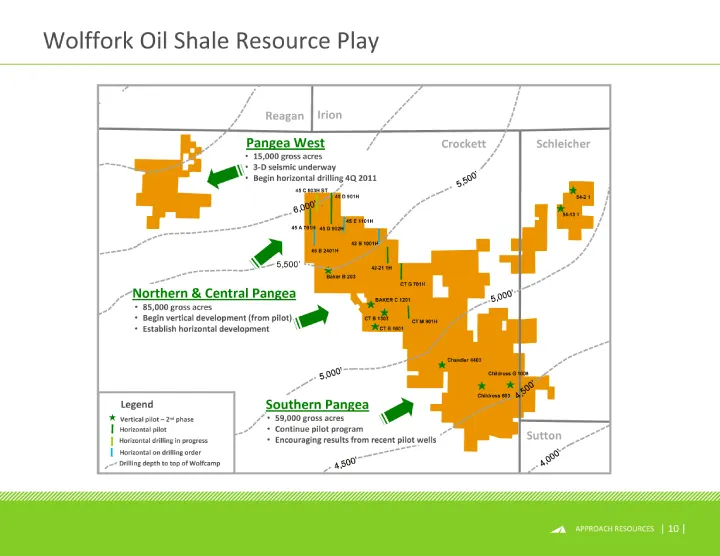
Slide 10: Wolffork Oil Shale Resource Play
Wolffork Oil Shale Resource Play Sutton Crockett Irion Reagan Schleicher Pangea West Northern & Central Pangea 59,000 gross acres Continue pilot program Encouraging results from recent pilot wells 85,000 gross acres Begin vertical development (from pilot) Establish horizontal development Southern Pa
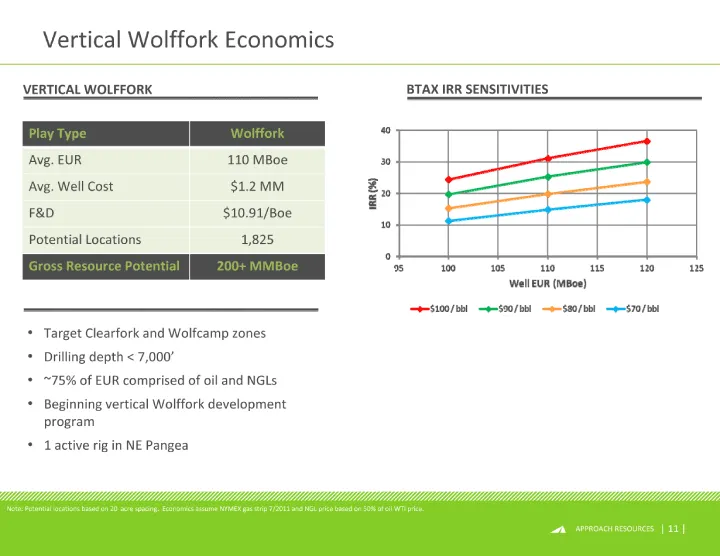
Slide 11: Vertical Wolffork Economics
Vertical Wolffork Economics Play Type Wolffork Avg. EUR 110 MBoe Avg. Well Cost $1.2 MM F&D $10.91/Boe Potential Locations 1,825 Gross Resource Potential 200+ MMBoe (CHART) VERTICAL WOLFFORK BTAX IRR SENSITIVITIES Note: Potential locations based on 20 acre spacing. Economics assume NYMEX gas strip 7
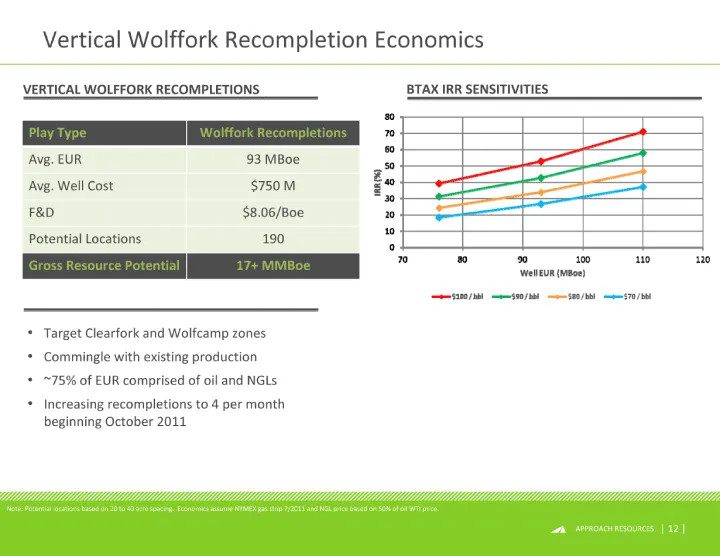
Slide 12: Vertical Wolffork Recompletion Economics
Vertical Wolffork Recompletion Economics Play Type Wolffork Recompletions Avg. EUR 93 MBoe Avg. Well Cost $750 M F&D $8.06/Boe Potential Locations 190 Gross Resource Potential 17+ MMBoe VERTICAL WOLFFORK RECOMPLETIONS BTAX IRR SENSITIVITIES Target Clearfork and Wolfcamp zones Commingle with existing
Slide 13: Vertical Wolffork Well Profile
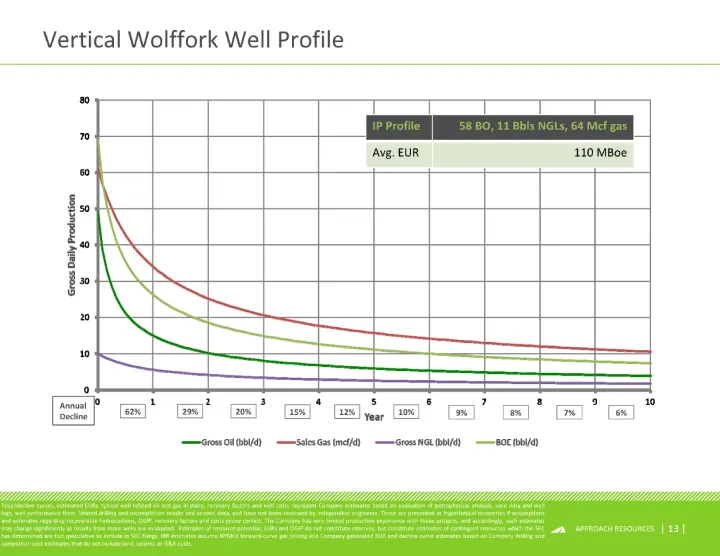
(CHART) Vertical Wolffork Well Profile Type/decline curves, estimated EURs, typical well related oil and gas in place, recovery factors and well costs represent Company estimates based on evaluation of petrophysical analysis, core data and well logs, well performance from limited drilling and recomp
Slide 14: Vertical Canyon Wolffork Economics
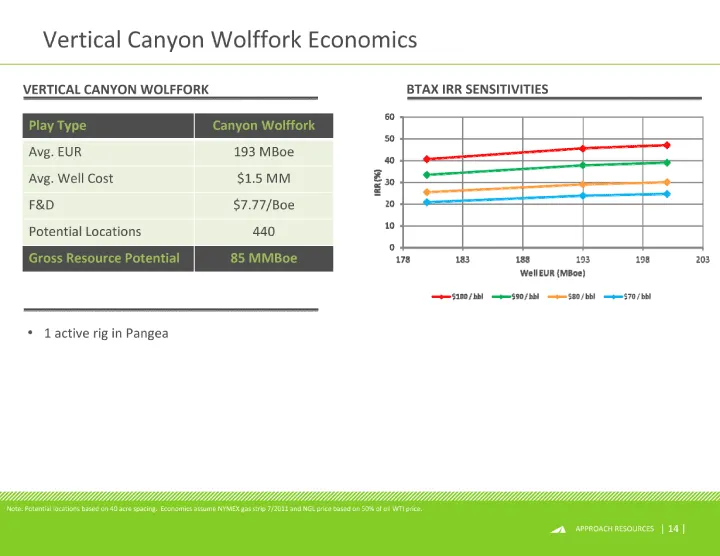
Vertical Canyon Wolffork Economics Play Type Canyon Wolffork Avg. EUR 193 MBoe Avg. Well Cost $1.5 MM F&D $7.77/Boe Potential Locations 440 Gross Resource Potential 85 MMBoe VERTICAL CANYON WOLFFORK BTAX IRR SENSITIVITIES Note: Potential locations based on 40 acre spacing. Economics assume NYMEX gas
Slide 15: Vertical Canyon Wolffork Well Profile
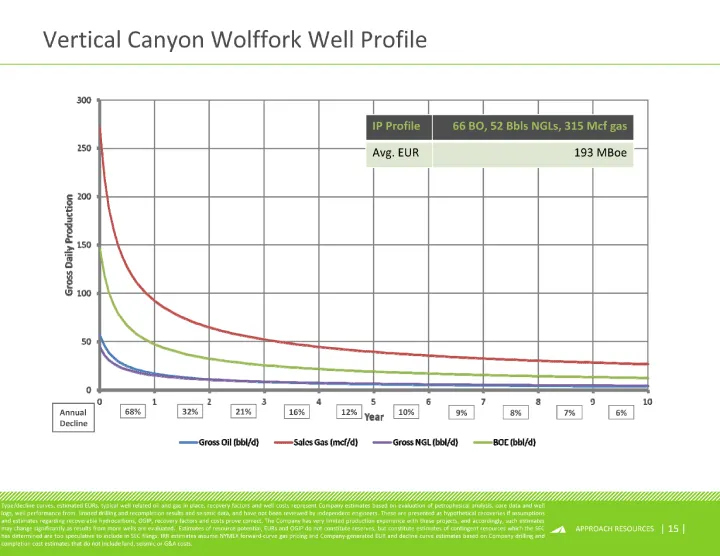
(CHART) Vertical Canyon Wolffork Well Profile Annual Decline 68% 32% 21% 16% 12% 10% 9% 8% 7% 6% Type/decline curves, estimated EURs, typical well related oil and gas in place, recovery factors and well costs represent Company estimates based on evaluation of petrophysical analysis, core data and we
Slide 16: Horizontal Wolfcamp - Enhancing Wolfcamp Value
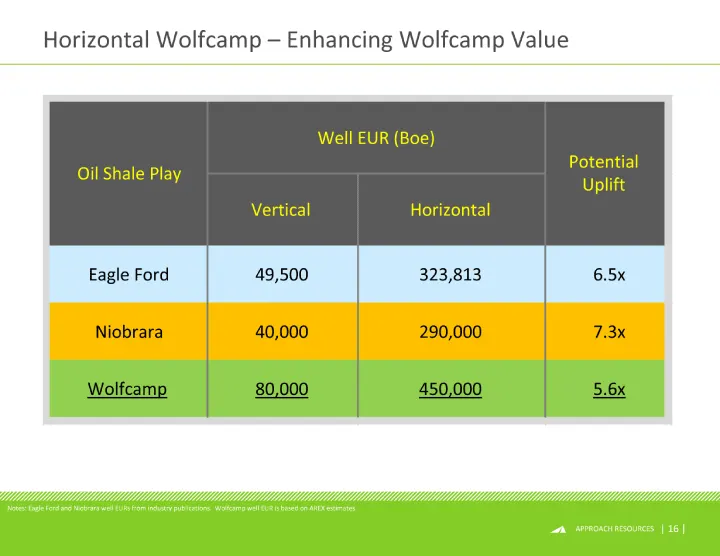
Vertical Horizontal Eagle Ford 49,500 323,813 6.5x Niobrara 40,000 290,000 7.3x Wolfcamp 80,000 450,000 5.6x Well EUR (Boe) Oil Shale Play Potential Uplift Notes: Eagle Ford and Niobrara well EURs from industry publications. Wolfcamp well EUR is based on AREX estimates. Horizontal Wolfcamp - Enhanci
Slide 17: Horizontal Wolfcamp Economics
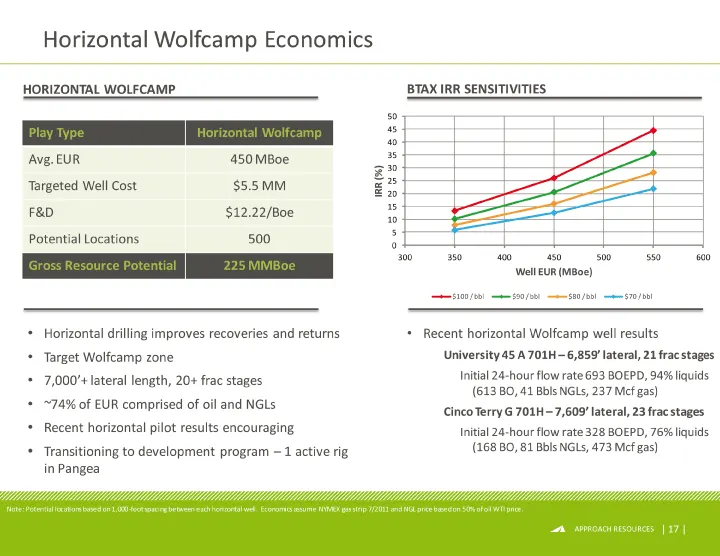
Horizontal Wolfcamp Economics Play Type Horizontal Wolfcamp Avg. EUR 450 MBoe Targeted Well Cost $5.5 MM F&D $12.22/Boe Potential Locations 500 Gross Resource Potential 225 MMBoe HORIZONTAL WOLFCAMP BTAX IRR SENSITIVITIES (CHART) Horizontal drilling improves recoveries and returns Target Wolfcamp zo
Slide 18: Horizontal Wolfcamp Well Profile
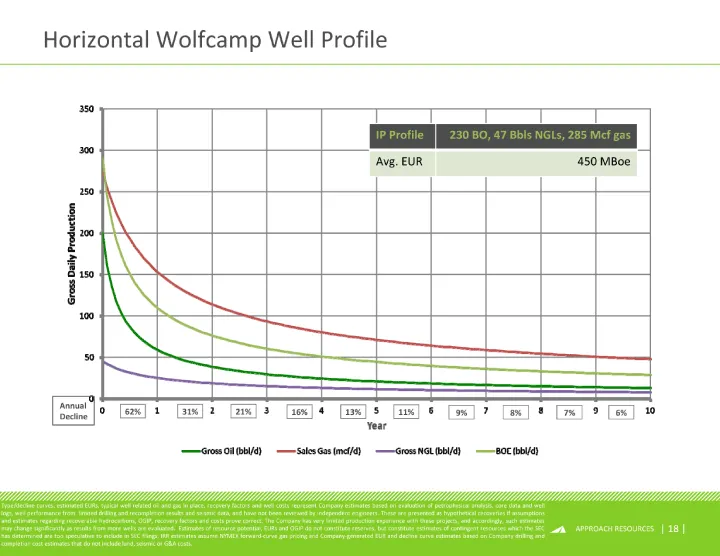
(CHART) Horizontal Wolfcamp Well Profile Annual Decline 62% 31% 21% 16% 13% 11% 9% 8% 7% 6% Type/decline curves, estimated EURs, typical well related oil and gas in place, recovery factors and well costs represent Company estimates based on evaluation of petrophysical analysis, core data and well lo
Slide 19: Summary - AREX Total Resource Potential
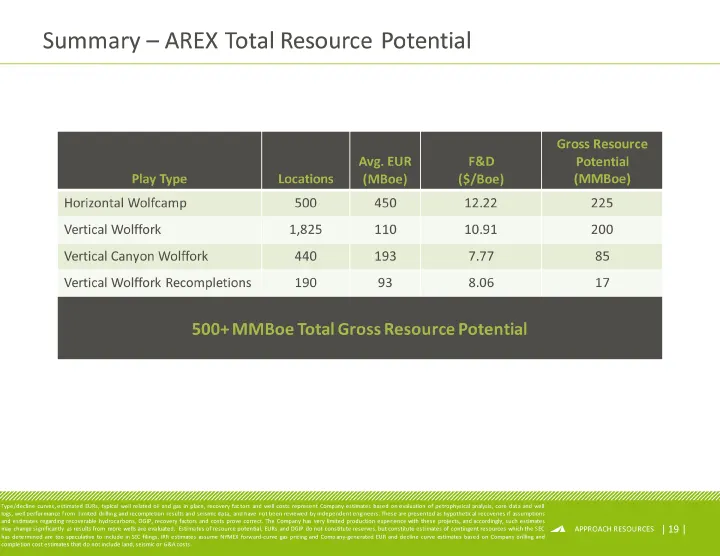
Summary - AREX Total Resource Potential Play Type Locations Avg. EUR (MBoe) F&D ($/Boe) Gross Resource Potential (MMBoe) Horizontal Wolfcamp 500 450 12.22 225 Vertical Wolffork 1,825 110 10.91 200 Vertical Canyon Wolffork 440 193 7.77 85 Vertical Wolffork Recompletions 190 93 8.06 17 500+ MMBoe Tota
Slide 20: Key Takeaways
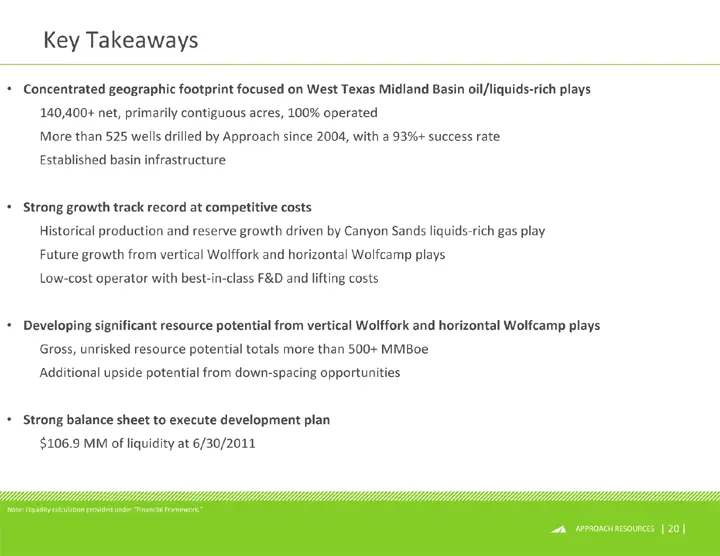
Concentrated geographic footprint focused on West Texas Midland Basin oil/liquids-rich plays 140,400+ net, primarily contiguous acres, 100% operated More than 525 wells drilled by Approach since 2004, with a 93%+ success rate Established basin infrastructure Strong growth track record at competitive
Slide 21: Financial Framework
i, Financial Framework YYyyyyyYYYYYYyYy§y§lyHbYVWJ
Slide 22: 2Q 2011 Highlights
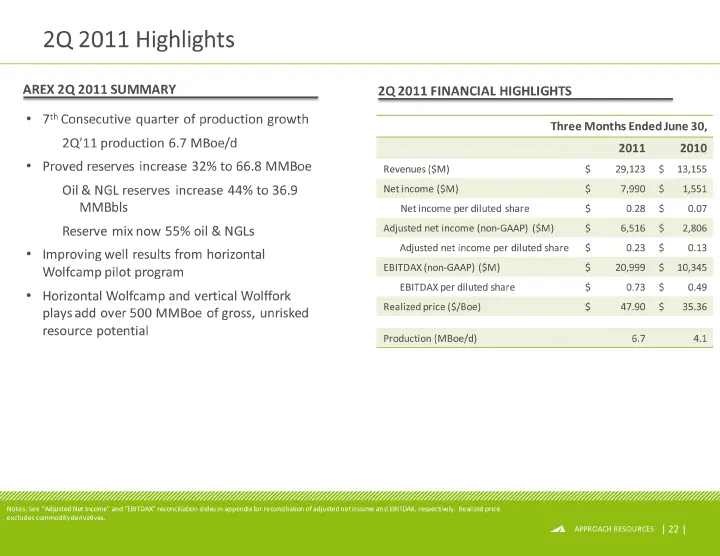
2Q 2011 Highlights 2Q 2011 FINANCIAL HIGHLIGHTS Three Months Ended June 30, Three Months Ended June 30, Three Months Ended June 30, Three Months Ended June 30, Three Months Ended June 30, 2011 2011 2010 2010 Revenues ($M) $ 29,123 $ 13,155 Net income ($M) $ 7,990 $ 1,551 Net income per diluted share
Slide 23: 2Q 2011 Operating Highlights
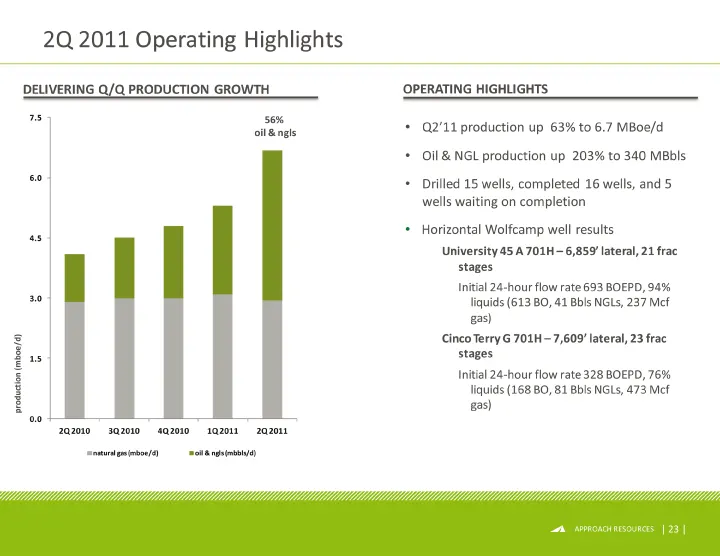
2Q 2011 Operating Highlights DELIVERING Q/Q PRODUCTION GROWTH OPERATING HIGHLIGHTS (CHART) production (mboe/d) 56% oil & ngls Q2'11 production up 63% to 6.7 MBoe/d Oil & NGL production up 203% to 340 MBbls Drilled 15 wells, completed 16 wells, and 5 wells waiting on completion Horizontal Wolfcamp we
Slide 24: Current 2011 Guidance
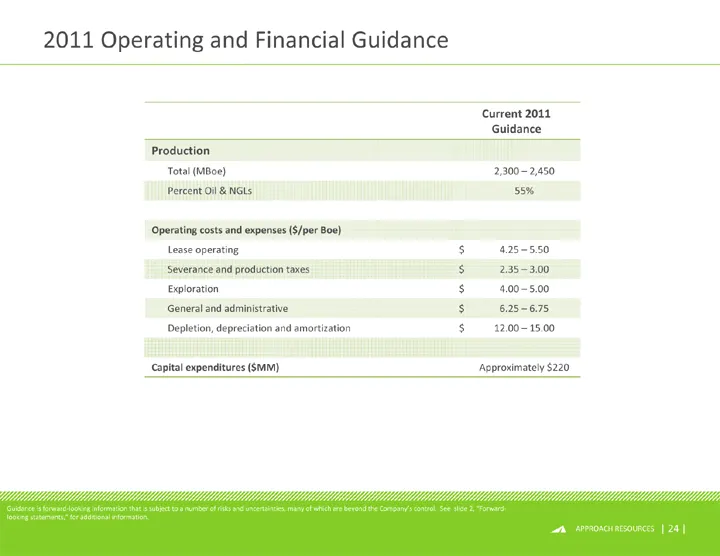
Current 2011 Guidance Current 2011 Guidance Current 2011 Guidance Current 2011 Guidance Production Total (MBoe) 2,300 - 2,450 2,300 - 2,450 2,300 - 2,450 Percent Oil & NGLs 55% 55% 55% Operating costs and expenses ($/per Boe) Lease operating $ 4.25 - 5.50 4.25 - 5.50 4.25 - 5.50 Severance and produc
Slide 25: 2011 Hedge Position
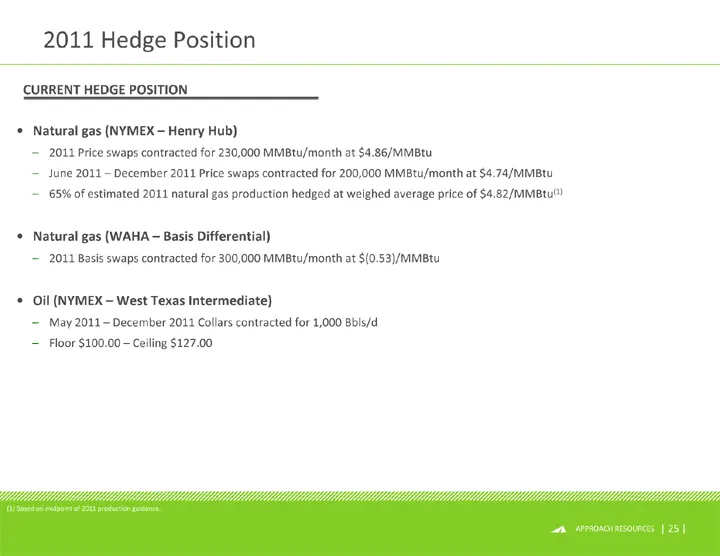
Natural gas (NYMEX - Henry Hub) 2011 Price swaps contracted for 230,000 MMBtu/month at $4.86/MMBtu June 2011 - December 2011 Price swaps contracted for 200,000 MMBtu/month at $4.74/MMBtu 65% of estimated 2011 natural gas production hedged at weighed average price of $4.82/MMBtu(1) Natural gas (WAHA
Slide 26: Liquidity at June 30, 2011
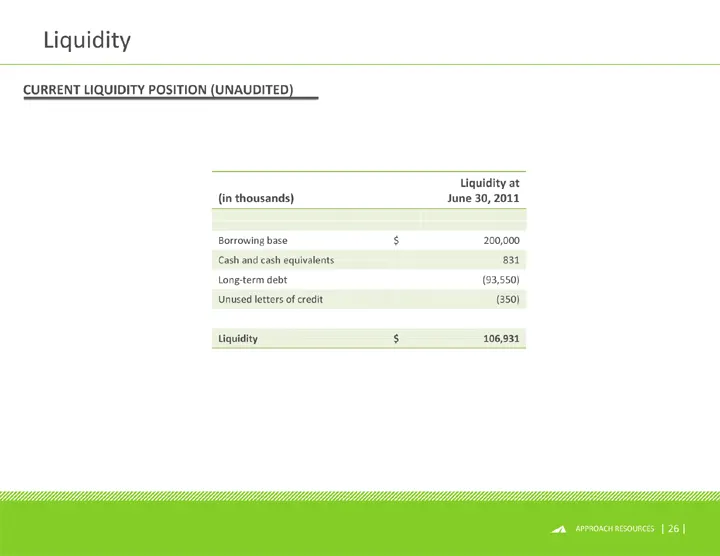
(in thousands) Liquidity at June 30, 2011 Liquidity at June 30, 2011 Borrowing base $ 200,000 Cash and cash equivalents 831 Long-term debt (93,550) Unused letters of credit (350) Liquidity $ 106,931 Liquidity CURRENT LIQUIDITY POSITION (UNAUDITED)
Slide 27: Appendix: Non-GAAP reconciliations
Appendix Non-gaap reconciliations
Slide 28: Adjusted Net Income Reconciliation
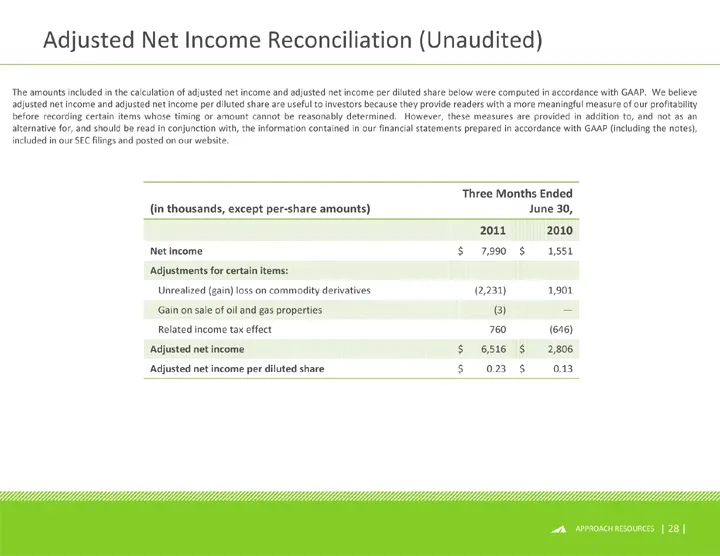
(in thousands, except per-share amounts) Three Months Ended June 30, Three Months Ended June 30, Three Months Ended June 30, Three Months Ended June 30, 2011 2011 2010 2010 Net income $ 7,990 $ 1,551 Adjustments for certain items: Unrealized (gain) loss on commodity derivatives (2,231) 1,901 Gain on
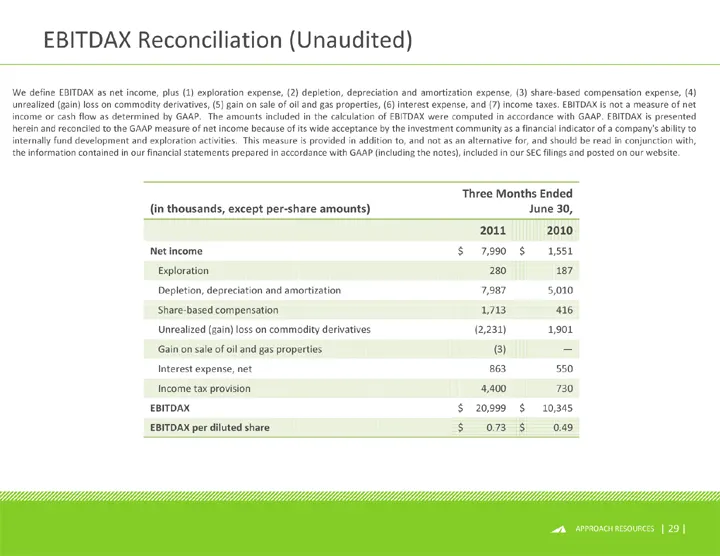
Slide 29: EBITDAX Reconciliation
We define EBITDAX as net income, plus (1) exploration expense, (2) depletion, depreciation and amortization expense, (3) share-based compensation expense, (4) unrealized (gain) loss on commodity derivatives, (5) gain on sale of oil and gas properties, (6) interest expense, and (7) income taxes. EBIT
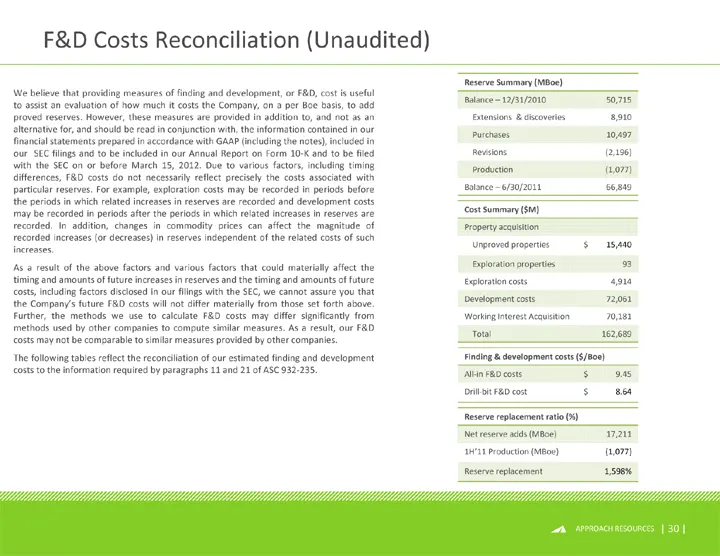
Slide 30: F&D Costs Reconciliation
We believe that providing measures of finding and development, or F&D, cost is useful to assist an evaluation of how much it costs the Company, on a per Boe basis, to add proved reserves. However, these measures are provided in addition to, and not as an alternative for, and should be read in conjun
Source: SEC EDGAR · 8-K filed Sep 21, 2011
More decks from Approach Resources Inc
 Investor Presentation (January 2017)46 slides · Jan 9, 2017
 Proxy Contest (January 2017)47 slides · Jan 5, 2017
 Investor Presentation (December 2016)45 slides · Dec 20, 2016
 Q3 2016 Earnings Presentation33 slides · Nov 3, 2016
 Q3 2015 Earnings Presentation19 slides · Nov 5, 2015
 Q2 2015 Earnings Presentation21 slides · Aug 6, 2015