Community Banks — Super Community Bank Conference Mid-Atlantic 2004
43 slides from Community Banks's conference presentation, Nov 5, 2004
Slide 1: A Common Name Delivering Uncommon Results
Exhibit 99.1 A Common Name Delivering Uncommon Results Super. Community Bank Conference Mid-Atlantic 2004 Super Community BANK CONFERENCE Mid-Atlantic 2004

Slide 2: Disclaimer
Disclaimer This presentation contains “forward looking” information, as defined by the Private Securities Litigation Reform Act of 1995, that is based on Community’s current expectations, estimates and projections about future events and financial trends affecting the financial condition of its busi
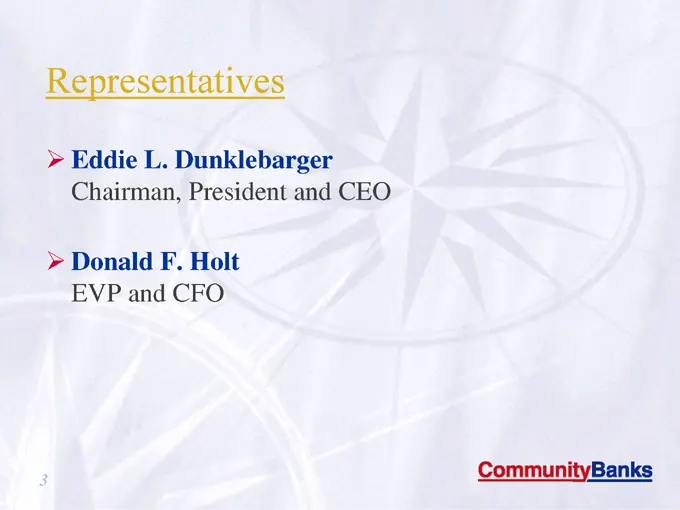
Slide 3: Representatives
Eddie L. Dunklebarger Chairman, President and CEO Donald F. Holt EVP and CFO Representatives
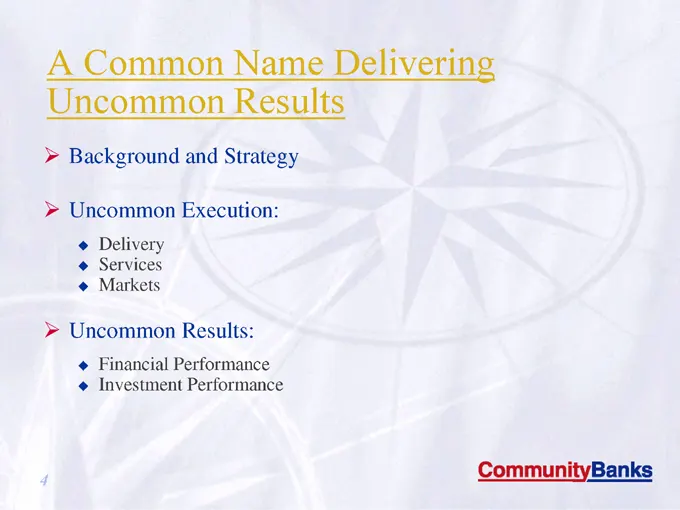
Slide 4: A Common Name Delivering Uncommon Results
A Common Name Delivering Uncommon Results Background and Strategy Uncommon Execution: Delivery Services Markets Uncommon Results: Financial Performance Investment Performance
Slide 5: Background and Strategy
Background and Strategy A Formula For Shareholder Value
Slide 6: CommunityBanks
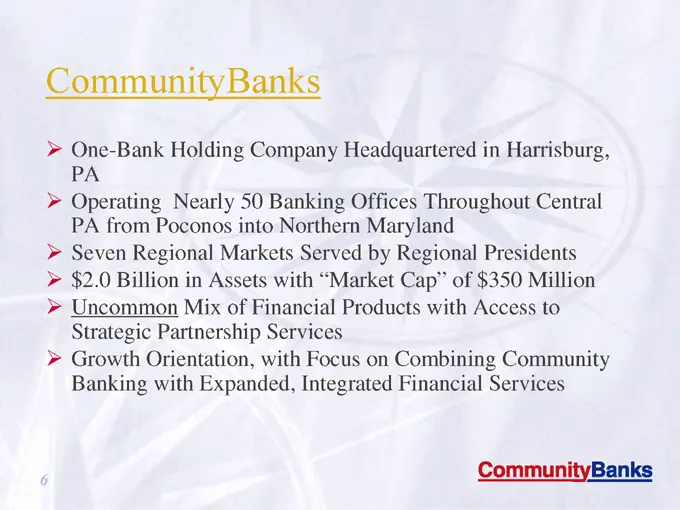
CommunityBanks One-Bank Holding Company Headquartered in Harrisburg, PA Operating Nearly 50 Banking Offices Throughout Central PA from Poconos into Northern Maryland Seven Regional Markets Served by Regional Presidents $2.0 Billion in Assets with “Market Cap” of $350 Million Mix of Financial Product
Slide 7: Our Business Model: Local People... Local Decisions
Background and Strategy Our Business Model: CommunityBanks Local People... Local Decisions®
Slide 8: Operating Principles
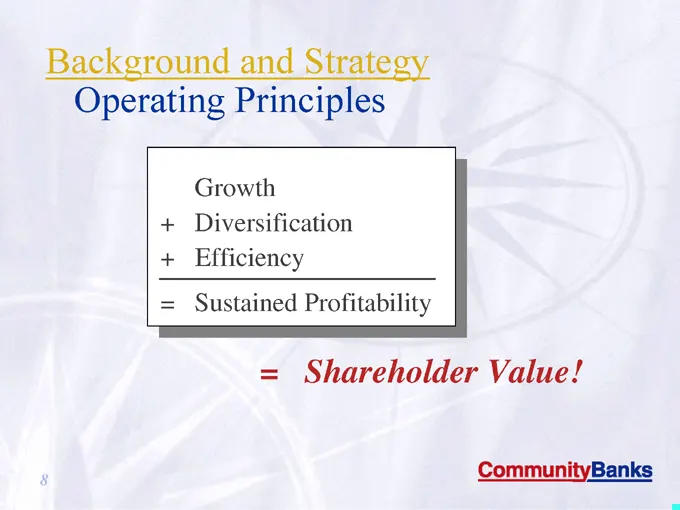
Background and Strategy Operating Principles = Shareholder Value! Growth + Diversification + Efficiency = Sustained Profitability
Slide 9: Performance Goals
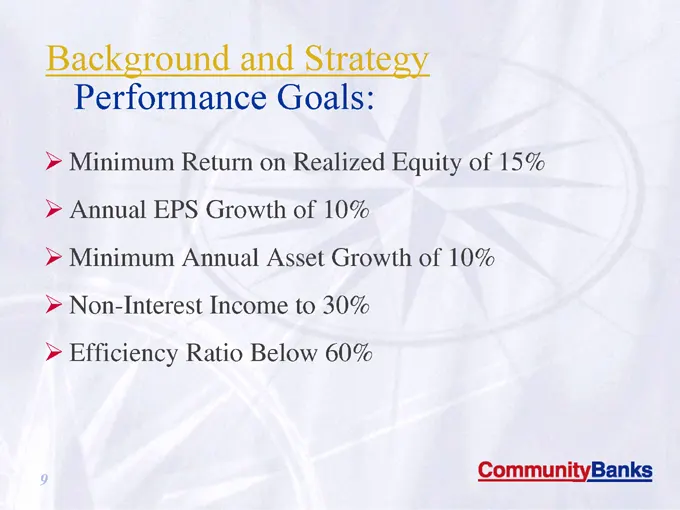
Background and Strategy Performance Goals: Minimum Return on Realized Equity of 15% Annual EPS Growth of 10% Minimum Annual Asset Growth of 10% Non-Interest Income to 30% Efficiency Ratio Below 60%
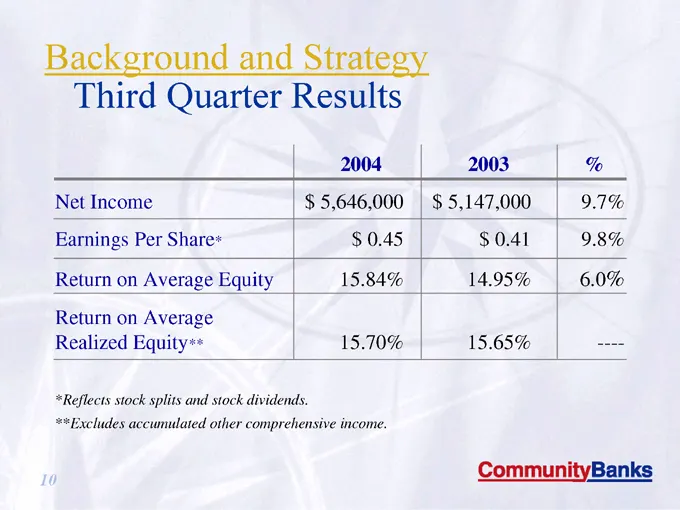
Slide 10: Third Quarter Results
Background and Strategy Third Quarter Results Net Income $ 5,646,000 $ 5,147,000 9.7% Earnings Per Share* $ 0.45 $ 0.41 9.8% Return on Average Equity 15.84% 14.95% 6.0% Return on Average Realized Equity** 15.70% 15.65% —— *Reflects stock splits and stock dividends. **Excludes accumulated other compr
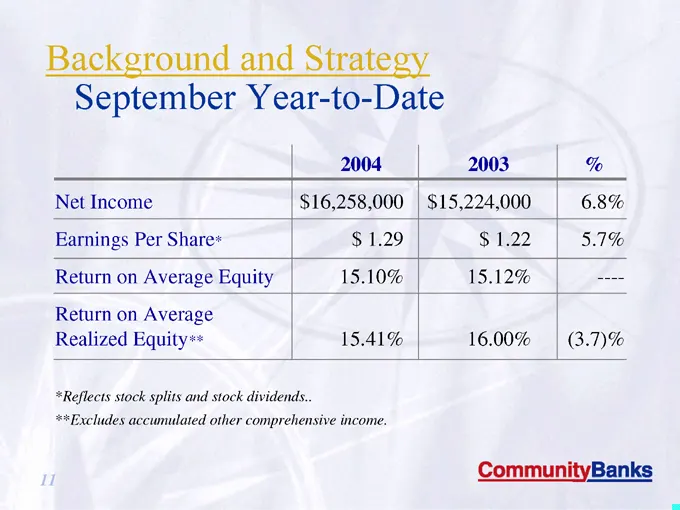
Slide 11: September Year-to-Date
Background and Strategy September Year-to-Date Net Income $16,258,000 $15,224,000 6.8% Earnings Per Share* $ 1.29 $ 1.22 5.7% Return on Average Equity 15.10% 15.12% —— Return on Average Realized Equity** 15.41% 16.00% (3.7)% *Reflects stock splits and stock dividends.. **Excludes accumulated other c

Slide 12: Execution: Uncommon Delivery
Execution Uncommon Delivery
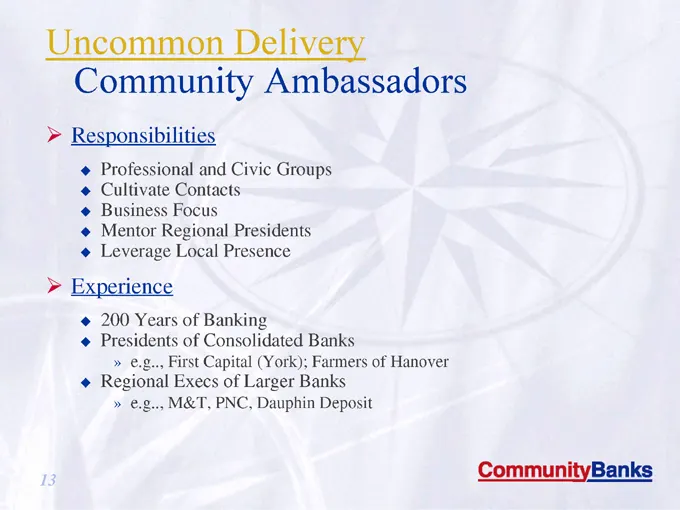
Slide 13: Delivery Community Ambassadors
Delivery Community Ambassadors Responsibilities Professional and Civic Groups Cultivate Contacts Business Focus Mentor Regional Presidents Leverage Local Presence Experience 200 Years of Banking Presidents of Consolidated Banks e.g.., First Capital (York); Farmers of Hanover Regional Execs of Larger
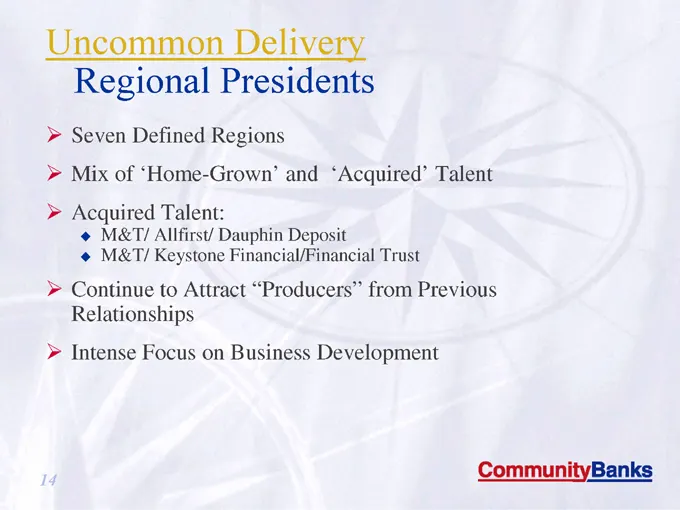
Slide 14: Delivery Regional Presidents
Delivery Regional Presidents Seven Defined Regions Mix of ‘Home-Grown’ and ‘Acquired’ Talent Acquired Talent: M&T/ Allfirst/ Dauphin Deposit M&T/ Keystone Financial/Financial Trust Continue to Attract “Producers” from Previous Relationships Intense Focus on Business Development
Slide 15: Delivery Integrated Businesses
Delivery Integrated Businesses Title Insurance ABCO (4/03) Combined Three Franchises Insurance Agency Shultz (6/03) Your Insurance Partner (9/03) Mortgage Origination Erie Financial Group (7/03) Doubled Origination Capacity to Over $200 million Investment Product Sales Annuities Brokerage
Slide 16: Delivery The Bryn Mawr 'Alliance'
Delivery The Bryn Mawr ‘Alliance’ Financial Management Services for over 100 years $1.86 Billion Assets Under Management Bryn Mawr Providing Investment Management Services for Trusts, Investment Management Accounts, and Other Professionally Managed Accounts Community Owns the Assets, Administer the

Slide 17: Execution: Uncommon Markets
Execution > Uncommon Markets CommunityBanks
Slide 18: Markets Our Expanding Franchise
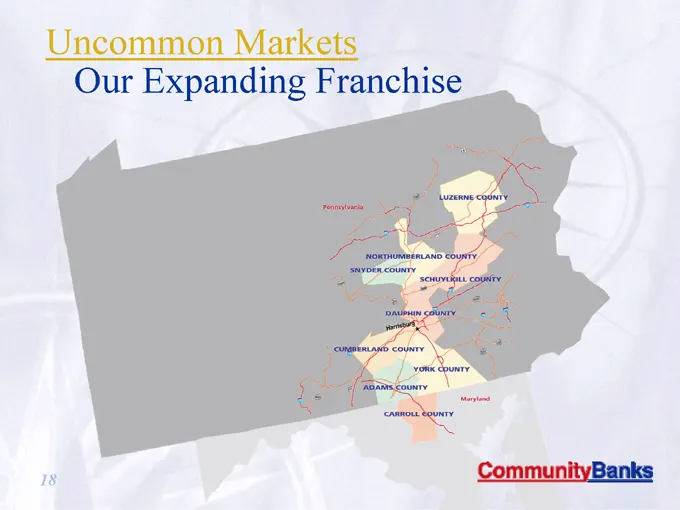
Markets Our Expanding Franchise
Slide 19: Markets Franchise Summary
Markets Franchise Summary York/Adams Counties (20 Offices) 2nd Fastest-Growing Urban Pennsylvania Market Adams – Growth Rates in Excess of 10% Dauphin/Cumberland Counties (12 Offices) Strong in Northern Dauphin Harrisburg/West Shore Focus Schuylkill/Luzerne/Northumberland/Snyder (13 Offices) Stable,
Slide 20: Markets Organic Growth
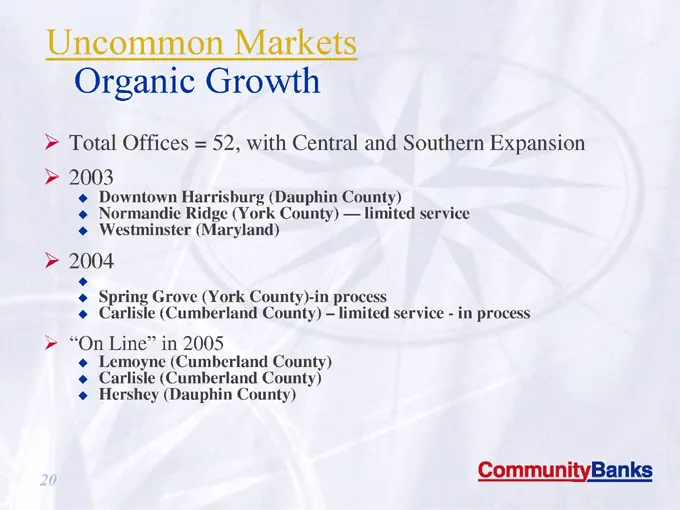
Markets Organic Growth Total Offices = 52, with Central and Southern Expansion Downtown Harrisburg (Dauphin County) Normandie Ridge (York County) — limited service Westminster (Maryland) Dillsburg (York County) Spring Grove (York County)-in process Carlisle (Cumberland County) – limited service—in p
Slide 21: Markets Disruption & Opportunity
Markets Disruption & Opportunity Core Markets: Allfirst/M&T Bank Waypoint/ Sovereign Marketing Effort Expanded Media Staffing Expand Presence in Higher Potential Markets Affected by ‘Disruption’ Solidify Presence in Established Markets as Larger Banks Lose “Localness”

Slide 22: Execution: Uncommon Services
Execution Uncommon Services
Slide 23: Services Overdraft Privilege
Services Overdraft Privilege Enrolled 2/3 of Existing Deposit Customers Usage Increases with Familiarity Vital to Fee Income Expansion Customer Acceptance De Minimus Delinquency/Credit Usage Appreciate Service Aspect—Willing to Pay Not Overly Sensitive to Price Cost/Benefit and Convenience Similar t

Slide 24: Services Free Checks!
Services Free Checks! Coordinated Effort with Specific Goals Create Office Traffic Differentiate From Free Checking Cross-Selling Opportunity Establish Primary Relationship The “FREE CHECKS” Campaign Marketing Blitz Develop Competitive Advantage thru Differentiation of Core Product Create a BUZZ
Slide 25: Services CDARS
Services CDARS Certificate of Deposit Account Registry System First Bank in Central PA to Offer Program Program Description Customer Can Access Up to $10 million of FDIC Coverage Administered Thru National Clearinghouse of Affiliated Banks Consolidate Accounts for Convenience, Without Losing Insuran
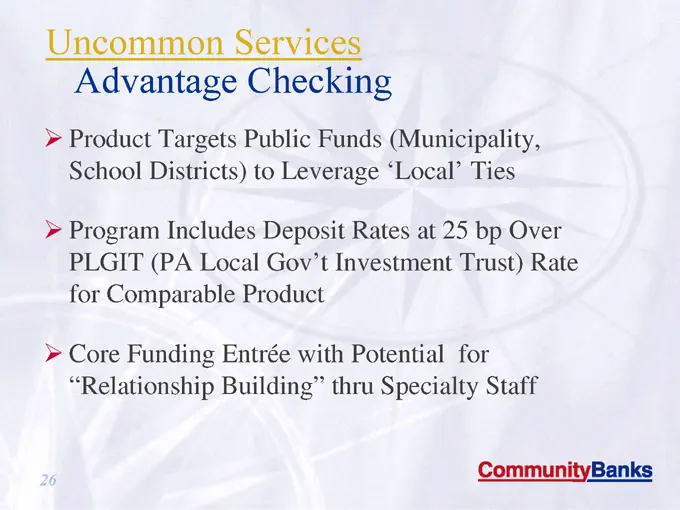
Slide 26: Services Advantage Checking
Services Advantage Checking Product Targets Public Funds (Municipality, School Districts) to Leverage ‘Local’ Ties Program Includes Deposit Rates at 25 bp Over PLGIT (PA Local Gov’t Investment Trust) Rate for Comparable Product Core Funding Entrée with Potential for “Relationship Building” thru Spec
Slide 27: Results: Uncommon Financial Performance
Results Uncommon Financial Performance Net Interest Income Non-Interest Income Asset Quality Operating Expenses
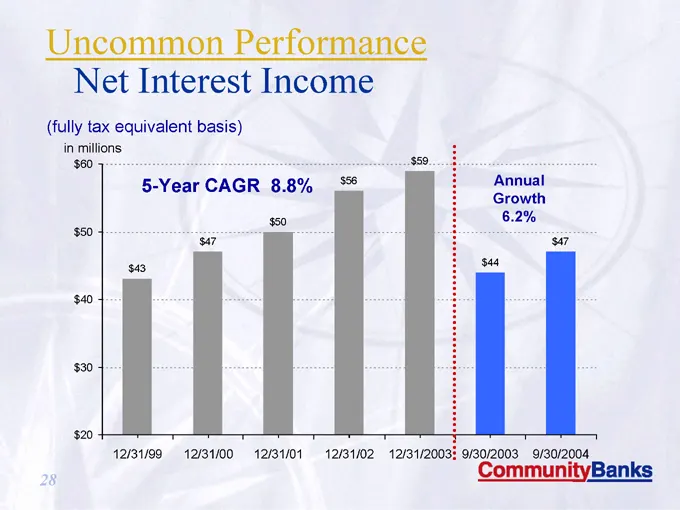
Slide 28: Performance Net Interest Income
Performance Net Interest Income (fully tax equivalent basis) in millions 5-Year CAGR 8.8% Annual Growth 6.2% $43 $47 $50 $56 $59 $44 $47 $20 $30 $40 $50 $60 12/31/99 12/31/00 12/31/01 12/31/02 12/31/2003 9/30/2003 9/30/2004
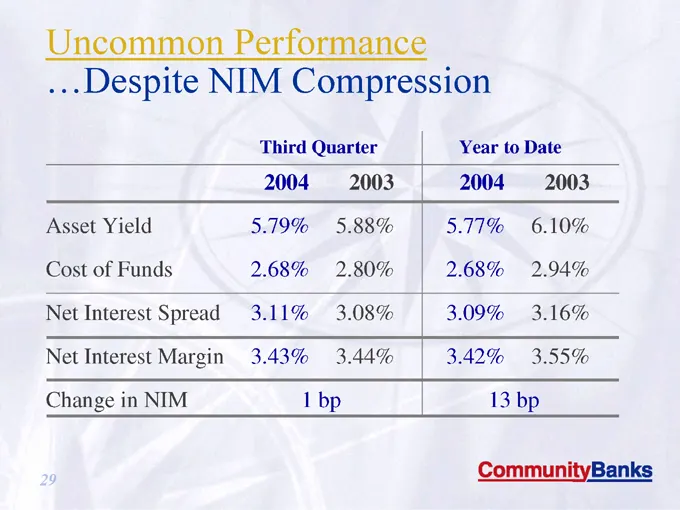
Slide 29: Performance ...Despite NIM Compression
Performance …Despite NIM Compression 2004 2003 2004 2003 Asset Yield 5.79% 5.88% 5.77% 6.10% Cost of Funds 2.68% 2.80% 2.68% 2.94% Net Interest Spread 3.11% 3.08% 3.09% 3.16% Net Interest Margin 3.43% 3.44% 3.42% 3.55% Change in NIM 1 bp 13 bp Third Quarter Year to Date
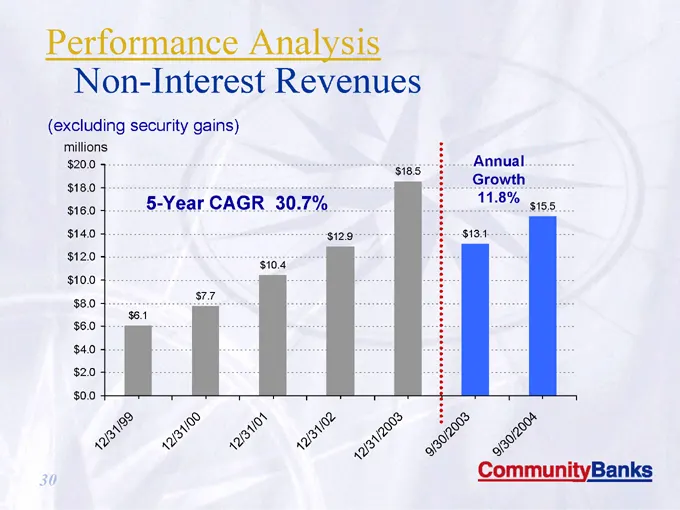
Slide 30: Performance Analysis Non-Interest Revenues
(excluding security gains) Performance Analysis Non-Interest Revenues millions 5-Year CAGR 30.7% Annual Growth 11.8% $6.1 $7.7 $10.4 $12.9 $18.5 $13.1 $15.5 $0.0 $2.0 $4.0 $6.0 $8.0 $10.0 $12.0 $14.0 $16.0 $18.0 $20.0 12/31/99 12/31/00 12/31/01 12/31/02 12/31/2003 9/30/2003 9/30/2004
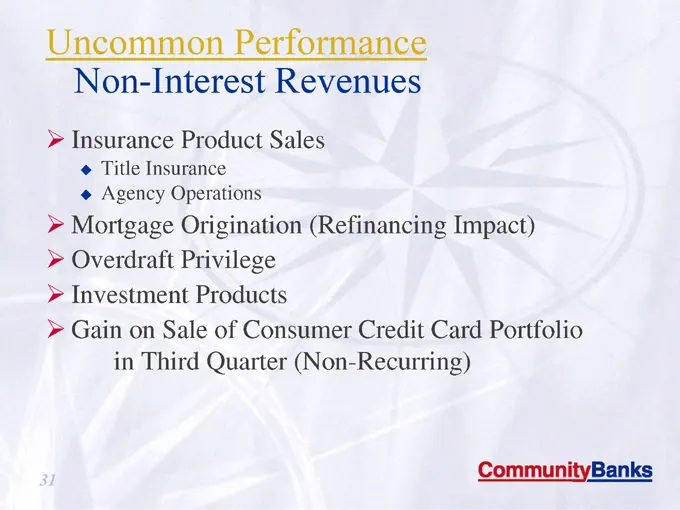
Slide 31: Performance Non-Interest Revenues
Performance Non-Interest Revenues Insurance Product Sales Title Insurance Agency Operations Mortgage Origination (Refinancing Impact) Overdraft Privilege Investment Products Gain on Sale of Consumer Credit Card Portfolio in Third Quarter (Non-Recurring)
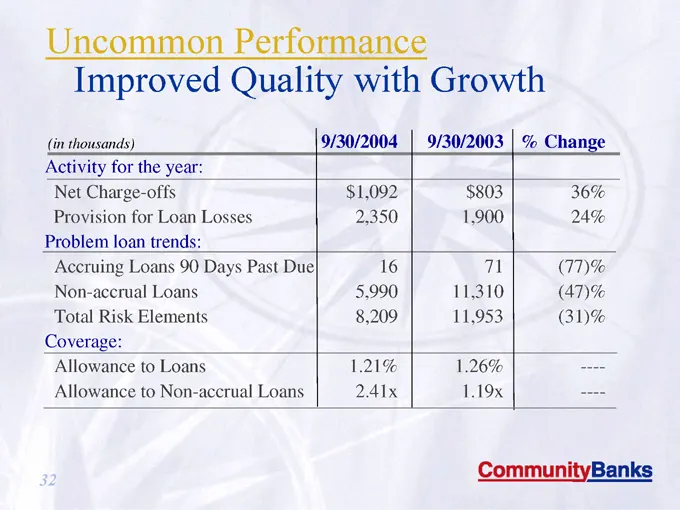
Slide 32: Performance Improved Quality with Growth
Performance Improved Quality with Growth 9/30/2004 9/30/2003 % Change Activity for the year: Net Charge-offs $1,092 $803 36% Provision for Loan Losses 2,350 1,900 24% Problem loan trends: Accruing Loans 90 Days Past Due 16 71 (77)% Non-accrual Loans 5,990 11,310 (47)% Total Risk Elements 8,209 11,95
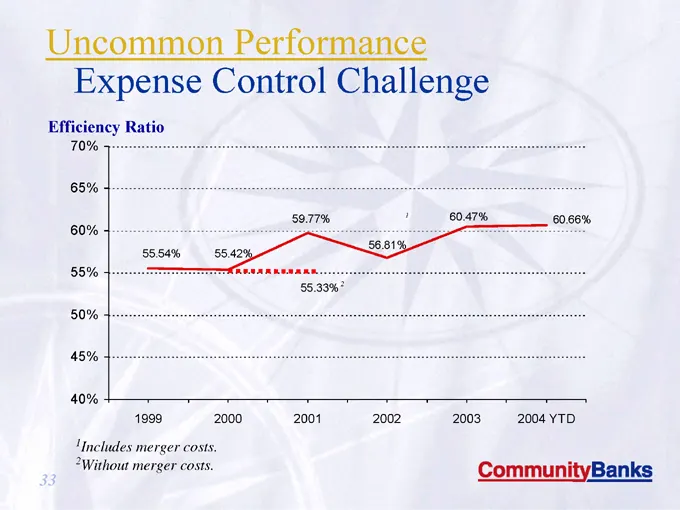
Slide 33: Performance Expense Control Challenge
Performance Expense Control Challenge 1Includes merger costs. 2Without merger costs. 55.33% Efficiency Ratio 60.66% 60.47% 56.81% 59.77% 55.42% 55.54% 40% 45% 50% 55% 60% 65% 70% 2004 YTD
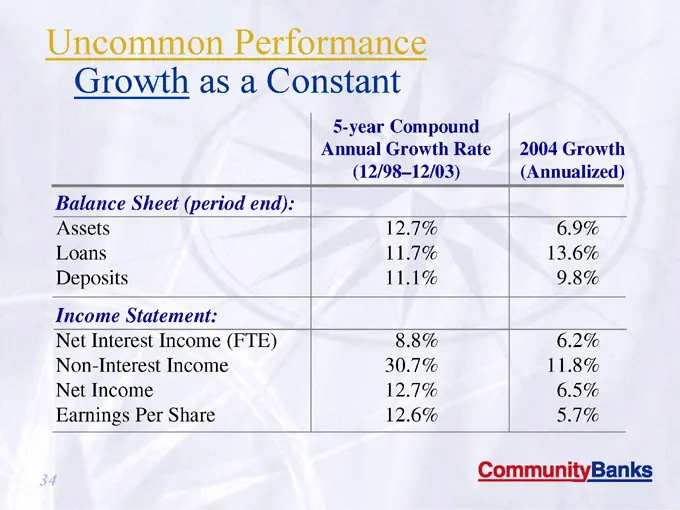
Slide 34: Uncommon Performance Growth as a Constant
Balance Sheet (period end): Assets 12.7% 6.9% Loans 11.7% 13.6% Deposits 11.1% 9.8% Income Statement: Net Interest Income (FTE) 8.8% 6.2% Non-Interest Income 30.7% 11.8% Net Income 12.7% 6.5% Earnings Per Share 12.6% 5.7% 5-year Compound Annual Growth Rate 2004 Growth (12/98–12/03) (Annualized) Unco
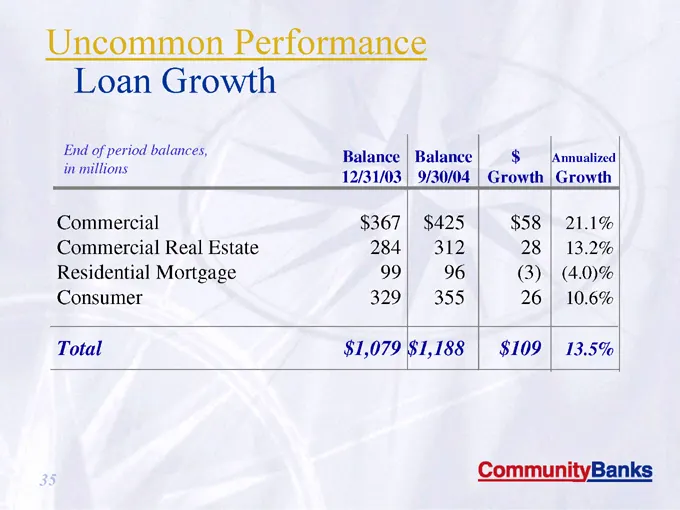
Slide 35: Uncommon Performance Loan Growth
Commercial $367 $425 $58 21.1% Commercial Real Estate 284 312 28 13.2% Residential Mortgage 99 96 (3) (4.0)% Consumer 329 355 26 10.6% Total $1,079 $1,188 $109 13.5% Balance Balance $ Annualized 12/31/03 9/30/04 Growth Growth Uncommon Performance Loan Growth End of period balances, in millions
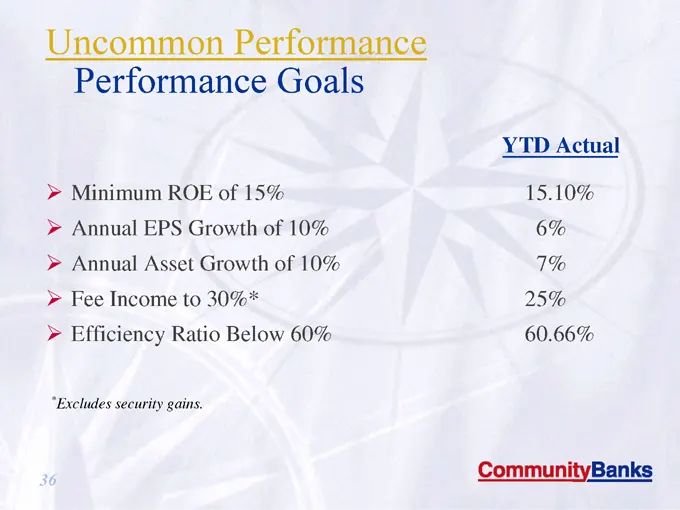
Slide 36: Uncommon Performance Goals
YTD Actual *Excludes security gains. Uncommon Performance Performance Goals Minimum ROE of 15% 15.10% Annual EPS Growth of 10% 6% Annual Asset Growth of 10% 7% Fee Income to 30%* 25% Efficiency Ratio Below 60% 60.66%
Slide 37: Results: Uncommon Investment
Results Uncommon Investment
Slide 38: Results Shareholder Focus
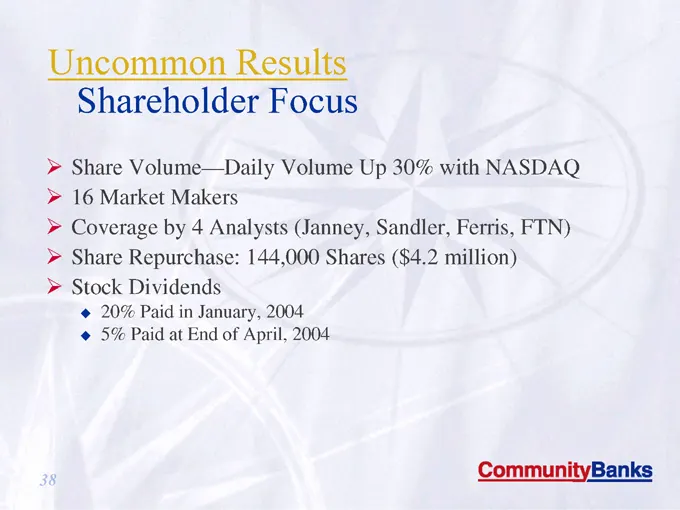
Results Shareholder Focus Share Volume—Daily Volume Up 30% with NASDAQ 16 Market Makers Coverage by 4 Analysts (Janney, Sandler, Ferris, FTN) Share Repurchase: 144,000 Shares ($4.2 million) Stock Dividends 20% Paid in January, 2004 5% Paid at End of April, 2004
Slide 39: Results Stock Price Update
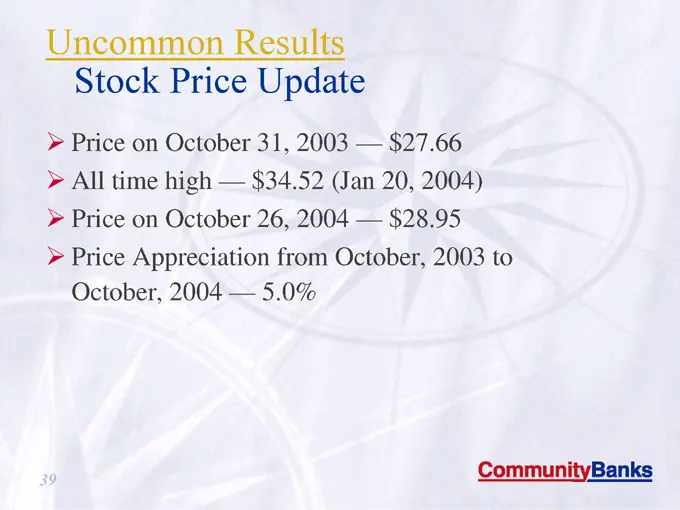
Results Stock Price Update Price on October 31, 2003 — $27.66 All time high — $34.52 (Jan 20, 2004) Price on October 26, 2004 — $28.95 Price Appreciation from October, 2003 to October, 2004 — 5.0%
Slide 40: Results Appreciation and Dividend
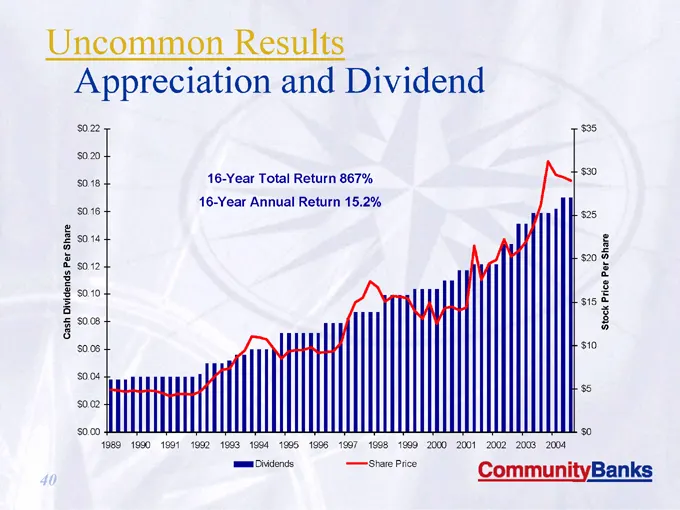
Results Appreciation and Dividend 16-Year Total Return 867% 16-Year Annual Return 15.2% $0.00 $0.02 $0.04 $0.06 $0.08 $0.10 $0.12 $0.14 $0.16 $0.18 $0.20 $0.22 Cash Dividends Per Share $0 $5 $10 $15 $20 $25 $30 $35 Stock Price Per Share Dividends Share Price
Slide 41: Five-Year Cumulative Returns Performance
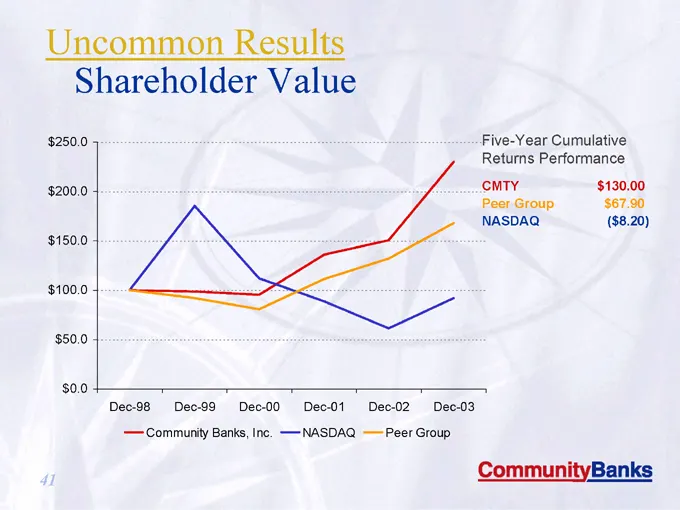
Five-Year Cumulative Returns Performance CMTY $130.00 Peer Group $67.90 NASDAQ ($8.20) Uncommon Results Shareholder Value $0.0 $50.0 $100.0 $150.0 $200.0 $250.0 Dec-98 Dec-99 Dec-00 Dec-01 Dec-02 Dec-03 Community Banks, Inc. NASDAQ Peer Group

Slide 42: Results Ongoing Recognition
Results Ongoing Recognition Central Penn Business Journal Fastest Growing Bank Top 50 Fastest Growing Businesses Harrisburg Magazine “Simply the Best” Bank Harrisburg Patriot News Top 10 “Superstar” Downtown Harrisburg/York Openings

Slide 43: A Common Name Delivering Uncommon Results - Questions?
“A Common Name Delivering Uncommon Results” CommunityBanks Questions?
Source: SEC EDGAR · 8-K filed Nov 5, 2004
More decks from Community Banks Inc
 Community Banks — Merger or Acquisition (June 2007)23 slides · Jun 20, 2007
 Community Banks — Merger or Acquisition (May 2007)31 slides · May 1, 2007
 Ferris, Baker Watts Mid-Atlantic Bank Conference 200620 slides · Jul 27, 2006
 Shareholder Meeting (May 2006)45 slides · May 9, 2006
 Emerald Groundhog Day Investment Forum (February 2006)40 slides · Feb 2, 2006
 Mid-Atlantic SuperCommunity Bank Conference 200528 slides · Nov 8, 2005