Alexander & Baldwin Holdings Inc
Alexander & Baldwin — Investor Day (April 2012)
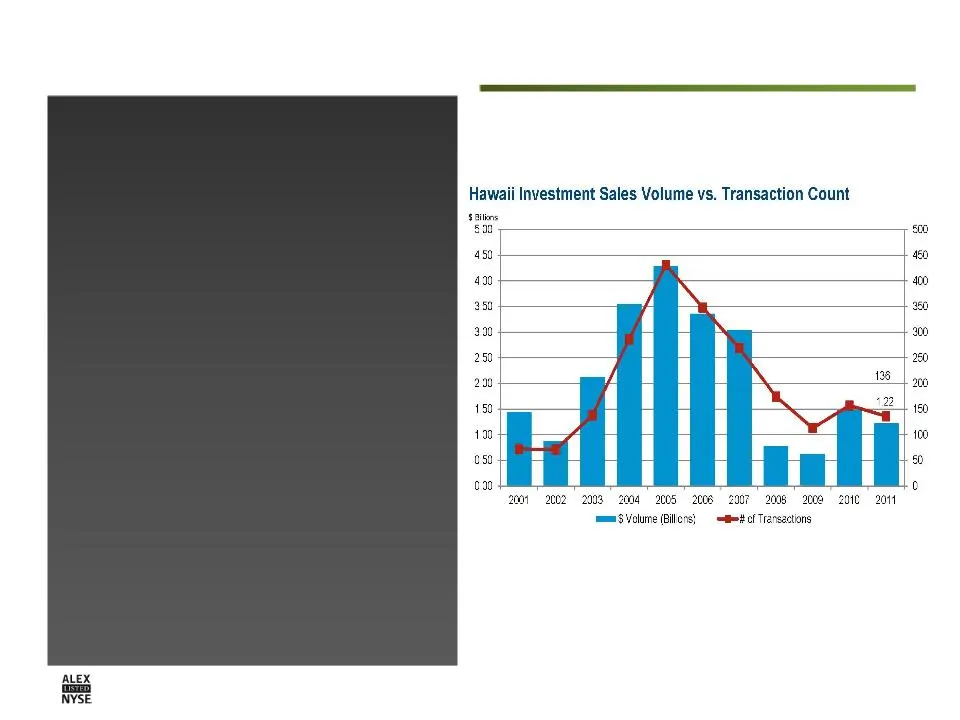
96 slides from Alexander & Baldwin's investor day presentation, Apr 10, 2012
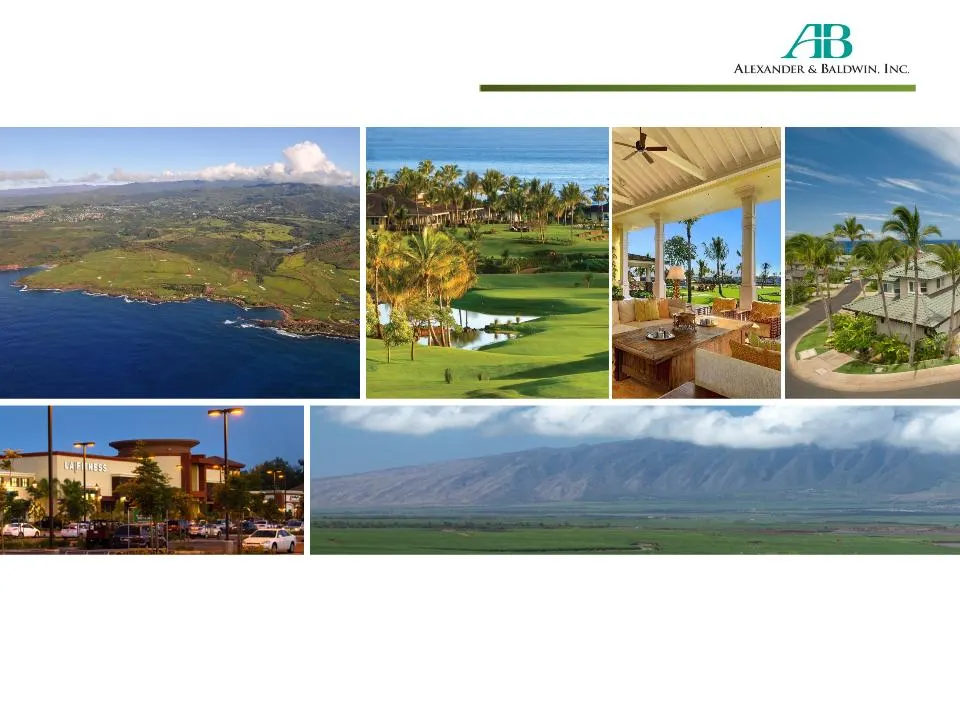
Slide 1: The New A&B: A Premier Hawaii Real Estate & Land Company
The New A&B: A Premier Hawaii Real Estate & Land Company April 11, 2012

Slide 2: Forward-Looking Statements
Forward-Looking Statements Statements in this presentation that set forth expectations or predictions are based on facts and situations that are known to us as of April 11, 2012. Actual results may differ materially, due to risks and uncertainties, such as those described on pages 9- 29 of our 2011

Slide 3: Presenting Today
Presenting Today Stan Kuriyama President & Chief Executive Officer, Alexander & Baldwin, Inc. Chris Benjamin President, A&B Land Group; President, A&B Properties, Inc. Paul Hallin Executive Vice President, Development, A&B Properties, Inc. David Haverly Senior Vice President, Leasing, A&B Properties

Slide 4: Agenda
Agenda § Overview - Kuriyama § Strategy - Benjamin § Real Estate Sales - Benjamin and Hallin § Questions and answers/ break § Real Estate Leasing - Benjamin and Haverly § Land Stewardship and Agribusiness - Benjamin § Landholdings - Benjamin § Valuation - Benjamin § Closing remarks - Kuriyama § Ques
Slide 5: Overview
Overview
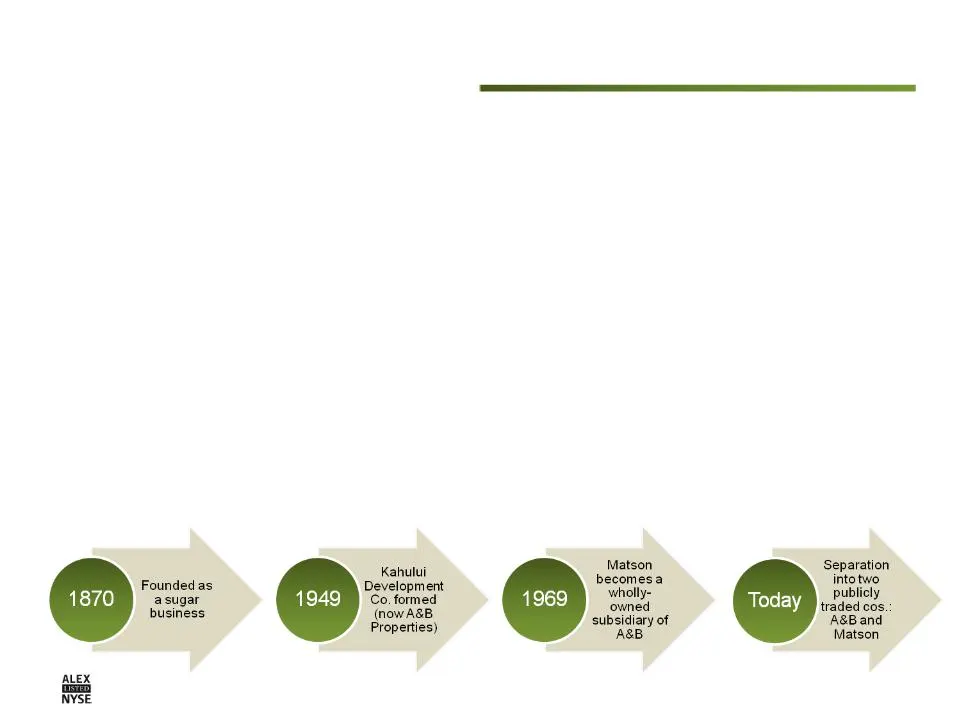
Slide 6: Alexander & Baldwin Overview and Evolution
Alexander & Baldwin Overview and Evolution § Agribusiness (Hawaiian Commercial & Sugar Co.) – 12 acres on Maui eventually led to 3 sugar plantations, 130,000 acres – Foundation for our real estate & shipping businesses – Today: State’s largest farmer, only remaining sugar plantation § Real Estate (A

Slide 7: Separation: Rationale and Updates
Rationale § Each company large & strong enough to stand on its own § Enhanced strategic direction & focus § Flexible capital structure § “Pure-play” stock – Greater transparency – Sector-specific shareholder base – Expanded research coverage – Better acquisition currency – Closer employee/ sharehold

Slide 8: The "New A&B"
The “New A&B” A PREMIER HAWAII REAL ESTATE & LAND COMPANY § Unique assets & competitive strengths Tangible ‒ 88,000 acres of land primarily on Maui and Kauai ‒ 7.9 million square feet of high-quality commercial properties in Hawaii & Mainland ‒ Robust Hawaii development pipeline (fully entitled) of
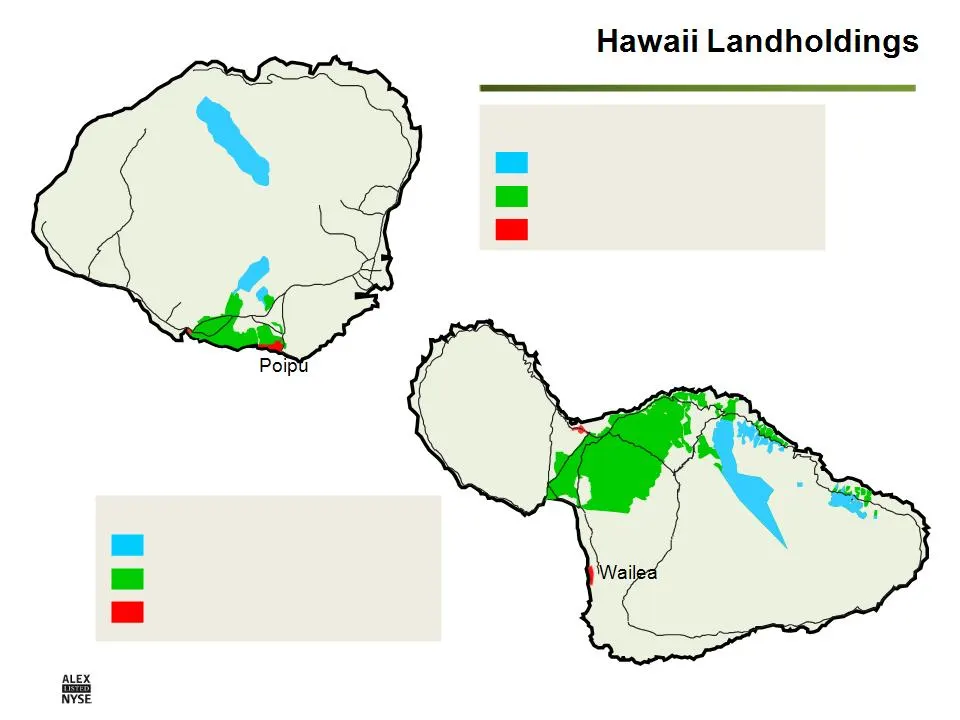
Slide 9: Maui and Kauai Landholdings
Kihei Kahului Conservation 15,850 acres Agriculture 50,831 acres Urban/Entitled 559 acres Maui - 70,000 acres * Includes 961 acres at Kukui’ula joint venture Lihue Wainiha Conservation 13,320 acres Agriculture 6,944 acres Urban/Entitled1,072 acres* Kauai - 20,000 acres Princeville
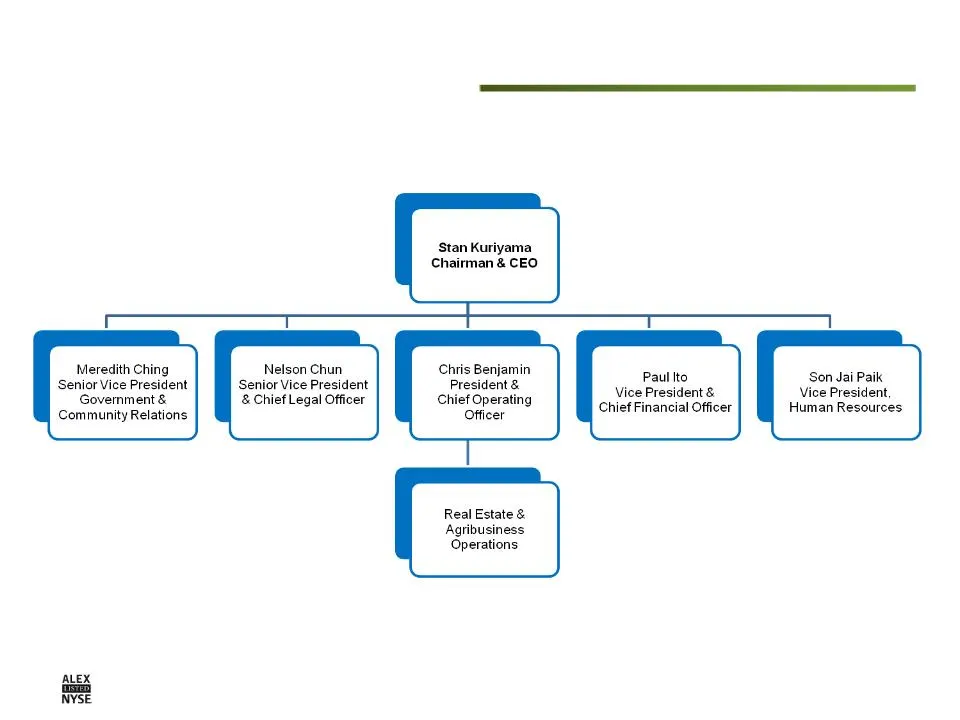
Slide 10: Stan Kuriyama, Chairman & CEO
Stan Kuriyama Chairman & CEO Meredith Ching Nelson Chun Chris Benjamin Senior Vice President Senior Vice President President & iss read ears Pre sata ovement s &Cnlet Legal Omioer: Chie Operating Chief Financial Officer Human Resources Community Relations Officer Real Estate & Agribusiness Oper a
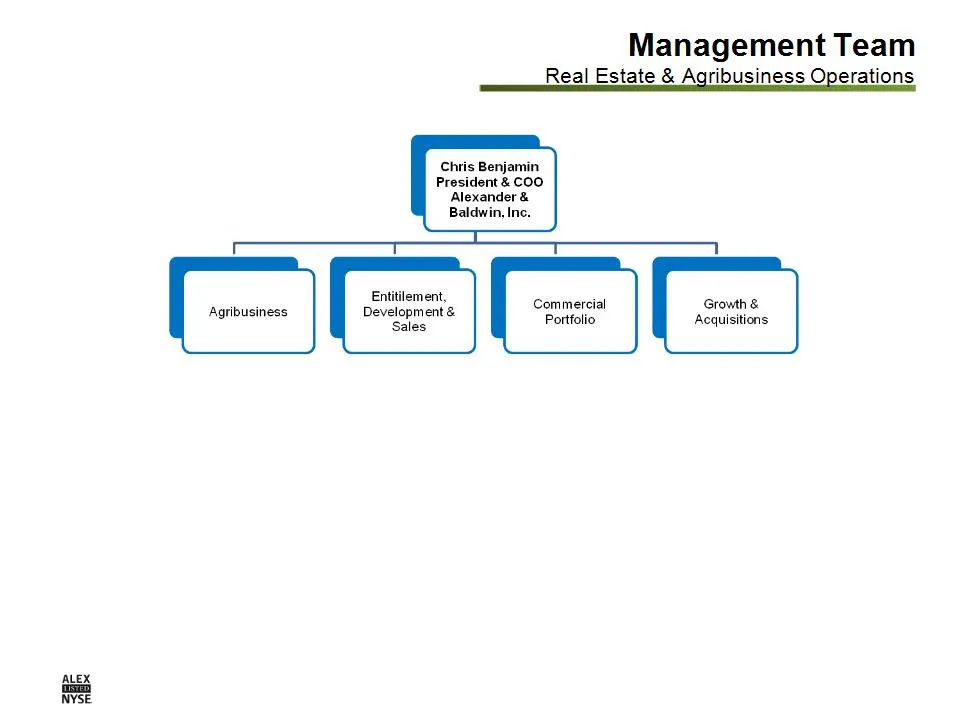
Slide 11: Real Estate and Agribusiness Leadership
Rick Volner General Manager HC&S Dan Ligenza VP Agribusiness Paul Hallin EVP, Development Alan Arakawa SVP, Planning Rick Stack SVP, Development Grant Chun VP, Maui Natalie Kiehm VP, Development Randy Endo VP, Development Tom Shigemoto VP, Planning, Kauai David Haverly SVP, Leasing Mike Wright EVP,
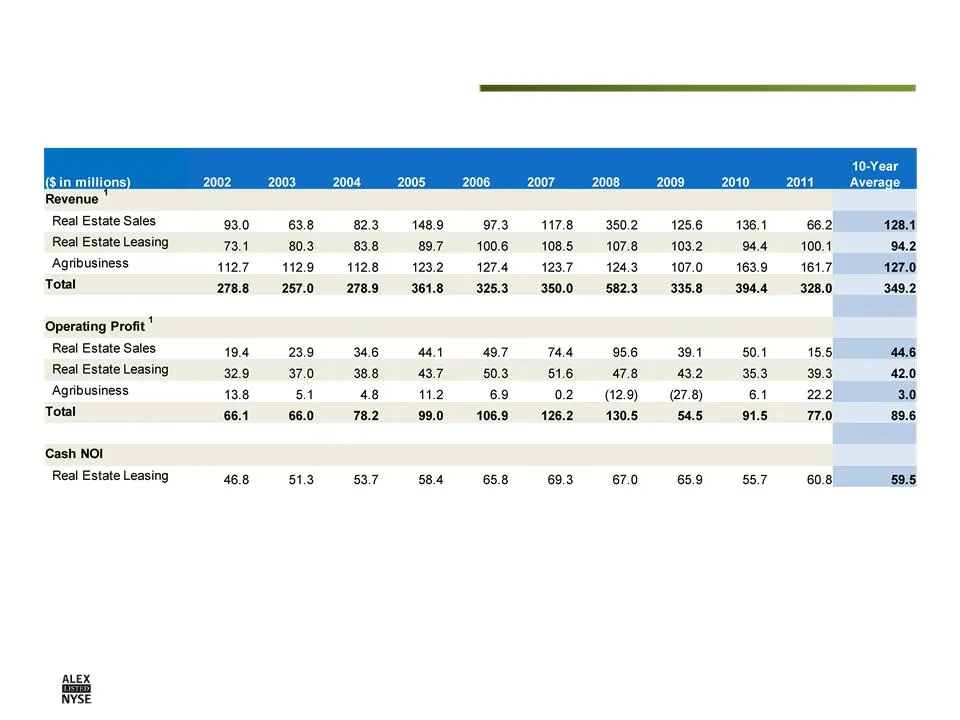
Slide 12: Financial Highlights
Financial Highlights 1 Includes real estate discontinued operations and intersegment revenue
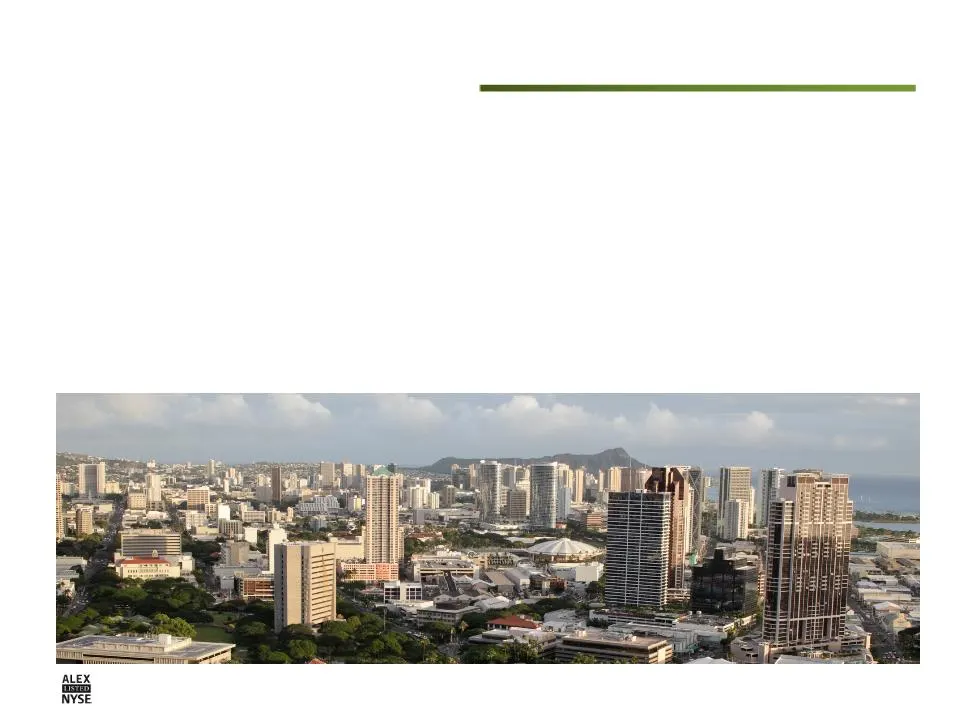
Slide 13: Value-Creation Driven
Value-Creation Driven 1. Capitalize on our competitive strengths (assets, people, balance sheet): Hawaii focus 2. Increase the value of our legacy lands through the entire development spectrum, consistent with community needs 3. Opportunistic, high return investments outside our legacy lands 4. Buil

Slide 14: Hawaii: Poised for Growth
Hawaii: Poised for Growth § Positive YOY trends in key economic indicators – Growing visitor counts (+4%) – Visitor expenditures at record pace (+16%) – Continuing low unemployment (2/10: 6.6%, 2/11: 6.4%) – General fund revenues (+8%) – Bankruptcies fell (-16%) – Oahu months of housing inventory de
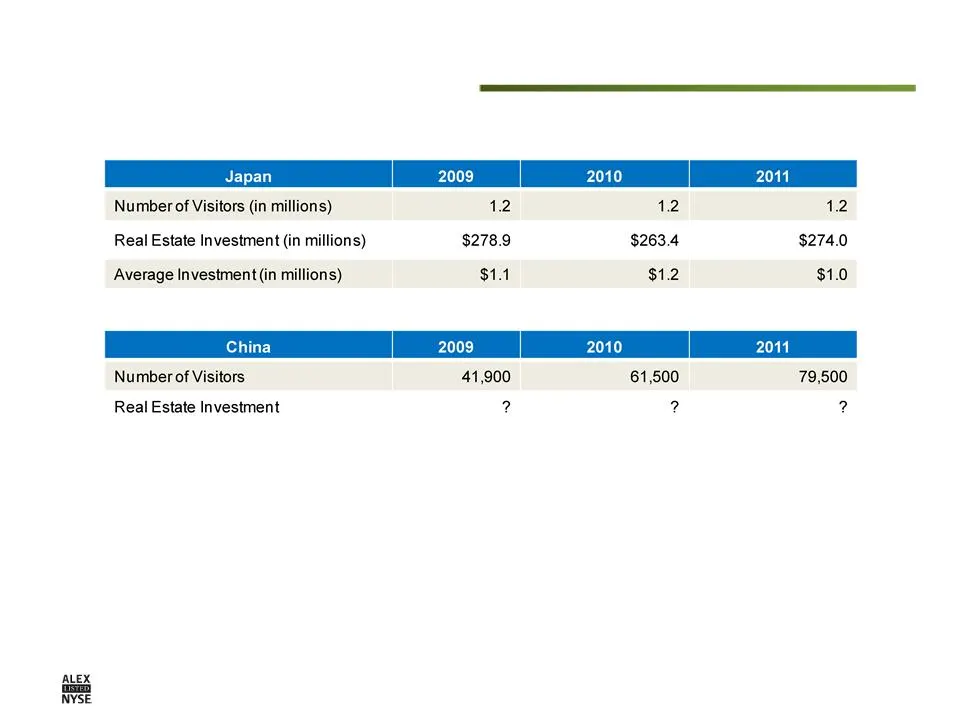
Slide 15: The China Potential
The China Potential Source: Title Guaranty (RE Transactions); Hawaii Tourism Authority (Visitor #’s)
Slide 16: Strategy
Strategy
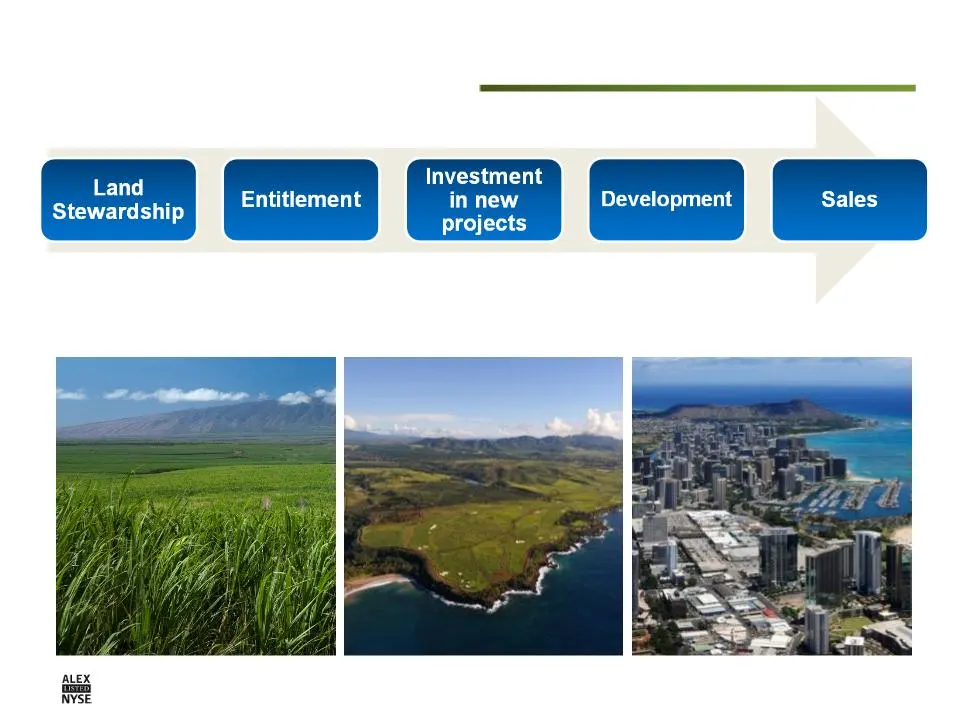
Slide 17: Unlocking Value From Hawaii Real Estate Assets
Unlocking Value From Hawaii Real Estate Assets Robust Development Pipeline 88,000 Acres of Hawaii Land Hawaii’s Premier, Large- Scale Agricultural Operation
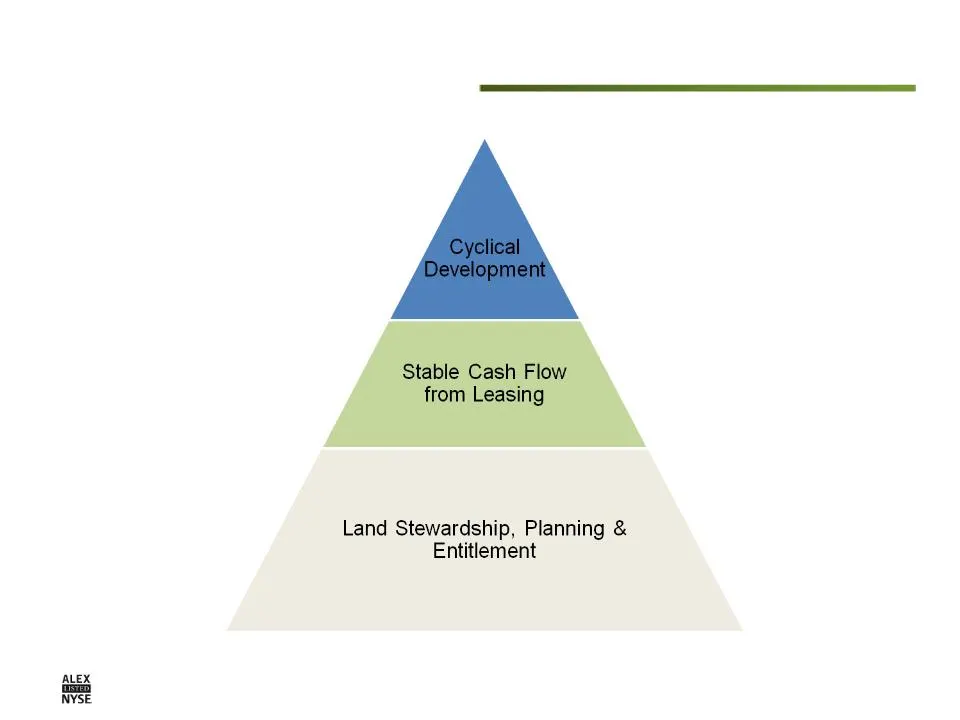
Slide 18: How Our Land Businesses Fit Together
How Our Land Businesses Fit Together

Slide 19: Development & Investment Strategy
Development & Investment Strategy § Focus on entitlement and development of core Hawaii lands – Opportunities to serve a wide range of residential, commercial and industrial markets, primarily on Maui and Kauai § Invest in high-returning real estate opportunities in Hawaii – Diversify to new markets
Slide 20: Leasing Strategy
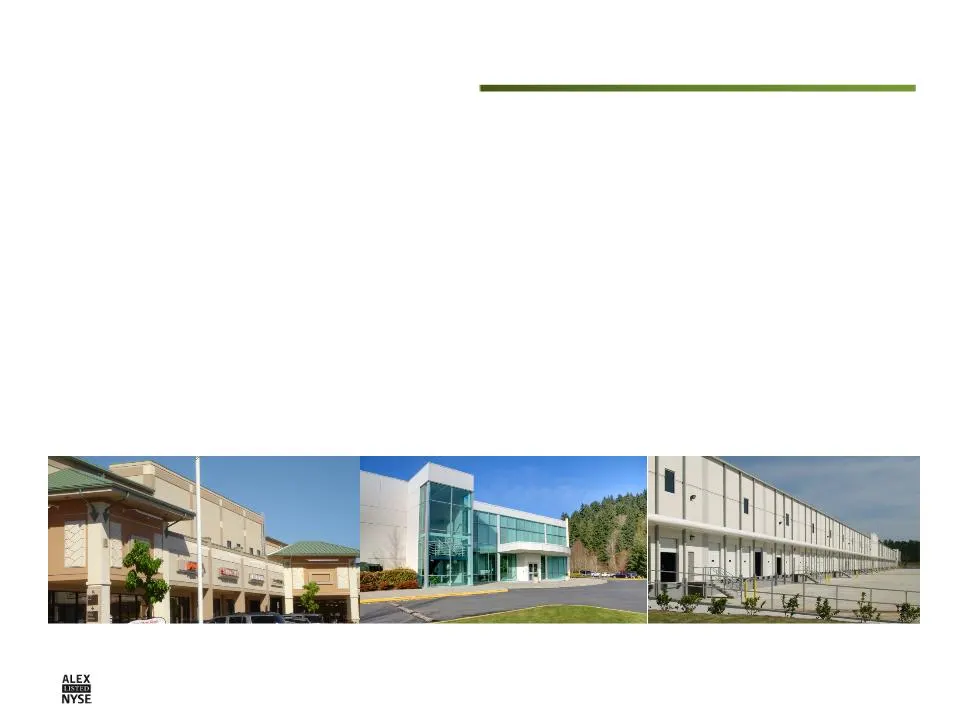
Leasing Strategy § Reinvesting sales proceeds, on a tax-advantaged basis, into other commercial real estate investments having favorable growth prospects § Diversified portfolio of stable assets provides recurring cash flow to fund or finance development activities § Active management to maximize va

Slide 21: Land Stewardship Strategy
Land Stewardship Strategy § Integrated approach to ensure that lands are employed at their highest and best use § Identify and pursue entitlements, developments and transactions that enhance the value of raw landholdings § Limited near-term development potential for a significant portion of landhold
Slide 22: Real Estate Sales
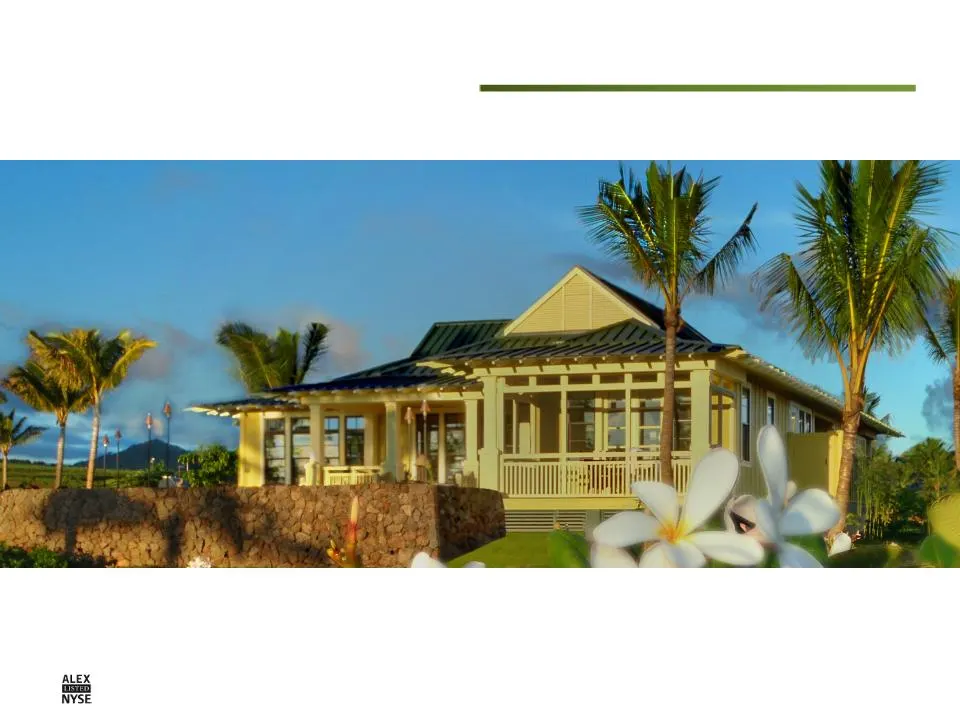
Real Estate Sales
Slide 23: Real Estate Sales Results
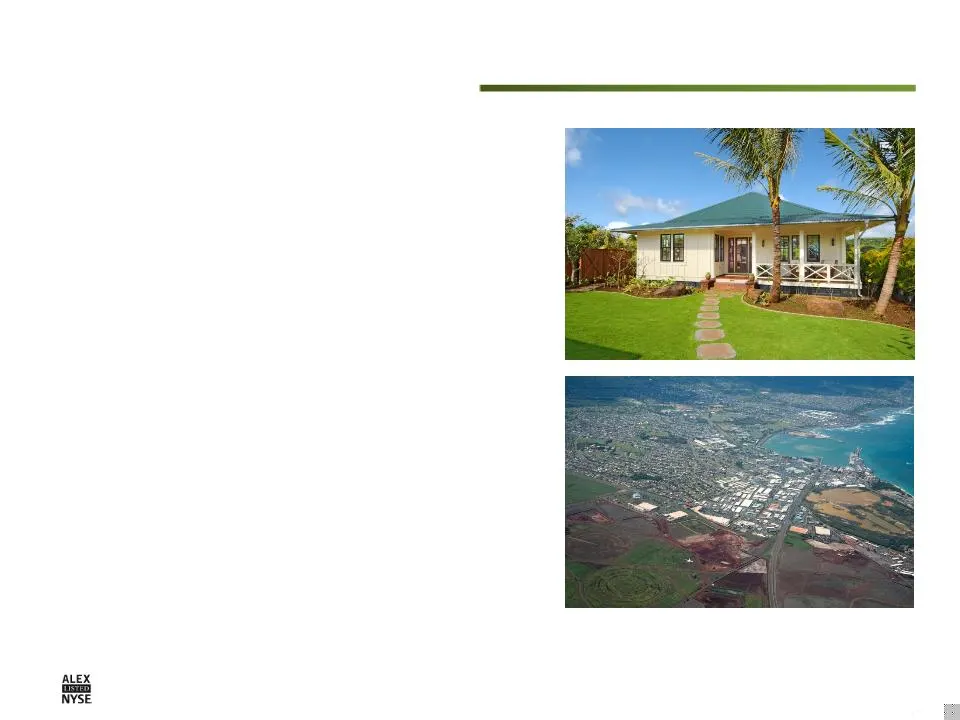
Real Estate Sales Results What’s Included? § Development sales § Commercial property sales § Land sales § Earnings from joint venture/other (included in operating profit only) – Developments – Joint venture developments held for lease

Slide 24: Principal Operational Activities
Principal Operational Activities § Investment in legacy and non-legacy Hawaii development projects/sites – First priority always optimization of historic landholdings – Review and analyze all available projects in Hawaii – Diversify Hawaii development portfolio (location and product type ) § Develop
Slide 25: Successful Hawaii Track Record
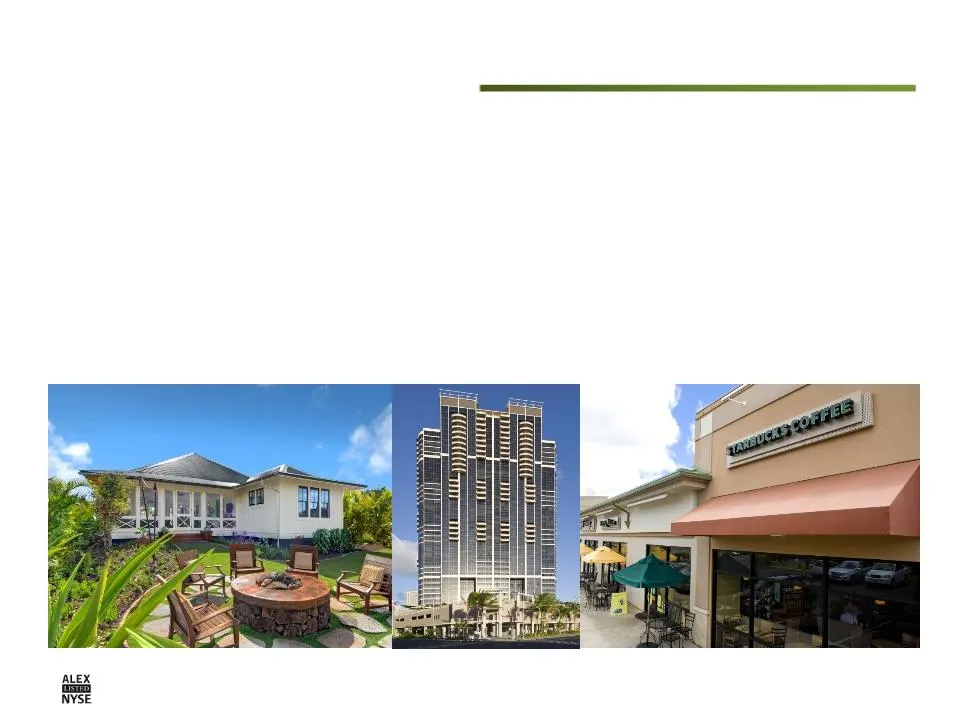
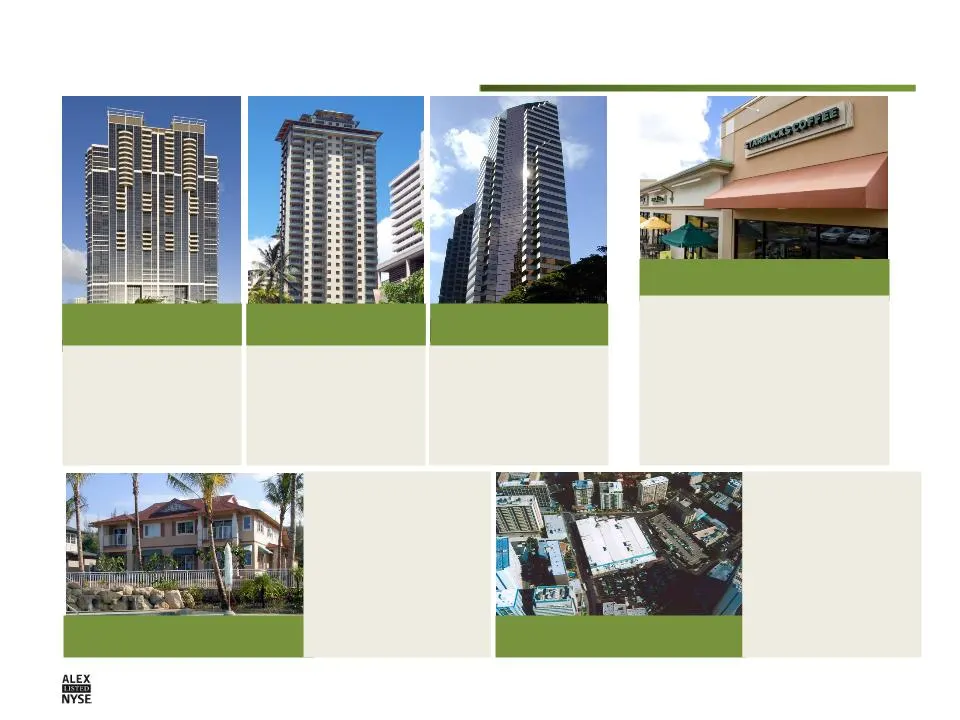
Successful Hawaii Track Record § Since 2000, invested $800 million in Hawaii development projects ($420 million completed), including: – Three high-rise condominiums in urban Honolulu – Premier resort destination communities on Maui and Kauai – Three commercial income properties we retain § Returns
Slide 26: Successful Development Track Record
Keola Lai Lanikea Alakea Corporate Tower Kai Lani Daiei (Retail) Kunia Shopping Center Successful Development Track Record 352-unit high-rise residential condominium near downtown Honolulu. $224M revenue generated. 100-unit condominium with surrounding ocean and mountain views in Waikiki. $63M reven
Slide 27: Market Knowledge & Expertise
Colliers Hawaii Year-End 2011 Investment Market Report Local Investors Out-of-State Investors Avg. Purchase Price $4.4M $19.2M Total Investments $409M $825M Purchase Price to Assessed Value 74.3% 122.3% Market Knowledge & Expertise § A&B competes with smaller, local investors and large Mainland inst
Slide 28: Market Knowledge & Expertise
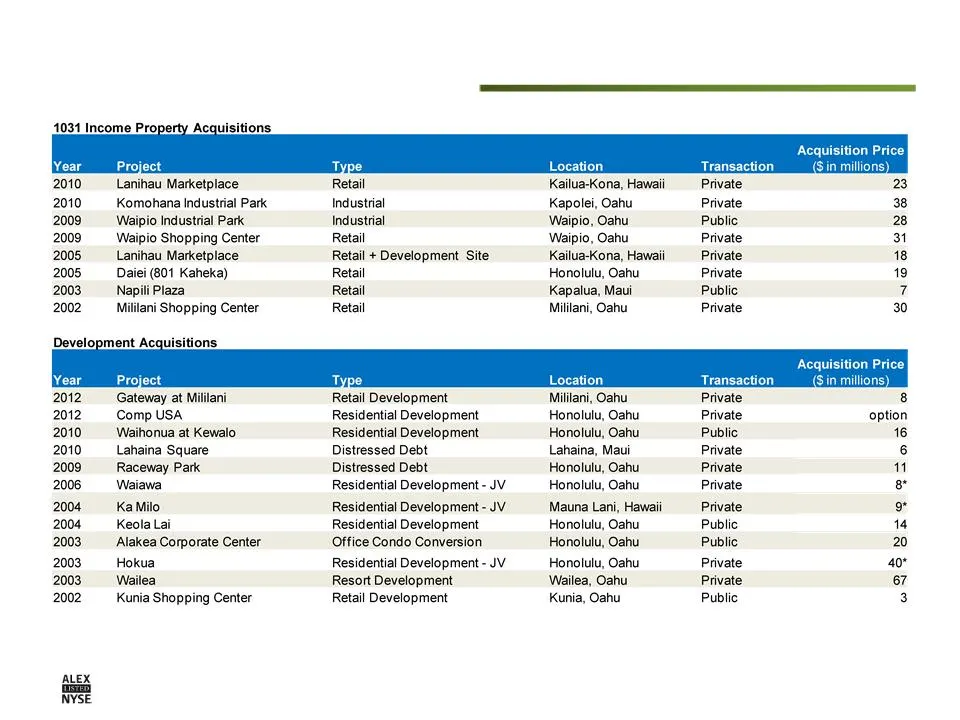
Market Knowledge & Expertise * Amount invested in joint venture
Slide 29: Diversifying Development Portfolio into New Markets
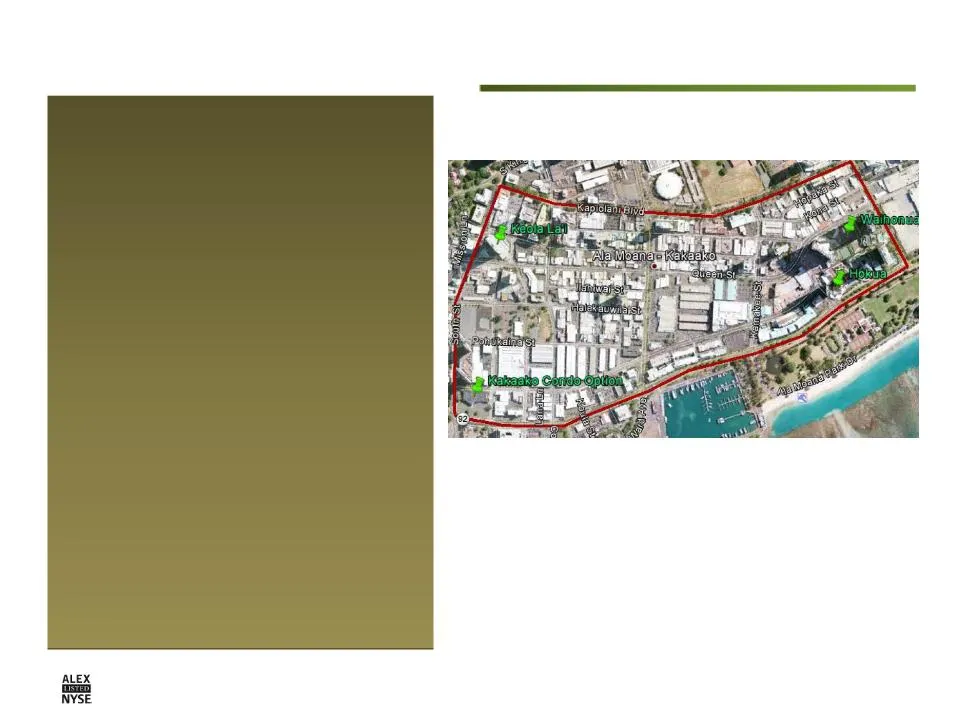
§ Strategy evolved in late 1990’s with “Project X” § Complement existing legacy land development activities with investment in areas outside traditional Maui and Kauai holdings § Have invested in 16 projects in Hawaii since 1998 § Oahu an area of focus – Kakaako – Urban Oahu redevelopment/TOD – Subu
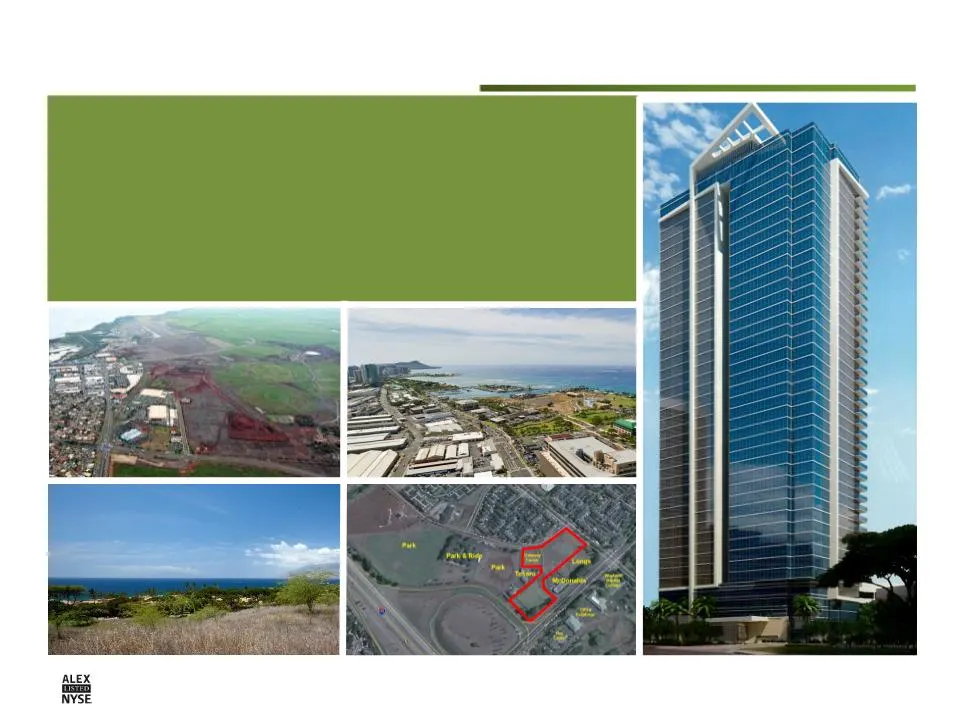
Slide 30: Development Pipeline and Entitlement
§ Representative projects in active development § Future pipeline § Entitlement Development Pipeline and Entitlement
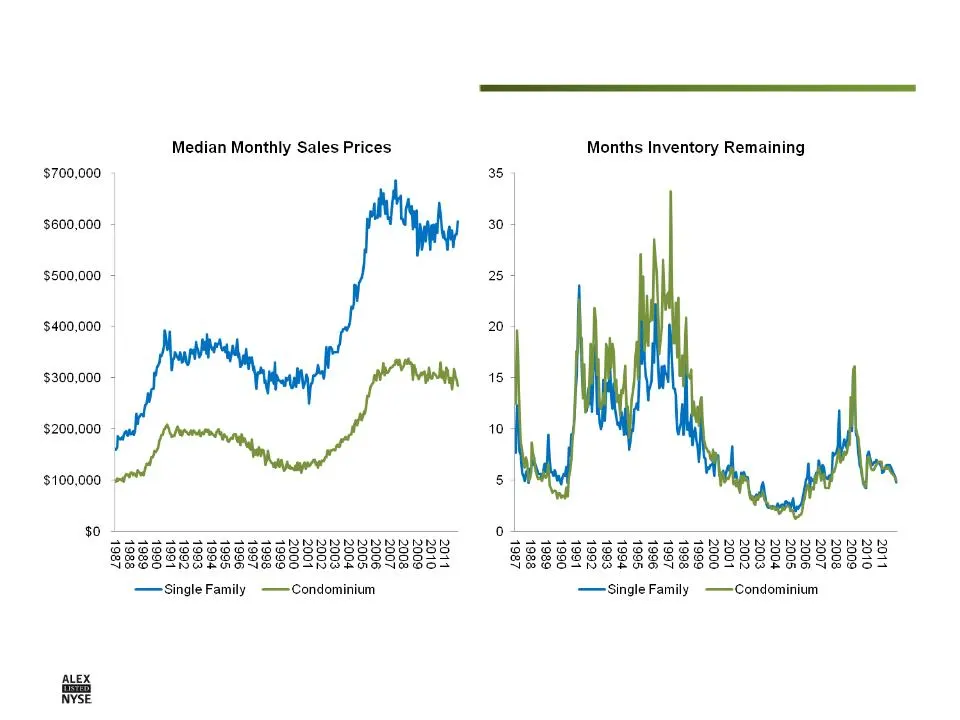
Slide 31: Markets - Oahu Residential
Markets - Oahu Residential Source: Honolulu Board of Realtors
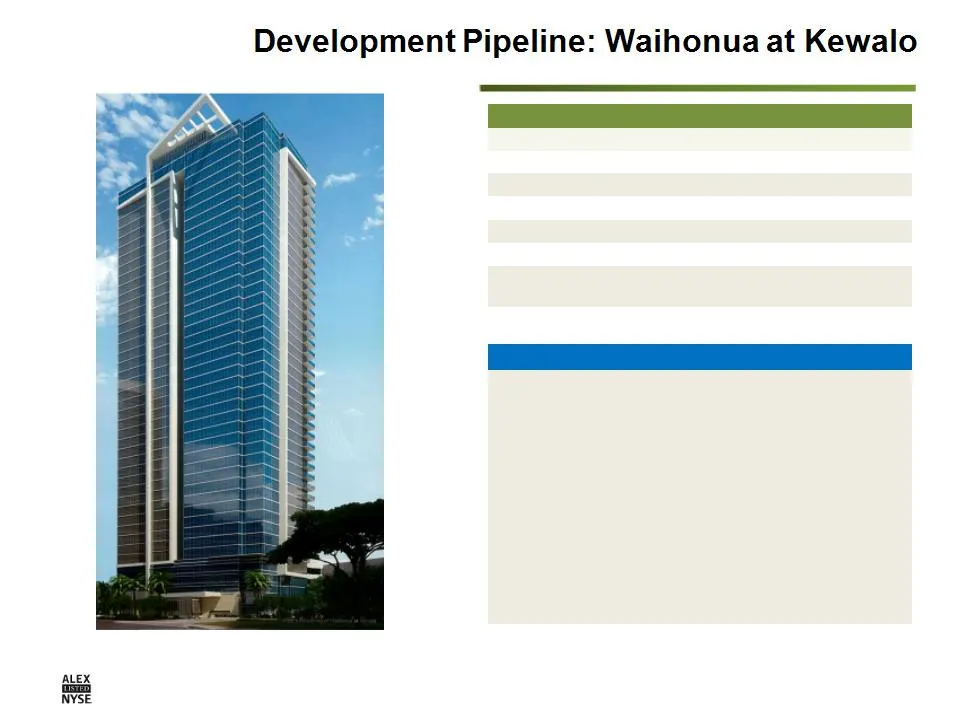
Slide 32: Oahu Highrise Condominium Project
Description Location Honolulu, Oahu Acquisition date June 30, 2010 Zoning Primary residential Units 341 Floors 43 Status Design/permitting and presales Estimated construction completion 2014/2015 Targeted sales price per s.f. $450-$970 Overview § Highrise condominium in urban Honolulu § Well located
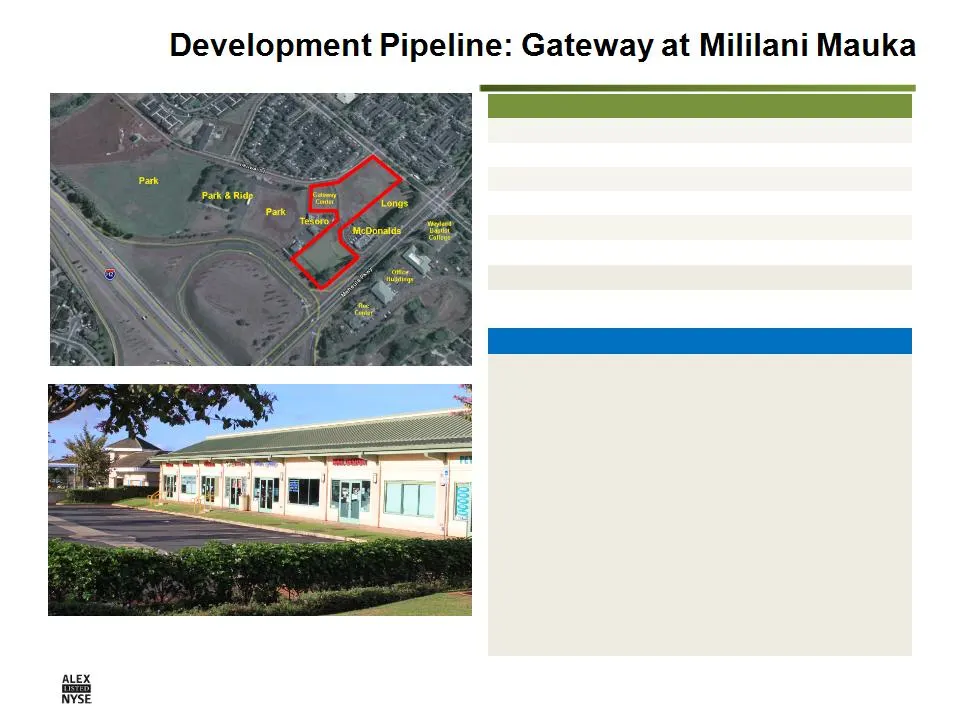
Slide 33: Mililani Retail Project
Description Location Mililani, Oahu Acquisition date December 29, 2011 Stabilized NOI $1.0 million Zoning Retail Acres 4.35 GLA (in sq. ft.) 28,400 (future), 5,900 (existing) Status Design/permitting Estimated construction completion 2013 Overview § 4.35-acre fee simple parcel § Fully zoned for comm
Slide 34: Development Pipeline: Maui Business Park II
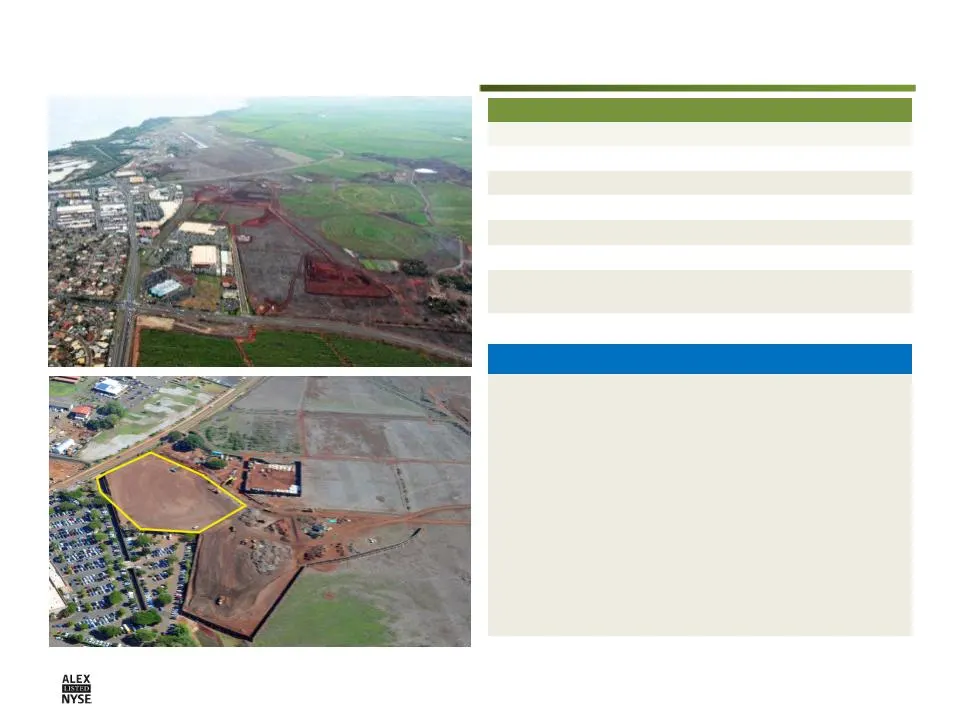
Description Location Kahului, Maui Acquisition date Historic lands Zoning Light industrial Acres 179 Lots 131 Status Construction and presales Estimated construction completion 2019 Targeted sales price per s.f. $40-$60 Overview § Zoned for light industrial (commercial, retail, office) § 179 gross a
Slide 35: Hawaii Resort Residential
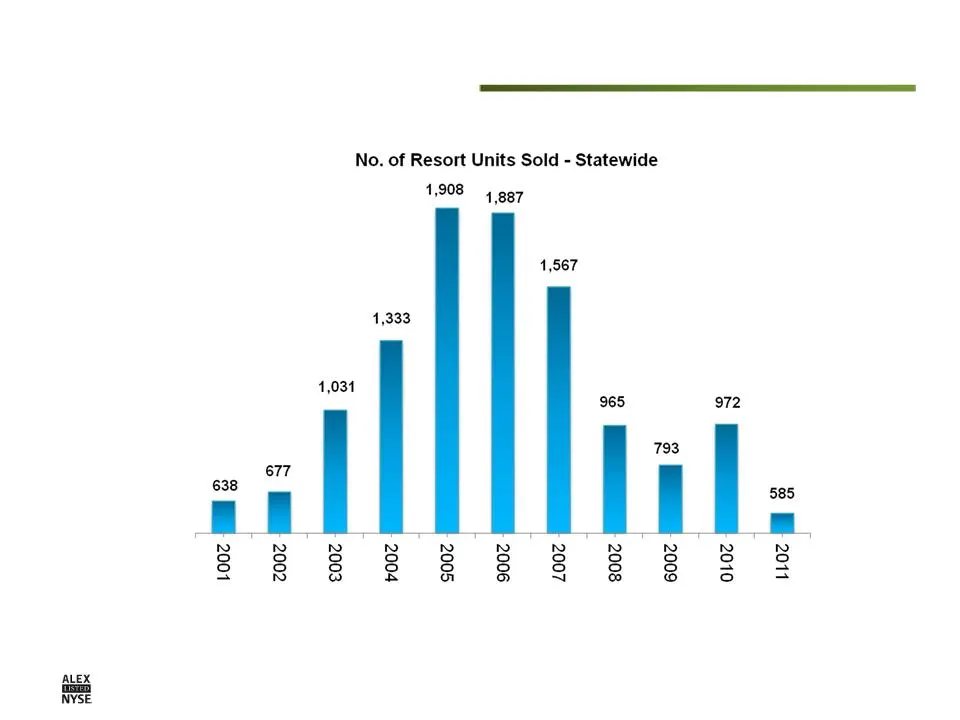
Hawaii Resort Residential Source: Paul Richard Cassidy, REMM Pacific/Data@Work
Slide 36: Development Pipeline: Wailea
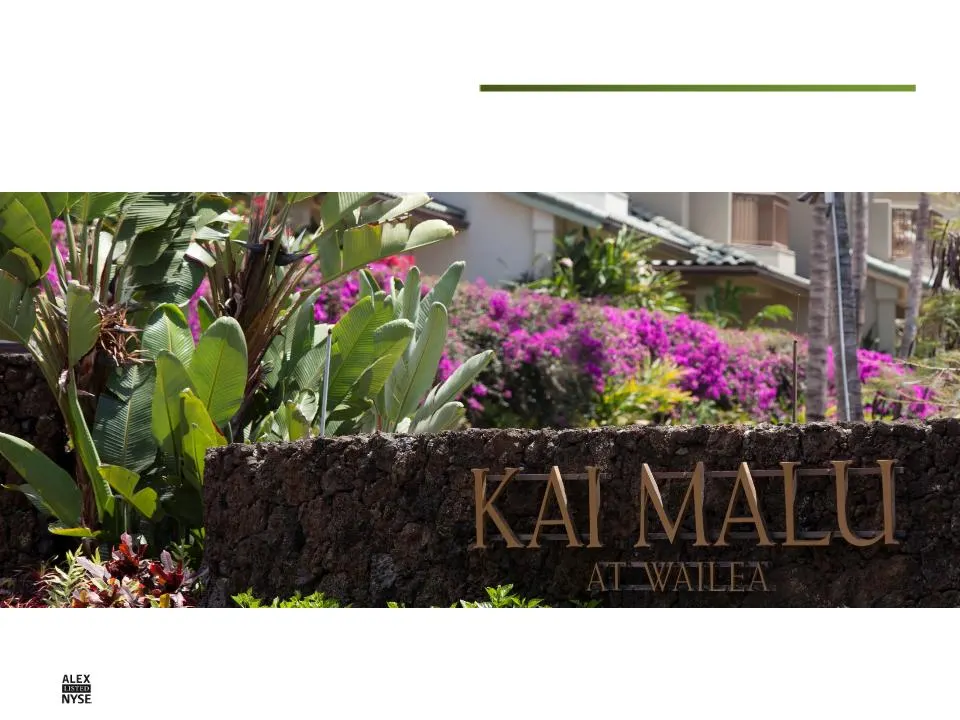
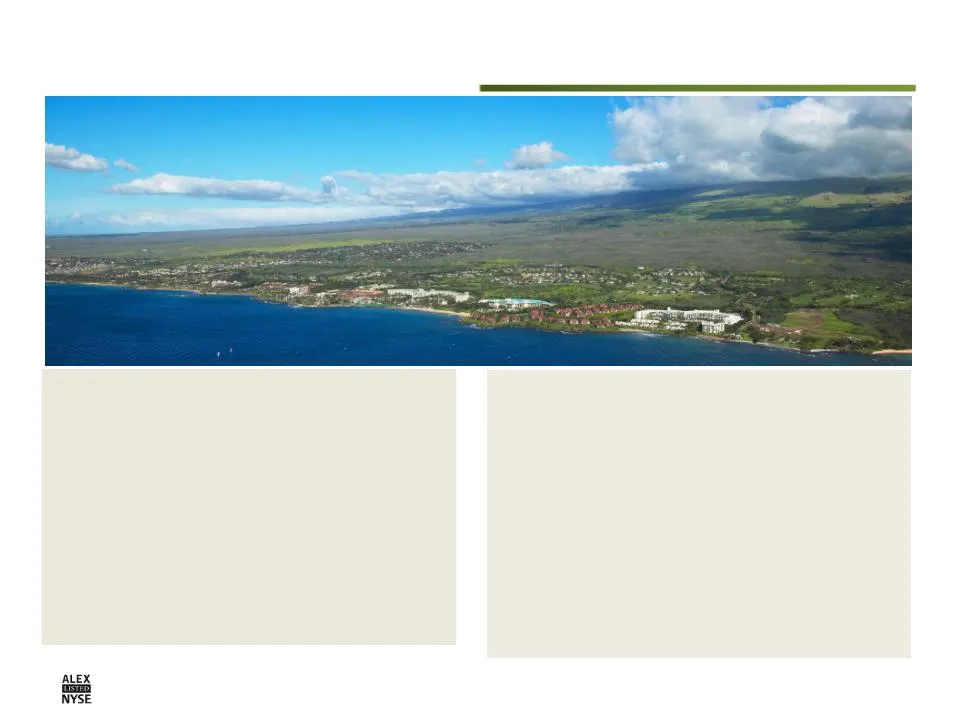
Fully Entitled Acreage Acres Acquisition/Improvements 270 Contributed to Kai Malu JV (25) Sold (78) Remaining 167 Lots for sale 14 Under development 38 Future development 115 Development Pipeline: Wailea § Premier resort destination on Maui § Original developer in the 1970s and 1980s § Sold in 1989,
Slide 37: Development Pipeline: Wailea
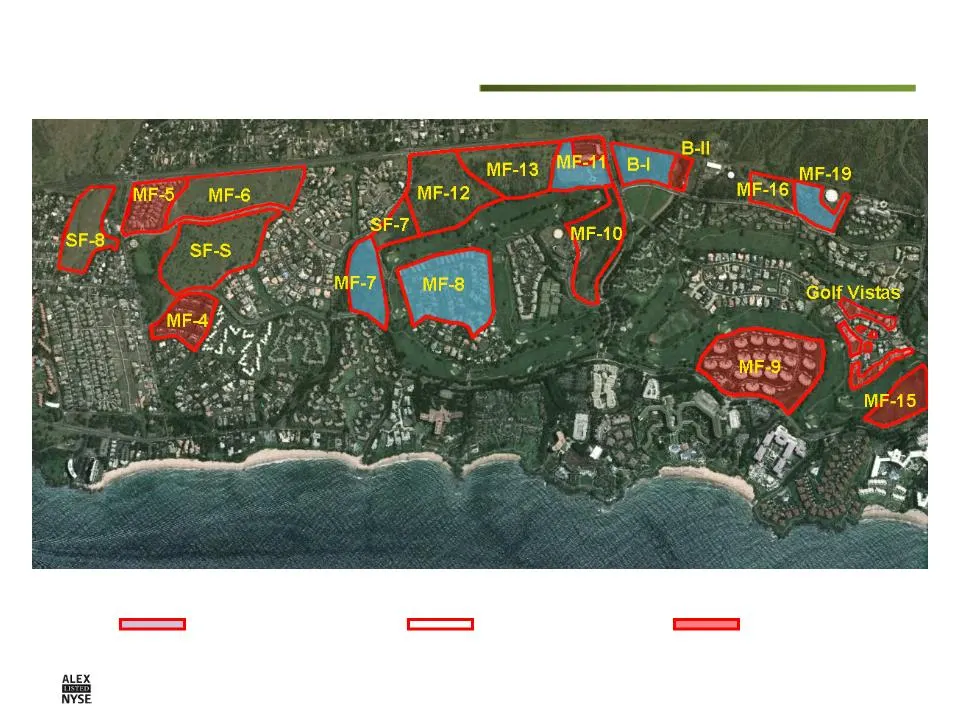
Development Pipeline: Wailea Future development Active development/sales Sold
Slide 38: Development Pipeline: Kukui'ula
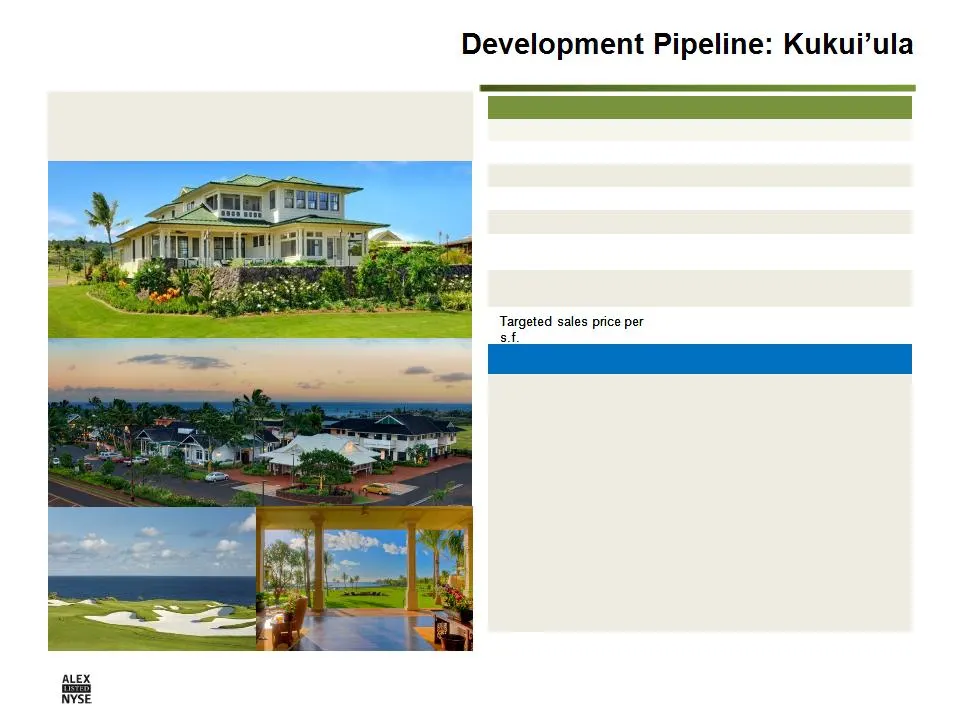
Description Location Poipu, Kauai Acquisition date Historic lands Zoning Resort residential Acres 1,000 (961 remaining) Units/homes Up to 1,500 Status Sales and marketing, vertical construction Estimated construction completion 2030 $40-$130 (land) Overview § Luxury resort residential community in P
Slide 39: Development Pipeline: Kukui'ula Financial Overview
Financial Overview § Long-term, master planned project, significant fluctuations in annual absorption over that time frame can be expected § Sufficient project infrastructure is in place today to sell about 280 additional acres (500 to 800 units) § GAAP accounting for the project will differ materia
Slide 40: Kona Resort Residential Community
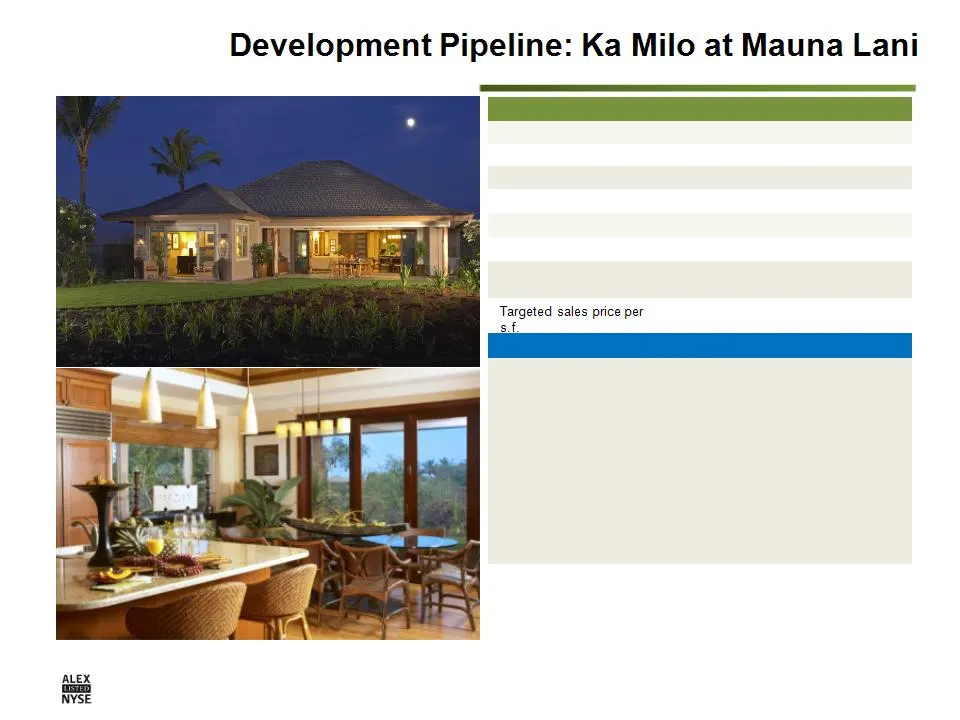
Description Location Kona, Hawaii Acquisition date May 2004 Zoning Resort residential Acres 31 (24 remaining) Units/Homes 137 total (34 sold; 103 to be built) Status Construction and sales Estimated construction completion 2015 $375-$920 Overview § 137-unit resort residential community, with a mix o
Slide 41: Development Pipeline: Brydeswood
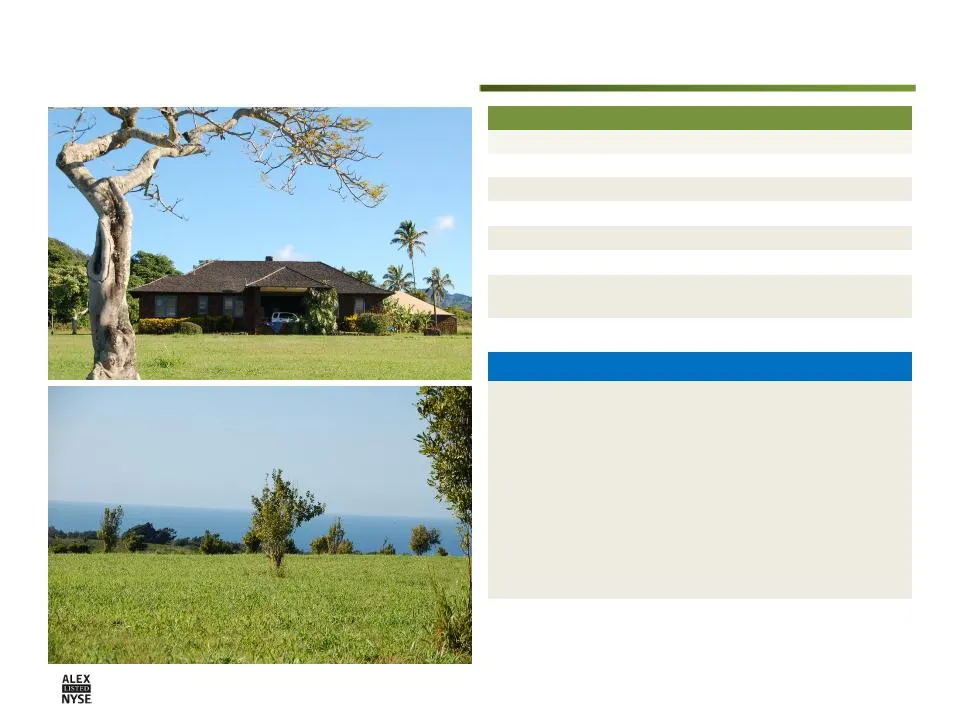
Description Location Kalaheo, Kauai Acquisition date Historic lands Zoning Ag lots Acres 352 Lots 24 Status Design/permitting and presales Estimated construction completion 2014 Targeted sales price per s.f. $2-$5 Overview § Planned development of 24 large estate lots (average size is 12 acres) § Fi
Slide 42: Development Pipeline: Future Projects
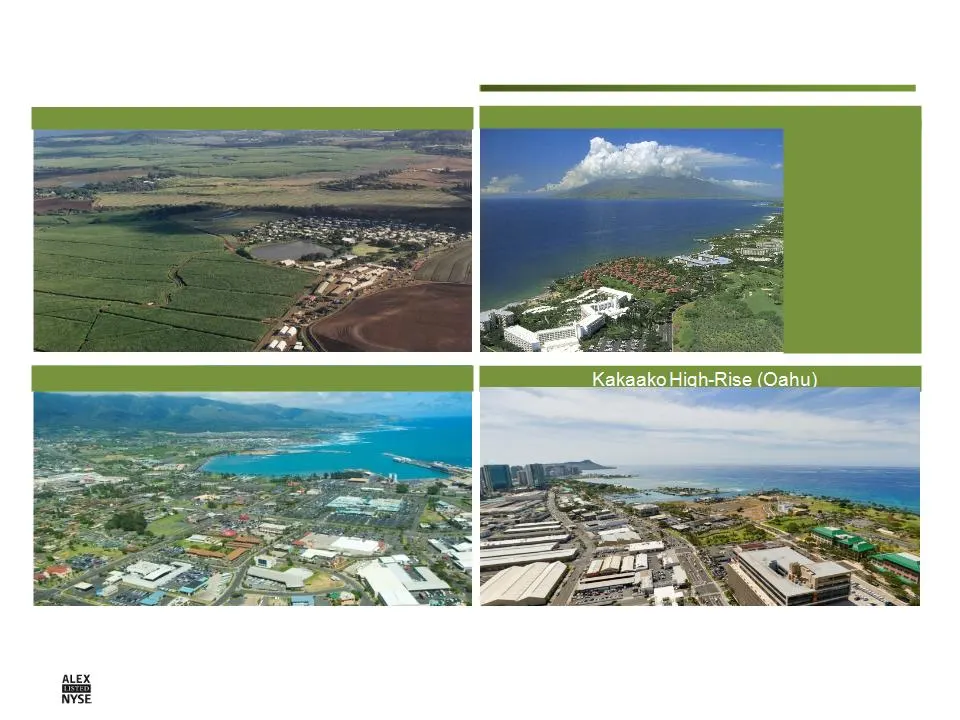
Haliimaile (Maui) Aina ‘O Kane and Kahului Town Center (Maui) Wailea (Maui) Wailea SF-8 Wailea MF-6 Wailea MF-10 Wailea MF-16 Development Pipeline: Future Projects
Slide 43: Future Entitlement Projects: Waiale, Kihei, Ele'ele
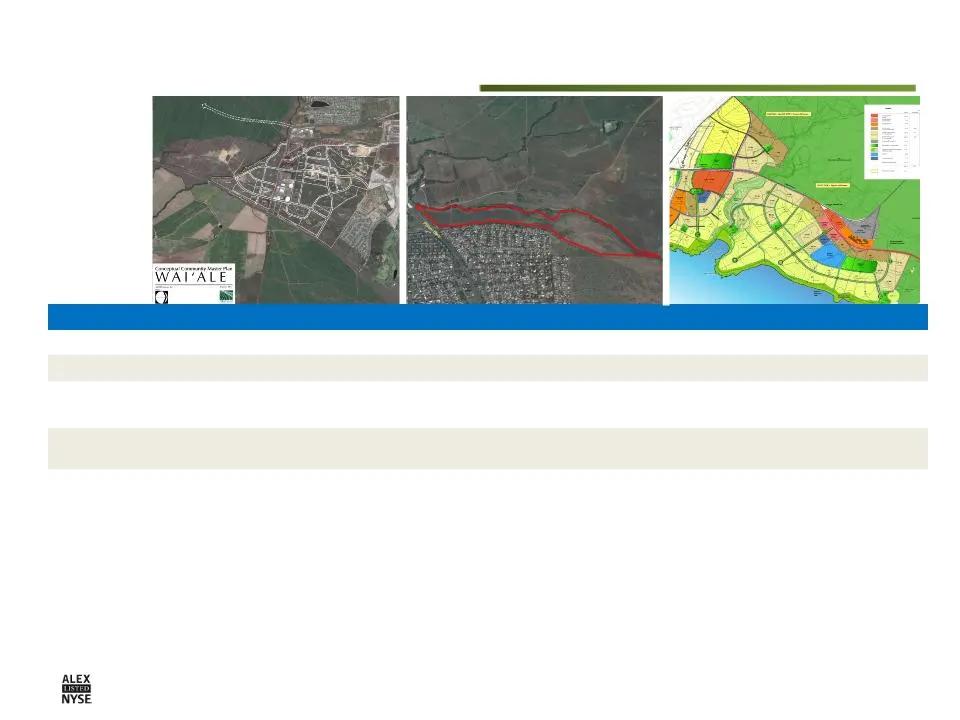
Waiale Kihei Residential Ele’ele Expansion Target Primary Residential Primary Residential Primary Residential Location Central Maui Maui’s South Shore Kauai’s South Shore Project Size (acres/units) 545 acres/2,550 units 95 acres/600 units 840 acres Project description Master-planned community Reside
Slide 44: Financial Overview: Real Estate Sales
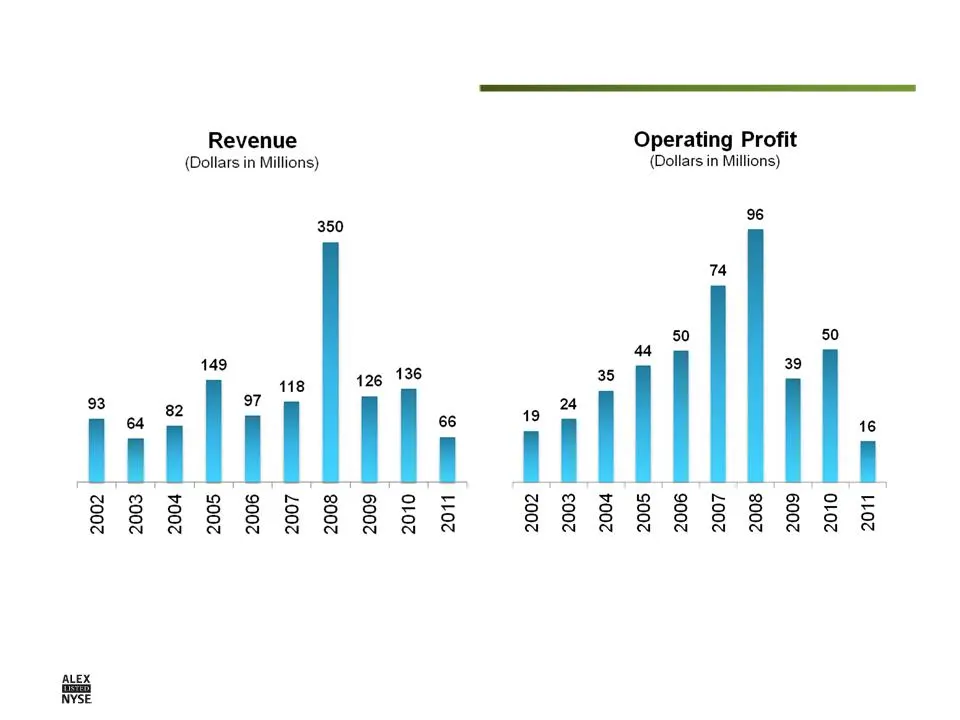
Financial Overview Real Estate Sales
Slide 45: Real Estate Sales Milestones
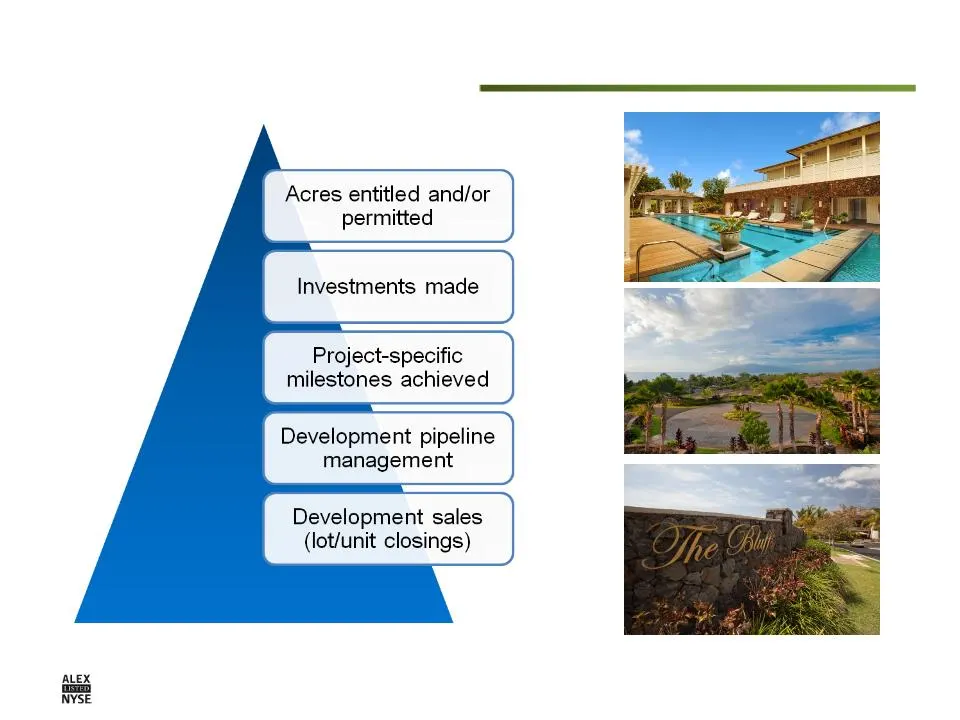
Acres entitled and/or permitted Investments made Project-specific milestones achieved Development pipeline management Development sales (lot/unit closings)
Slide 46: Real Estate Sales Summary
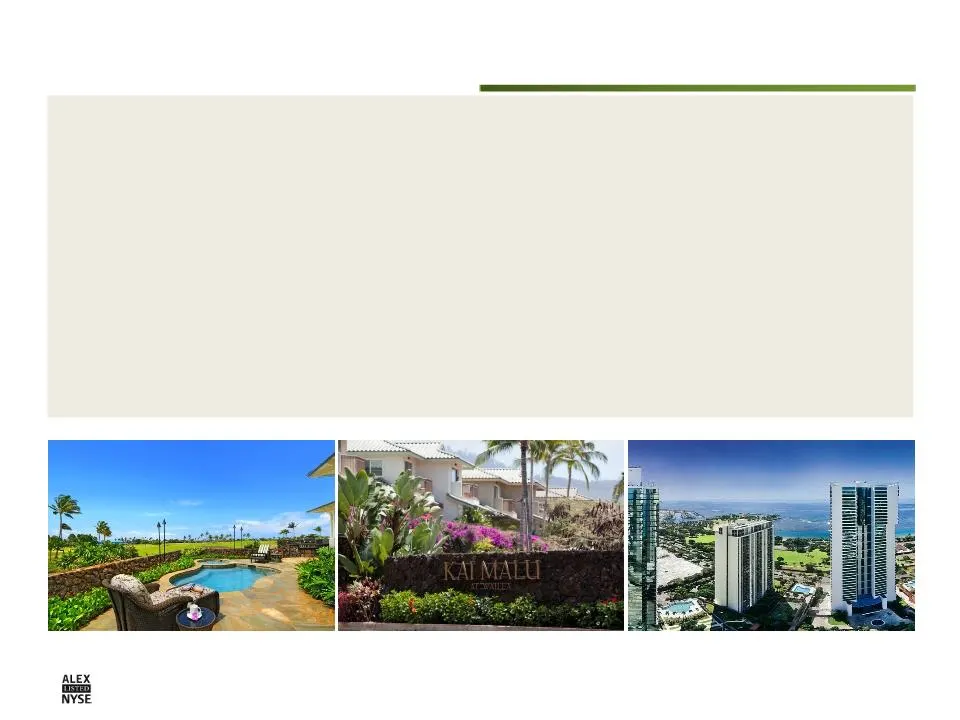
Real Estate Sales Summary § Value creation starts with entitlement - A&B favorably positioned § Highest value creation comes from development of historic land, but pace is slow § Late 1990s decision to acquire fully entitled lands has created tremendous growth and shareholder value § Today, robust p
Slide 47: Q&A / Break
Q&A / Break
Slide 48: Real Estate Leasing
Real Estate Leasing
Slide 49: Leasing Segment Results
Leasing Segment Results What’s Included? § Commercial property portfolio income § Hawaii unimproved property income – Third-party leases and licenses on a small portion of lands – Urban-zoned ground leases § Gains/losses on asset sales are not included

Slide 50: Primary Operational Activities
Primary Operational Activities § Acquire/develop income properties in markets with strong growth potential – Enhance asset values through facility upgrades, re-tenanting, asset repositioning and general market growth § Active management of assets in portfolio to maximize performance – Increase occup
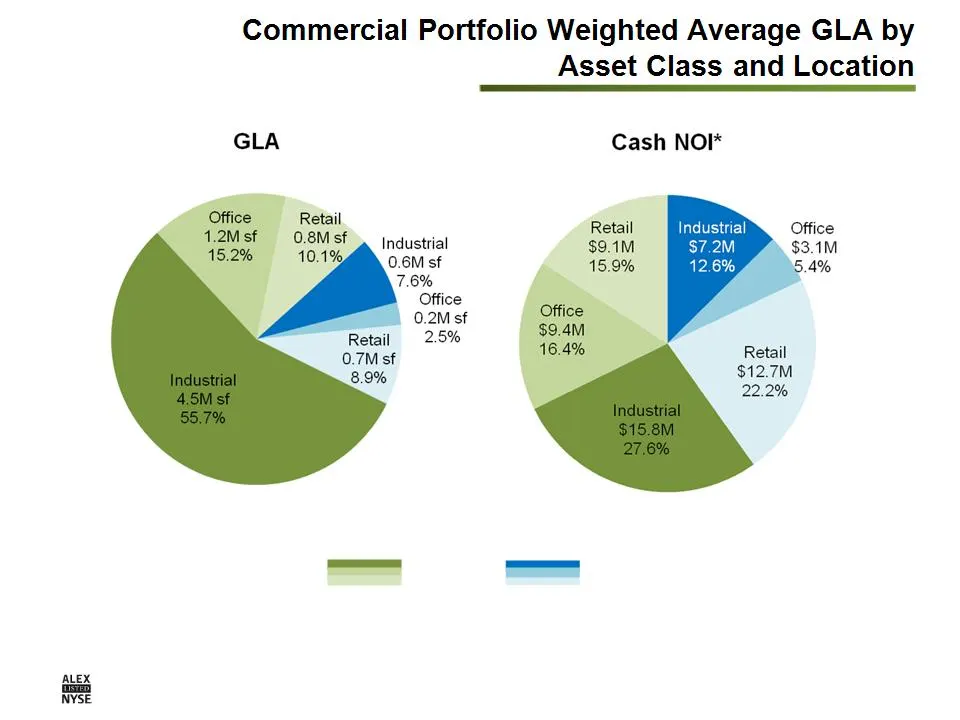
Slide 51: Commercial Portfolio: Mainland and Hawaii
* Includes cash NOI of $3.5M from Hawaii unimproved properties and cash NOI from properties sold in 2011 Mainland Hawaii $60.8M 7.9M sf

Slide 52: Evolving Portfolio Strategy
Evolving Portfolio Strategy § Increase the portfolio’s geographic concentration in Hawaii over time – Hawaii is poised for growth – A&B’s local market knowledge, relationships, and financial strength give it a sustainable competitive advantage in investing in Hawaii commercial properties – A&B’s com
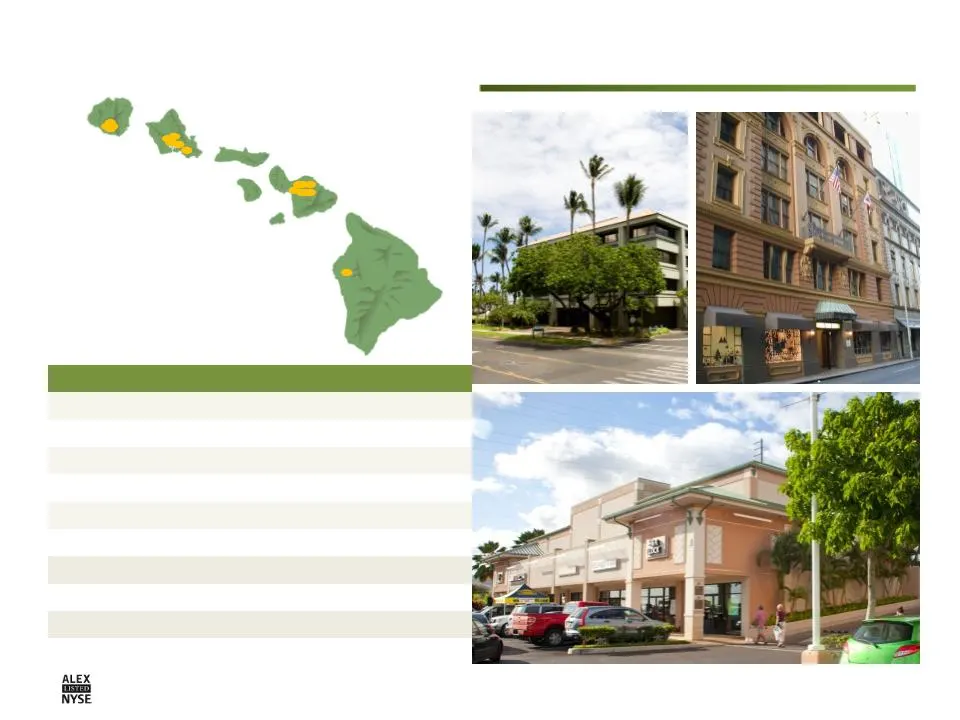
Slide 53: Hawaii Commercial Portfolio
Number of properties 21 Square feet Industrial 560K Office 170K Retail 700K Total 1.4M 2011 occupancy 91% Outstanding debt - Cash NOI $22.2M Cash NOI to total portfolio 36.5% Hawaii Commercial Portfolio
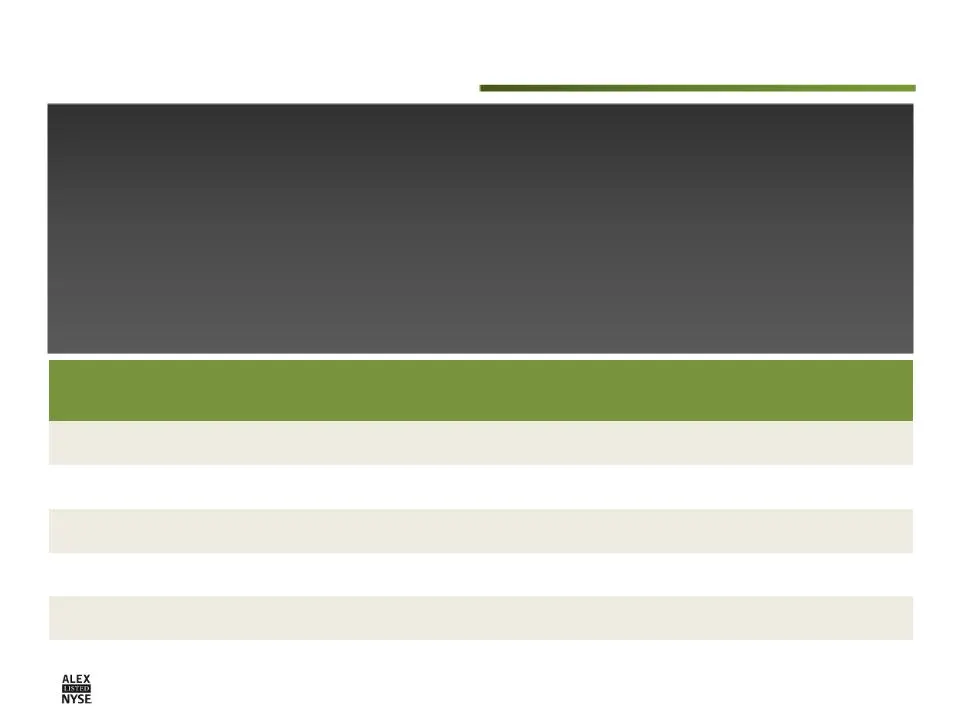
Slide 54: Neighbor Island Retail Market
Top Trends § Slight recovery in the Big Island market due to new development spurring growth § Kauai’s market volatility due to large tenant closure vulnerability § Maui experiencing weakened markets due to tenant consolidation and closings § Maui resort retail centers will begin to turn around with
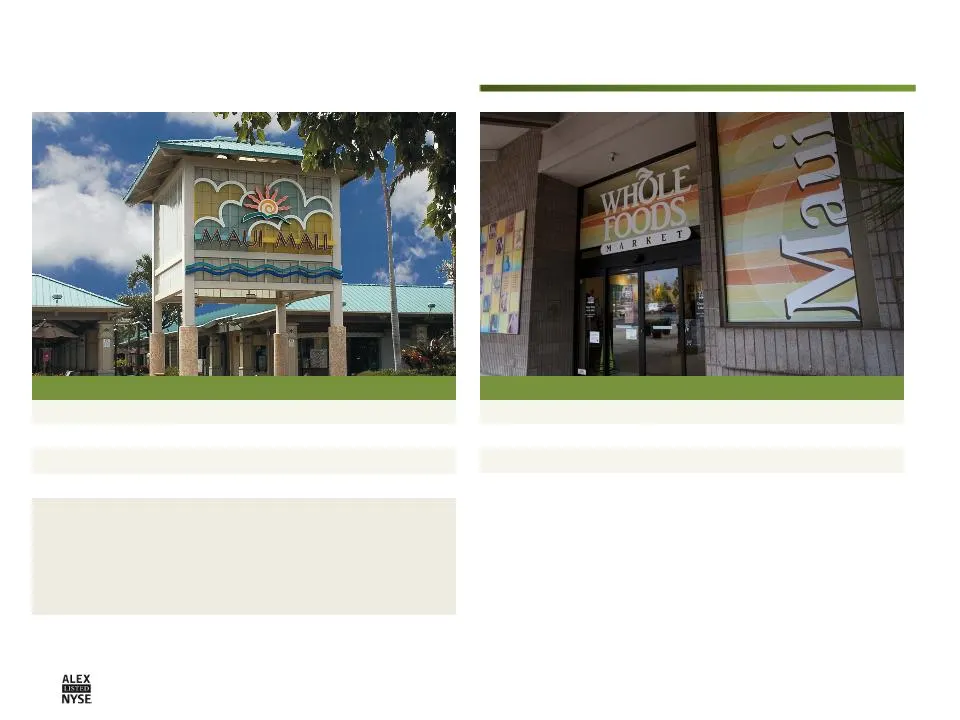
Slide 55: Maui Mall
2011 2010 2009 Gross revenue 4,538 4,270 3,794 Cash NOI 2,736 2,388 2,075 Capital improvements 660 1,402 524 Average occupancy (%) 94 92 91 Location Maui Development date 1971, renovated in 2010 Occupancy at 12/31/11 95% GLA 185,700 Top tenants Checker’s Automotive IHOP Longs Drug Stores Wallace The
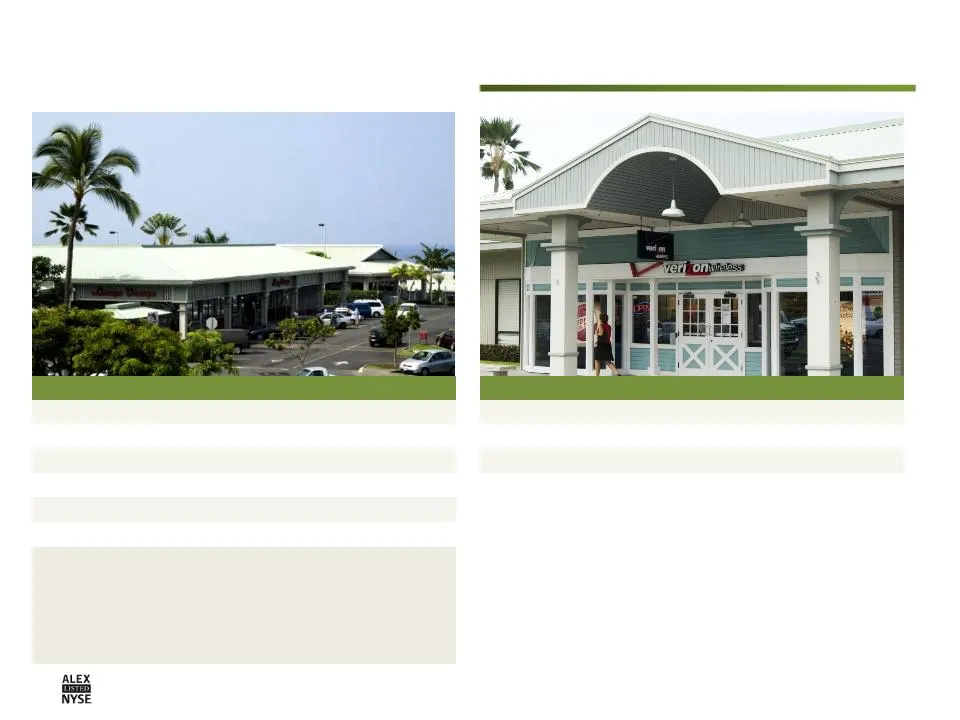
Slide 56: Lanihau Marketplace
2011 2010* 2009 Gross revenue 3,427 2,178 n/a Cash NOI 2,224 1,380 n/a Capital improvements 26 78 n/a Average occupancy (%) 99 98 n/a Location Hawaii (Big Island) Acquisition date April 9, 2010 Acquisition price $22.5 million Date constructed 1987 Occupancy at 12/31/11 99% GLA 88,300 Top tenants Ame
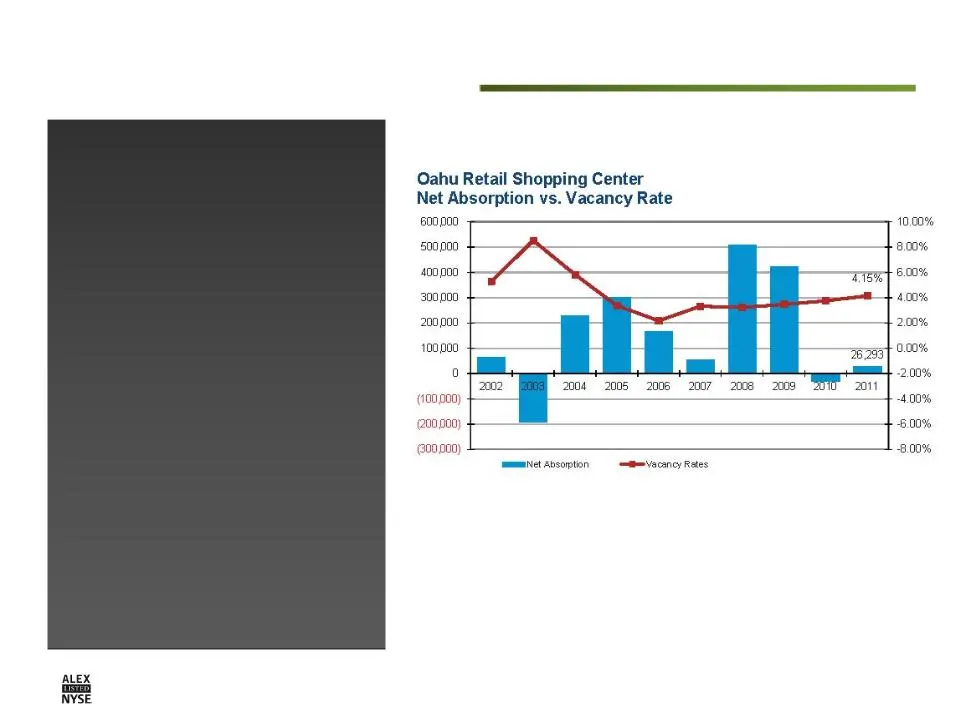
Slide 57: Oahu Retail Market
Top Trends § Retail market is resilient § Oahu market did not decline as much as neighbor islands during the recession § Surge in tourism contributed to retail sales growth § Honolulu remains an attractive retail marketplace Oahu Retail Market Source: Colliers International Research & Consulting
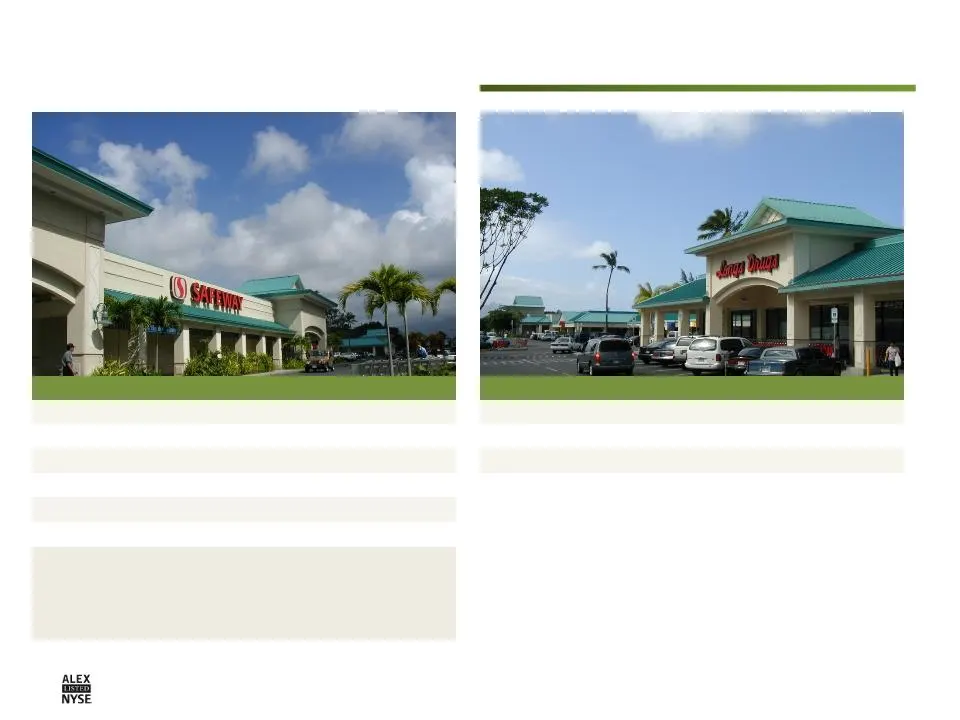
Slide 58: Kaneohe Bay Shopping Center
2011 2010 2009 Gross revenue 4,465 4,269 3,879 Cash NOI 1,853 1,472 1,942 Capital improvements 88 12 44 Average occupancy (%) 97 99 100 Location Oahu Acquisition date June 8, 2001 Acquisition price $13.3 million (leasehold) Date constructed 1971, renovated 2008 Occupancy at 12/31/11 95% GLA 123,900
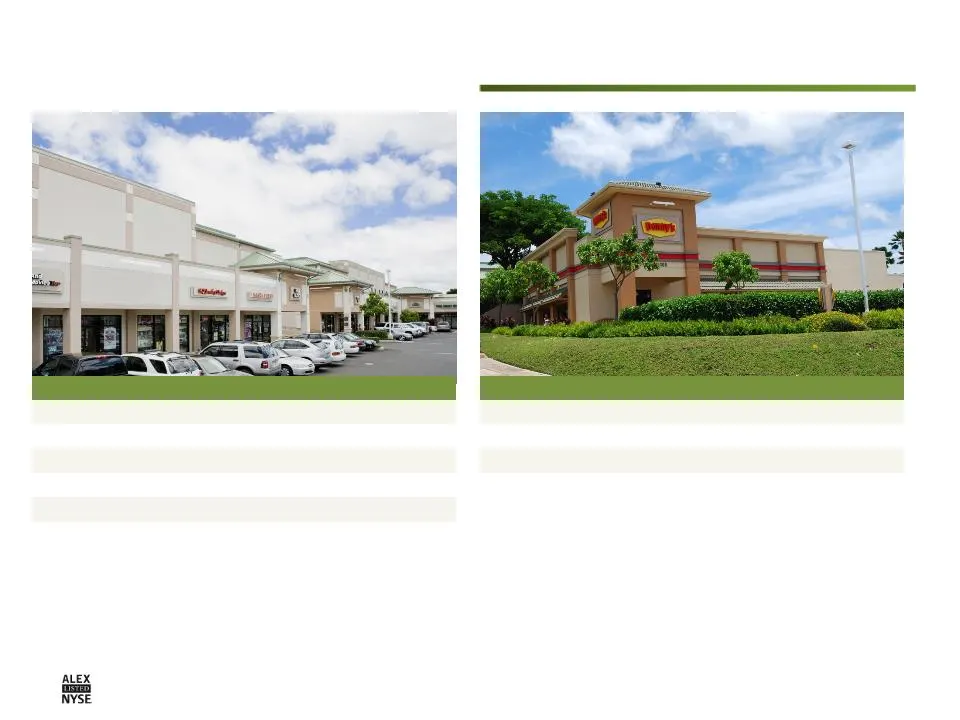
Slide 59: Kunia Shopping Center
2011 2010 2009 Gross revenue 2,849 2,791 3,075 Cash NOI 1,842 1,821 2,098 Capital improvements 36 - - Average occupancy (%) 90 90 96 Location Oahu Developed by A&B 2004 Development cost $13 million Occupancy at 12/31/11 96% GLA 60,400 Top tenants Bank of Hawaii Cole Academy Denny’s Jack In The Box J
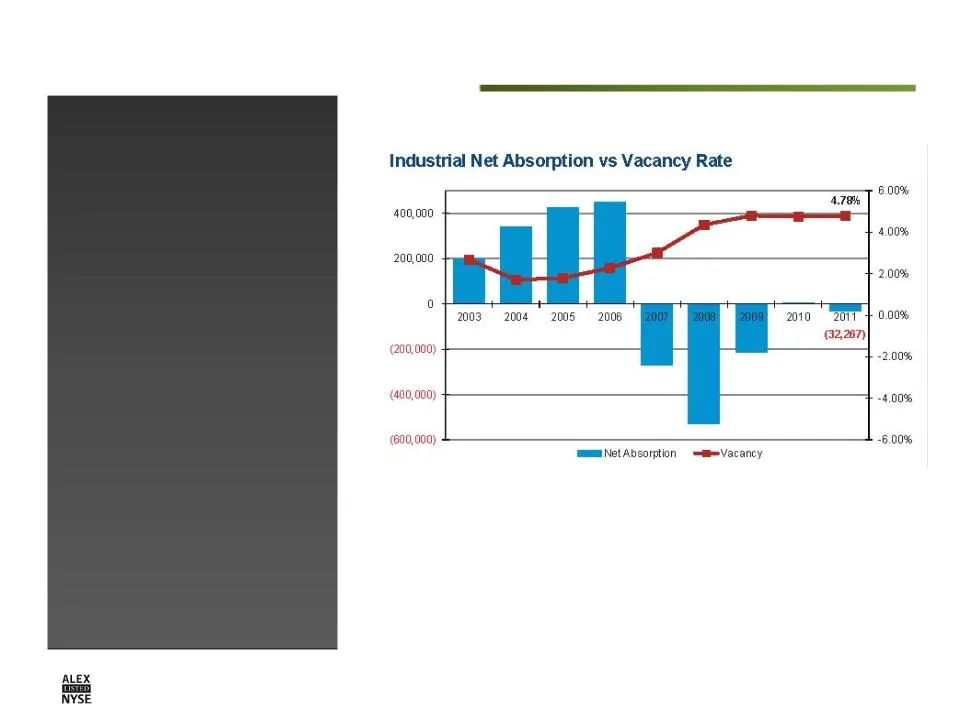
Slide 60: Oahu Industrial Market
Top Trends § Market generally subdued § Vacancy rates held in the 4.3% and 4.8% range since late 2007 § Recent pick up in activity and rents Oahu Industrial Market 4Q11 Source: Colliers International Research & Consulting
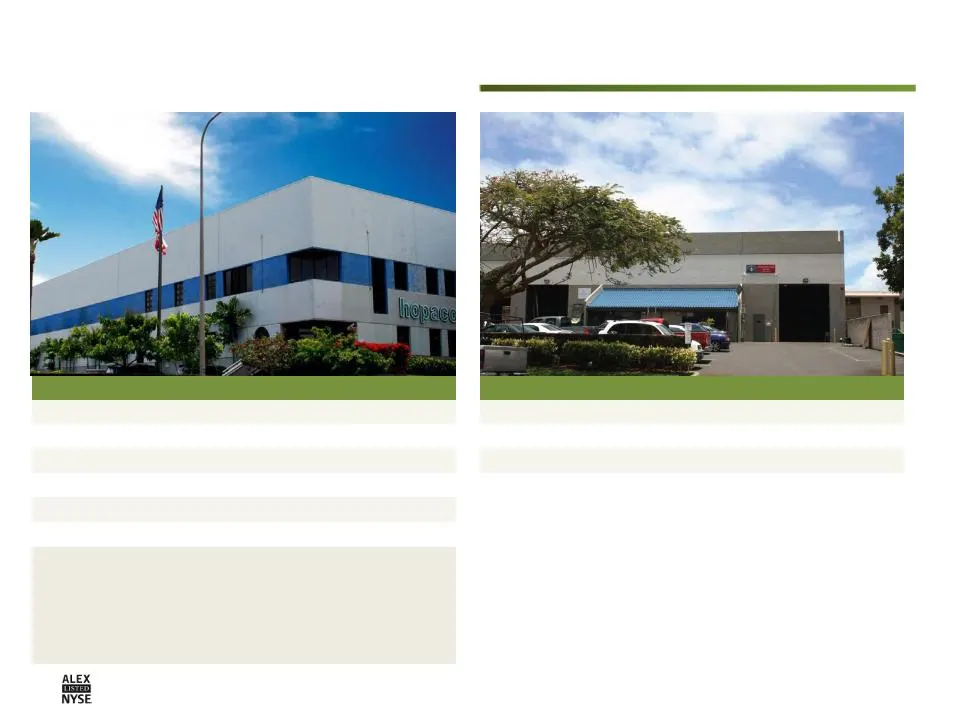
Slide 61: Waipio Industrial
2011 2010 2009* Gross revenue 2,849 2,742 2,149 Cash NOI 2,154 2,078 1,654 Capital improvements 33 82 - Average occupancy (%) 98 97 92 Location Oahu Acquisition date March 4, 2009 Acquisition price $28.3 million Date constructed 1988-1989 Occupancy at 12/31/11 98% GLA 158,400 Top tenants Arcadia Ind
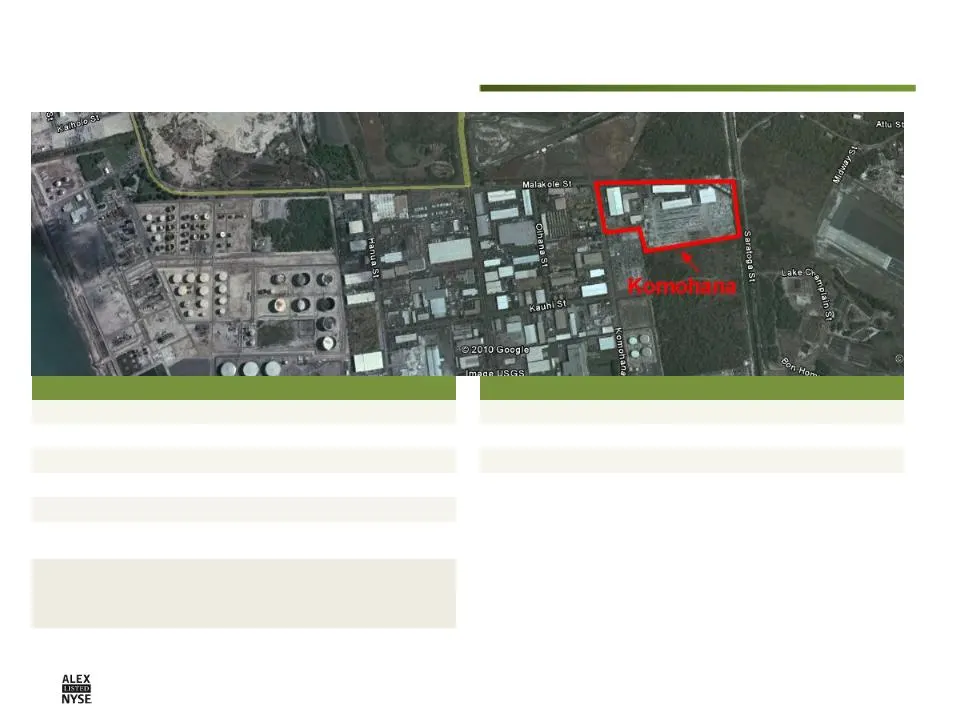
Slide 62: Komohana Industrial Park
2011 2010* 2009 Gross revenue 3,726 1,730 n/a Cash NOI 2,883 1,363 n/a Capital improvements 167 - n/a Average occupancy (%) 77 74 n/a Location Oahu Acquisition date July 20, 2010 Acquisition price $37.7 million Date constructed 1990 Occupancy at 12/31/11 81% GLA 238,300 (plus 29.4-acre ground lease)
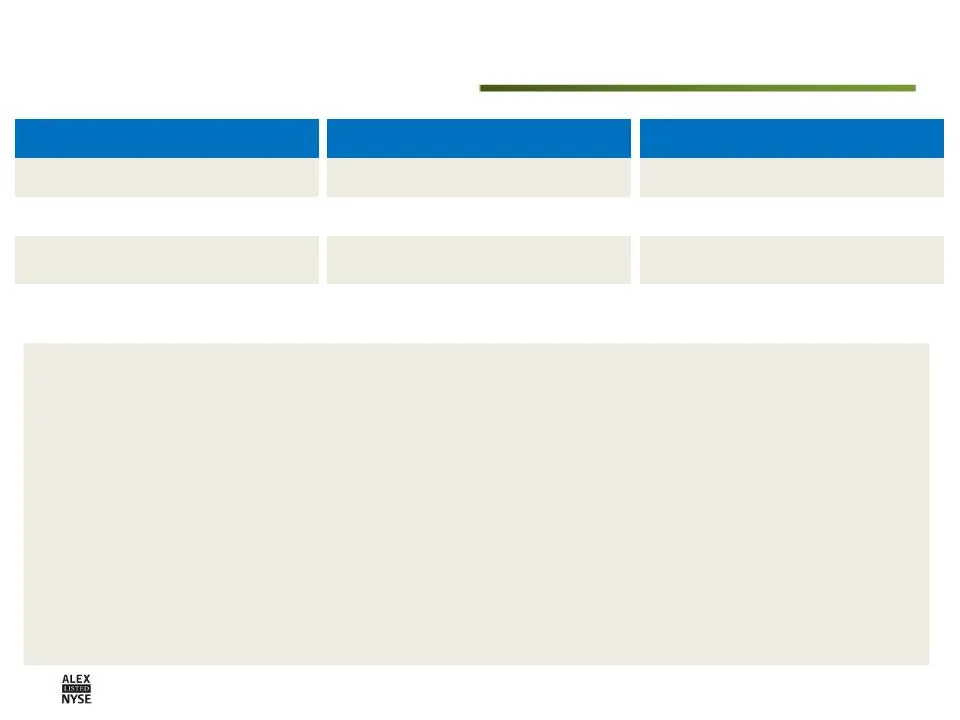
Slide 63: Hawaii Market Summary and 2012 Outlook
Retail YTD net absorption 26,293 SF Vacancy rate 4.16% Average asking rent range $2.94 - $3.92 PSF/MO Average operating expense $1.09 PSF/MO Industrial YTD net absorption (32,267) SF Vacancy rate 4.78% Average asking rent NNN $0.92 PSF/MO Average operating expense $0.31 PSF/MO Office YTD net absorpt
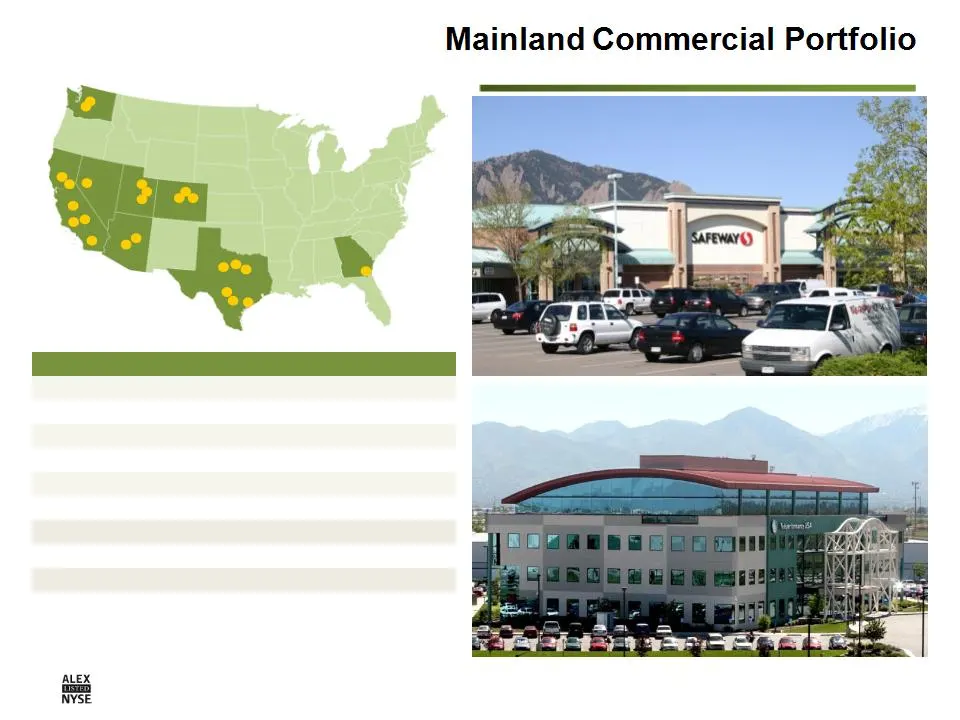
Slide 64: Mainland Commercial Portfolio
Number of properties 24 Square feet Industrial 4.5M Office 1.3M Retail 0.7M Total 6.5M 2011 occupancy 92% Outstanding debt $28.3M Cash NOI $33.6M Cash NOI to total portfolio 55.3%
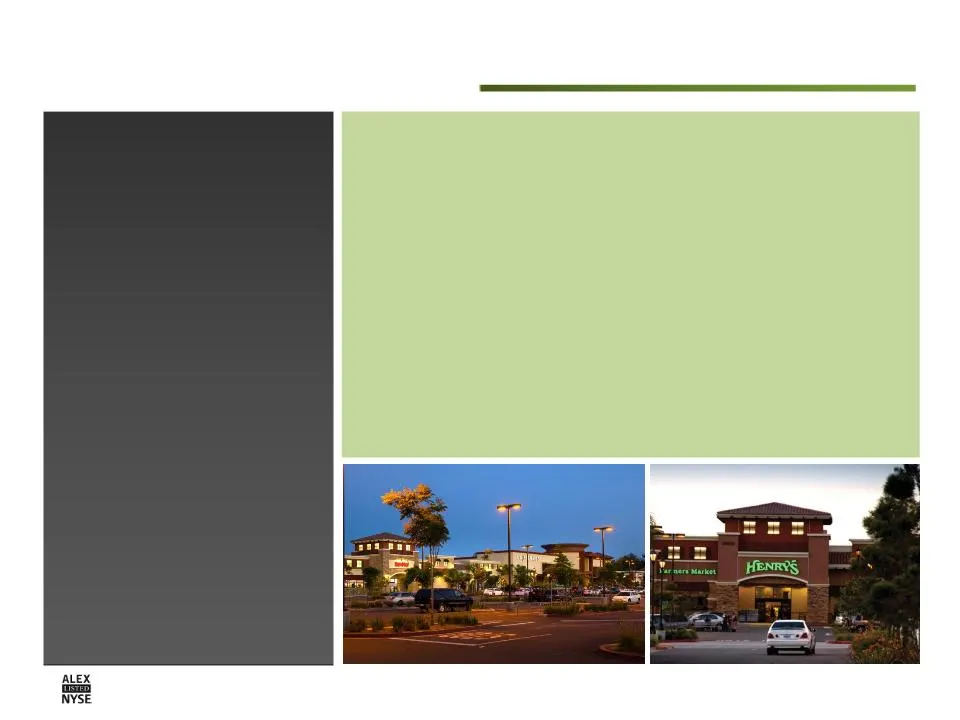
Slide 65: Mainland Retail
Overall Trends § Occupancy showing positive trends in select markets § Retail rents have bottomed and are poised to rise moderately § Absorption gaining momentum Mainland Retail Portfolio Trends § Increased investment interest driving cap rate compression § Market activity gaining momentum § Rents r
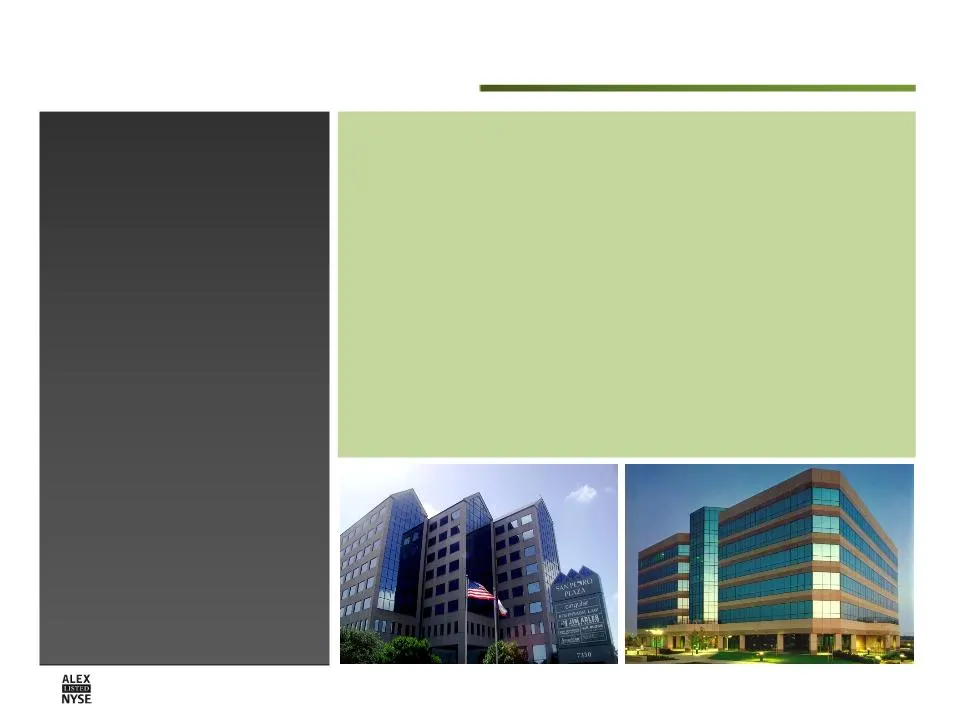
Slide 66: Mainland Office
Overall Trends § Vacancy rates are turning, however high levels indicate rents are years away from recovery § Leasing activity is picking up, but the rate is uneven across markets § Tenant footprints are not increasing Mainland Office Portfolio Trends § Sacramento office market continues to be weak
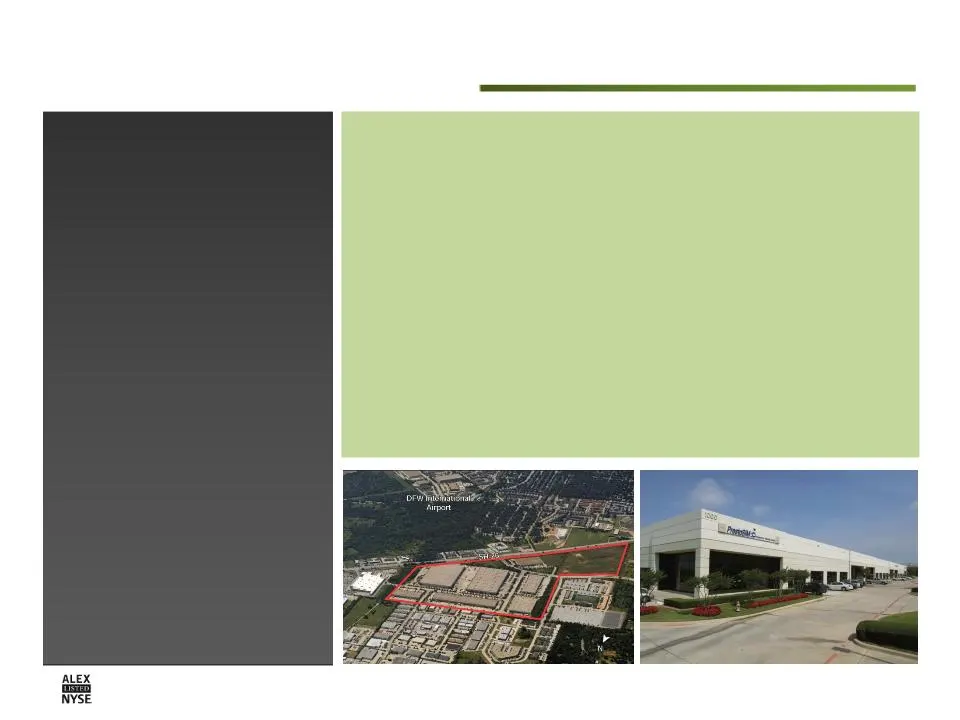
Slide 67: Mainland Industrial
Overall Trends § Vacancy rates falling, lead by port- related users § Rents bottoming out nationally, increasing in select sub markets § Demand for new, high quality industrial space is positive Mainland Industrial Portfolio Trends § Strong recovery noted (TX, CA) § Occupancy higher than national tr
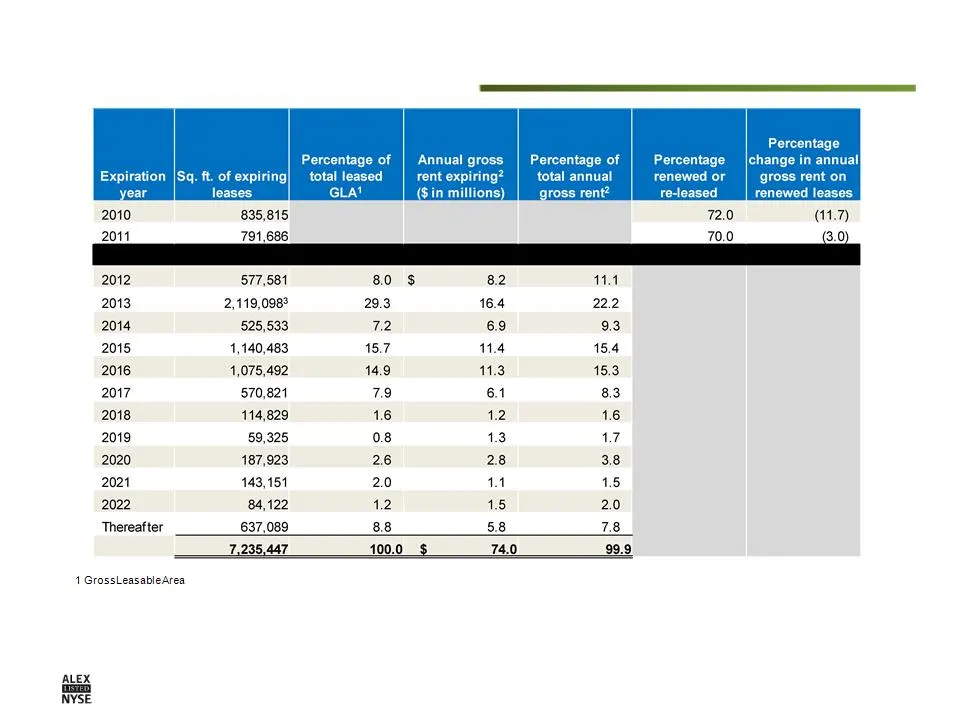
Slide 68: Renewals
Renewals 2 Annual gross rent means the annualized base rent amounts of expiring leases and includes improved properties only. 3 Includes 1,035,676 square feet related to the Savannah Logistics Park, which is 100% leased to Matson Logistics, Inc. Note: The weighted average lease terms of our Hawaii a
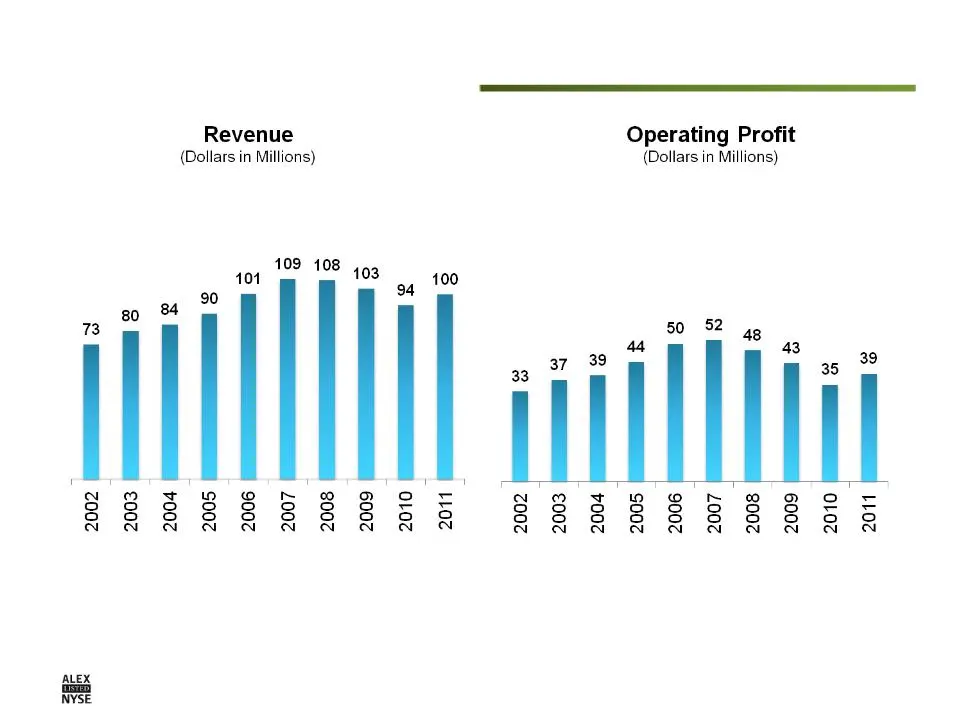
Slide 69: Financial Overview: Real Estate Leasing
Financial Overview Real Estate Leasing
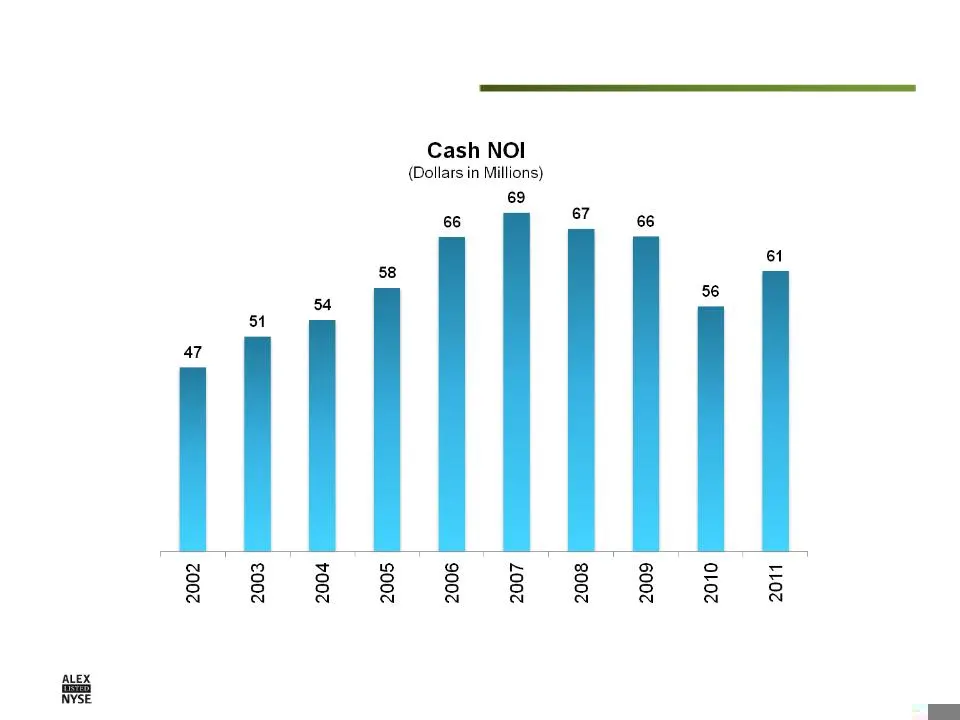
Slide 70: Financial Overview: Real Estate Leasing
Financial Overview Real Estate Leasing
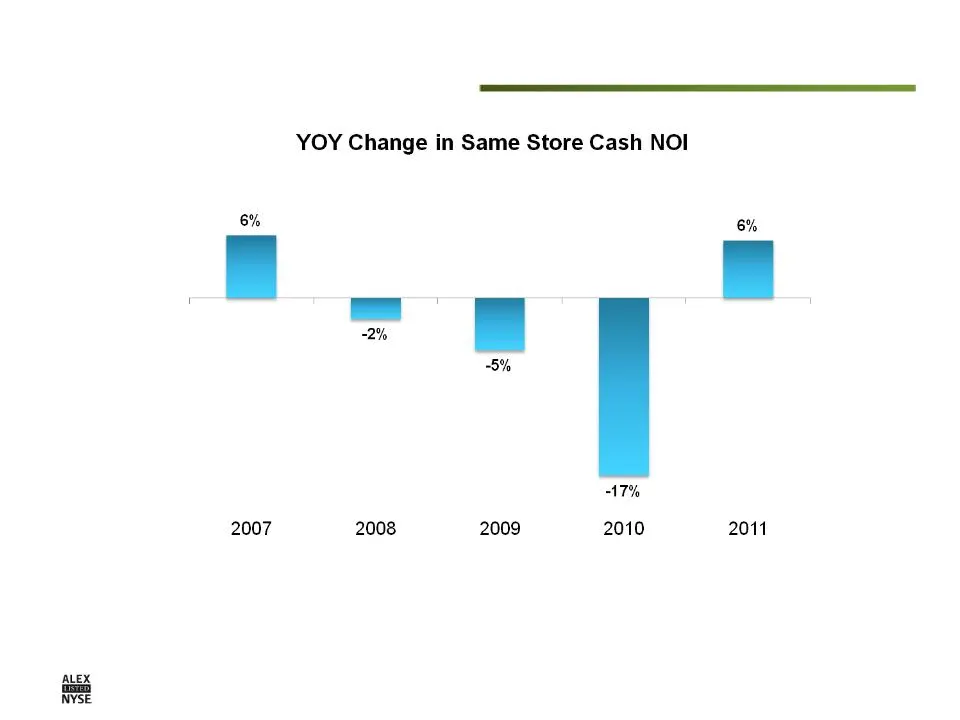
Slide 71: Financial Overview: Real Estate Leasing
Financial Overview Real Estate Leasing
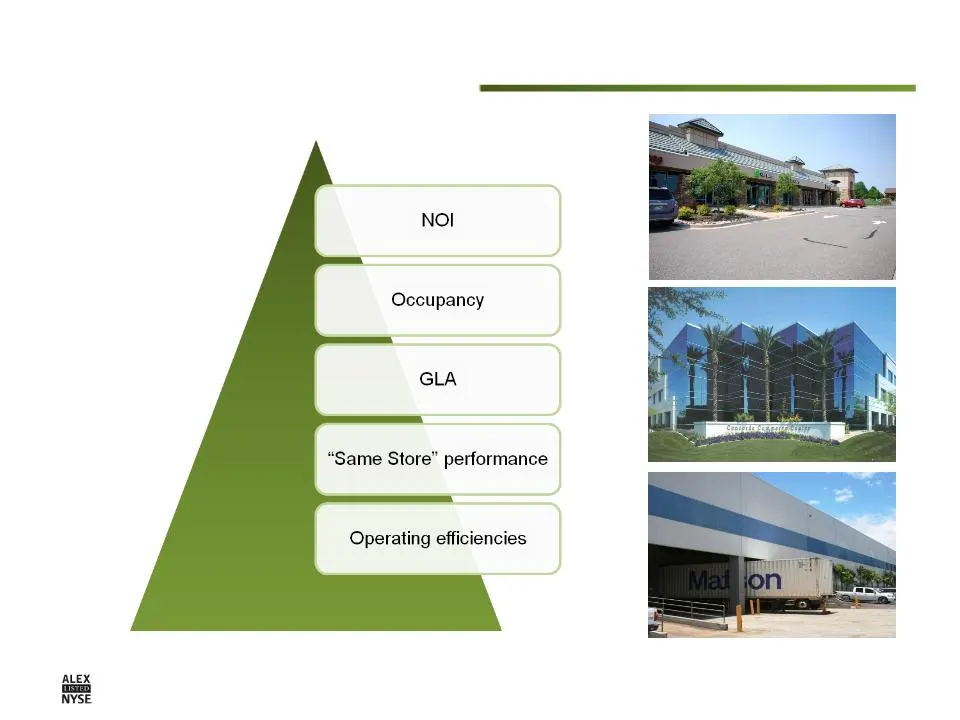
Slide 72: NOI, Occupancy and Same Store Performance
> i ie 3 NOI Occupancy GLA “Same Store” performance Operating efficiencies
Slide 73: Real Estate Leasing Summary
§ Commercial portfolio has been assembled through 1031 exchanges (32 properties), development (10 properties) and acquisitions (3 properties) § $213 million of deferred taxes utilized for acquisitions as of 12/31/11 § Provides consistent earnings and cash flow § Will continue to be a long-term value
Slide 74: Q&A
Q&A
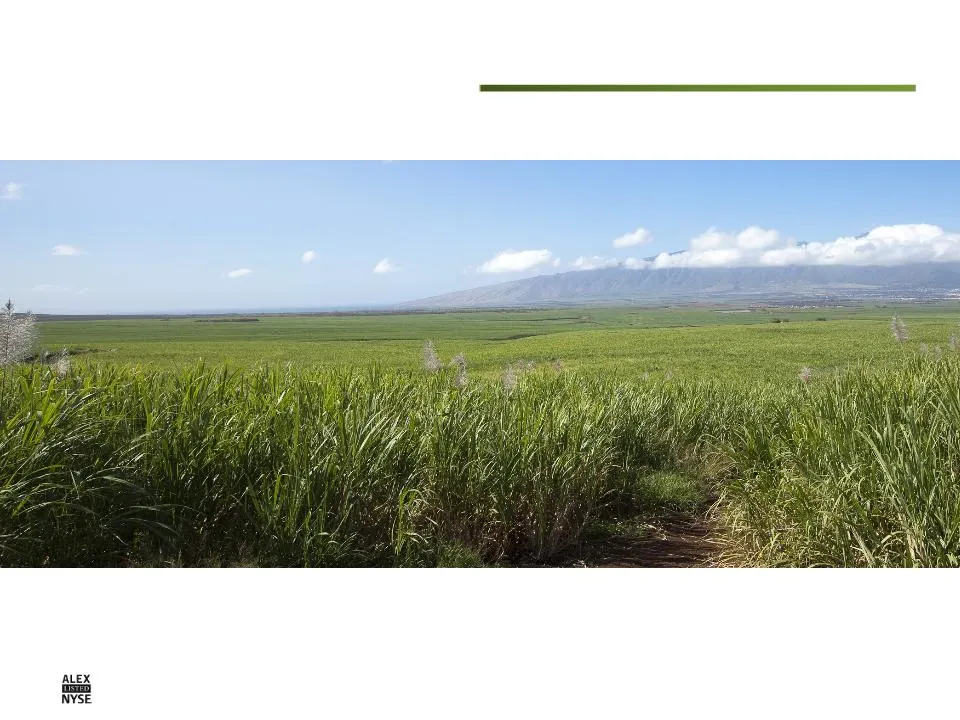
Slide 75: Land Stewardship and Agribusiness
Land Stewardship and Agribusiness
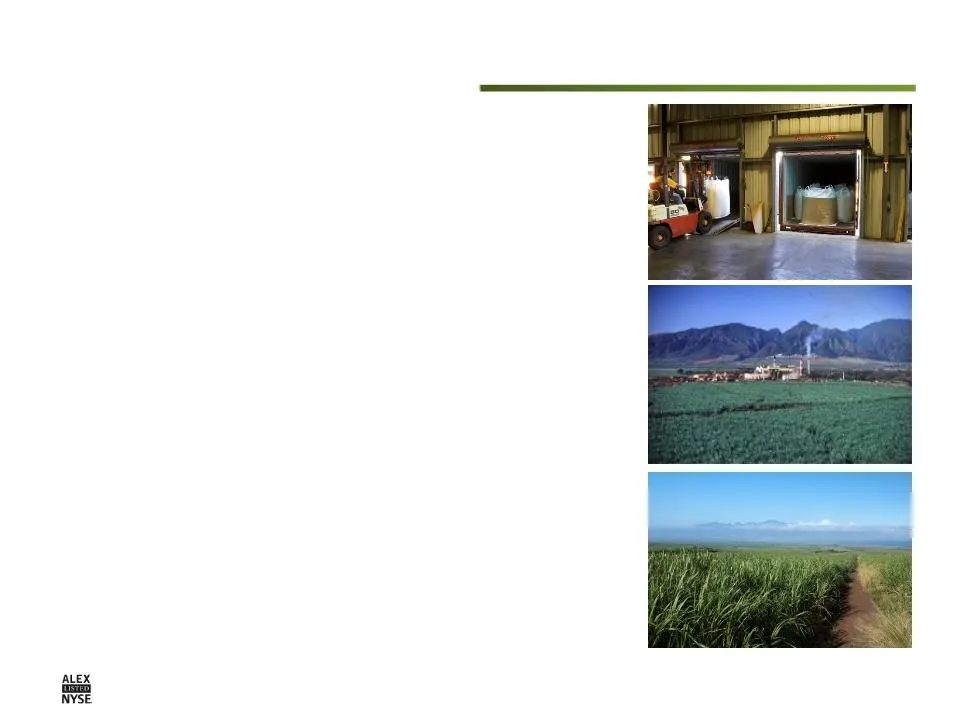
Slide 76: Agribusiness Results
Agribusiness Results What’s Included? § HC&S results – Raw & Specialty Sugar – Power § McBryde Resources results (Kauai) ‒ Renewable energy ‒ Agricultural leasing § Supporting trucking operations
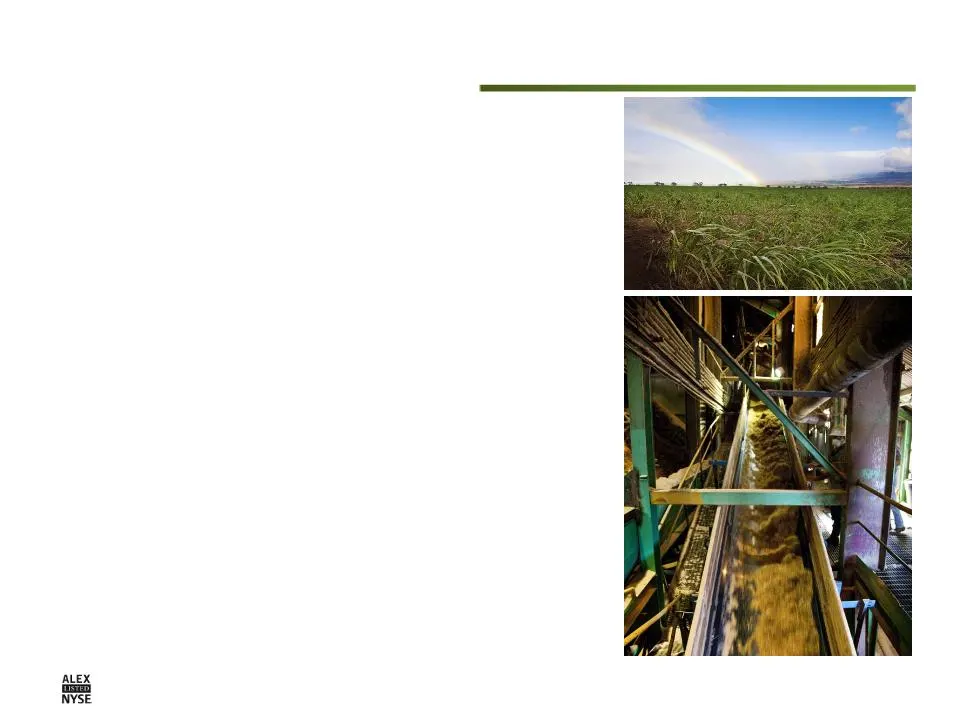
Slide 77: Land Stewardship
Land Stewardship § Extensive conservation lands on Maui and Kauai used for watershed and hydroelectric energy purposes § A&B owns some of the highest quality ag lands in the state – Highest and best use of core landholdings: agribusiness – Largest contiguous, irrigated farm § Significant improvement

Slide 78: Agribusiness as a Core Strategy
Agribusiness as a Core Strategy § Represents highest and best use of most lands § Facilitates ongoing maintenance of key infrastructure elements § Generated $23.5 million of operating cash flow in 2011 § Increasingly a potential source of growth via renewable energy opportunities: – Solar – Hydroele
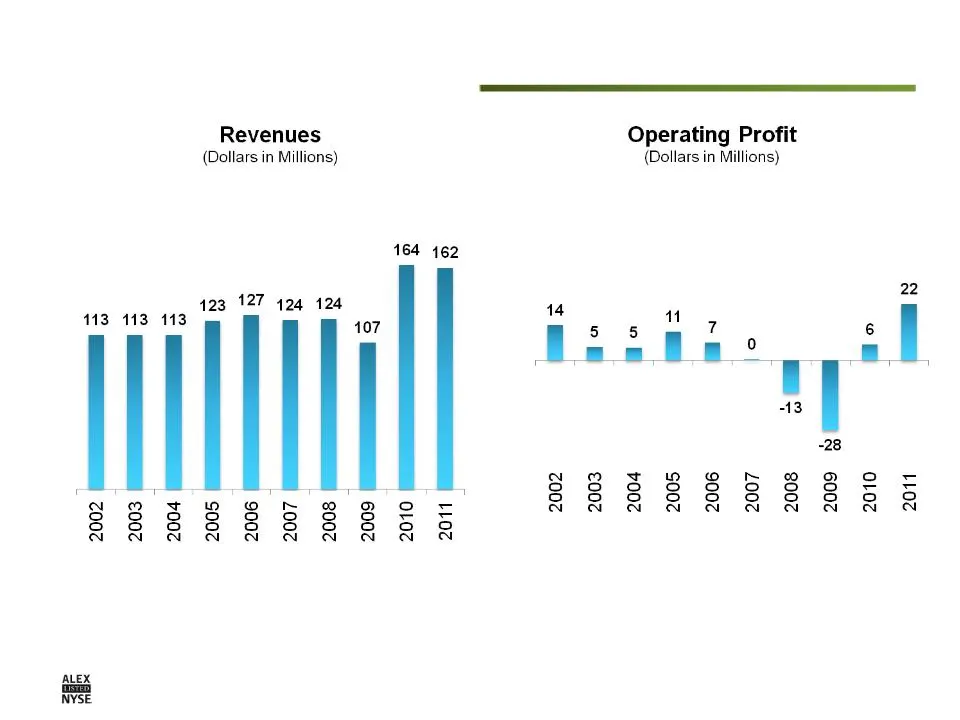
Slide 79: Operating Profit and Revenues
Operating Profit (Dollars in Millions) Revenues (Dollars in Millions) 164 162 x
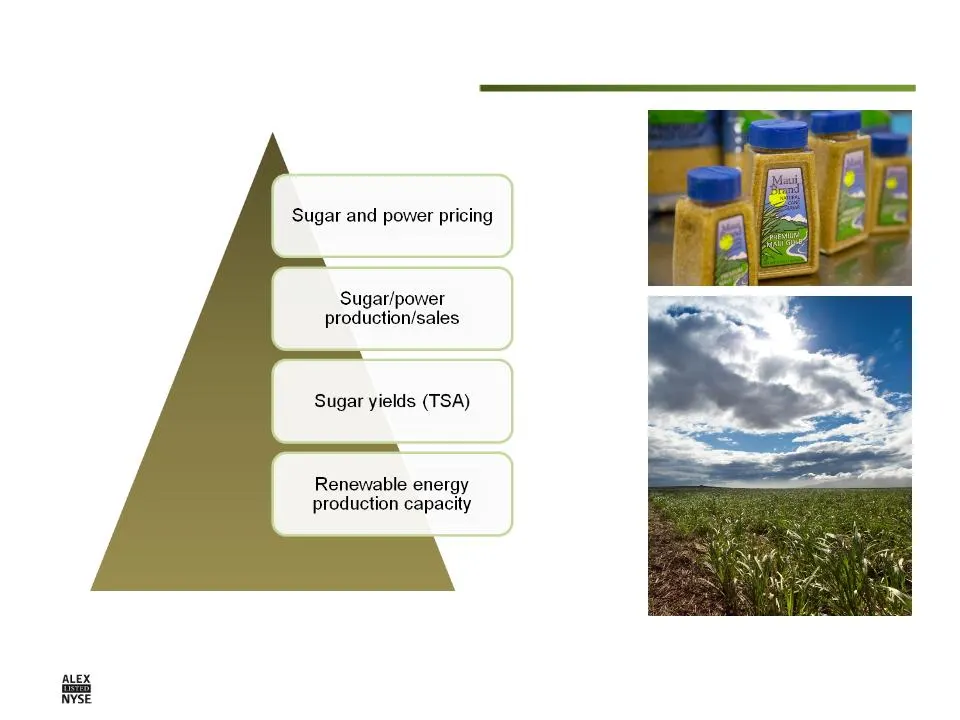
Slide 80: Sugar and Power Pricing
Sugar and power pricing Sugar/power production/sales Sugar yields (TSA) Renewable energy production capacity a
Slide 81: Landholdings
Landholdings
Slide 82: Hawaii Landholdings
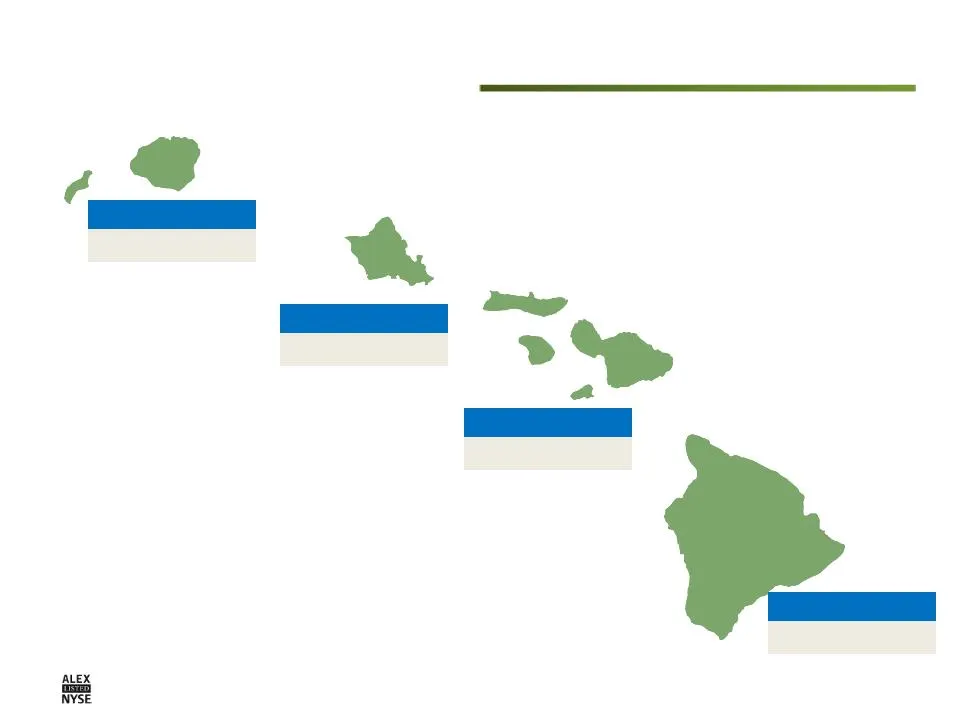
KAUAI 20,375 acres OAHU 70 acres MAUI 67,240 acres BIG ISLAND 10 acres Hawaii Landholdings As of December 31, 2011 88,000 acres in the state
Slide 83: Maui and Kauai Land Use
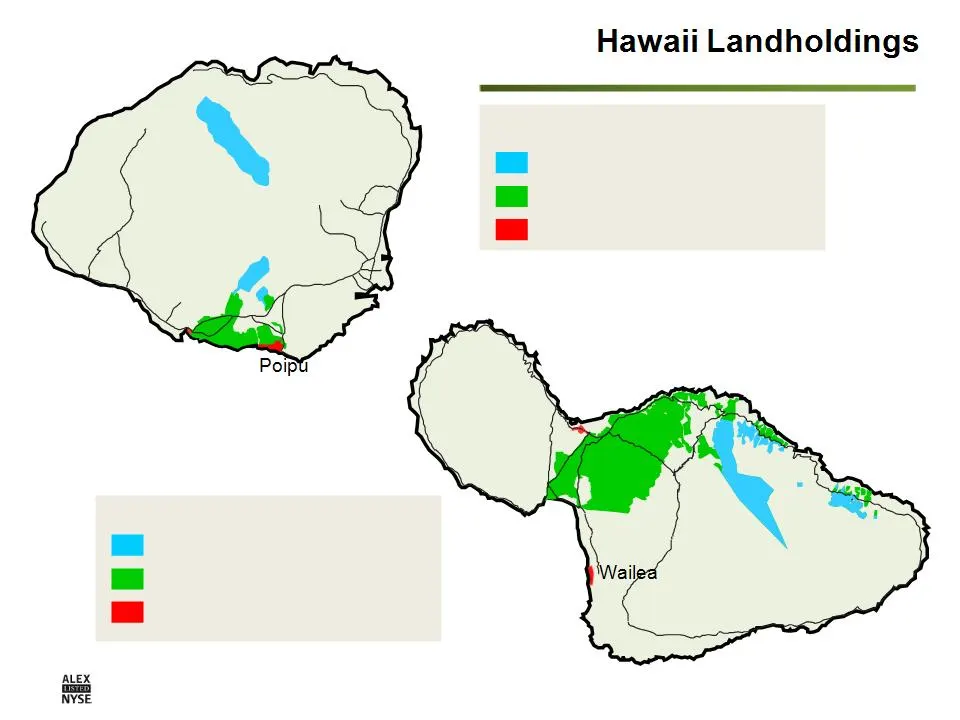
Kihei Kahului Conservation 15,850 acres Agriculture 50,831 acres Urban/Entitled 559 acres Maui - 70,000 acres * Includes 961 acres at Kukui’ula joint venture Lihue Wainiha Conservation 13,320 acres Agriculture 6,944 acres Urban/Entitled1,072 acres* Kauai - 20,000 acres Princeville
Slide 84: Landholdings by Entitlement and Use
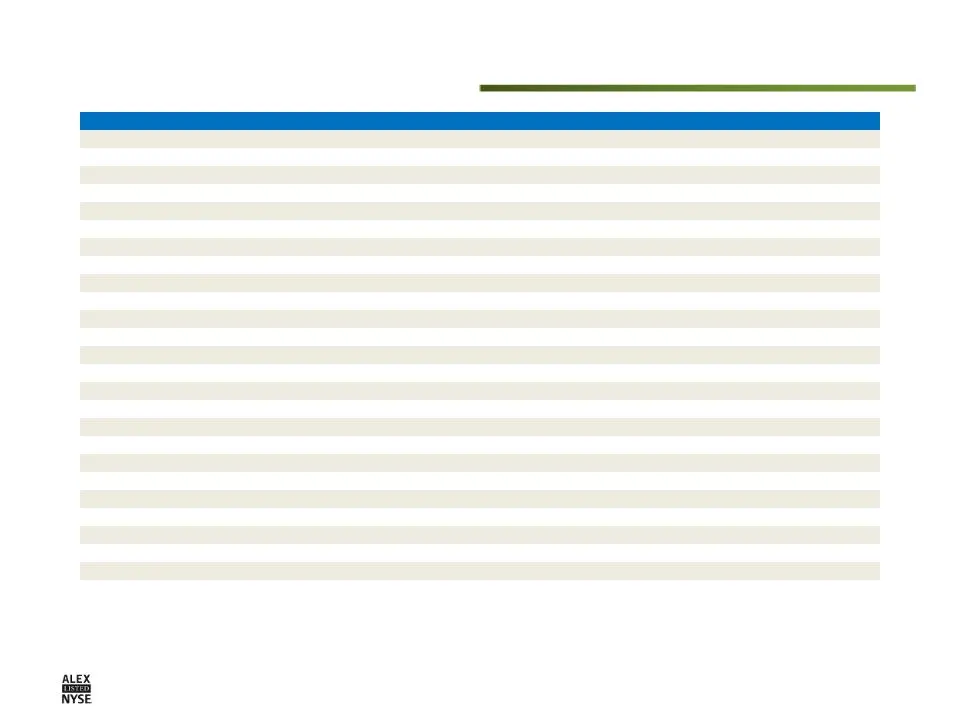
Description Maui Kauai Oahu Big Island Mainland Total Acres Fully entitled Hawaii - development/other Active development/sales 231 - 7 - - 238 Future development 174 44 - - - 218 Ground leases to third parties 64 1 - - - 65 Land used by affiliates 22 4 - - - 26 Other, including land not planned for
Slide 85: Valuation
ALEX fo NYSE

Slide 86: Valuation Methodologies - Overall Approach
Valuation Methodologies - Overall Approach § “Sum-of-the-parts” approach to perform a Net Asset Valuation most commonly used ‒ Break down holdings into key asset classes ‒ Value assets within asset class using one or more methodologies ‒ Sum and subtract certain liabilities § A&B does not routinely
Slide 87: Valuation Methodologies
Asset Class Valuation Methodologies Income properties Commercial properties Capitalized income or comparable sales Ground leases Capitalized income or comparable sales Development lands Active developments Discounted cash flow or value of land, as is Future or planned dev. Value of land, as is or NP
Slide 88: Asset Class Information & Data Sources
Asset Class Information & Data Sources Income properties Commercial properties Company : 10-K, RE Supplement (pg. 37-77) Presentations, Website, Form 10 Third Party: Commercial Property Brokers, REITs, NAREIT, CCIM, Other HI public co.’s, commercial property sales listing websites (e.g., Loopnet) Gr
Slide 89: Valuation Methodologies - Market Data
Valuation Methodologies - Market Data North Shore/Upcountry Maui Ag Zoned Land Sales Comps (Haiku /Kula /Makawao /Olinda) 2006 to 2011 Source: A&B compilation and analysis of Maui Board of Realtors data
Slide 90: Valuation Methodologies - Market Data
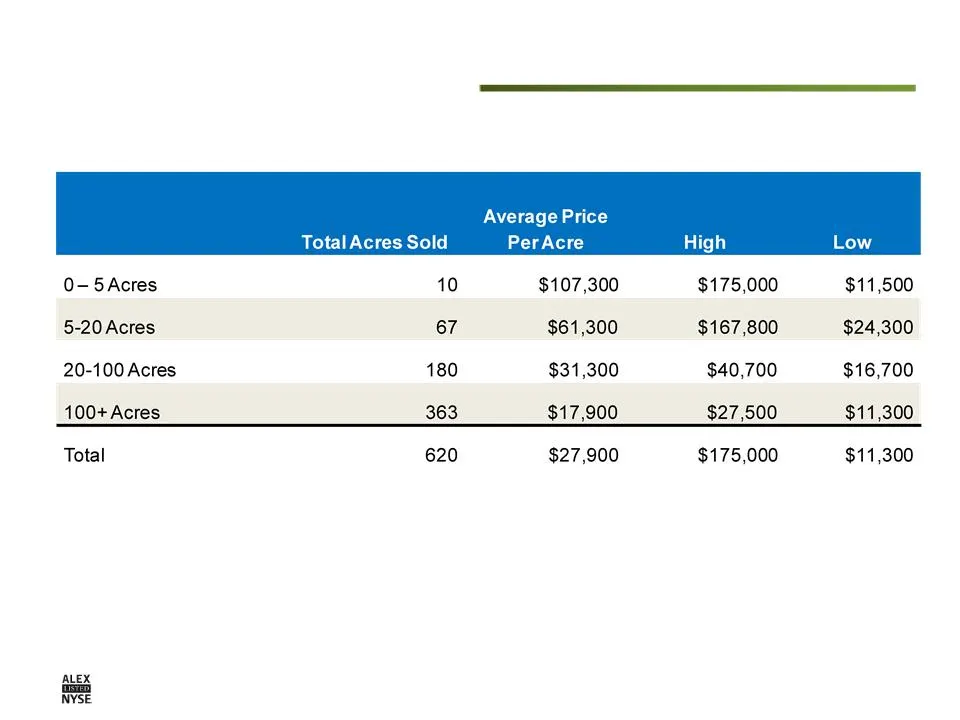
Valuation Methodologies - Market Data Kauai Ag Zoned Land Sales Comps 2007 to 2010 Source: A&B compilation and analysis of Hawaii Information Service data
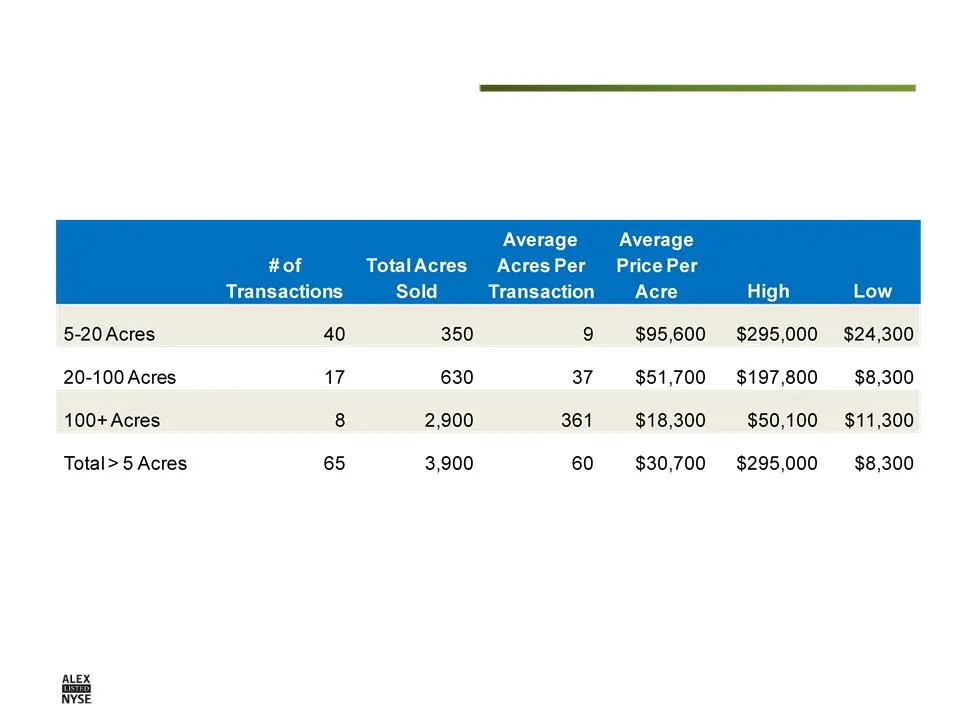
Slide 91: A&B Ag Zoned Land 5-Year Sales Data
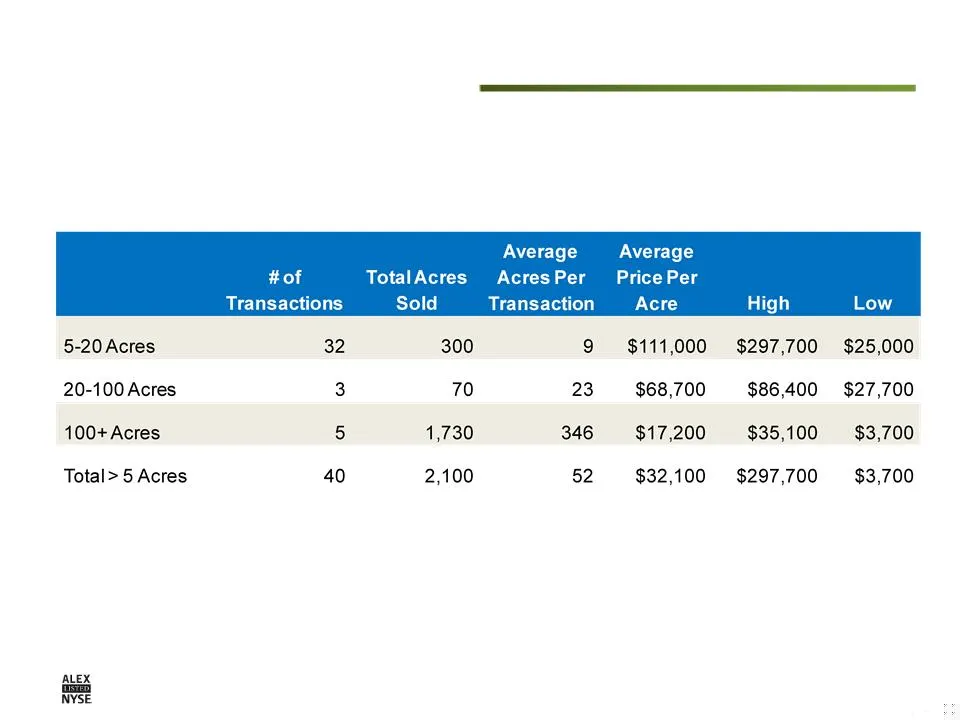
Valuation Methodologies - A&B Ag Zoned Land 5-Year Sales Data A&B Ag Zoned Land Sales Transactions 2007 to 2011 A&B’s gross margin on unimproved land sales averaged 87% from 2007-2011
Slide 92: Closing Remarks
Closing Remarks

Slide 93: A&B: Investment Thesis
A&B: Investment Thesis 1. Unique assets & competitive strengths – Land – Commercial portfolio – Agriculture – People, Hawaii experience, reputation 2. Proven track record of creating shareholder value 3. Embedded growth opportunities in a development pipeline positioned for market recovery 4. Health
Slide 94: Q&A
Q&A

Slide 95: Where to Find Additional Information
Where to Find Additional Information This communication does not constitute an offer to sell or the solicitation of an offer to buy any securities or a solicitation of any vote or approval. Alexander & Baldwin Holdings, Inc. (“Holdings”) filed a registration statement that includes a preliminary pro

Slide 96: Participants in the Merger Solicitation
Participants in the Merger Solicitation A&B, its directors, executive officers, certain other members of management, and employees may be deemed to be participants in the solicitation of proxies from the shareholders of A&B in favor of the proposed holding company reorganization. Additional informat
Source: SEC EDGAR · 8-K filed Apr 10, 2012
More decks from Alexander & Baldwin Holdings Inc
 Q2 2025 Earnings Presentation21 slides · Jul 24, 2025
 Q4 2023 Earnings Presentation27 slides · Feb 28, 2024
 Investor Presentation (September 2022)33 slides · Sep 9, 2022
 Investor Presentation (January 2022)39 slides · Jan 10, 2022
 Investor Presentation (December 2021)39 slides · Dec 15, 2021
 Q4 2017 Earnings Presentation33 slides · Mar 1, 2018