UNITIL Corporation · NYSE:UTL
UNITIL — Q3 2026 Earnings Presentation
27 slides from UNITIL's earnings presentation, Nov 3, 2026

Slide 1: Q3 2026 Financial Results and Strategic Update
Q3 2026 Financial Results and Strategic Update November 3, 2026
Slide 2: Forward-Looking Statements and Use of Non-GAAP Measures
Forward-Looking Statements and Use of Non-GAAP Measures This presentation contains “forward-looking statements” including within the meaning of the safe harbor provisions of the Private Securities Litigation Reform Act of 1995. All statements, other than statements of historical fact, included in th
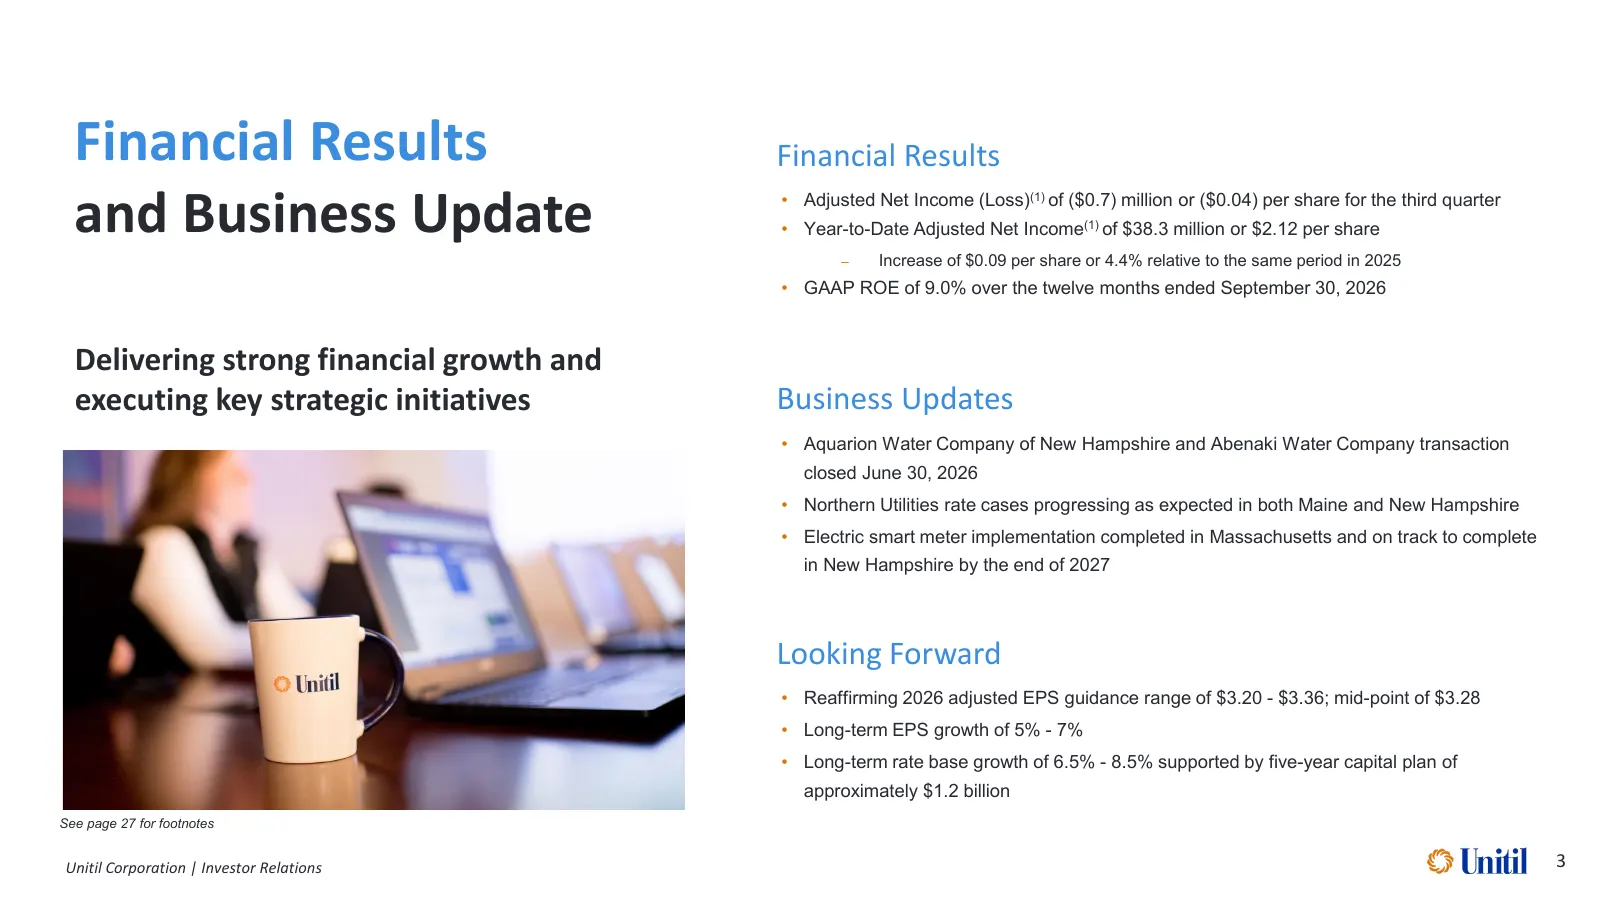
Slide 3: Financial Results and Business Update
Financial Results Financial Results and Business Update • Adjusted Net Income (Loss)(1) of ($0.7) million or ($0.04) per share for the third quarter • Year-to-Date Adjusted Net Income(1) of $38.3 million or $2.12 per share – Increase of $0.09 per share or 4.4% relative to the same period in 2025 • G
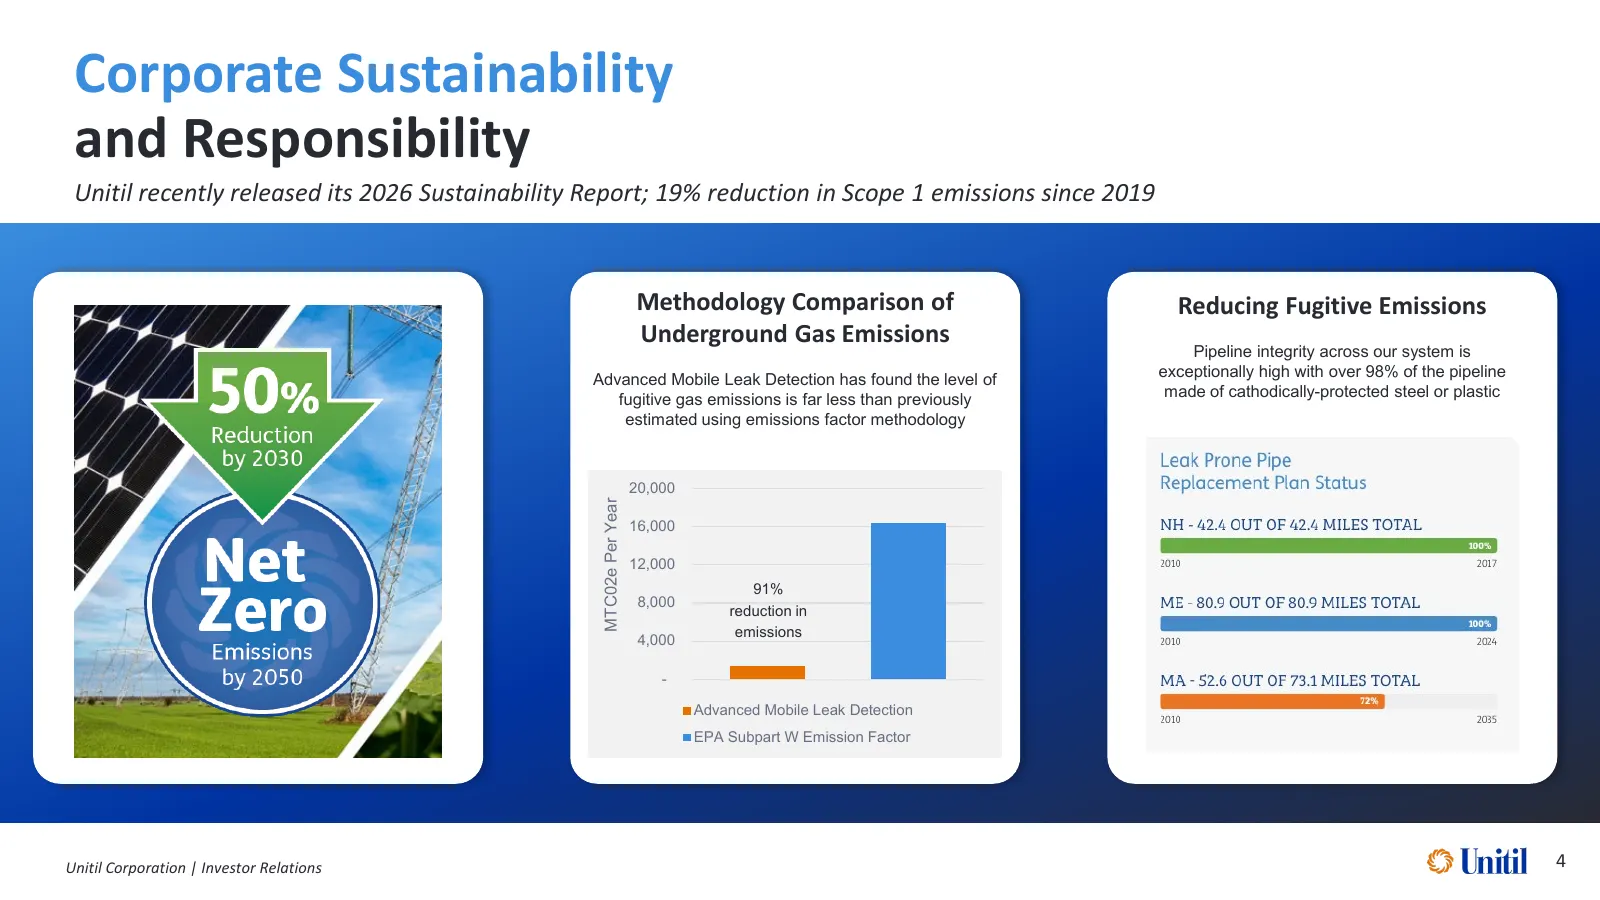
Slide 4: Corporate Sustainability and Responsibility
Corporate Sustainability and Responsibility Unitil recently released its 2026 Sustainability Report; 19% reduction in Scope 1 emissions since 2019 Methodology Comparison of Reducing Fugitive Emissions Underground Gas Emissions Pipeline integrity across our system is Advanced Mobile Leak Detection ha
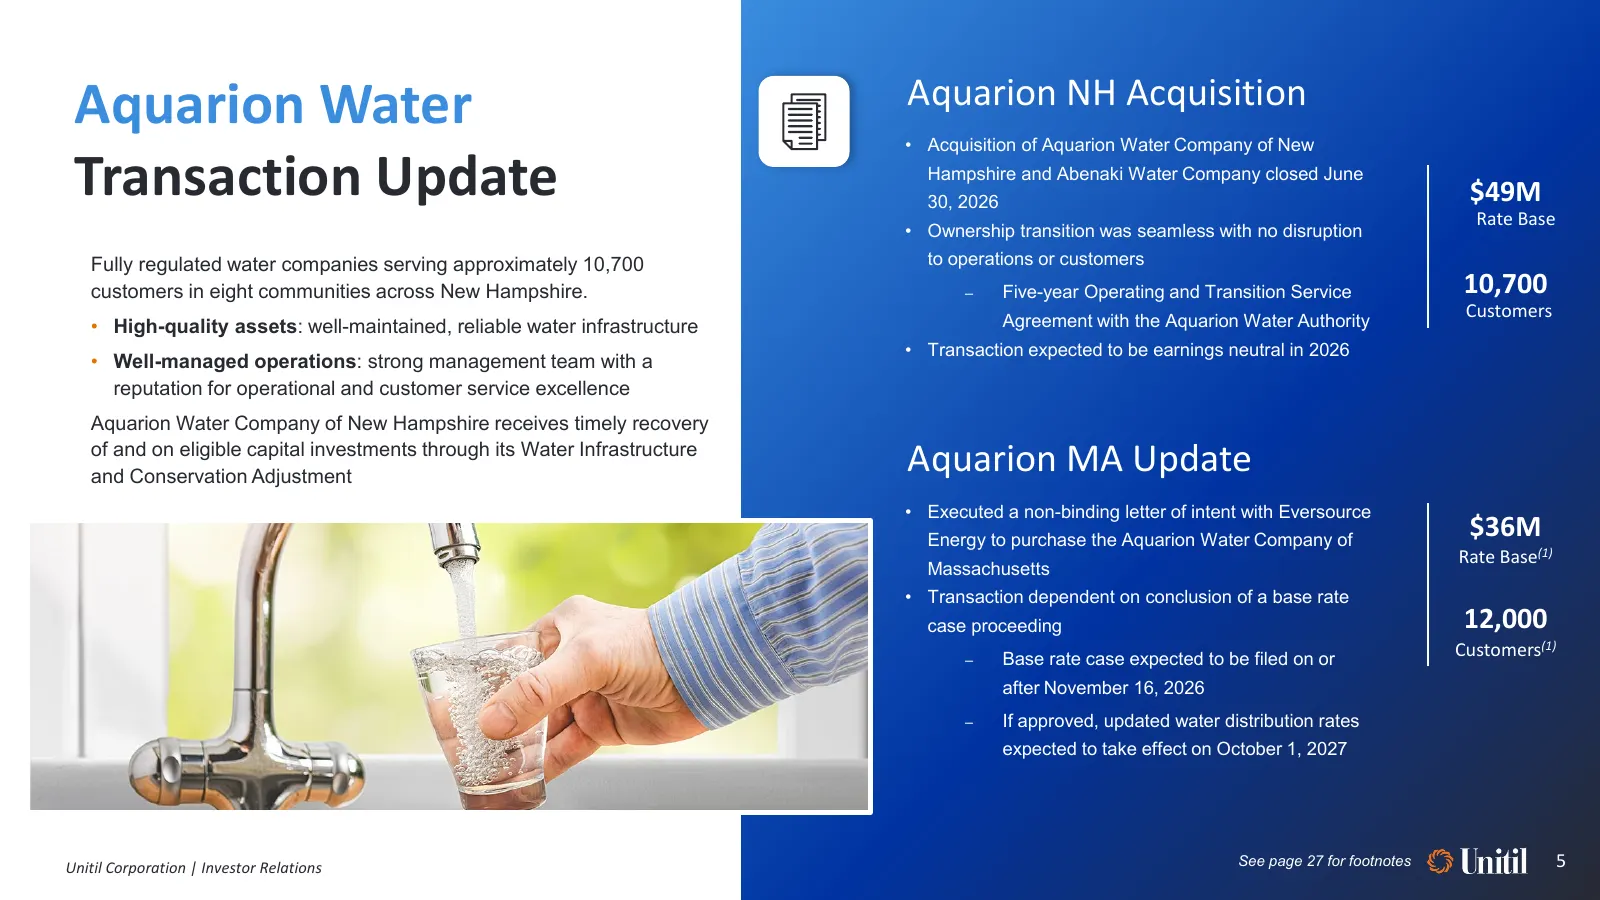
Slide 5: Aquarion Water Transaction Update
Aquarion Water Aquarion NH Acquisition • Acquisition of Aquarion Water Company of New Transaction Update Hampshire and Abenaki Water Company closed June 30, 2026 $49M Rate Base • Ownership transition was seamless with no disruption Fully regulated water companies serving approximately 10,700 to oper
Slide 6: Third Quarter 2026 Financial Results
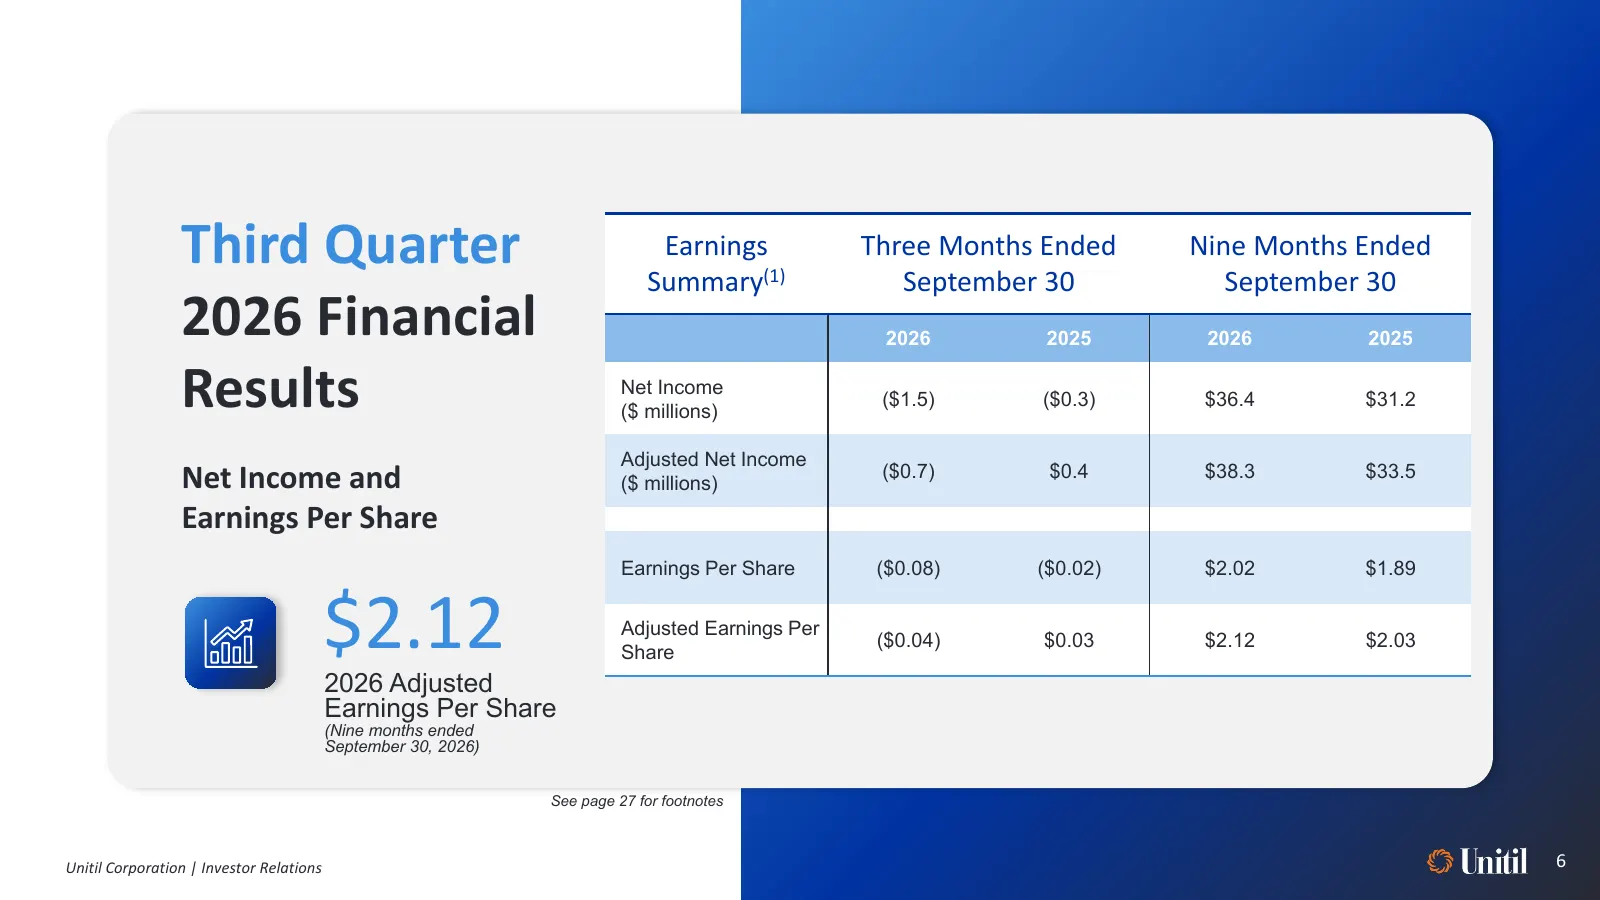
Third Quarter Earnings Summary(1) Three Months Ended September 30 Nine Months Ended September 30 2026 Financial 2026 2025 2026 2025 Results Net Income ($ millions) ($1.5) ($0.3) $36.4 $31.2 Adjusted Net Income Net Income and ($ millions) ($0.7) $0.4 $38.3 $33.5 Earnings Per Share Earnings Per Share
Slide 7: Sales Volume and Adjusted Gross Margin Variances
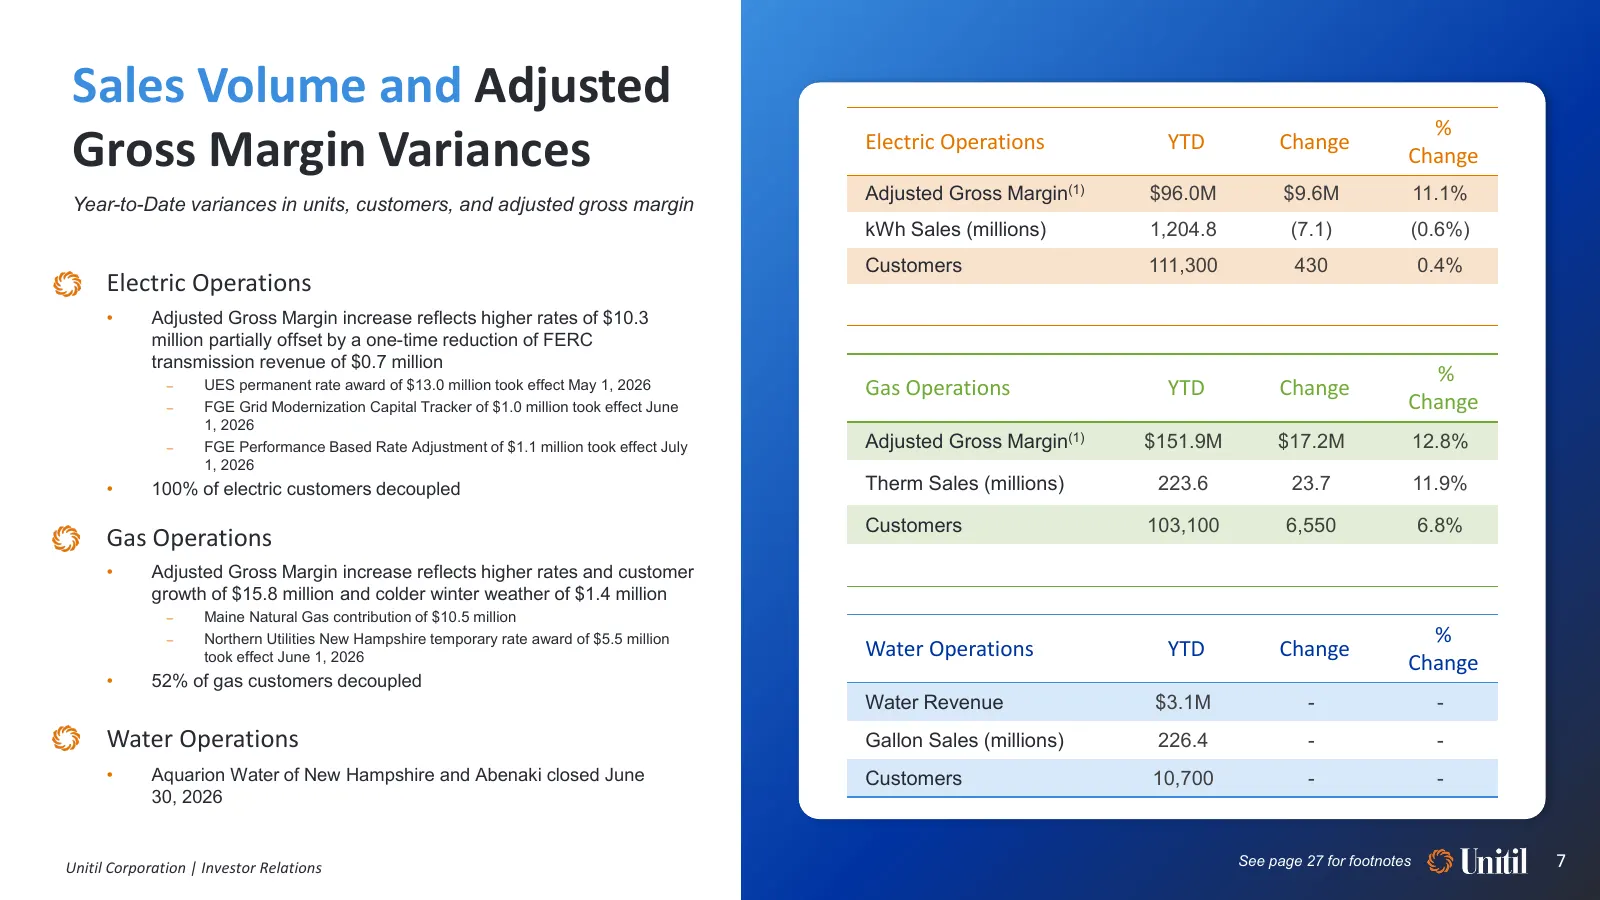
Sales Volume and Adjusted Gross Margin Variances % Electric Operations YTD Change Change Adjusted Gross Margin(1) $96.0M $9.6M 11.1% Year-to-Date variances in units, customers, and adjusted gross margin kWh Sales (millions) 1,204.8 (7.1) (0.6%) Customers 111,300 430 0.4% Electric Operations • Adjust
Slide 8: Third Quarter Earnings Reconciliation
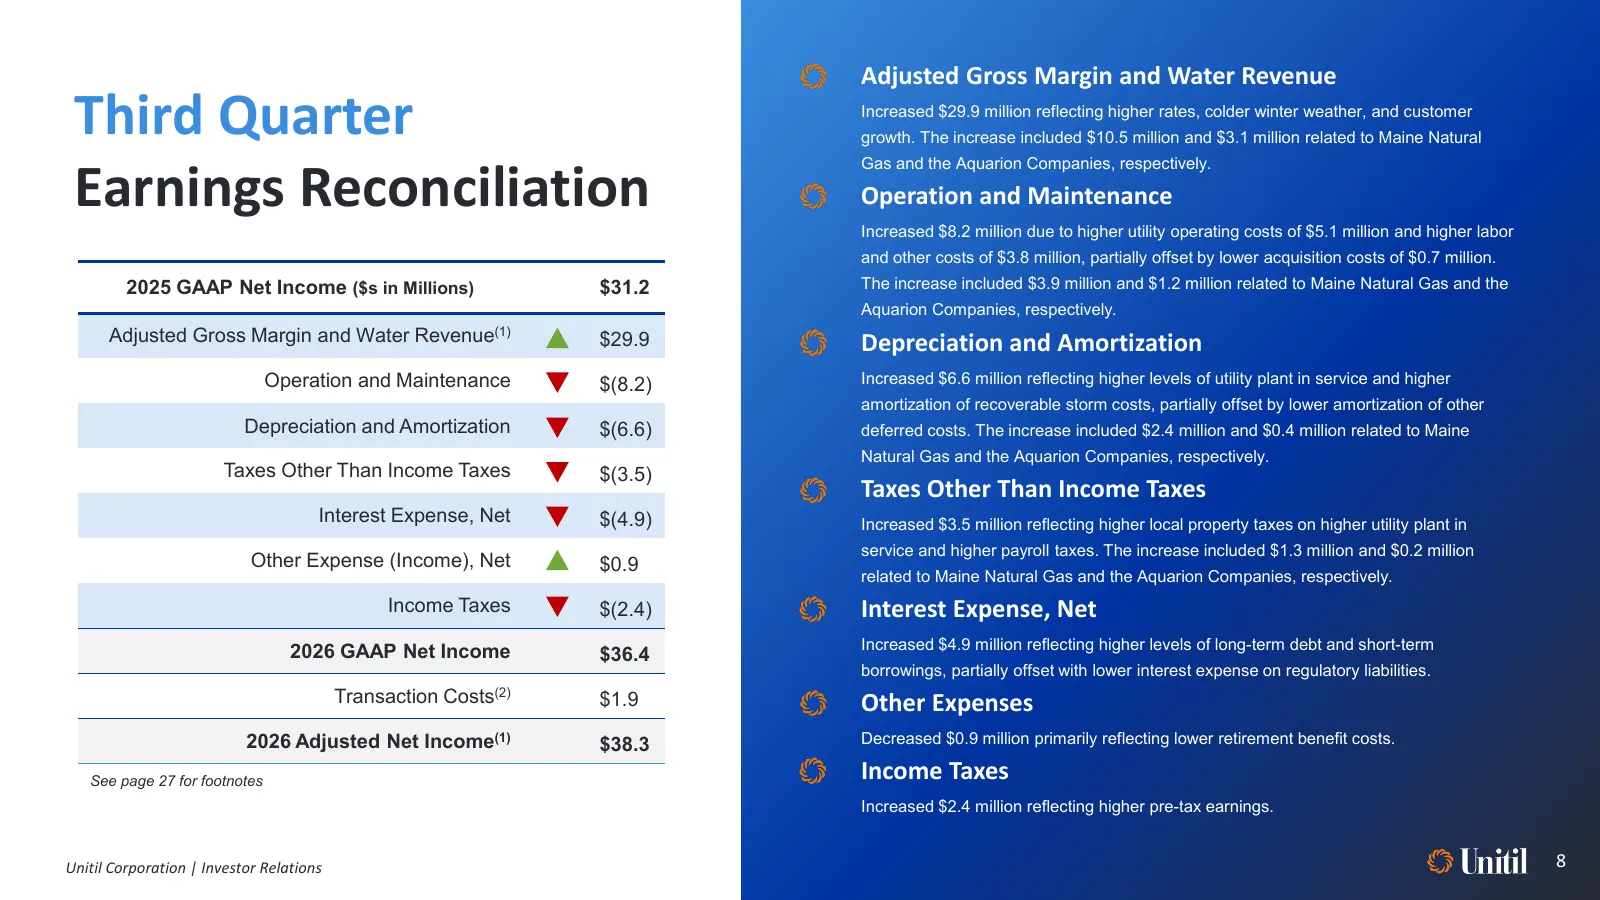
Adjusted Gross Margin and Water Revenue Third Quarter Increased $29.9 million reflecting higher rates, colder winter weather, and customer growth. The increase included $10.5 million and $3.1 million related to Maine Natural Earnings Reconciliation Gas and the Aquarion Companies, respectively. Opera
Slide 9: Northern Utilities NH Regulatory Proceeding
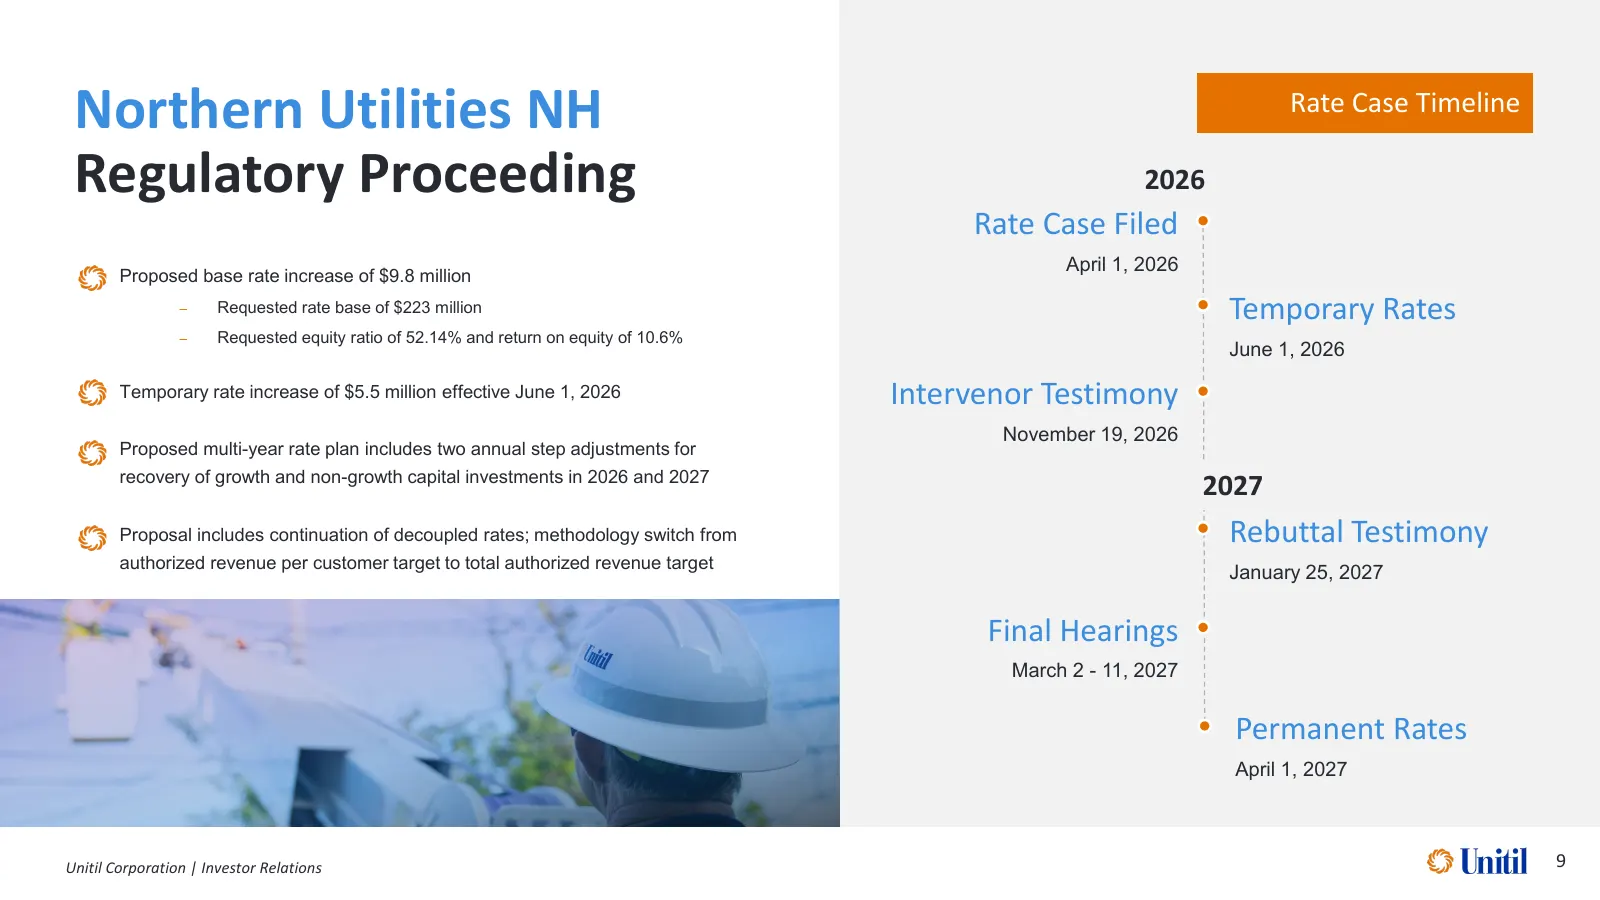
Northern Utilities NH Rate Case Timeline Regulatory Proceeding 2026 Rate Case Filed April 1, 2026 Proposed base rate increase of $9.8 million – Requested rate base of $223 million Temporary Rates – Requested equity ratio of 52.14% and return on equity of 10.6% June 1, 2026 Temporary rate increase of
Slide 10: Northern Utilities ME Regulatory Proceeding
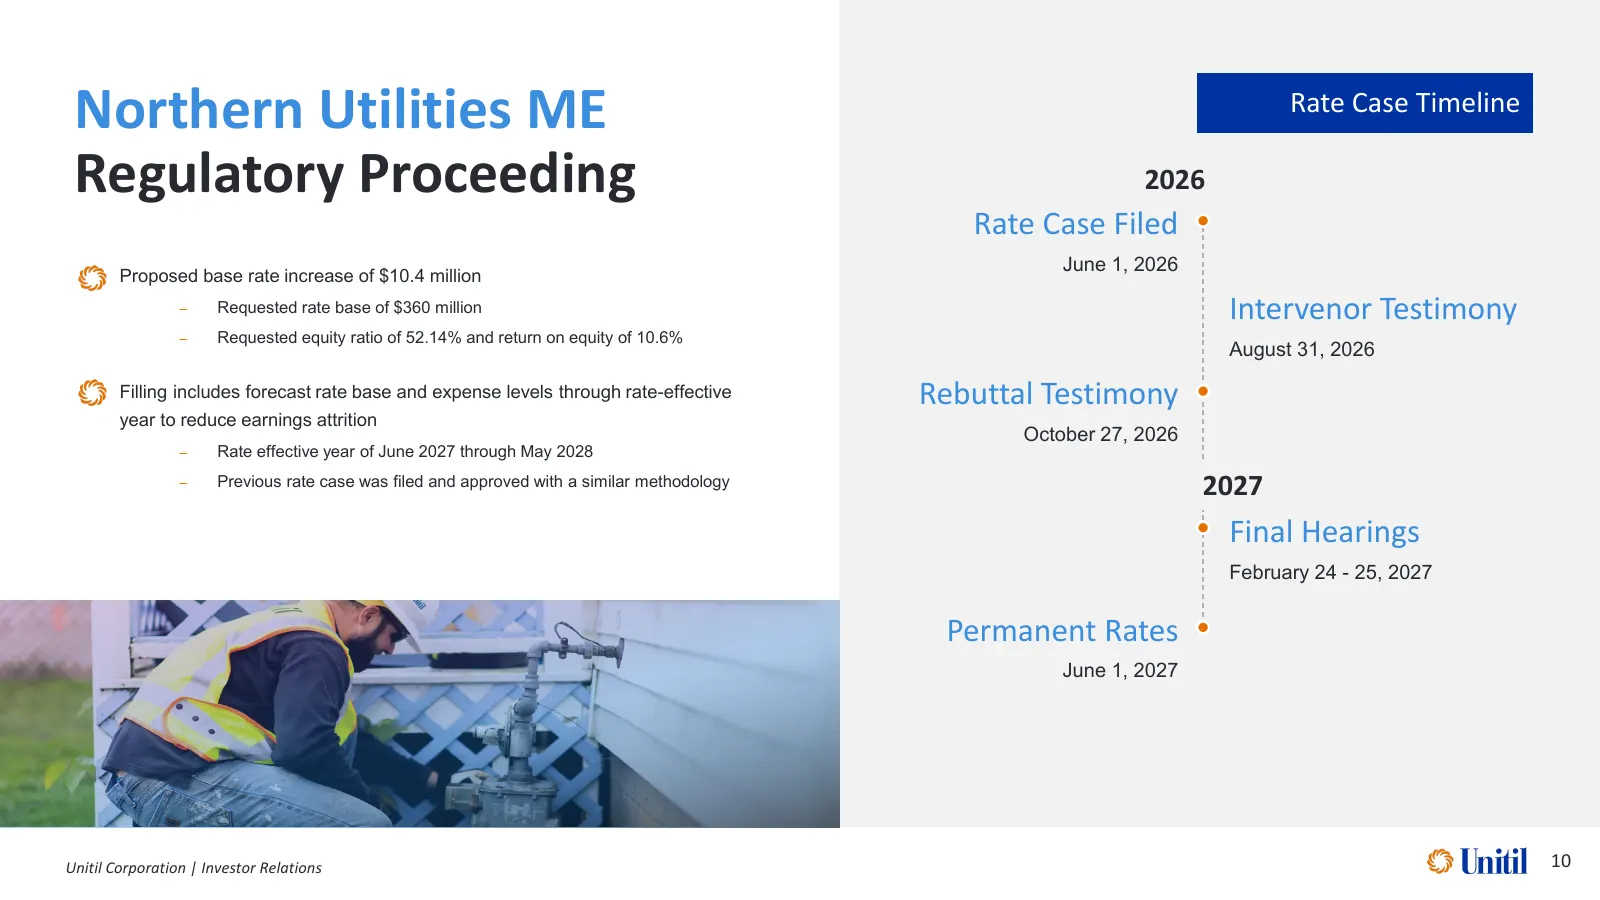
Northern Utilities ME Rate Case Timeline Regulatory Proceeding 2026 Rate Case Filed June 1, 2026 Proposed base rate increase of $10.4 million – Requested rate base of $360 million Intervenor Testimony – Requested equity ratio of 52.14% and return on equity of 10.6% August 31, 2026 Filling includes f
Slide 11: Capital Investment Plan of $1.2 Billion
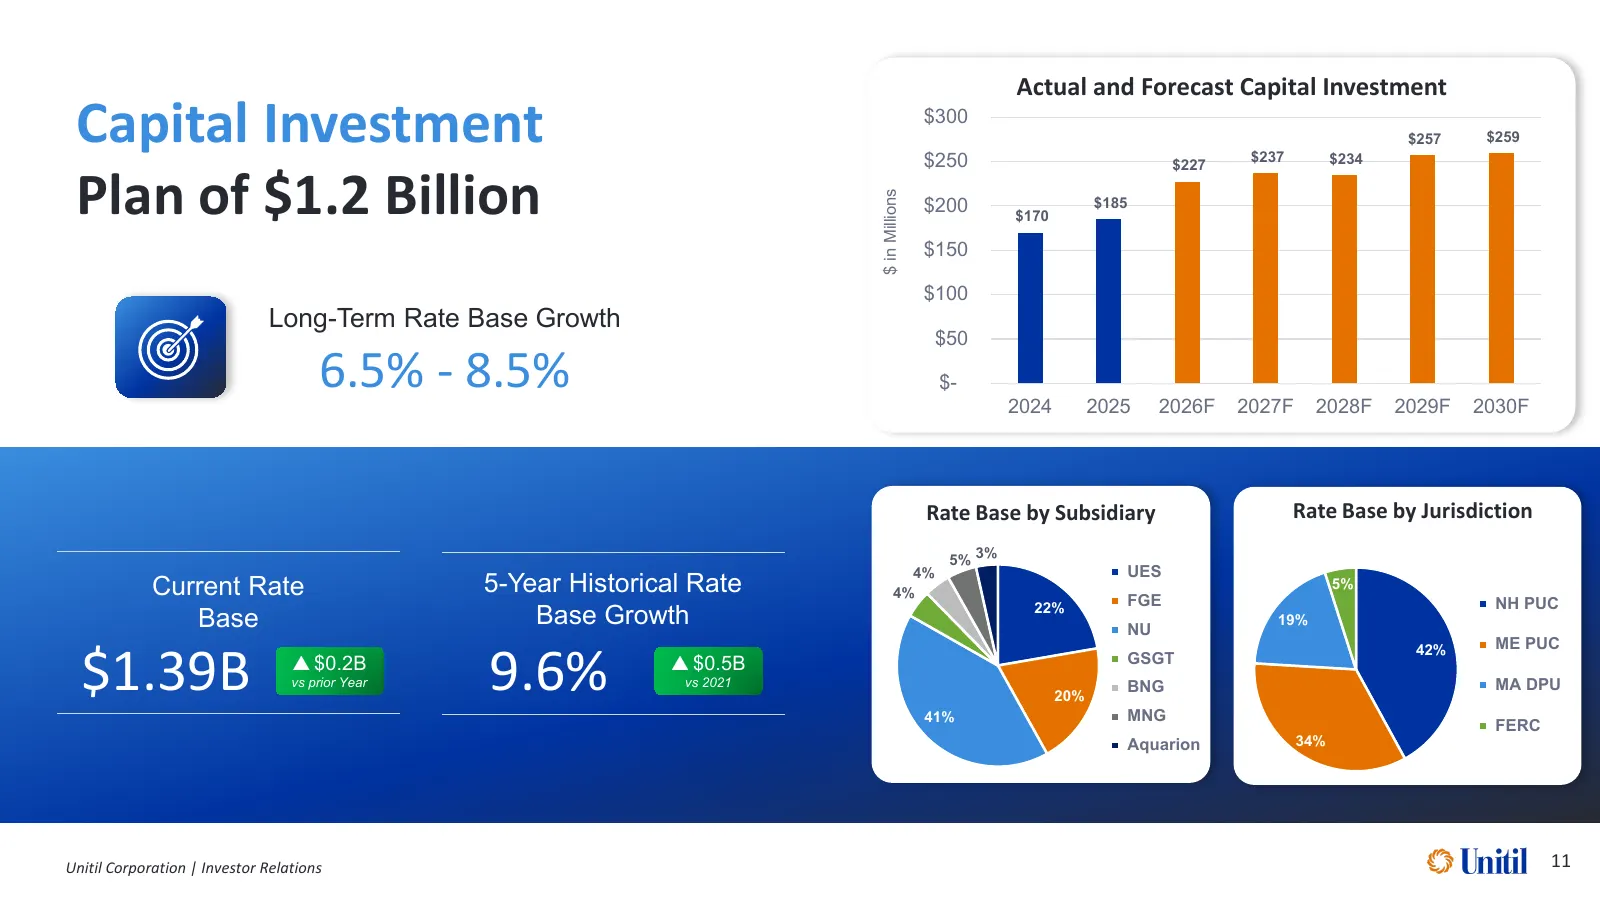
Actual and Forecast Capital Investment Capital Investment $300 $250 $237 $234 $257 $259 Plan of $1.2 Billion $227 $ in Millions $200 $170 $185 $150 $100 Long-Term Rate Base Growth $50 6.5% - 8.5% $- 2024 2025 2026F 2027F 2028F 2029F 2030F Rate Base by Subsidiary Rate Base by Jurisdiction 5% 3% 4% UE
Slide 12: Strong Financial Profile
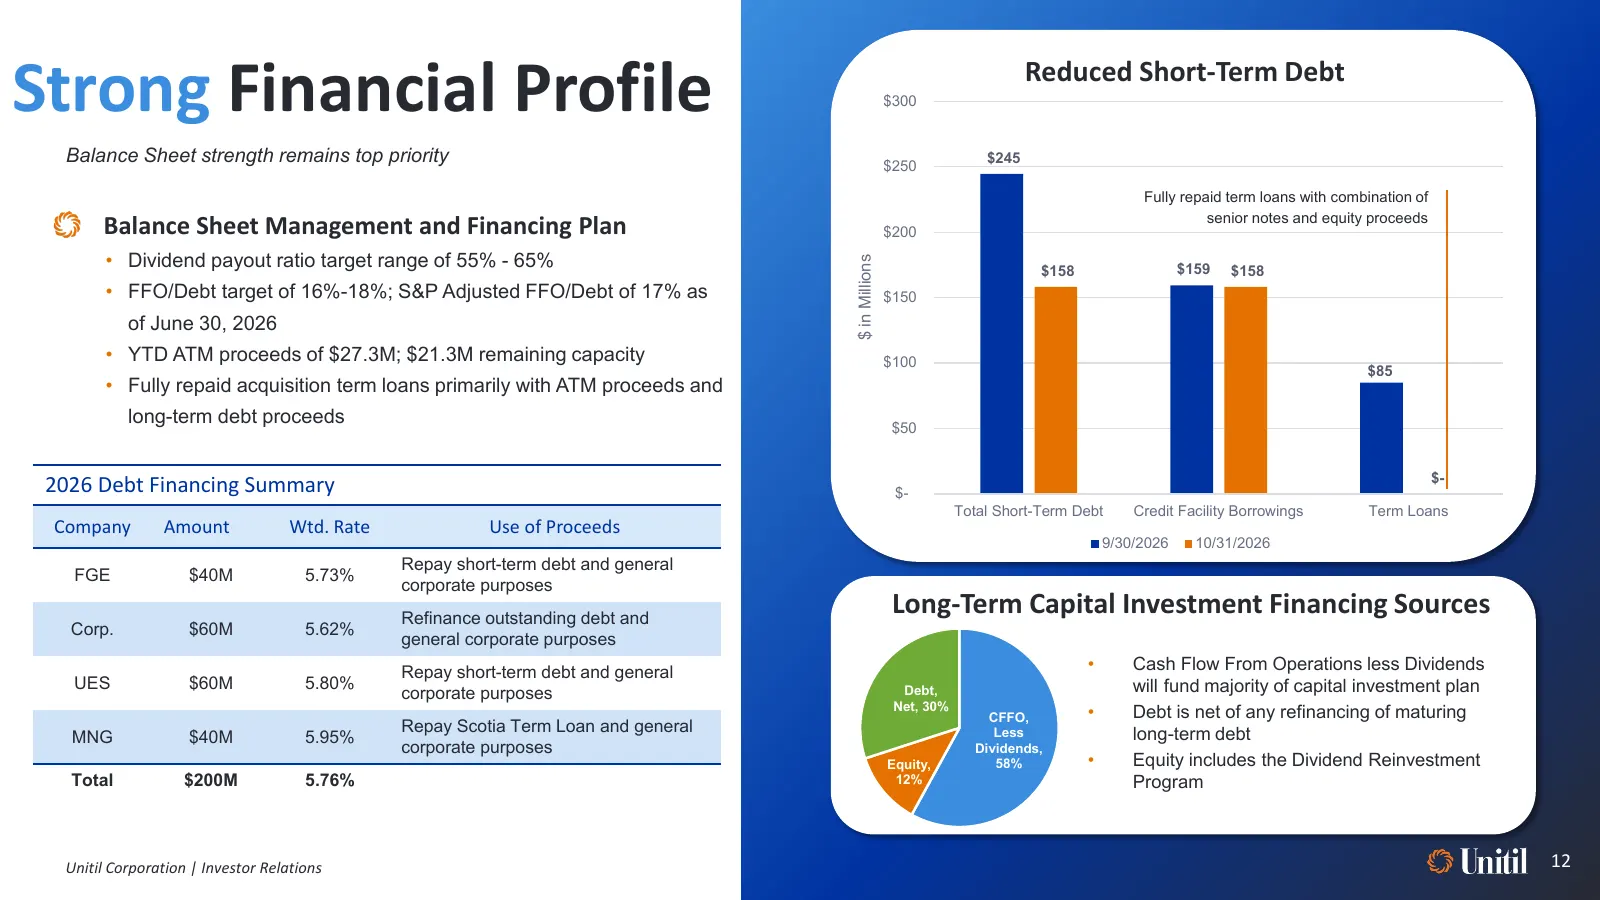
Strong Financial Profile $300 Reduced Short-Term Debt Balance Sheet strength remains top priority $250 $245 Fully repaid term loans with combination of Balance Sheet Management and Financing Plan $200 senior notes and equity proceeds • Dividend payout ratio target range of 55% - 65% $ in Millions $1
Slide 13: Shareholder Value Creation
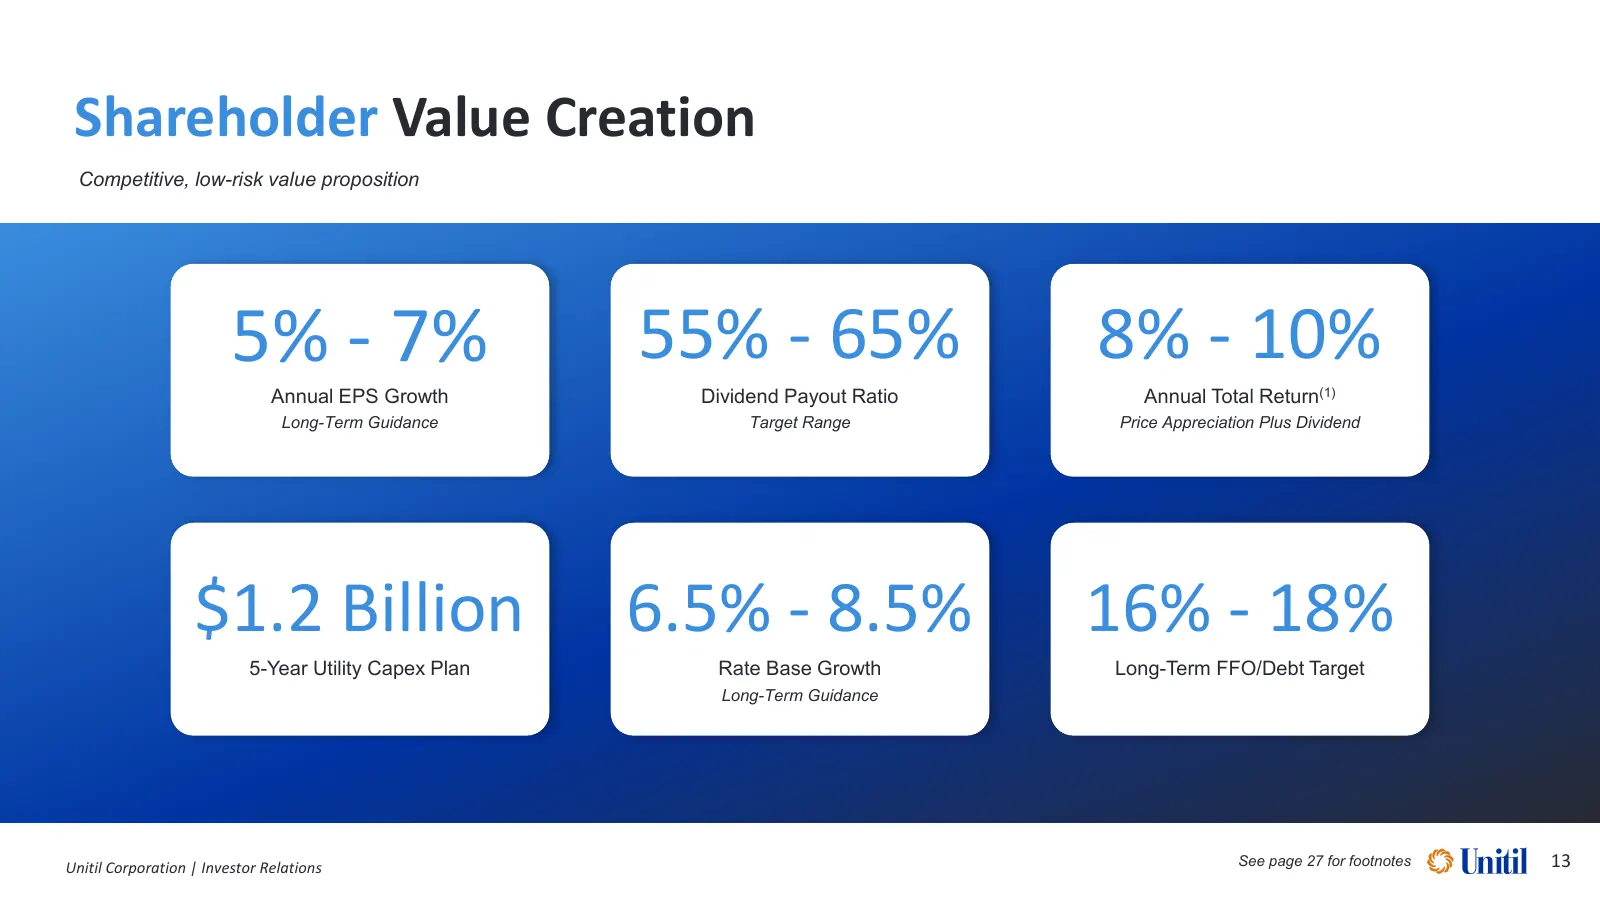
Shareholder Value Creation Competitive, low-risk value proposition 5% - 7% 55% - 65% 8% - 10% Annual EPS Growth Dividend Payout Ratio Annual Total Return(1) Long-Term Guidance Target Range Price Appreciation Plus Dividend $1.2 Billion 6.5% - 8.5% 16% - 18% 5-Year Utility Capex Plan Rate Base Growth
Slide 14: Appendix
Appendix 15 About Unitil 16 2026 Earnings Guidance 17 Return on Average Common Equity 18 Rate Base by Division and Jurisdiction 19 Key Regulatory Recovery Mechanisms 20 Rate Relief Summary 21 Investment Grade Credit Metrics 22 Dividend History 23 - 25 GAAP Reconciliation of Non-GAAP Measures 26 Endn
Slide 15: About Unitil
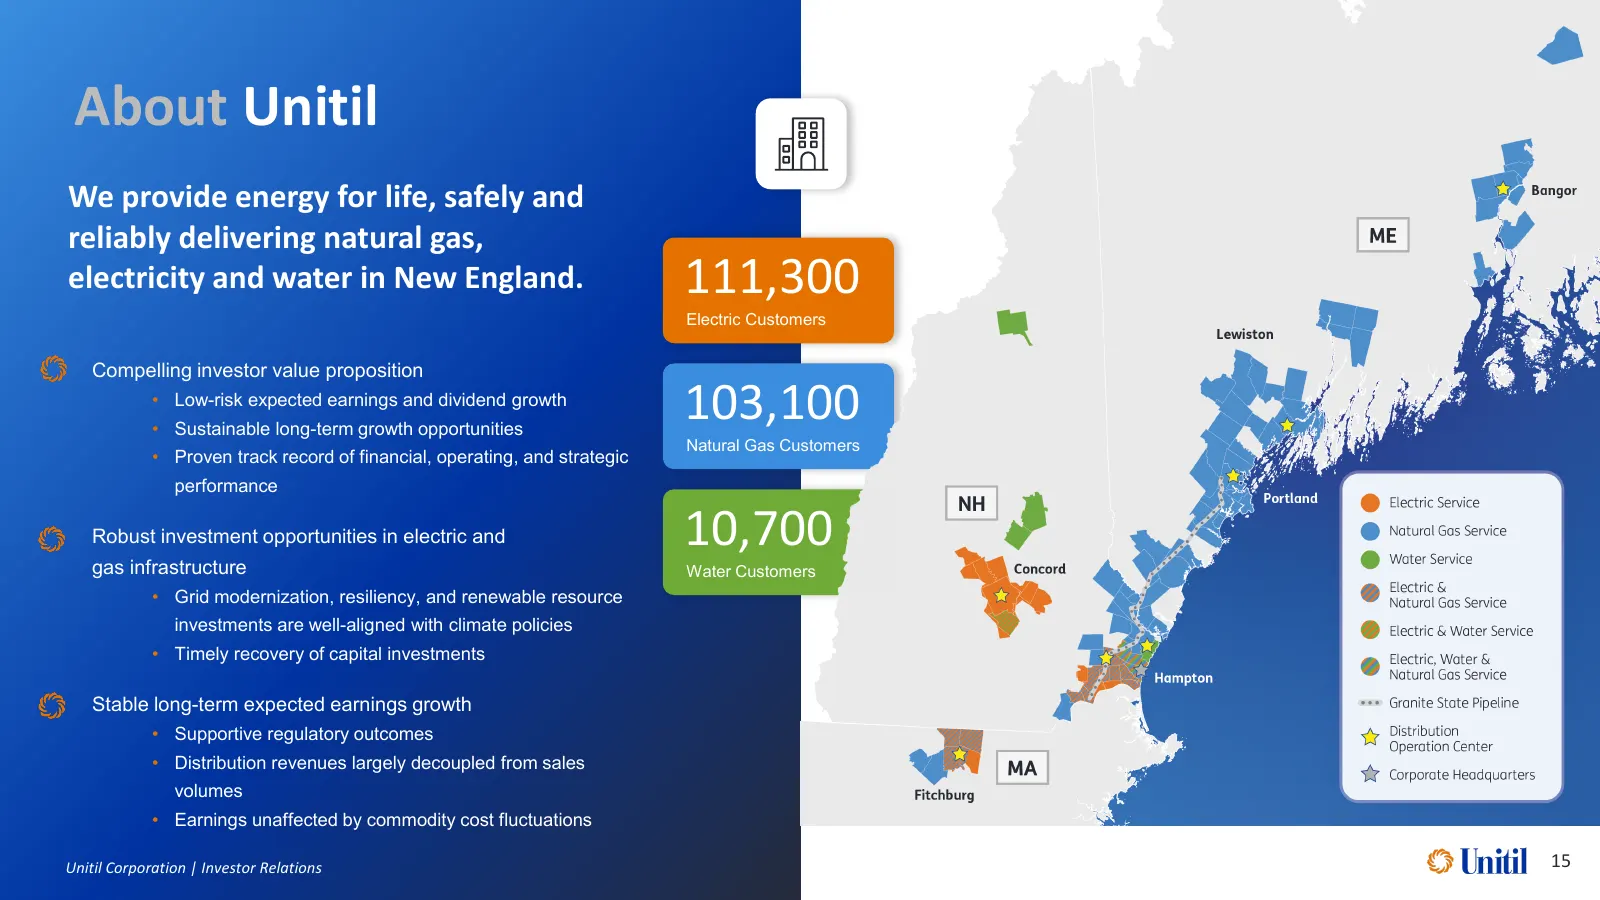
About Unitil We provide energy for life, safely and reliably delivering natural gas, electricity and water in New England. 111,300 Electric Customers Compelling investor value proposition • Low-risk expected earnings and dividend growth • Sustainable long-term growth opportunities 103,100 Natural Ga
Slide 16: 2026 Earnings Guidance
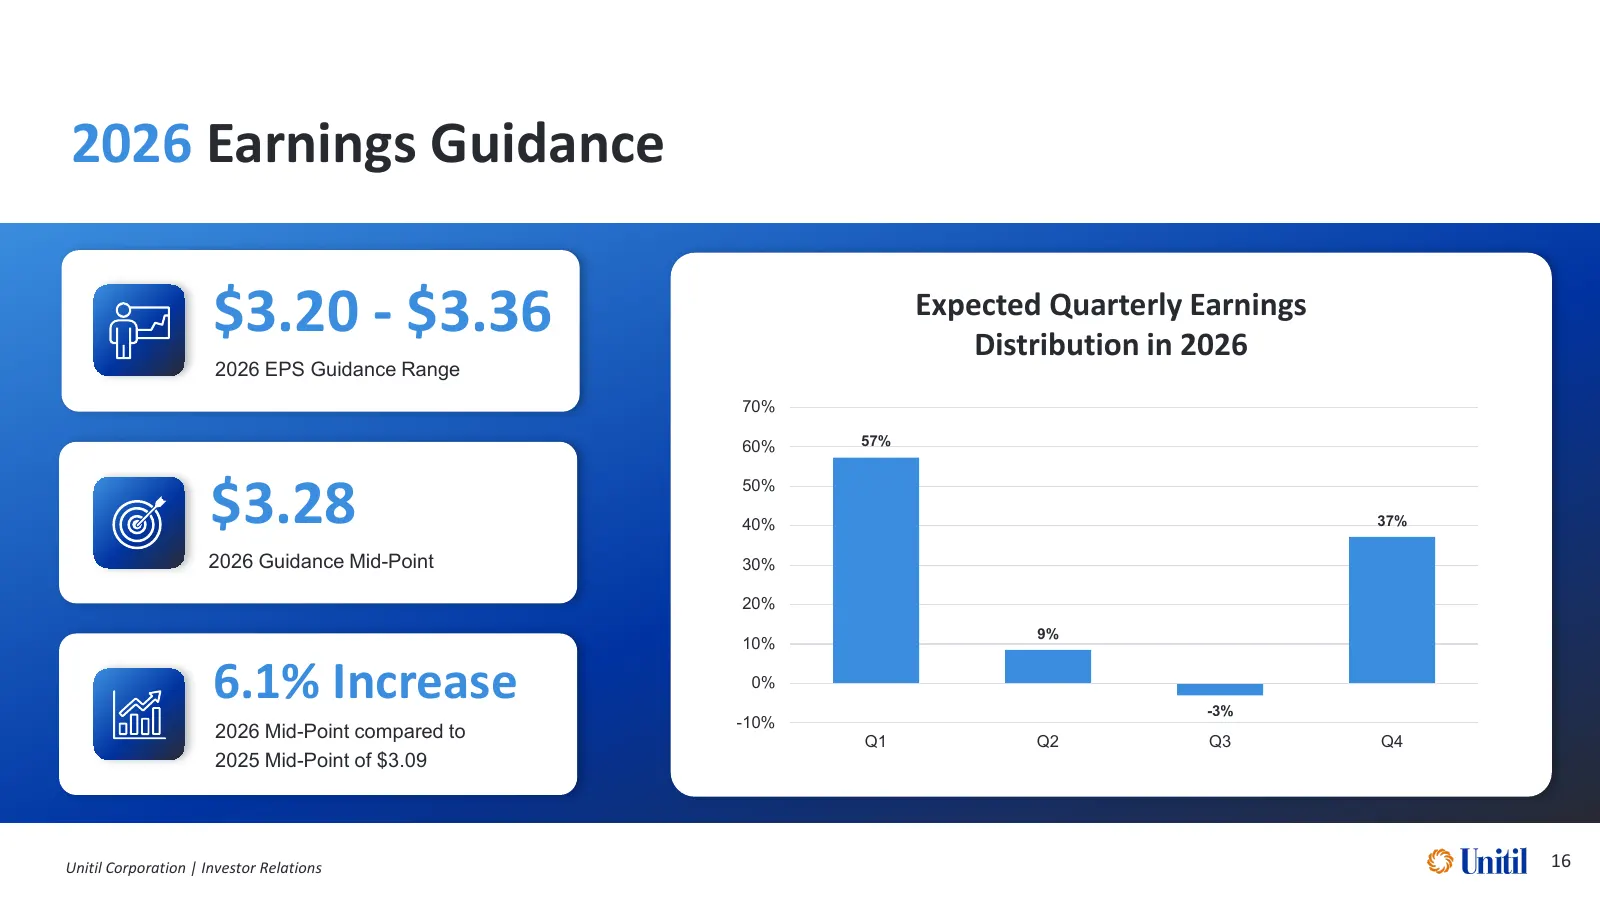
2026 Earnings Guidance Reaffirming long-term earnings guidance of 5% to 7% $3.20 - $3.36 Expected Quarterly Earnings Distribution in 2026 2026 EPS Guidance Range 70% 60% 57% $3.28 50% 40% 37% 2026 Guidance Mid-Point 30% 20% 9% 10% 6.1% Increase 0% -3% -10% 2026 Mid-Point compared to Q1 Q2 Q3 Q4 2025
Slide 17: Return on Average Common Equity
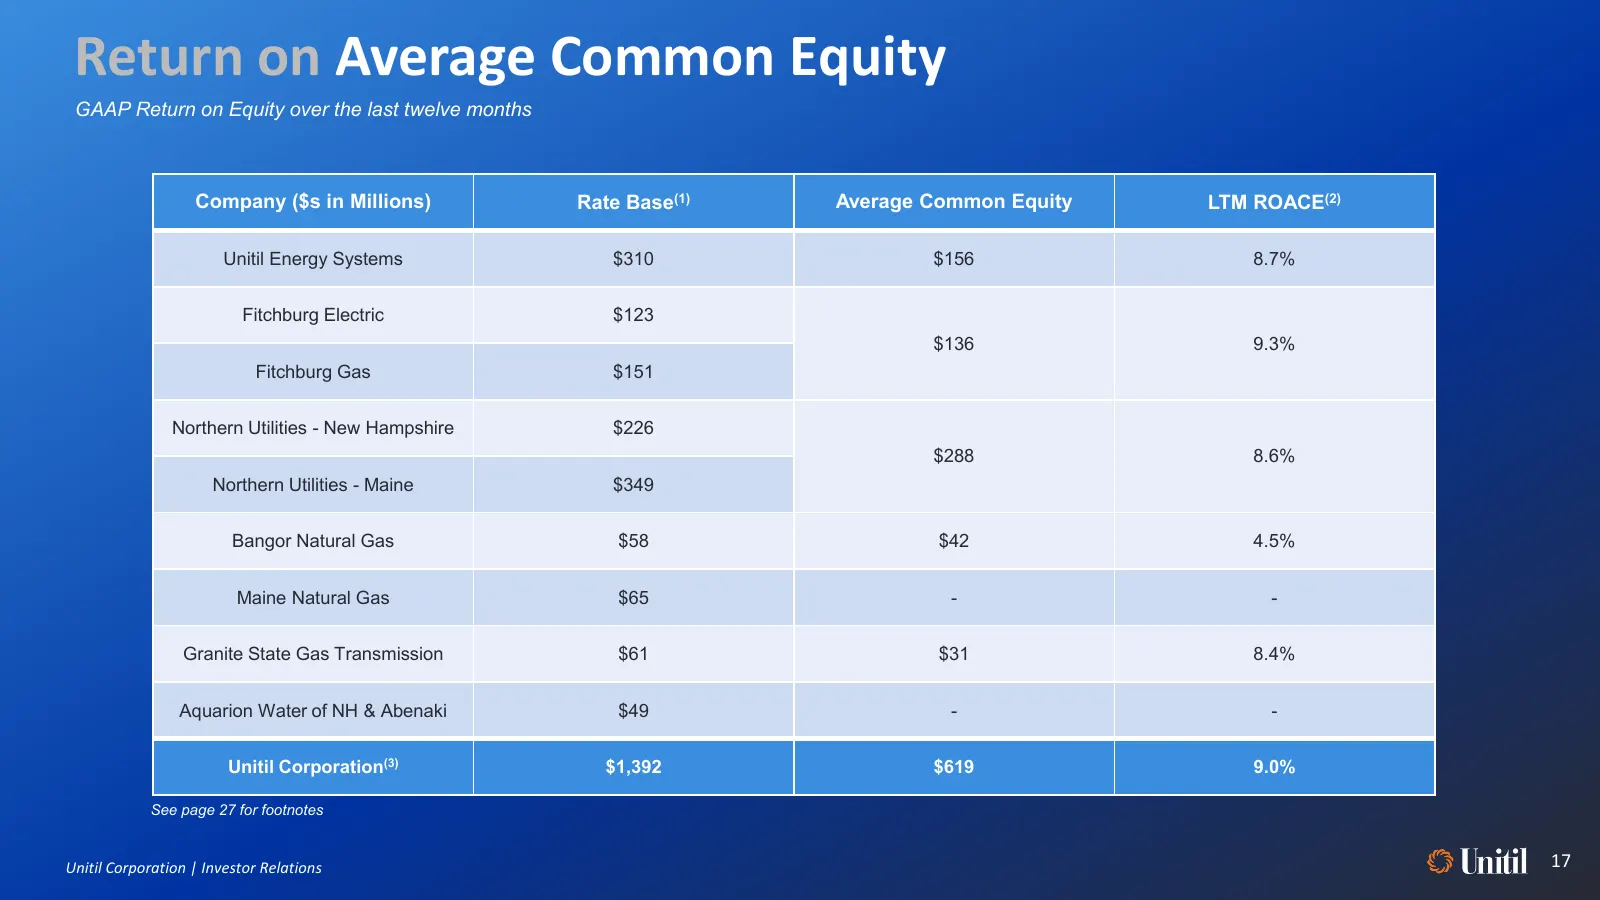
Return on Average Common Equity GAAP Return on Equity over the last twelve months Company ($s in Millions) Rate Base(1) Average Common Equity LTM ROACE(2) Unitil Energy Systems $310 $156 8.7% Fitchburg Electric $123 $136 9.3% Fitchburg Gas $151 Northern Utilities - New Hampshire $226 $288 8.6% North
Slide 18: Rate Base by Division and Jurisdiction
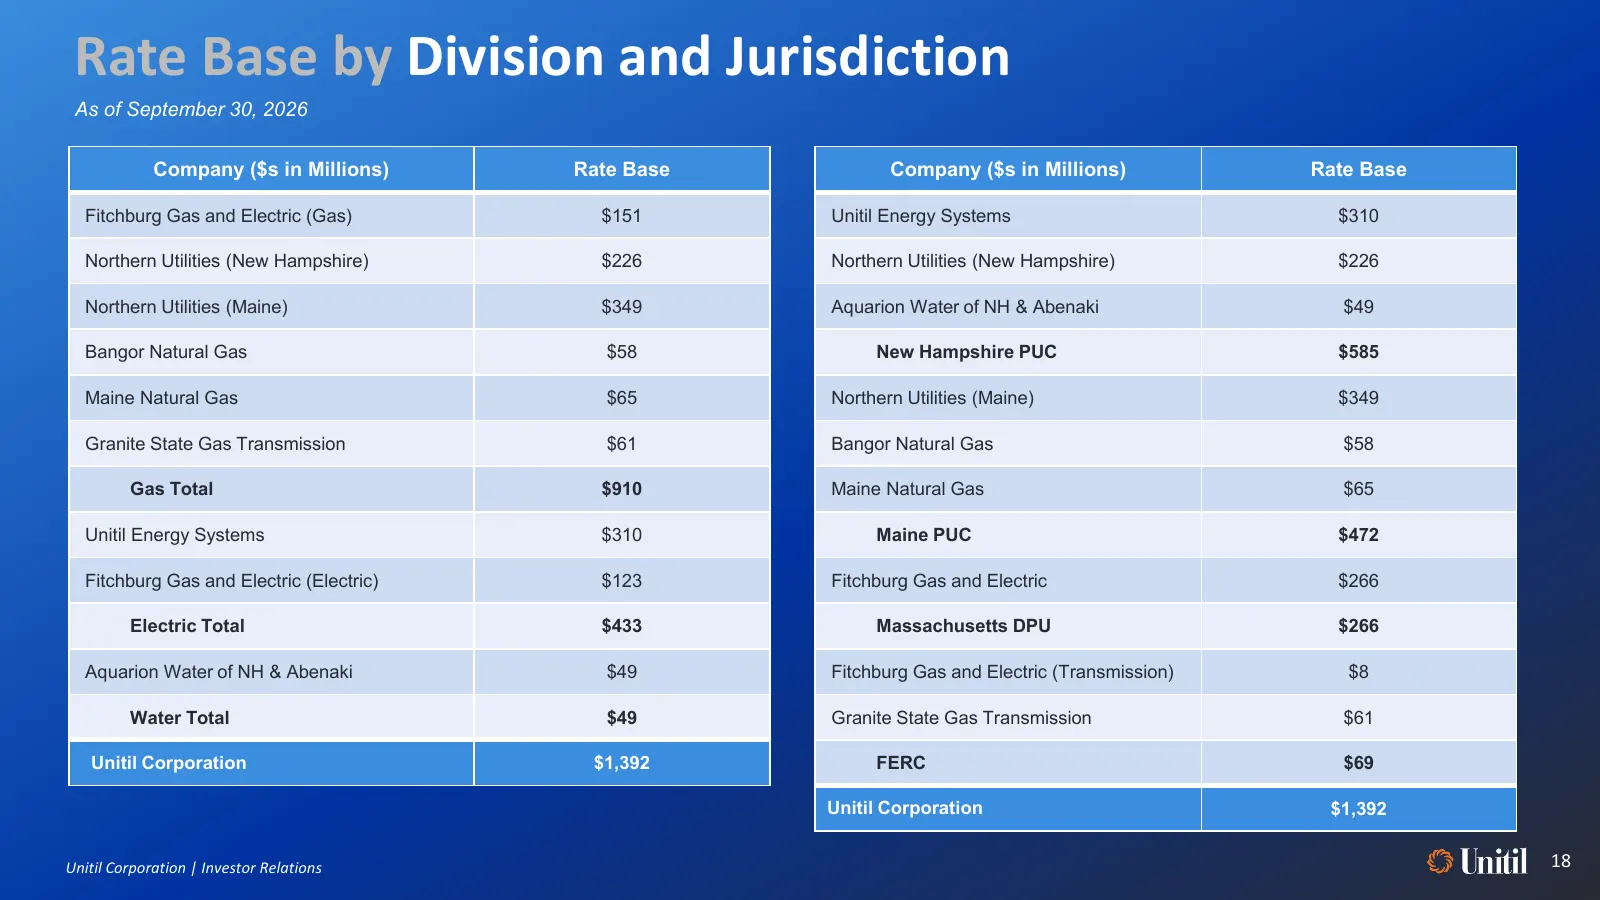
Rate Base by Division and Jurisdiction As of September 30, 2026 Company ($s in Millions) Rate Base Company ($s in Millions) Rate Base Fitchburg Gas and Electric (Gas) $151 Unitil Energy Systems $310 Northern Utilities (New Hampshire) $226 Northern Utilities (New Hampshire) $226 Northern Utilities (M
Slide 19: Regulation Overview
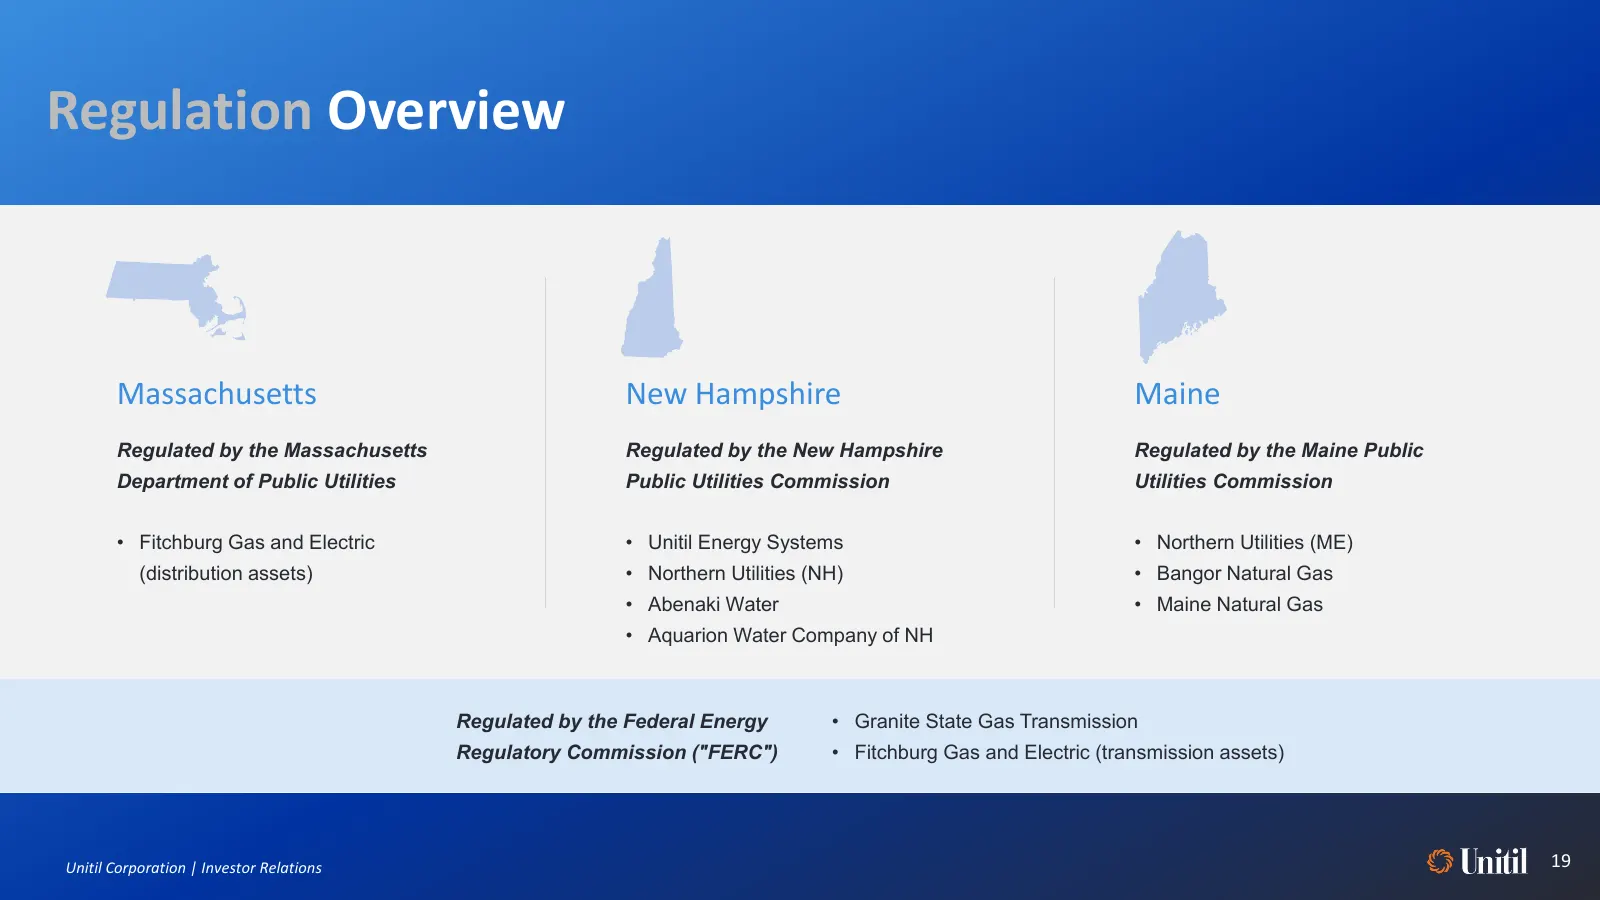
Regulation Overview Massachusetts New Hampshire Maine Regulated by the Massachusetts Regulated by the New Hampshire Regulated by the Maine Public Department of Public Utilities Public Utilities Commission Utilities Commission • Fitchburg Gas and Electric • Unitil Energy Systems • Northern Utilities
Slide 20: Key Regulatory Recovery Mechanisms
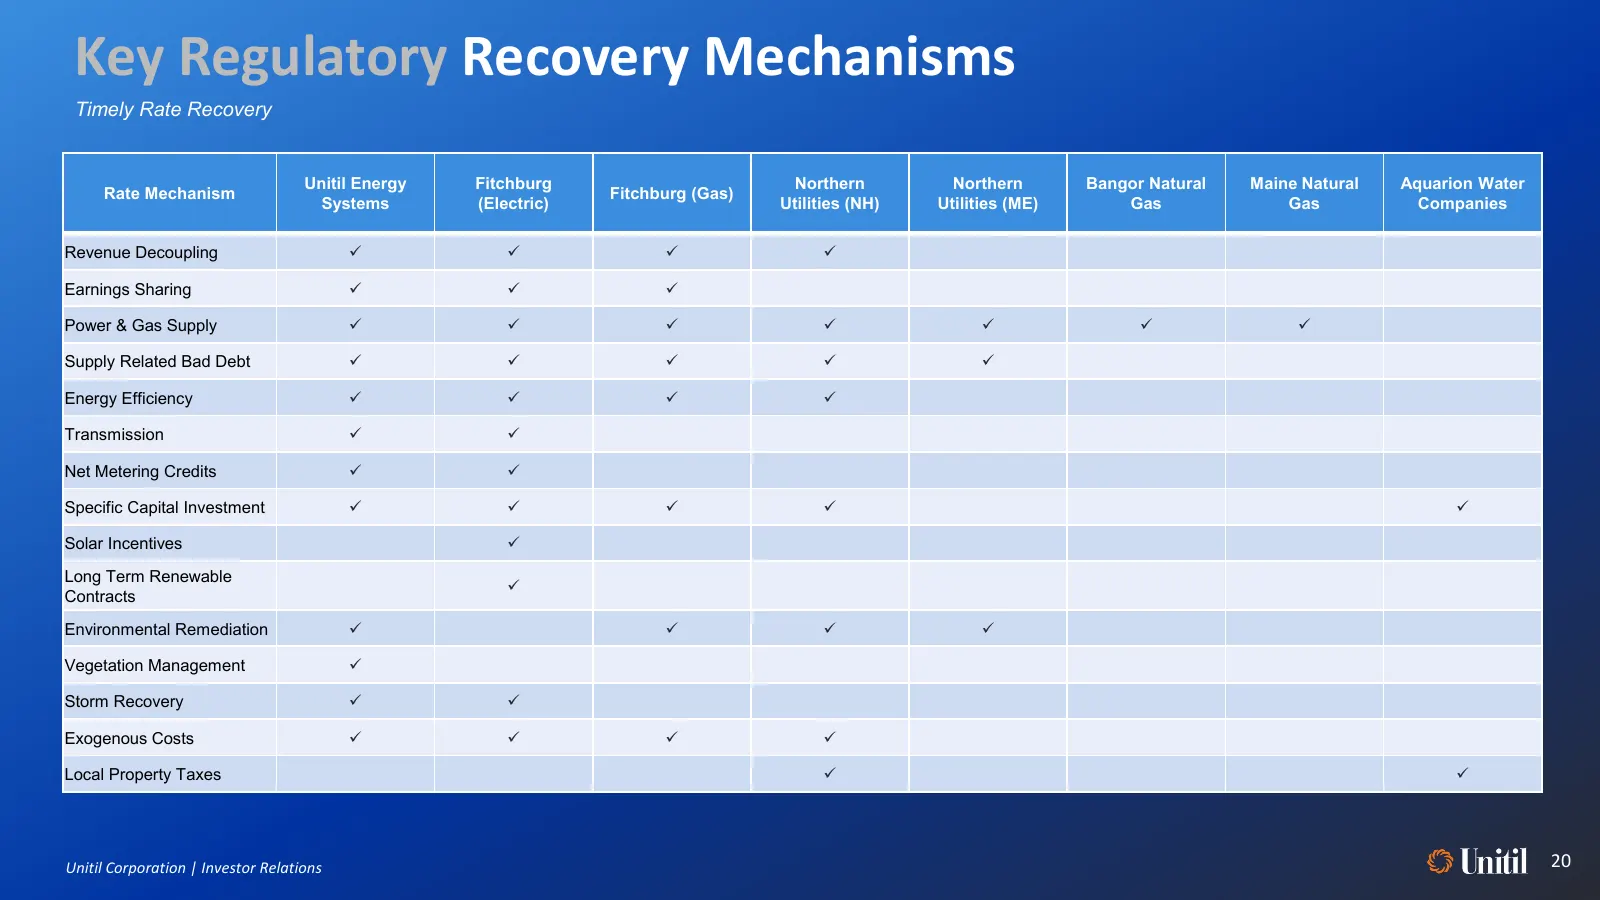
Key Regulatory Recovery Mechanisms Timely Rate Recovery Unitil Energy Fitchburg Northern Northern Bangor Natural Maine Natural Aquarion Water Rate Mechanism Fitchburg (Gas) Systems (Electric) Utilities (NH) Utilities (ME) Gas Gas Companies Revenue Decoupling Earnings Sharing Power & Ga
Slide 21: Rate Relief Summary
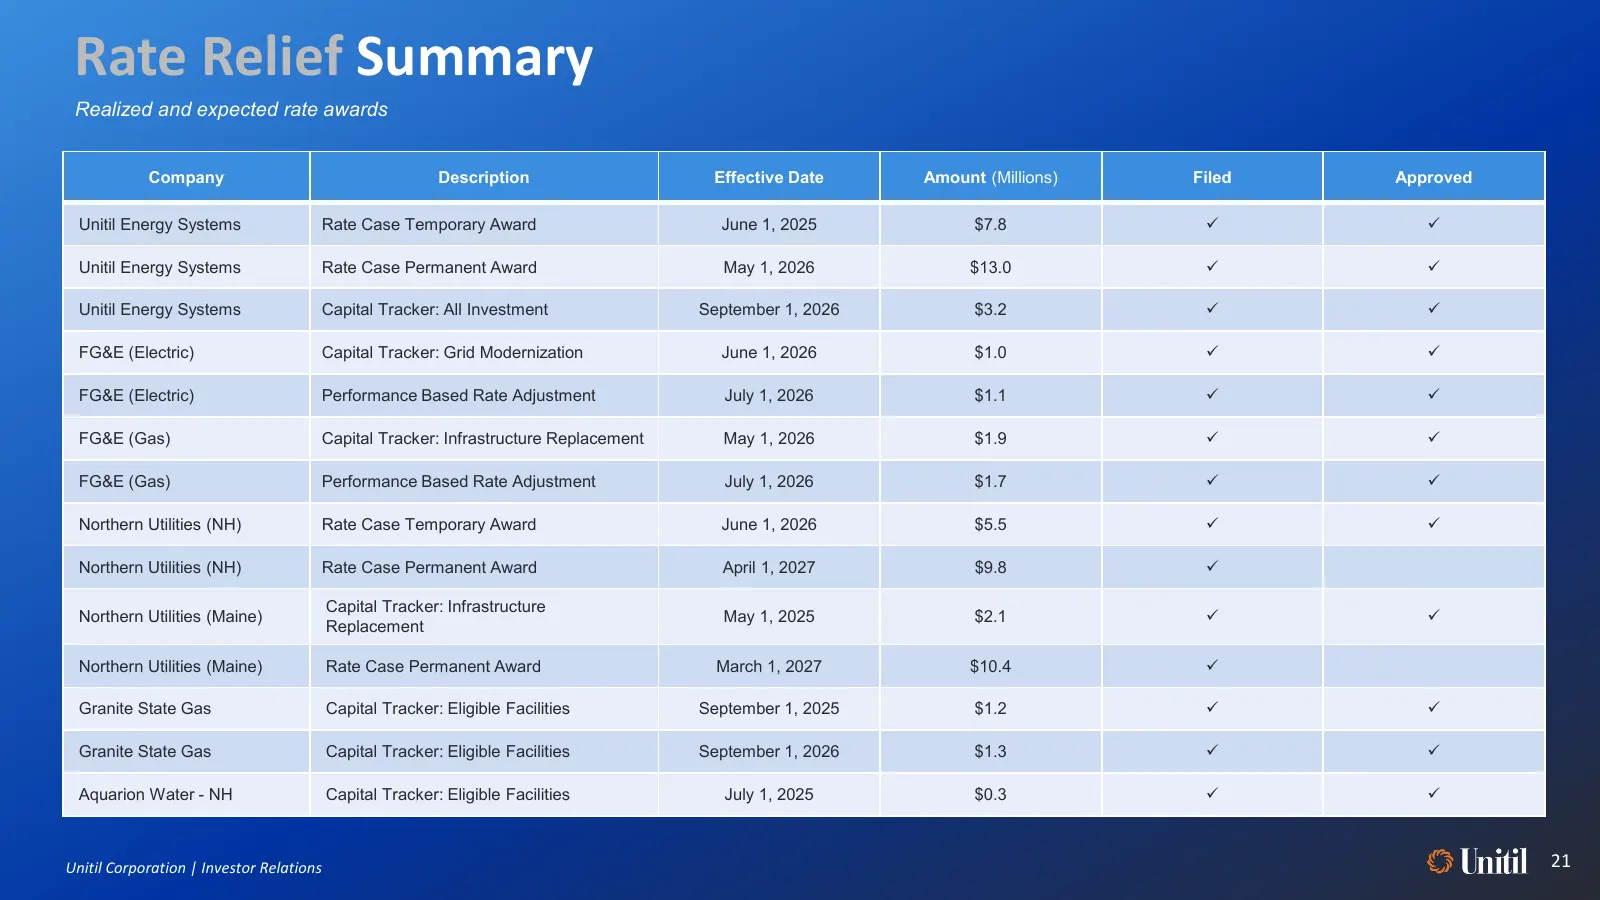
Rate Relief Summary Realized and expected rate awards Company Description Effective Date Amount (Millions) Filed Approved Unitil Energy Systems Rate Case Temporary Award June 1, 2025 $7.8 Unitil Energy Systems Rate Case Permanent Award May 1, 2026 $13.0 Unitil Energy Systems Capital Tracker:
Slide 22: Investment Grade Credit Rating
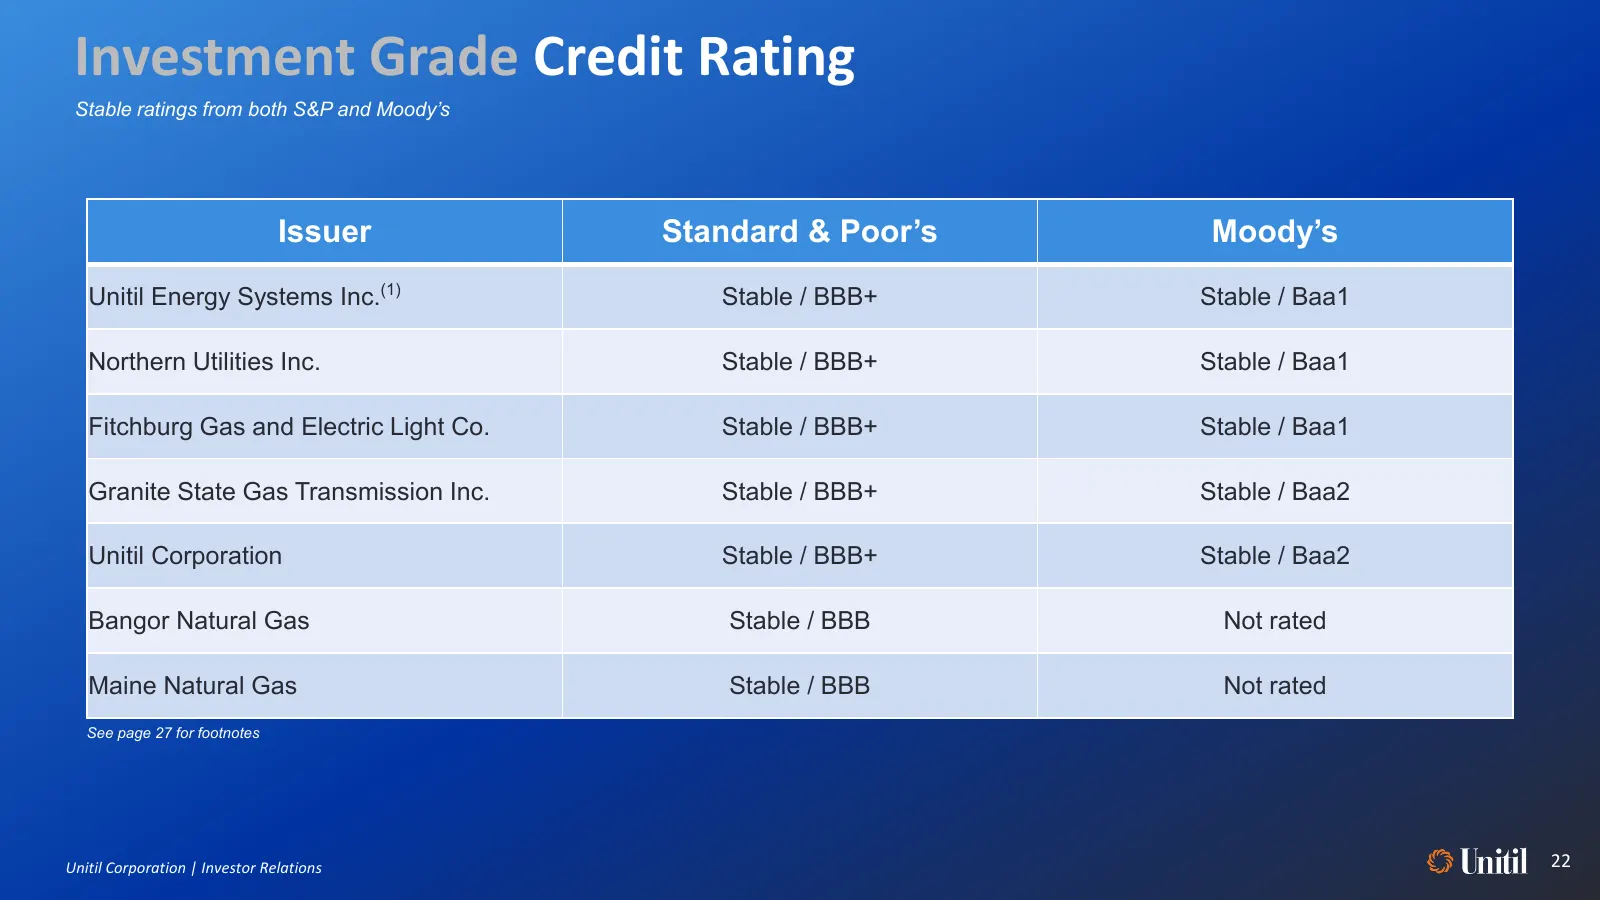
Investment Grade Credit Rating Stable ratings from both S&P and Moody’s Issuer Standard & Poor’s Moody’s Unitil Energy Systems Inc.(1) Stable / BBB+ Stable / Baa1 Northern Utilities Inc. Stable / BBB+ Stable / Baa1 Fitchburg Gas and Electric Light Co. Stable / BBB+ Stable / Baa1 Granite State Gas Tr
Slide 23: Continuous Dividend Payout Since Incorporation
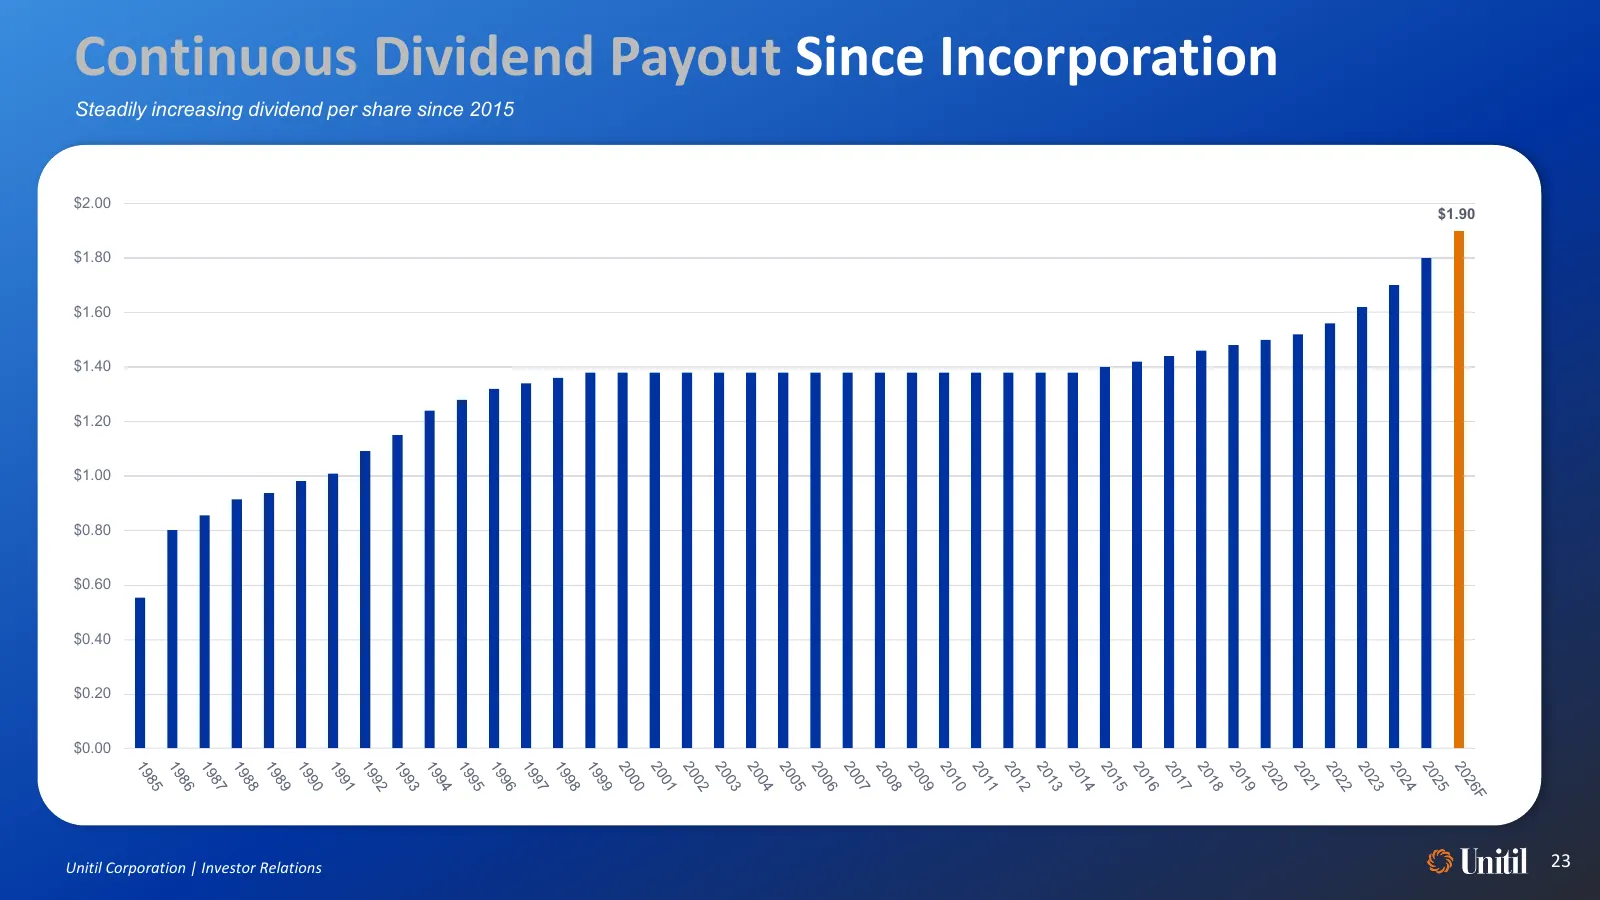
Continuous Dividend Payout Since Incorporation Steadily increasing dividend per share since 2015 $2.00 $1.90 $1.80 $1.60 $1.40 $1.20 $1.00 $0.80 $0.60 $0.40 $0.20 $0.00 Unitil Corporation | Investor Relations 23
Slide 24: GAAP Reconciliation of Adjusted Gross Margin
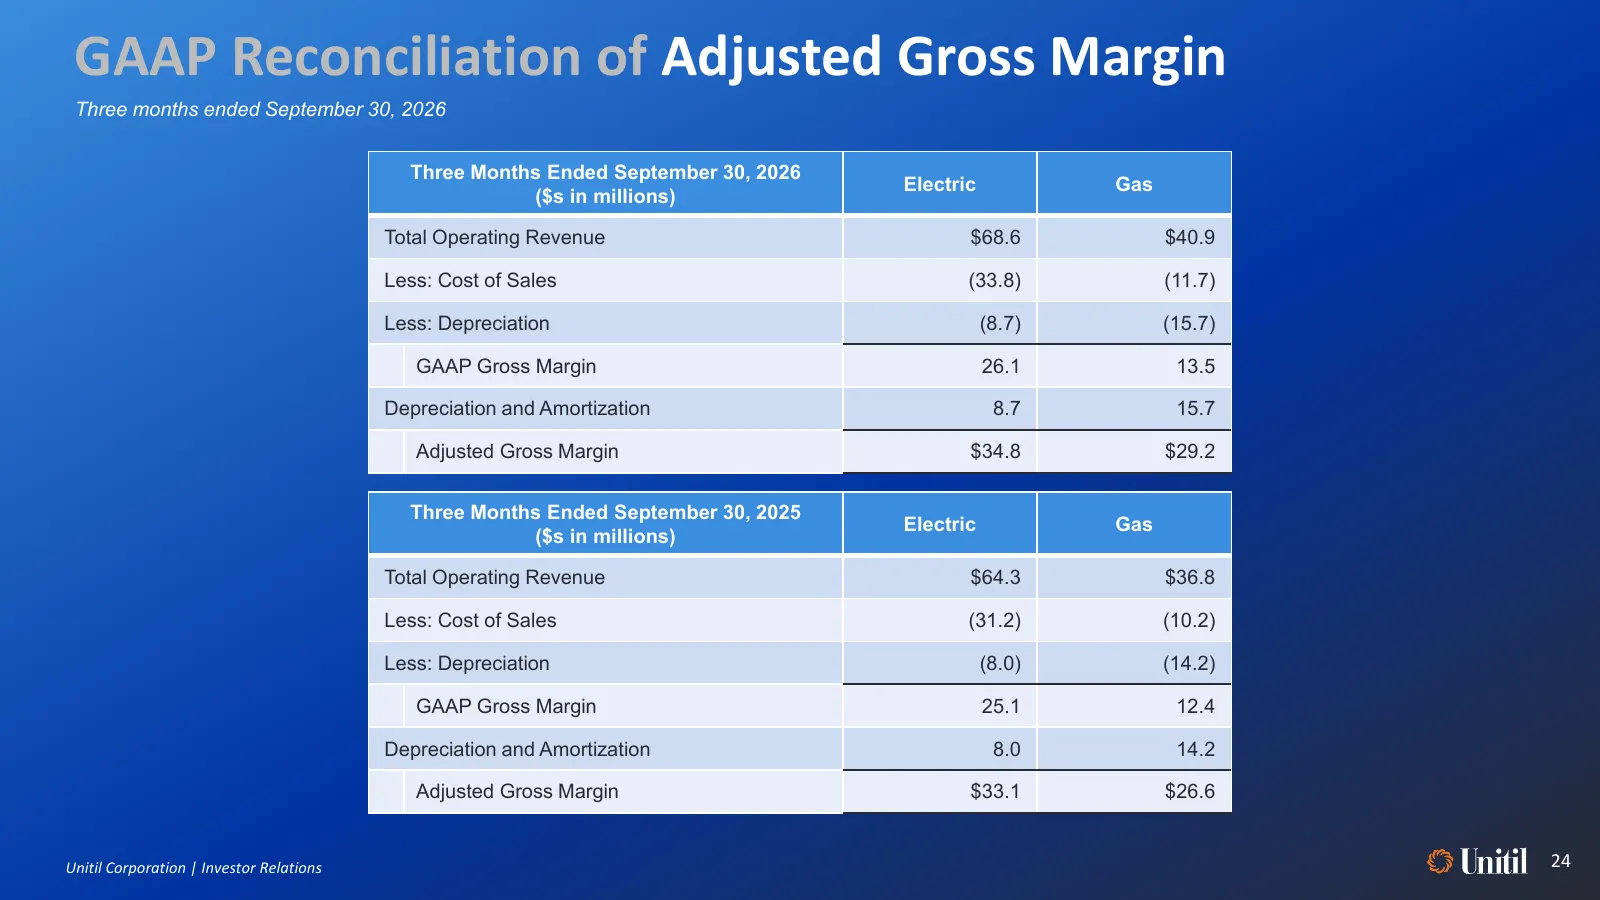
GAAP Reconciliation of Adjusted Gross Margin Three months ended September 30, 2026 Three Months Ended September 30, 2026 Electric Gas ($s in millions) Total Operating Revenue $68.6 $40.9 Less: Cost of Sales (33.8) (11.7) Less: Depreciation (8.7) (15.7) GAAP Gross Margin 26.1 13.5 Depreciation and Am
Slide 25: GAAP Reconciliation of Adjusted Gross Margin
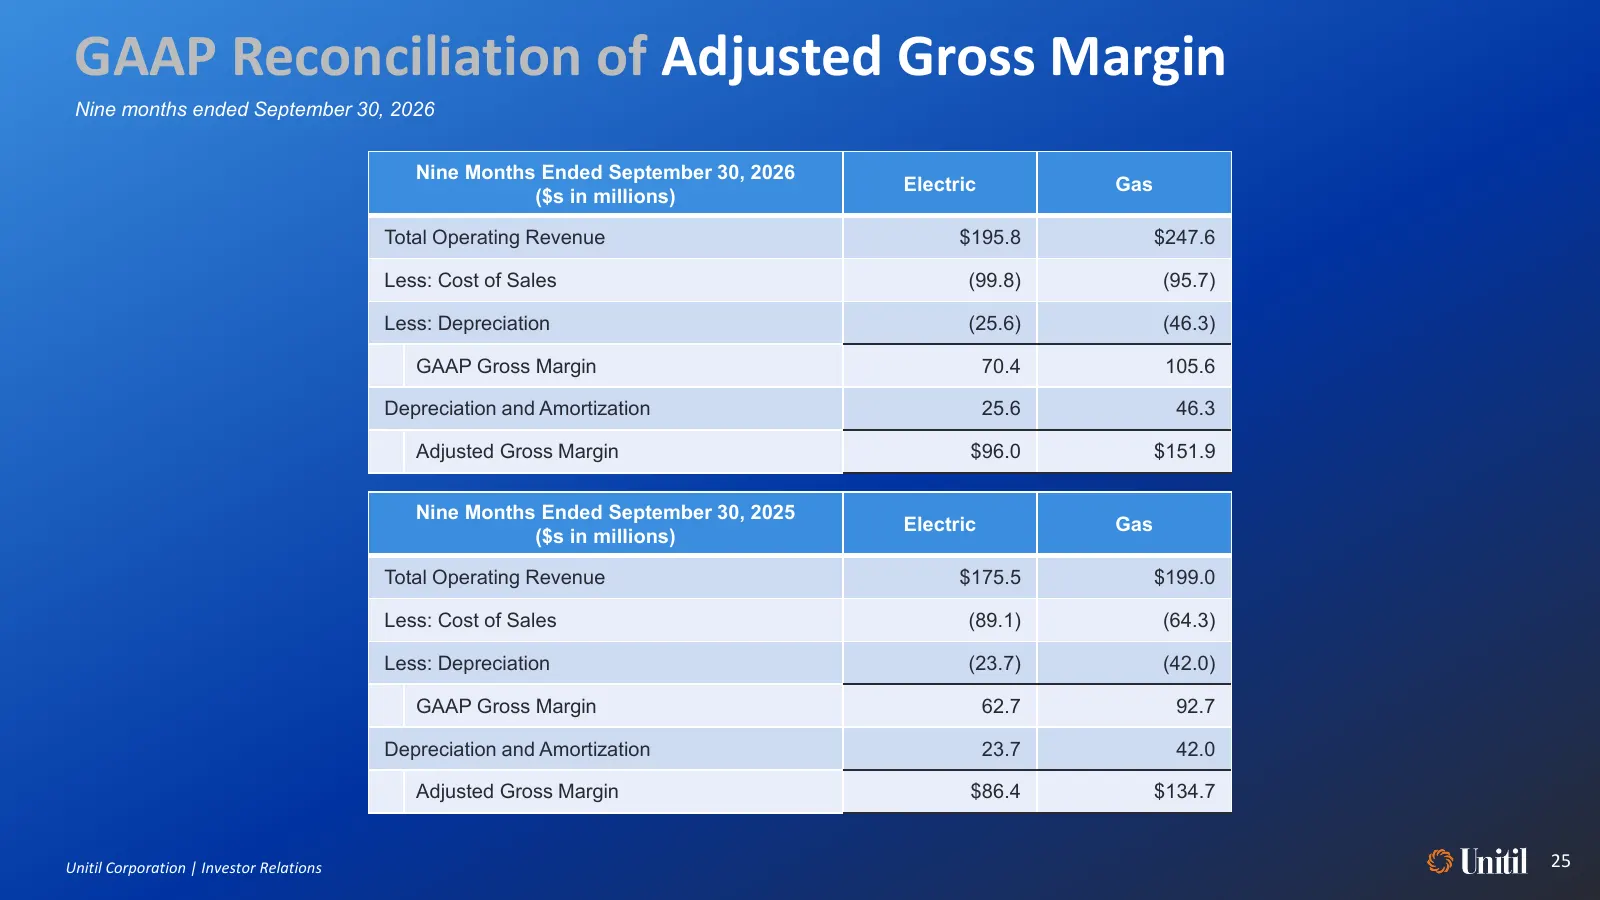
GAAP Reconciliation of Adjusted Gross Margin Nine months ended September 30, 2026 Nine Months Ended September 30, 2026 Electric Gas ($s in millions) Total Operating Revenue $195.8 $247.6 Less: Cost of Sales (99.8) (95.7) Less: Depreciation (25.6) (46.3) GAAP Gross Margin 70.4 105.6 Depreciation and
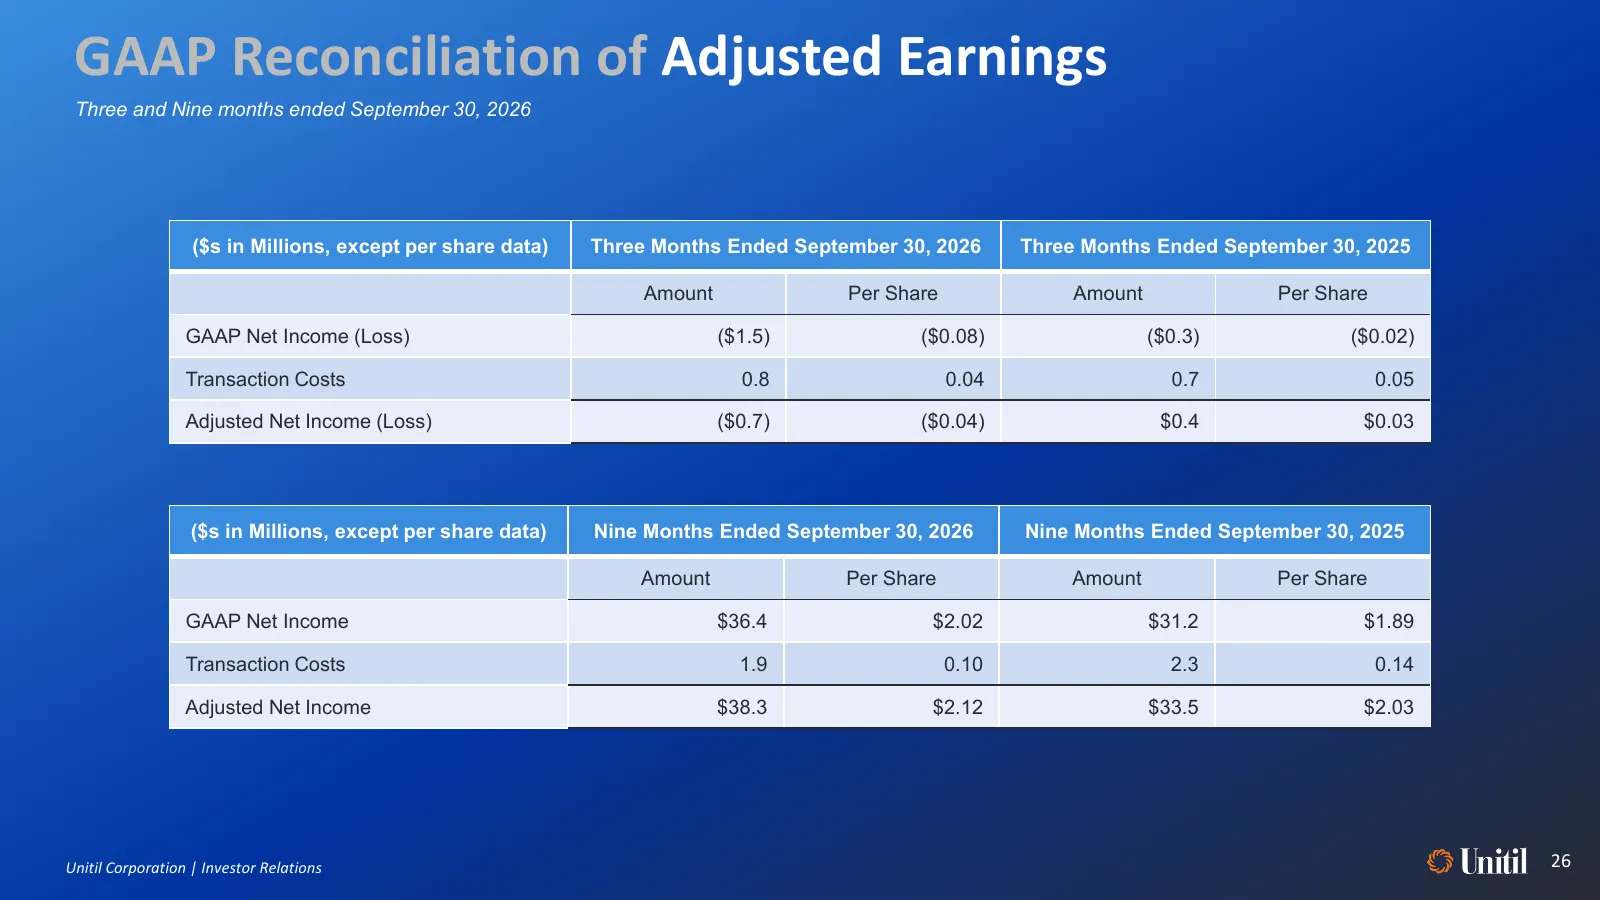
Slide 26: GAAP Reconciliation of Adjusted Earnings
GAAP Reconciliation of Adjusted Earnings Three and Nine months ended September 30, 2026 ($s in Millions, except per share data) Three Months Ended September 30, 2026 Three Months Ended September 30, 2025 Amount Per Share Amount Per Share GAAP Net Income (Loss) ($1.5) ($0.08) ($0.3) ($0.02) Transacti
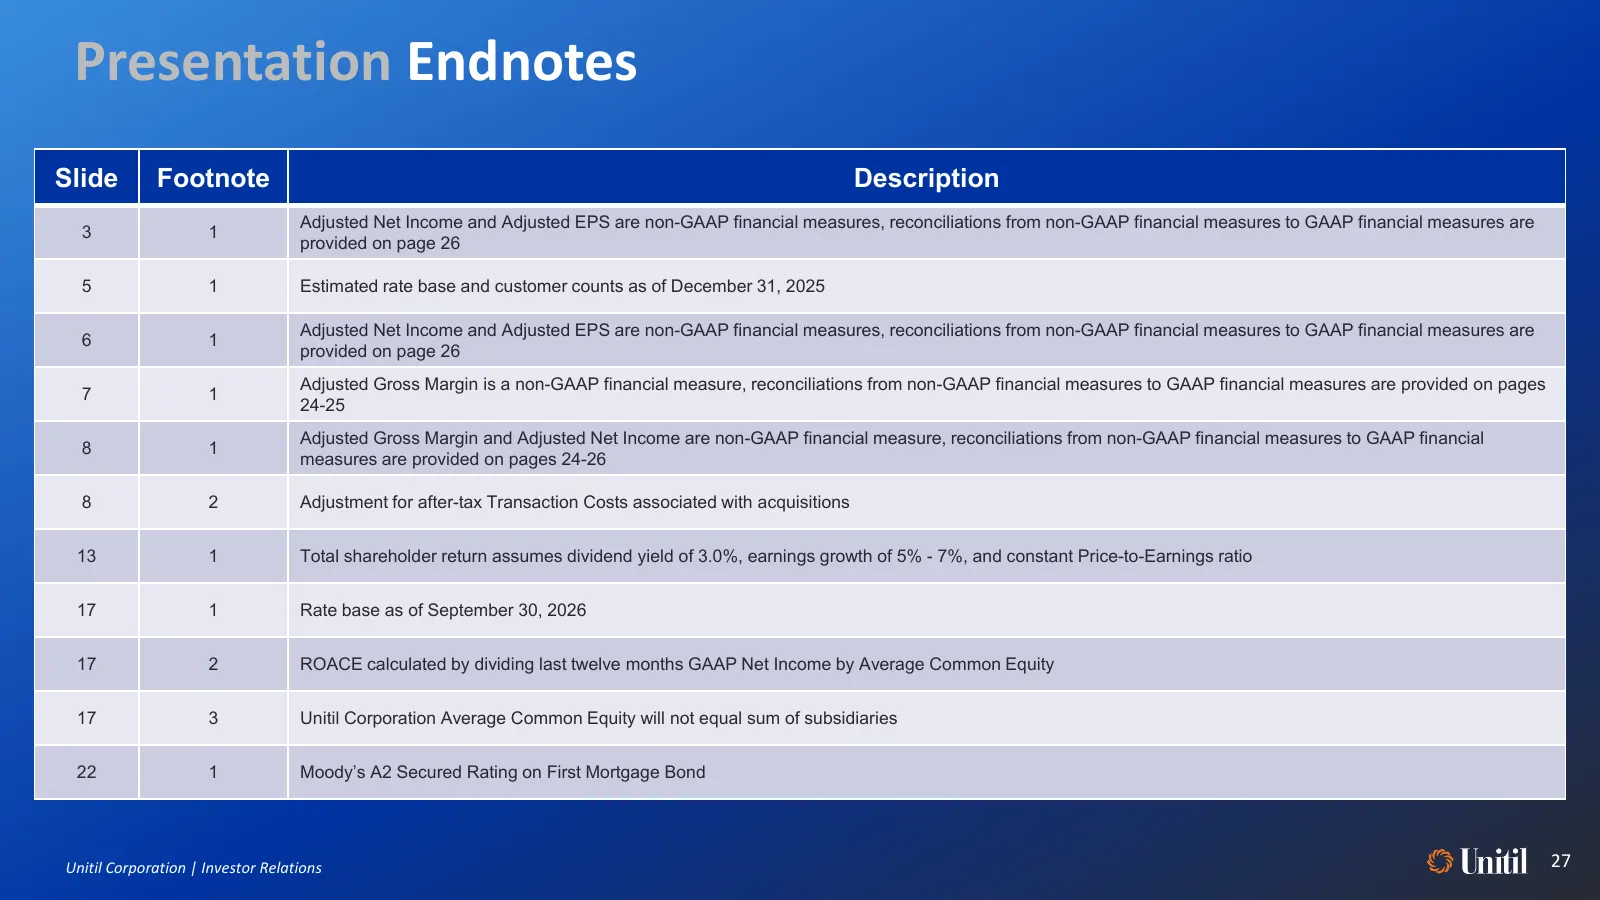
Slide 27: Presentation Endnotes
Presentation Endnotes Slide Footnote Description Adjusted Net Income and Adjusted EPS are non-GAAP financial measures, reconciliations from non-GAAP financial measures to GAAP financial measures are 3 1 provided on page 26 5 1 Estimated rate base and customer counts as of December 31, 2025 Adjusted
Source: 6ix earnings call
More decks from UNITIL Corporation
 Q2 2026 Earnings Presentation23 slides · Aug 4, 2026
 Q1 2026 Earnings Presentation24 slides · May 5, 2026
 American Gas Association Financial Forum 202629 slides · May 2026
 Shareholder Meeting (April 2026)19 slides · Apr 29, 2026
 Q4 2025 Earnings Presentation24 slides · Feb 10, 2026
 EEI Financial Conference 202534 slides · November 2025