Rexel SA · EURONEXT:RXL
Rexel SA — FY2012 Earnings Presentation
89 slides from Rexel SA's earnings presentation, February 2013
Slide 1: Post-Q4 & Full-Year 2012 Results Roadshow Presentation
POST-Q4 & FULL-YEAR 2012 RESULTS Roadshow presentation
Slide 2: Company Overview
1 » COMPANY OVERVIEW = ENERGY MOTION
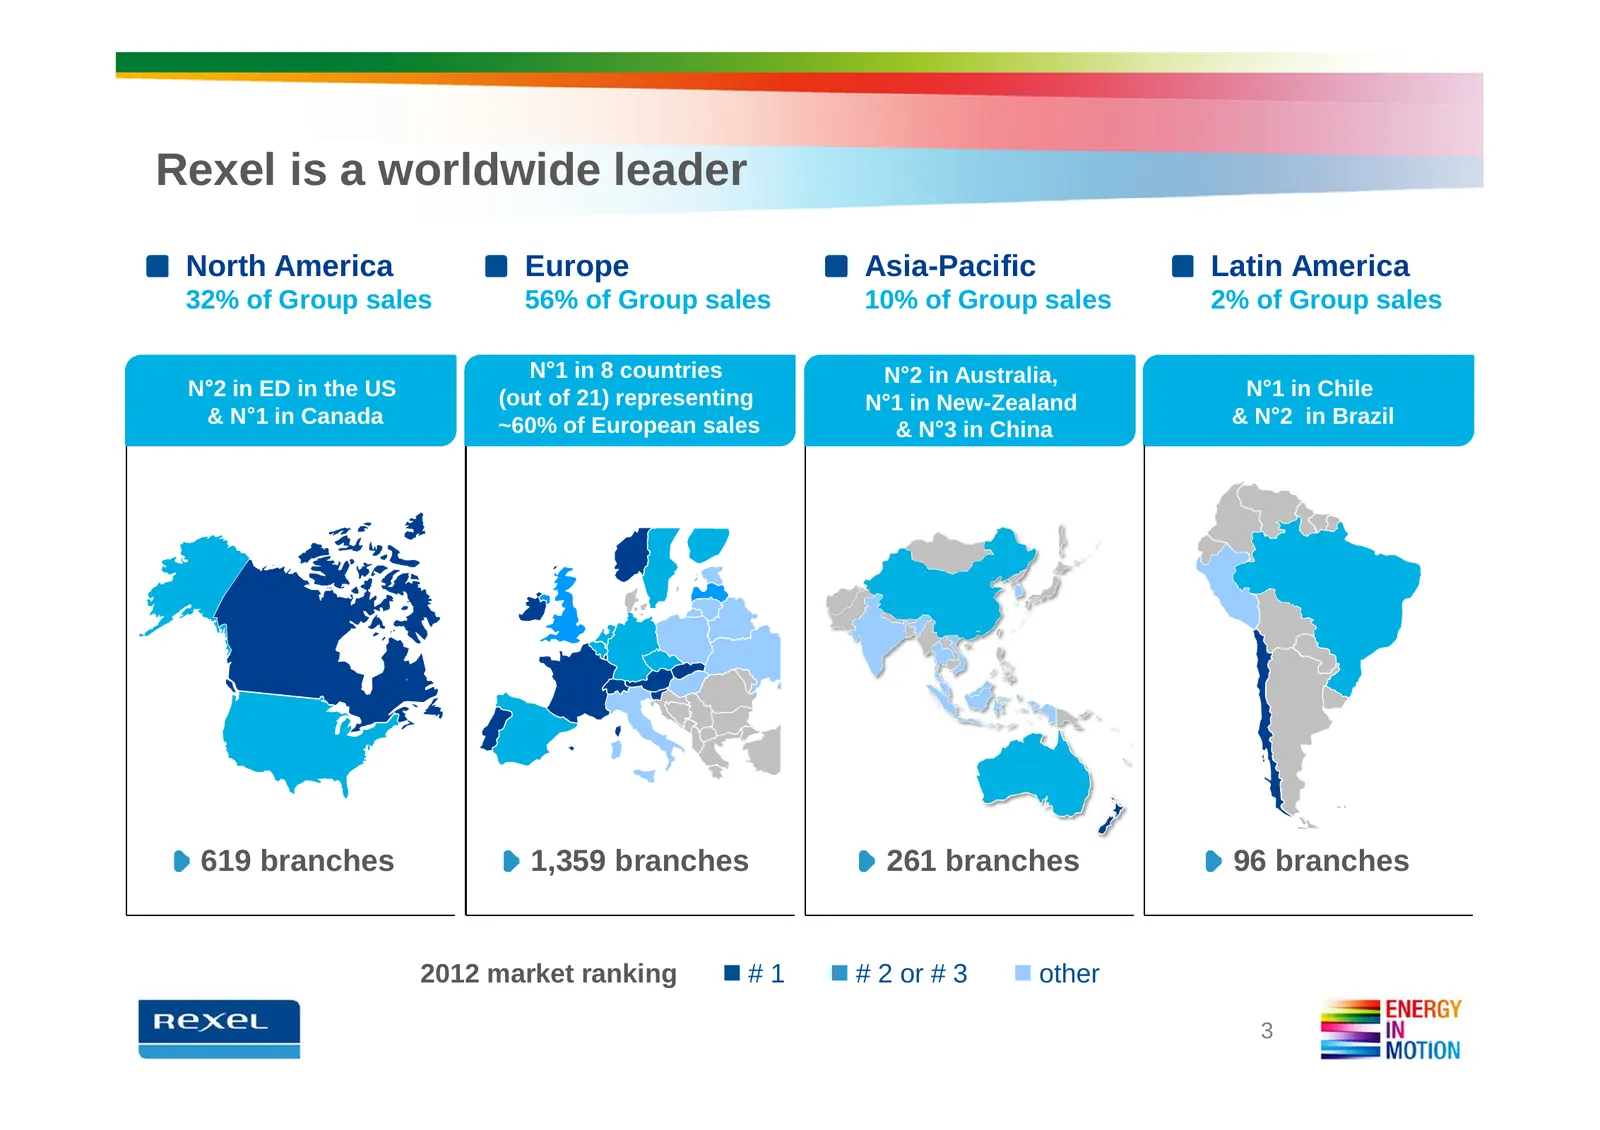
Slide 3: Rexel is a worldwide leader
Rexel is a worldwide leader North America Europe Asia-Pacific Latin America 32% of Group sales 56% of Group sales 10% of Group sales 2% of Group sales N°1 in 8 countries N°2 in Australia, N°°2 in ED in the US (out of 21) representing N°1 in Chile N°1 in New-Zealand & N°°1 in Canada ~60% of European
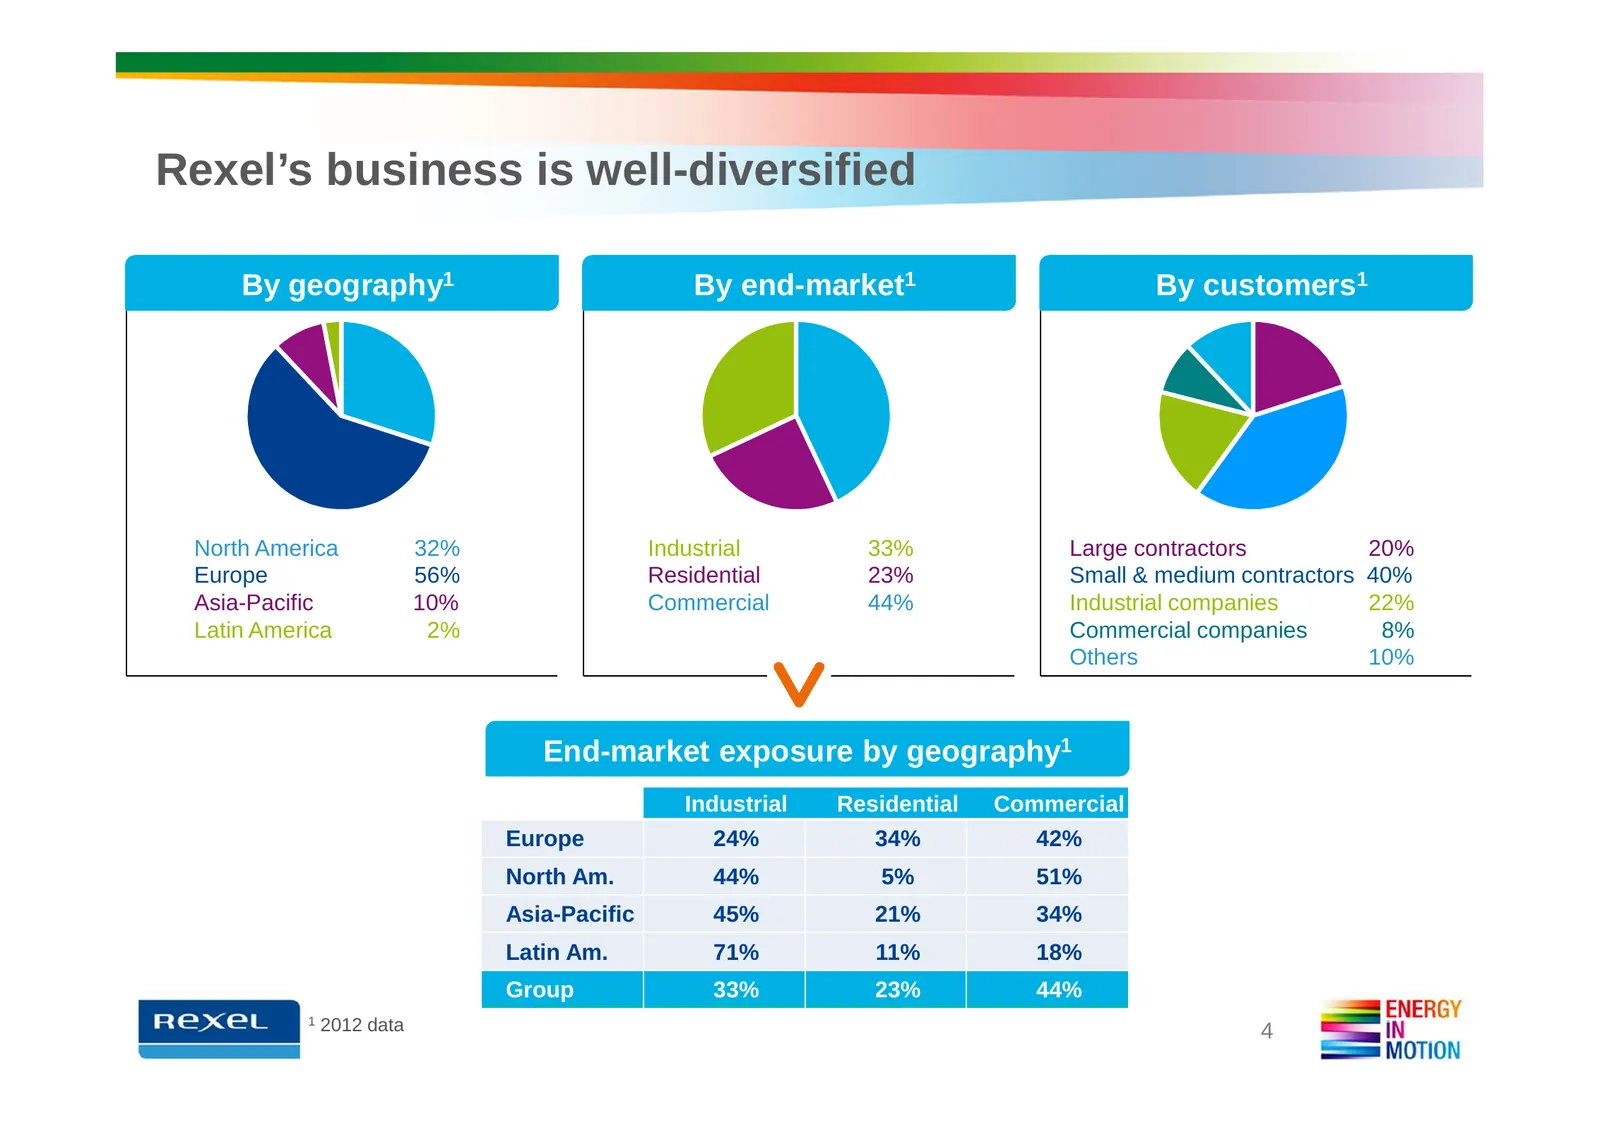
Slide 4: Rexel's business is well-diversified
Rexel’s business is well-diversified By geography1 By end-market1 By customers1 North America 32% Industrial 33% Large contractors 20% Europe 56% Residential 23% Small & medium contractors 40% Asia-Pacific 10% Commercial 44% Industrial companies 22% Latin America 2% Commercial companies 8% Others 10
Slide 5: A customer-centric approach through a multi-channel model
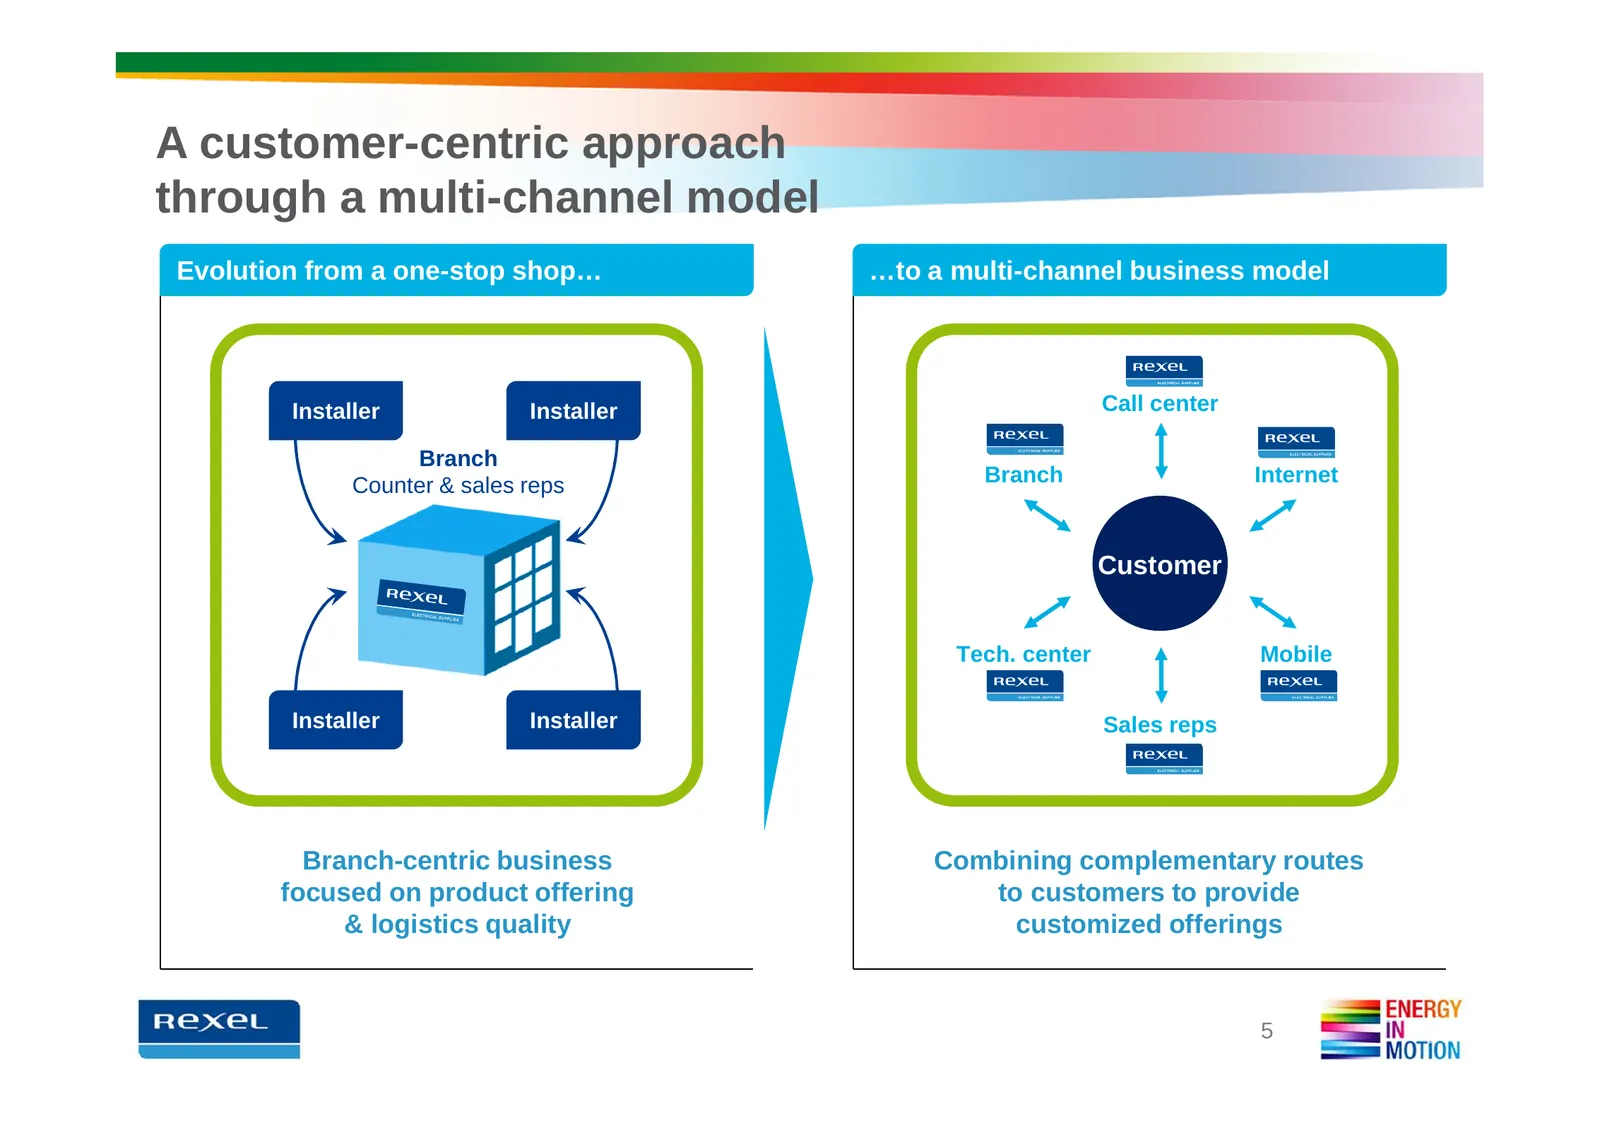
A customer-centric approach through a multi-channel model Evolution from a one-stop shop… …to a multi-channel business model Installer Installer Call center Branch Counter & sales reps Branch Internet Customer Tech. center Mobile Installer Installer Sales reps Branch-centric business Combining compl
Slide 6: Rexel has strong relationships with its suppliers
Rexel has strong relationships with its suppliers Rexel has organized its supplier relationships around: A limited number of strategic suppliers that are global players A number of national or regional suppliers The 25 top suppliers represent 53% of Rexel’s purchases, with no risk of interdependence
Slide 7: Rexel: a market consolidator with a proven capacity to extract synergies
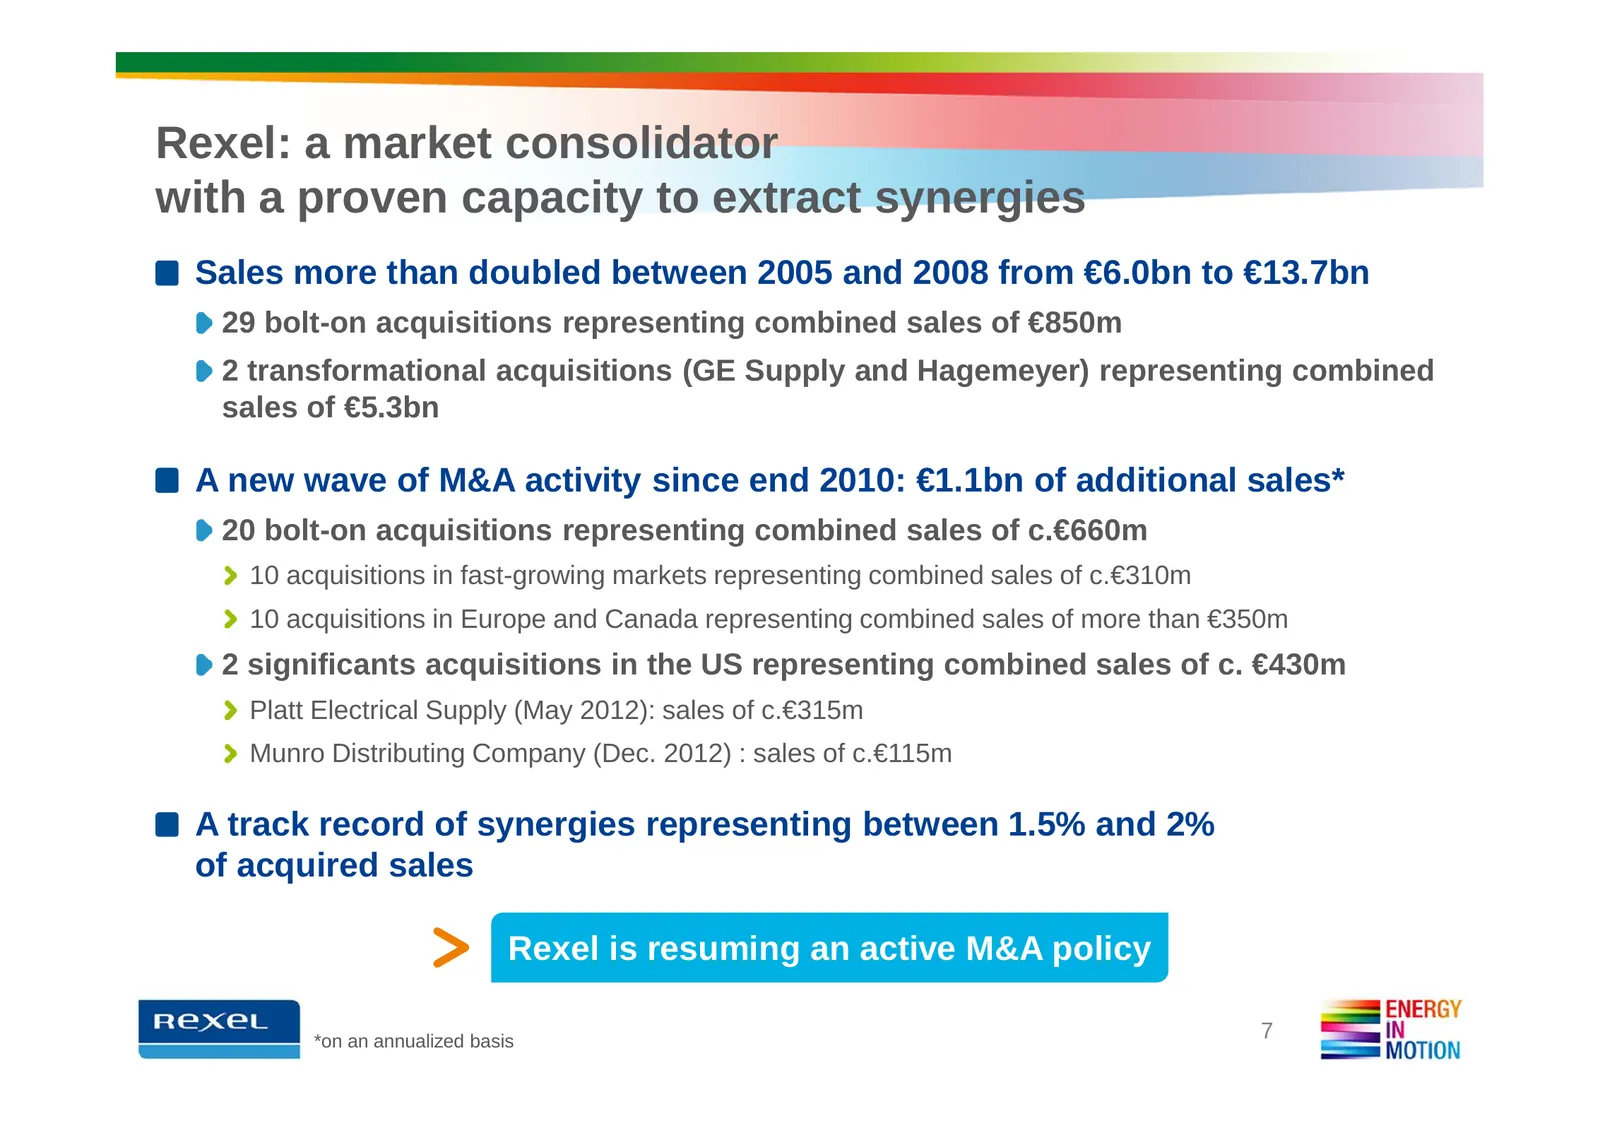
Rexel: a market consolidator with a proven capacity to extract synergies Sales more than doubled between 2005 and 2008 from €6.0bn to €13.7bn 29 bolt-on acquisitions representing combined sales of €850m 2 transformational acquisitions (GE Supply and Hagemeyer) representing combined sales of €5.3bn A
Slide 8: Resilience across cycles thanks to margin discipline and cost management
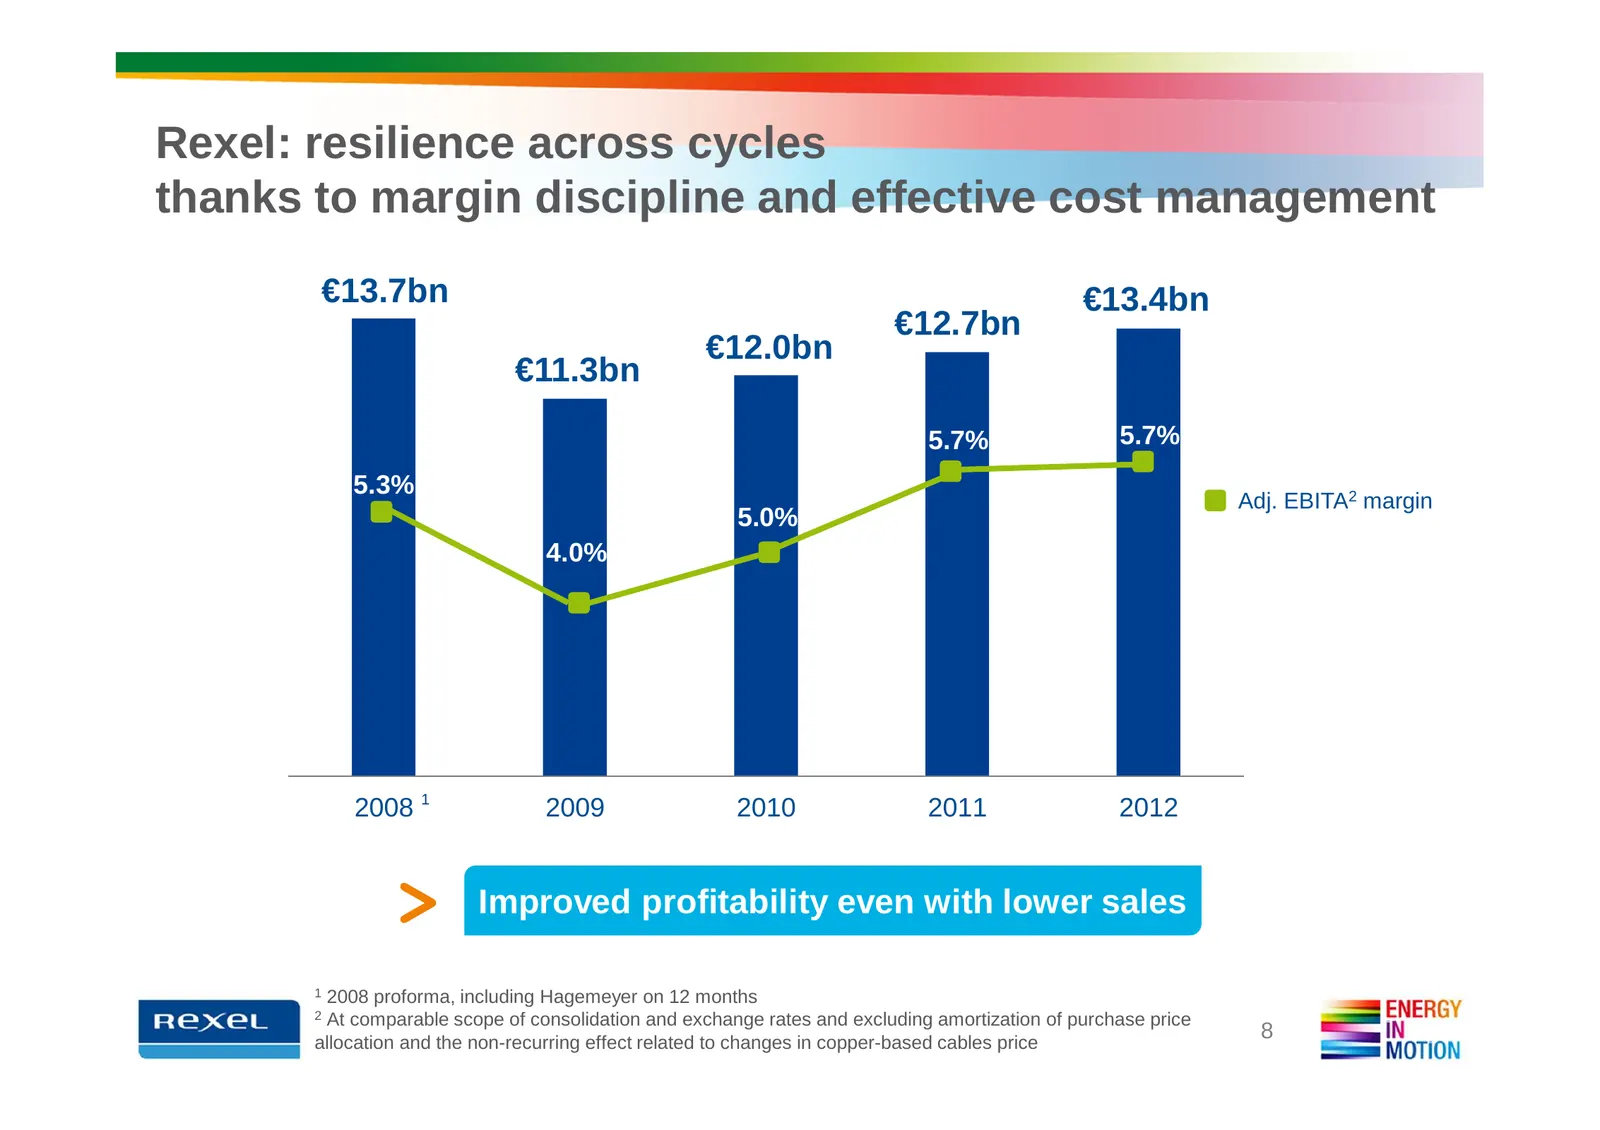
Rexel: resilience across cycles thanks to margin discipline and effective cost management €13.7bn €13.4bn €12.7bn €12.0bn €11.3bn 5.7% 5.7% 5.3% Adj. EBITA2 margin 5.0% 4.0% 2008 1 2009 2010 2011 2012 Improved profitability even with lower sales 1 2008 proforma, including Hagemeyer on 12 months 2 At
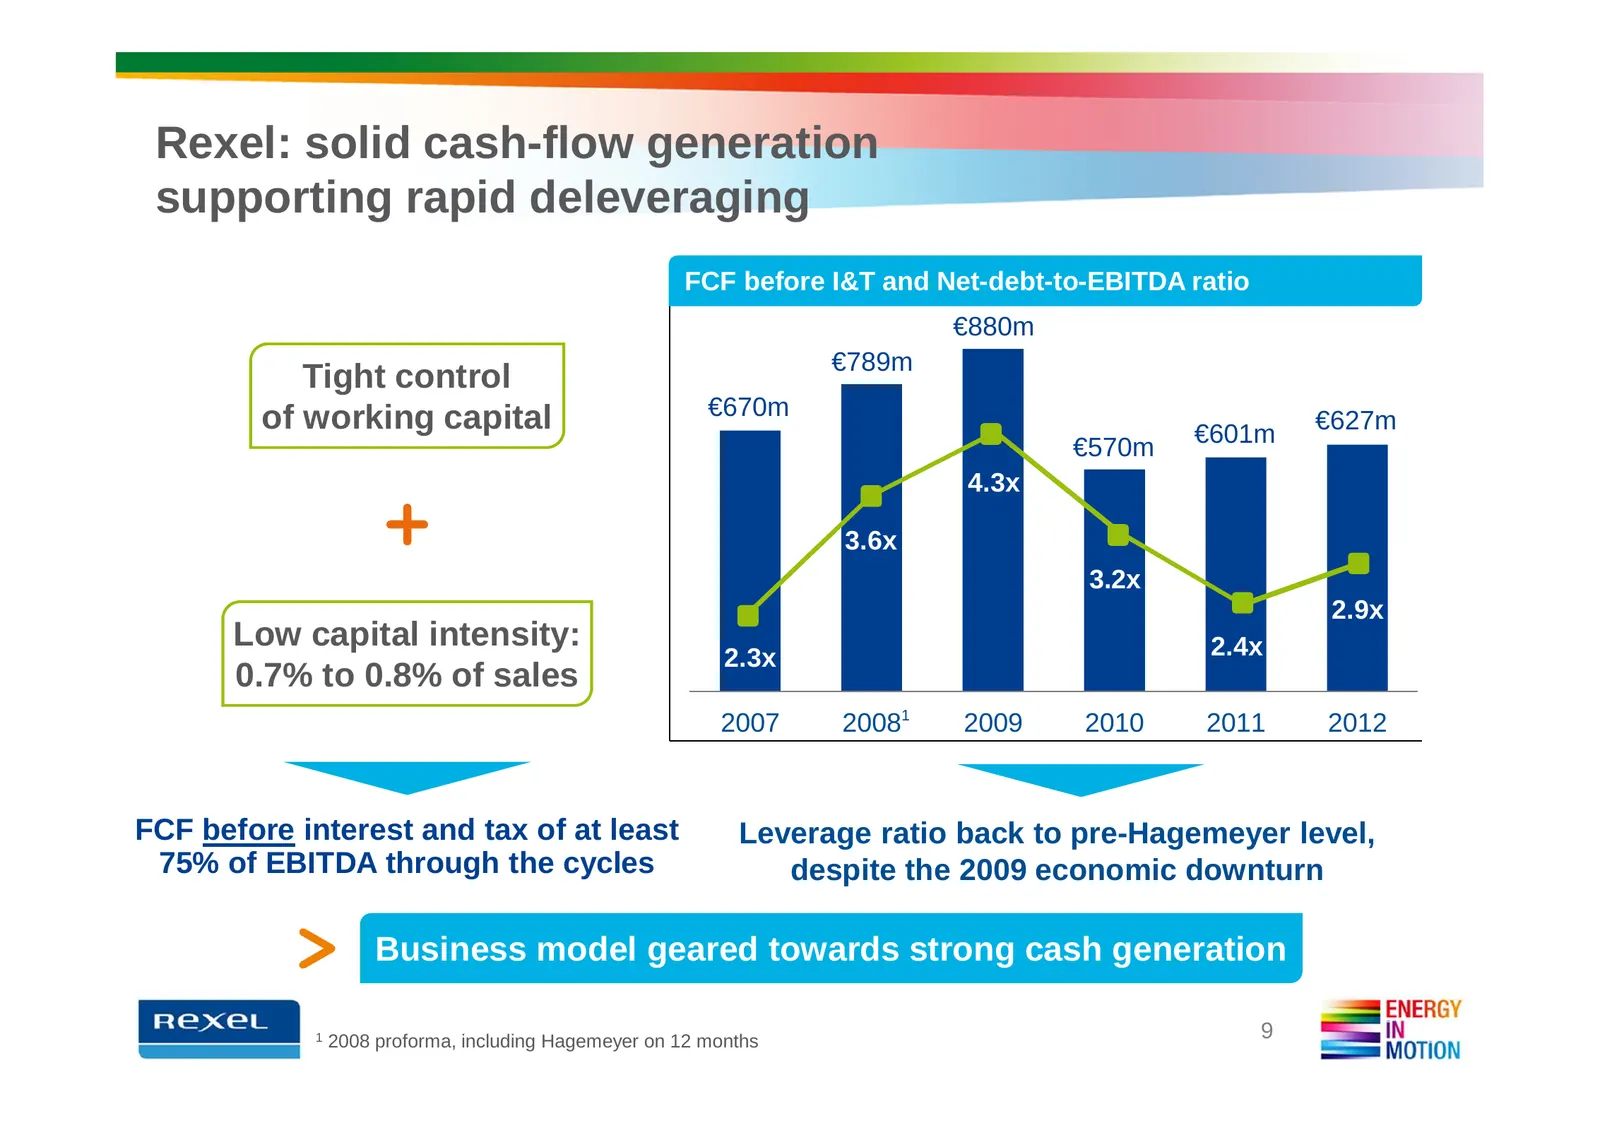
Slide 9: Solid cash-flow generation supporting rapid deleveraging
Rexel: solid cash-flow generation supporting rapid deleveraging FCF before I&T and Net-debt-to-EBITDA ratio €880m €789m Tight control of working capital €670m €627m €601m €570m 4.3x 3.6x 3.2x 2.9x Low capital intensity: 2.4x 2.3x 0.7% to 0.8% of sales 2007 20081 2009 2010 2011 2012 FCF before intere
Slide 10: Q4 & Full-Year Results
2 a Q4 & FULL-YEAR RESULTS = ENERGY MOTION
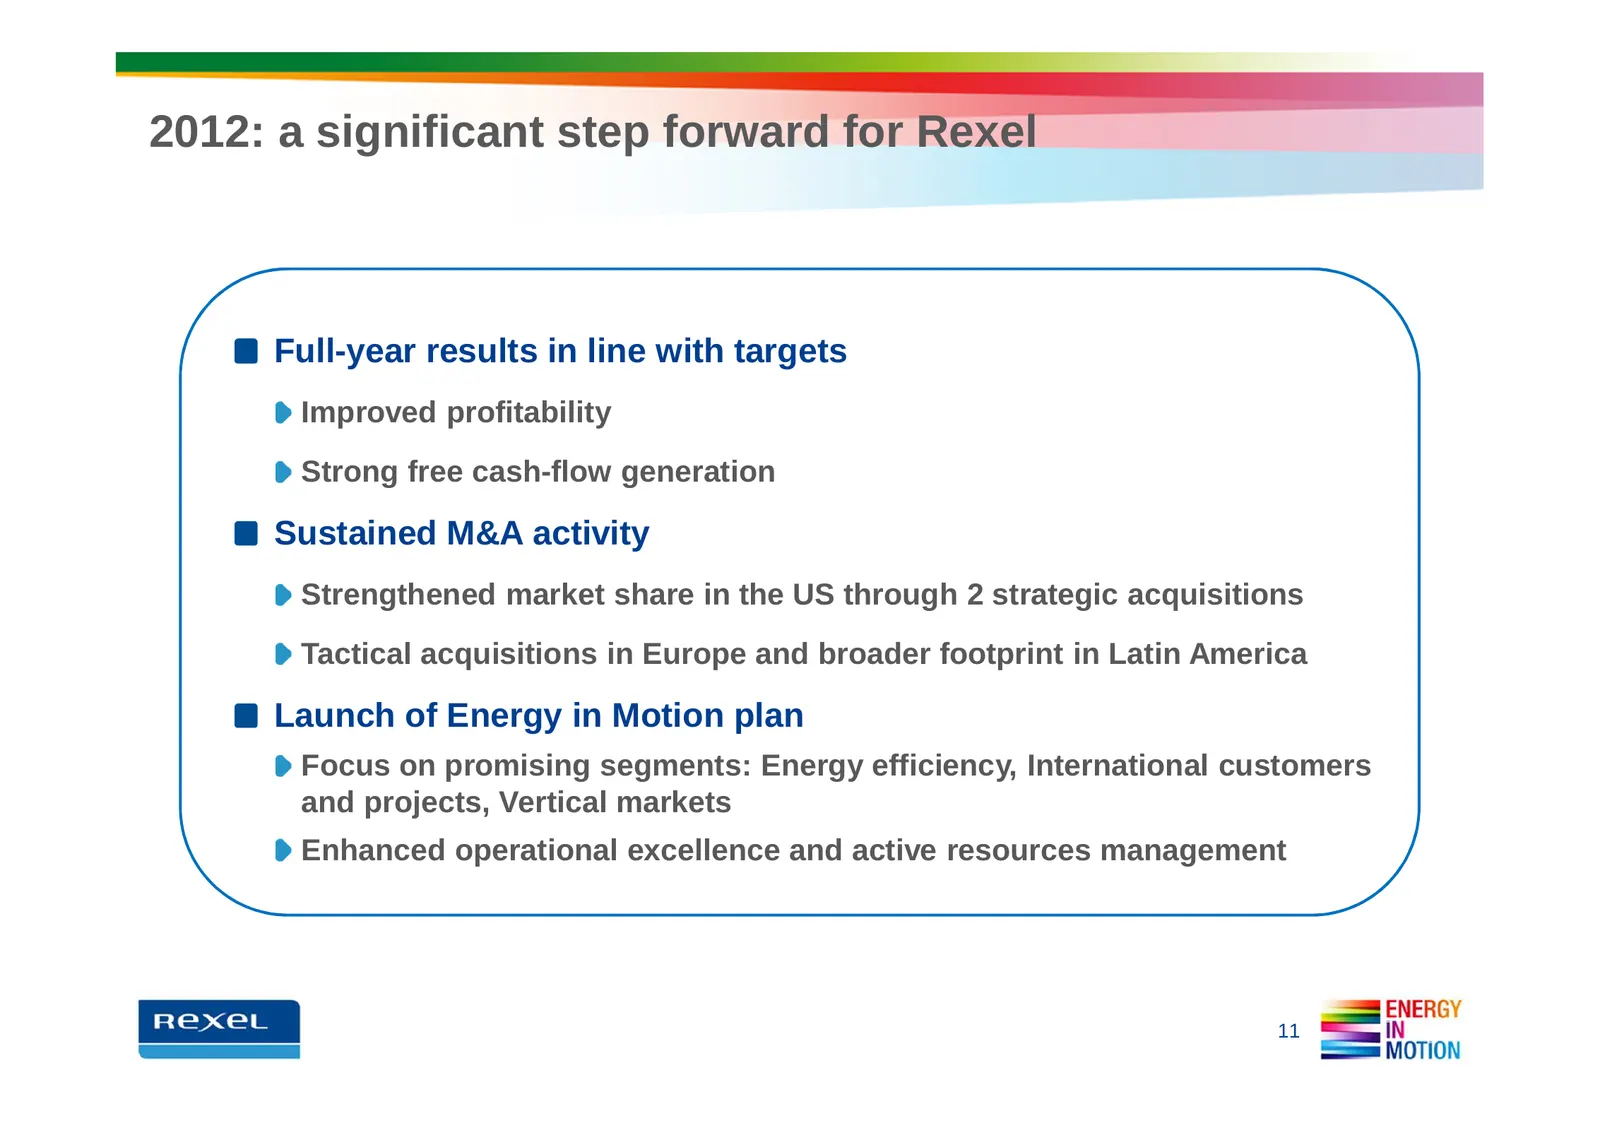
Slide 11: 2012: a significant step forward for Rexel
2012: a significant step forward for Rexel Full-year results in line with targets Improved profitability Strong free cash-flow generation Sustained M&A activity Strengthened market share in the US through 2 strategic acquisitions Tactical acquisitions in Europe and broader footprint in Latin America
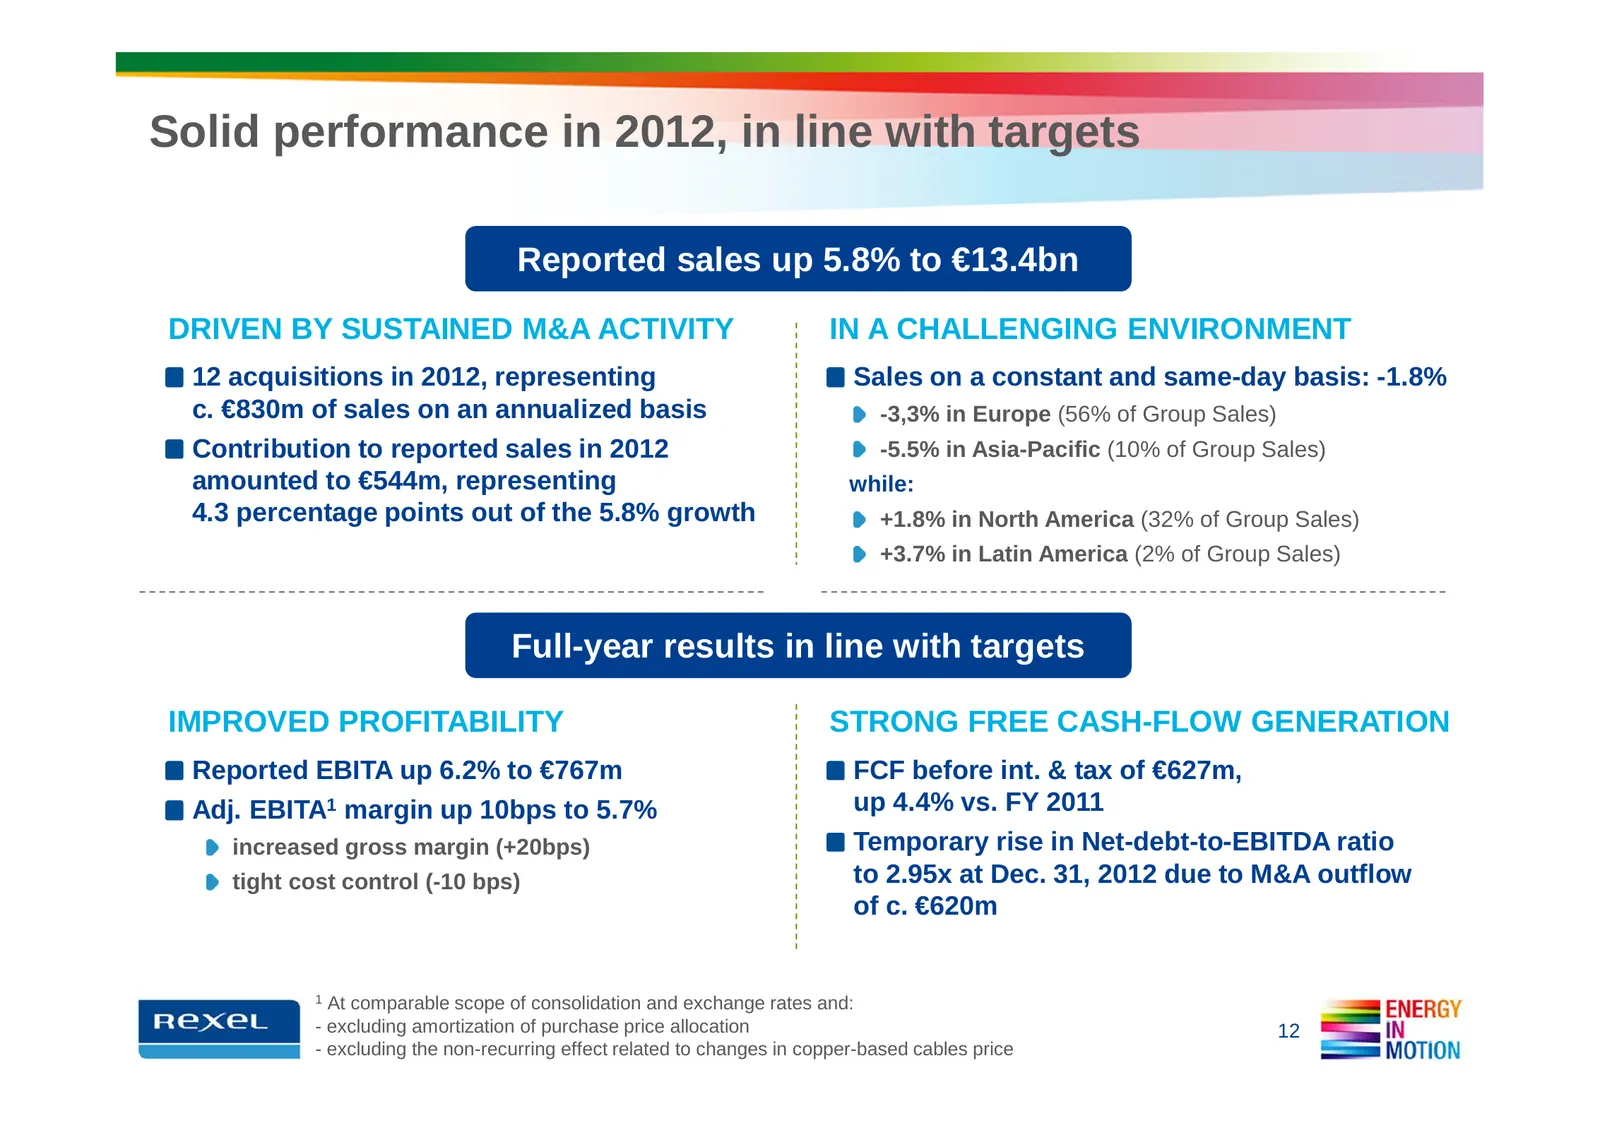
Slide 12: Solid performance in 2012, in line with targets
Solid performance in 2012, in line with targets Reported sales up 5.8% to €13.4bn DRIVEN BY SUSTAINED M&A ACTIVITY IN A CHALLENGING ENVIRONMENT 12 acquisitions in 2012, representing Sales on a constant and same-day basis: -1.8% c. €830m of sales on an annualized basis -3,3% in Europe (56% of Group S
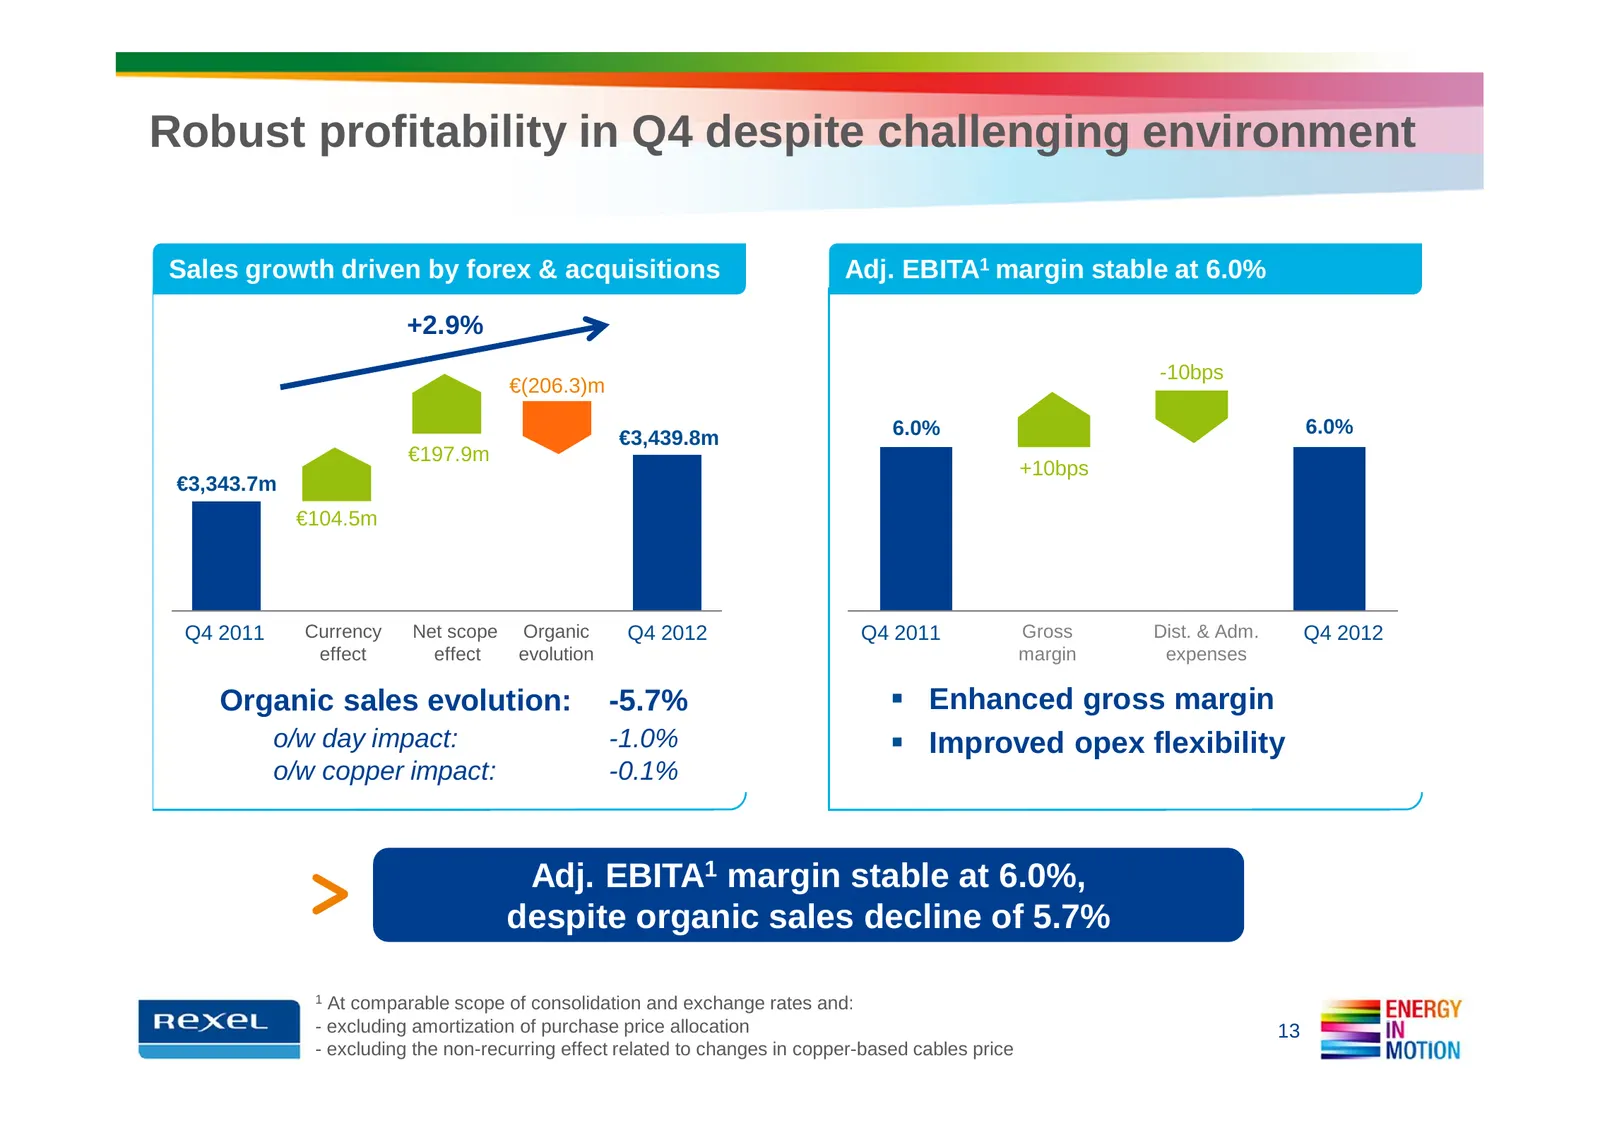
Slide 13: Robust profitability in Q4 despite challenging environment
Robust profitability in Q4 despite challenging environment Sales growth driven by forex & acquisitions Adj. EBITA1 margin stable at 6.0% +2.9% -10bps €(206.3)m 6.0% 6.0% €3,439.8m €197.9m +10bps €3,343.7m €104.5m Q4 2011 Currency Net scope Organic Q4 2012 Q4 2011 Gross Dist. & Adm. Q4 2012 effect ef
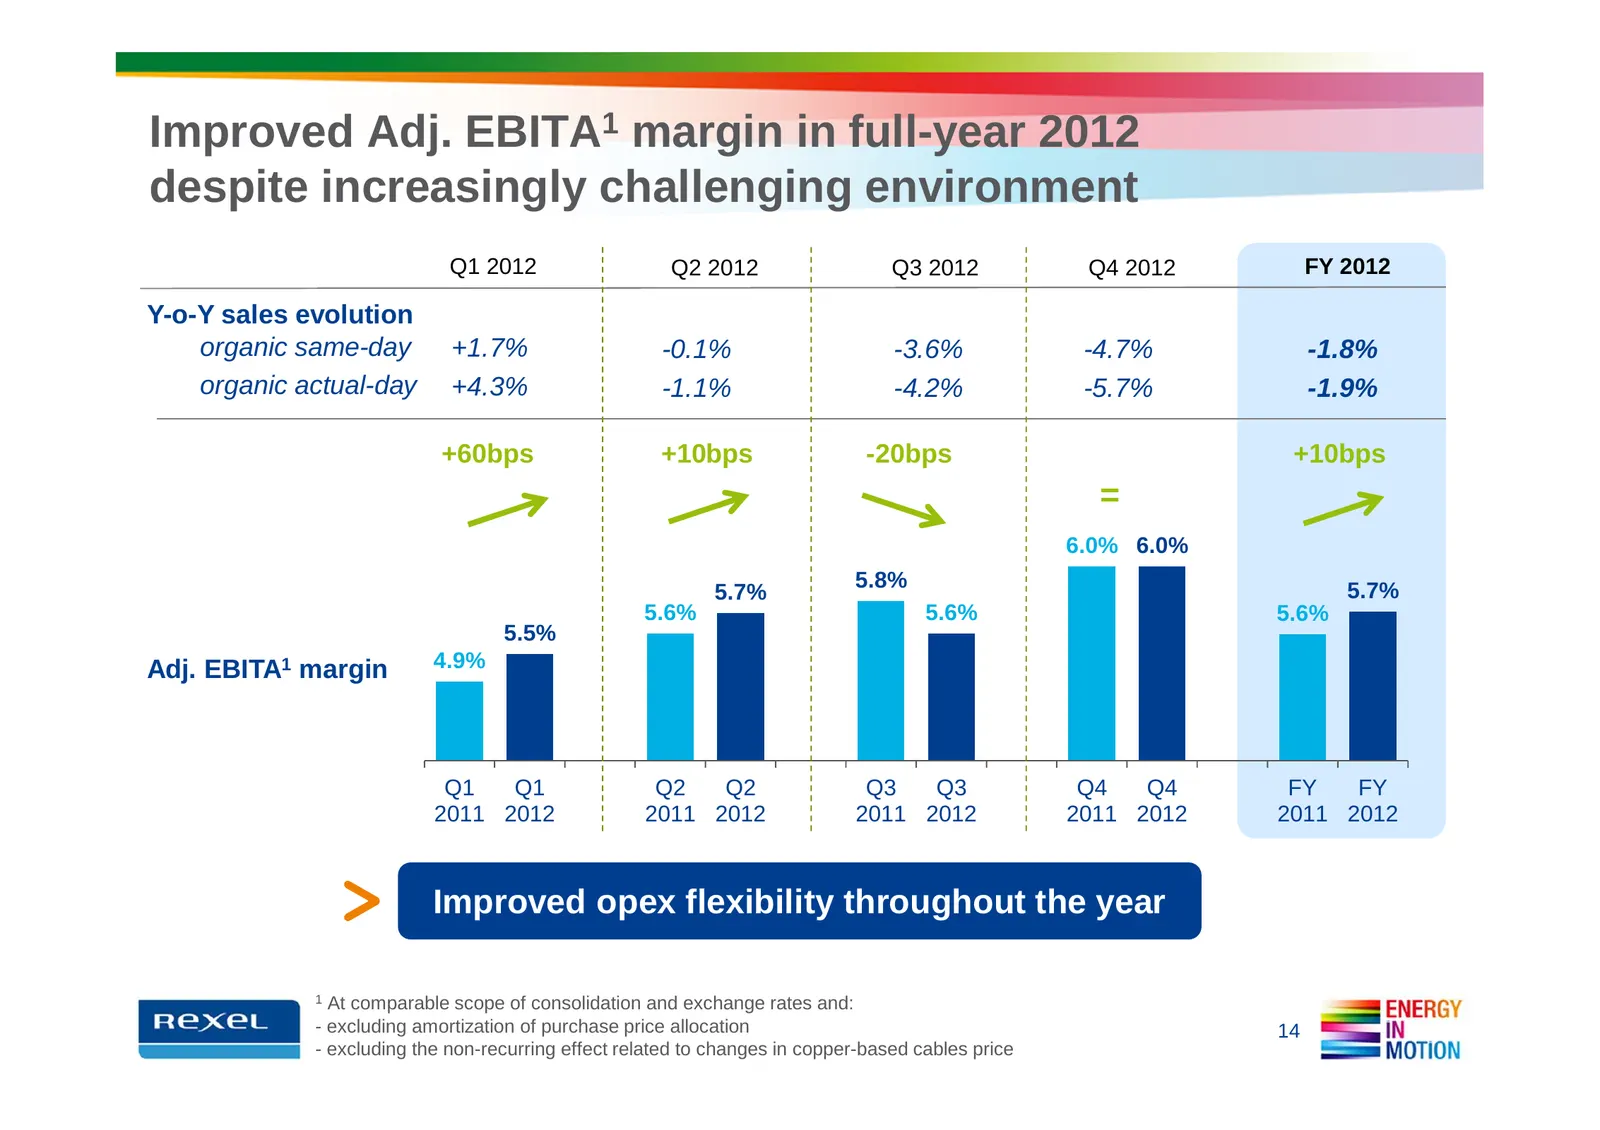
Slide 14: Improved Adj. EBITA margin in full-year 2012
Improved Adj. EBITA1 margin in full-year 2012 despite increasingly challenging environment Q1 2012 Q2 2012 Q3 2012 Q4 2012 FY 2012 Y-o-Y sales evolution organic same-day +1.7% -0.1% -3.6% -4.7% -1.8% organic actual-day +4.3% -1.1% -4.2% -5.7% -1.9% +60bps +10bps -20bps +10bps = 6.0% 6.0% 5.8% 5.7% 5
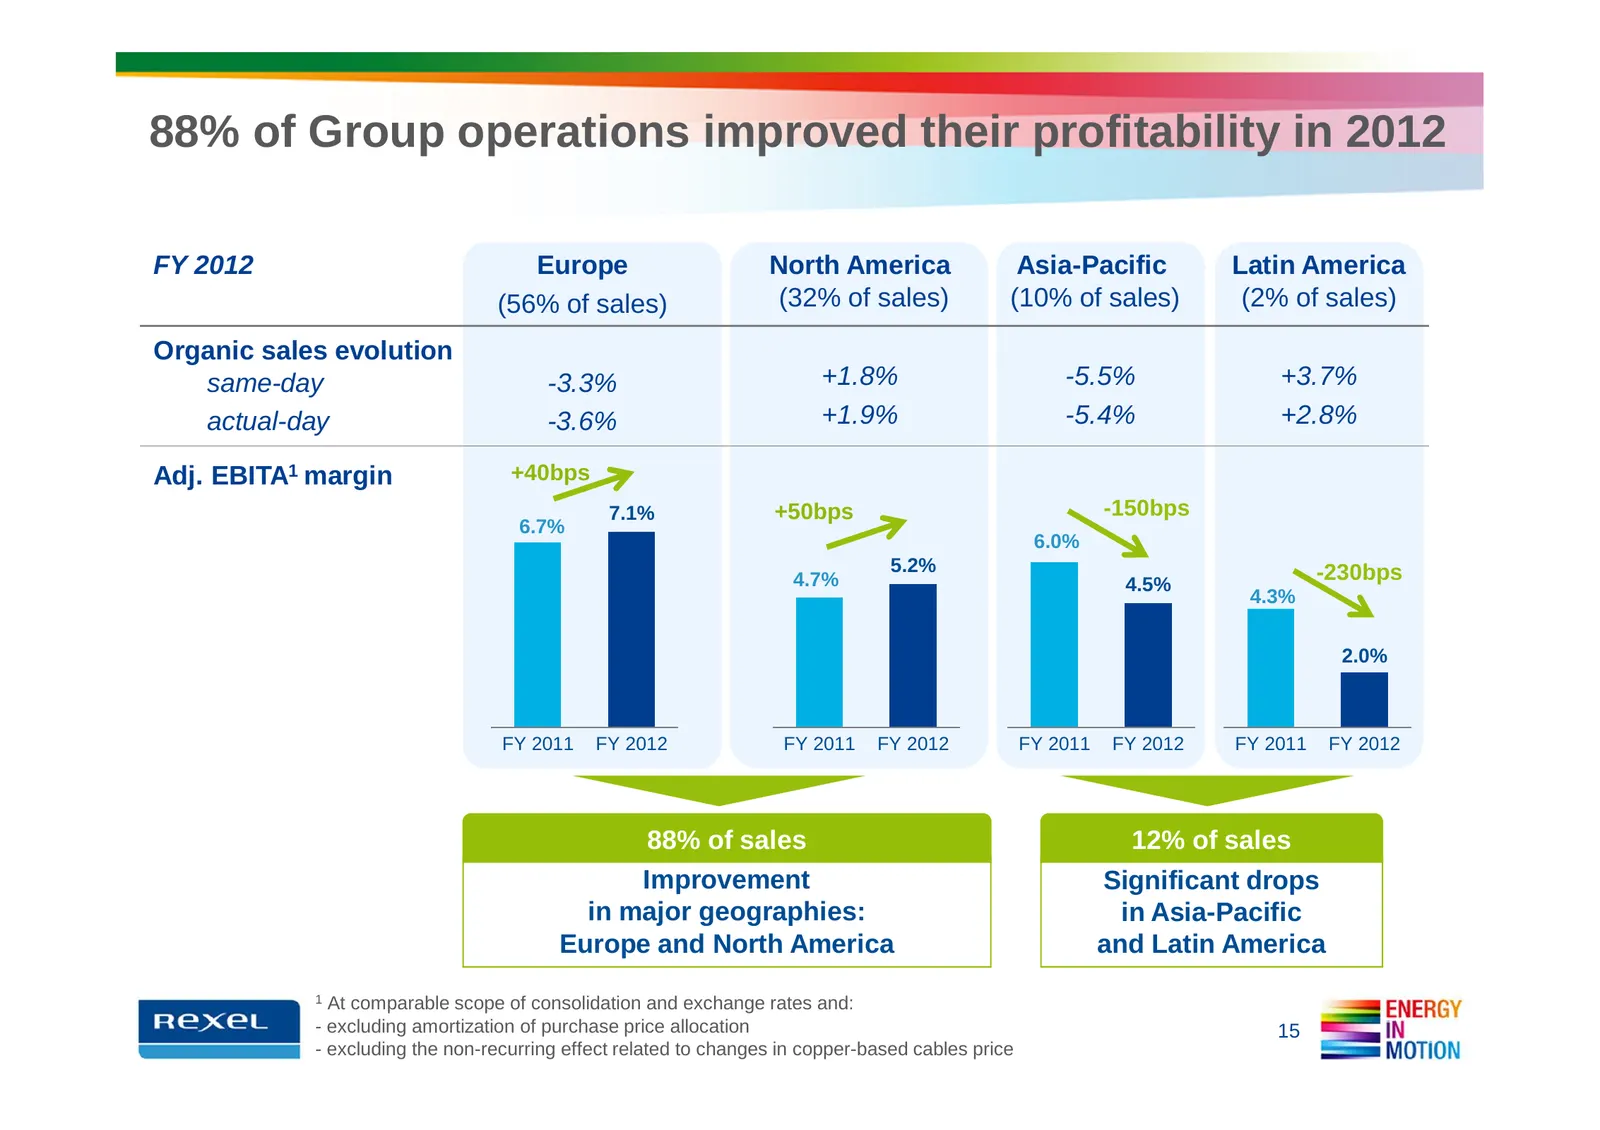
Slide 15: 88% of Group operations improved their profitability in 2012
88% of Group operations improved their profitability in 2012 FY 2012 Europe North America Asia-Pacific Latin America (56% of sales) (32% of sales) (10% of sales) (2% of sales) Organic sales evolution same-day -3.3% +1.8% -5.5% +3.7% actual-day -3.6% +1.9% -5.4% +2.8% Adj. EBITA1 margin +40bps 7.1% +
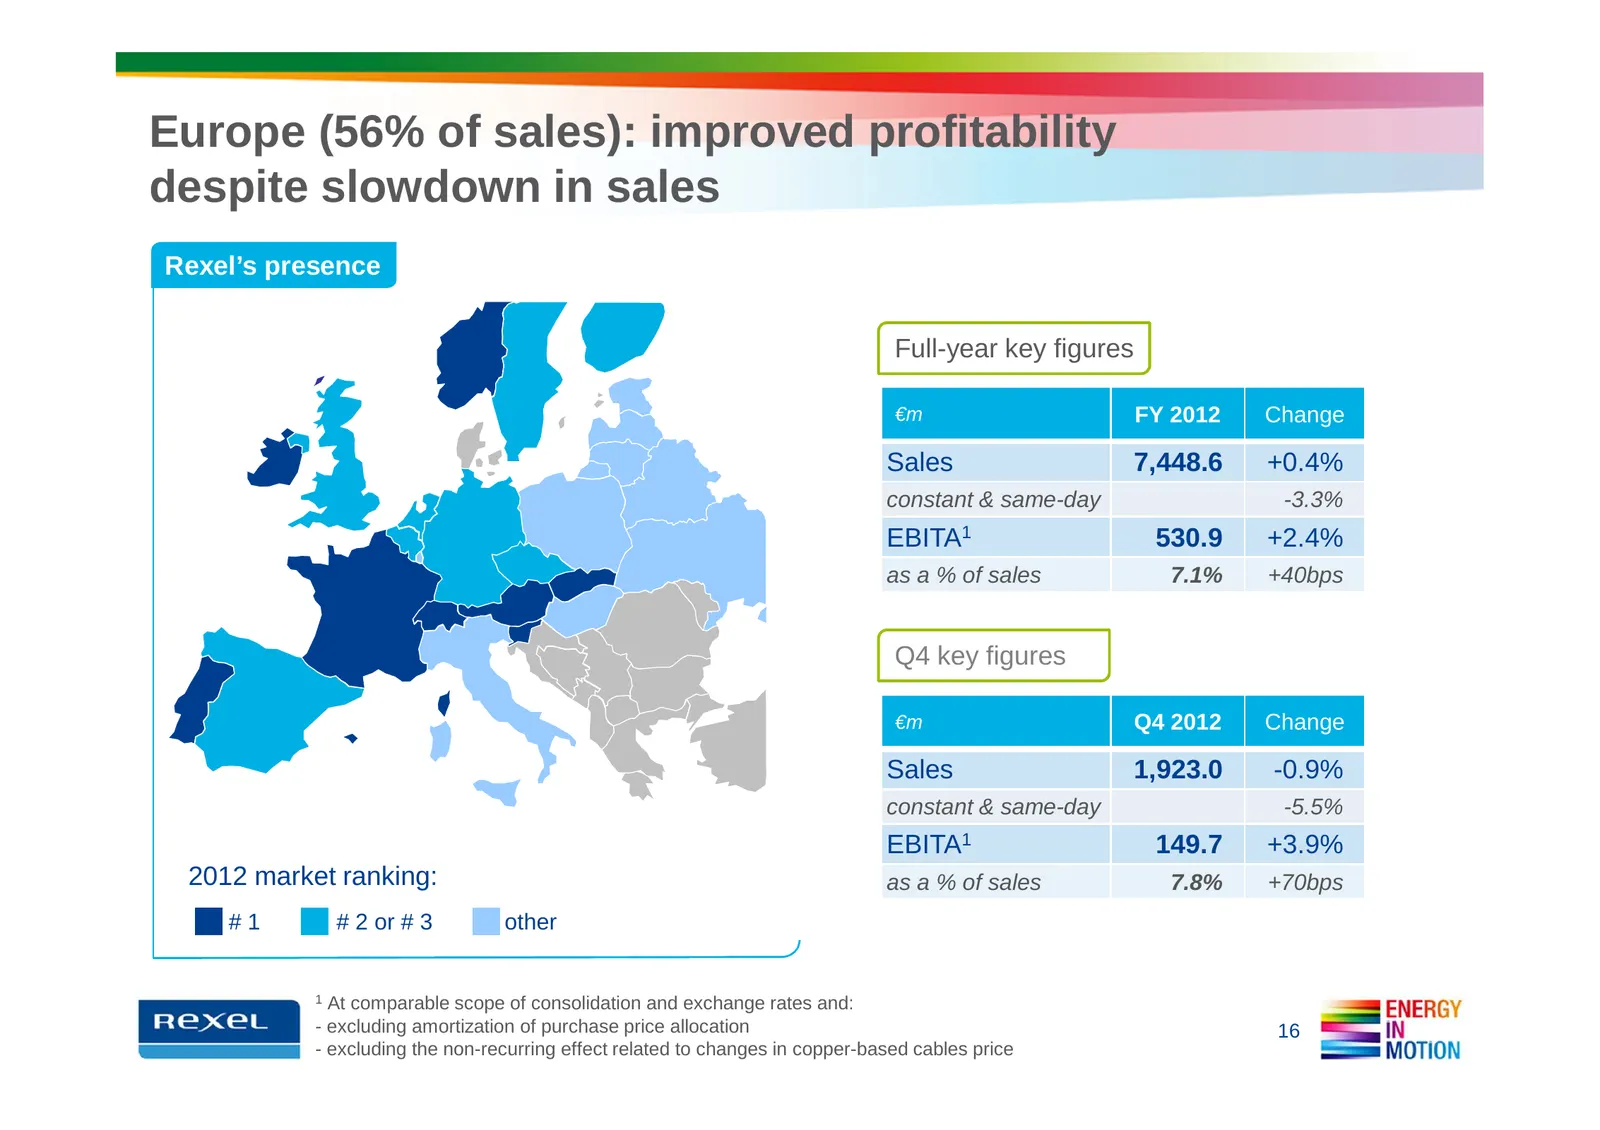
Slide 16: Europe: improved profitability despite slowdown in sales
Europe (56% of sales): improved profitability despite slowdown in sales Rexel’s presence Full-year key figures €m FY 2012 Change Sales 7,448.6 +0.4% constant & same-day -3.3% EBITA1 530.9 +2.4% as a % of sales 7.1% +40bps Q4 key figures €m Q4 2012 Change Sales 1,923.0 -0.9% constant & same-day -5.5%
Slide 17: Europe: Q4 2012 business highlights
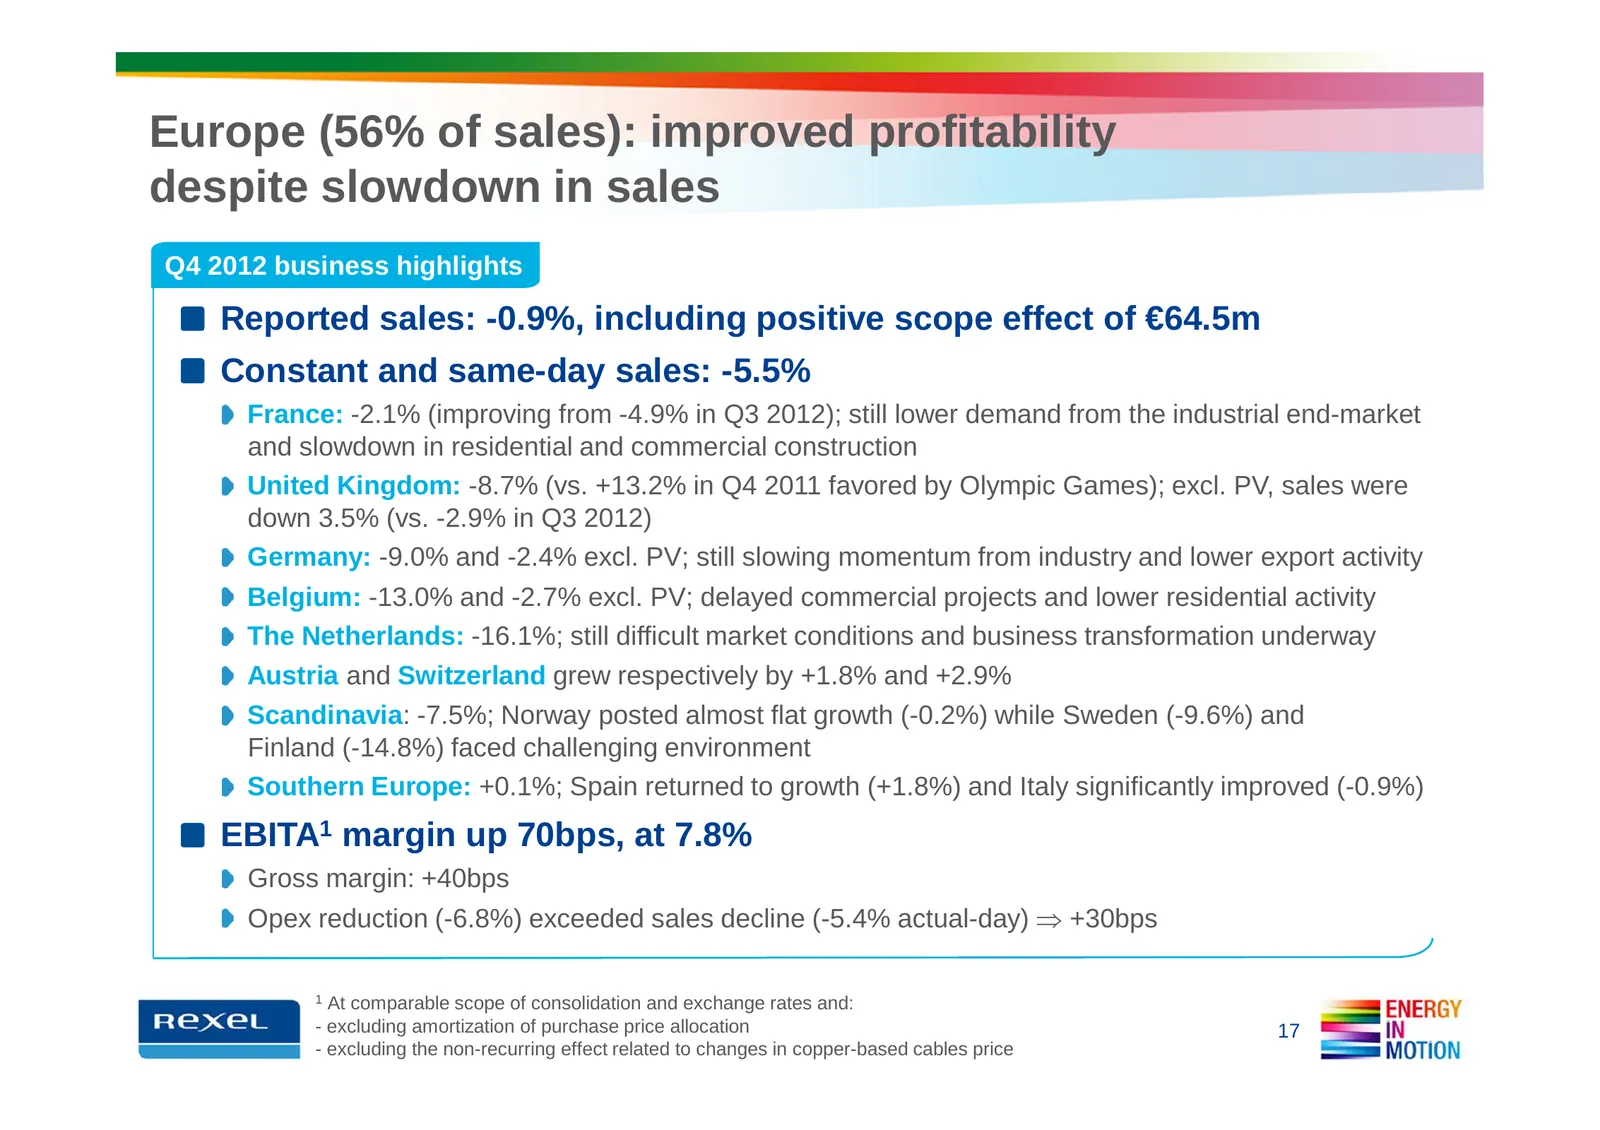
Europe (56% of sales): improved profitability despite slowdown in sales Q4 2012 business highlights Reported sales: -0.9%, including positive scope effect of €64.5m Constant and same-day sales: -5.5% France: -2.1% (improving from -4.9% in Q3 2012); still lower demand from the industrial end-market a
Slide 18: North America: solid full-year performance and integration of acquisitions
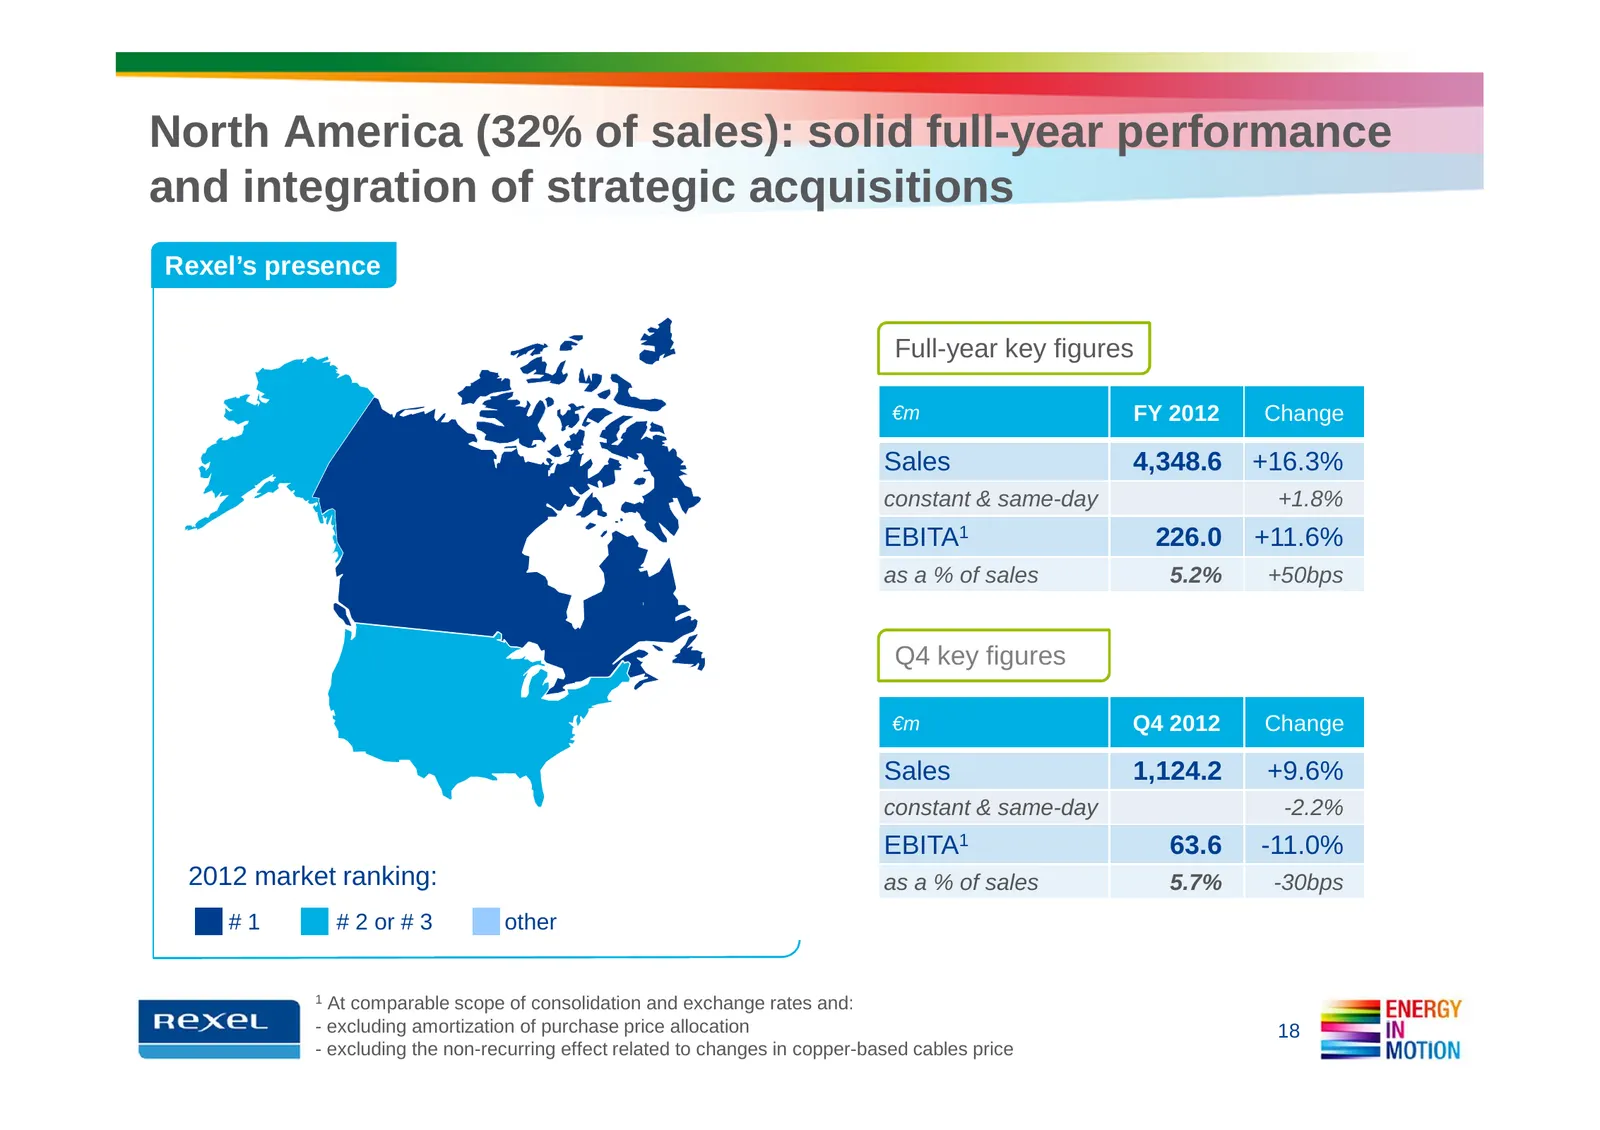
North America (32% of sales): solid full-year performance and integration of strategic acquisitions Rexel’s presence Full-year key figures €m FY 2012 Change Sales 4,348.6 +16.3% constant & same-day +1.8% EBITA1 226.0 +11.6% as a % of sales 5.2% +50bps Q4 key figures €m Q4 2012 Change Sales 1,124.2 +
Slide 19: North America: Q4 2012 business highlights
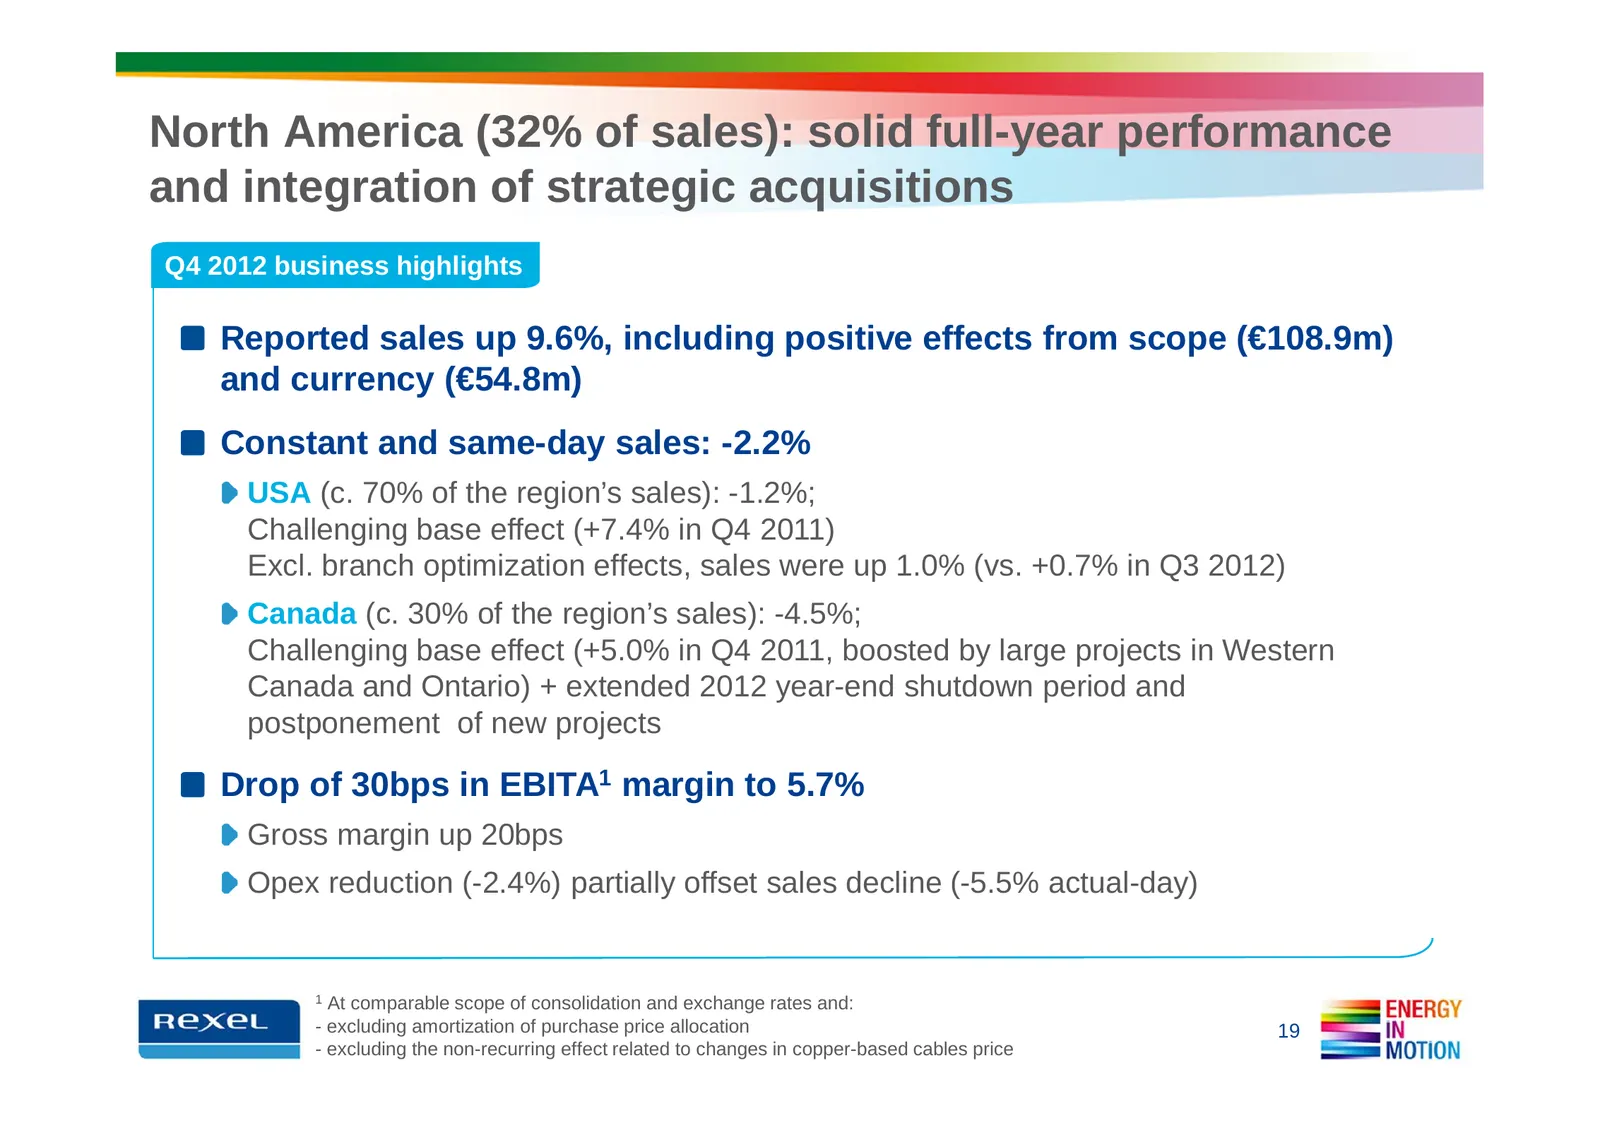
North America (32% of sales): solid full-year performance and integration of strategic acquisitions Q4 2012 business highlights Reported sales up 9.6%, including positive effects from scope (€108.9m) and currency (€54.8m) Constant and same-day sales: -2.2% USA (c. 70% of the region’s sales): -1.2%;
Slide 20: Asia-Pacific: growth in China offset by the Pacific region
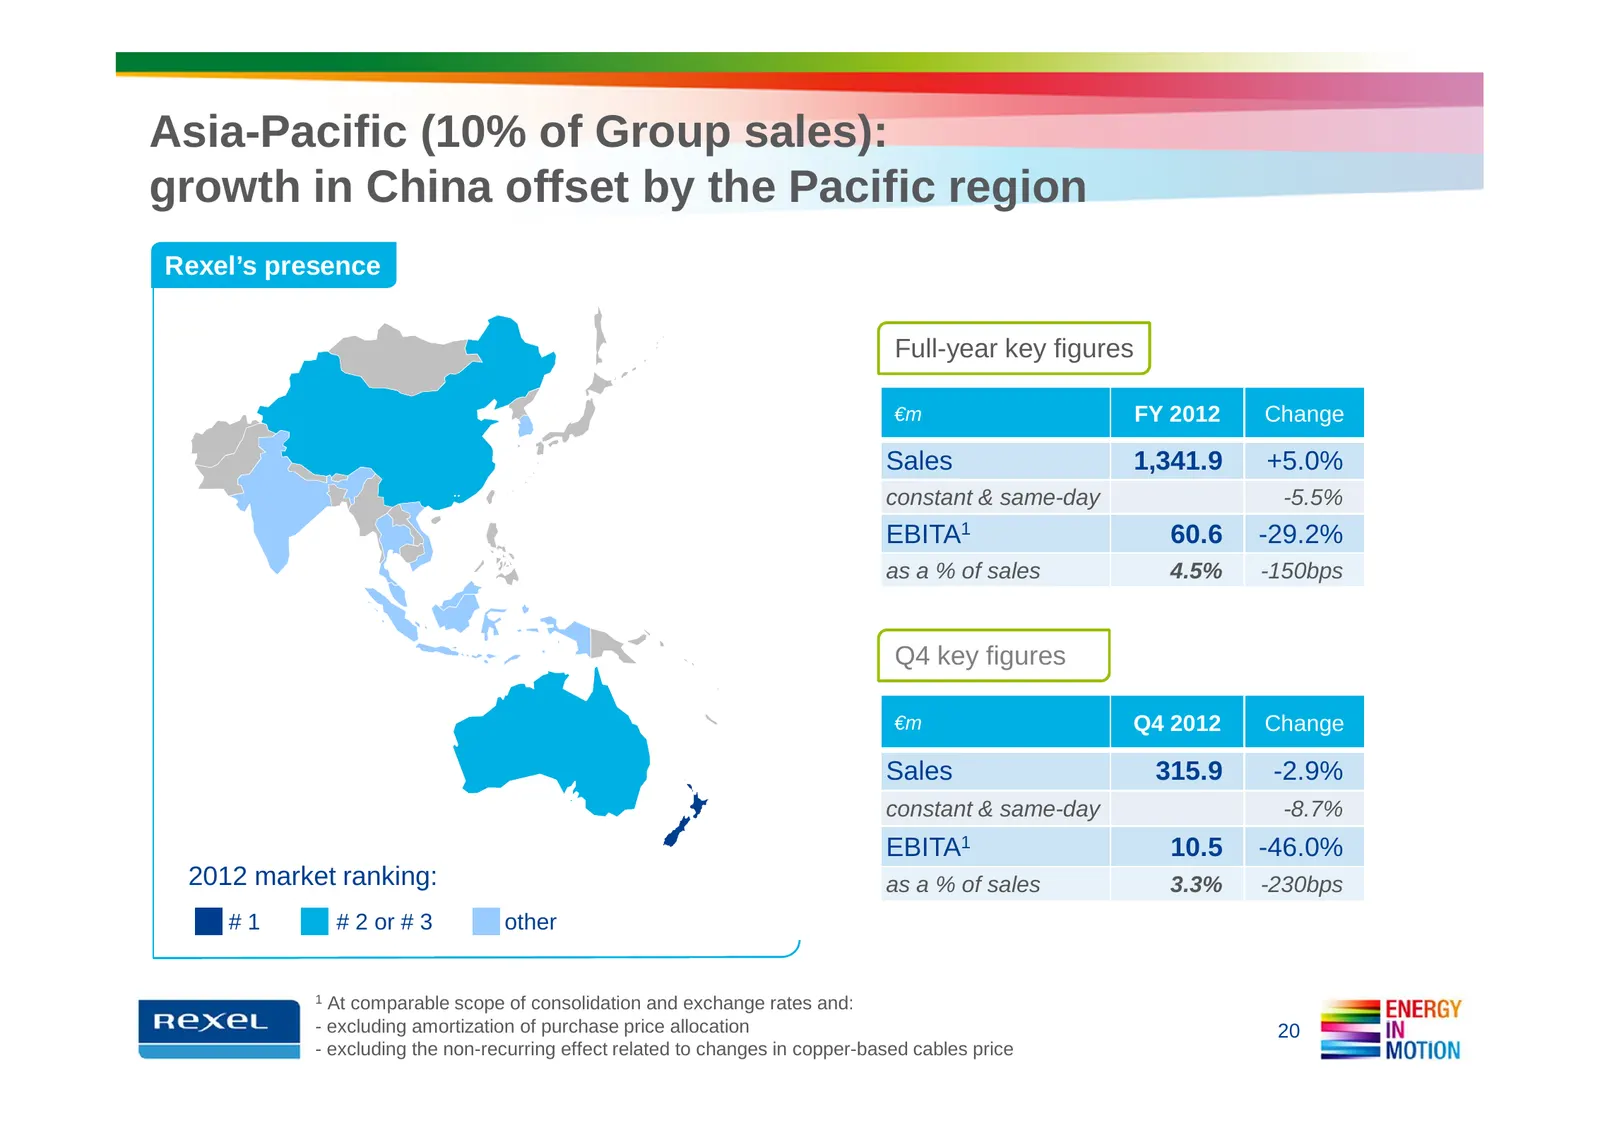
Asia-Pacific (10% of Group sales): growth in China offset by the Pacific region Rexel’s presence Full-year key figures €m FY 2012 Change Sales 1,341.9 +5.0% constant & same-day -5.5% EBITA1 60.6 -29.2% as a % of sales 4.5% -150bps Q4 key figures €m Q4 2012 Change Sales 315.9 -2.9% constant & same-da
Slide 21: Asia-Pacific: Q4 2012 business highlights
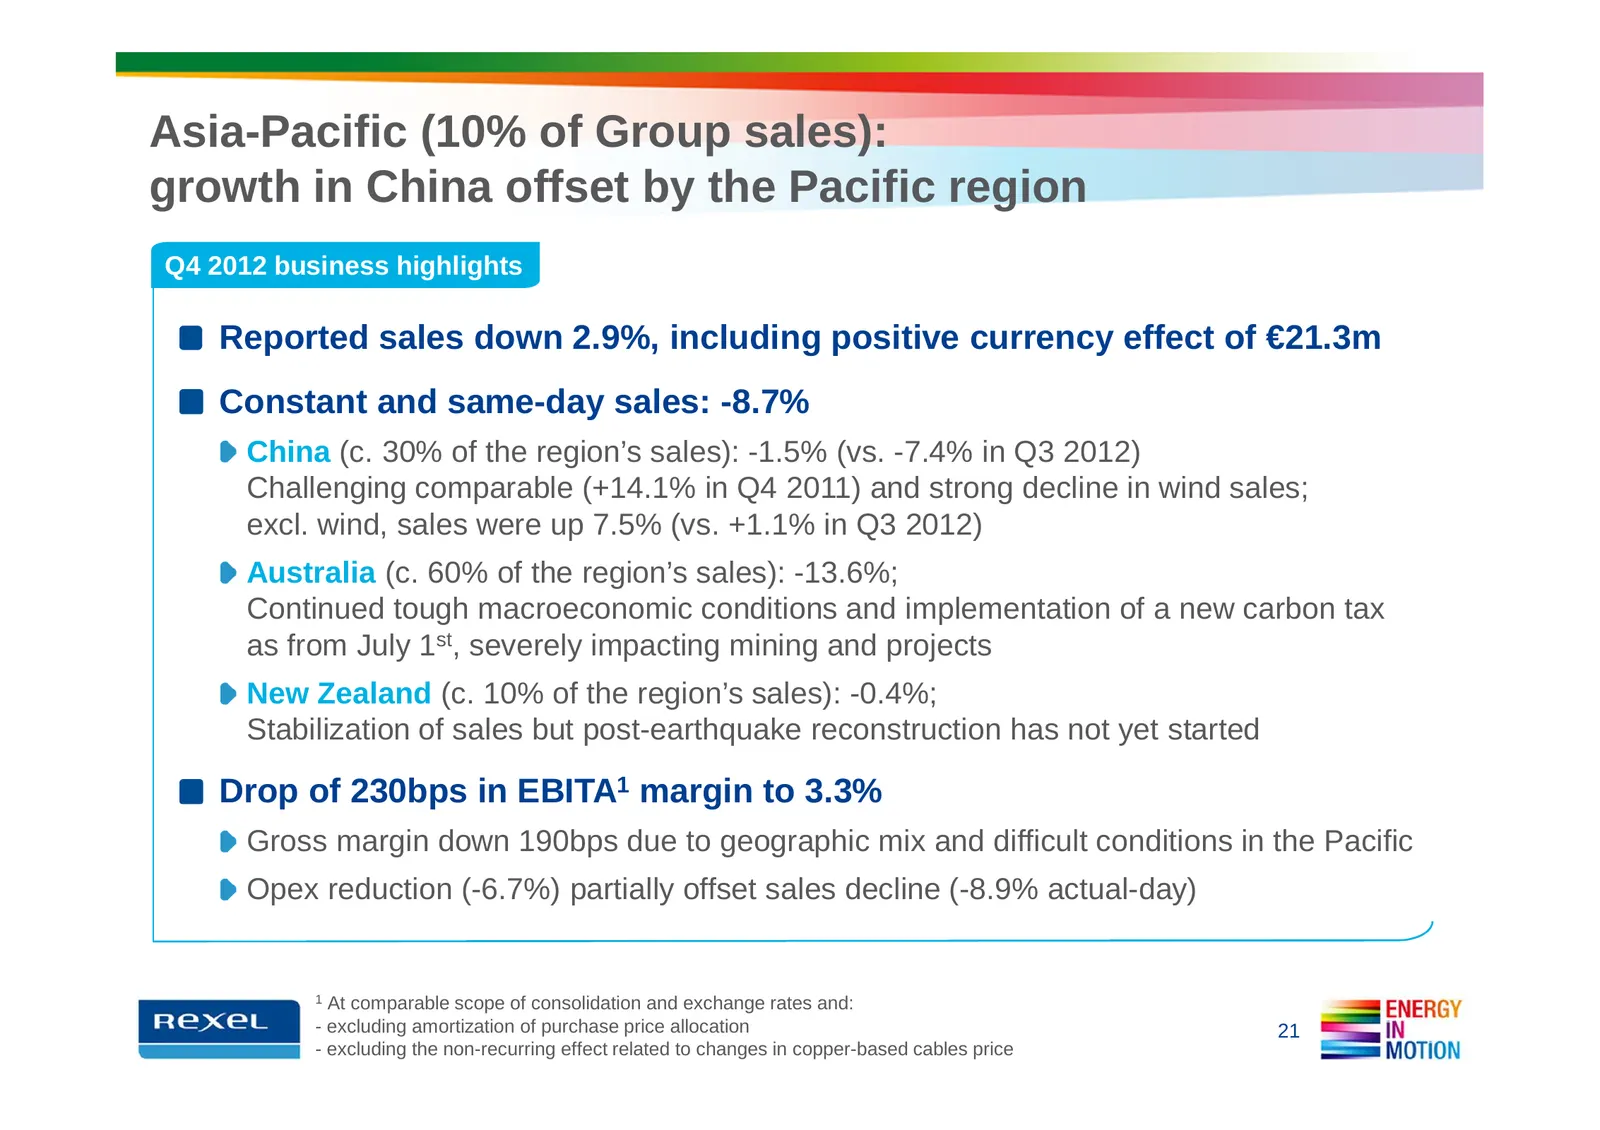
Asia-Pacific (10% of Group sales): growth in China offset by the Pacific region Q4 2012 business highlights Reported sales down 2.9%, including positive currency effect of €21.3m Constant and same-day sales: -8.7% China (c. 30% of the region’s sales): -1.5% (vs. -7.4% in Q3 2012) Challenging compara
Slide 22: Latin America: building a solid platform in the region
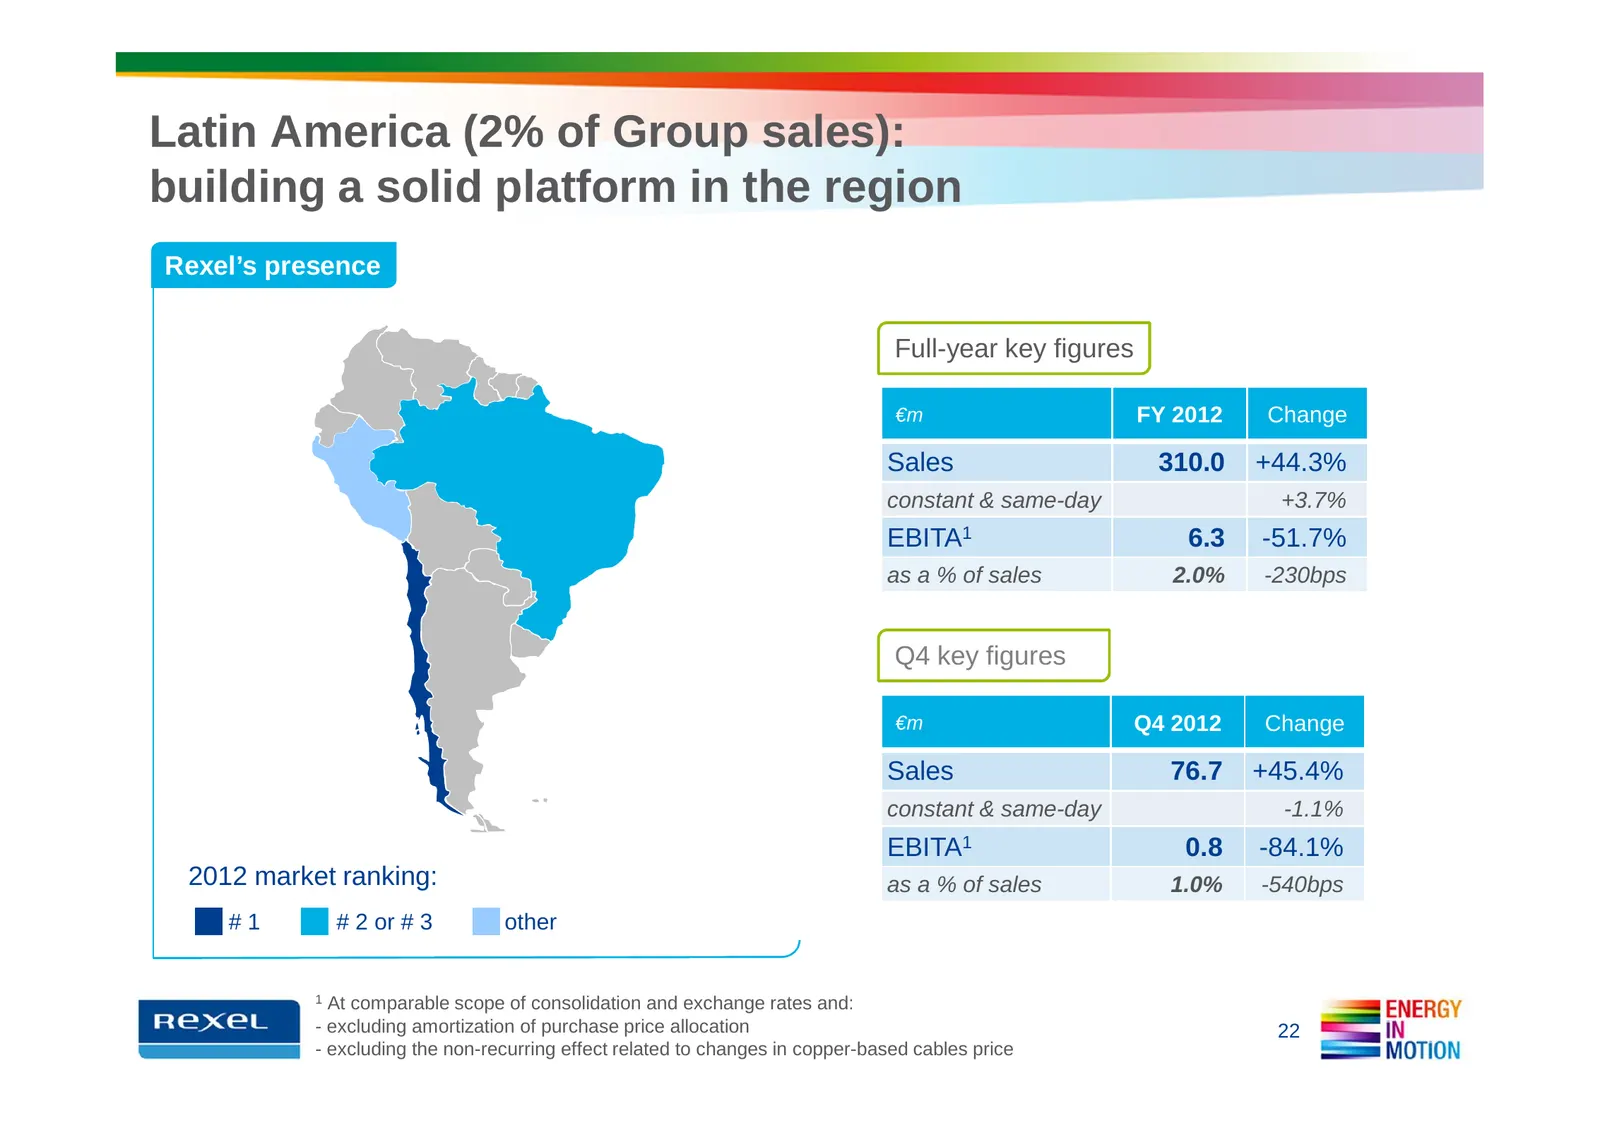
Latin America (2% of Group sales): building a solid platform in the region Rexel’s presence Full-year key figures €m FY 2012 Change Sales 310.0 +44.3% constant & same-day +3.7% EBITA1 6.3 -51.7% as a % of sales 2.0% -230bps Q4 key figures €m Q4 2012 Change Sales 76.7 +45.4% constant & same-day -1.1%
Slide 23: Latin America: Q4 2012 business highlights
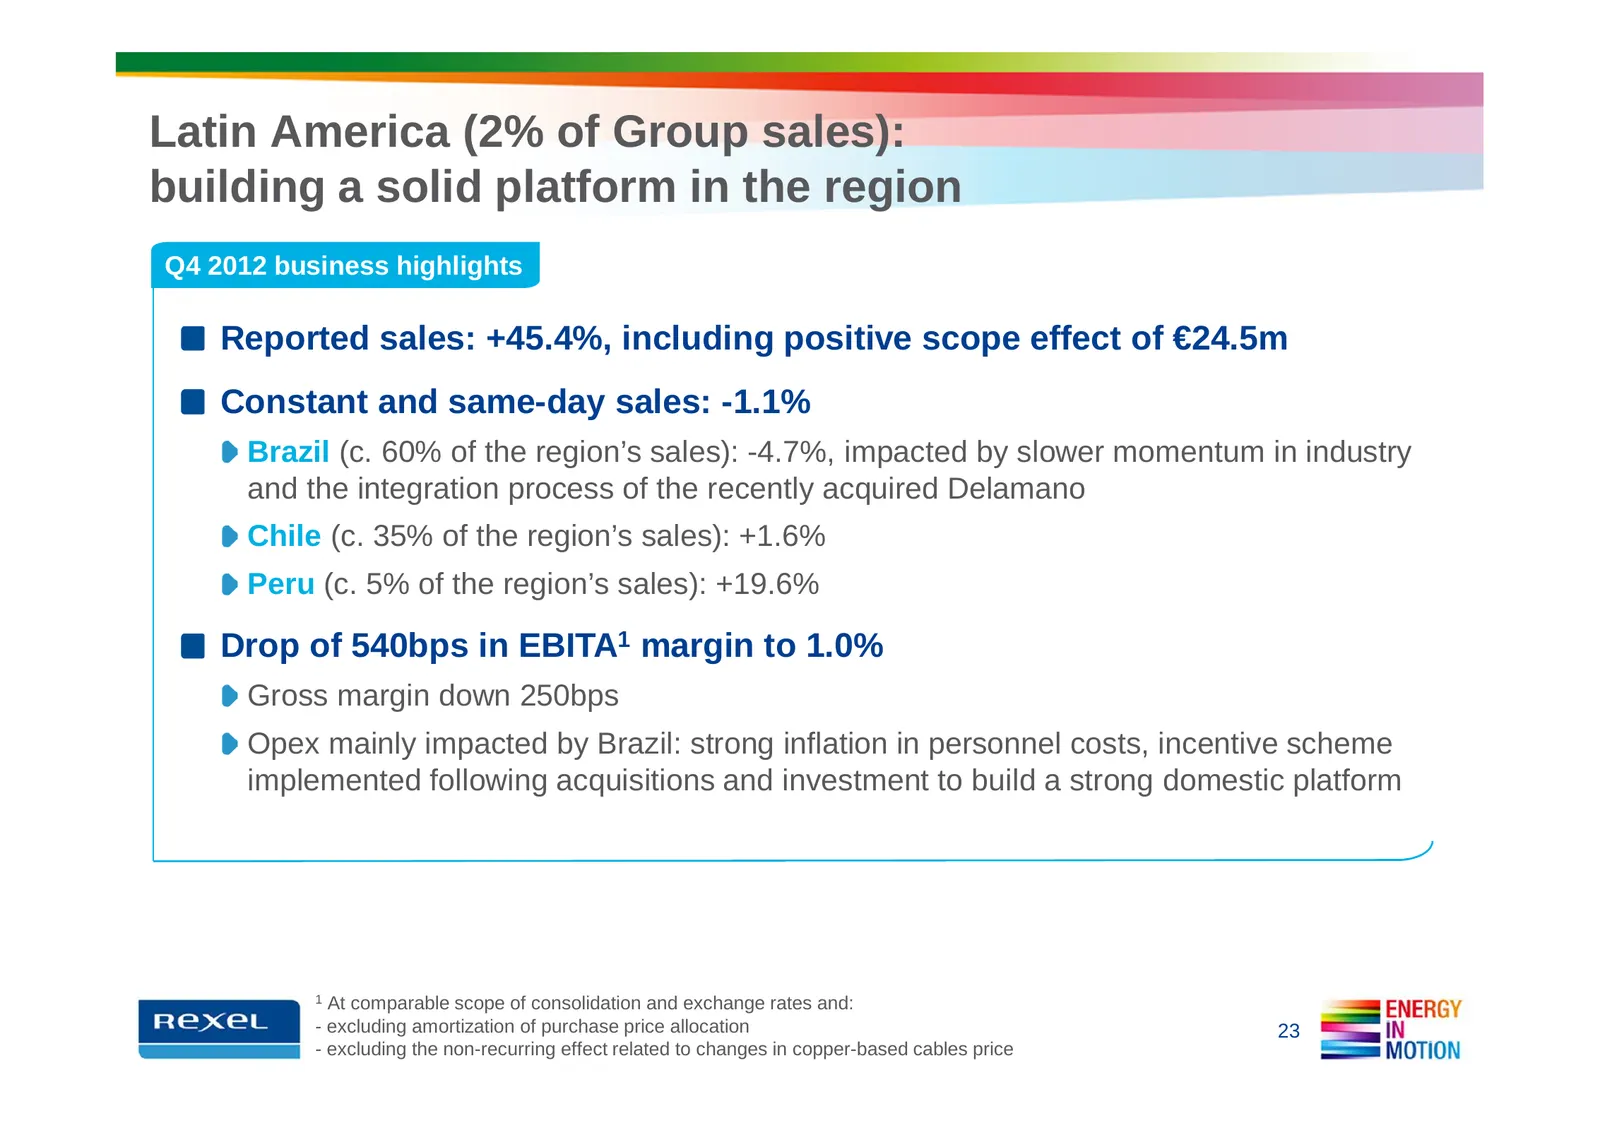
Latin America (2% of Group sales): building a solid platform in the region Q4 2012 business highlights Reported sales: +45.4%, including positive scope effect of €24.5m Constant and same-day sales: -1.1% Brazil (c. 60% of the region’s sales): -4.7%, impacted by slower momentum in industry and the in
Slide 24: Reported sales up 2.9% in Q4 and 5.8% in FY 2012
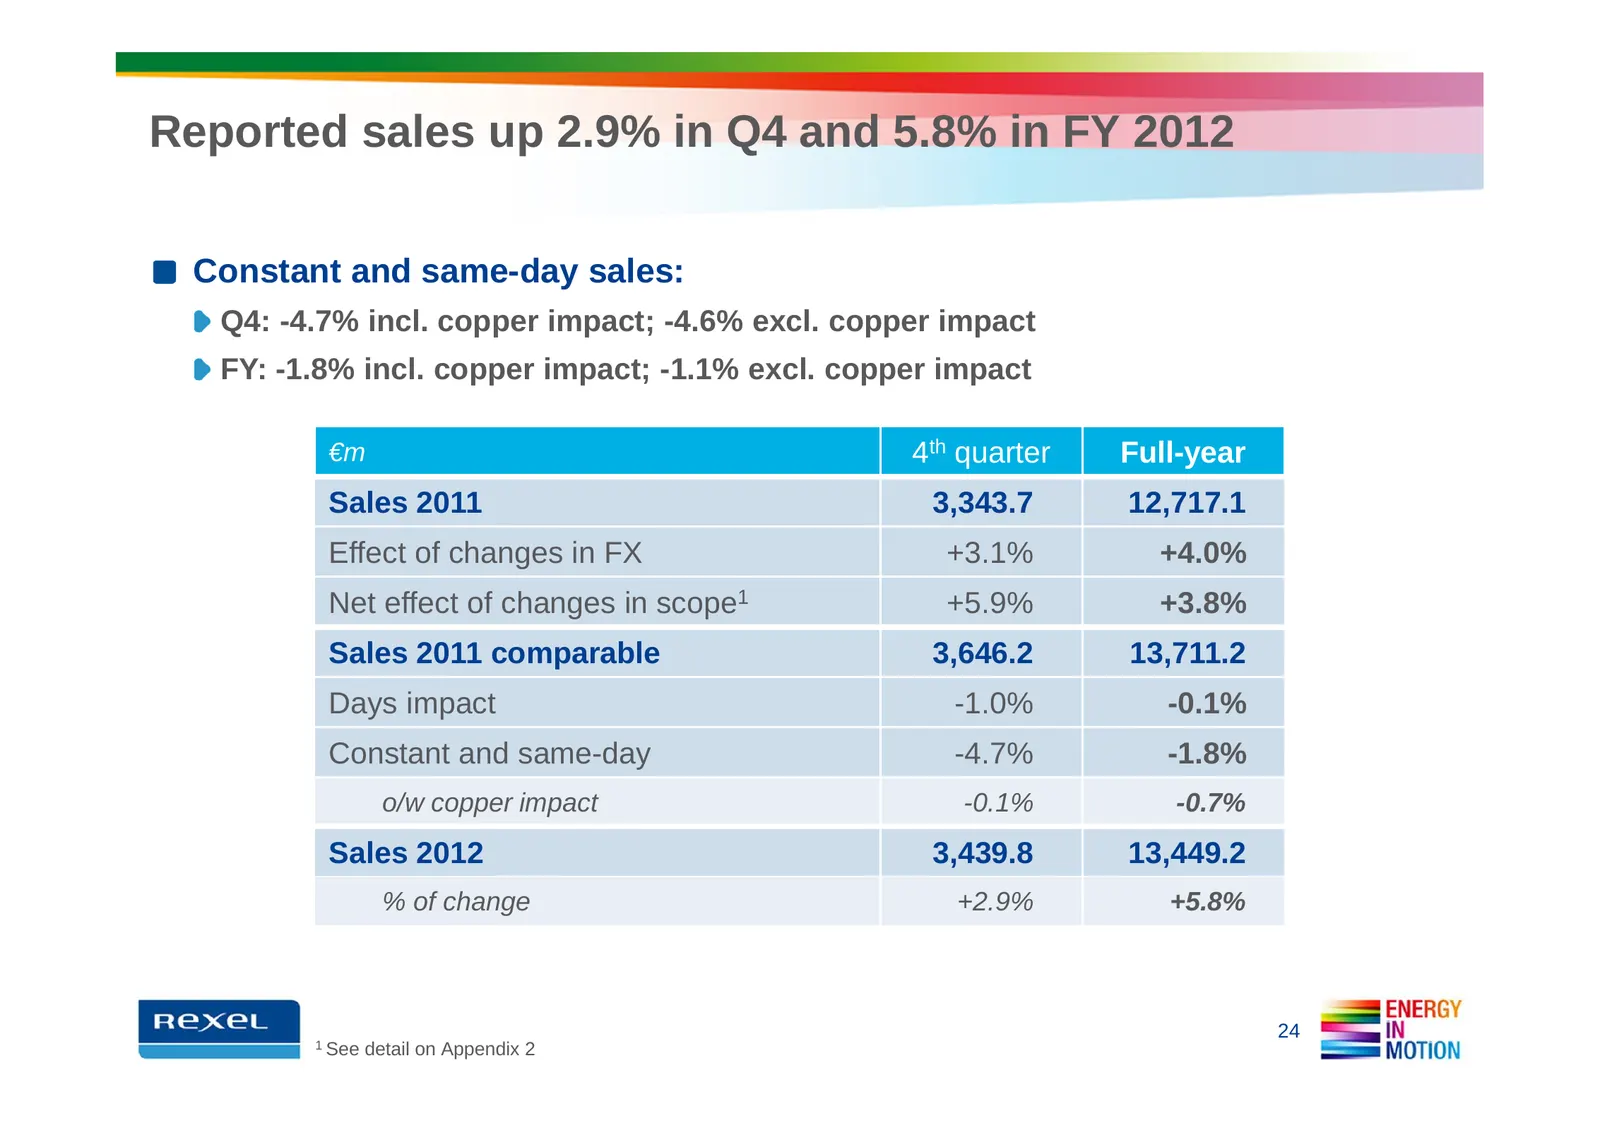
Reported sales up 2.9% in Q4 and 5.8% in FY 2012 Constant and same-day sales: Q4: -4.7% incl. copper impact; -4.6% excl. copper impact FY: -1.8% incl. copper impact; -1.1% excl. copper impact €m 4th quarter Full-year Sales 2011 3,343.7 12,717.1 Effect of changes in FX +3.1% +4.0% Net effect of chang
Slide 25: Continued improvement in gross margin
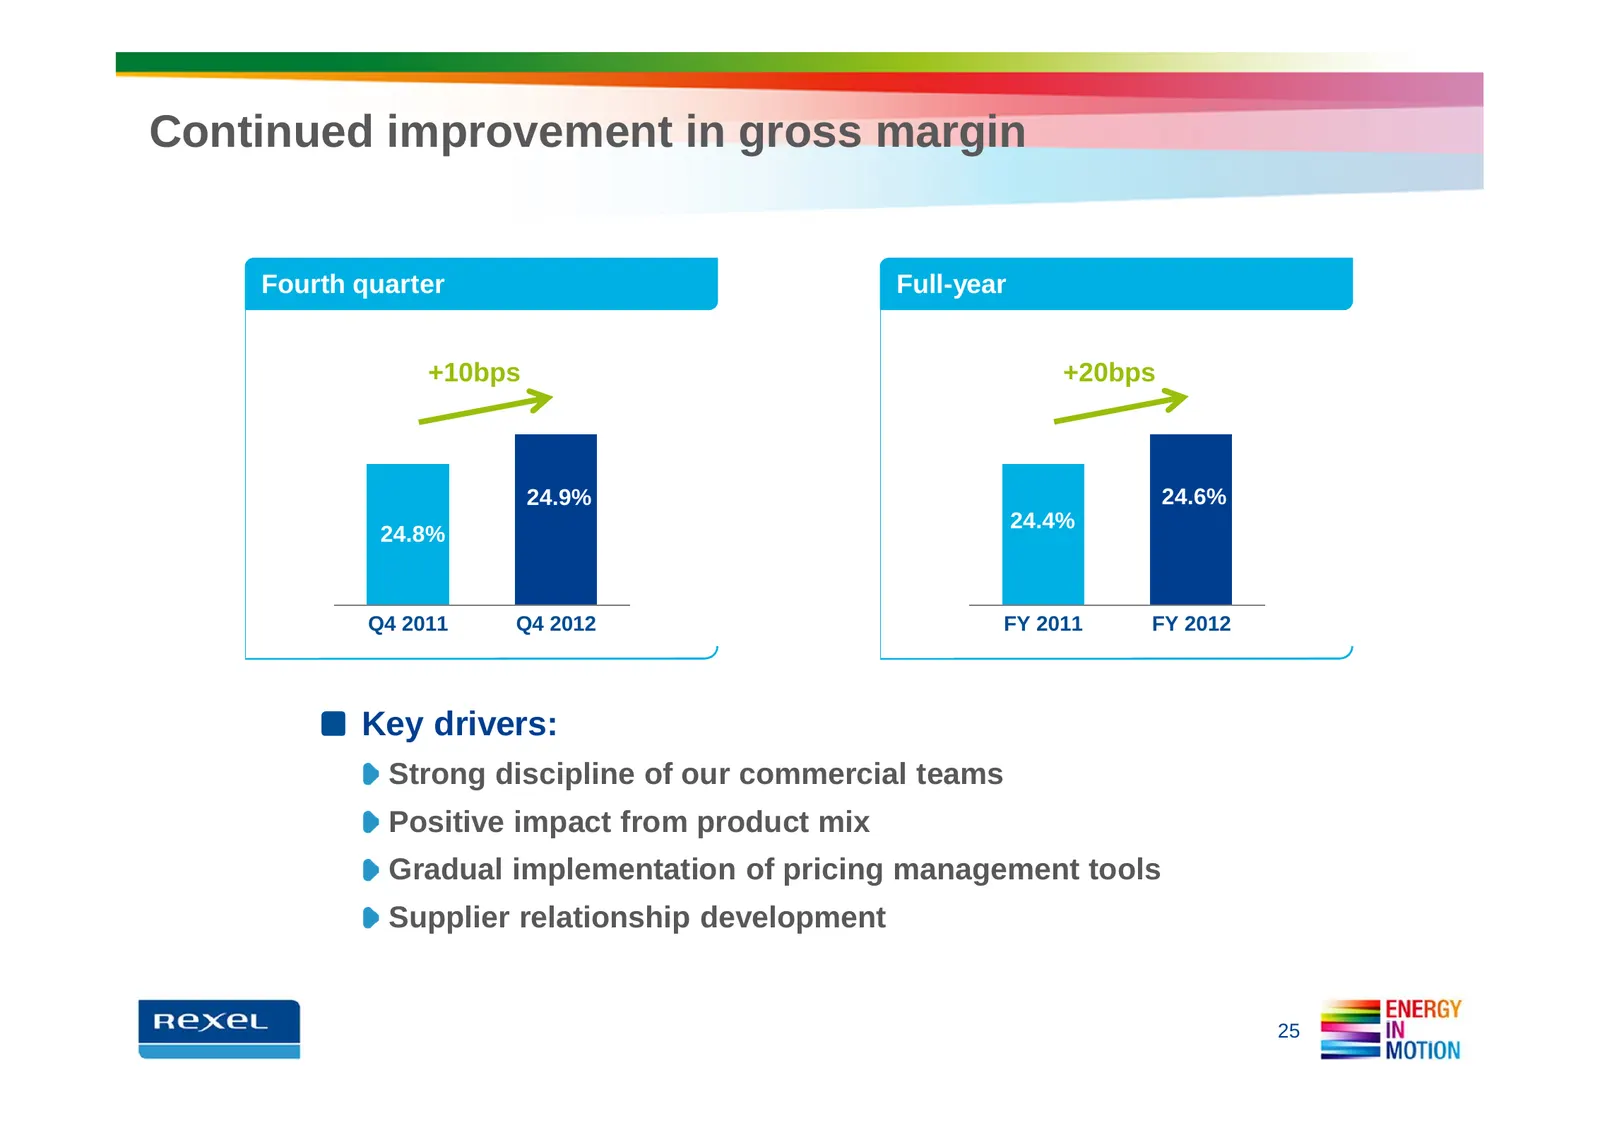
Continued improvement in gross margin Fourth quarter Full-year +10bps +20bps 24.9% 24.6% 24.4% 24.8% Q4 2011 Q4 2012 FY 2011 FY 2012 Key drivers: Strong discipline of our commercial teams Positive impact from product mix Gradual implementation of pricing management tools Supplier relationship develo
Slide 26: EBITA margin stable in Q4 and up 10bps in the full-year
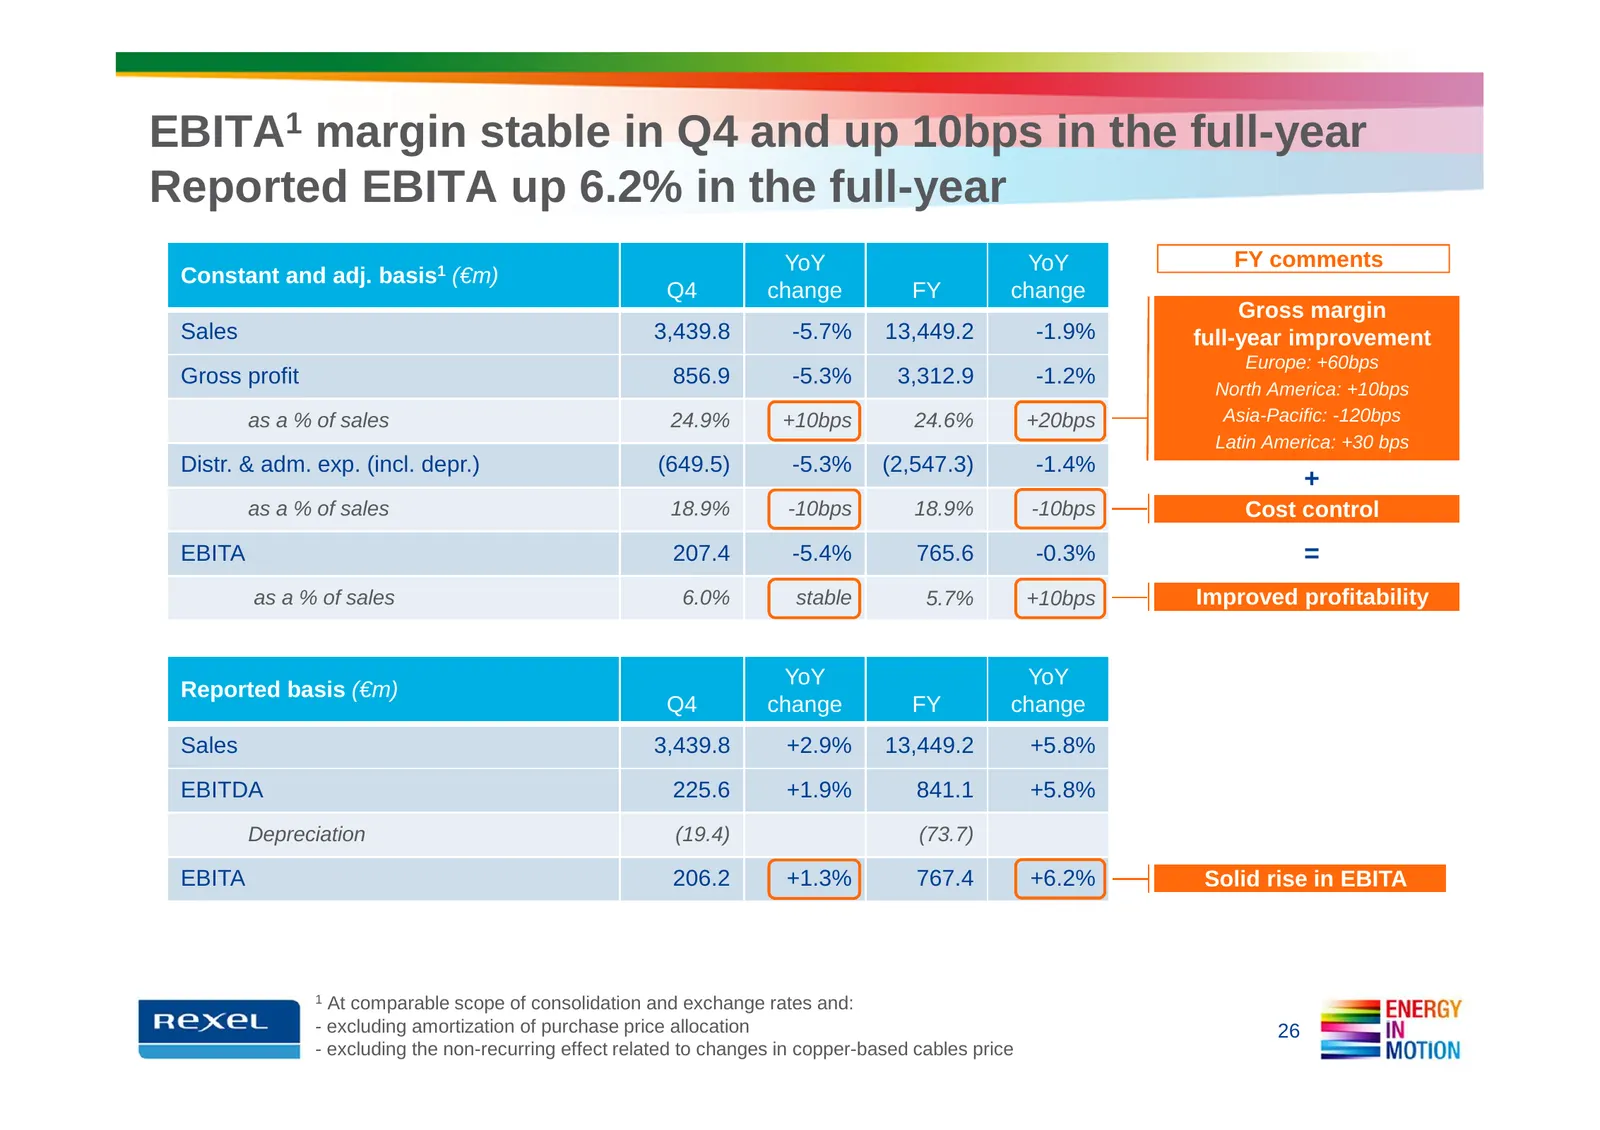
EBITA1 margin stable in Q4 and up 10bps in the full-year Reported EBITA up 6.2% in the full-year YoY YoY FY comments Constant and adj. basis1 (€m) Q4 change FY change Gross margin Sales 3,439.8 -5.7% 13,449.2 -1.9% full-year improvement Europe: +60bps Gross profit 856.9 -5.3% 3,312.9 -1.2% North Ame
Slide 27: Slight increase in net income despite higher tax rate
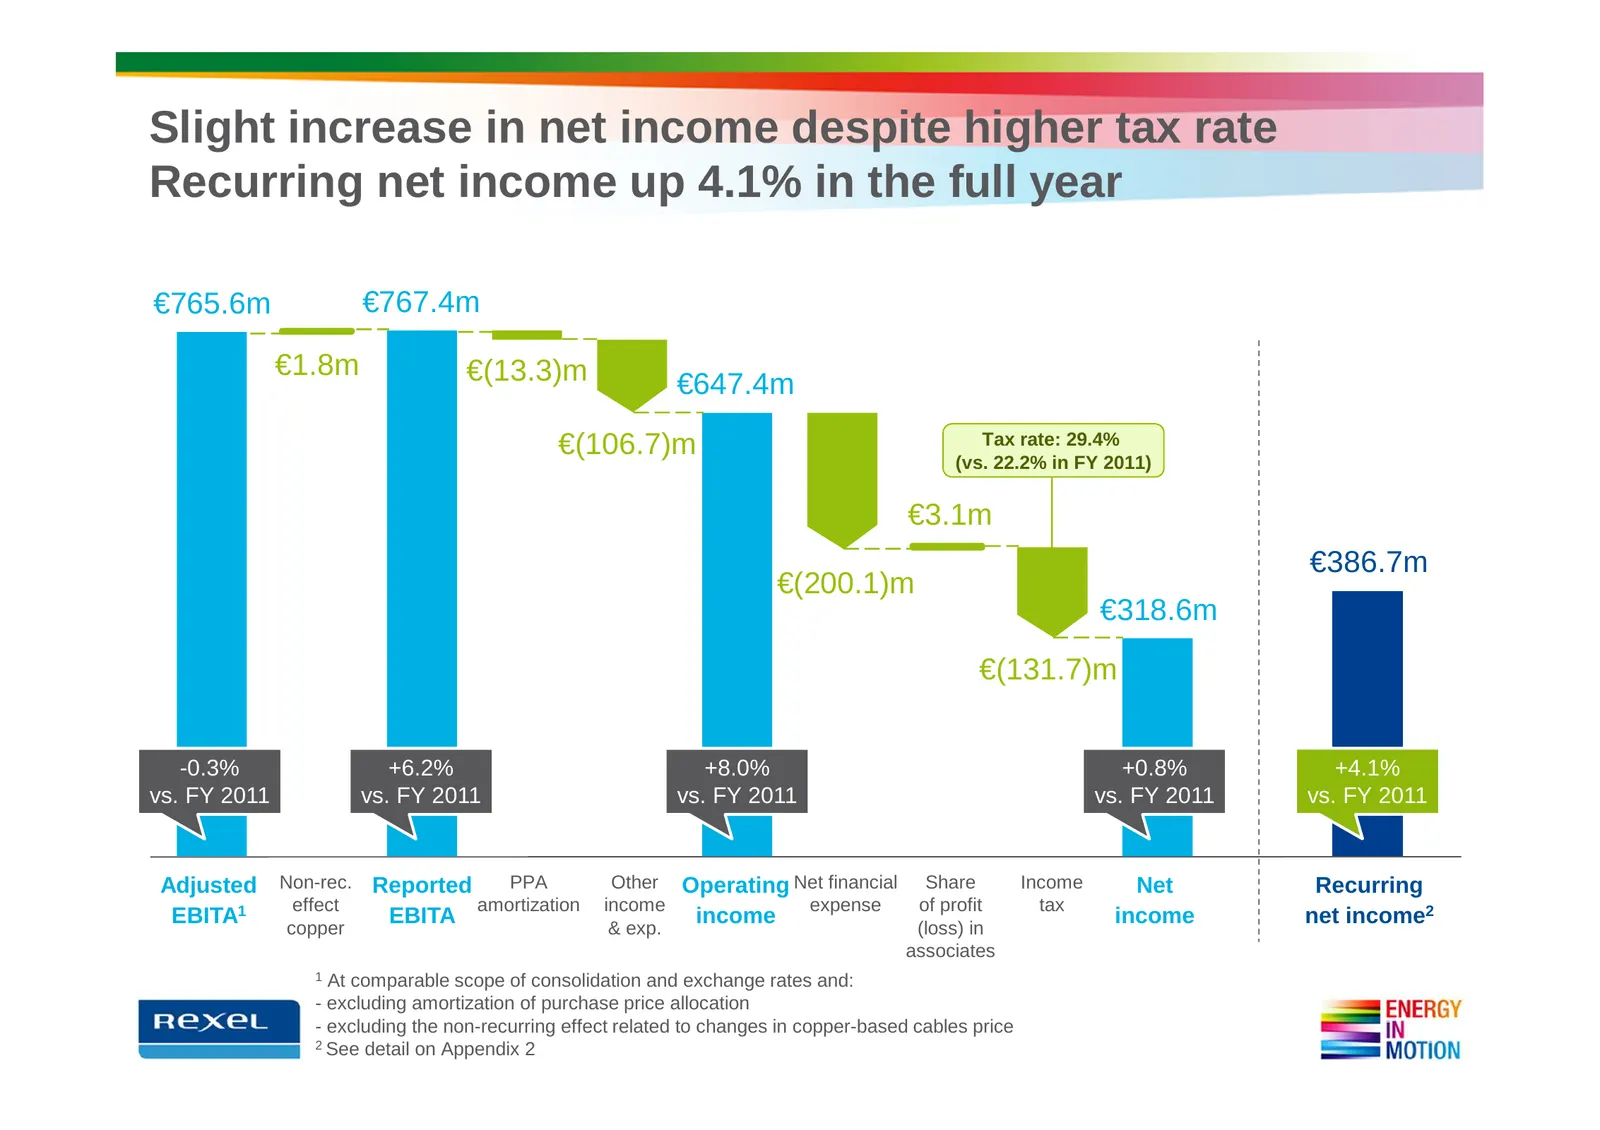
Slight increase in net income despite higher tax rate Recurring net income up 4.1% in the full year €765.6m €767.4m €1.8m €(13.3)m €647.4m €(106.7)m Tax rate: 29.4% (vs. 22.2% in FY 2011) €3.1m €386.7m €(200.1)m €318.6m €(131.7)m -0.3% +6.2% +8.0% +0.8% +4.1% vs. FY 2011 vs. FY 2011 vs. FY 2011 vs.
Slide 28: Robust FCF before interest and tax up 4.4% in full year
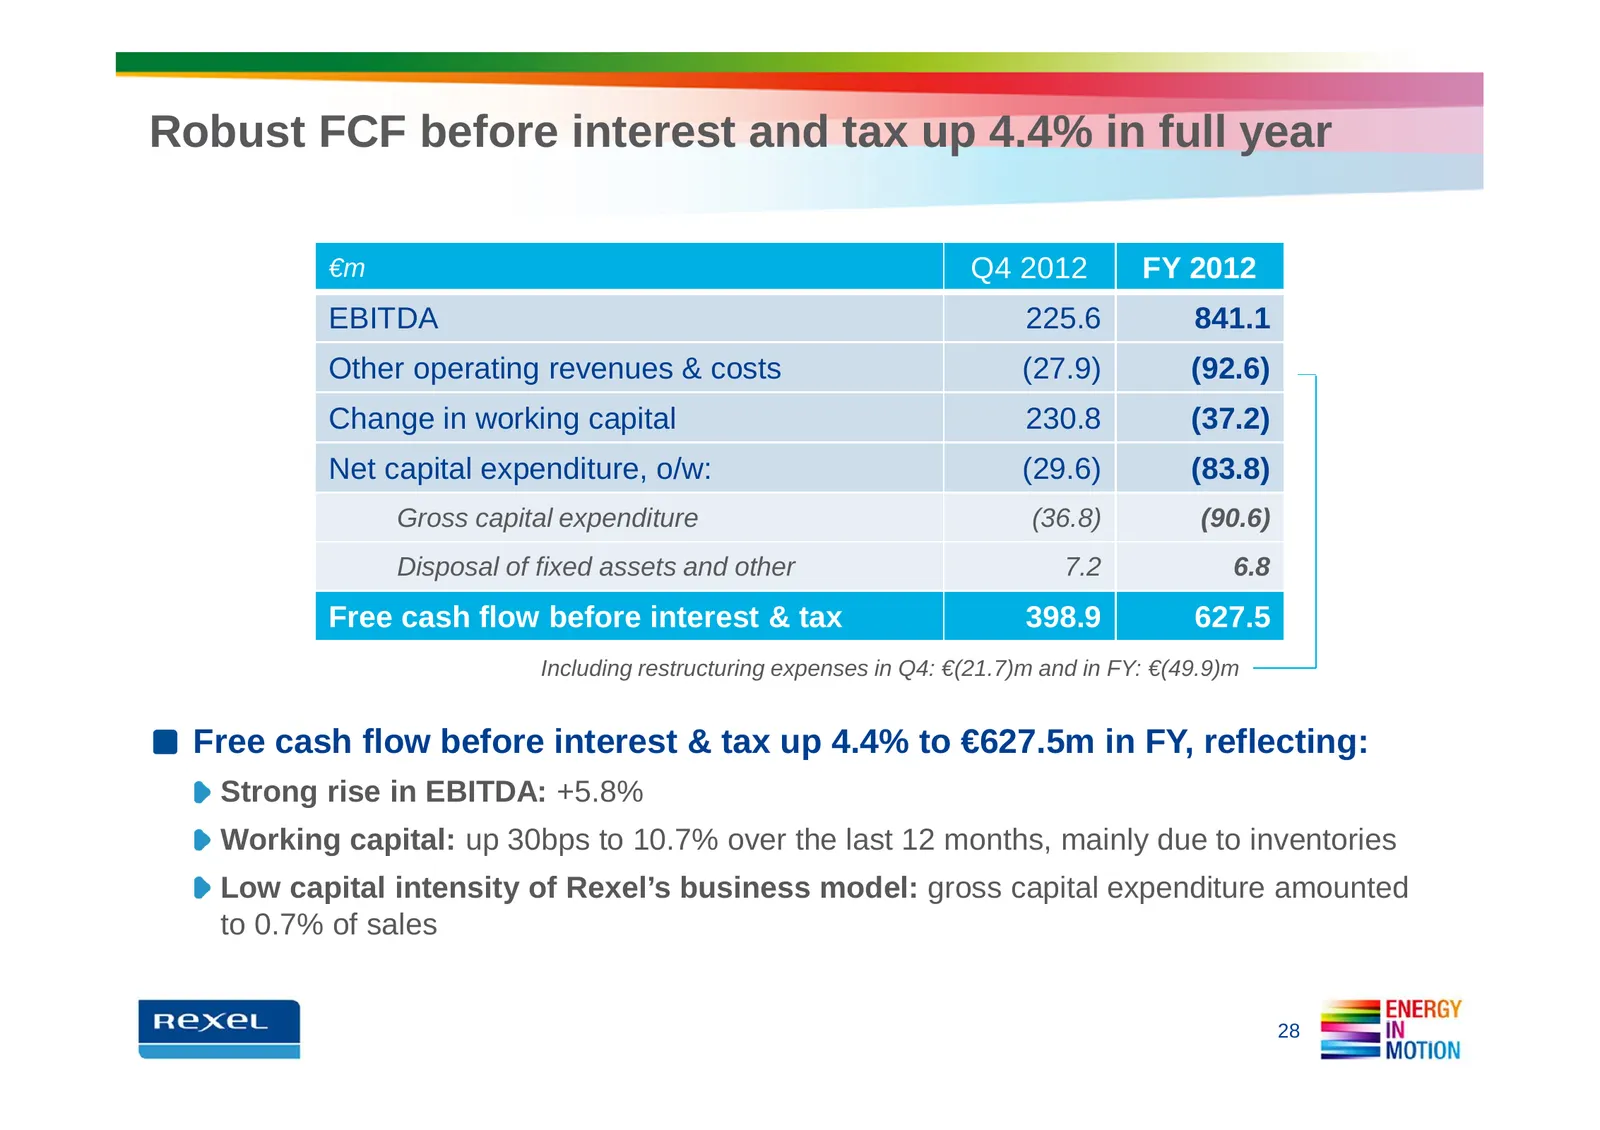
Robust FCF before interest and tax up 4.4% in full year €m Q4 2012 FY 2012 EBITDA 225.6 841.1 Other operating revenues & costs (27.9) (92.6) Change in working capital 230.8 (37.2) Net capital expenditure, o/w: (29.6) (83.8) Gross capital expenditure (36.8) (90.6) Disposal of fixed assets and other 7
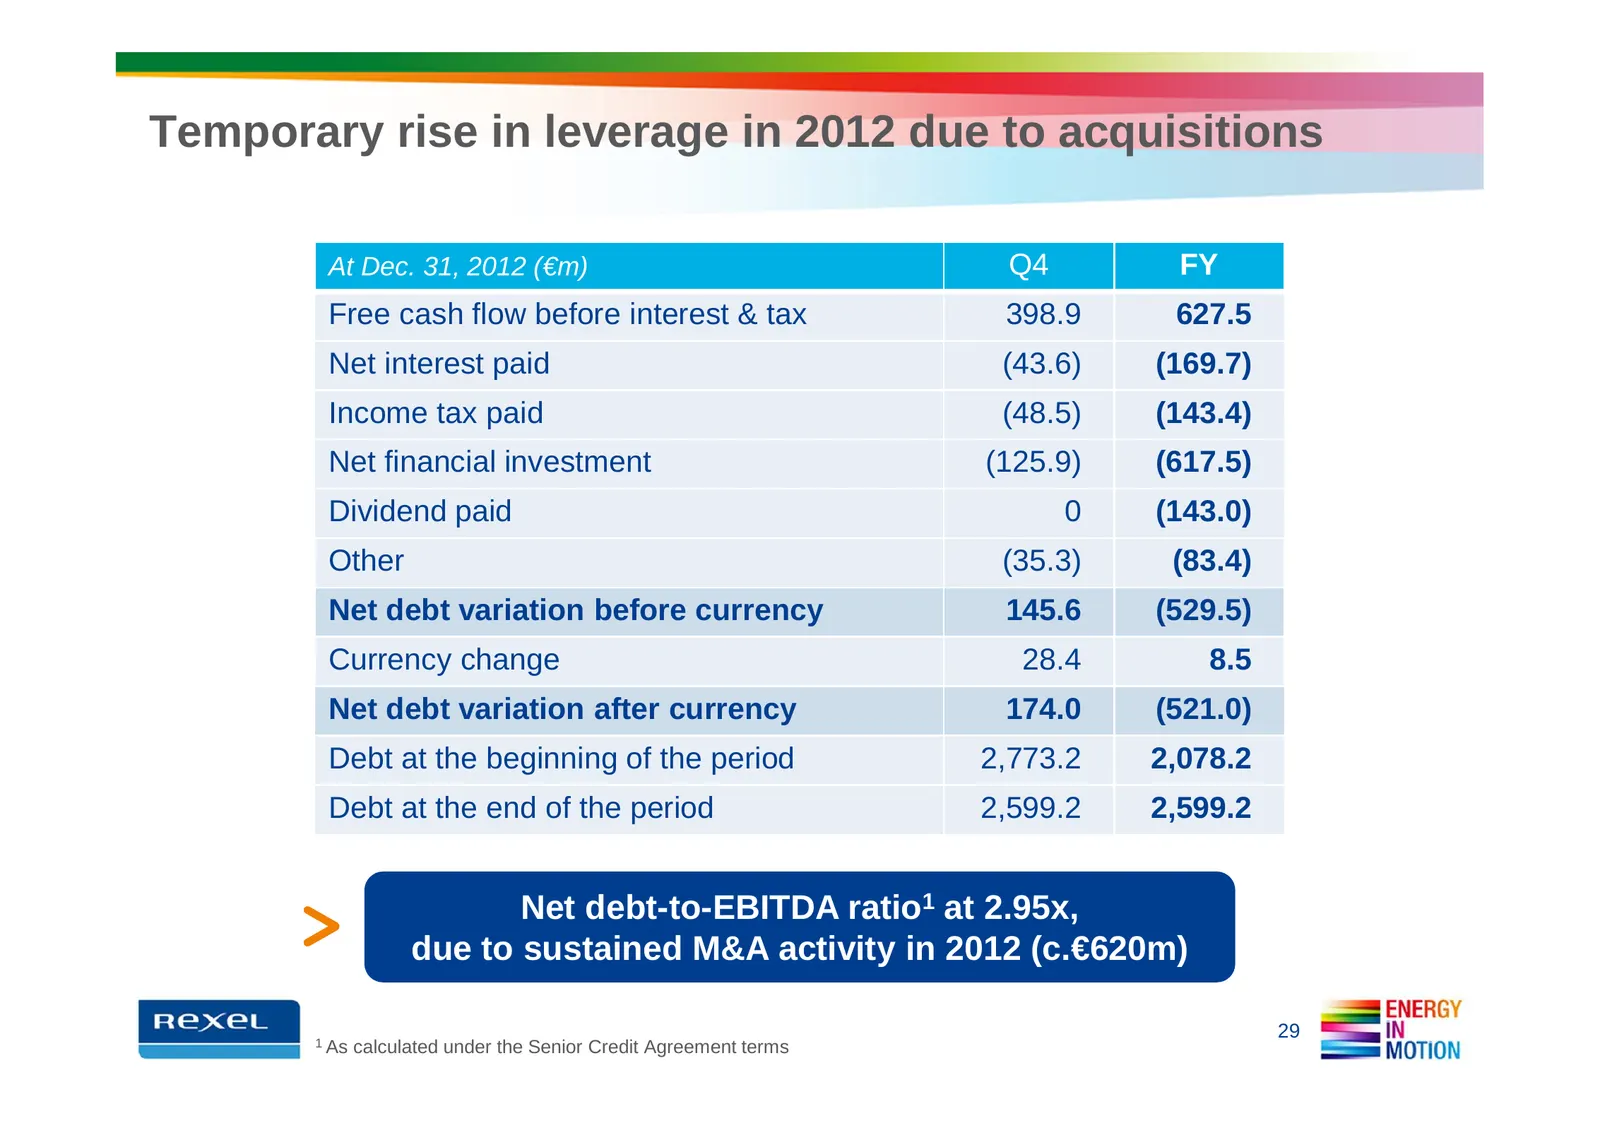
Slide 29: Temporary rise in leverage in 2012 due to acquisitions
Temporary rise in leverage in 2012 due to acquisitions At Dec. 31, 2012 (€m) Q4 FY Free cash flow before interest & tax 398.9 627.5 Net interest paid (43.6) (169.7) Income tax paid (48.5) (143.4) Net financial investment (125.9) (617.5) Dividend paid 0 (143.0) Other (35.3) (83.4) Net debt variation
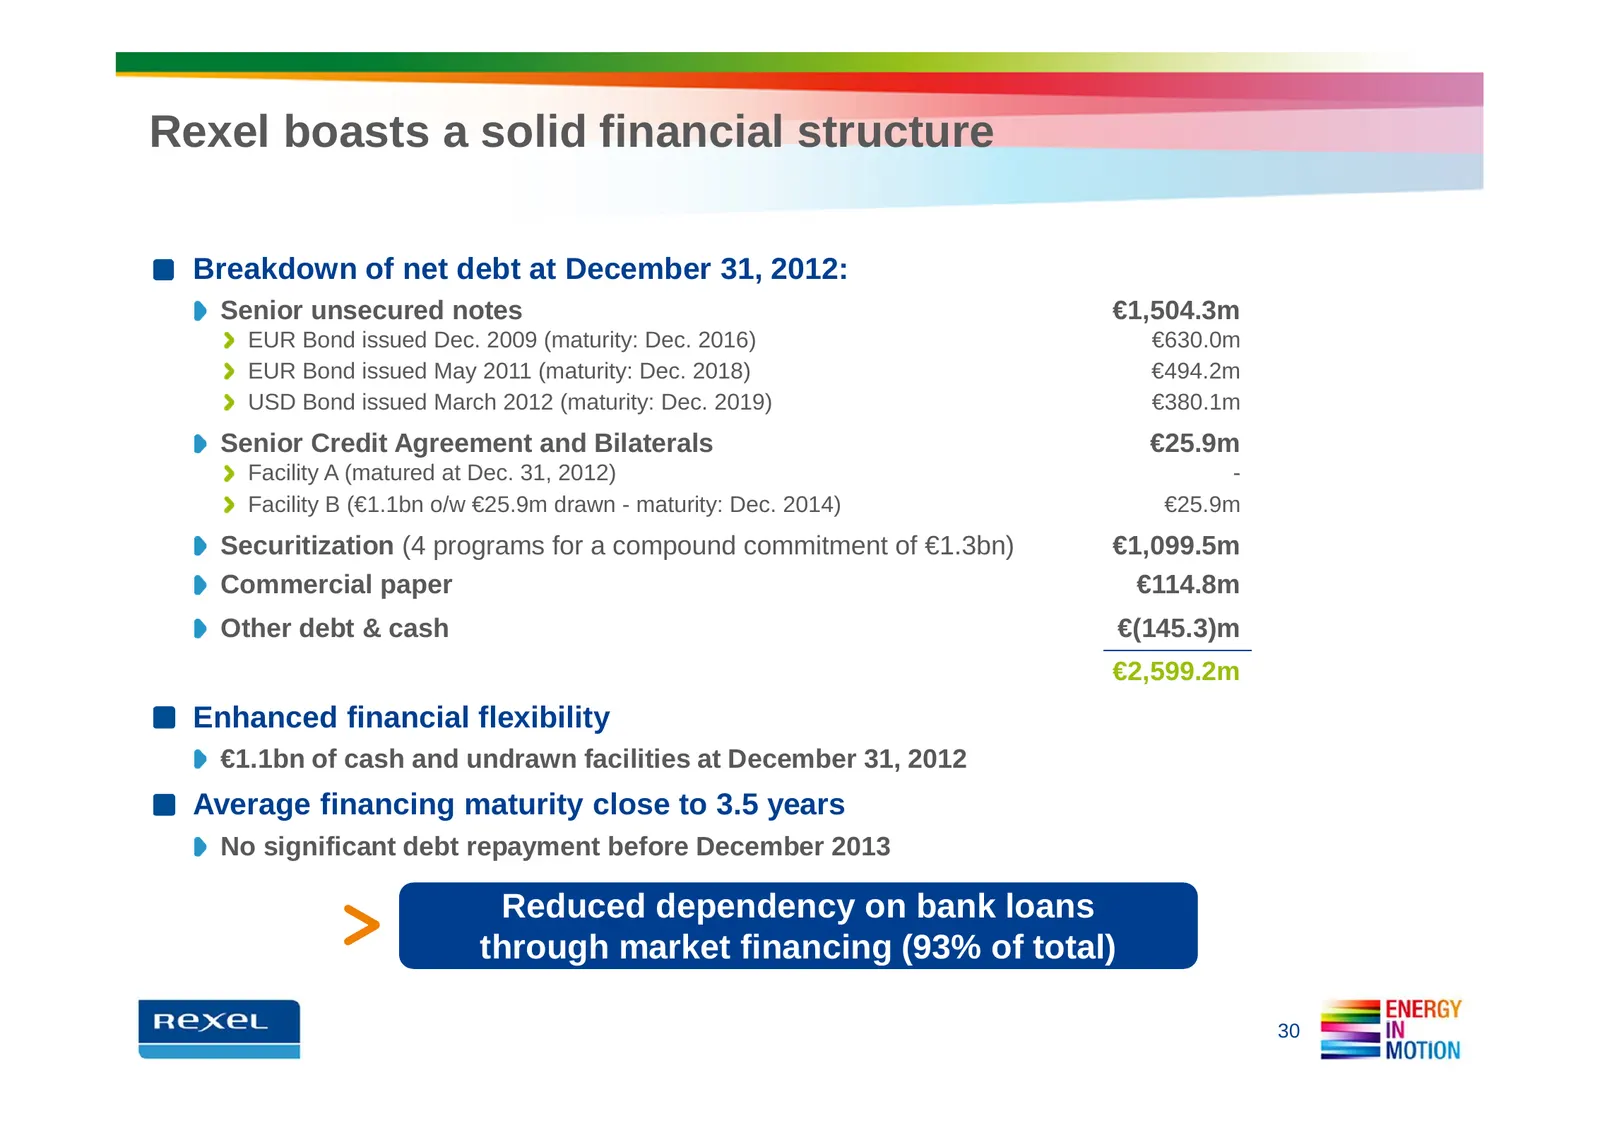
Slide 30: Rexel boasts a solid financial structure
Rexel boasts a solid financial structure Breakdown of net debt at December 31, 2012: Senior unsecured notes €1,504.3m EUR Bond issued Dec. 2009 (maturity: Dec. 2016) €630.0m EUR Bond issued May 2011 (maturity: Dec. 2018) €494.2m USD Bond issued March 2012 (maturity: Dec. 2019) €380.1m Senior Credit
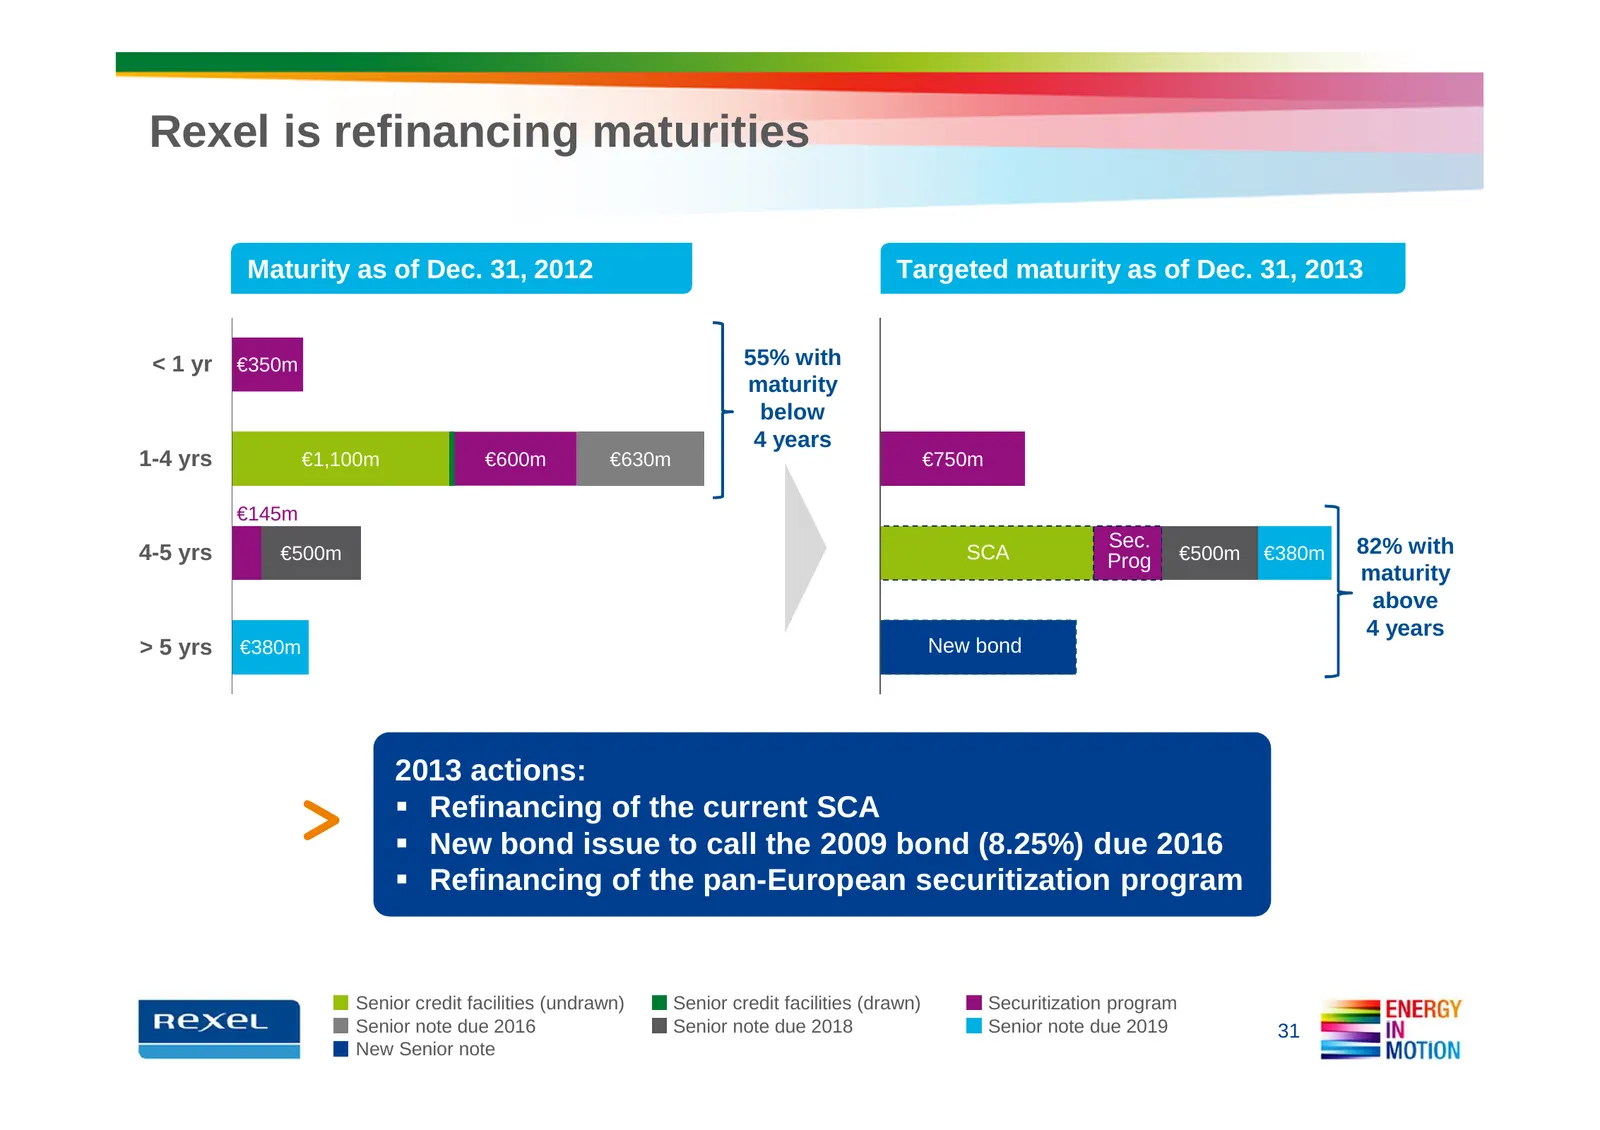
Slide 31: Rexel is refinancing maturities
Rexel is refinancing maturities Maturity as of Dec. 31, 2012 Targeted maturity as of Dec. 31, 2013 < 1 yr €350m 55% with maturity below 4 years 1-4 yrs €1,100m €600m €630m €750m €145m Sec. 82% with 4-5 yrs €500m SCA Prog €500m €380m maturity above 4 years > 5 yrs €380m New bond 2013 actions: Refinan
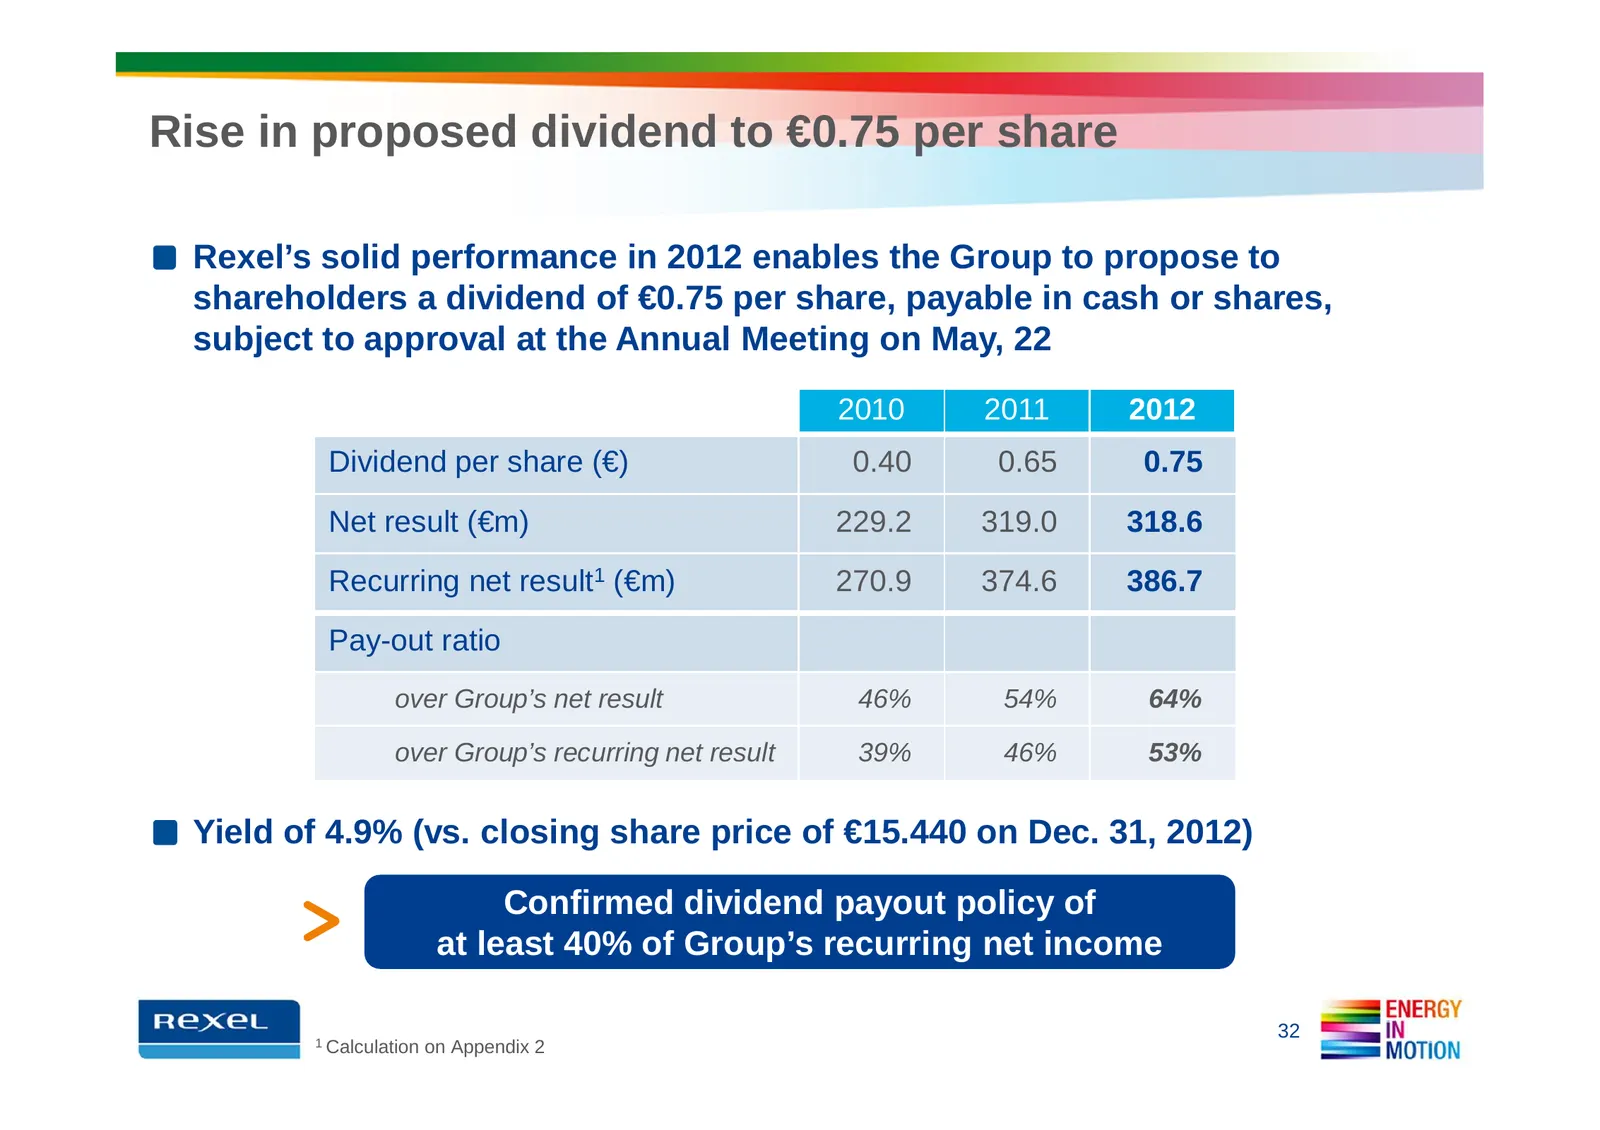
Slide 32: Rise in proposed dividend to €0.75 per share
Rise in proposed dividend to €0.75 per share Rexel’s solid performance in 2012 enables the Group to propose to shareholders a dividend of €0.75 per share, payable in cash or shares, subject to approval at the Annual Meeting on May, 22 2010 2011 2012 Dividend per share (€) 0.40 0.65 0.75 Net result (

Slide 33: Strategic Update
3 » STRATEGIC UPDATE = ENERGY MOTION
Slide 34: Energy in Motion: Accelerating in Key Markets
ENERGY IN MOTION: ACCELERATING IN KEY MARKETS
Slide 35: UK: Strong margin improvement despite organic sales drop
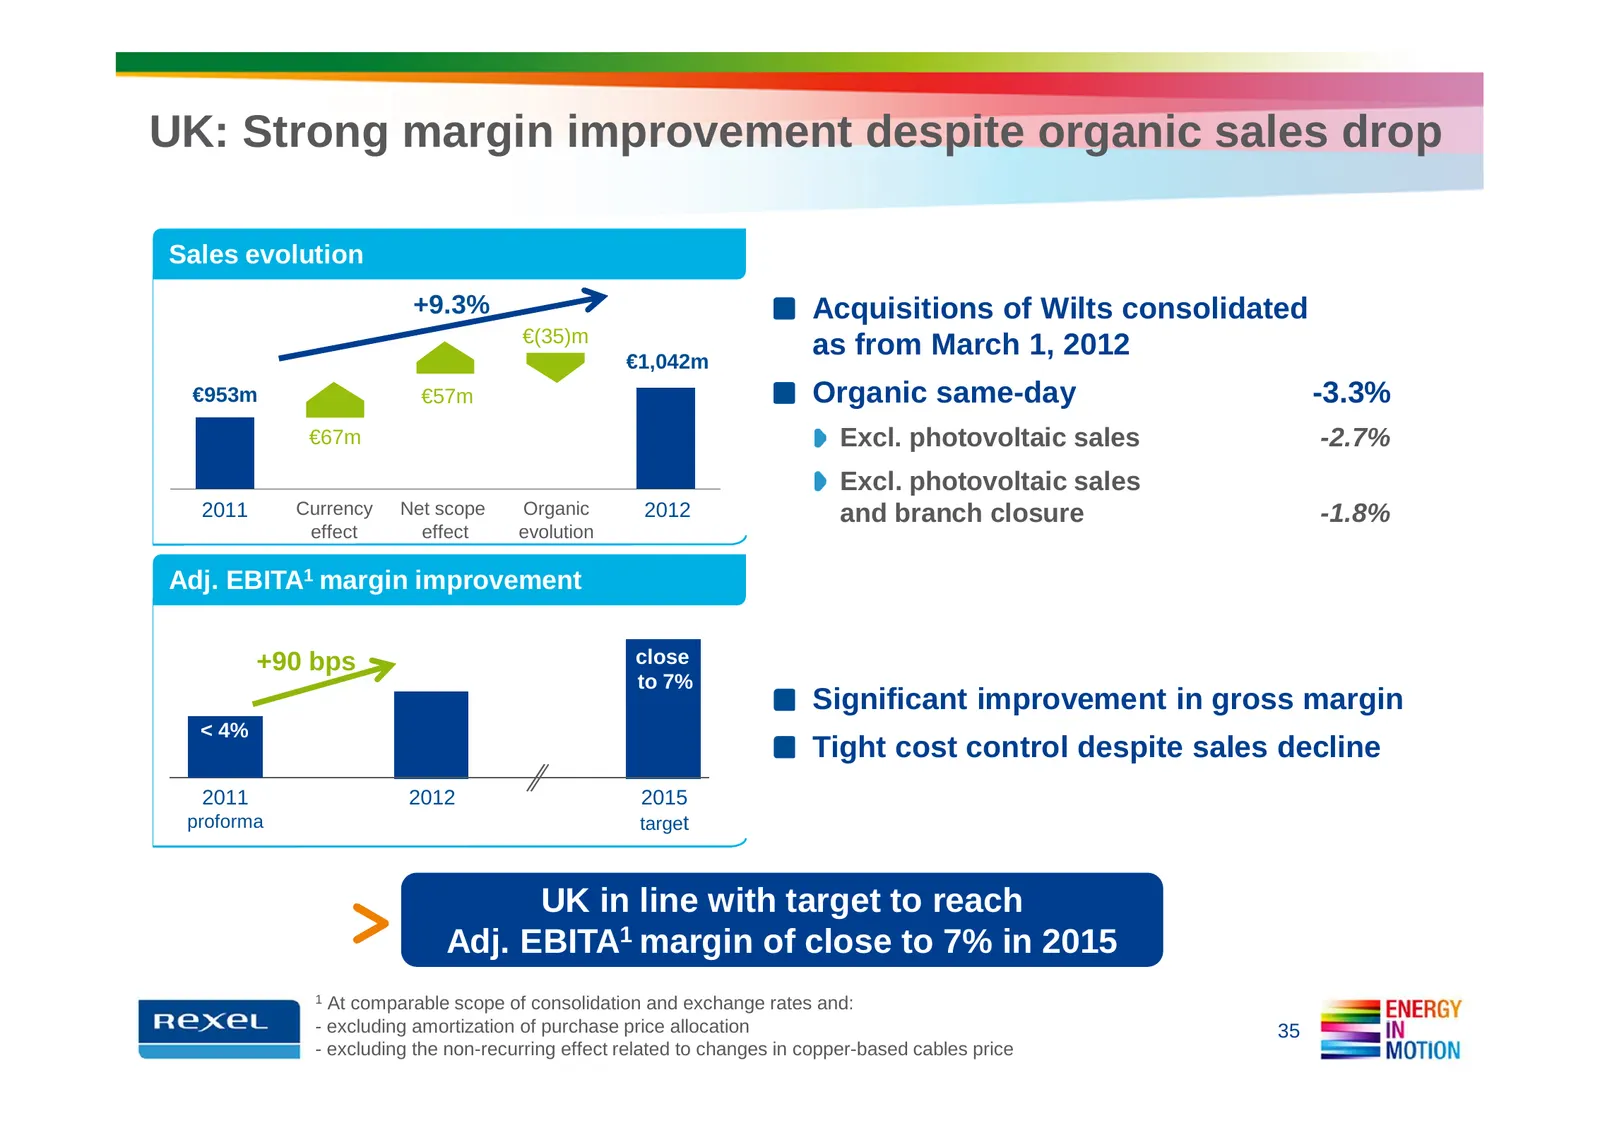
UK: Strong margin improvement despite organic sales drop Sales evolution +9.3% Acquisitions of Wilts consolidated €(35)m €1,042m as from March 1, 2012 €953m €57m Organic same-day -3.3% €67m Excl. photovoltaic sales -2.7% Excl. photovoltaic sales 2011 Currency Net scope Organic 2012 and branch closur
Slide 36: USA: Continued turnaround, further boosted by M&A
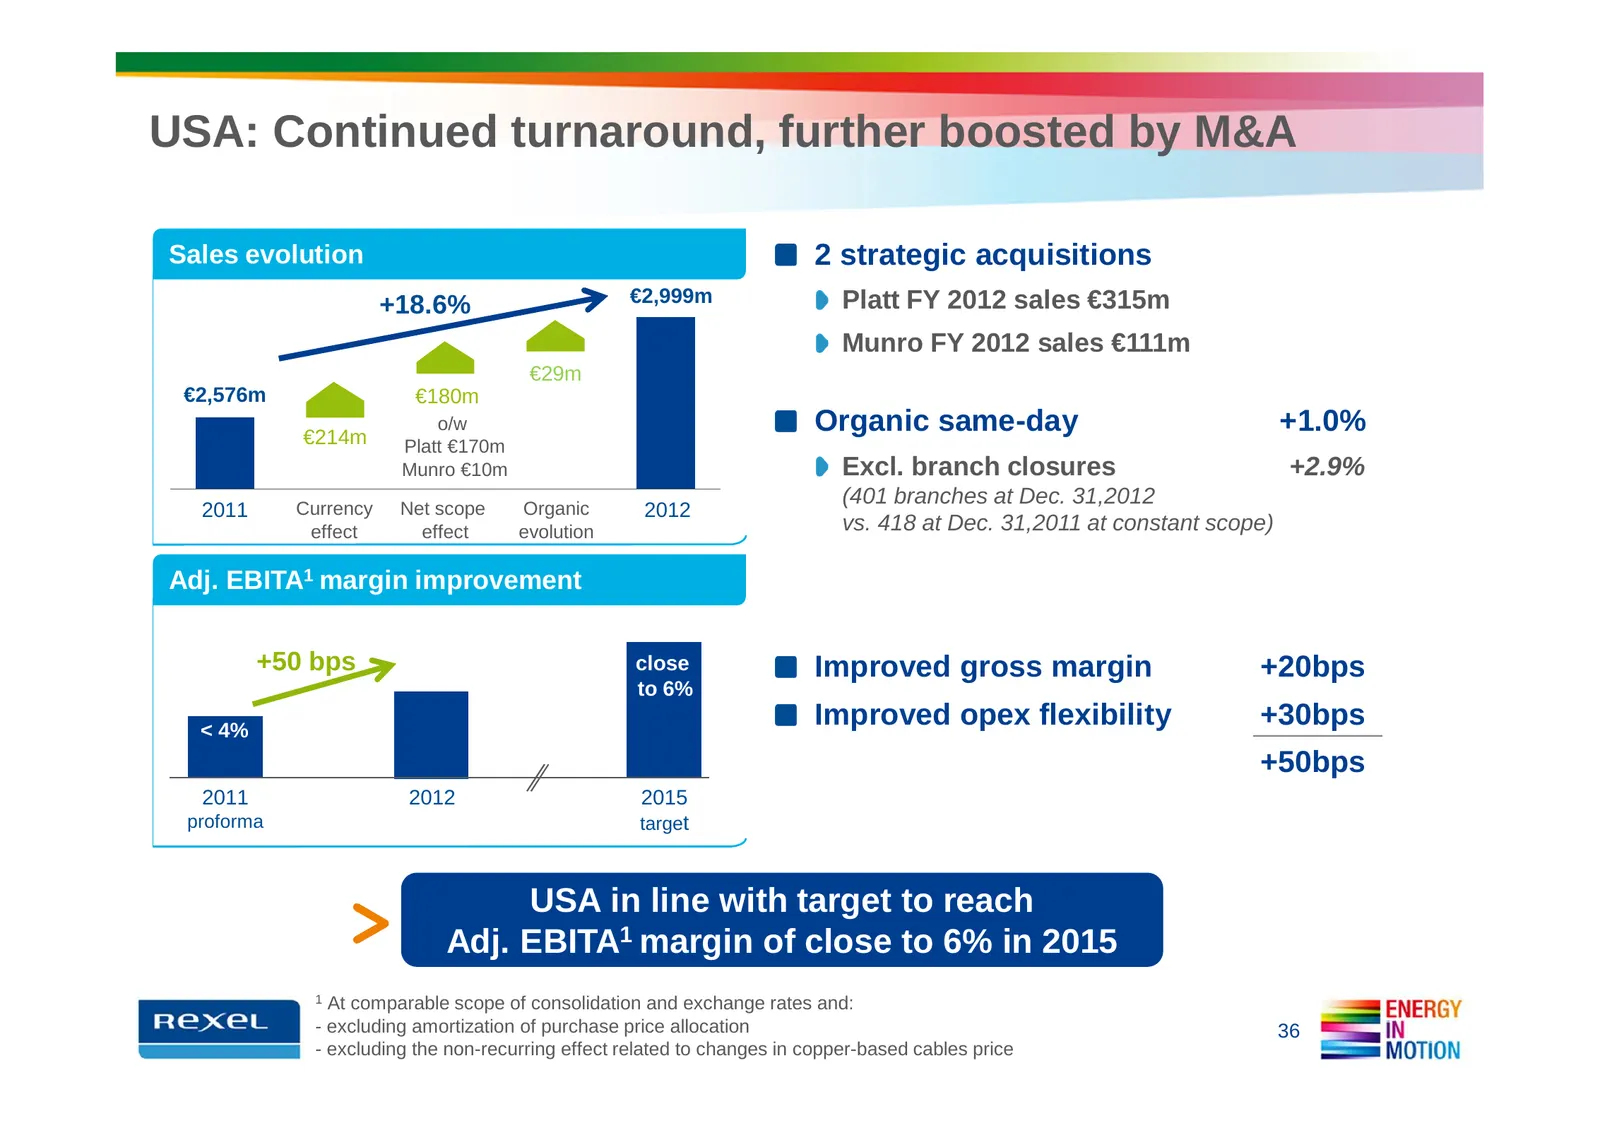
USA: Continued turnaround, further boosted by M&A Sales evolution 2 strategic acquisitions +18.6% €2,999m Platt FY 2012 sales €315m Munro FY 2012 sales €111m €29m €2,576m €180m €214m o/w Organic same-day +1.0% Platt €170m Munro €10m Excl. branch closures +2.9% (401 branches at Dec. 31,2012 2011 Curr
Slide 37: Energy in Motion: Focusing on Growth Priorities
ENERGY IN MOTION: FOCUSING ON GROWTH PRIORITIES
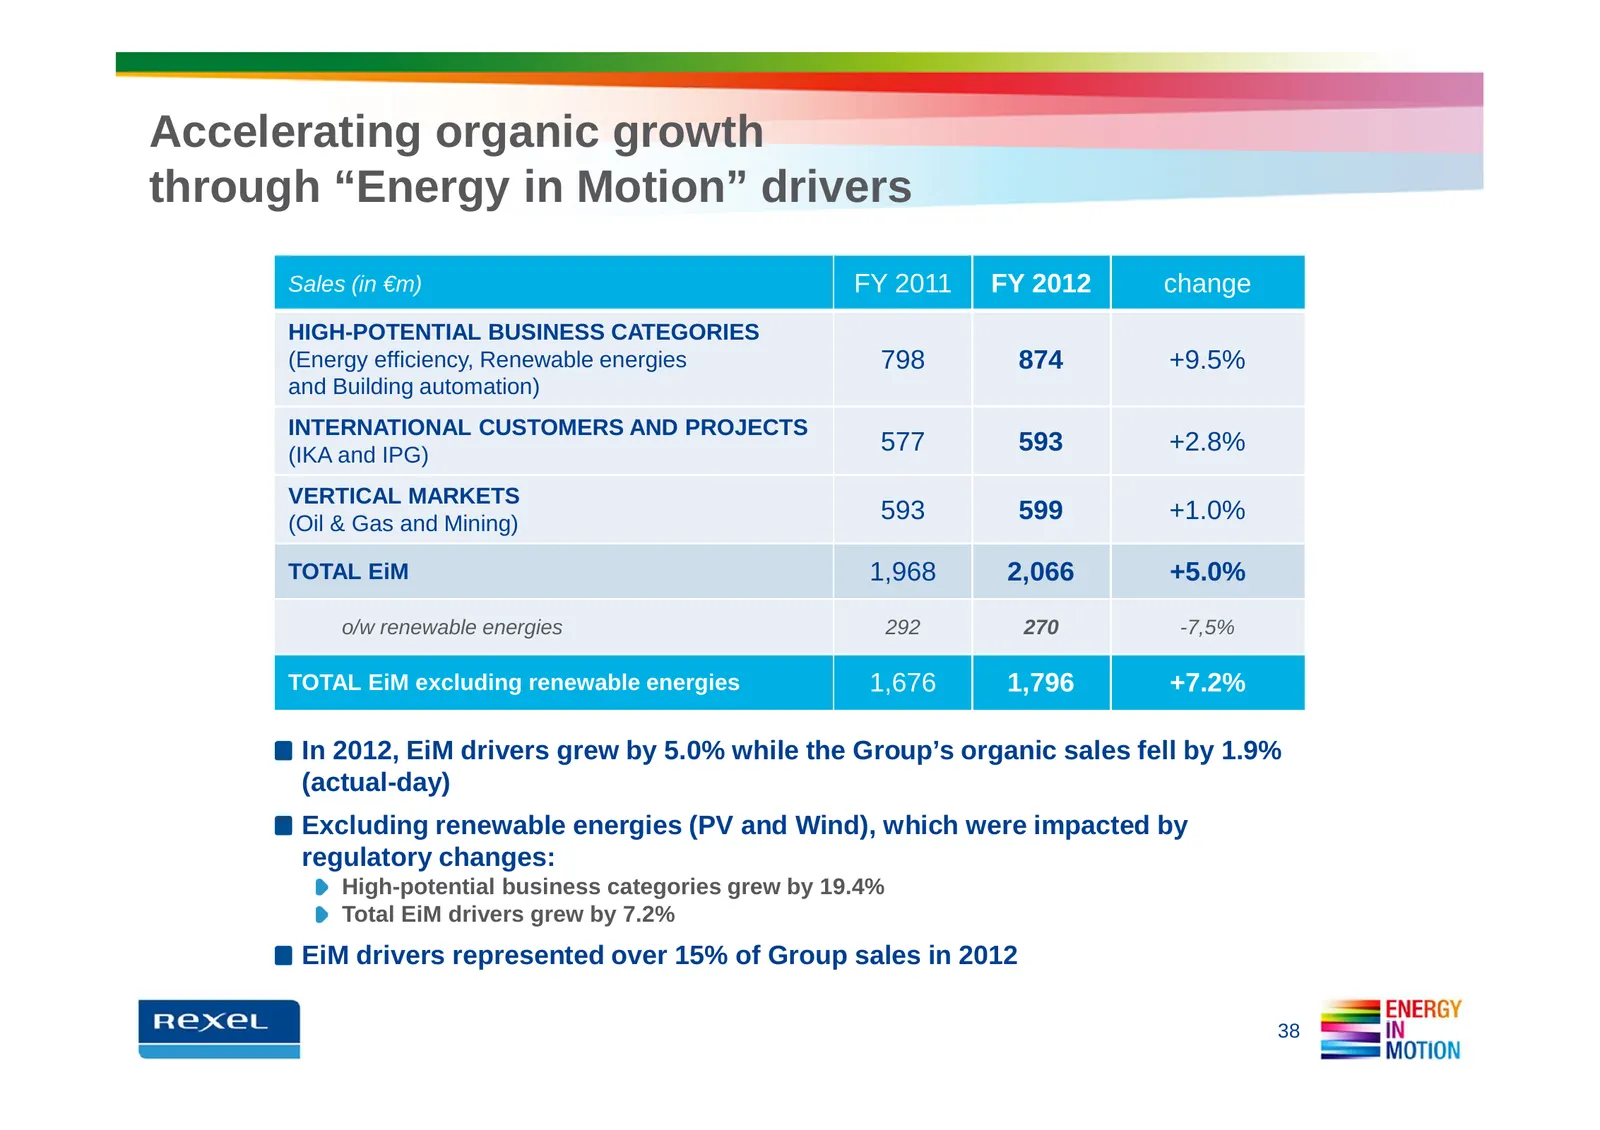
Slide 38: Accelerating organic growth through Energy in Motion drivers
Accelerating organic growth through “Energy in Motion” drivers Sales (in €m) FY 2011 FY 2012 change HIGH-POTENTIAL BUSINESS CATEGORIES (Energy efficiency, Renewable energies 798 874 +9.5% and Building automation) INTERNATIONAL CUSTOMERS AND PROJECTS (IKA and IPG) 577 593 +2.8% VERTICAL MARKETS (Oil
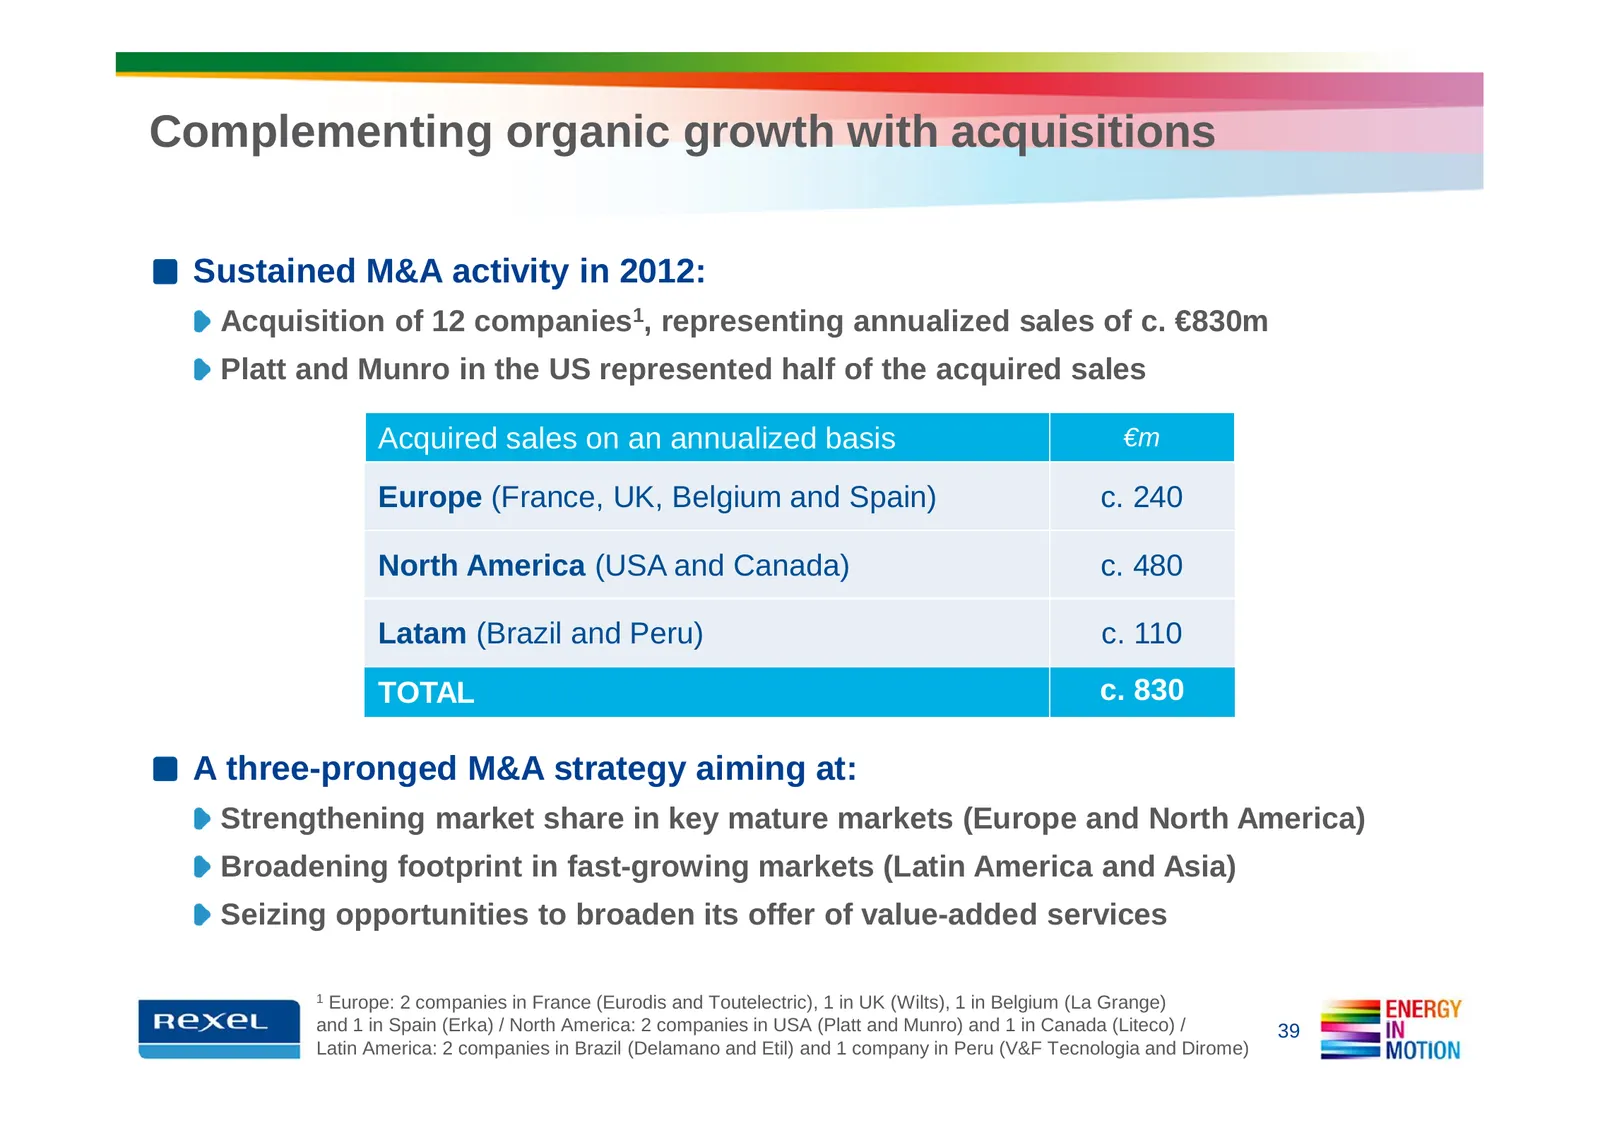
Slide 39: Complementing organic growth with acquisitions
Complementing organic growth with acquisitions Sustained M&A activity in 2012: Acquisition of 12 companies1, representing annualized sales of c. €830m Platt and Munro in the US represented half of the acquired sales Acquired sales on an annualized basis €m Europe (France, UK, Belgium and Spain) c. 2
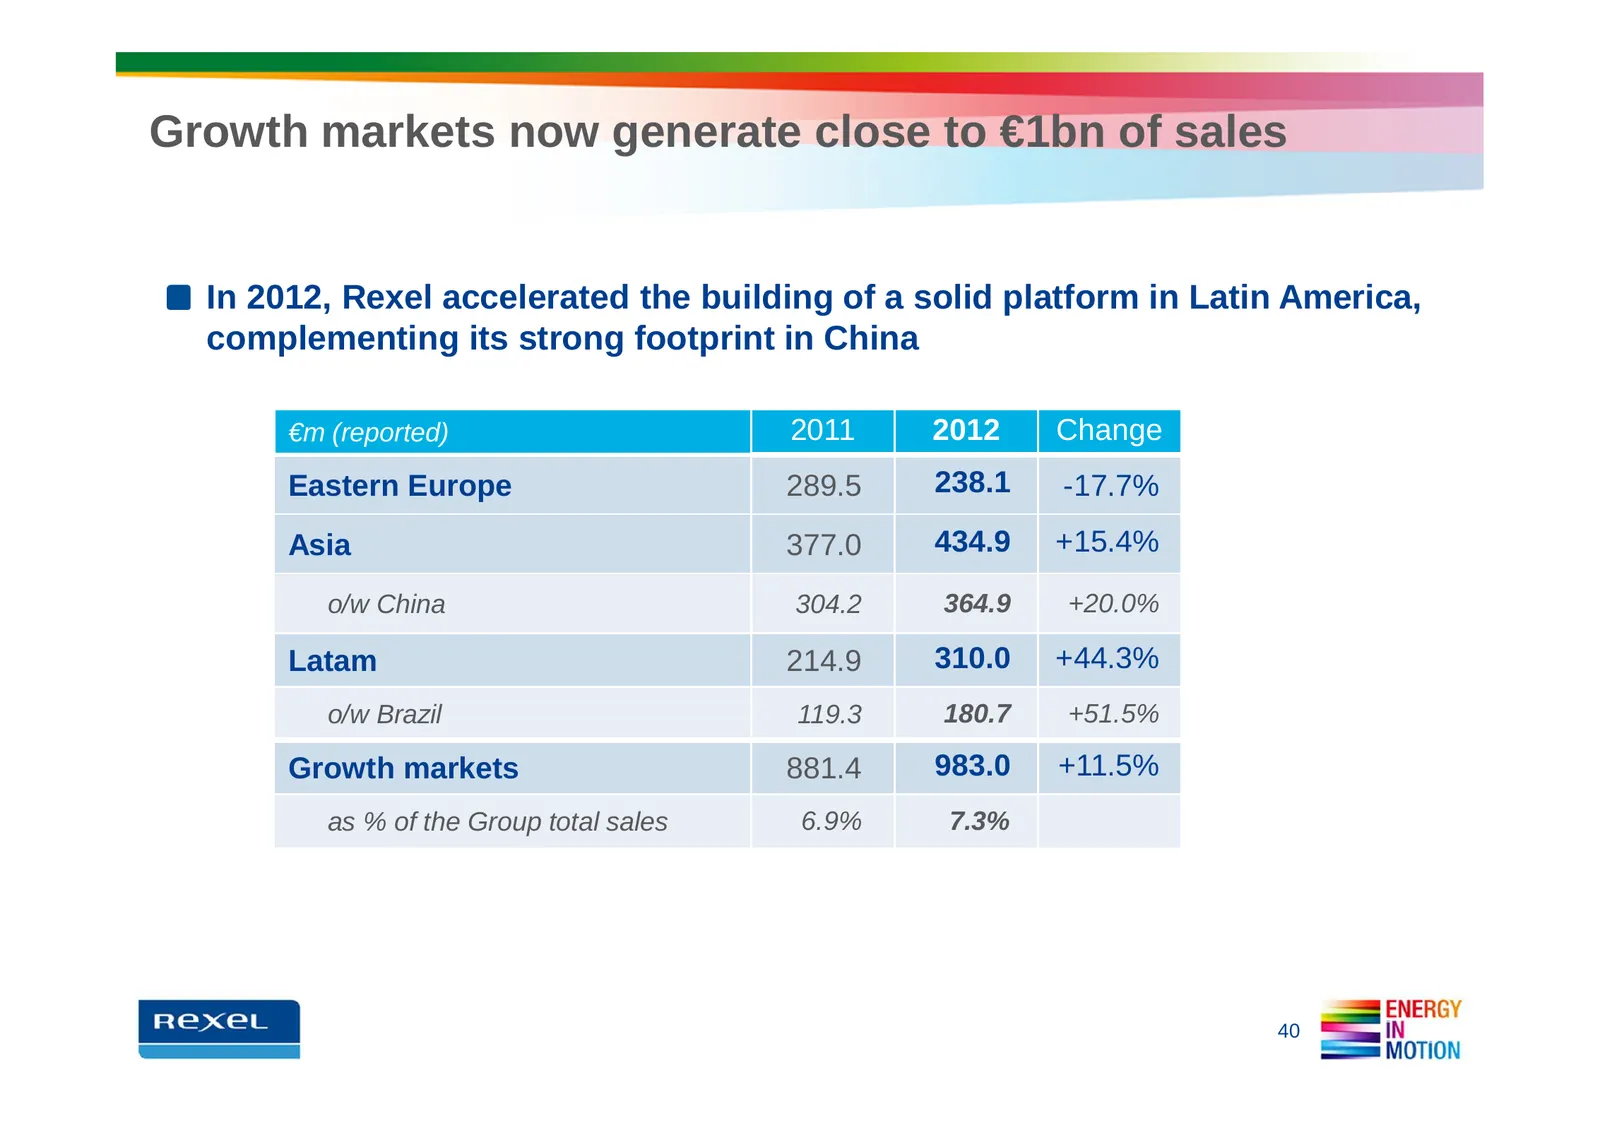
Slide 40: Growth markets now generate close to €1bn of sales
Growth markets now generate close to €1bn of sales In 2012, Rexel accelerated the building of a solid platform in Latin America, complementing its strong footprint in China €m (reported) 2011 2012 Change Eastern Europe 289.5 238.1 -17.7% Asia 377.0 434.9 +15.4% o/w China 304.2 364.9 +20.0% Latam 214
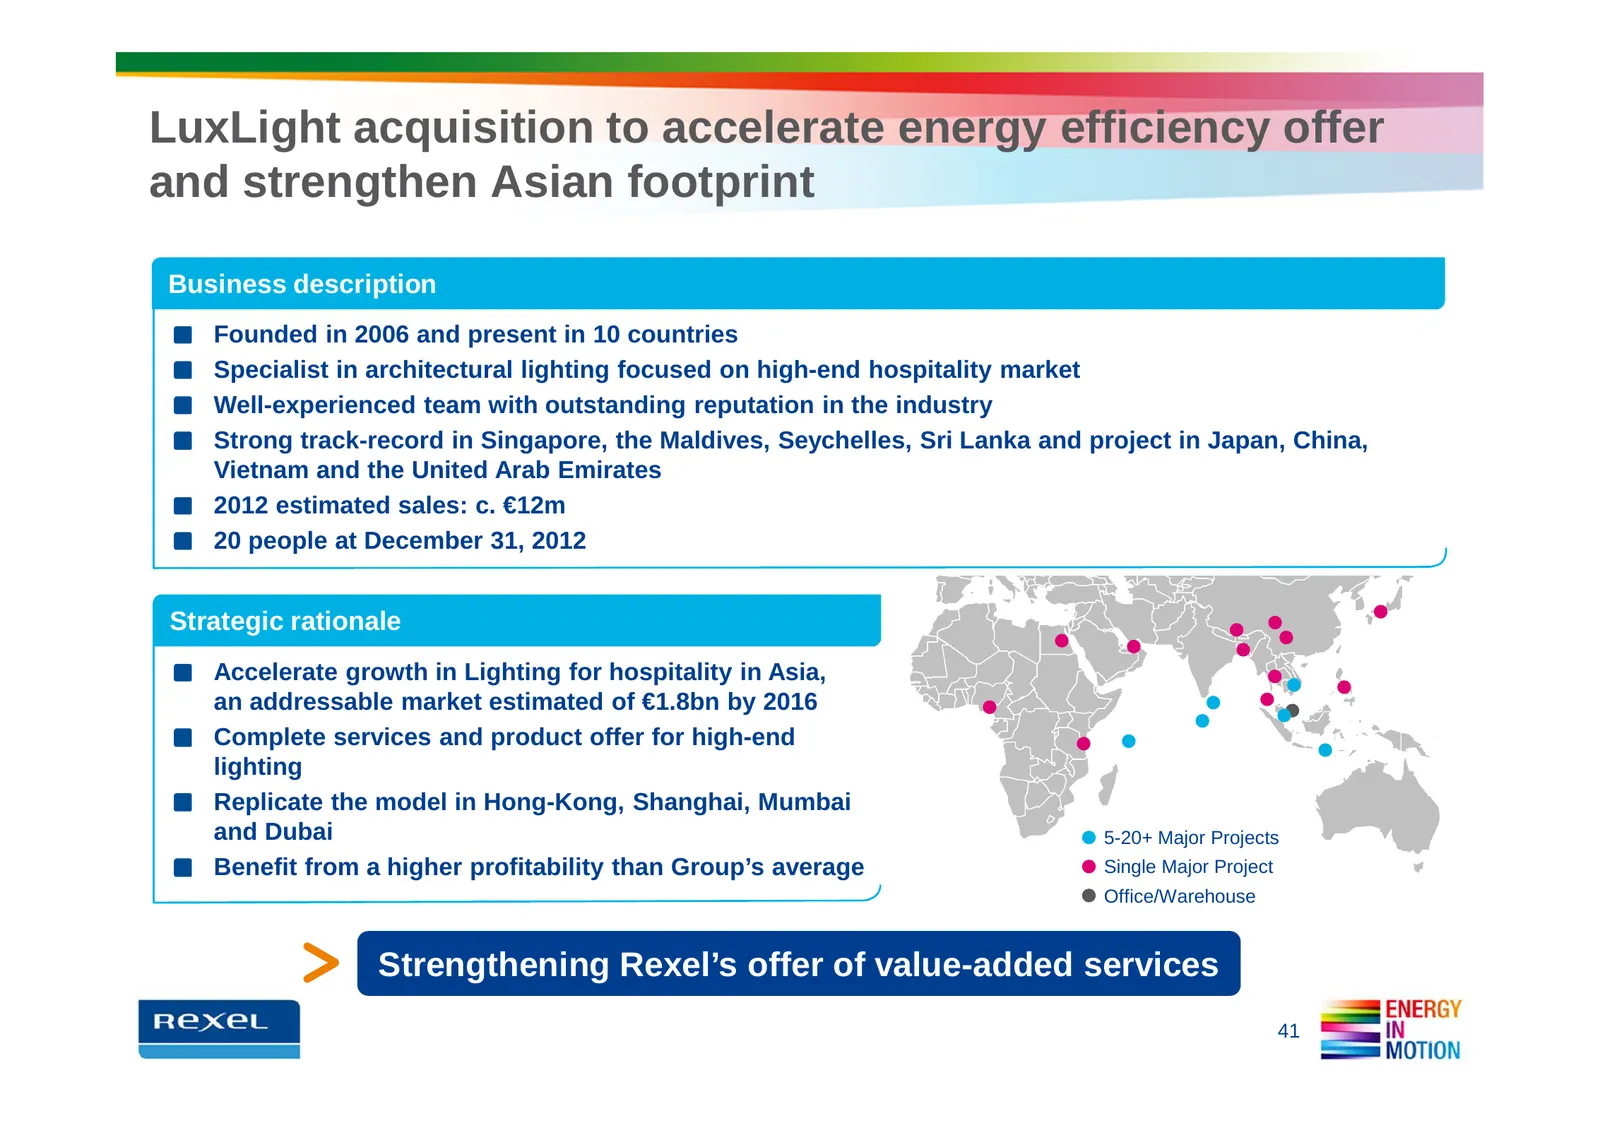
Slide 41: LuxLight acquisition to accelerate energy efficiency offer
LuxLight acquisition to accelerate energy efficiency offer and strengthen Asian footprint Business description Founded in 2006 and present in 10 countries Specialist in architectural lighting focused on high-end hospitality market Well-experienced team with outstanding reputation in the industry Str
Slide 42: Energy in Motion: Enhancing Organizational Effectiveness
ENERGY IN MOTION: ENHANCING ORGANIZATIONAL EFFECTIVENESS
Slide 43: Leadership accountability to accelerate implementation of Energy in Motion
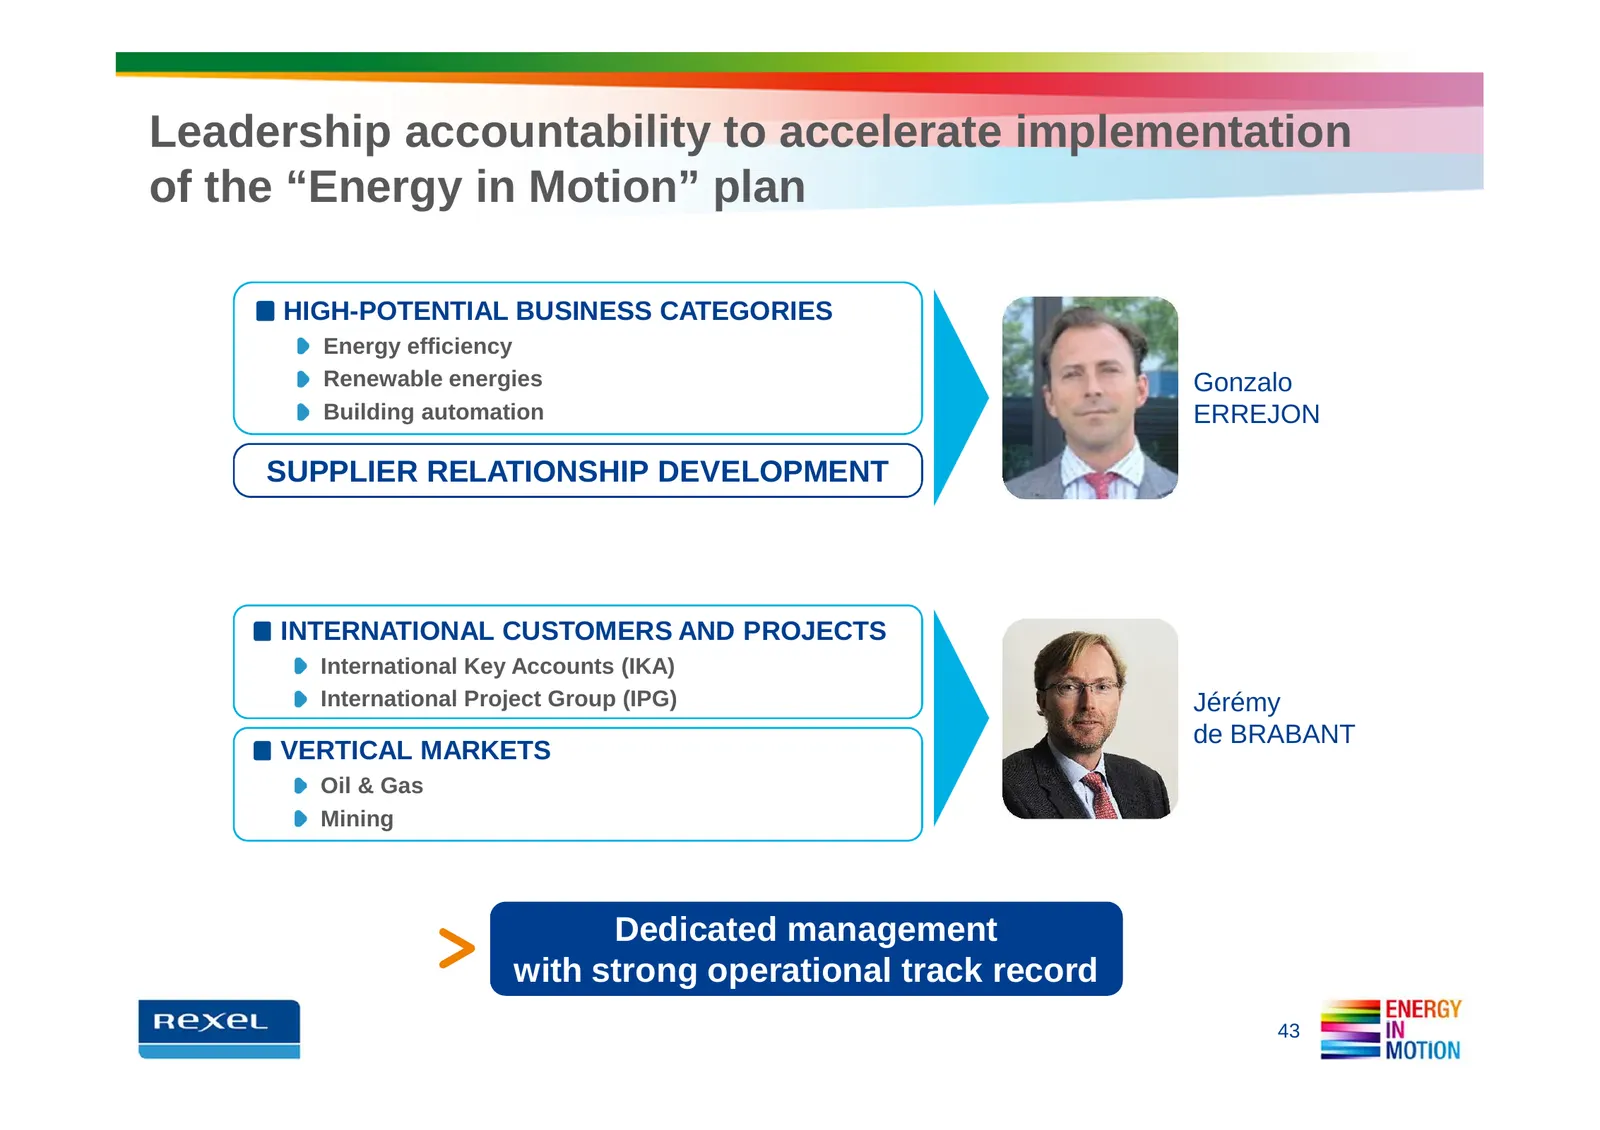
Leadership accountability to accelerate implementation of the “Energy in Motion” plan HIGH-POTENTIAL BUSINESS CATEGORIES Energy efficiency Renewable energies Gonzalo Building automation ERREJON SUPPLIER RELATIONSHIP DEVELOPMENT INTERNATIONAL CUSTOMERS AND PROJECTS International Key Accounts (IKA) In
Slide 44: A more focused organization in Europe
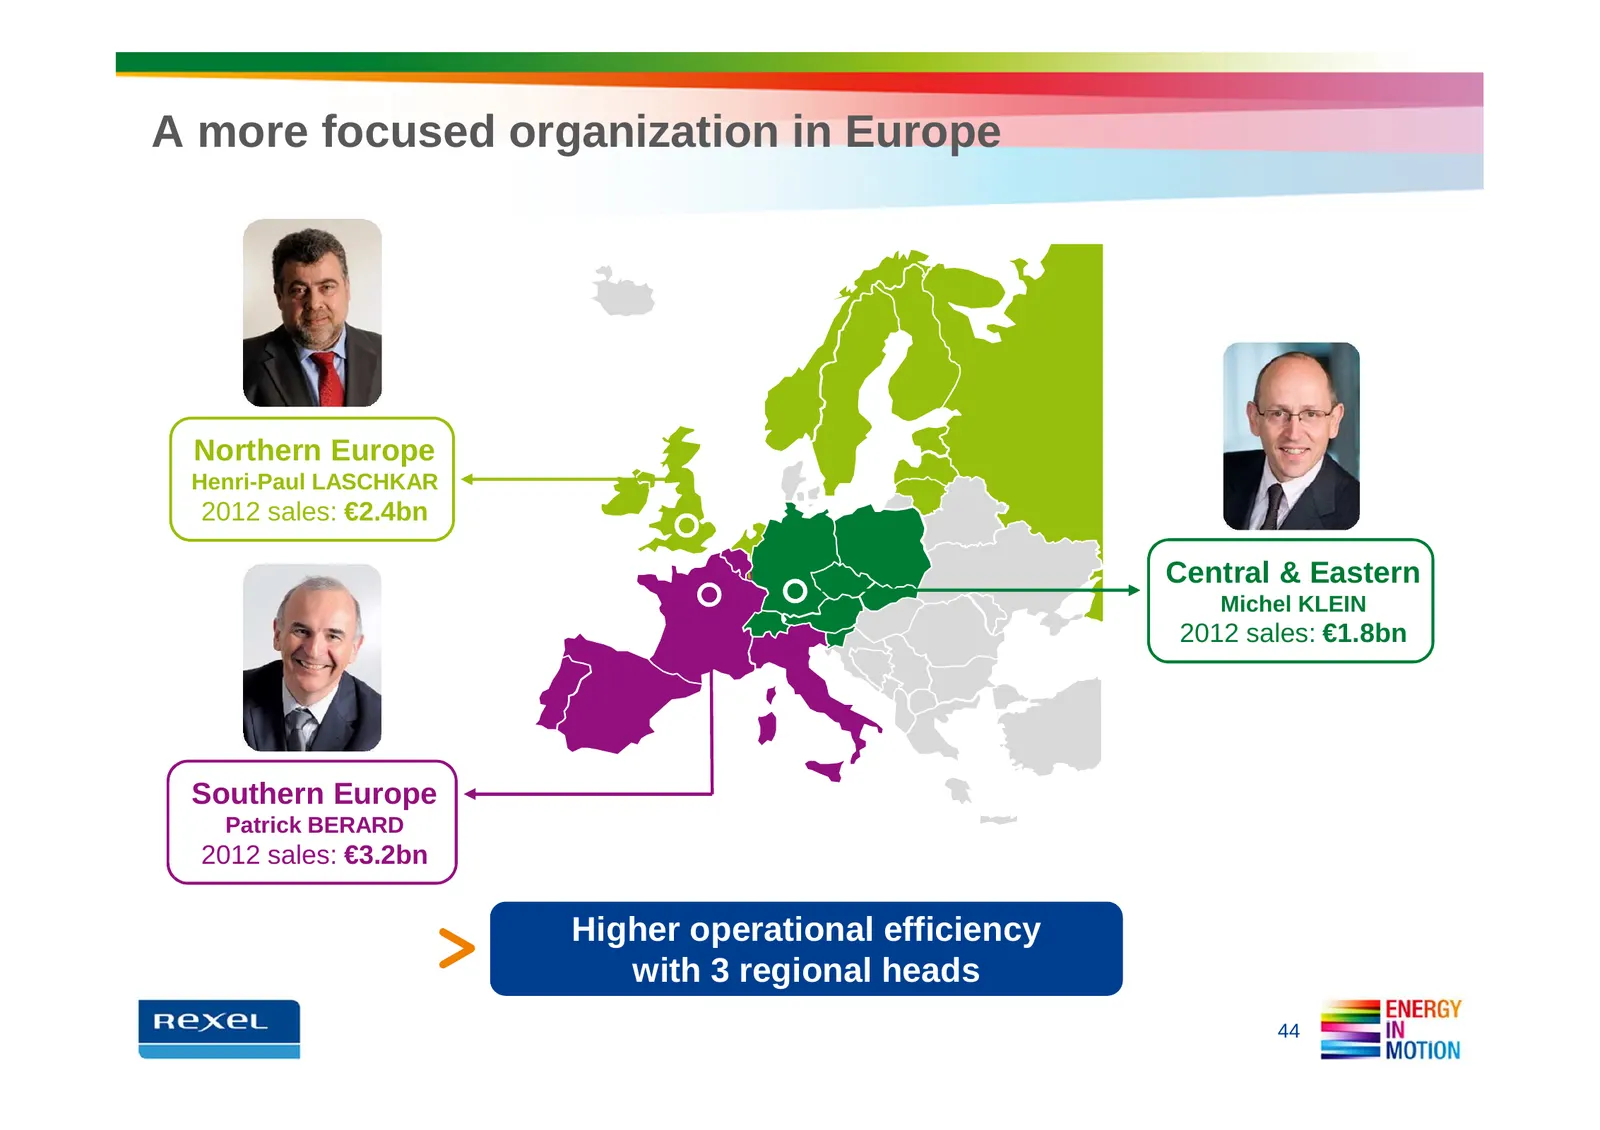
A more focused organization in Europe Northern Europe Henri-Paul LASCHKAR 2012 sales: €2.4bn Central & Eastern Michel KLEIN 2012 sales: €1.8bn Southern Europe Patrick BERARD 2012 sales: €3.2bn Higher operational efficiency with 3 regional heads 44
Slide 45: Appointment of Catherine Guillouard as Group CFO
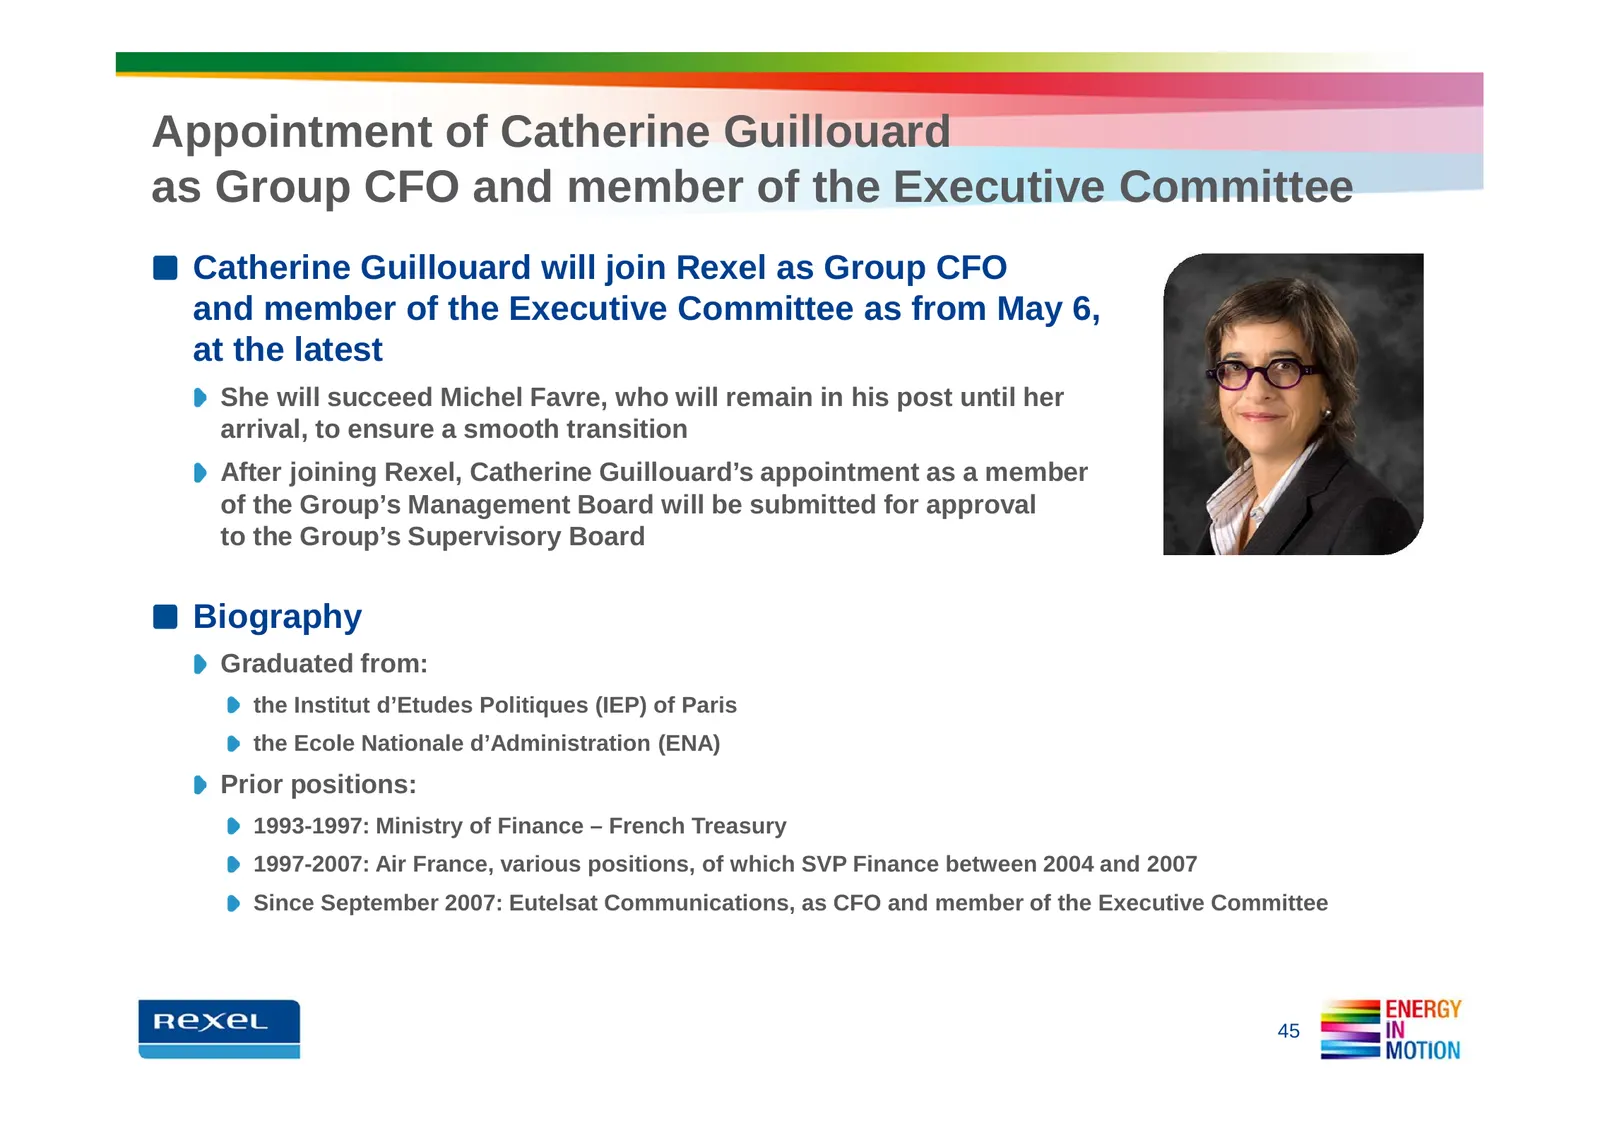
Appointment of Catherine Guillouard as Group CFO and member of the Executive Committee Catherine Guillouard will join Rexel as Group CFO and member of the Executive Committee as from May 6, at the latest She will succeed Michel Favre, who will remain in his post until her arrival, to ensure a smooth
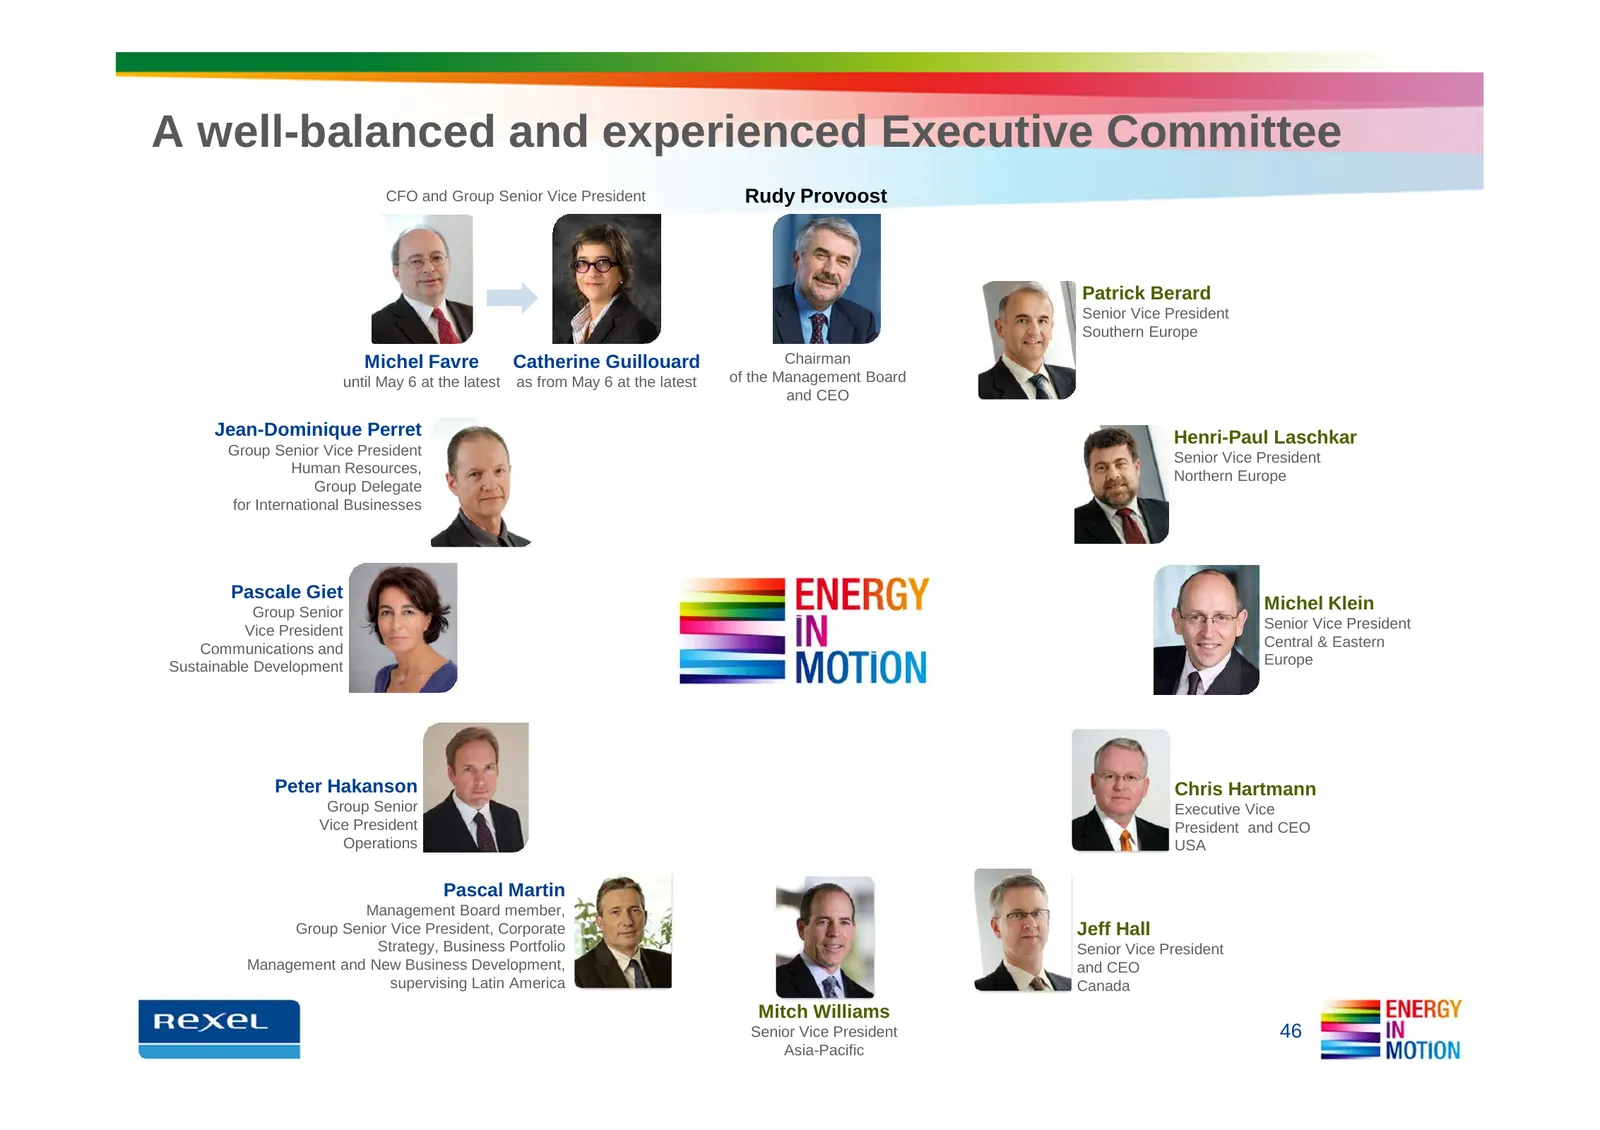
Slide 46: A well-balanced and experienced Executive Committee
A well-balanced and experienced Executive Committee CFO and Group Senior Vice President Rudy Provoost Patrick Berard Senior Vice President Southern Europe Michel Favre Catherine Guillouard Chairman until May 6 at the latest as from May 6 at the latest of the Management Board and CEO Jean-Dominique P
Slide 47: Energy in Motion: Driving Operational Performance
ENERGY IN MOTION: DRIVING OPERATIONAL PERFORMANCE
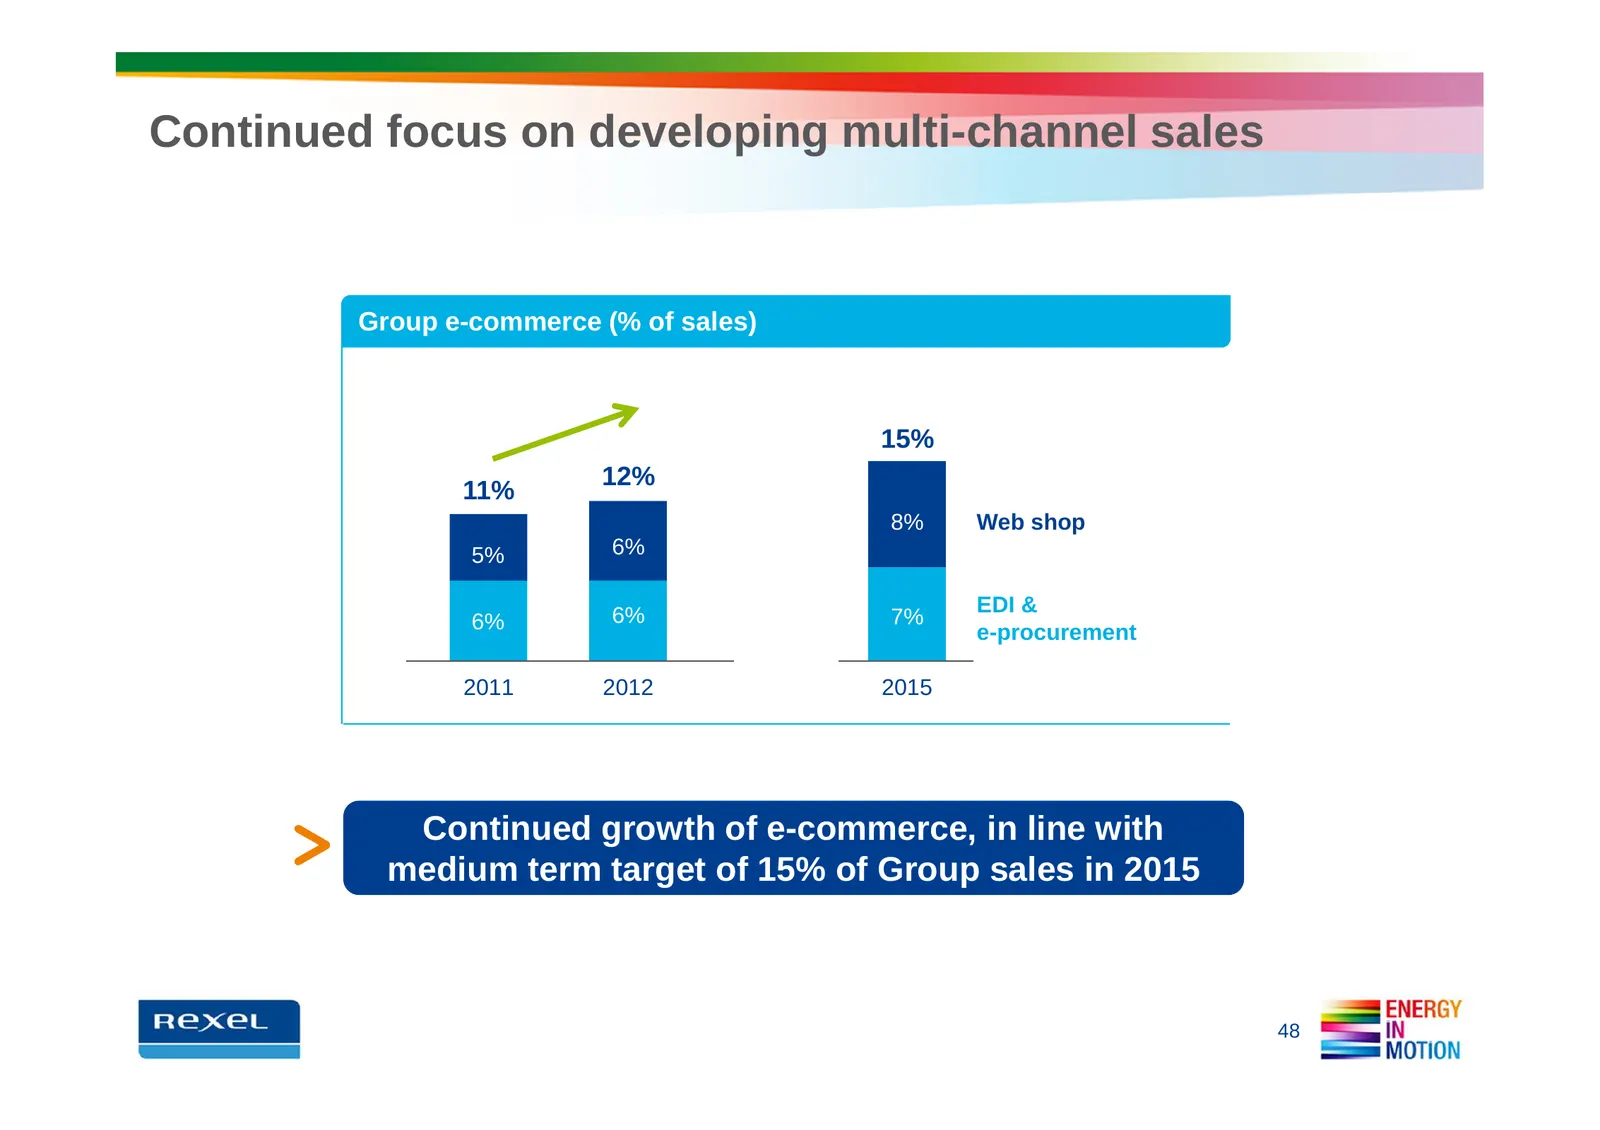
Slide 48: Continued focus on developing multi-channel sales
Continued focus on developing multi-channel sales Group e-commerce (% of sales) 15% 12% 11% 8% Web shop 5% 6% 6% EDI & 6% 7% e-procurement 2011 2012 2015 Continued growth of e-commerce, in line with medium term target of 15% of Group sales in 2015 48
Slide 49: Solid pricing management to drive margin
Solid pricing management to drive margin Our pricing actions rely on 3 cornerstones Pricing assessments conducted based on Group methodology (price differentiation, value pricing rather than cost-plus…) Local initiatives supported by the Group (implementation of processes and KPIs, overrides control
Slide 50: Strong financial discipline
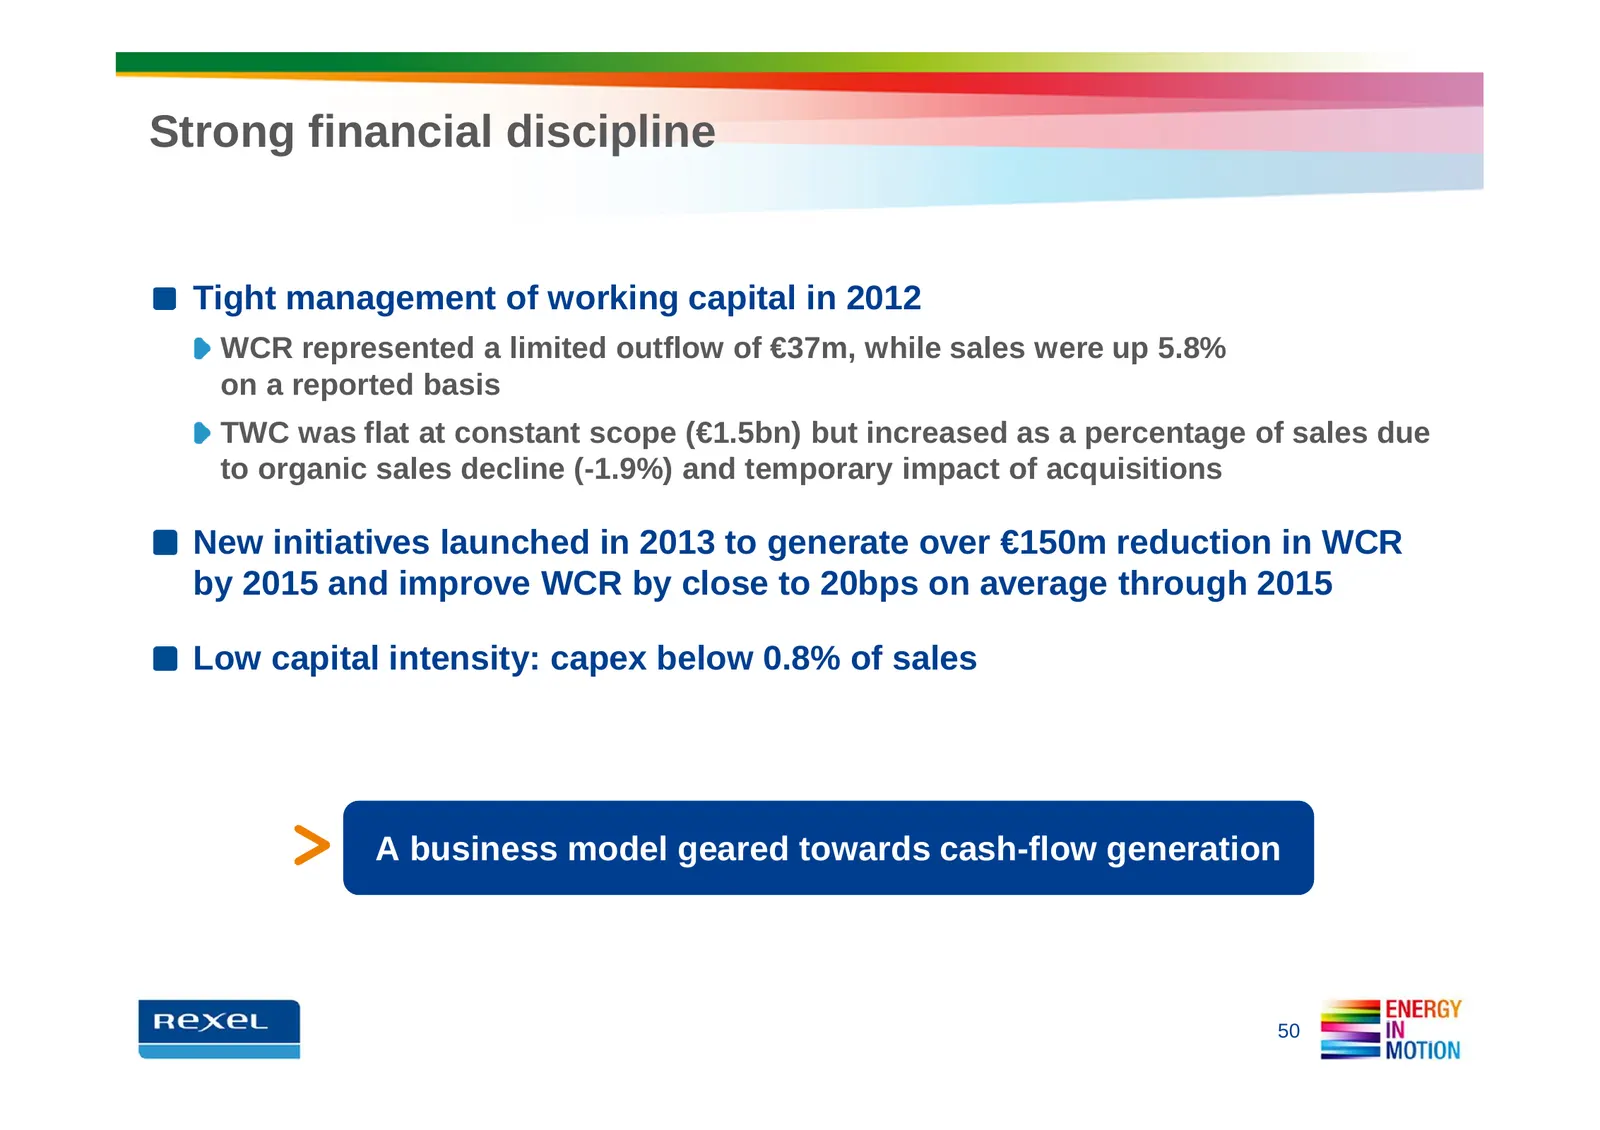
Strong financial discipline Tight management of working capital in 2012 WCR represented a limited outflow of €37m, while sales were up 5.8% on a reported basis TWC was flat at constant scope (€1.5bn) but increased as a percentage of sales due to organic sales decline (-1.9%) and temporary impact of

Slide 51: Outlook
OUTLOOK = ENERGY MOTION
Slide 52: Solid targets for 2013, medium-term guidance confirmed
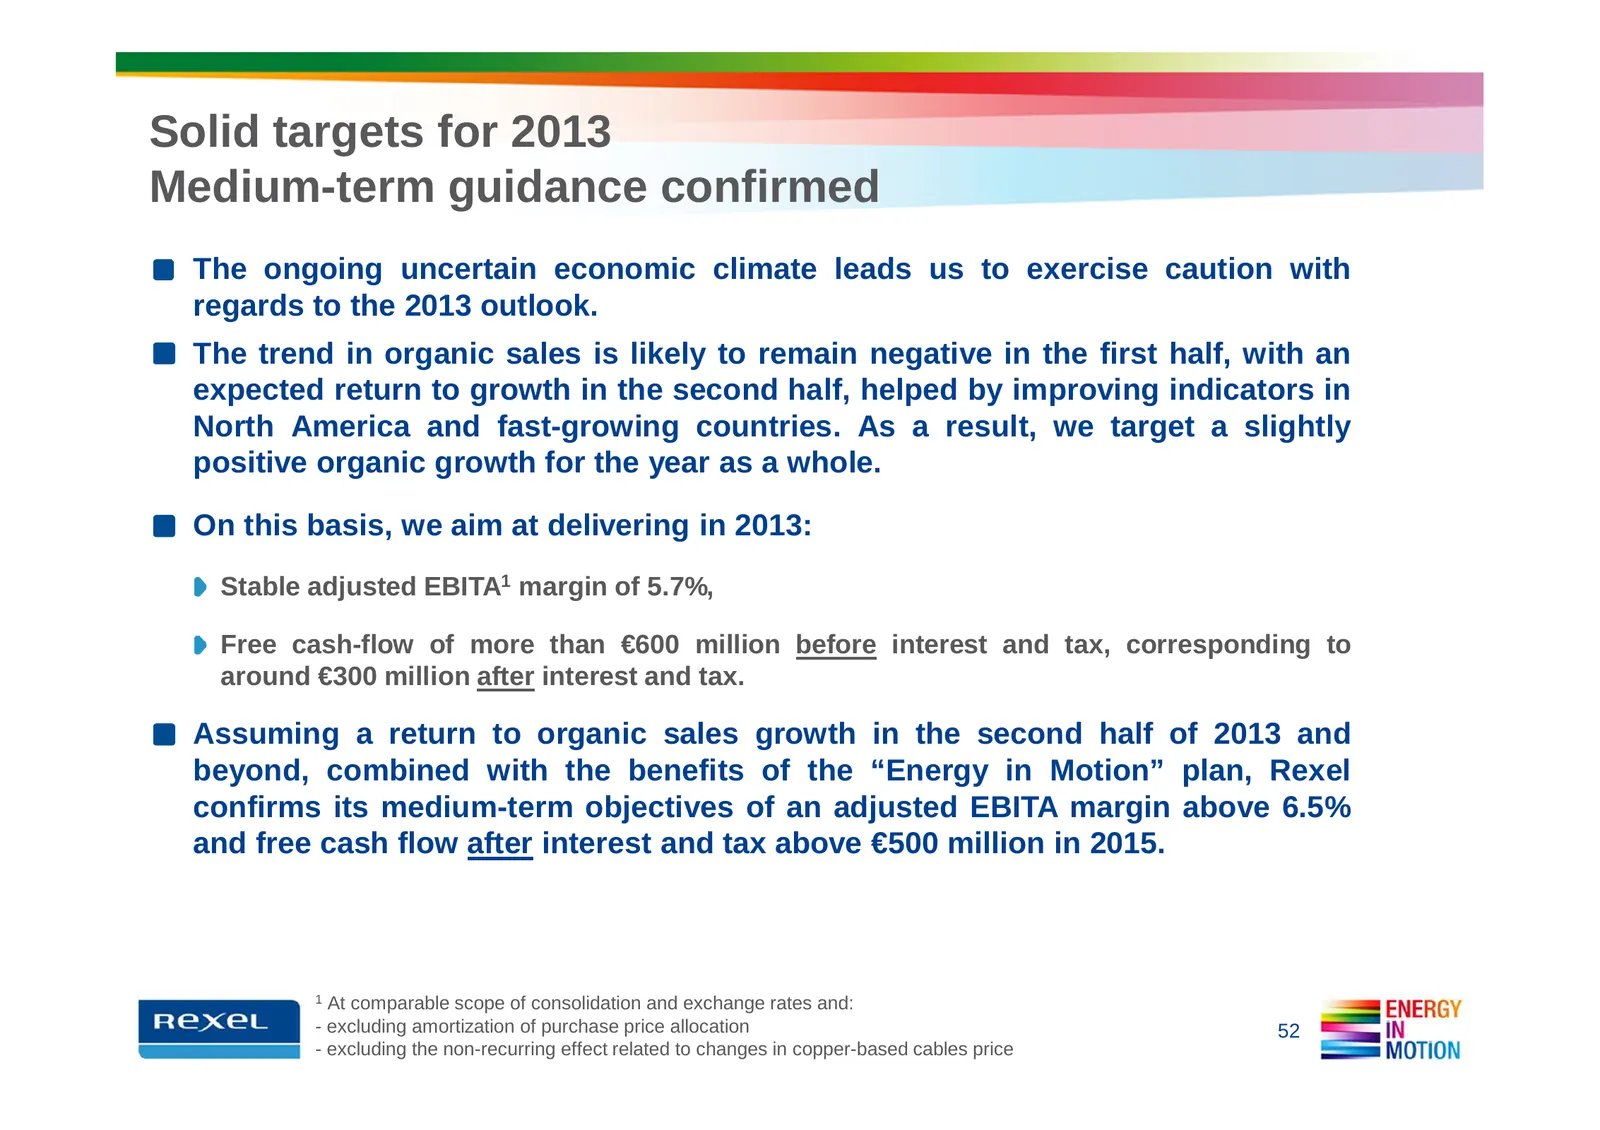
Solid targets for 2013 Medium-term guidance confirmed The ongoing uncertain economic climate leads us to exercise caution with regards to the 2013 outlook. The trend in organic sales is likely to remain negative in the first half, with an expected return to growth in the second half, helped by impro
Slide 53: Energy in Motion 2015 Ambitions
4. ENERGY IN MOTION 2015 AMBITIONS (Investor Day May 29, 2012)
Slide 54: Ambitious mid-term goals and financial targets
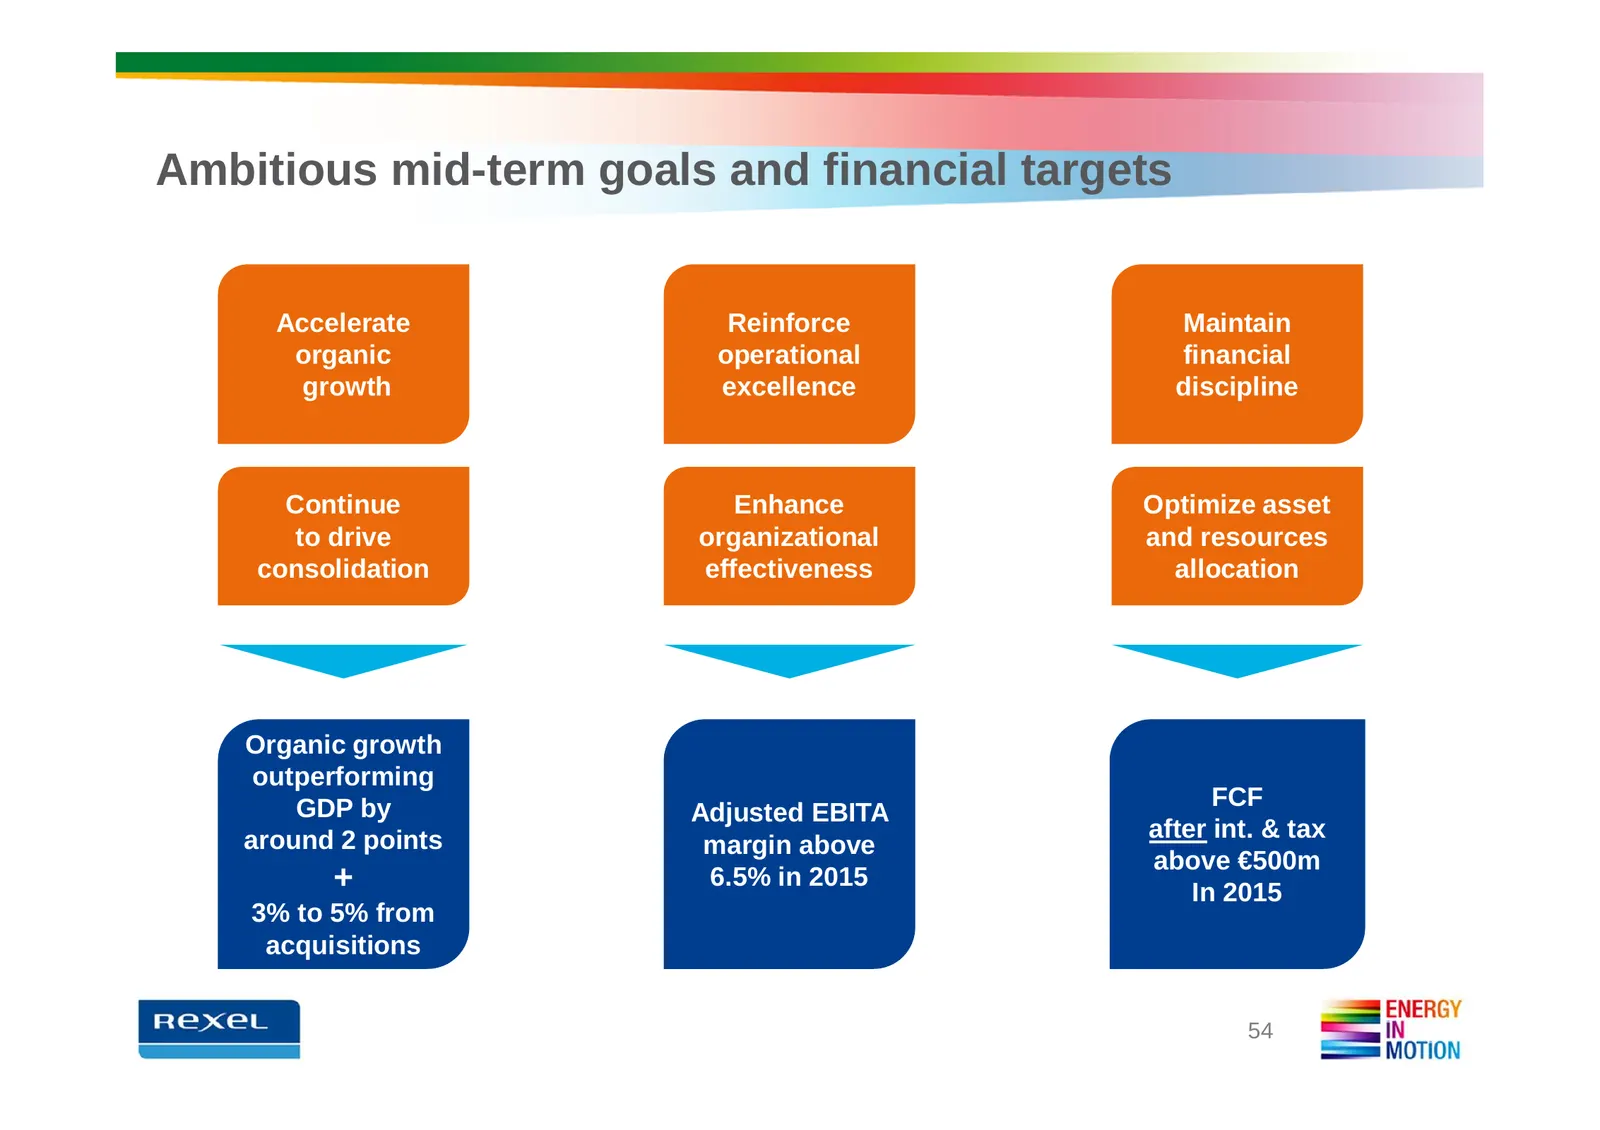
Ambitious mid-term goals and financial targets Accelerate Reinforce Maintain organic operational financial growth excellence discipline Continue Enhance Optimize asset to drive organizational and resources consolidation effectiveness allocation Organic growth outperforming GDP by FCF Adjusted EBITA
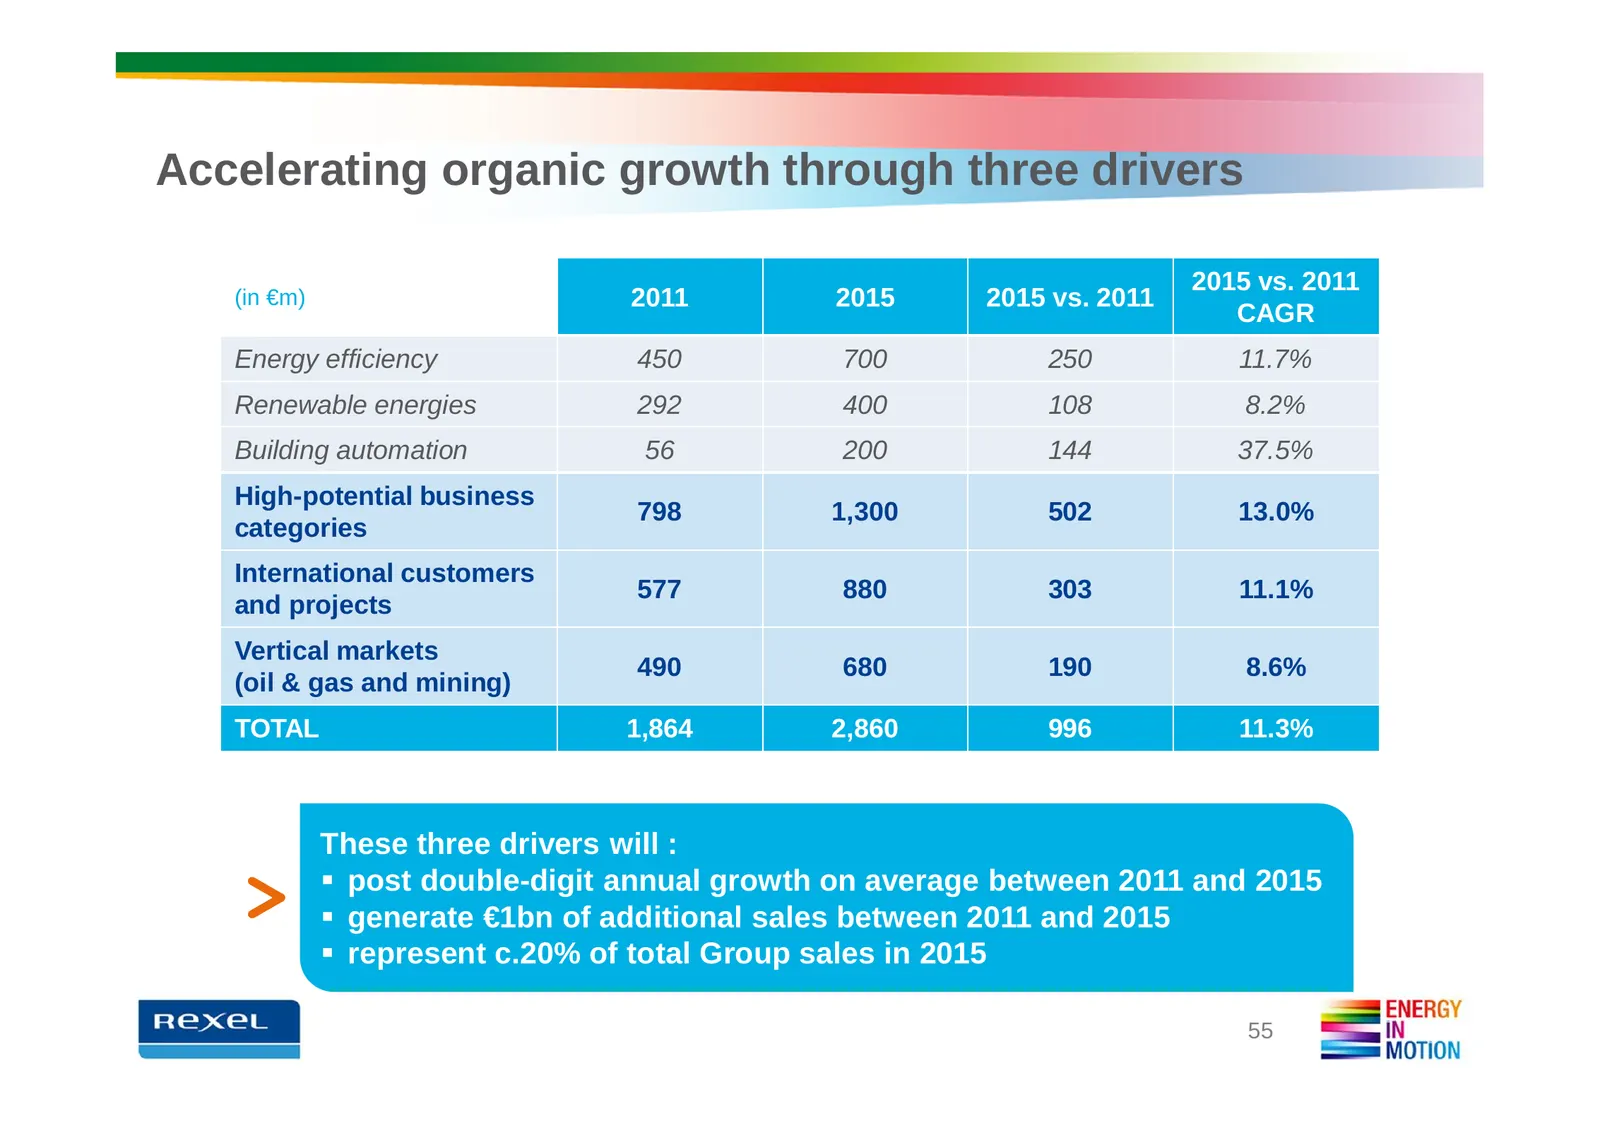
Slide 55: Accelerating organic growth through three drivers
Accelerating organic growth through three drivers 2015 vs. 2011 (in €m) 2011 2015 2015 vs. 2011 CAGR Energy efficiency 450 700 250 11.7% Renewable energies 292 400 108 8.2% Building automation 56 200 144 37.5% High-potential business 798 1,300 502 13.0% categories International customers 577 880 303
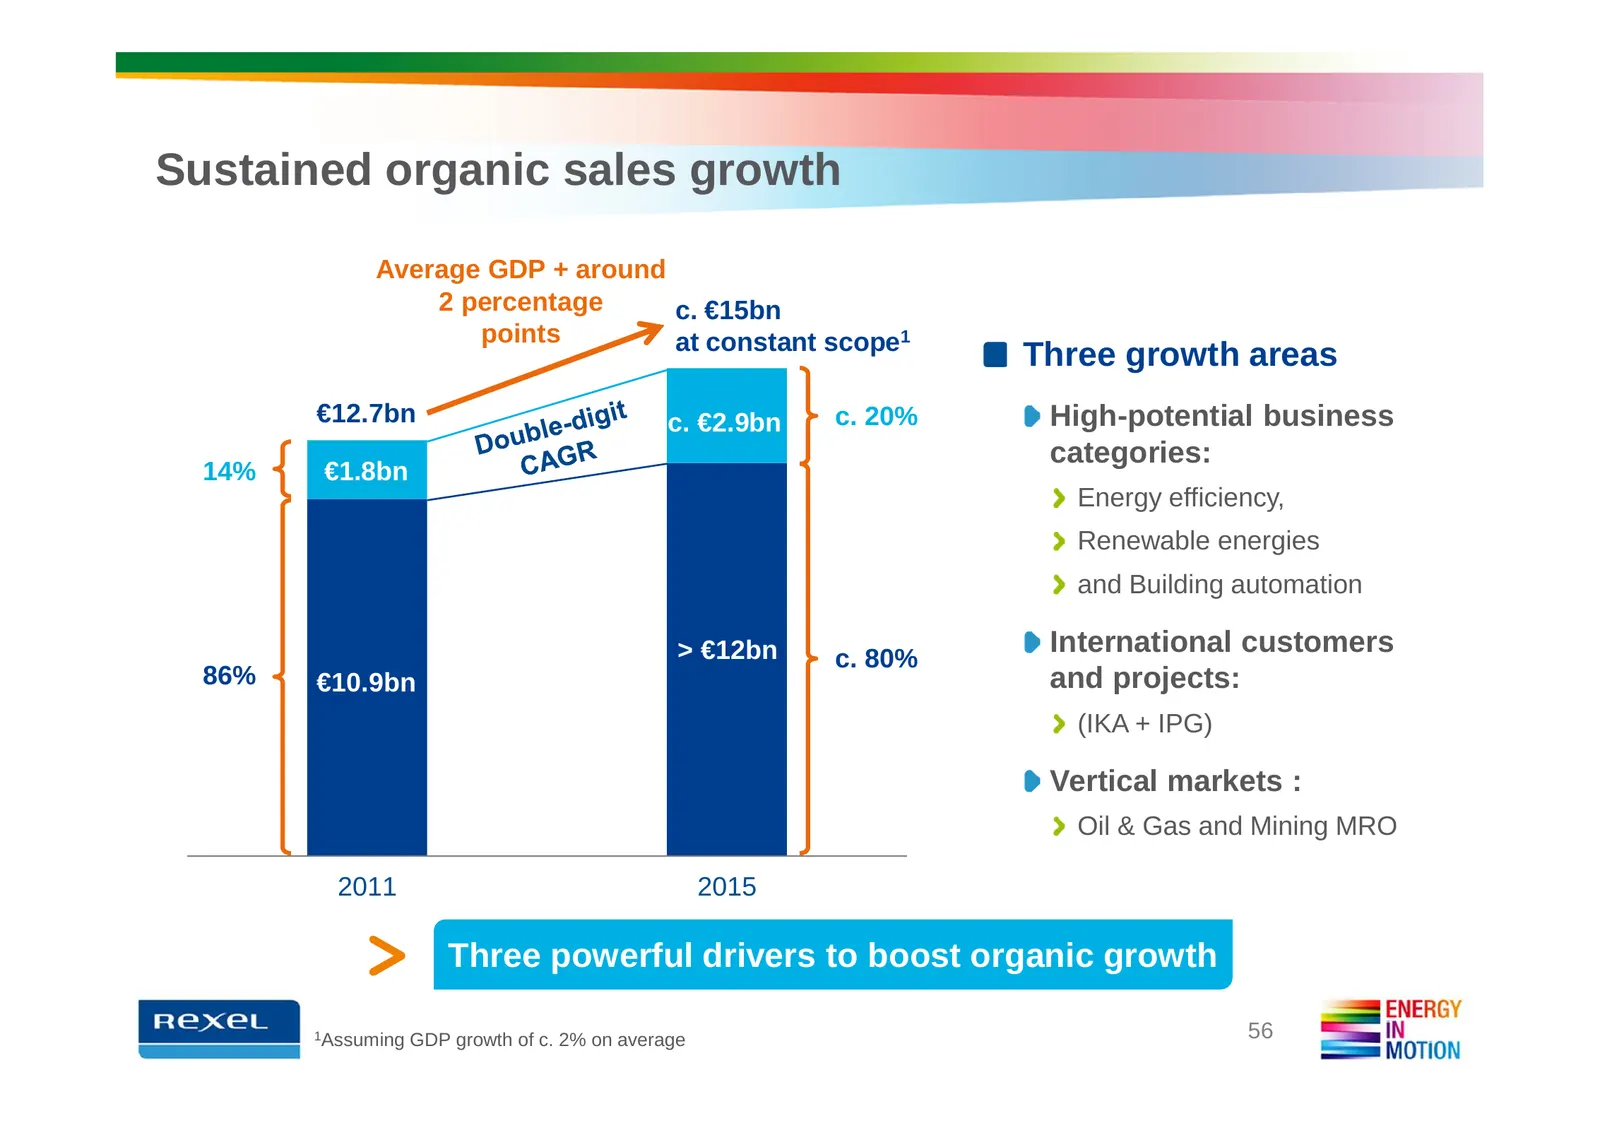
Slide 56: Sustained organic sales growth
Sustained organic sales growth Average GDP + around 2 percentage c. €15bn points at constant scope1 Three growth areas €12.7bn c. €2.9bn c. 20% High-potential business categories: 14% €1.8bn Energy efficiency, Renewable energies and Building automation > €12bn International customers c. 80% 86% €10.
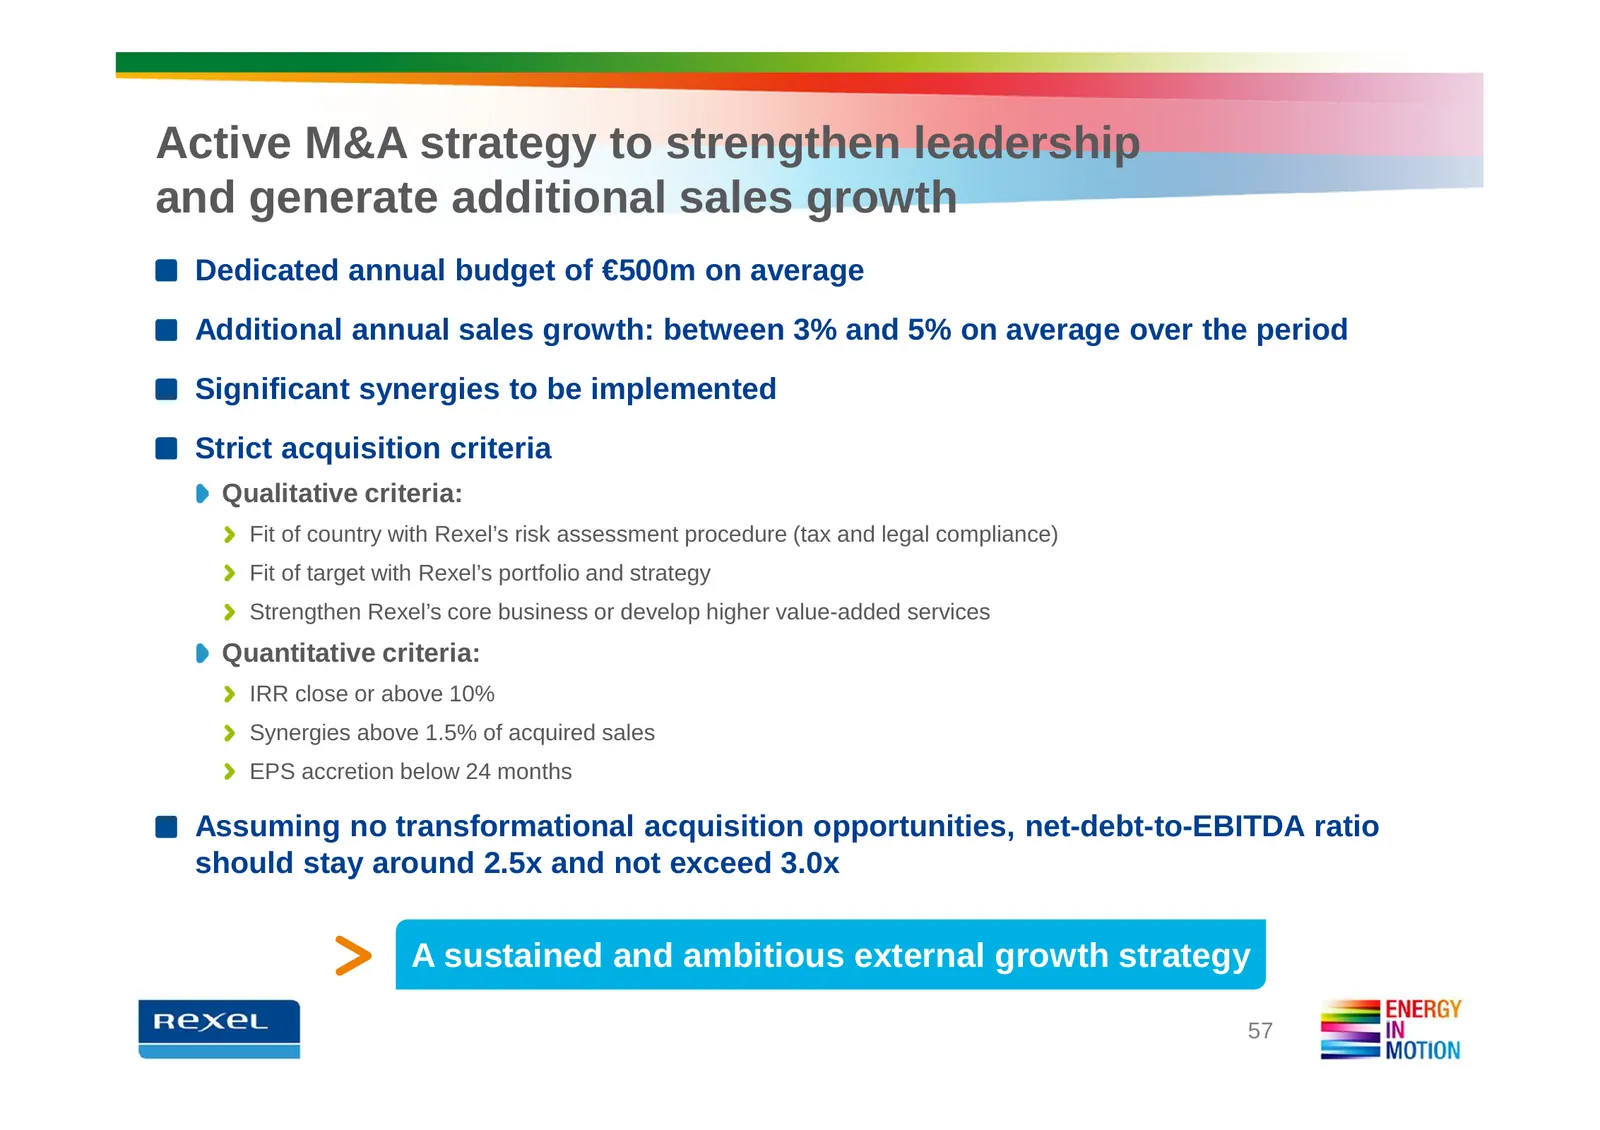
Slide 57: Active M&A strategy to strengthen leadership
Active M&A strategy to strengthen leadership and generate additional sales growth Dedicated annual budget of €500m on average Additional annual sales growth: between 3% and 5% on average over the period Significant synergies to be implemented Strict acquisition criteria Qualitative criteria: Fit of
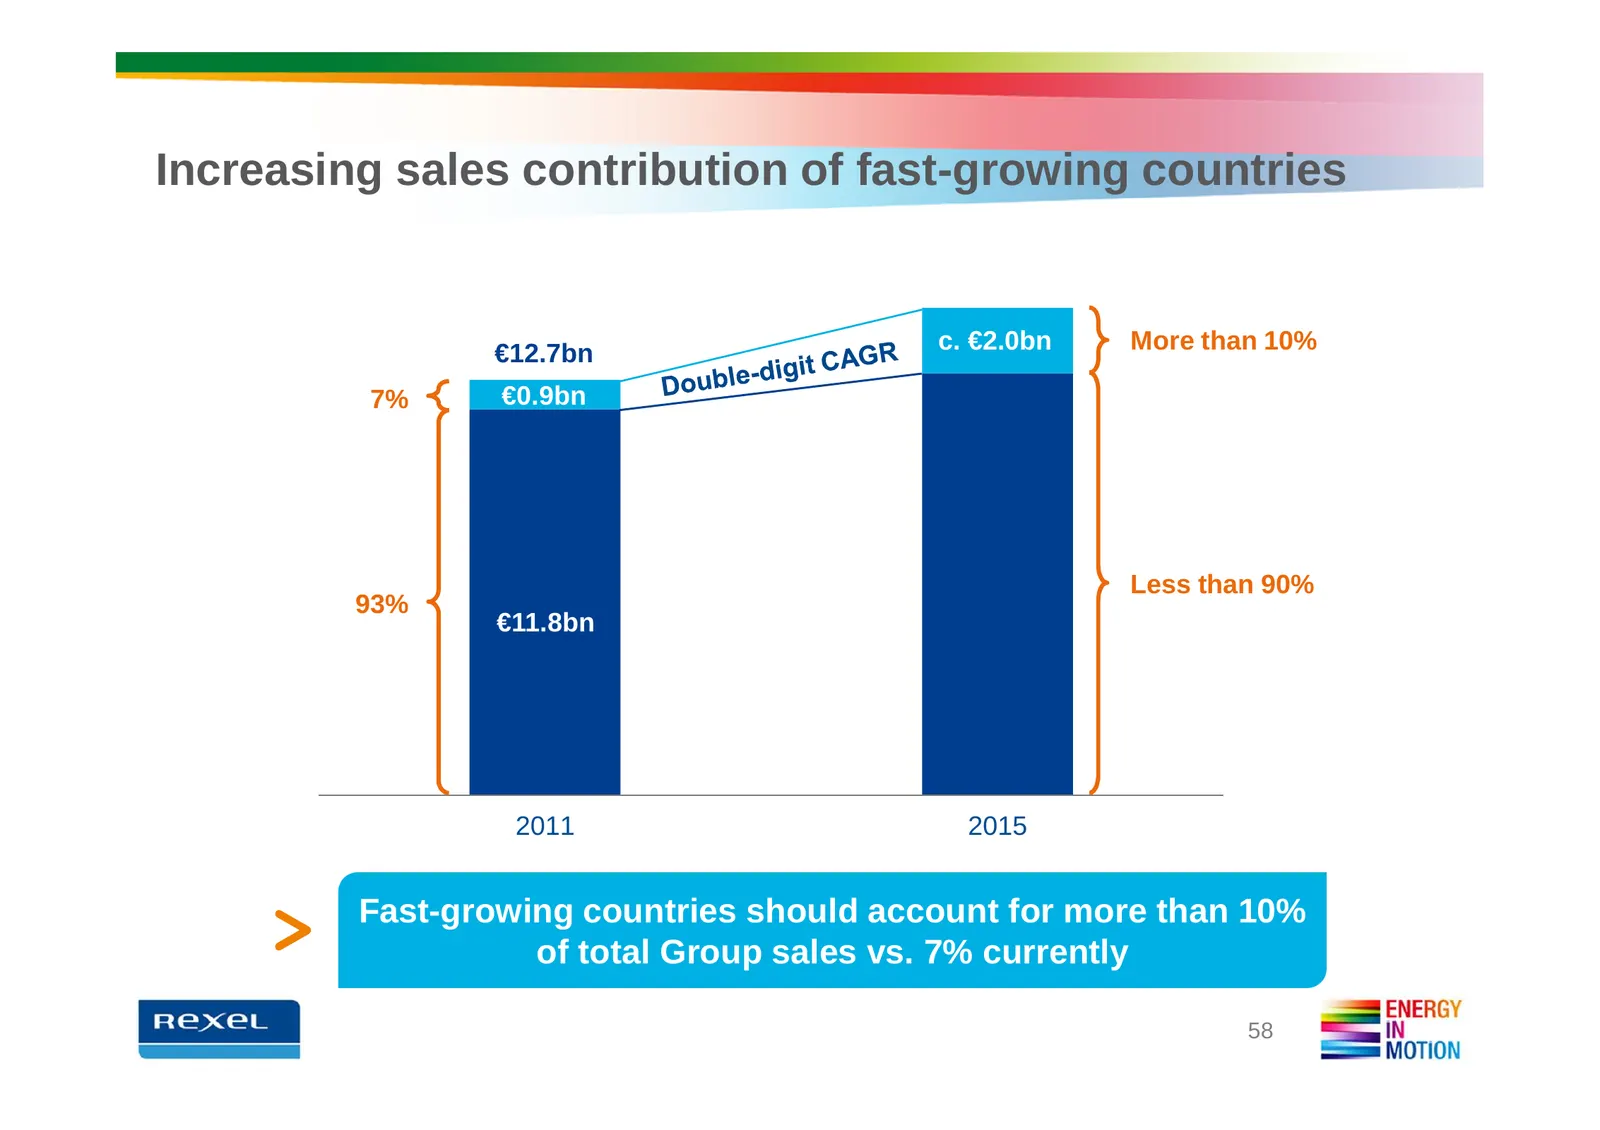
Slide 58: Increasing sales contribution of fast-growing countries
Increasing sales contribution of fast-growing countries €12.7bn c. €2.0bn More than 10% 7% €0.9bn Less than 90% 93% €11.8bn 2011 2015 Fast-growing countries should account for more than 10% of total Group sales vs. 7% currently 58
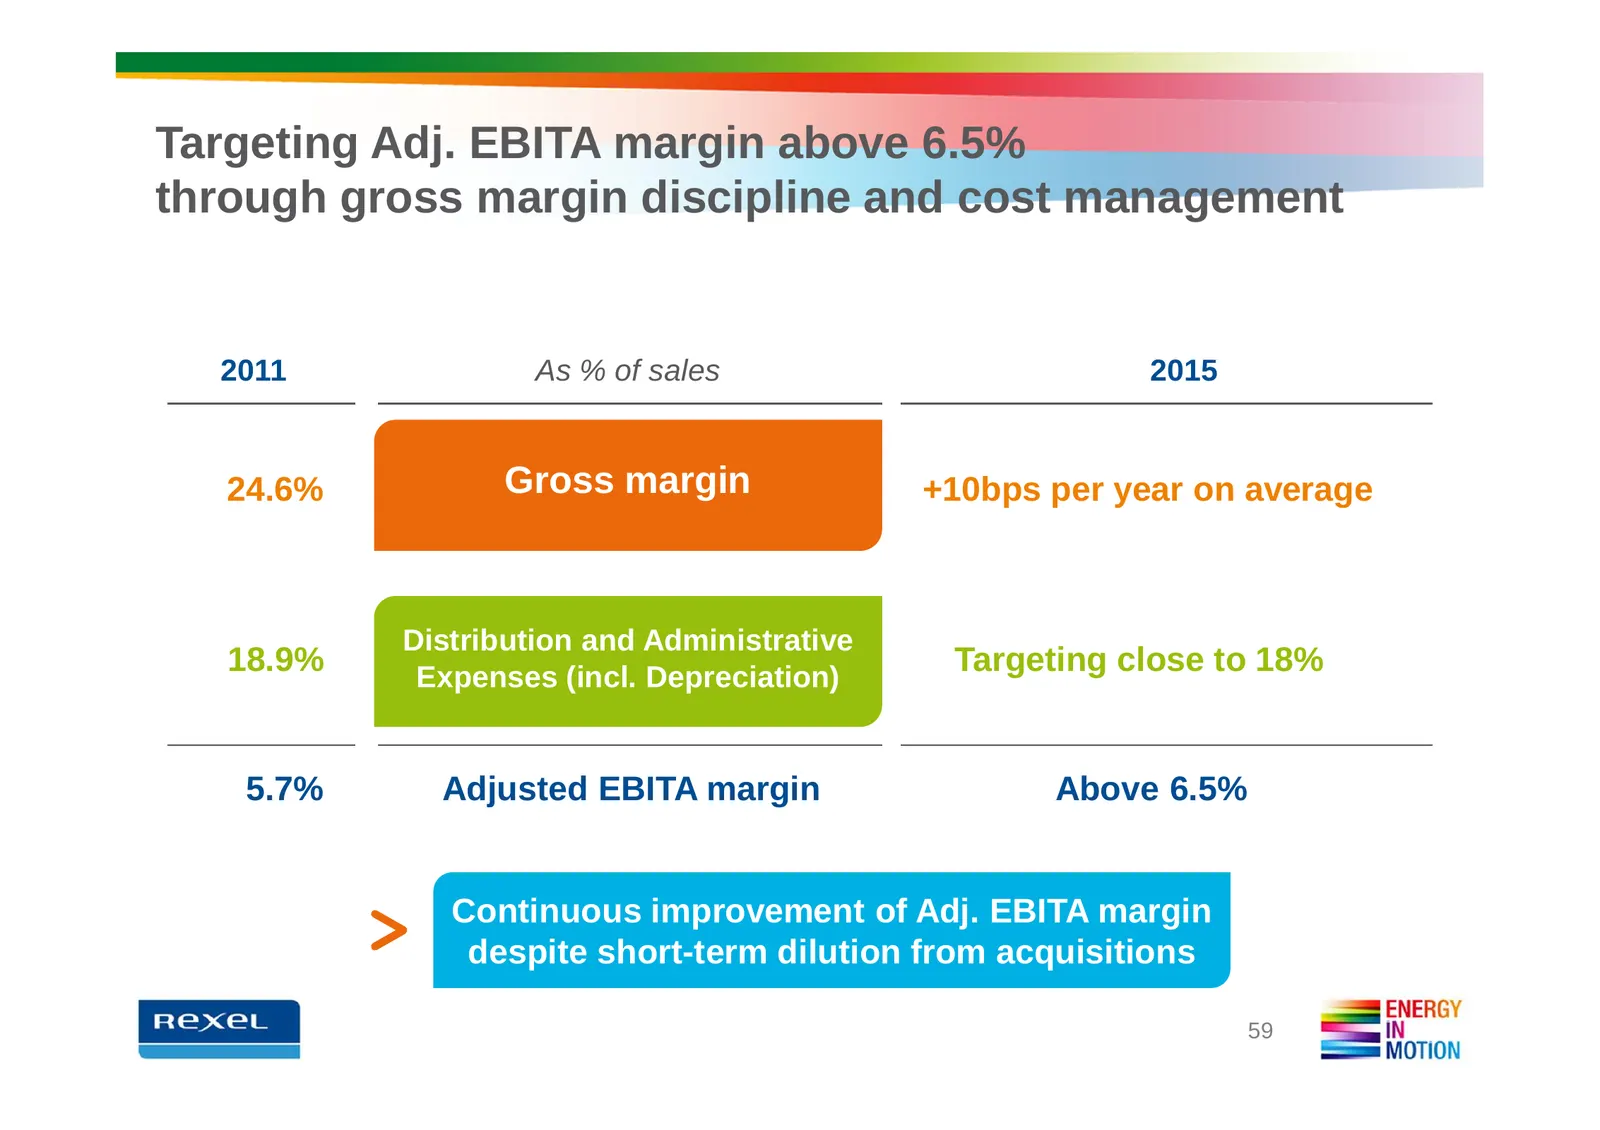
Slide 59: Targeting Adj. EBITA margin above 6.5%
Targeting Adj. EBITA margin above 6.5% through gross margin discipline and cost management 2011 As % of sales 2015 24.6% Gross margin +10bps per year on average Distribution and Administrative 18.9% Expenses (incl. Depreciation) Targeting close to 18% 5.7% Adjusted EBITA margin Above 6.5% Continuous
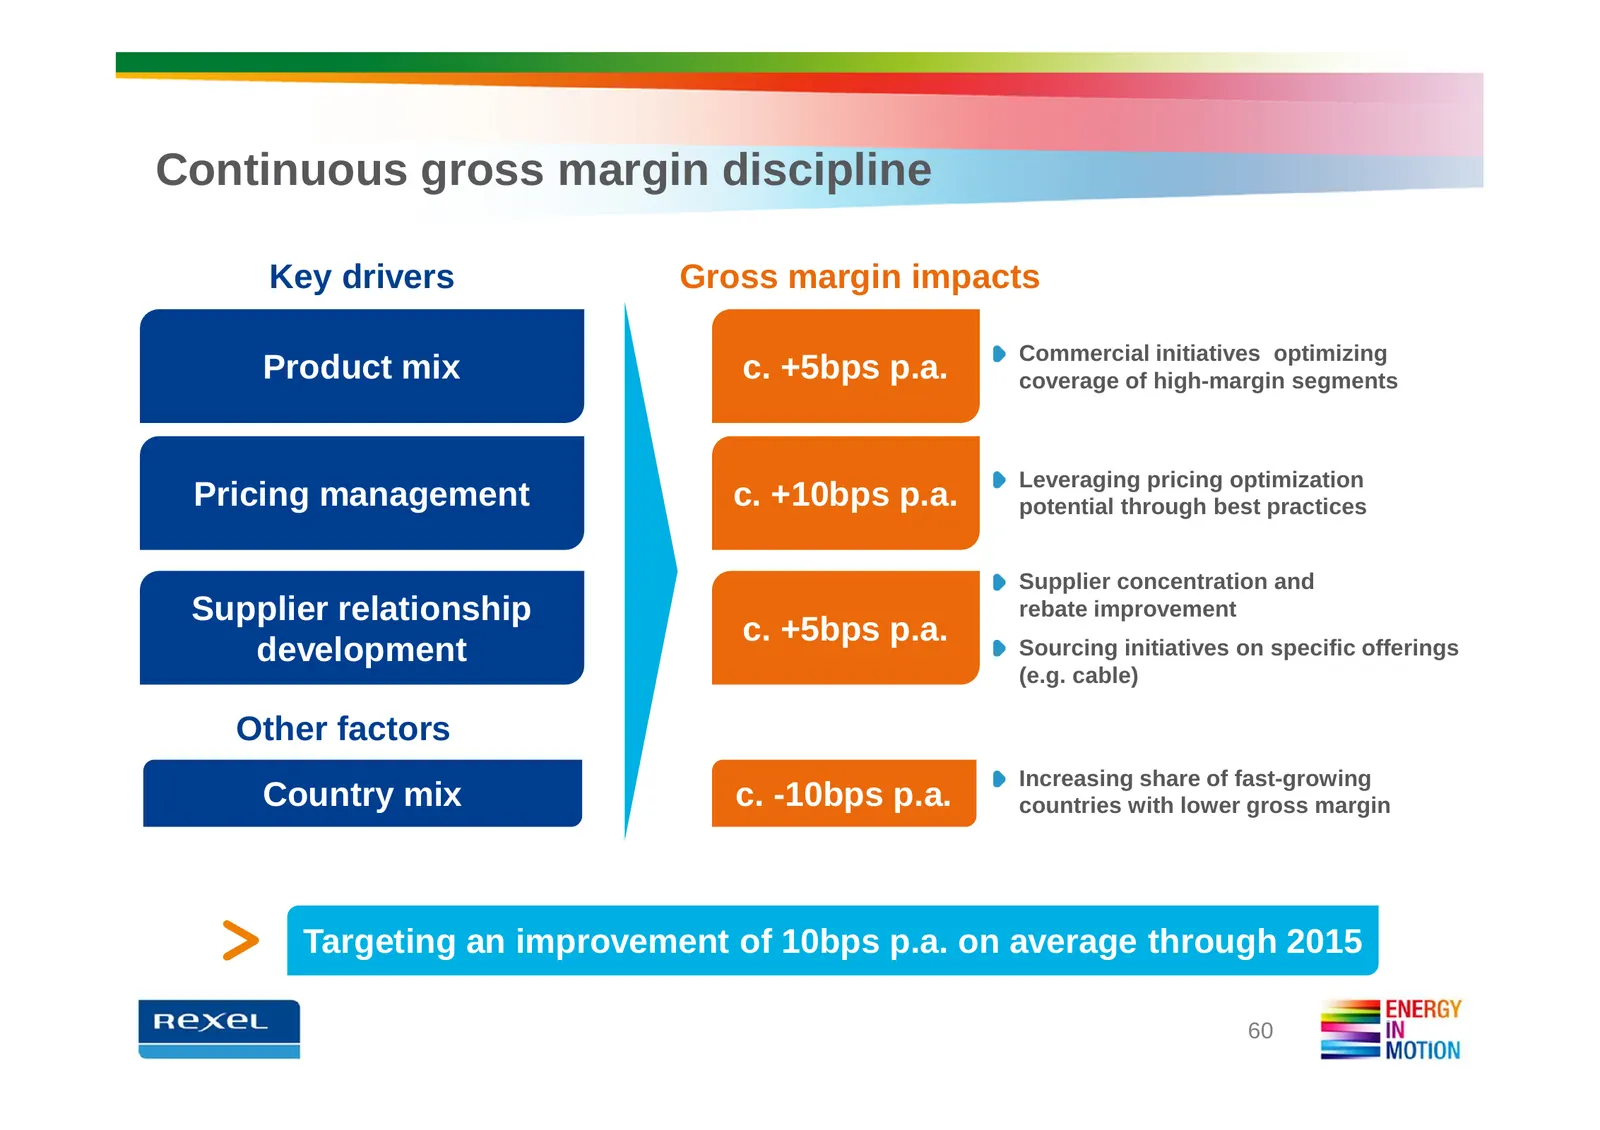
Slide 60: Continuous gross margin discipline
Continuous gross margin discipline Key drivers Gross margin impacts Commercial initiatives optimizing Product mix c. +5bps p.a. coverage of high-margin segments Leveraging pricing optimization Pricing management c. +10bps p.a. potential through best practices Supplier concentration and Supplier rela
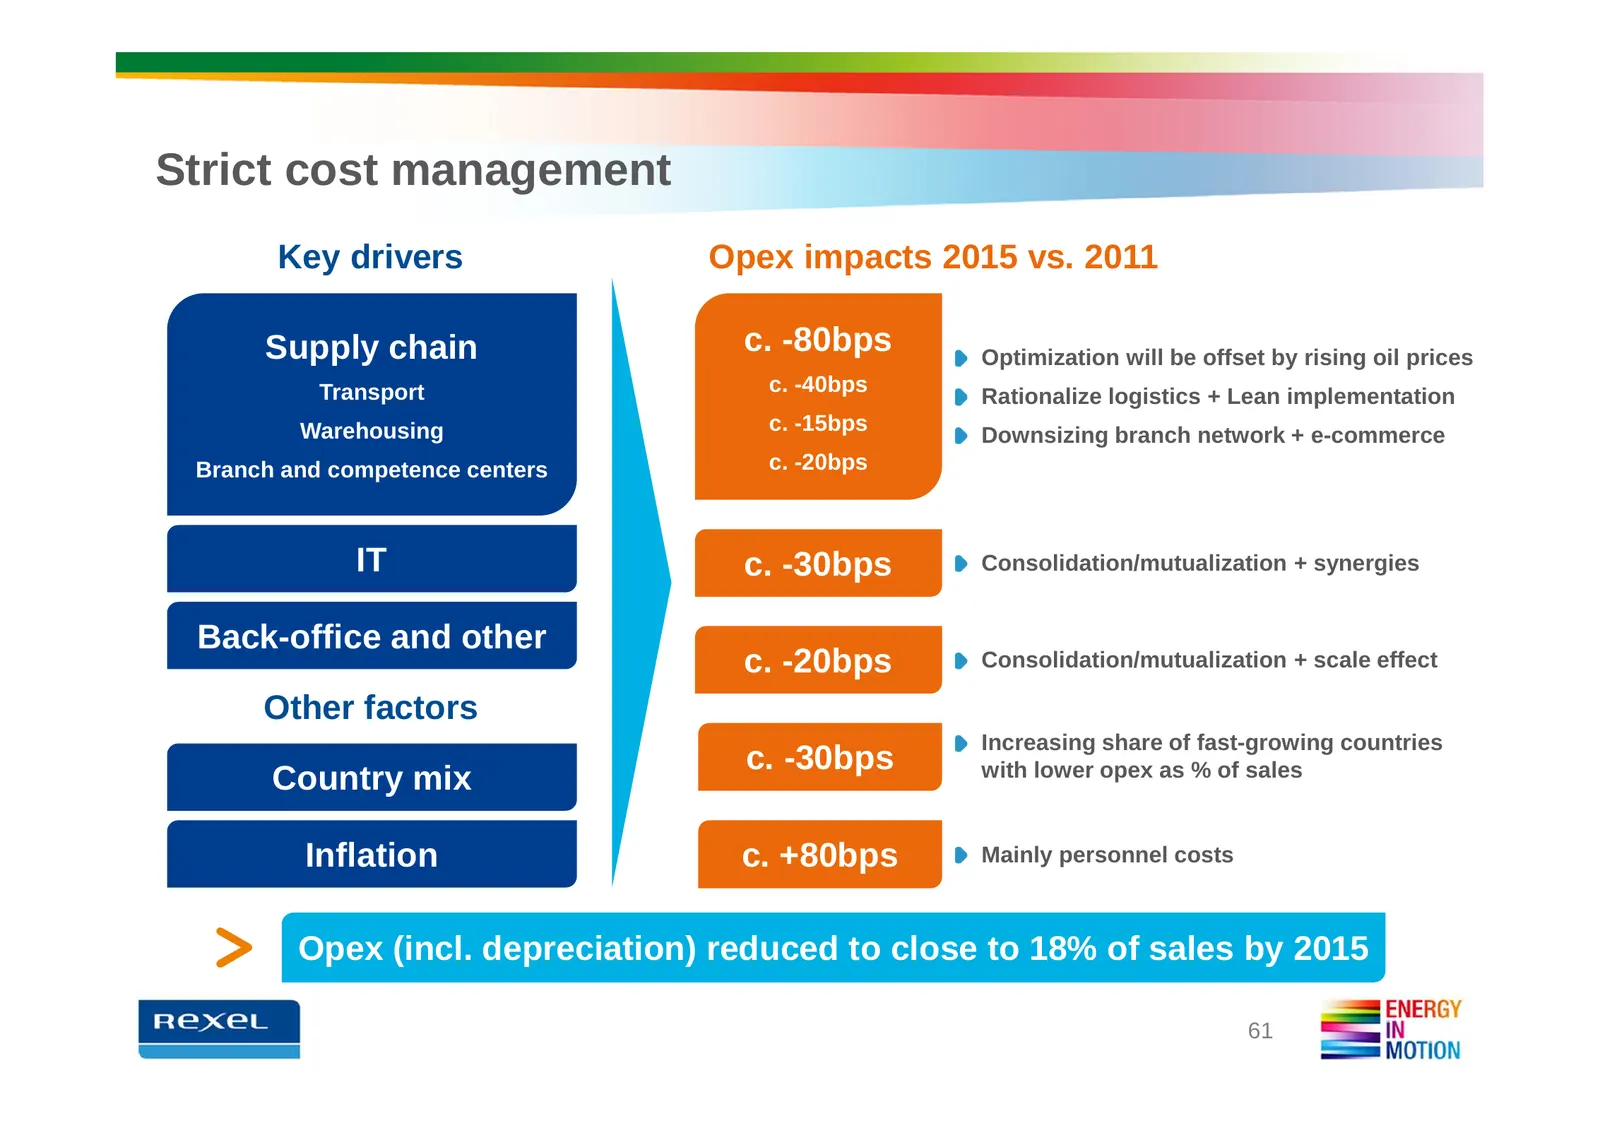
Slide 61: Strict cost management
Strict cost management Key drivers Opex impacts 2015 vs. 2011 Supply chain c. -80bps Optimization will be offset by rising oil prices Transport c. -40bps Rationalize logistics + Lean implementation Warehousing c. -15bps Downsizing branch network + e-commerce Branch and competence centers c. -20bps I
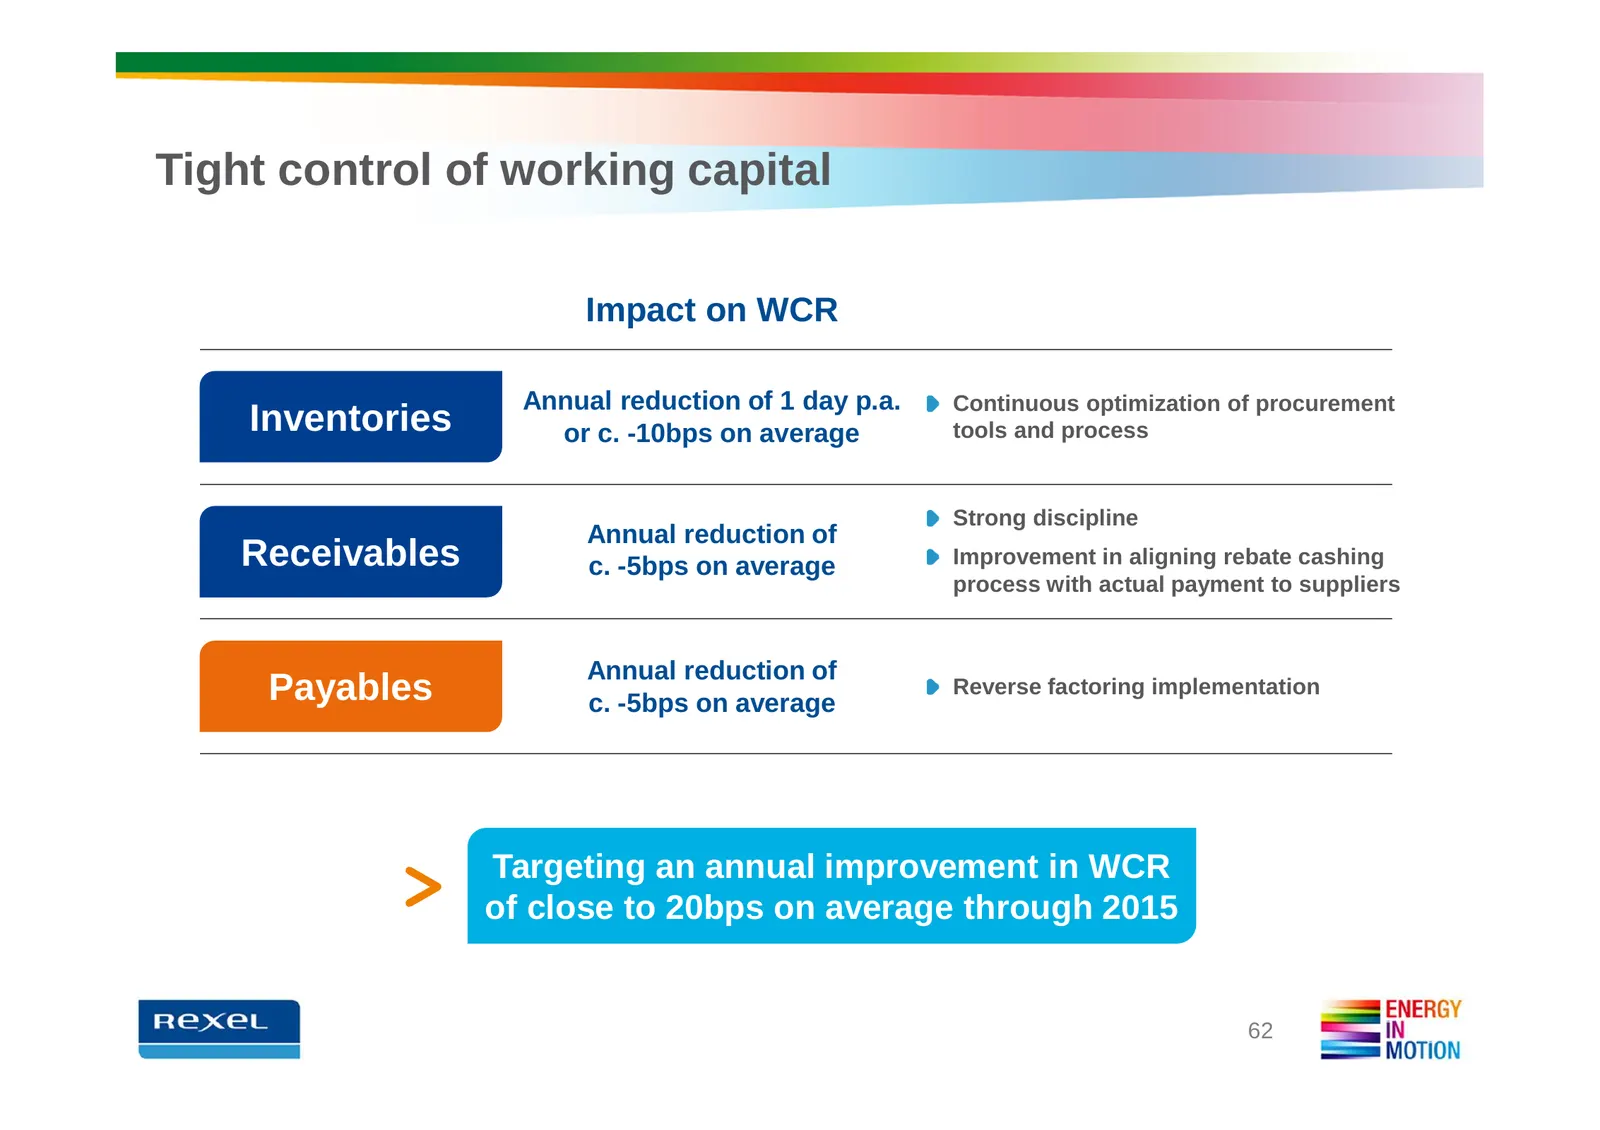
Slide 62: Tight control of working capital
Tight control of working capital Impact on WCR Annual reduction of 1 day p.a. Continuous optimization of procurement Inventories or c. -10bps on average tools and process Strong discipline Annual reduction of Receivables c. -5bps on average Improvement in aligning rebate cashing process with actual
Slide 63: Solid cash-flow generation
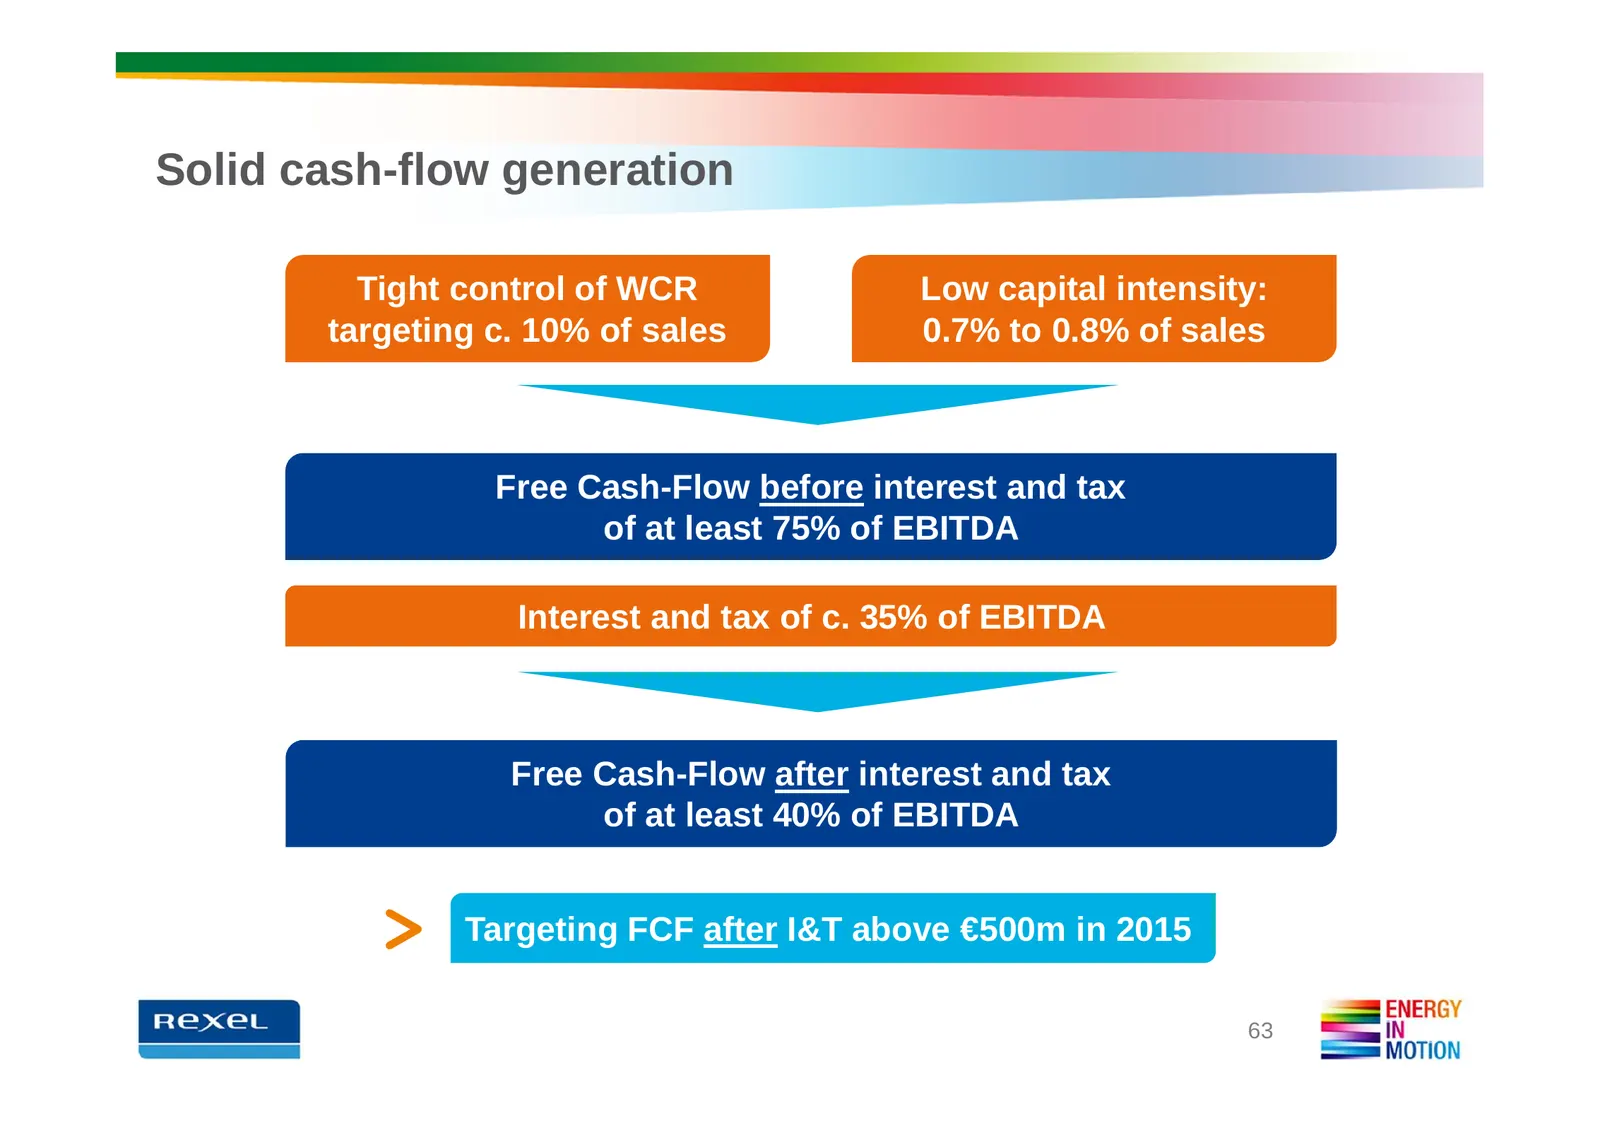
Solid cash-flow generation Tight control of WCR Low capital intensity: targeting c. 10% of sales 0.7% to 0.8% of sales Free Cash-Flow before interest and tax of at least 75% of EBITDA Interest and tax of c. 35% of EBITDA Free Cash-Flow after interest and tax of at least 40% of EBITDA Targeting FCF a
Slide 64: Improved flexibility through a three-pronged financial strategy
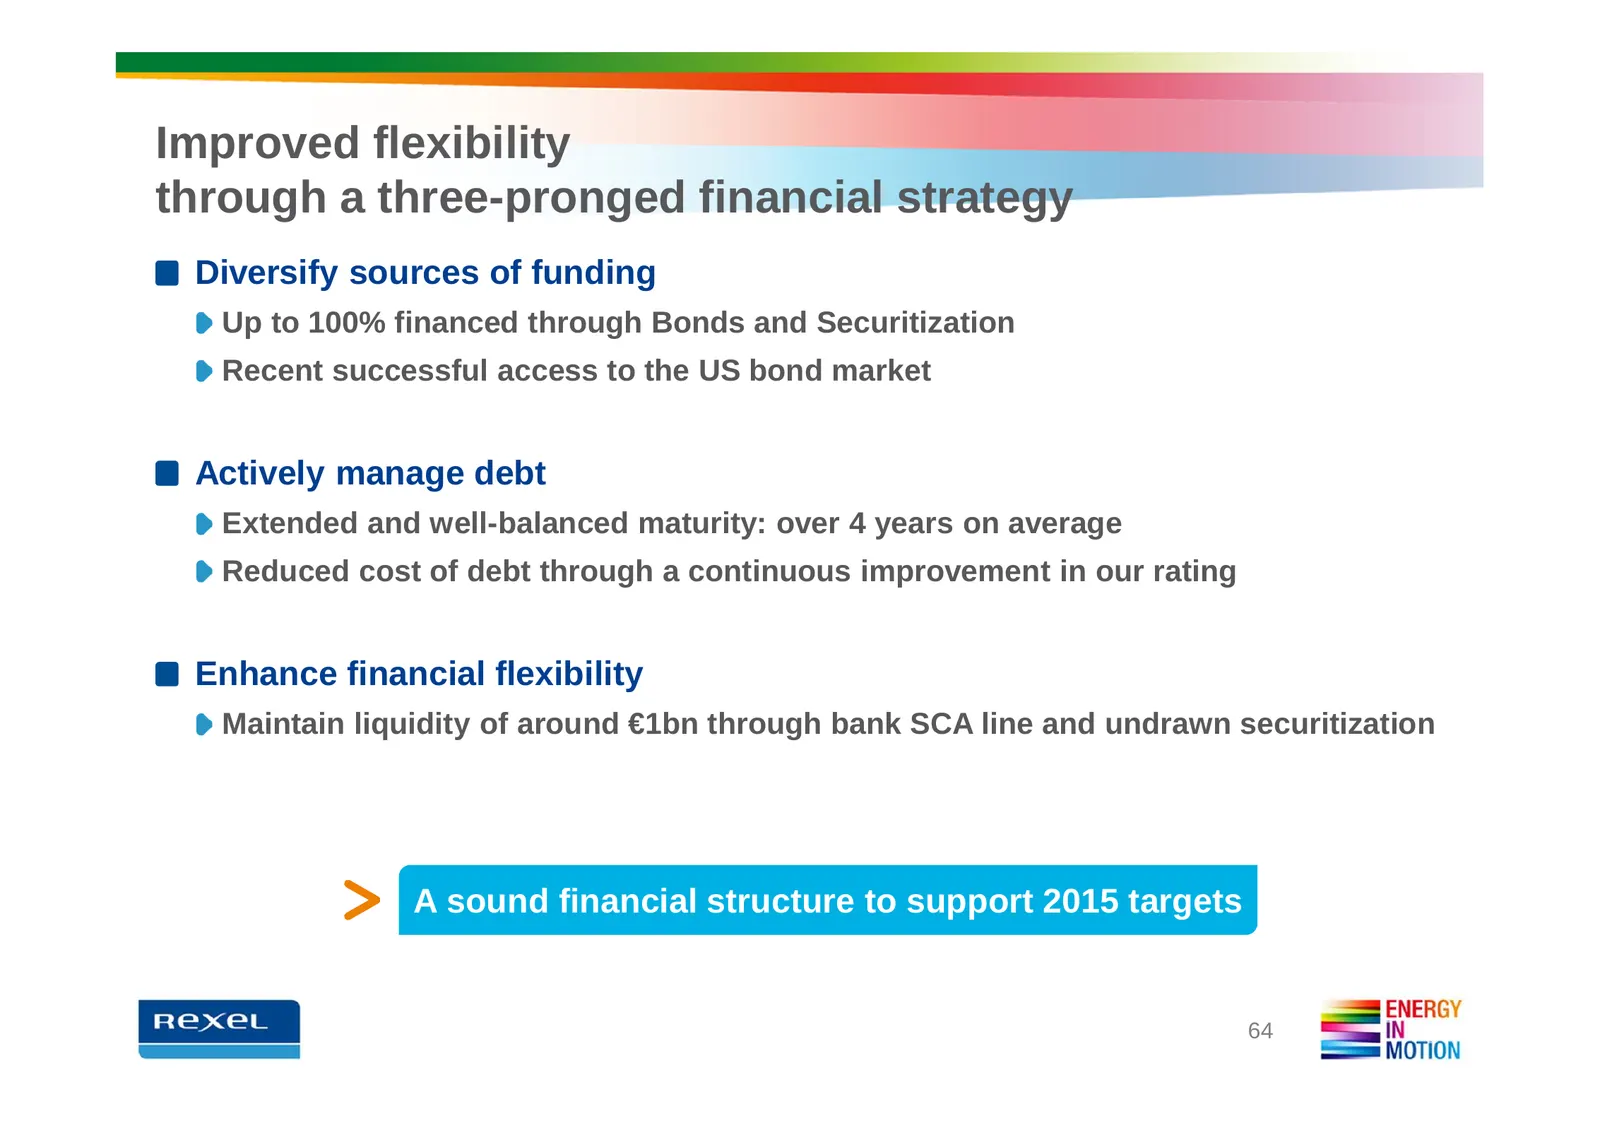
Improved flexibility through a three-pronged financial strategy Diversify sources of funding Up to 100% financed through Bonds and Securitization Recent successful access to the US bond market Actively manage debt Extended and well-balanced maturity: over 4 years on average Reduced cost of debt thro
Slide 65: 2015 Financial Targets
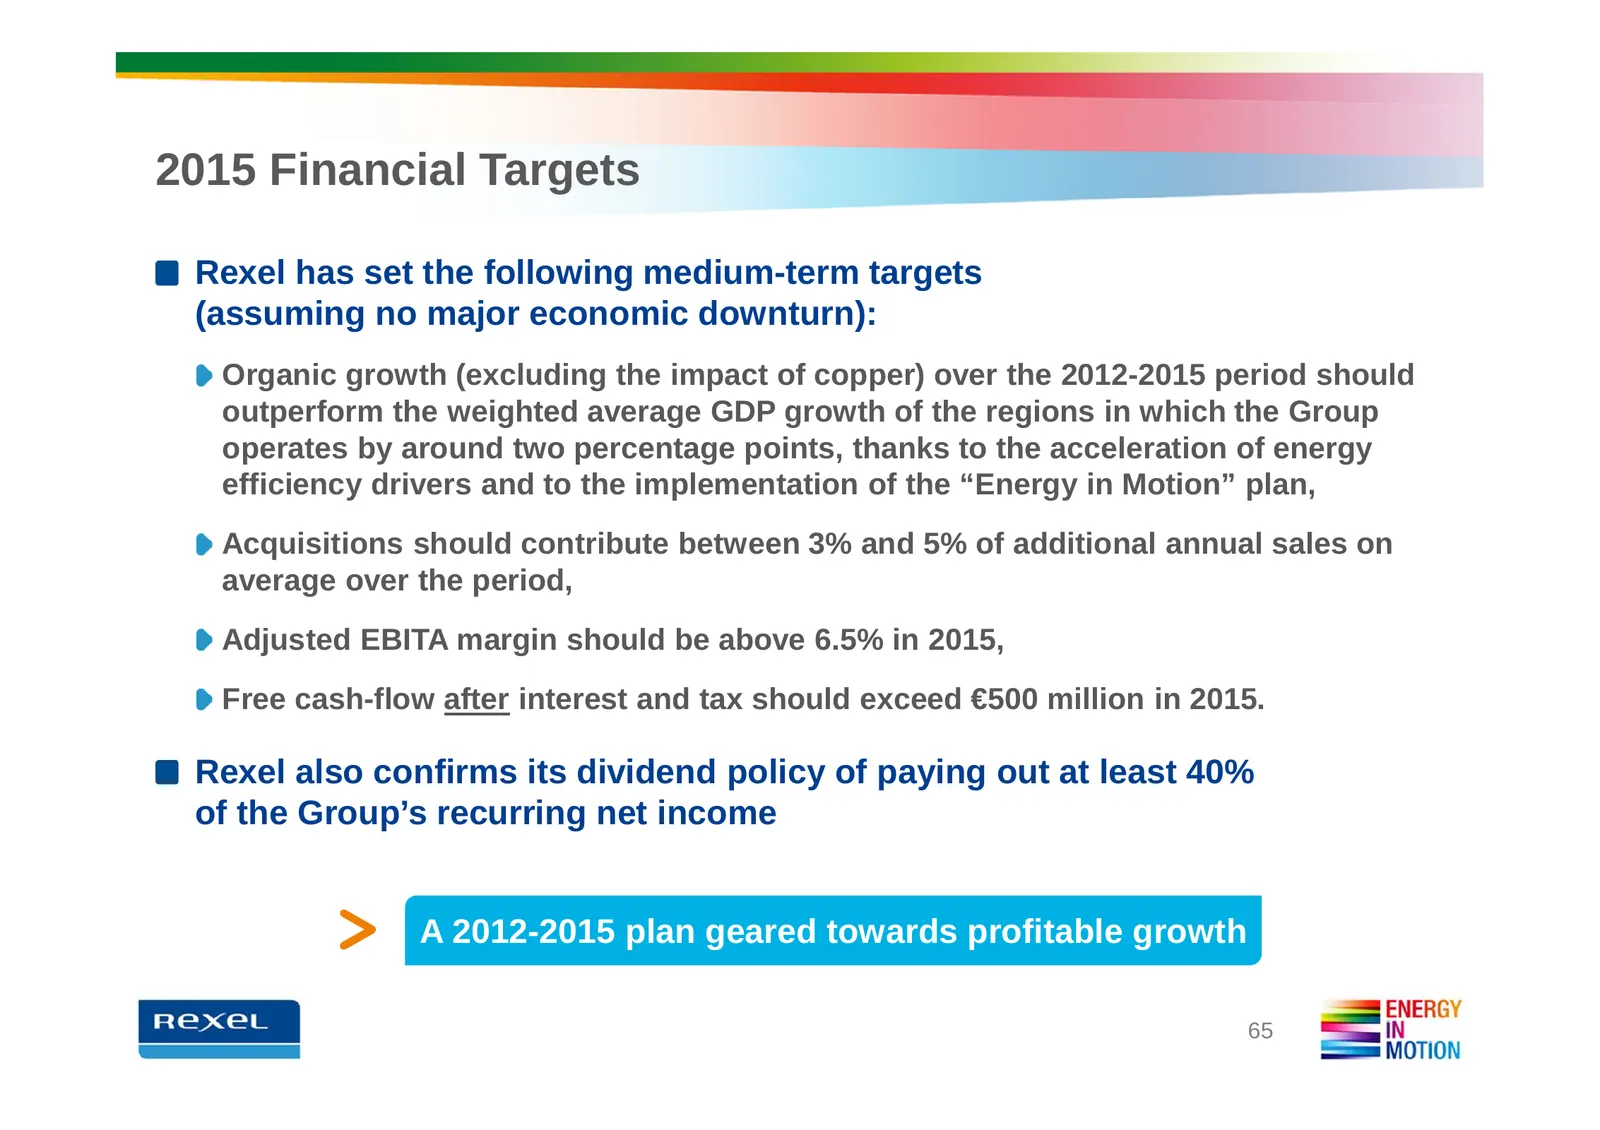
2015 Financial Targets Rexel has set the following medium-term targets (assuming no major economic downturn): Organic growth (excluding the impact of copper) over the 2012-2015 period should outperform the weighted average GDP growth of the regions in which the Group operates by around two percentag
Slide 66: Appendices
Rexel has elected for early adoption of revised IAS 19 “Employee Benefits” following its endorsement by EU on June 6th, 2012. The early adoption of this amendment improves information of the Group’s financial situation, in APPENDICES particular the presentation in the financial statements of the sur
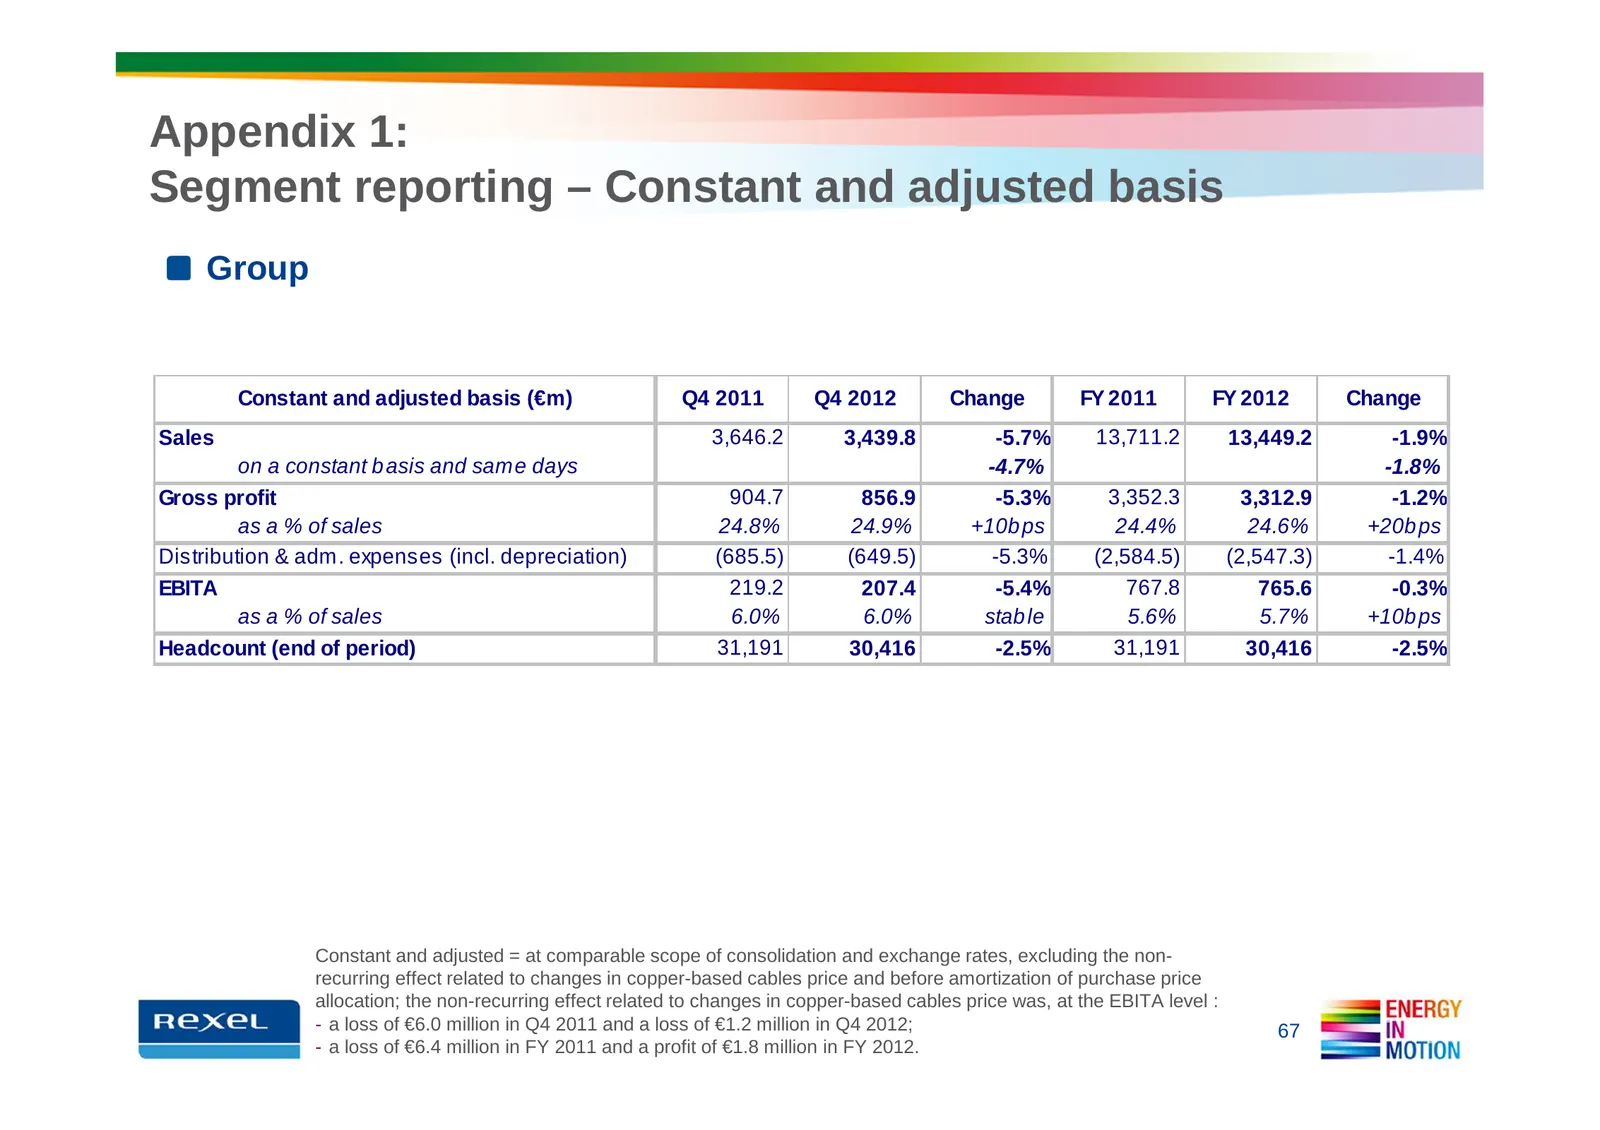
Slide 67: Appendix 1: Segment reporting – Group
Appendix 1: Segment reporting – Constant and adjusted basis Group Constant and adjusted basis (€m) Q4 2011 Q4 2012 Change FY 2011 FY 2012 Change Sales 3,646.2 3,439.8 -5.7% 13,711.2 13,449.2 -1.9% on a constant b asis and same days -4.7% -1.8% Gross profit 904.7 856.9 -5.3% 3,352.3 3,312.9 -1.2% as
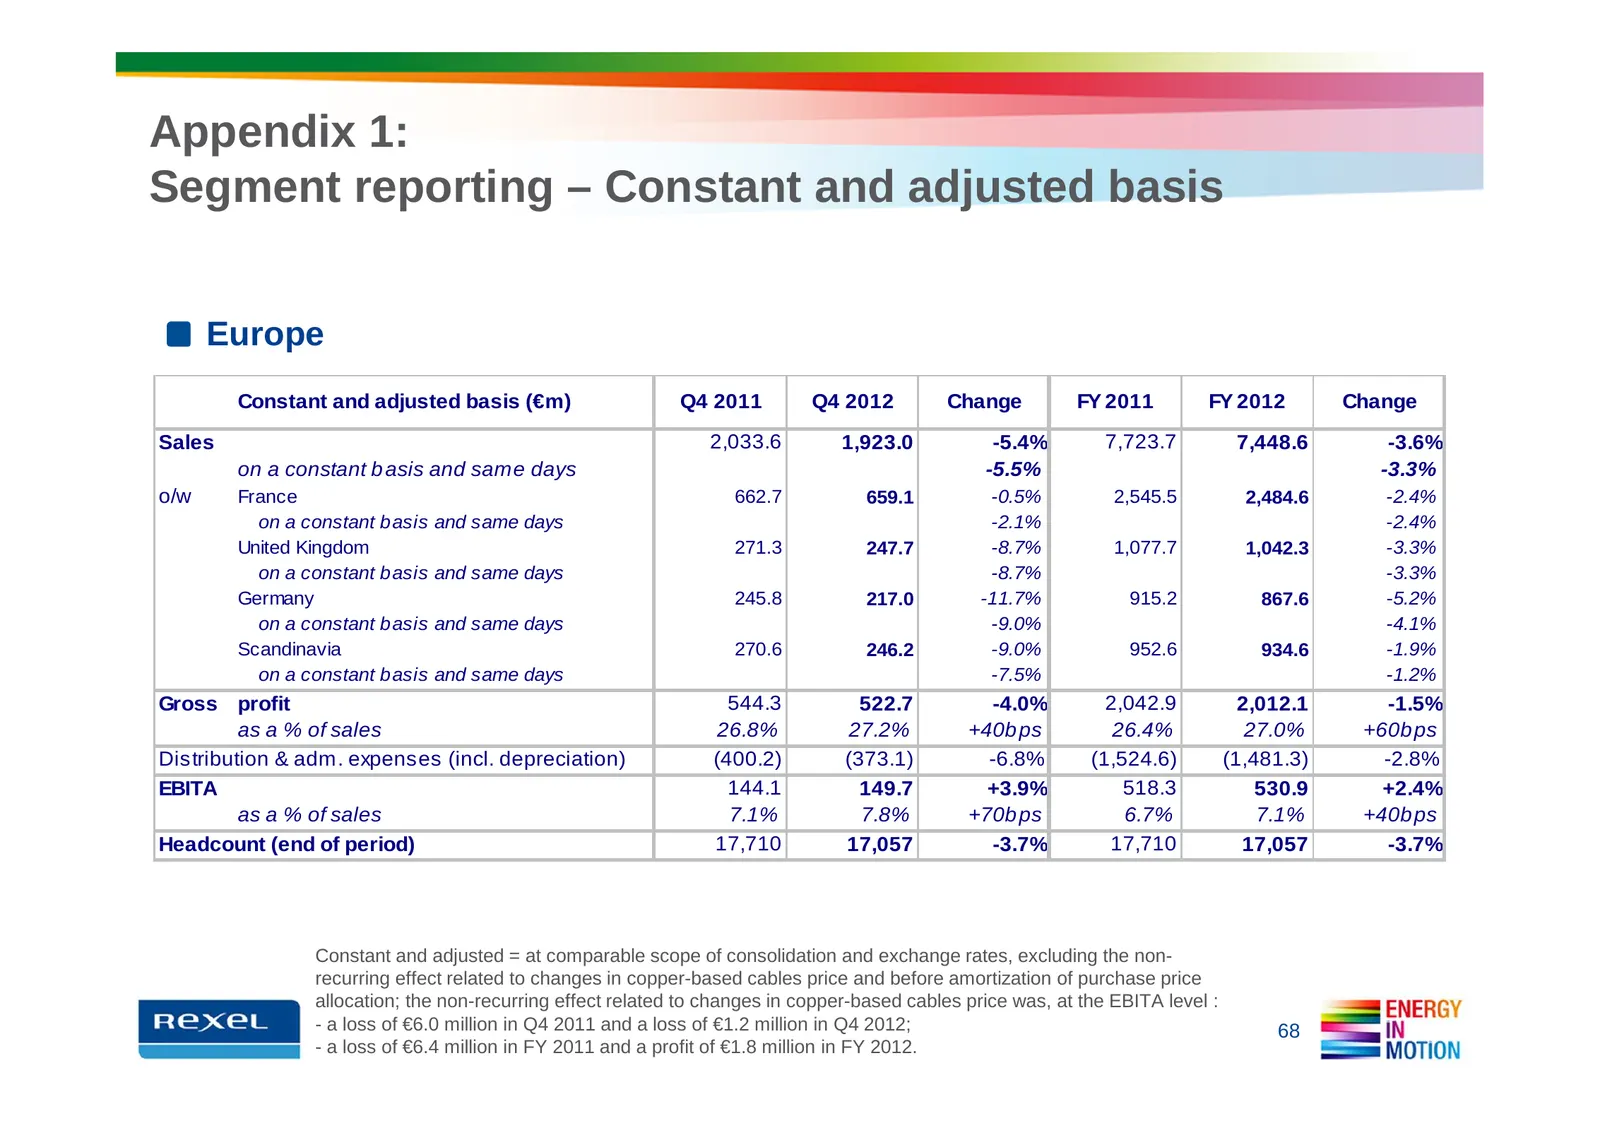
Slide 68: Appendix 1: Segment reporting – Europe
Appendix 1: Segment reporting – Constant and adjusted basis Europe Constant and adjusted basis (€m) Q4 2011 Q4 2012 Change FY 2011 FY 2012 Change Sales 2,033.6 1,923.0 -5.4% 7,723.7 7,448.6 -3.6% on a constant b asis and same days -5.5% -3.3% o/w France 662.7 659.1 -0.5% 2,545.5 2,484.6 -2.4% on a c
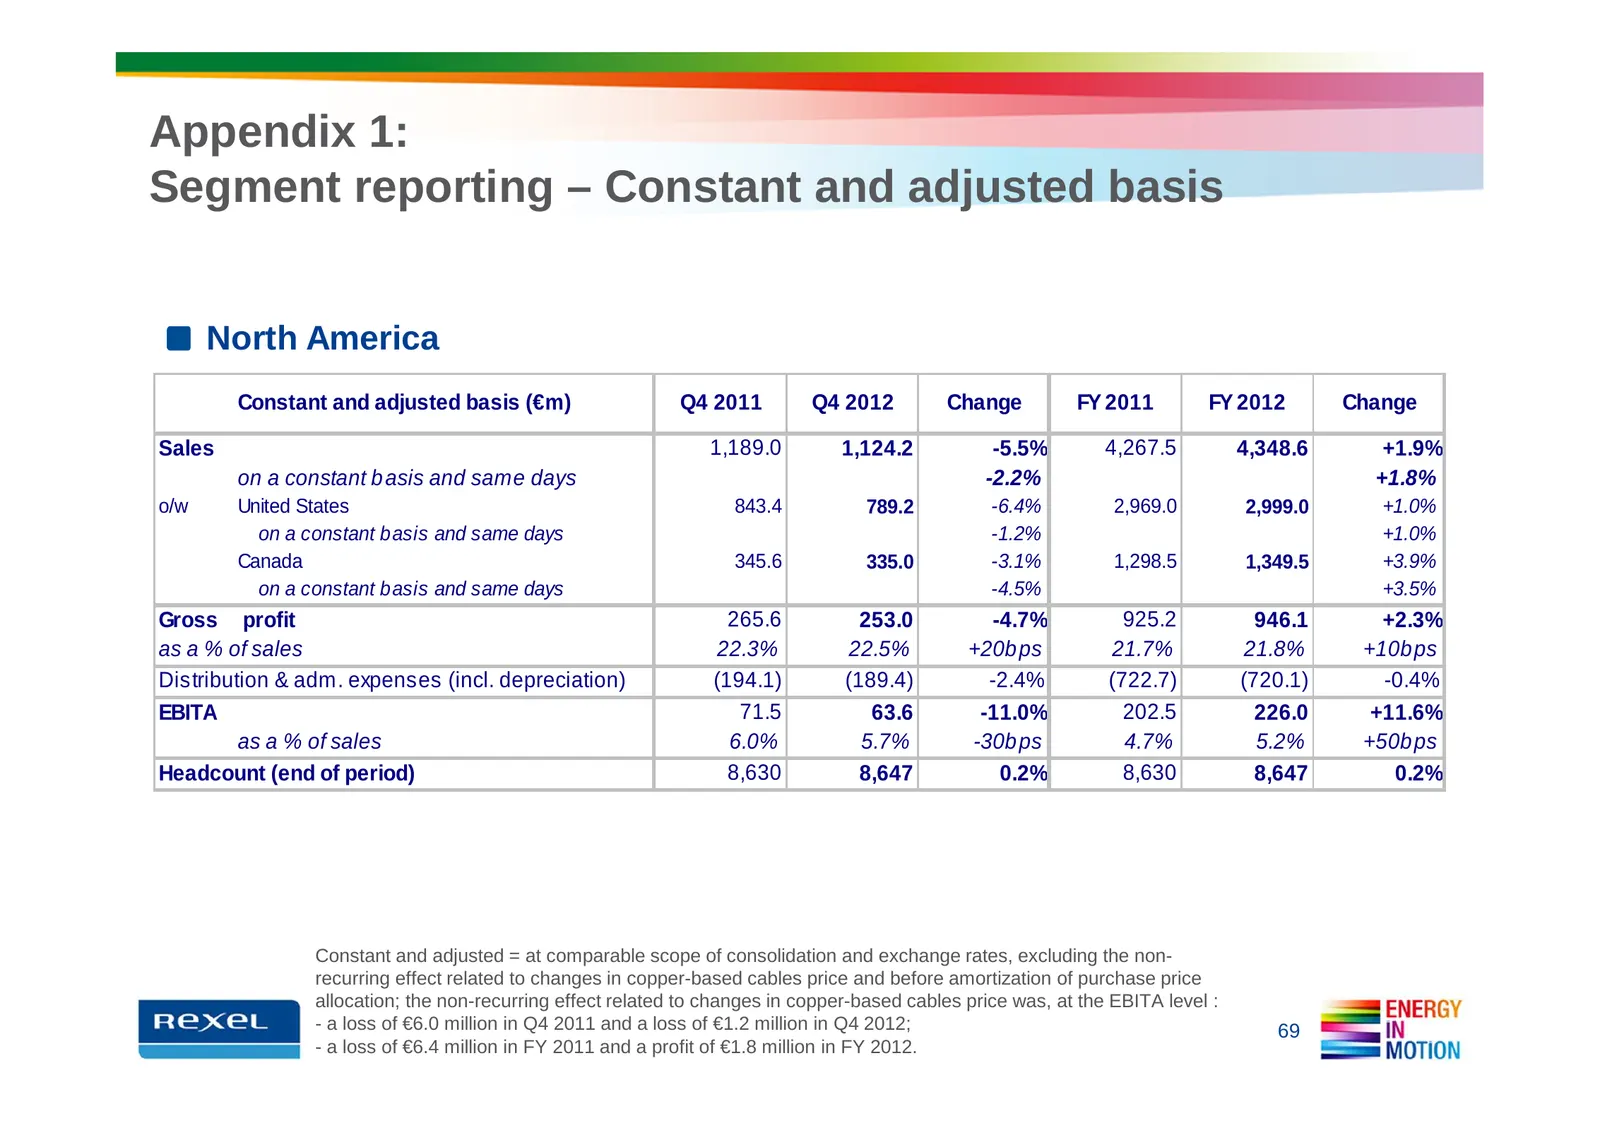
Slide 69: Appendix 1: Segment reporting – North America
Appendix 1: Segment reporting – Constant and adjusted basis North America Constant and adjusted basis (€m) Q4 2011 Q4 2012 Change FY 2011 FY 2012 Change Sales 1,189.0 1,124.2 -5.5% 4,267.5 4,348.6 +1.9% on a constant b asis and same days -2.2% +1.8% o/w United States 843.4 789.2 -6.4% 2,969.0 2,999.
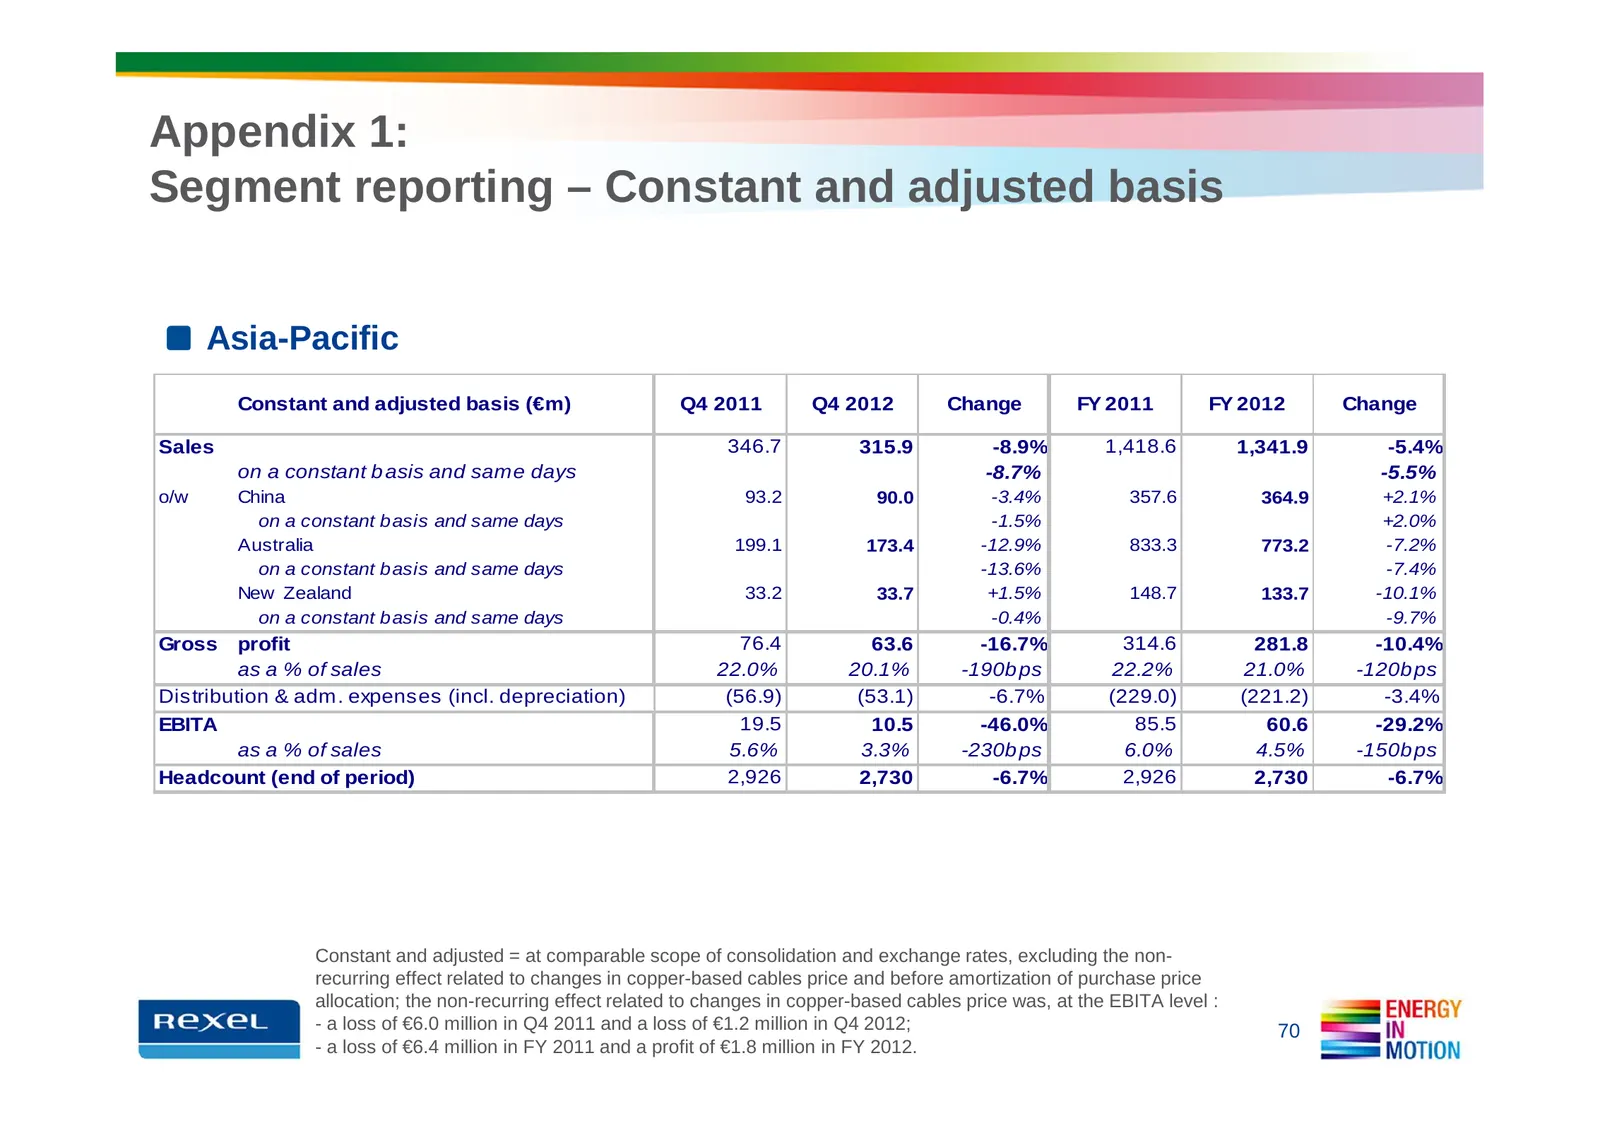
Slide 70: Appendix 1: Segment reporting – Asia-Pacific
Appendix 1: Segment reporting – Constant and adjusted basis Asia-Pacific Constant and adjusted basis (€m) Q4 2011 Q4 2012 Change FY 2011 FY 2012 Change Sales 346.7 315.9 -8.9% 1,418.6 1,341.9 -5.4% on a constant b asis and same days -8.7% -5.5% o/w China 93.2 90.0 -3.4% 357.6 364.9 +2.1% on a consta
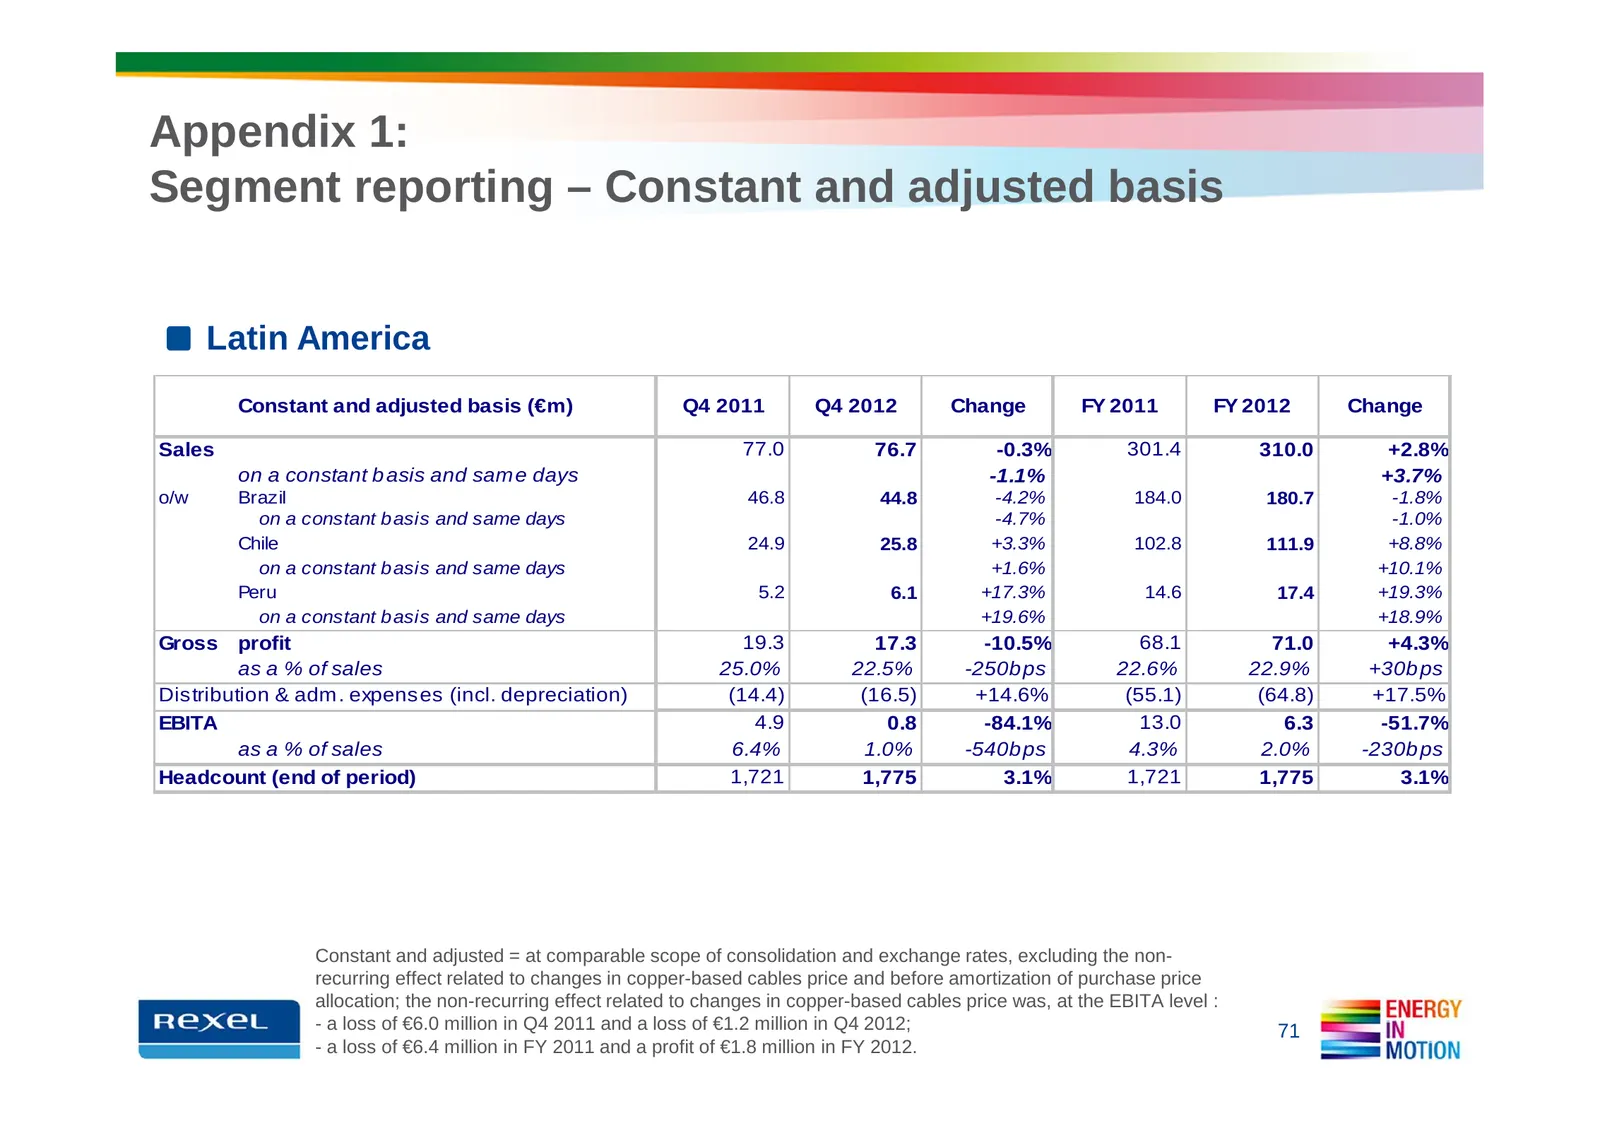
Slide 71: Appendix 1: Segment reporting – Latin America
Appendix 1: Segment reporting – Constant and adjusted basis Latin America Constant and adjusted basis (€m) Q4 2011 Q4 2012 Change FY 2011 FY 2012 Change Sales 77.0 76.7 -0.3% 301.4 310.0 +2.8% on a constant b asis and sam e days -1.1% +3.7% o/w Brazil 46.8 44.8 -4.2% 184.0 180.7 -1.8% on a constant
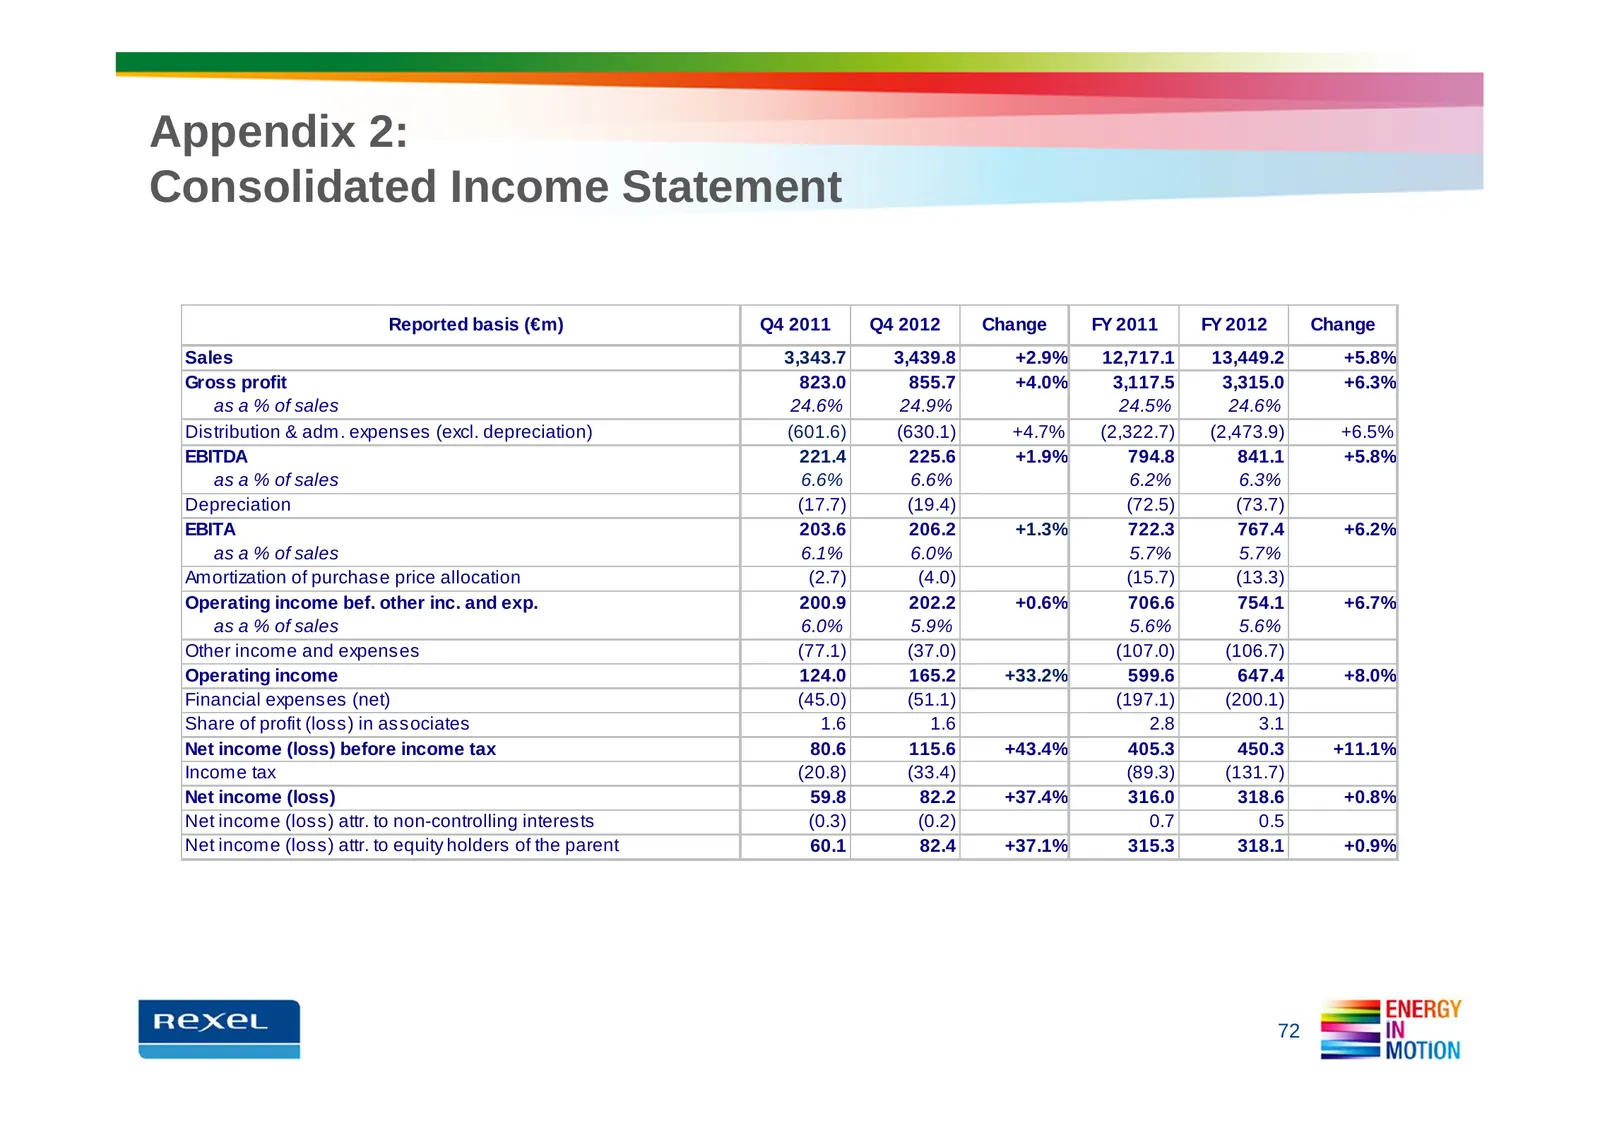
Slide 72: Appendix 2: Consolidated Income Statement
Appendix 2: Consolidated Income Statement Reported basis (€m) Q4 2011 Q4 2012 Change FY 2011 FY 2012 Change Sales 3,343.7 3,439.8 +2.9% 12,717.1 13,449.2 +5.8% Gross profit 823.0 855.7 +4.0% 3,117.5 3,315.0 +6.3% as a % of sales 24.6% 24.9% 24.5% 24.6% Distribution & adm. expenses (excl. depreciatio
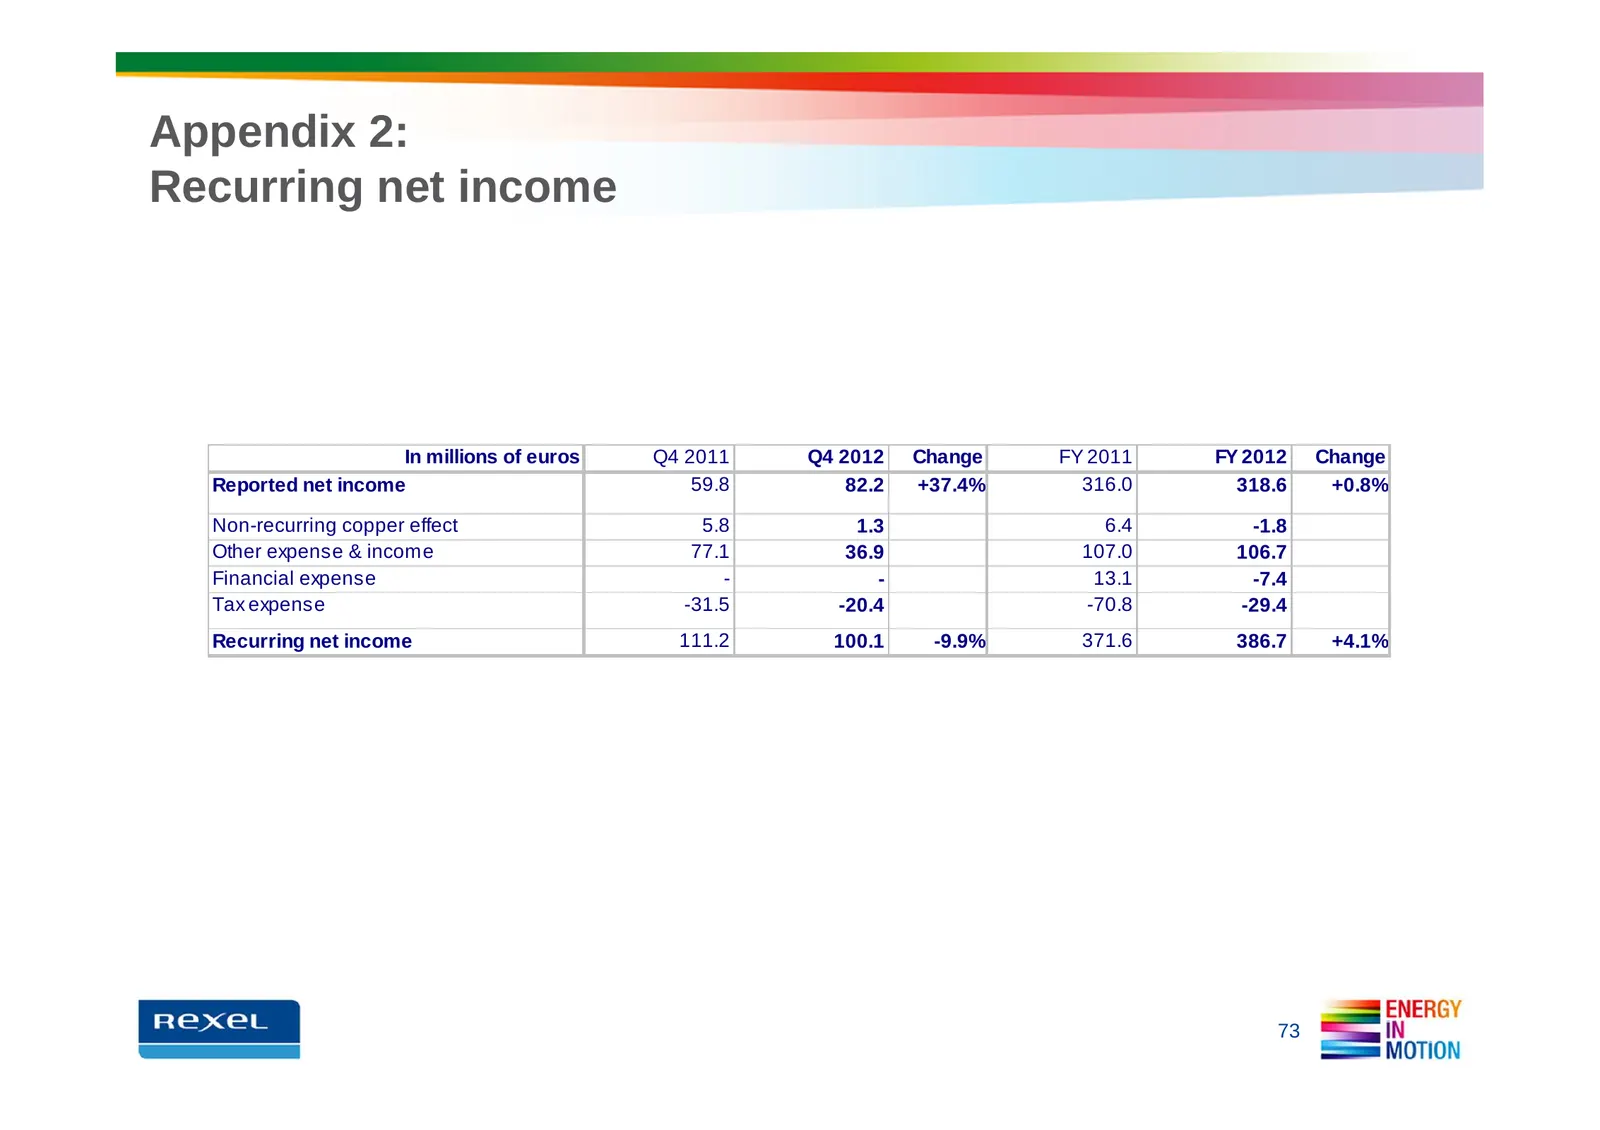
Slide 73: Appendix 2: Recurring net income
Appendix 2: Recurring net income In millions of euros Q4 2011 Q4 2012 Change FY 2011 FY 2012 Change Reported net income 59.8 82.2 +37.4% 316.0 318.6 +0.8% Non-recurring copper effect 5.8 1.3 6.4 -1.8 Other expense & income 77.1 36.9 107.0 106.7 Financial expense - - 13.1 -7.4 Tax expense -31.5 -20.4
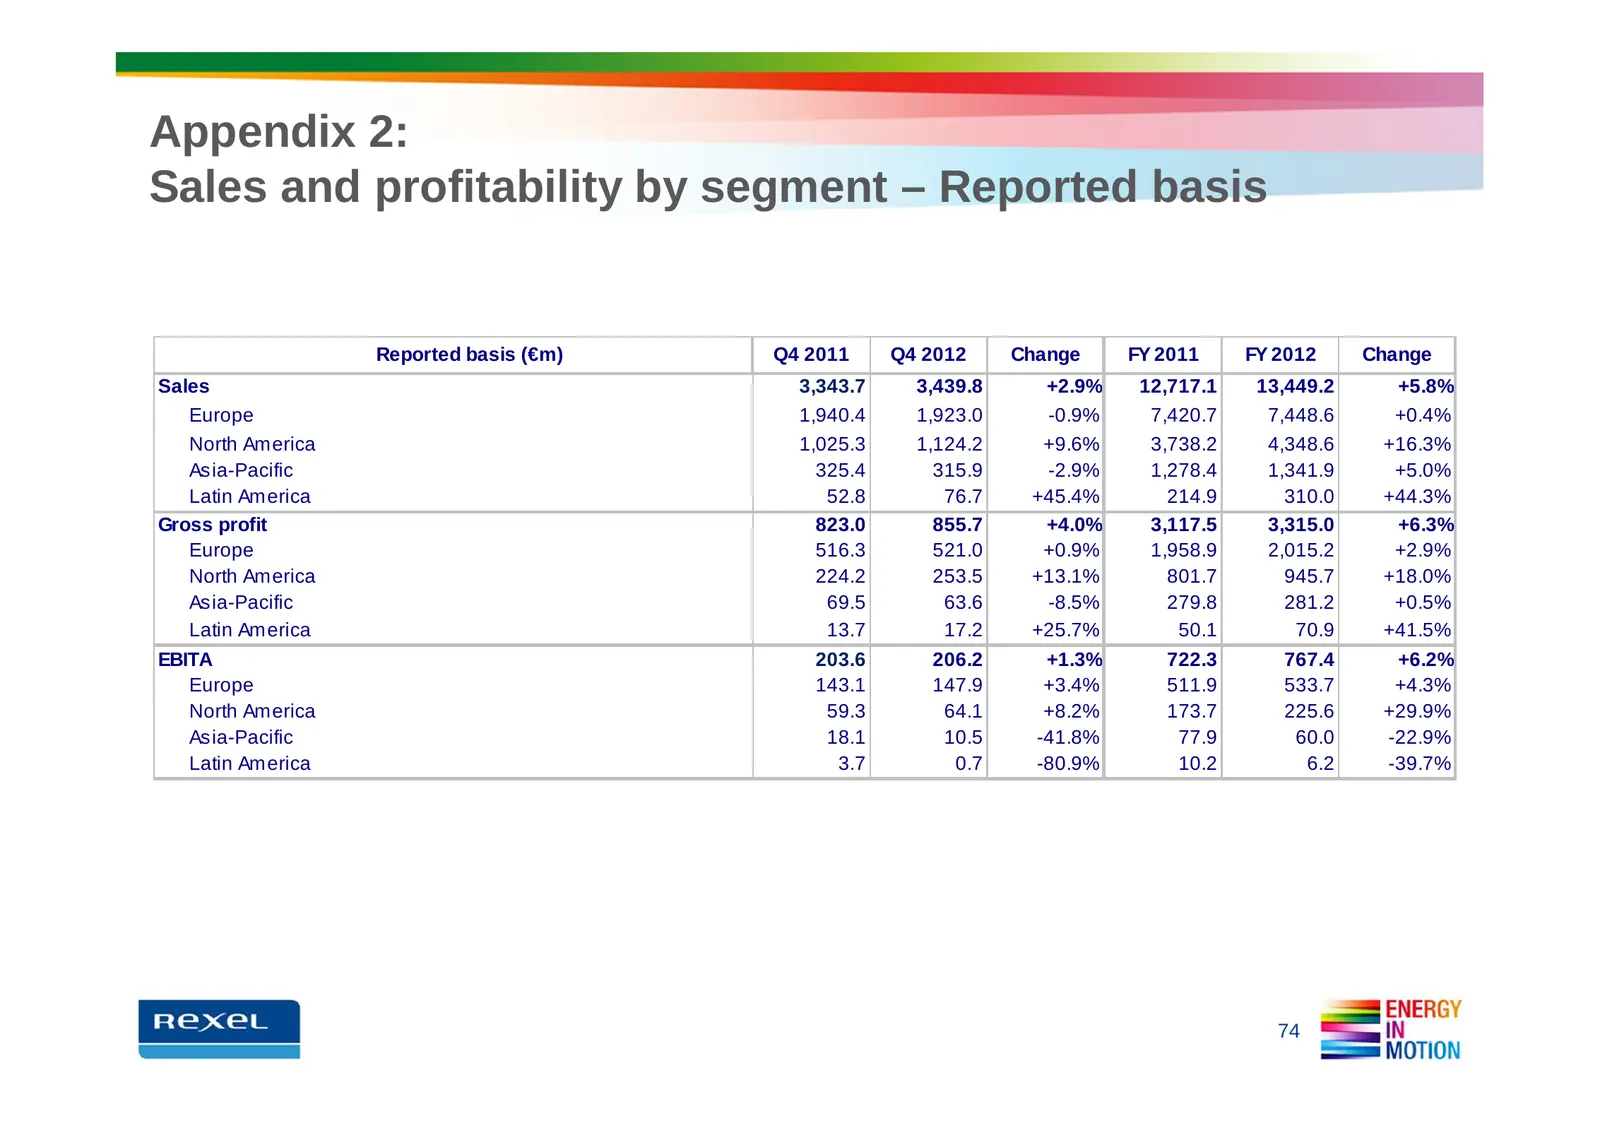
Slide 74: Appendix 2: Sales and profitability by segment – Reported basis
Appendix 2: Sales and profitability by segment – Reported basis Reported basis (€m) Q4 2011 Q4 2012 Change FY 2011 FY 2012 Change Sales 3,343.7 3,439.8 +2.9% 12,717.1 13,449.2 +5.8% Europe 1,940.4 1,923.0 -0.9% 7,420.7 7,448.6 +0.4% North America 1,025.3 1,124.2 +9.6% 3,738.2 4,348.6 +16.3% Asia-Pac
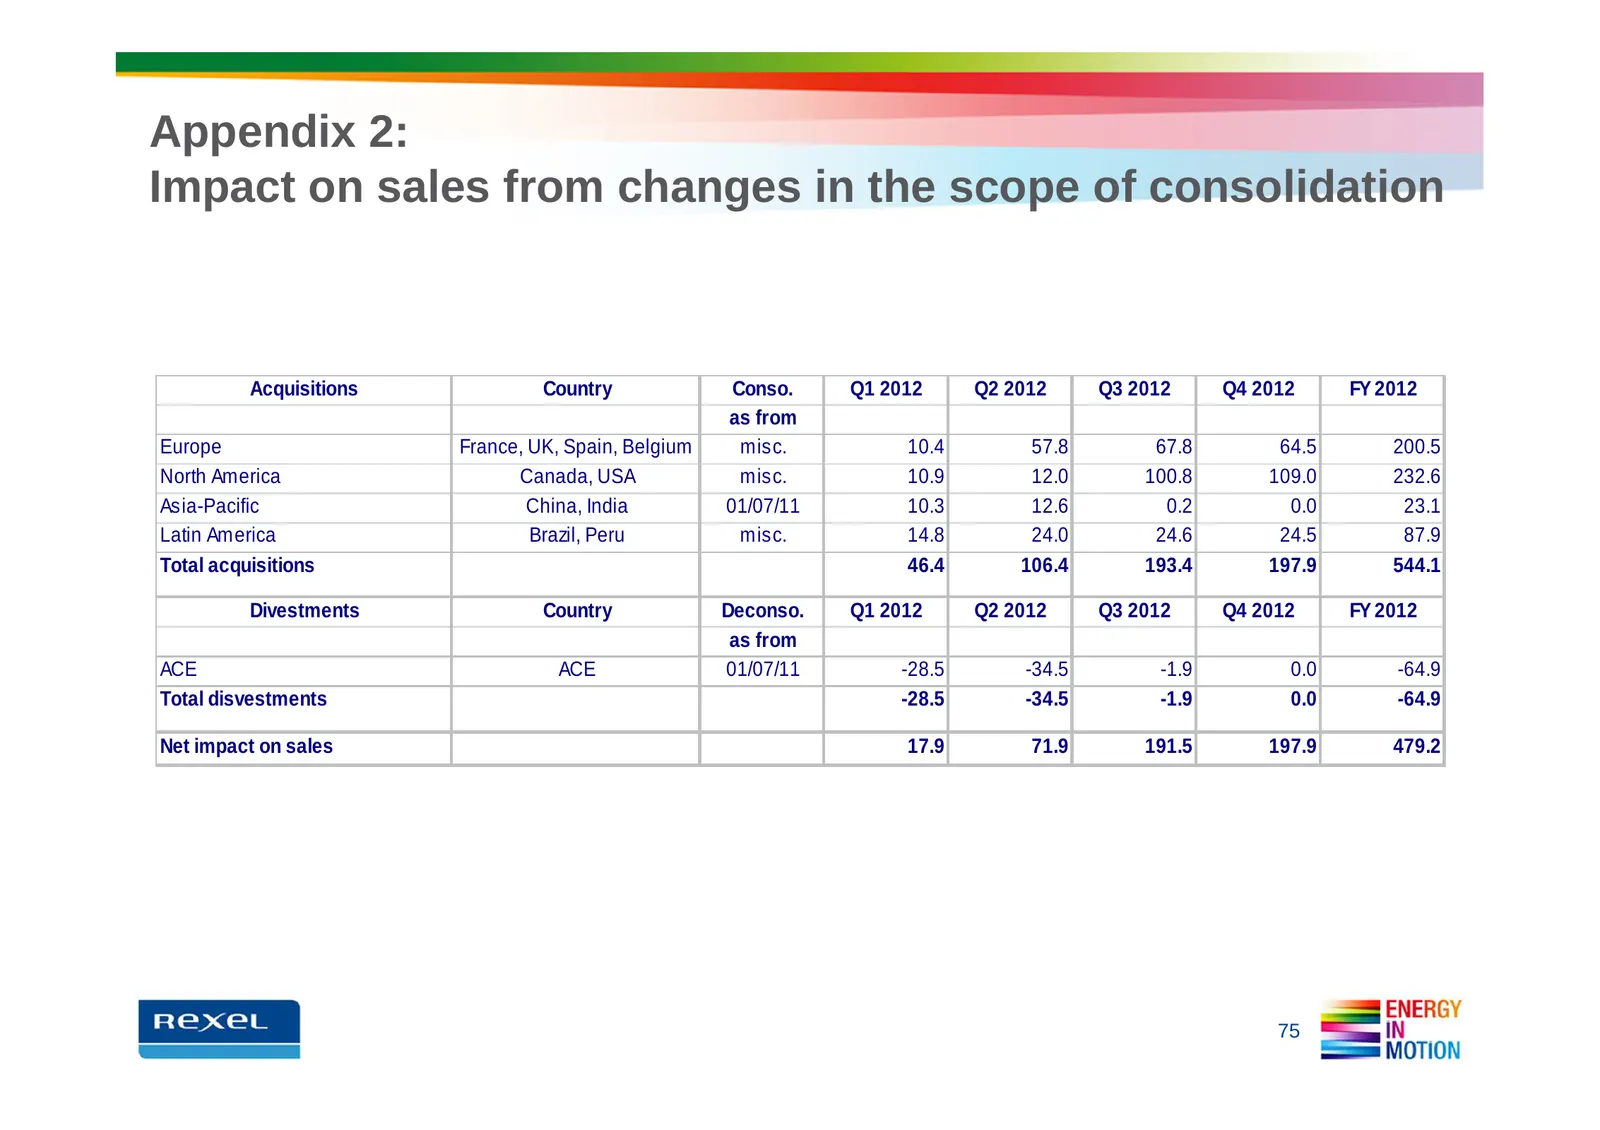
Slide 75: Appendix 2: Impact on sales from changes in scope of consolidation
Appendix 2: Impact on sales from changes in the scope of consolidation Acquisitions Country Conso. Q1 2012 Q2 2012 Q3 2012 Q4 2012 FY 2012 as from Europe France, UK, Spain, Belgium misc. 10.4 57.8 67.8 64.5 200.5 North America Canada, USA misc. 10.9 12.0 100.8 109.0 232.6 Asia-Pacific China, India 0
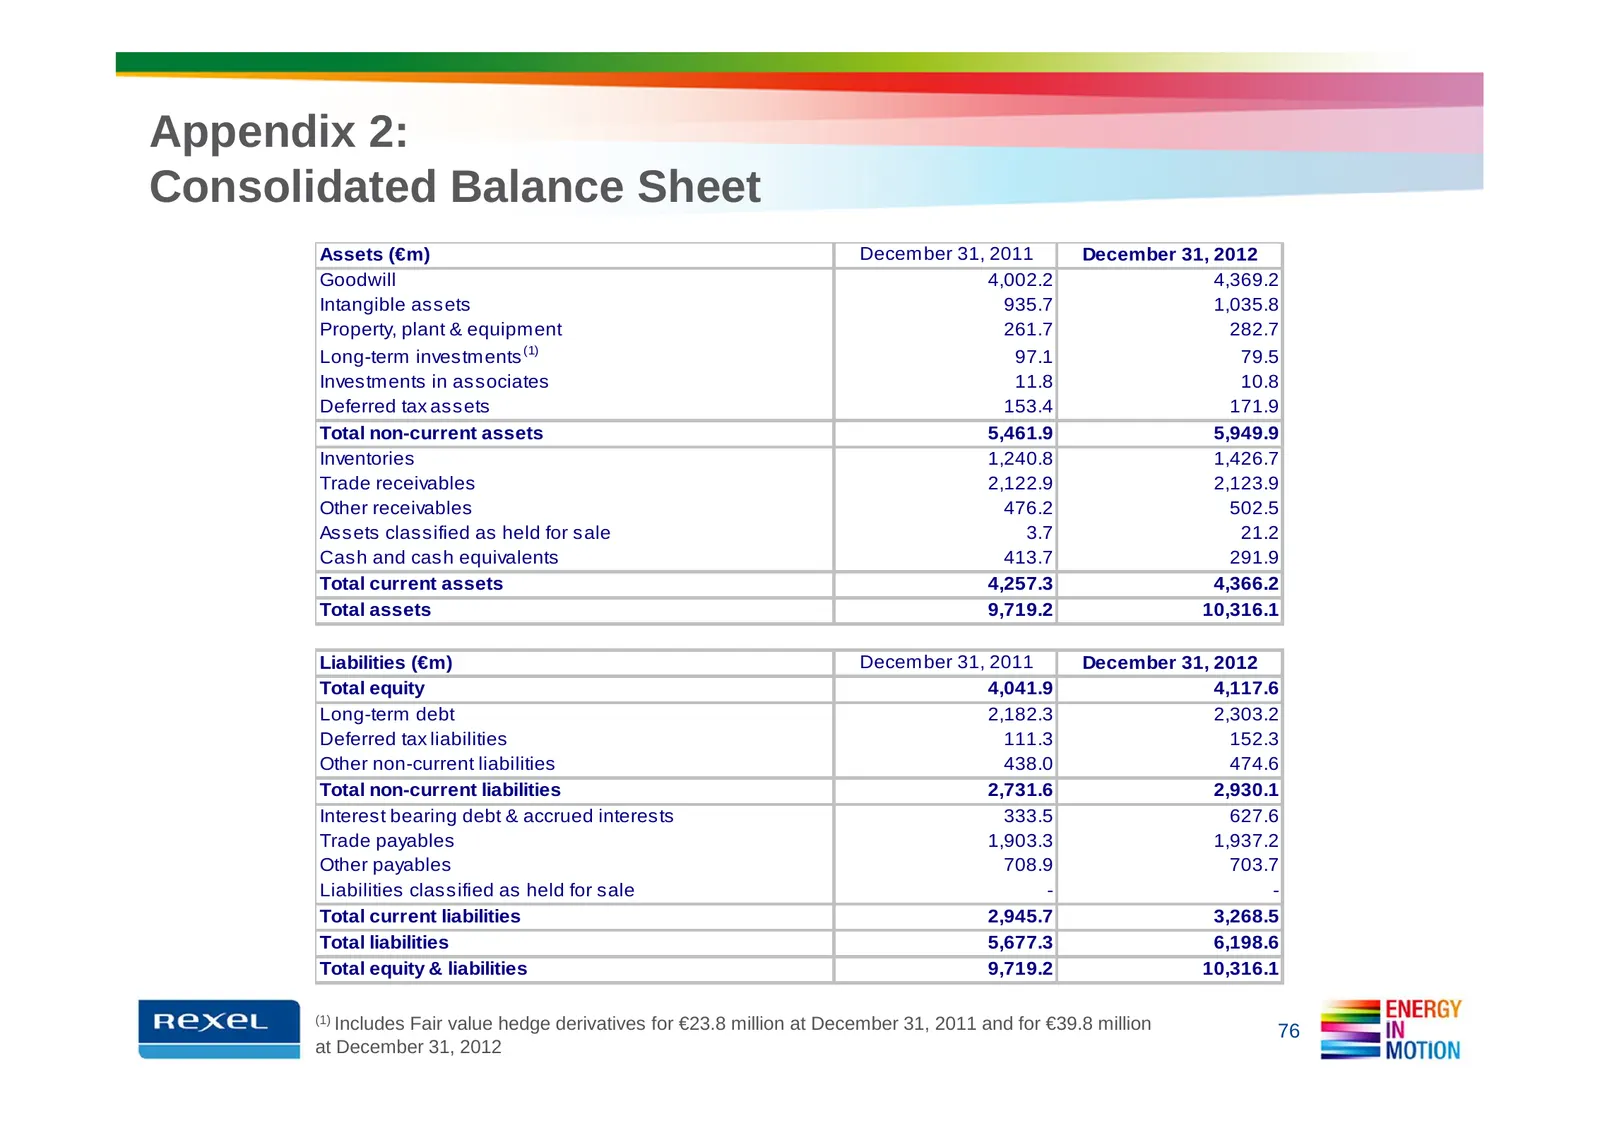
Slide 76: Appendix 2: Consolidated Balance Sheet
Appendix 2: Consolidated Balance Sheet Assets (€m) December 31, 2011 December 31, 2012 Goodwill 4,002.2 4,369.2 Intangible assets 935.7 1,035.8 Property, plant & equipment 261.7 282.7 Long-term investments (1) 97.1 79.5 Investments in associates 11.8 10.8 Deferred tax assets 153.4 171.9 Total non-cu
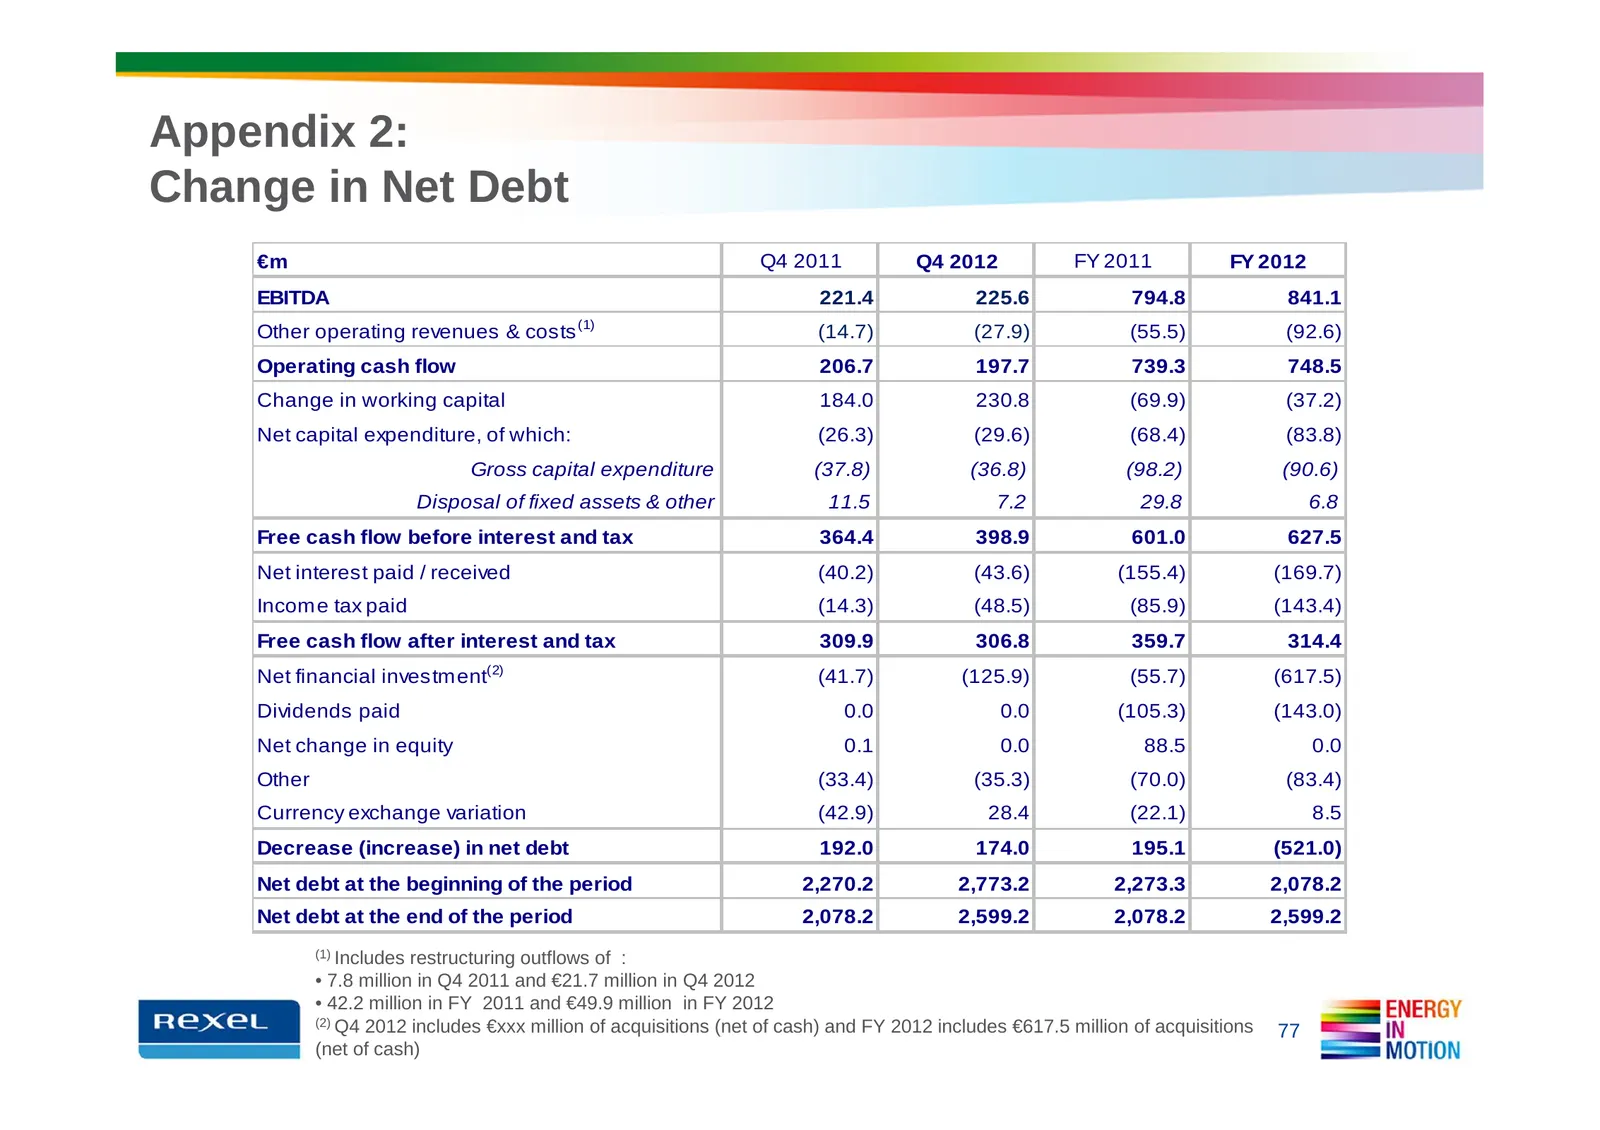
Slide 77: Appendix 2: Change in Net Debt
Appendix 2: Change in Net Debt €m Q4 2011 Q4 2012 FY 2011 FY 2012 EBITDA 221.4 225.6 794.8 841.1 (1) Other operating revenues & costs (14.7) (27.9) (55.5) (92.6) Operating cash flow 206.7 197.7 739.3 748.5 Change in working capital 184.0 230.8 (69.9) (37.2) Net capital expenditure, of which: (26.3)
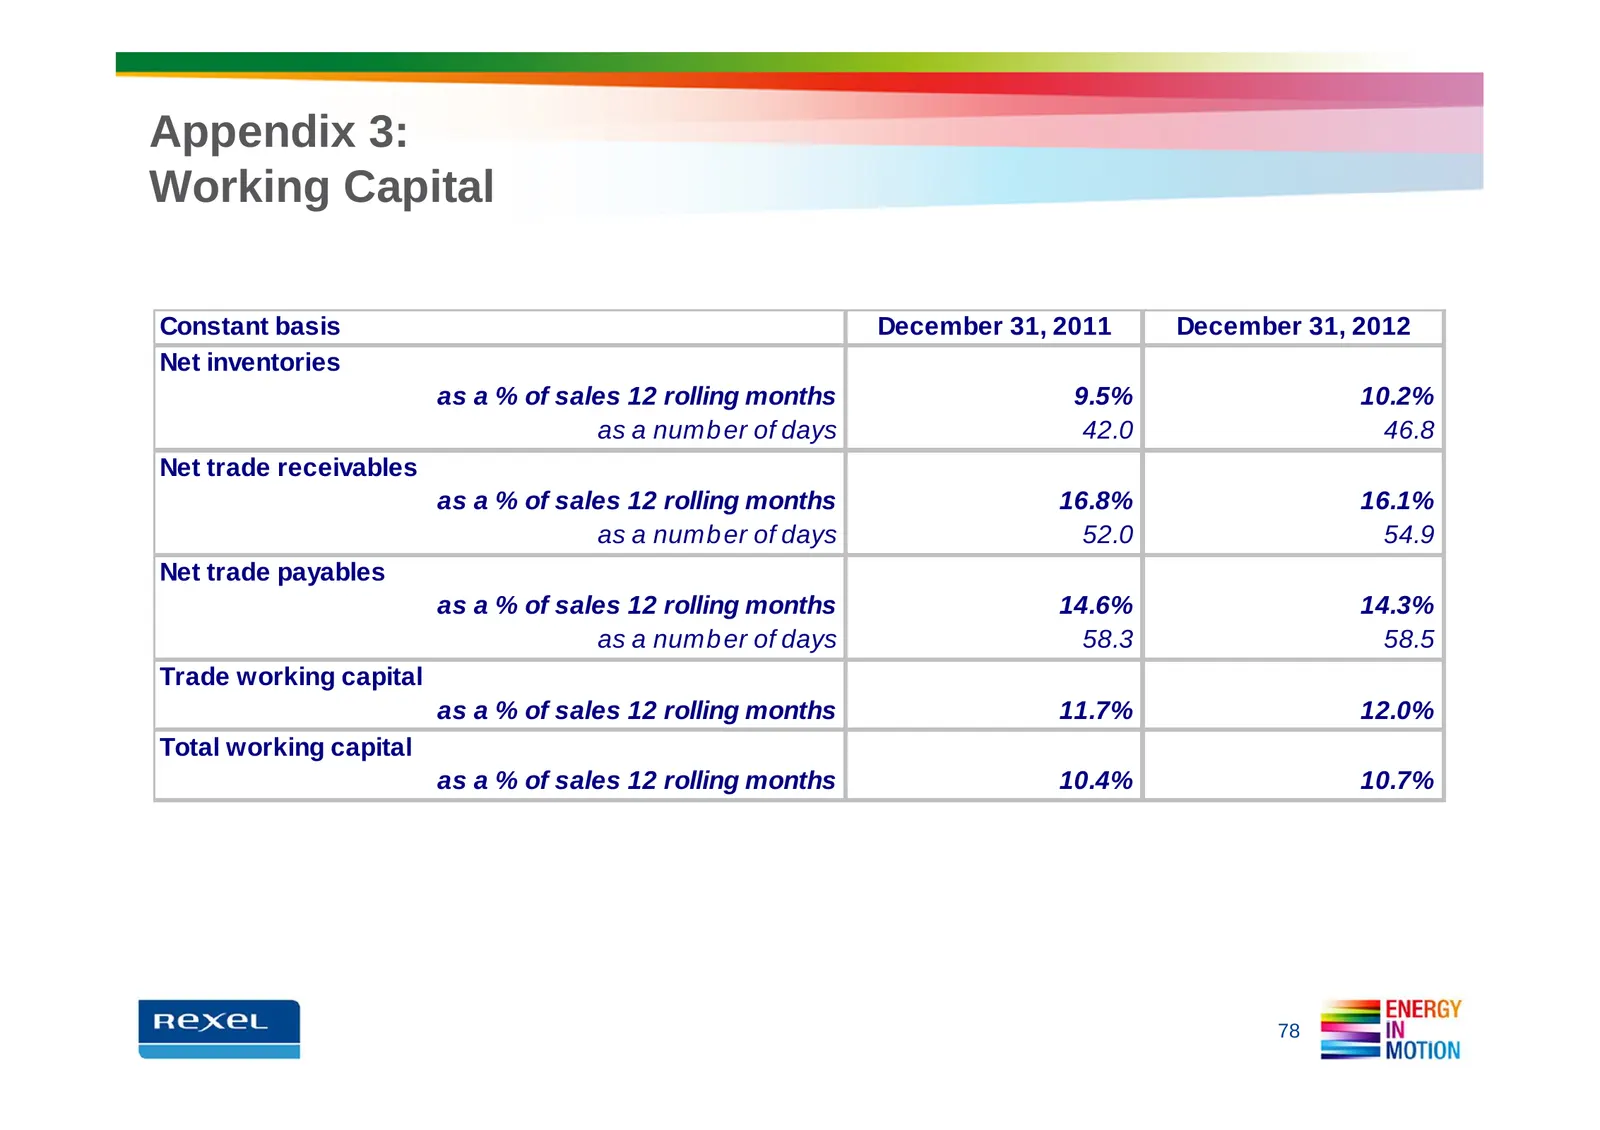
Slide 78: Appendix 3: Working Capital
Appendix 3: Working Capital Constant basis December 31, 2011 December 31, 2012 Net inventories as a % of sales 12 rolling months 9.5% 10.2% as a numb er of days 42.0 46.8 Net trade receivables as a % of sales 12 rolling months 16.8% 16.1% as a numb er of days 52.0 54.9 Net trade payables as a % of s
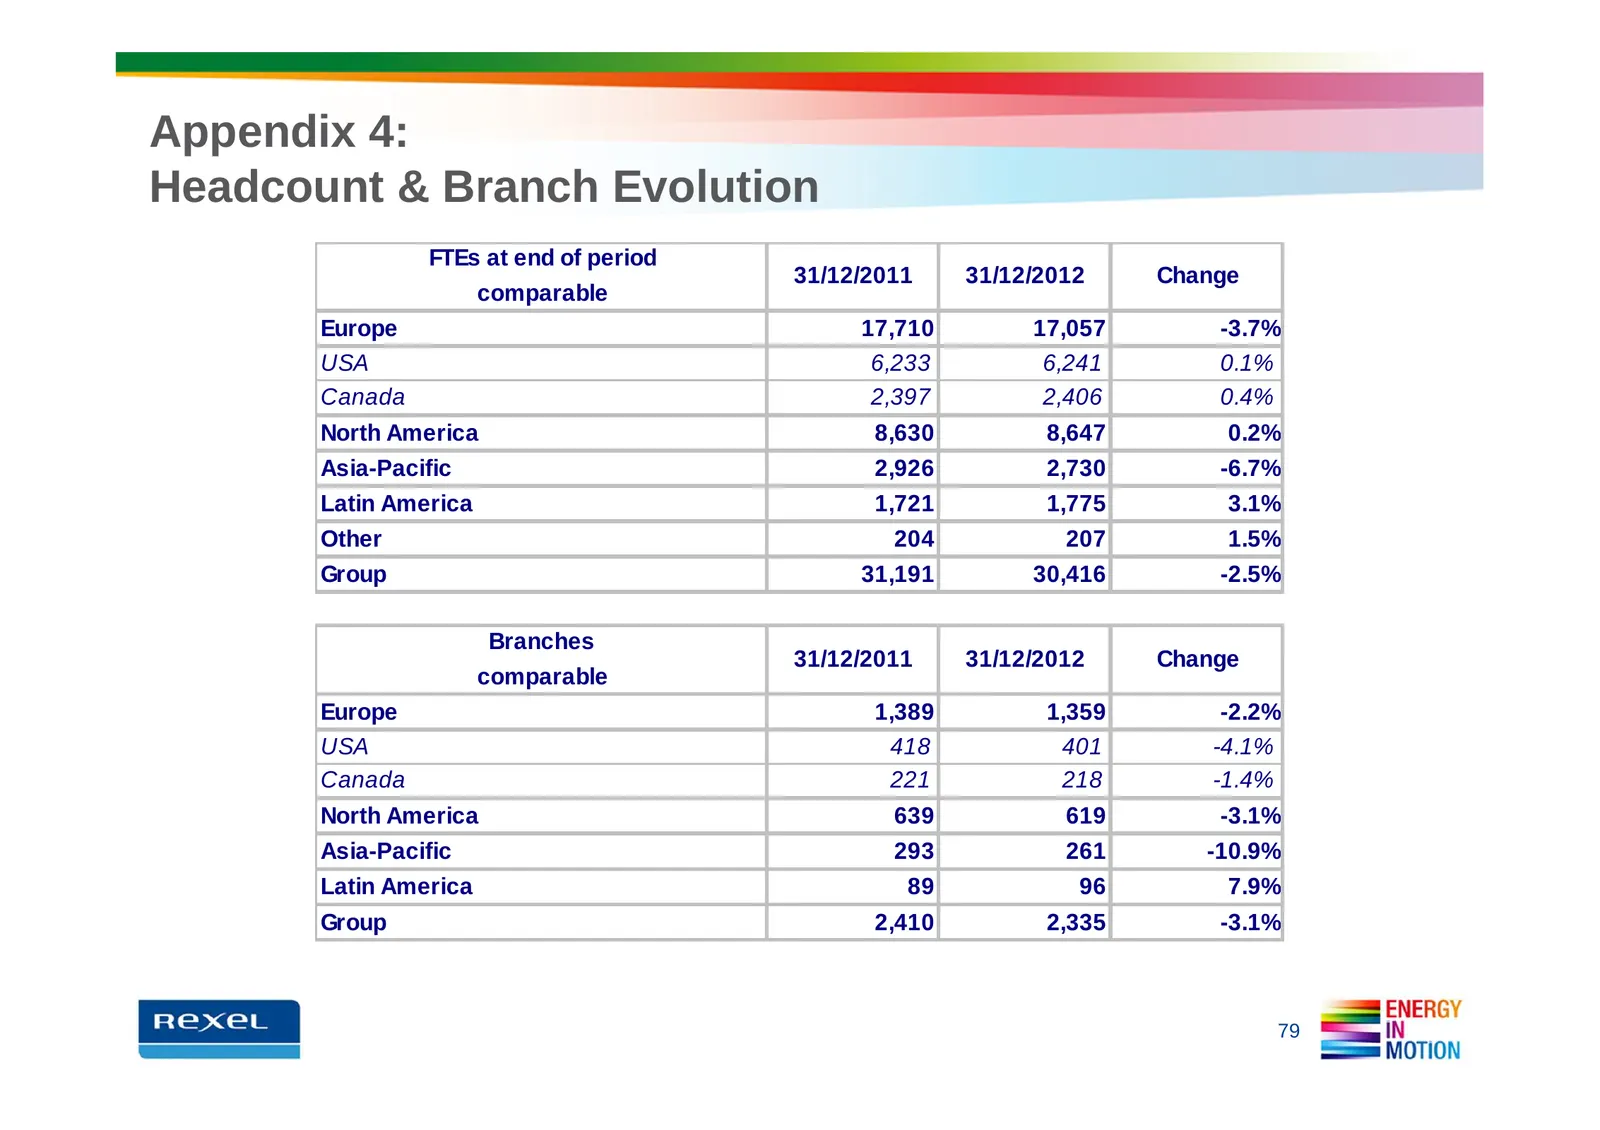
Slide 79: Appendix 4: Headcount & Branch Evolution
Appendix 4: Headcount & Branch Evolution FTEs at end of period 31/12/2011 31/12/2012 Change comparable Europe 17,710 17,057 -3.7% USA 6,233 6,241 0.1% Canada 2,397 2,406 0.4% North America 8,630 8,647 0.2% Asia-Pacific 2,926 2,730 -6.7% Latin America 1,721 1,775 3.1% Other 204 207 1.5% Group 31,191
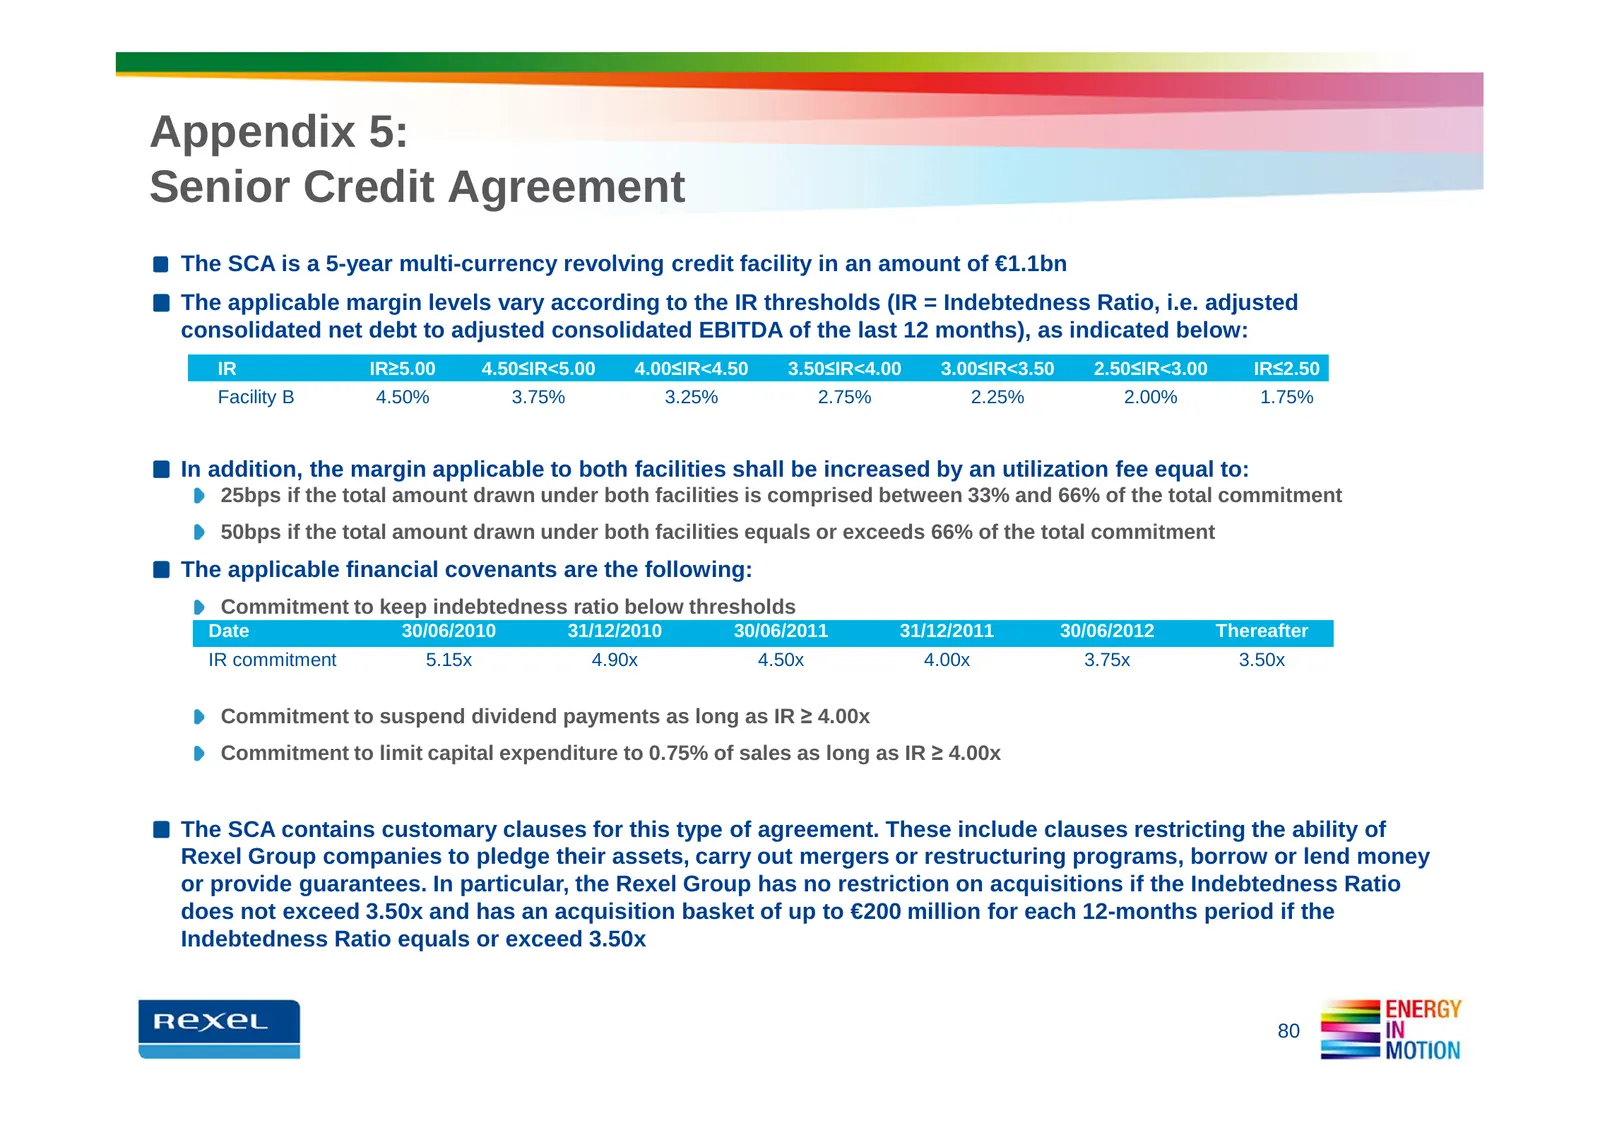
Slide 80: Appendix 5: Senior Credit Agreement
Appendix 5: Senior Credit Agreement The SCA is a 5-year multi-currency revolving credit facility in an amount of €1.1bn The applicable margin levels vary according to the IR thresholds (IR = Indebtedness Ratio, i.e. adjusted consolidated net debt to adjusted consolidated EBITDA of the last 12 months
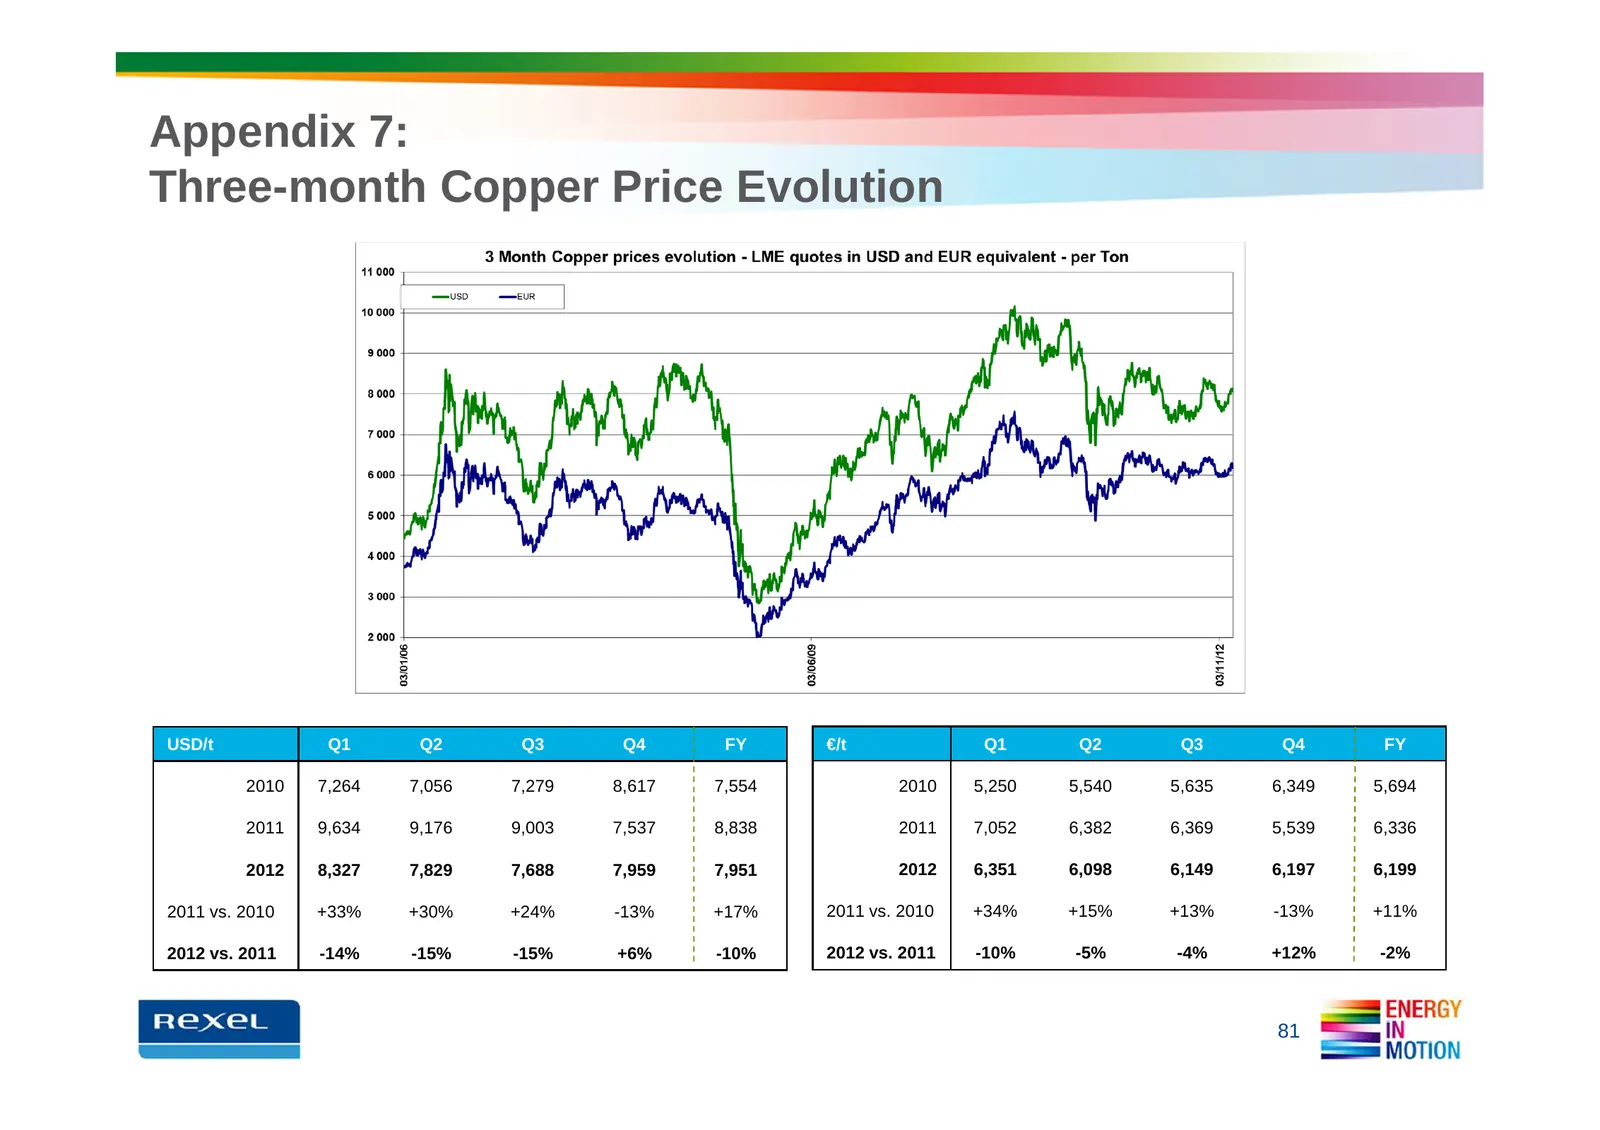
Slide 81: Appendix 7: Three-month Copper Price Evolution
Appendix 7: Three-month Copper Price Evolution USD/t Q1 Q2 Q3 Q4 FY €/t Q1 Q2 Q3 Q4 FY 2010 7,264 7,056 7,279 8,617 7,554 2010 5,250 5,540 5,635 6,349 5,694 2011 9,634 9,176 9,003 7,537 8,838 2011 7,052 6,382 6,369 5,539 6,336 2012 8,327 7,829 7,688 7,959 7,951 2012 6,351 6,098 6,149 6,197 6,199 201
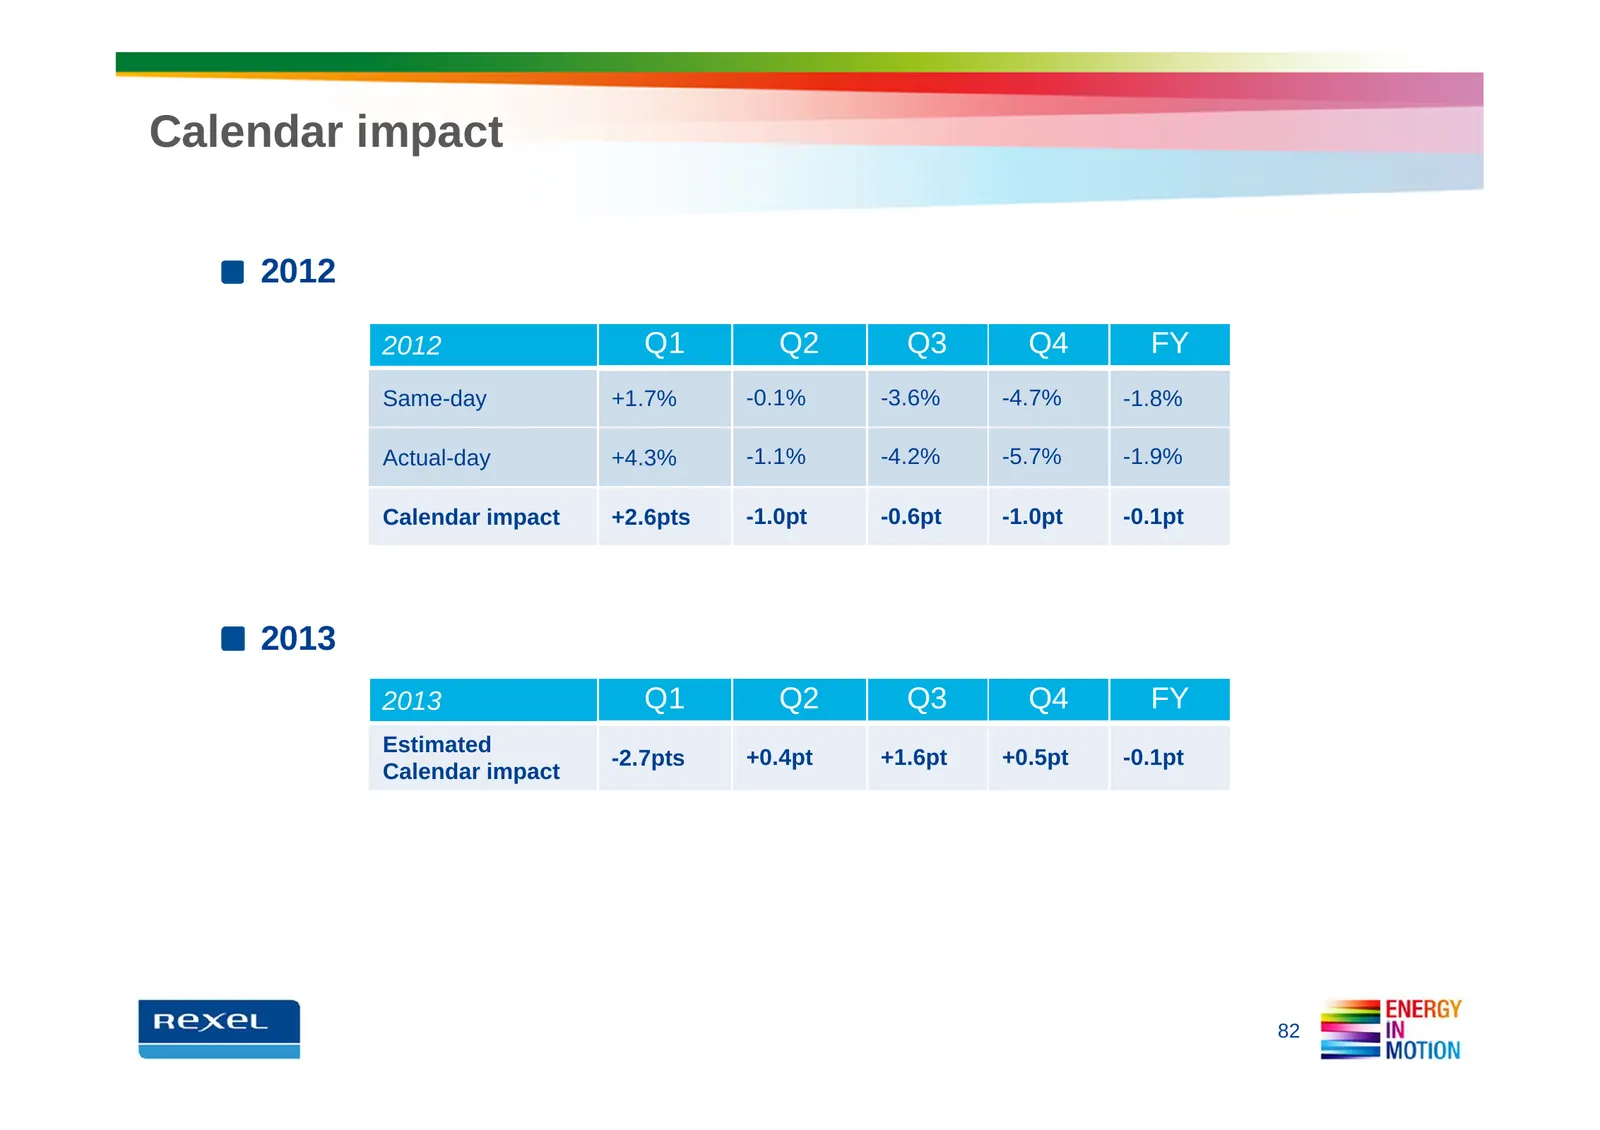
Slide 82: Calendar impact
Calendar impact 2012 2012 Q1 Q2 Q3 Q4 FY Same-day +1.7% -0.1% -3.6% -4.7% -1.8% Actual-day +4.3% -1.1% -4.2% -5.7% -1.9% Calendar impact +2.6pts -1.0pt -0.6pt -1.0pt -0.1pt 2013 2013 Q1 Q2 Q3 Q4 FY Estimated -2.7pts +0.4pt +1.6pt +0.5pt -0.1pt Calendar impact 82
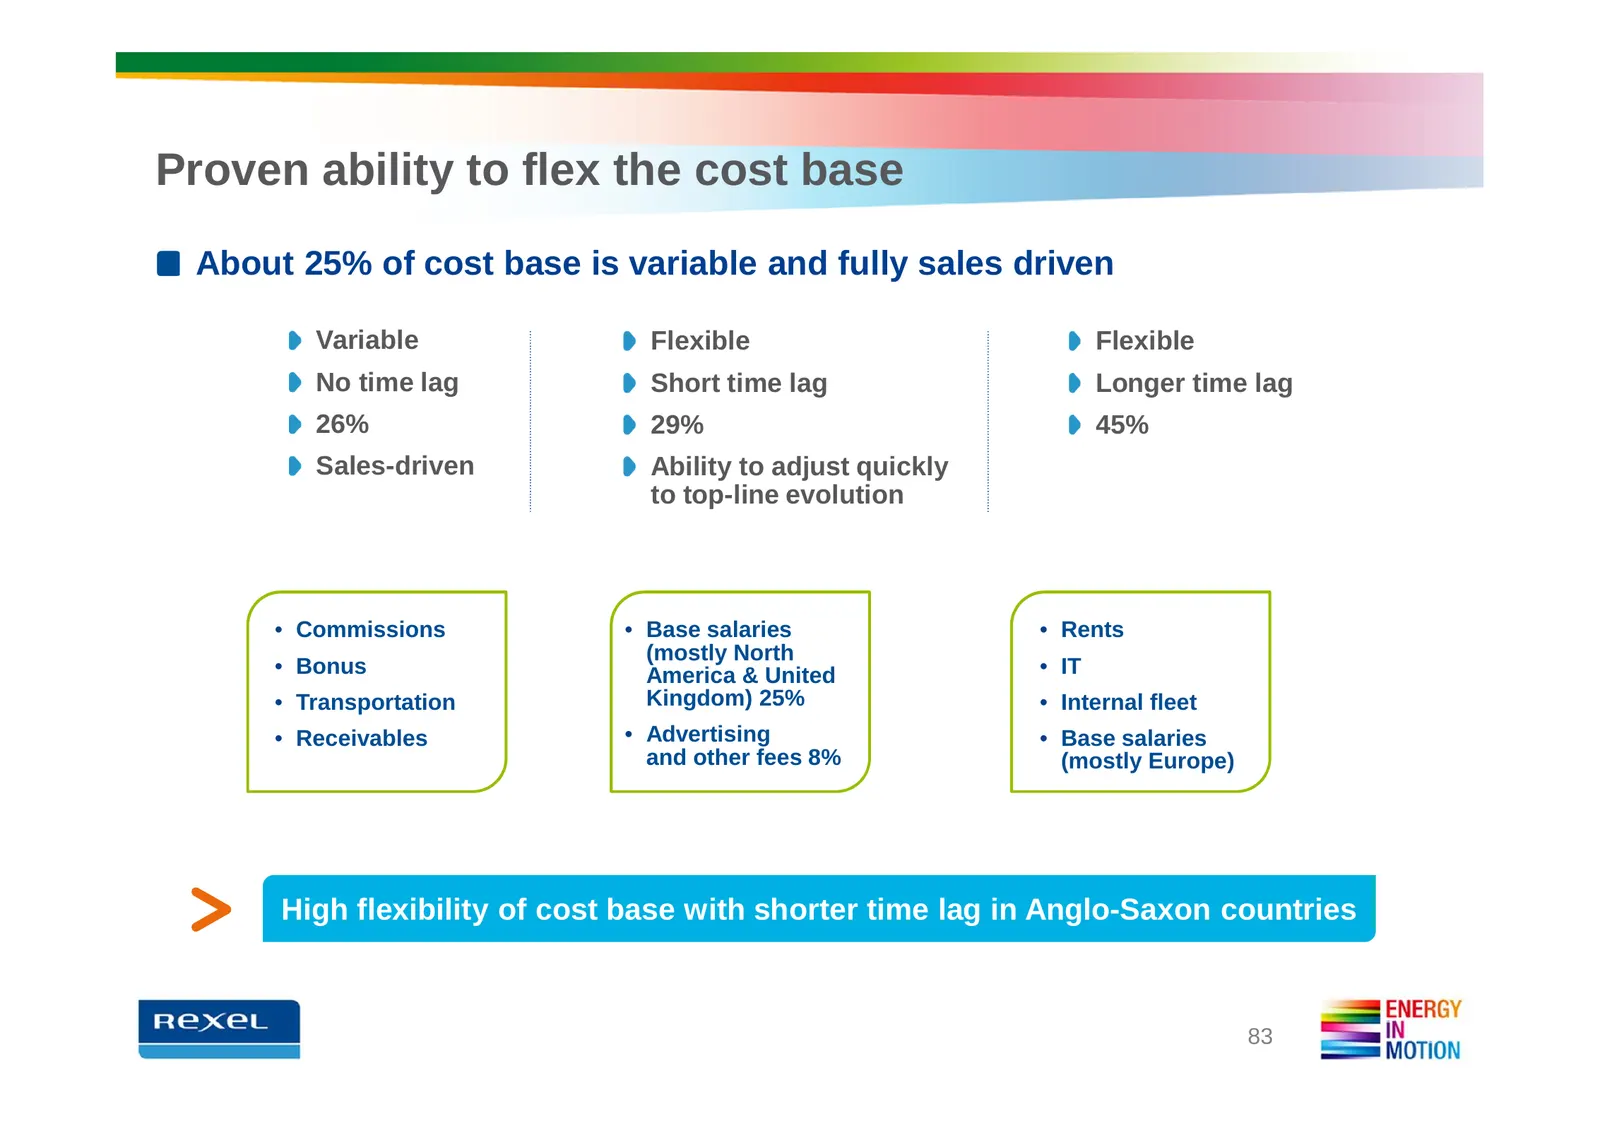
Slide 83: Proven ability to flex the cost base
Proven ability to flex the cost base About 25% of cost base is variable and fully sales driven Variable Flexible Flexible No time lag Short time lag Longer time lag 26% 29% 45% Sales-driven Ability to adjust quickly to top-line evolution • Commissions • Base salaries • Rents (mostly North • Bonus Am
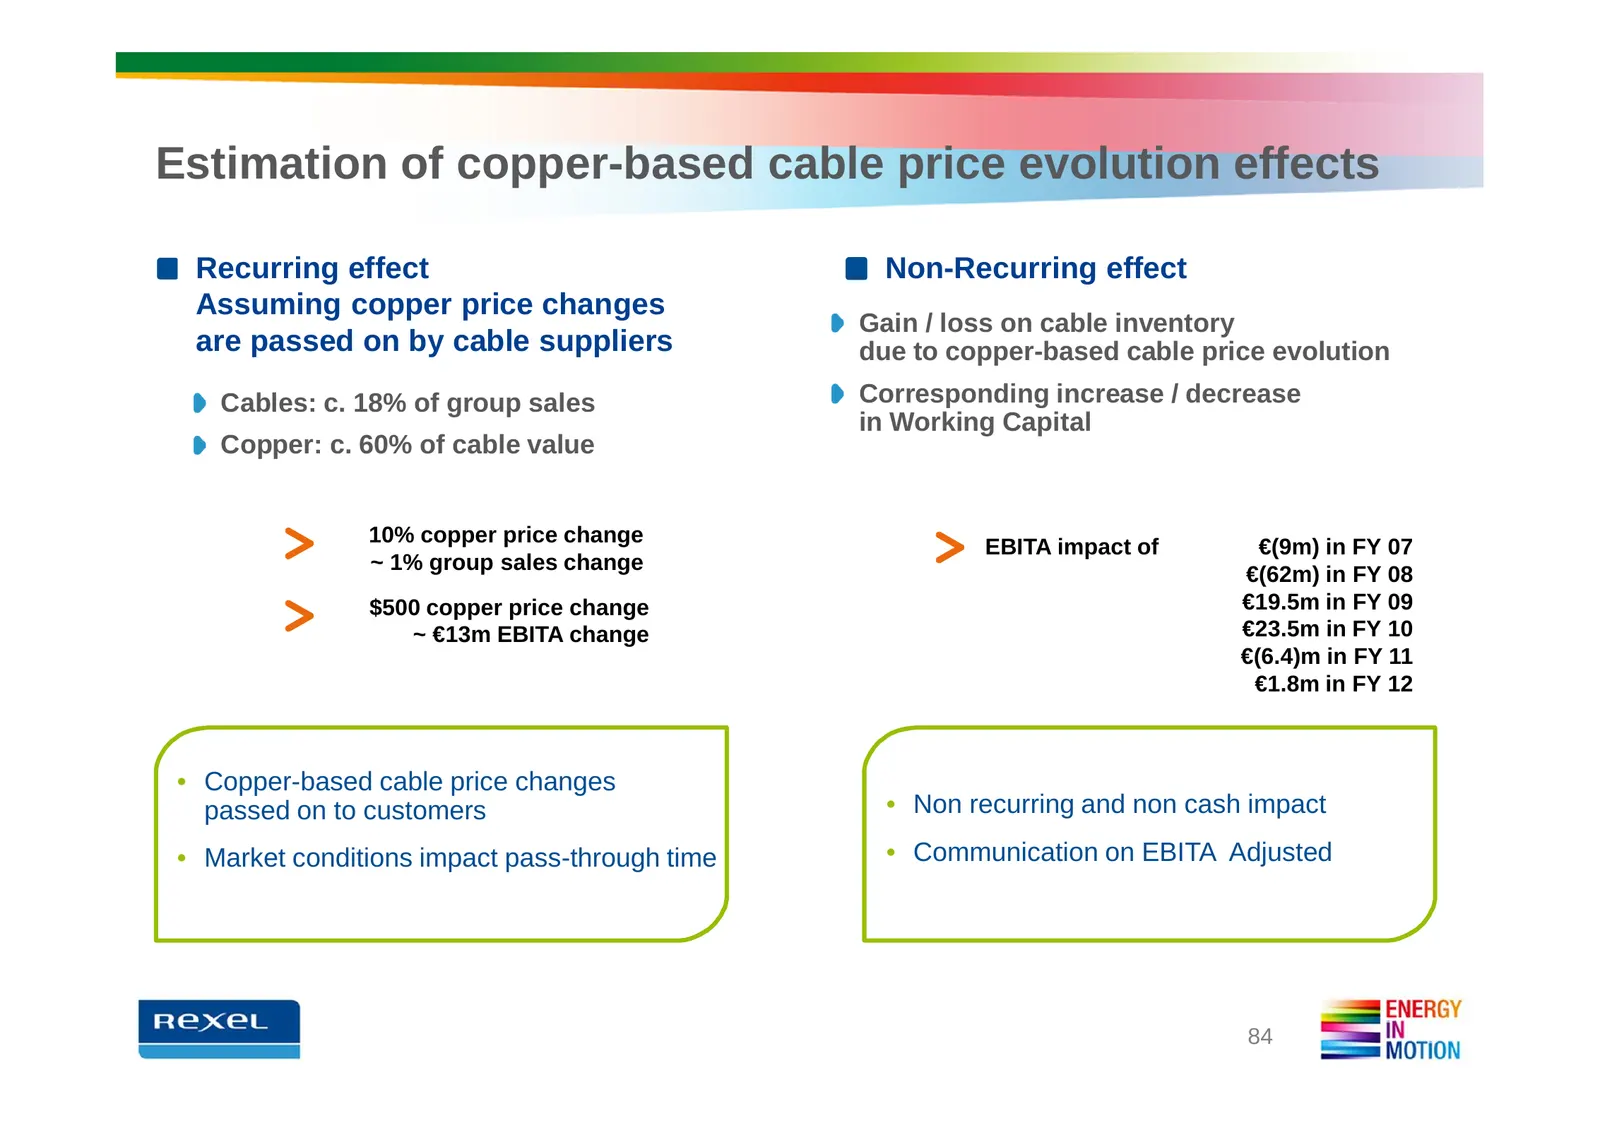
Slide 84: Estimation of copper-based cable price evolution effects
Estimation of copper-based cable price evolution effects Recurring effect Non-Recurring effect Assuming copper price changes Gain / loss on cable inventory are passed on by cable suppliers due to copper-based cable price evolution Cables: c. 18% of group sales Corresponding increase / decrease in Wo
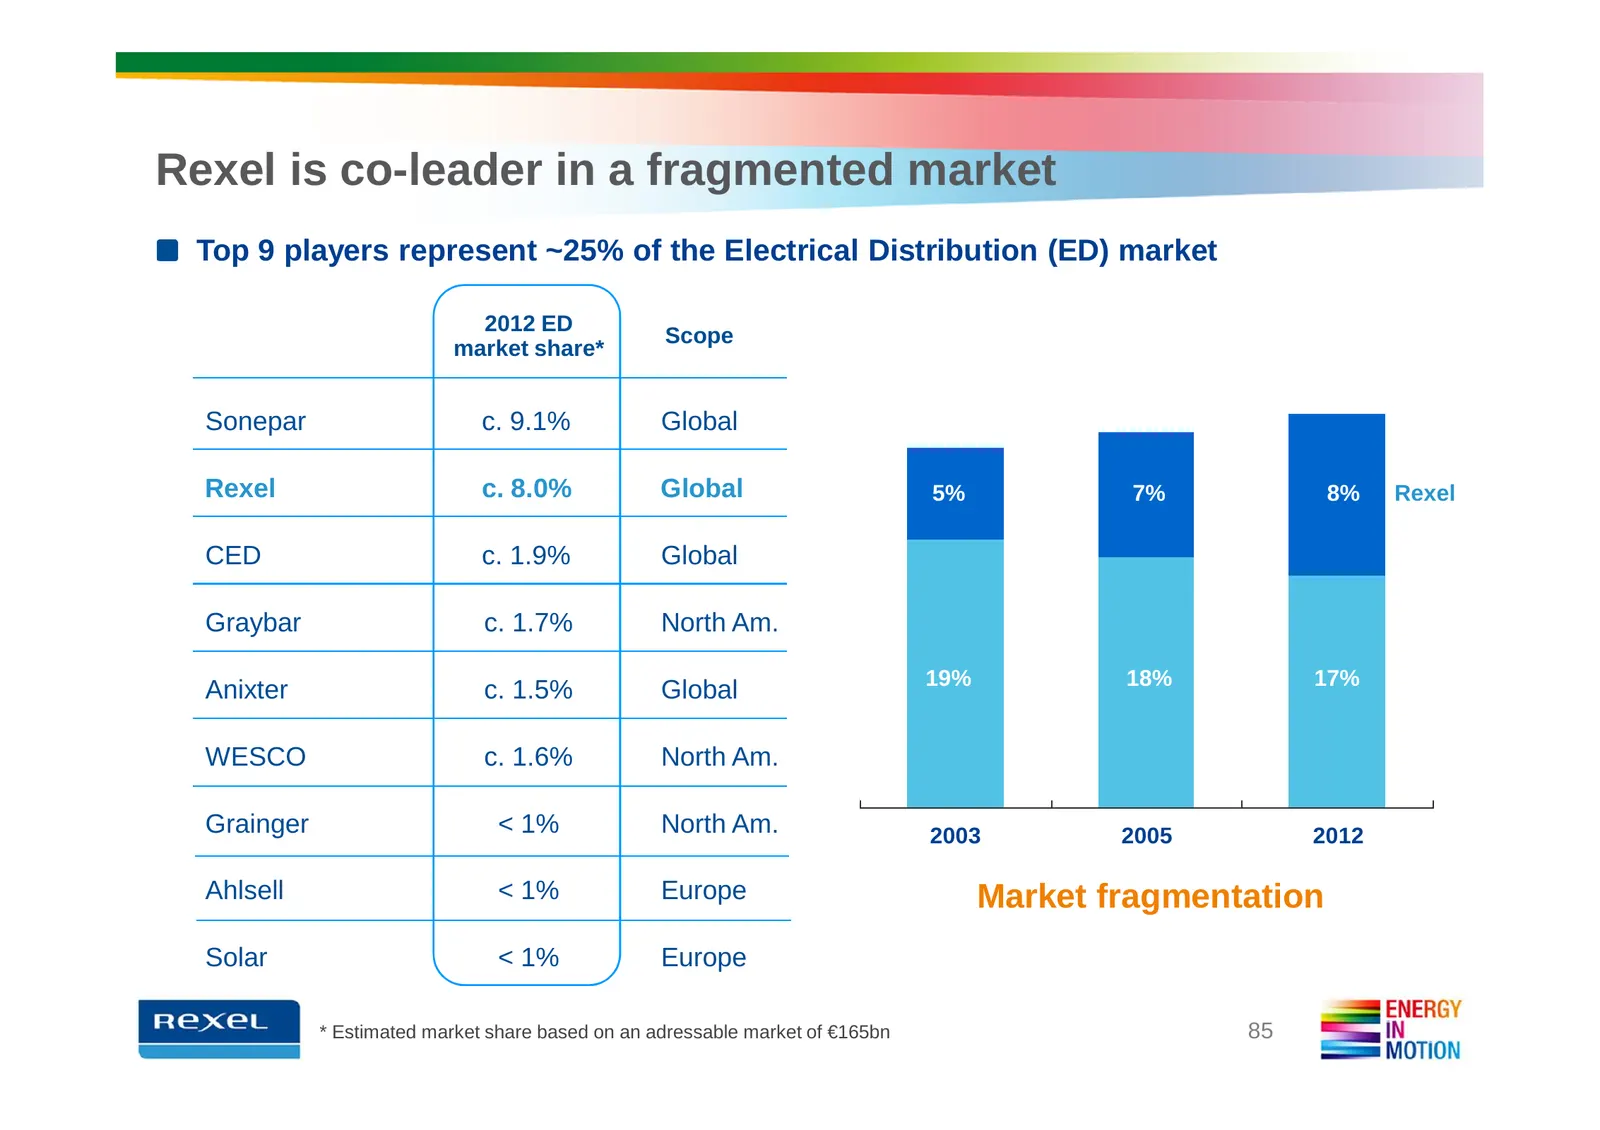
Slide 85: Rexel is co-leader in a fragmented market
Rexel is co-leader in a fragmented market Top 9 players represent ~25% of the Electrical Distribution (ED) market 2012 ED Scope market share* Sonepar c. 9.1% Global Rexel c. 8.0% Global 5% 7% 8% Rexel CED c. 1.9% Global Graybar c. 1.7% North Am. 19% 18% 17% Anixter c. 1.5% Global WESCO c. 1.6% North
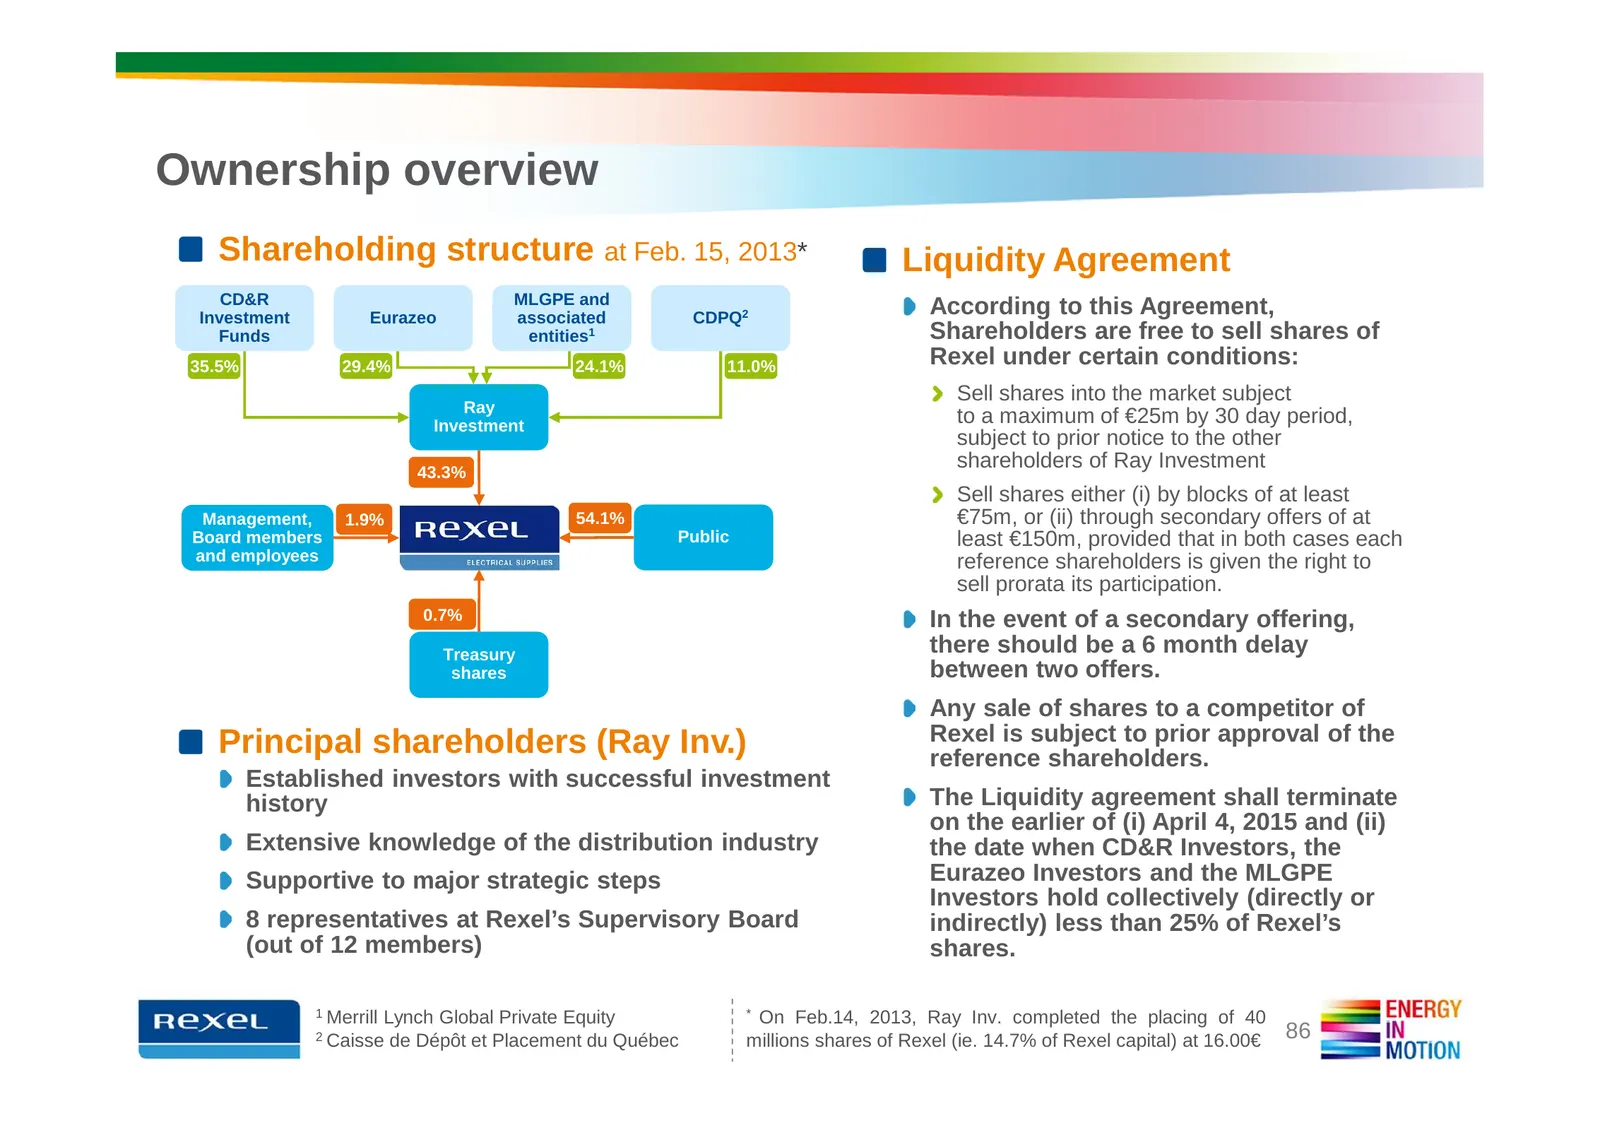
Slide 86: Ownership overview
Ownership overview Shareholding structure at Feb. 15, 2013* Liquidity Agreement CD&R MLGPE and Investment Eurazeo associated CDPQ2 According to this Agreement, Funds entities1 Shareholders are free to sell shares of 35.5% 29.4% 24.1% 11.0% Rexel under certain conditions: Sell shares into the market

Slide 87: Financial Calendar & Contacts
FINANCIAL CALENDAR & CONTACTS
Slide 88: Financial Calendar and contacts
Financial Calendar and contacts Financial Calendar Contacts • May 2, 2013 • Investors & Analysts First-quarter 2013 results Marc MAILLET Tel: +33 1 42 85 76 12 • July 26, 2013 Email: mmaillet@rexel.com Second-quarter and half-year 2013 results Florence MEILHAC • October 31, 2013 Tel: +33 1 42 85 57
Slide 89: Disclaimer
Disclaimer The Group is exposed to fluctuations in copper prices in connection with its distribution of cable products. Cables accounted for approximately 17% of the Group's sales, and copper accounts for approximately 60% of the composition of cables. This exposure is indirect since cable prices al
Source: Internet Archive copy of rexel.com
More decks from Rexel SA
 Q3 2026 Earnings Presentation13 slides · Oct 22, 2026
 Q2 2026 Earnings Presentation24 slides · Jul 27, 2026
 FY 2025 Earnings Presentation31 slides · Feb 11, 2026
 Q3 2025 Earnings Presentation15 slides · Oct 15, 2025
 Q2 2025 Earnings Presentation20 slides · Jul 28, 2025
 Q1 2025 Earnings Presentation16 slides · Apr 29, 2025