Elbit Systems Ltd · TASE:ESLT
Elbit Systems — Investor Presentation (March 2024)
28 slides from Elbit Systems's investor presentation, March 2024

Slide 1: Investor Overview
Investor Overview March 2024
Slide 2: Safe Harbor
Safe Harbor This presentation, reference to which herein includes information that may be provided by Elbit Systems Ltd. ("Elbit systems", and collectively with any or all of its subsidiaries, the “Company”) orally or in writing in connection therewith, is provided for general information only, and
Slide 3: Elbit Systems | A Highly Innovative Global Defense Company
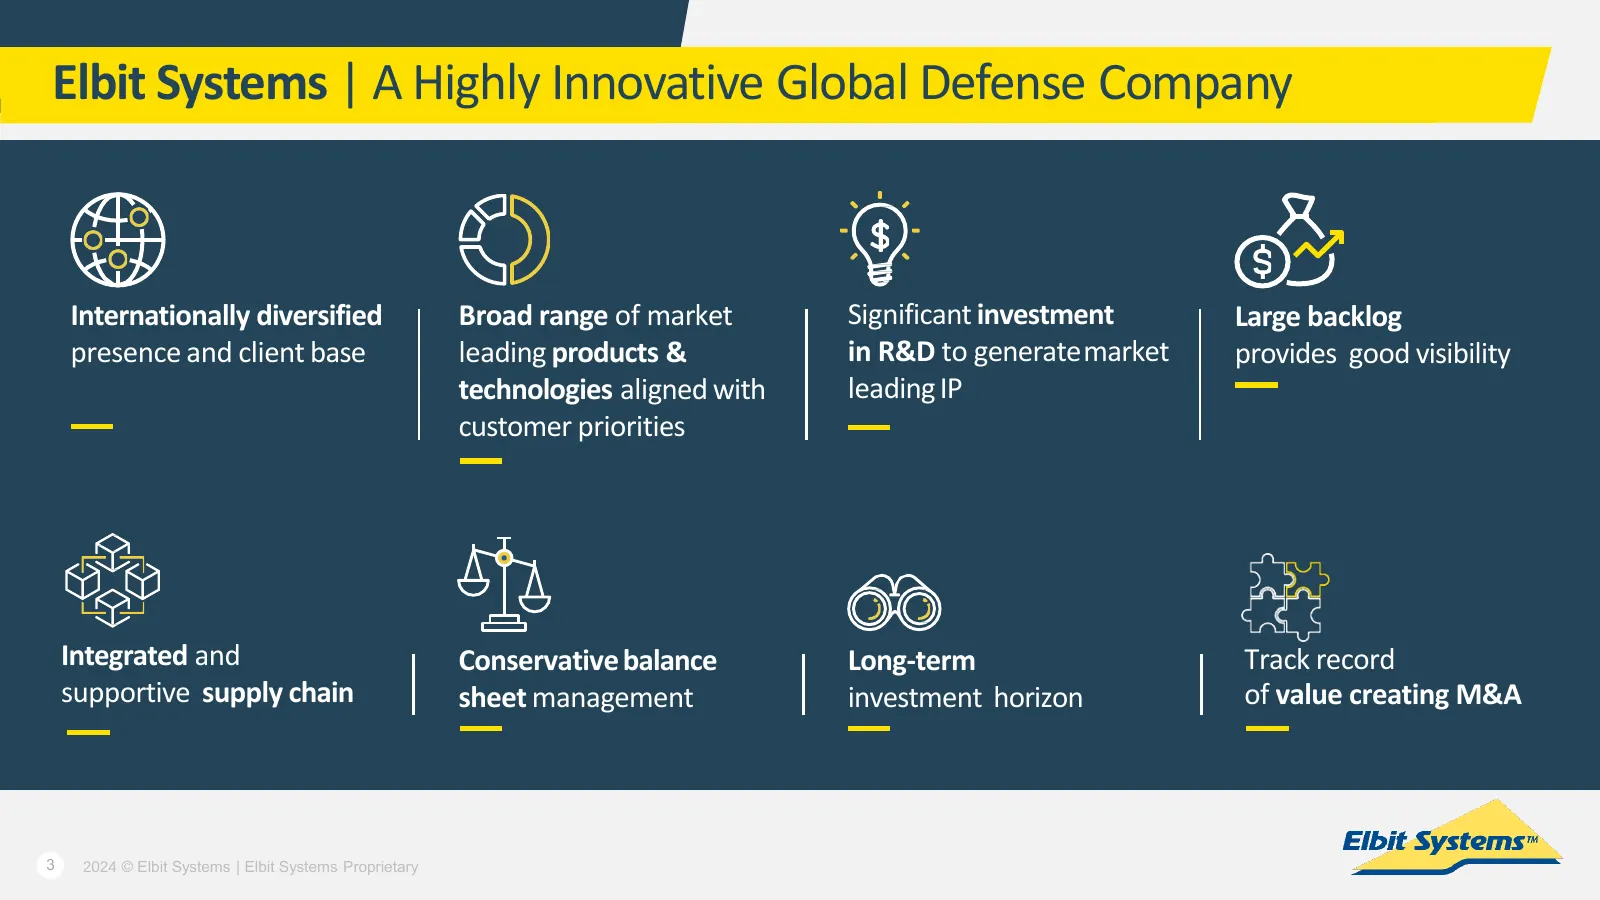
Elbit Systems | A Highly Innovative Global Defense Company Internationally diversified Broad range of market Significant investment Large backlog presence and client base leading products & in R&D to generatemarket provides good visibility technologies aligned with leading IP customer priorities Int
Slide 4: Elbit Systems at a glance
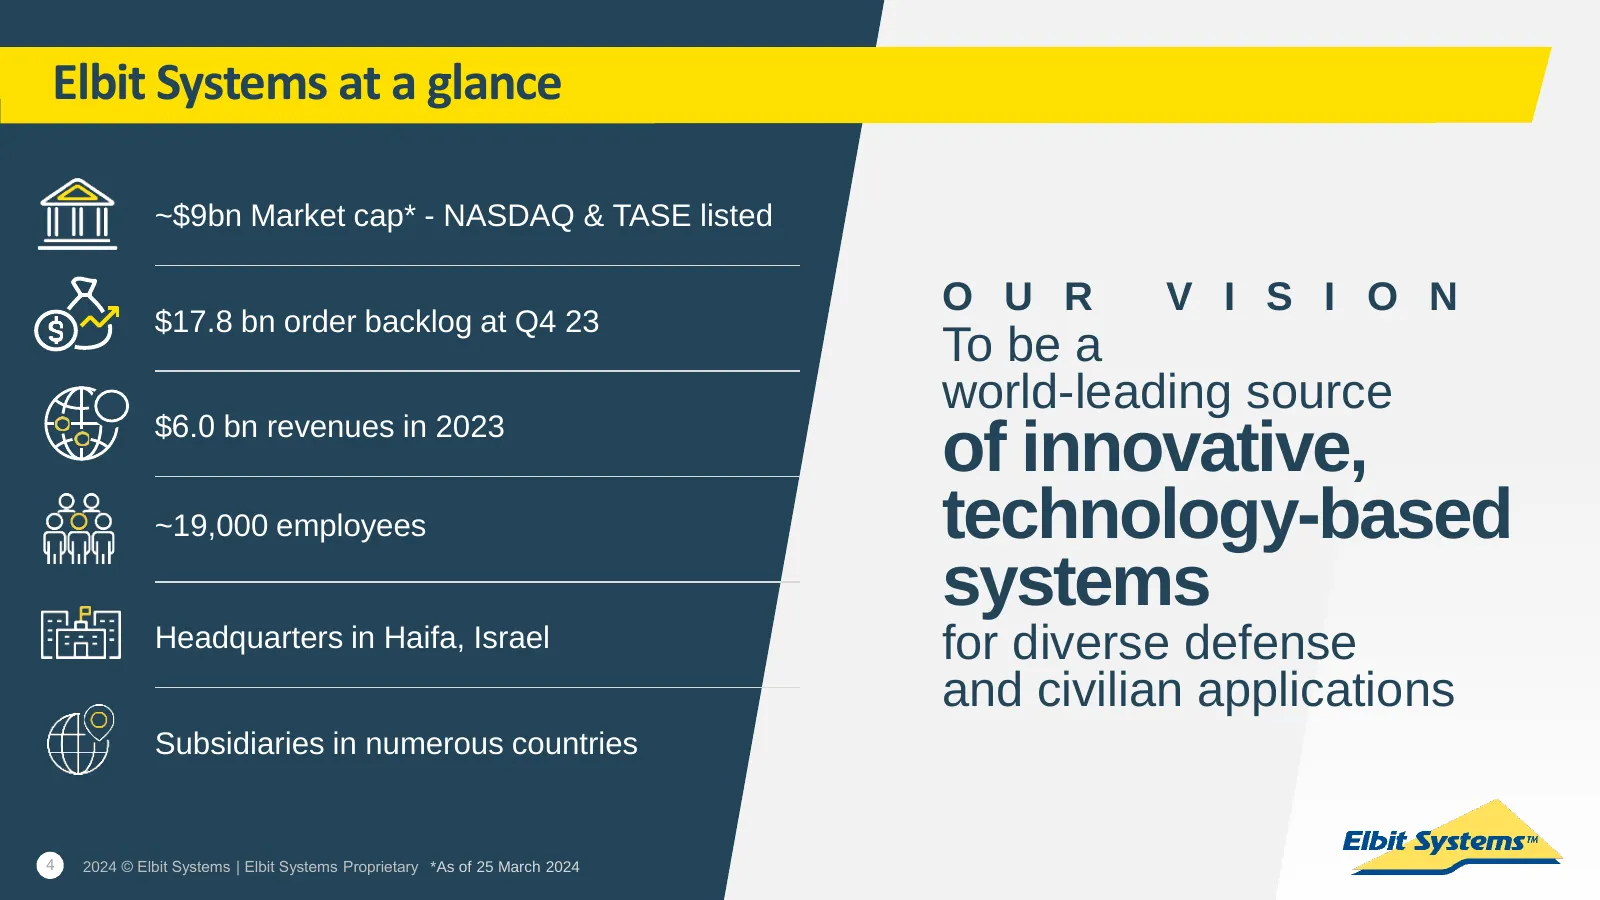
Elbit Systems at a glance ~$9bn Market cap* - NASDAQ & TASE listed O U R V I S I O N $17.8 bn order backlog at Q4 23 To be a world-leading source $6.0 bn revenues in 2023 of innovative, ~19,000 employees technology-based systems Headquarters in Haifa, Israel for diverse defense and civilian applicat
Slide 5: Geographically balanced customer portfolio
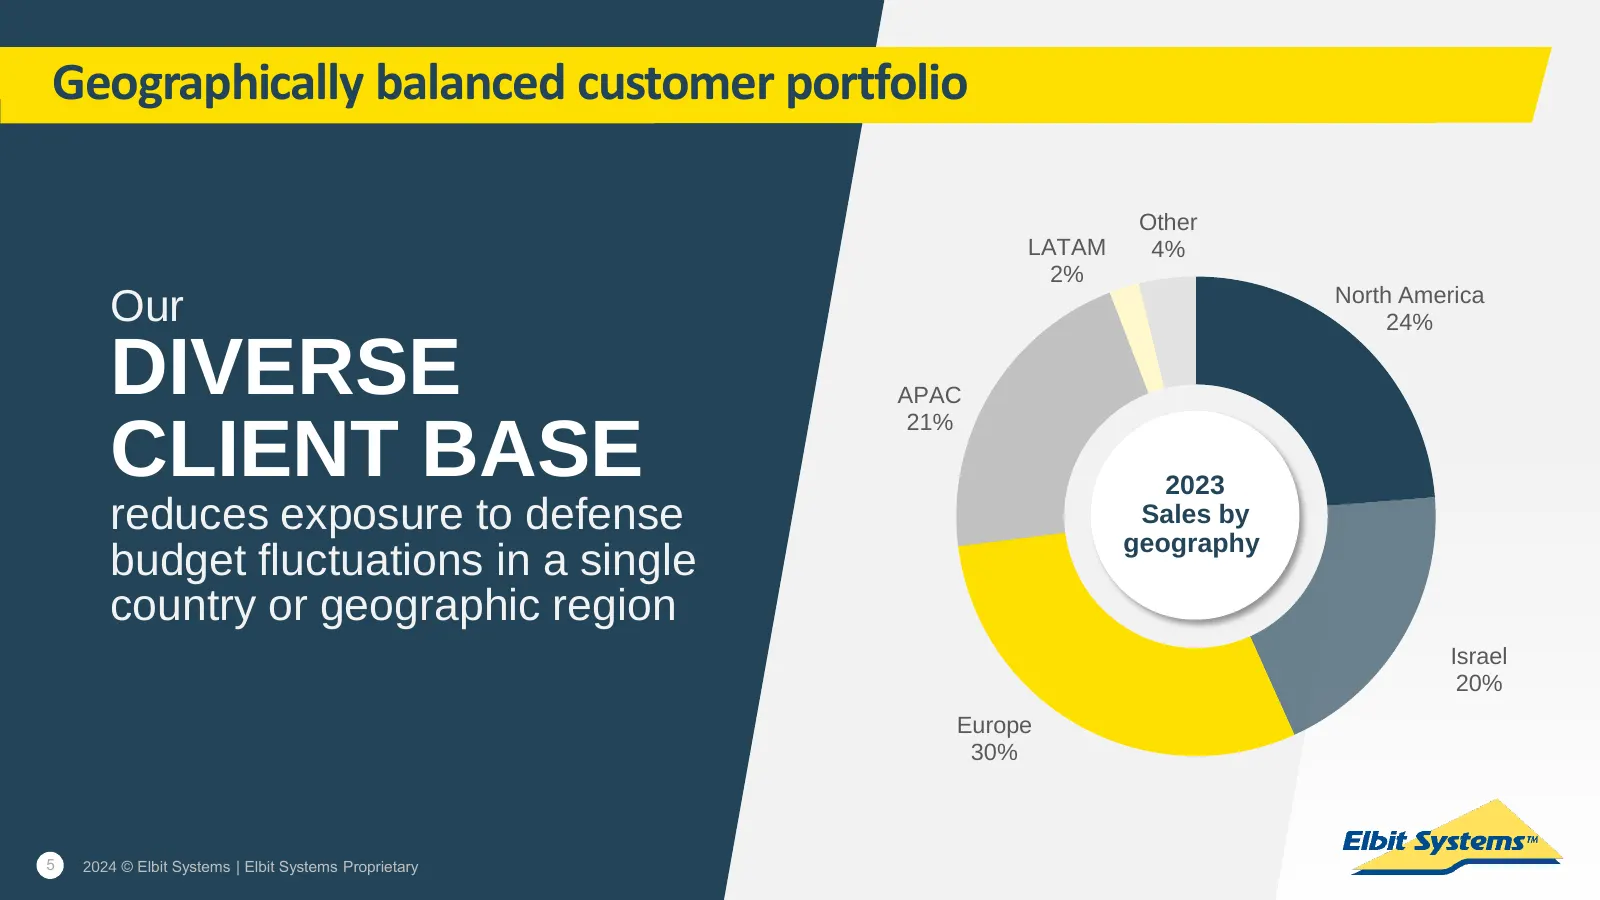
Geographically balanced customer portfolio Other LATAM 4% 2% North America Our 24% DIVERSE APAC 21% CLIENT BASE 2023 reduces exposure to defense Sales by geography budget fluctuations in a single country or geographic region Israel 20% Europe 30% 5 2024 © Elbit Systems | Elbit Systems Proprietary
Slide 6: Israel's largest defense company
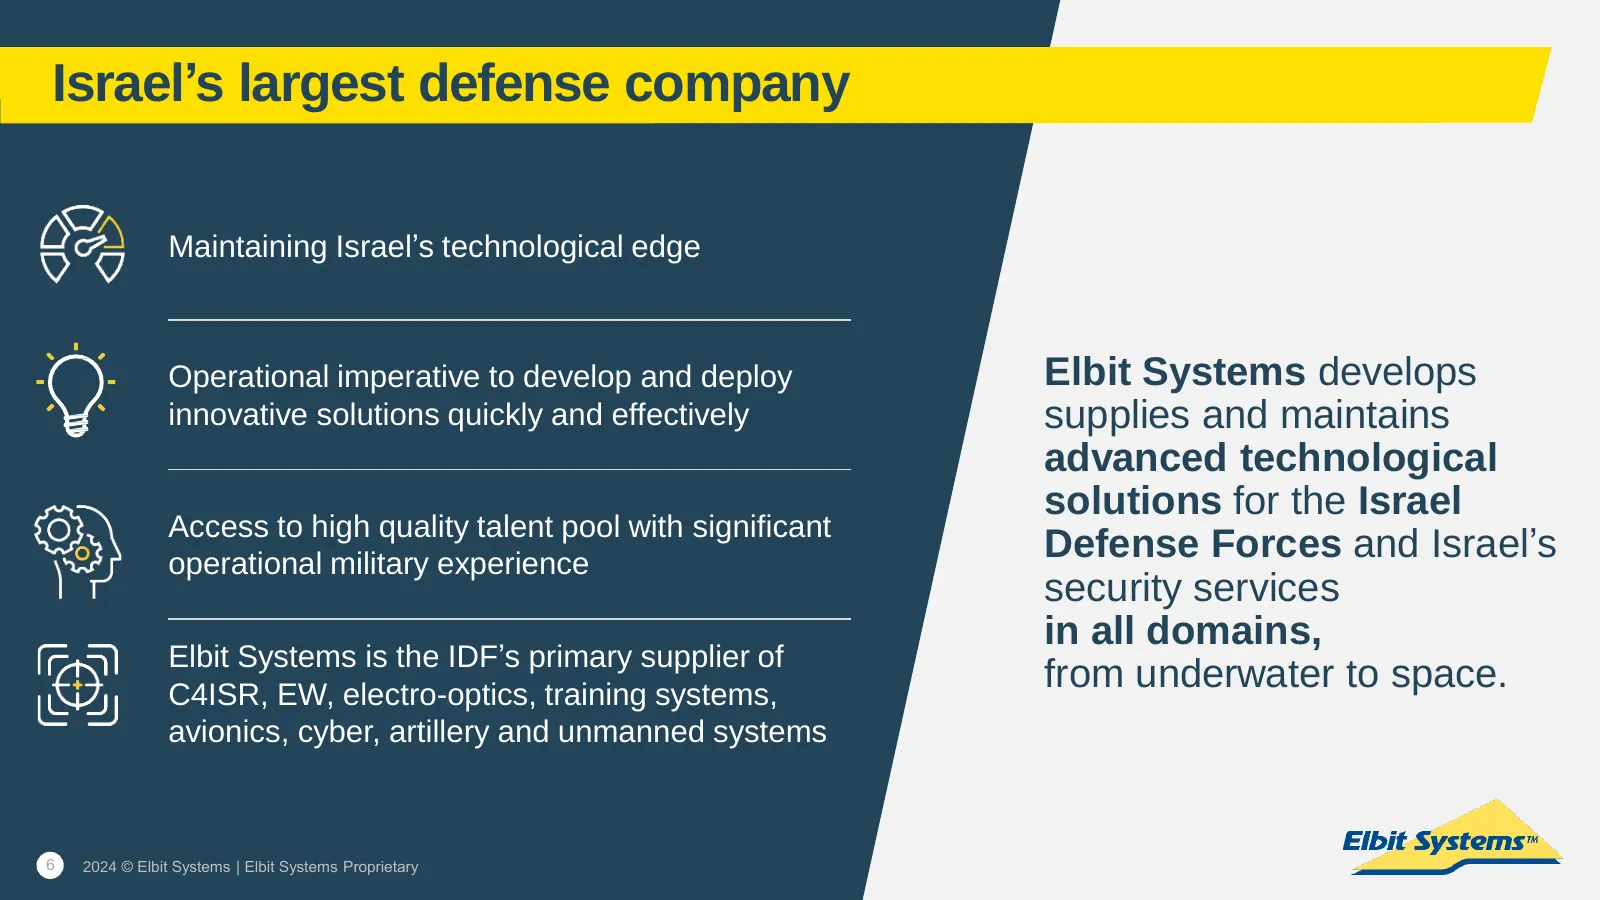
Israel’s largest defense company Maintaining Israel’s technological edge Operational imperative to develop and deploy Elbit Systems develops innovative solutions quickly and effectively supplies and maintains advanced technological solutions for the Israel Access to high quality talent pool with sig
Slide 7: Broad global footprint
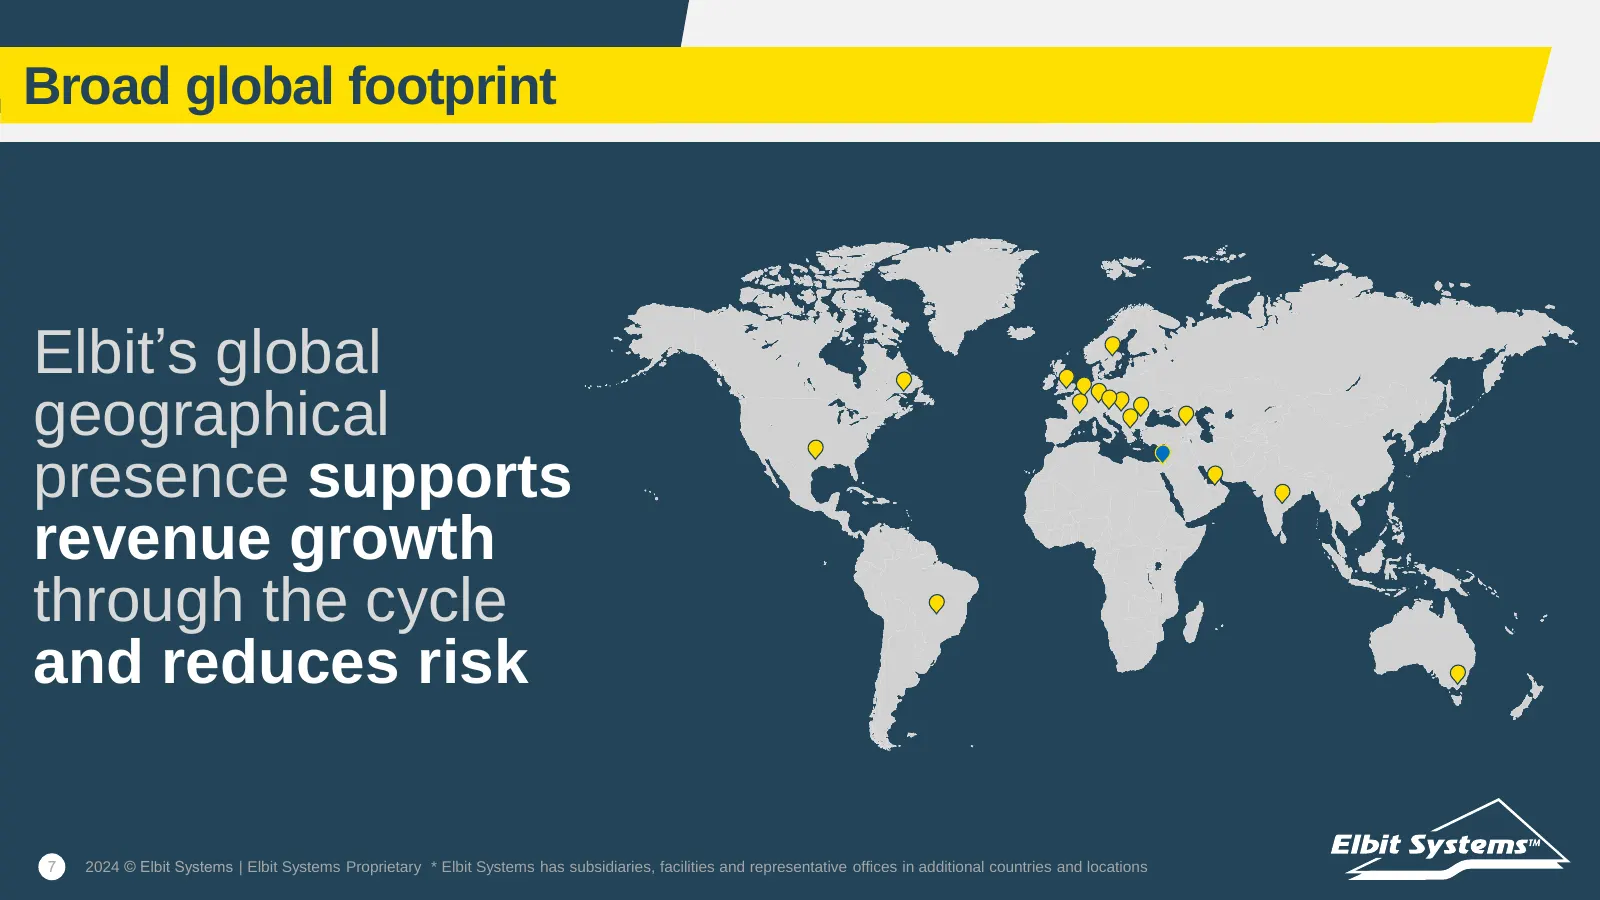
Broad global footprint Elbit’s global geographical presence supports revenue growth through the cycle and reduces risk 7 2024 © Elbit Systems | Elbit Systems Proprietary * Elbit Systems has subsidiaries, facilities and representative offices in additional countries and locations
Slide 8: USA | A Strong Presence in a Strategic Market
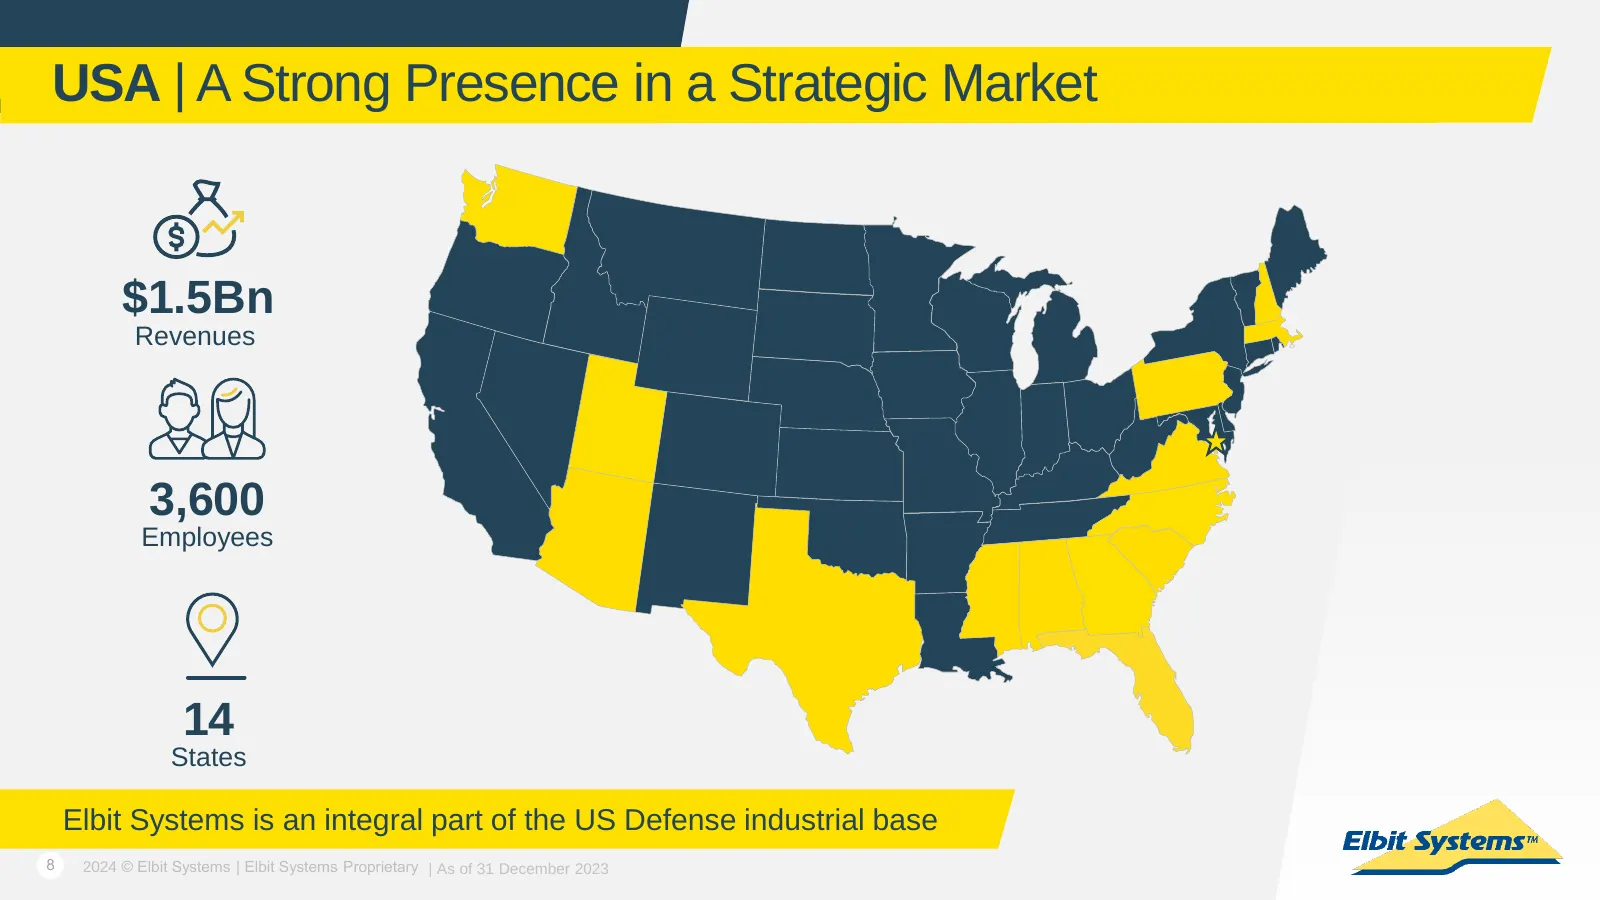
USA | A Strong Presence in a Strategic Market $1.5Bn Revenues 3,600 Employees 14 States Elbit Systems is an integral part of the US Defense industrial base 8 2024 © Elbit Systems | Elbit Systems Proprietary | As of 31 December 2023
Slide 9: Strong Positions across Europe support organic growth
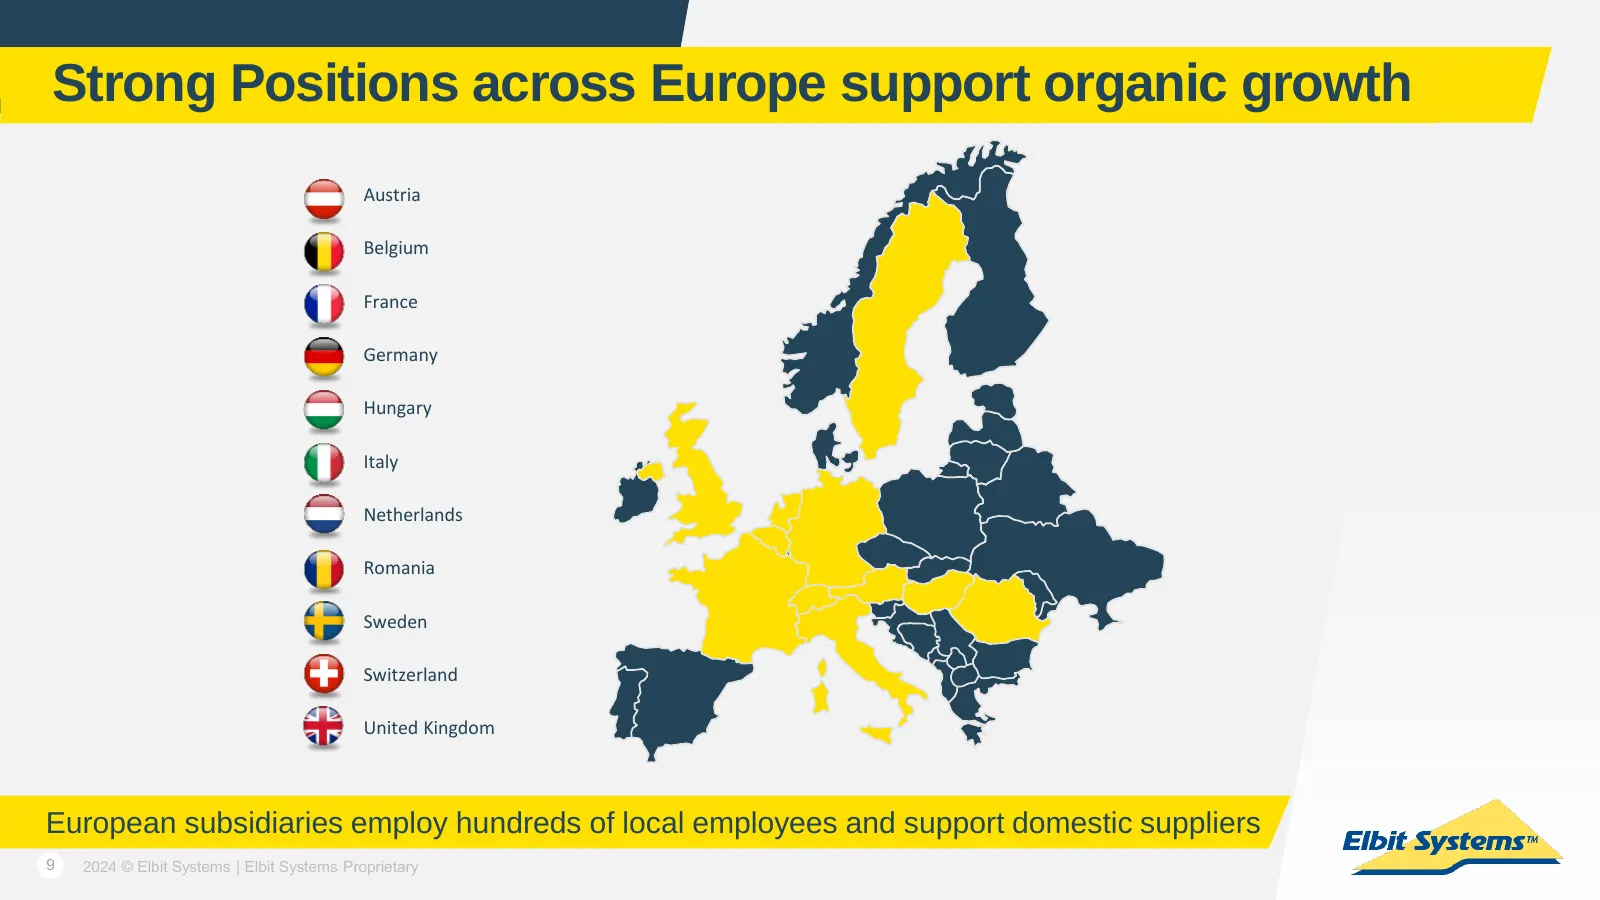
Strong Positions across Europe support organic growth Austria Belgium France Germany Hungary Italy Netherlands Romania Sweden Switzerland United Kingdom European subsidiaries employ hundreds of local employees and support domestic suppliers 9 2024 © Elbit Systems | Elbit Systems Proprietary
Slide 10: Sustained R&D investment and technology development
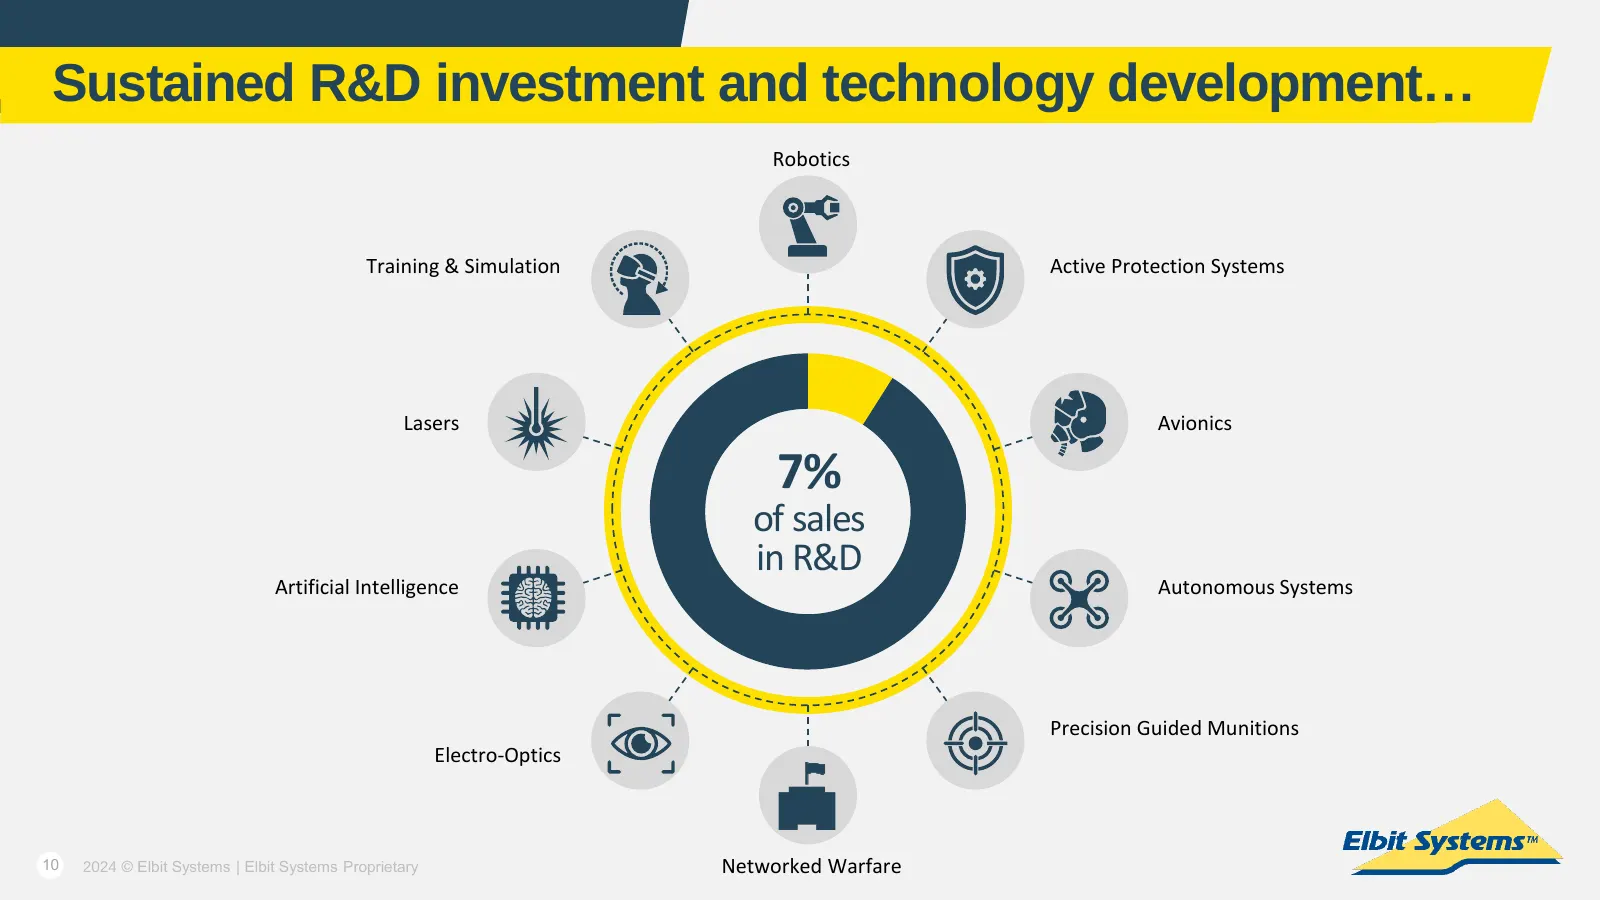
Sustained R&D investment and technology development… Robotics Training & Simulation Active Protection Systems Lasers Avionics 7% of sales in R&D Artificial Intelligence Autonomous Systems Precision Guided Munitions Electro-Optics 10 2024 © Elbit Systems | Elbit Systems Proprietary Networked Warfare
Slide 11: Elbit Systems is a top three global player
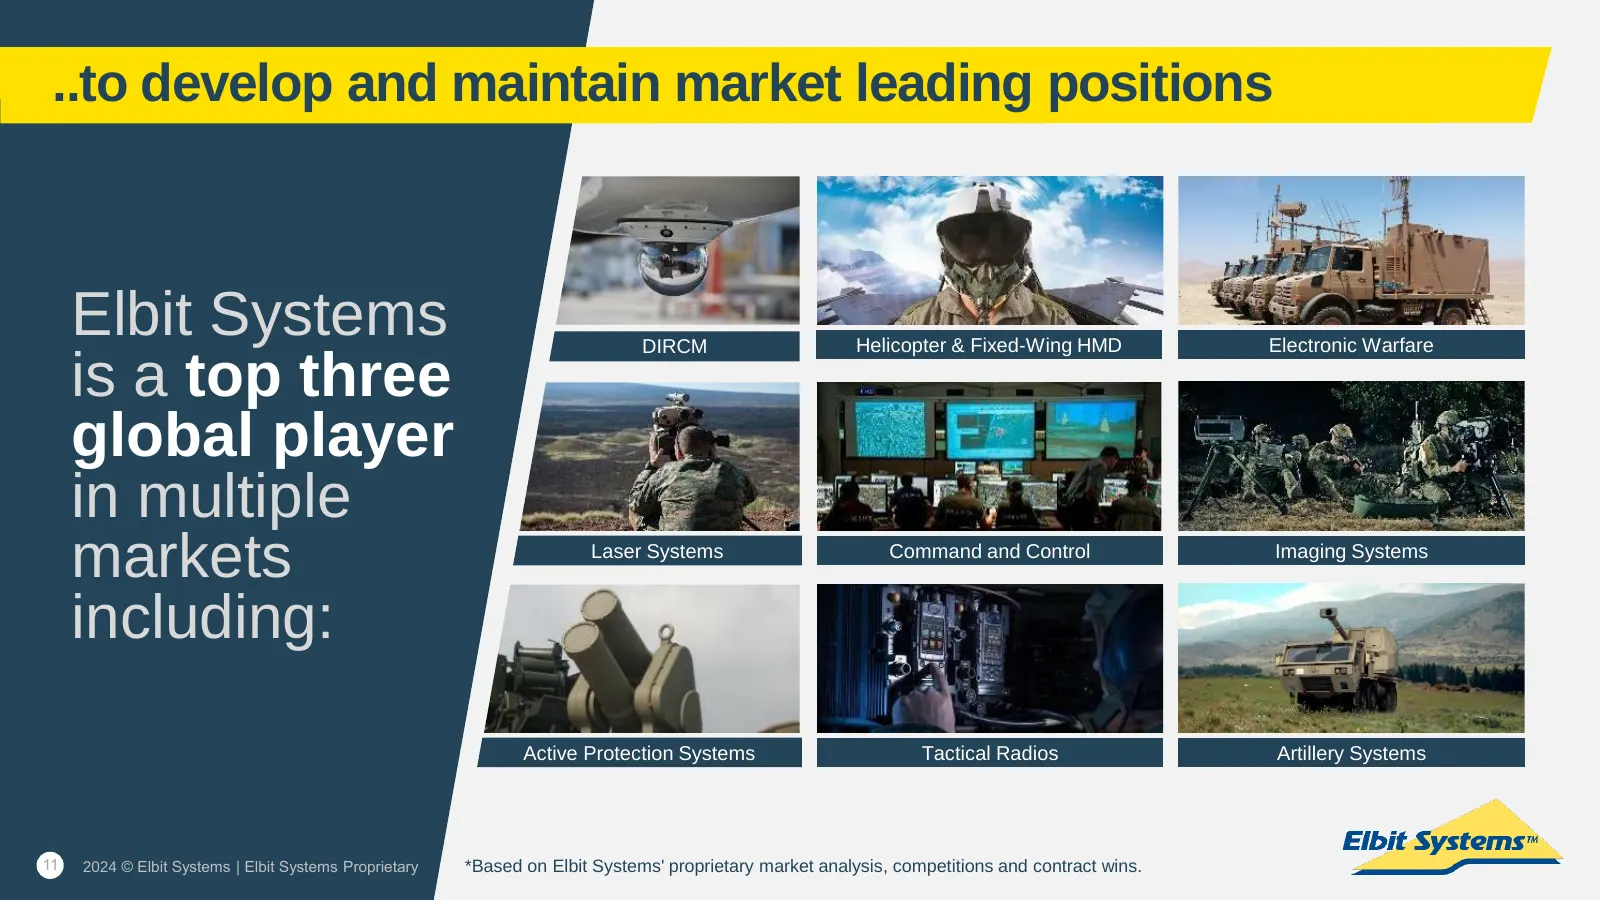
..to develop and maintain market leading positions Elbit Systems DIRCM Helicopter & Fixed-Wing HMD Electronic Warfare is a top three global player in multiple markets Laser Systems Command and Control Imaging Systems including: Active Protection Systems Tactical Radios Artillery Systems 11 2024 © El
Slide 12: Business Segments | Annual Revenues ($m)
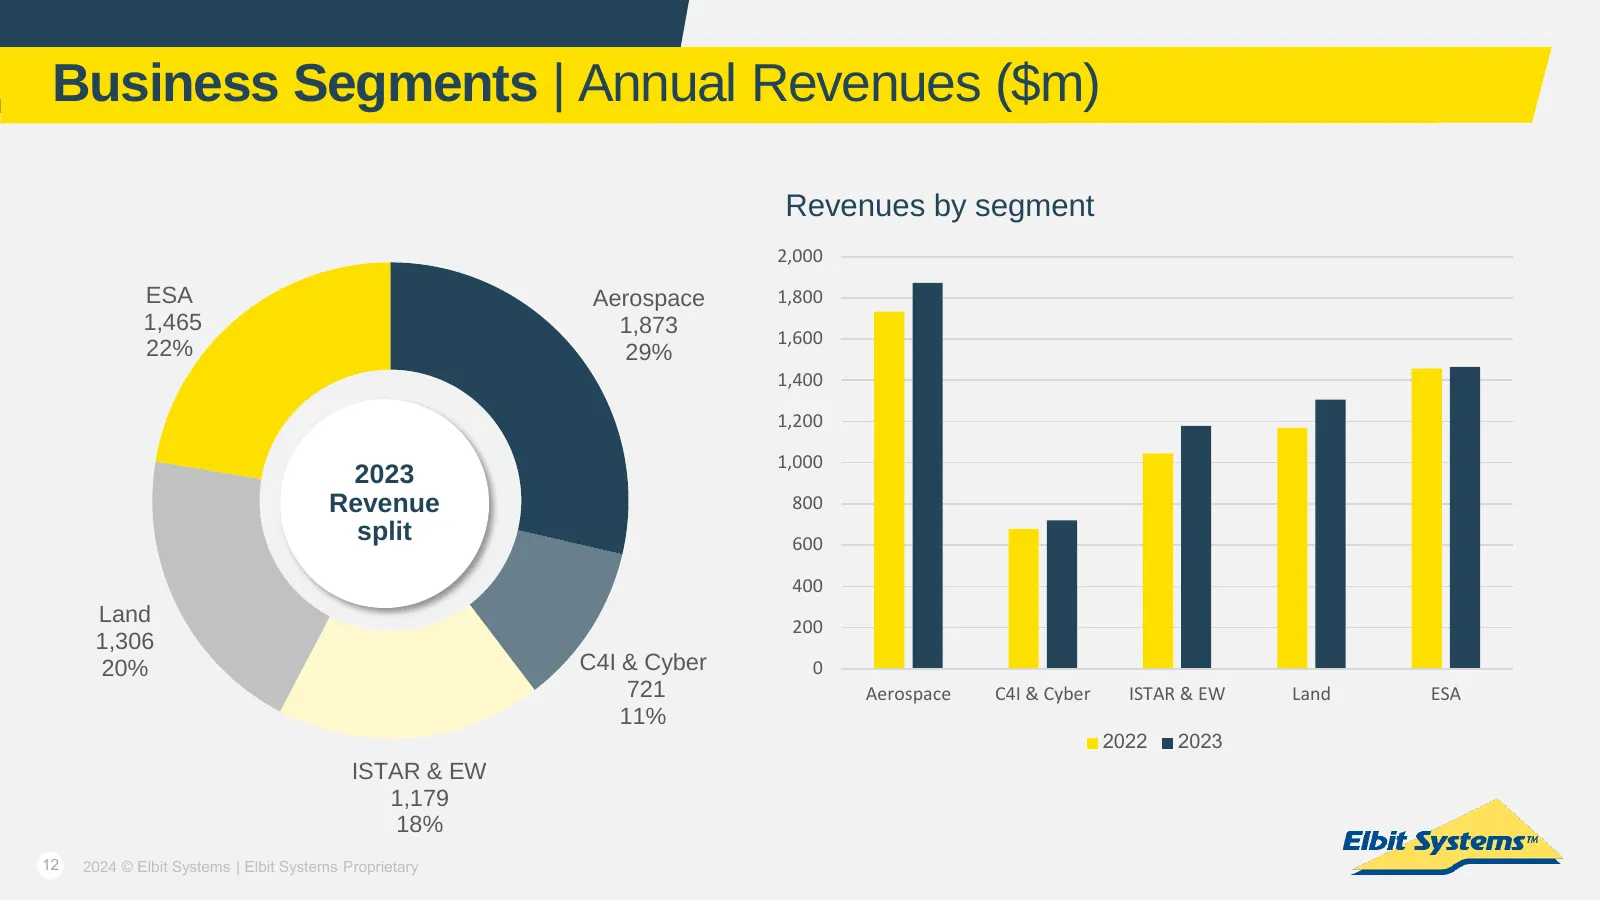
Business Segments | Annual Revenues ($m) Revenues by segment 2,000 ESA Aerospace 1,800 1,465 1,873 1,600 22% 29% 1,400 1,200 1,000 2023 Revenue 800 split 600 400 Land 200 1,306 20% C4I & Cyber 0 721 Aerospace C4I & Cyber ISTAR & EW Land ESA 11% 2022 2023 ISTAR & EW 1,179 18% 12 2024 © Elbit Systems
Slide 13: Business Segments | Annual Operating Income
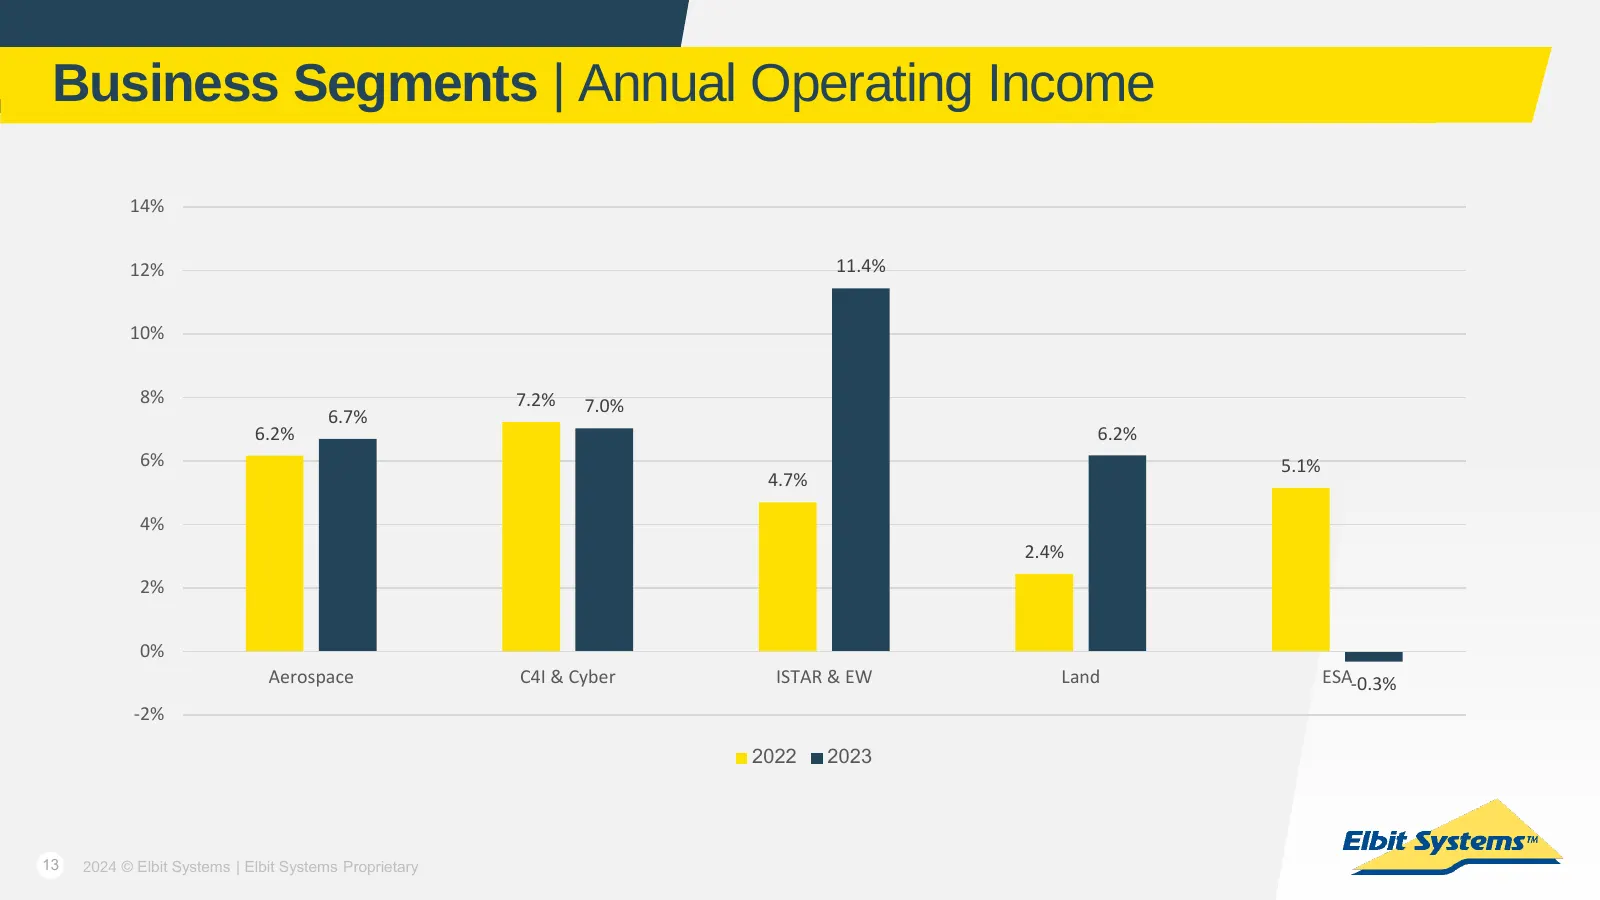
Business Segments | Annual Operating Income 14% 12% 11.4% 10% 8% 7.2% 7.0% 6.7% 6.2% 6.2% 6% 5.1% 4.7% 4% 2.4% 2% 0% Aerospace C4I & Cyber ISTAR & EW Land ESA-0.3% -2% 2022 2023 13 2024 © Elbit Systems | Elbit Systems Proprietary
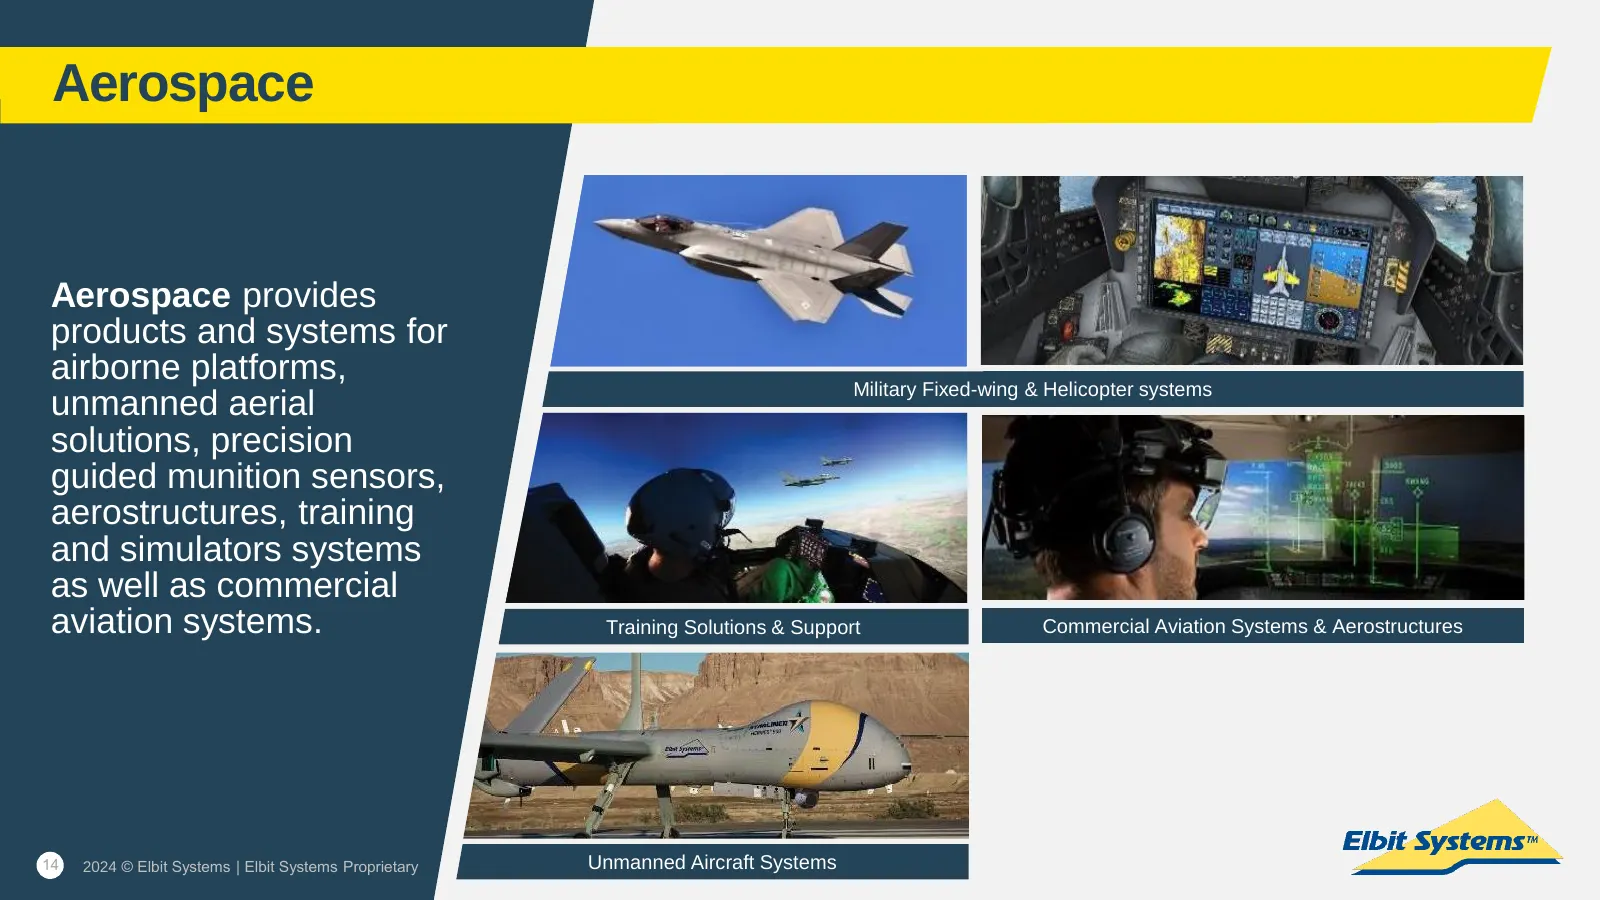
Slide 14: Aerospace
Aerospace Aerospace provides products and systems for airborne platforms, Military Fixed-wing & Helicopter systems unmanned aerial solutions, precision guided munition sensors, aerostructures, training and simulators systems as well as commercial aviation systems. Training Solutions & Support Commer
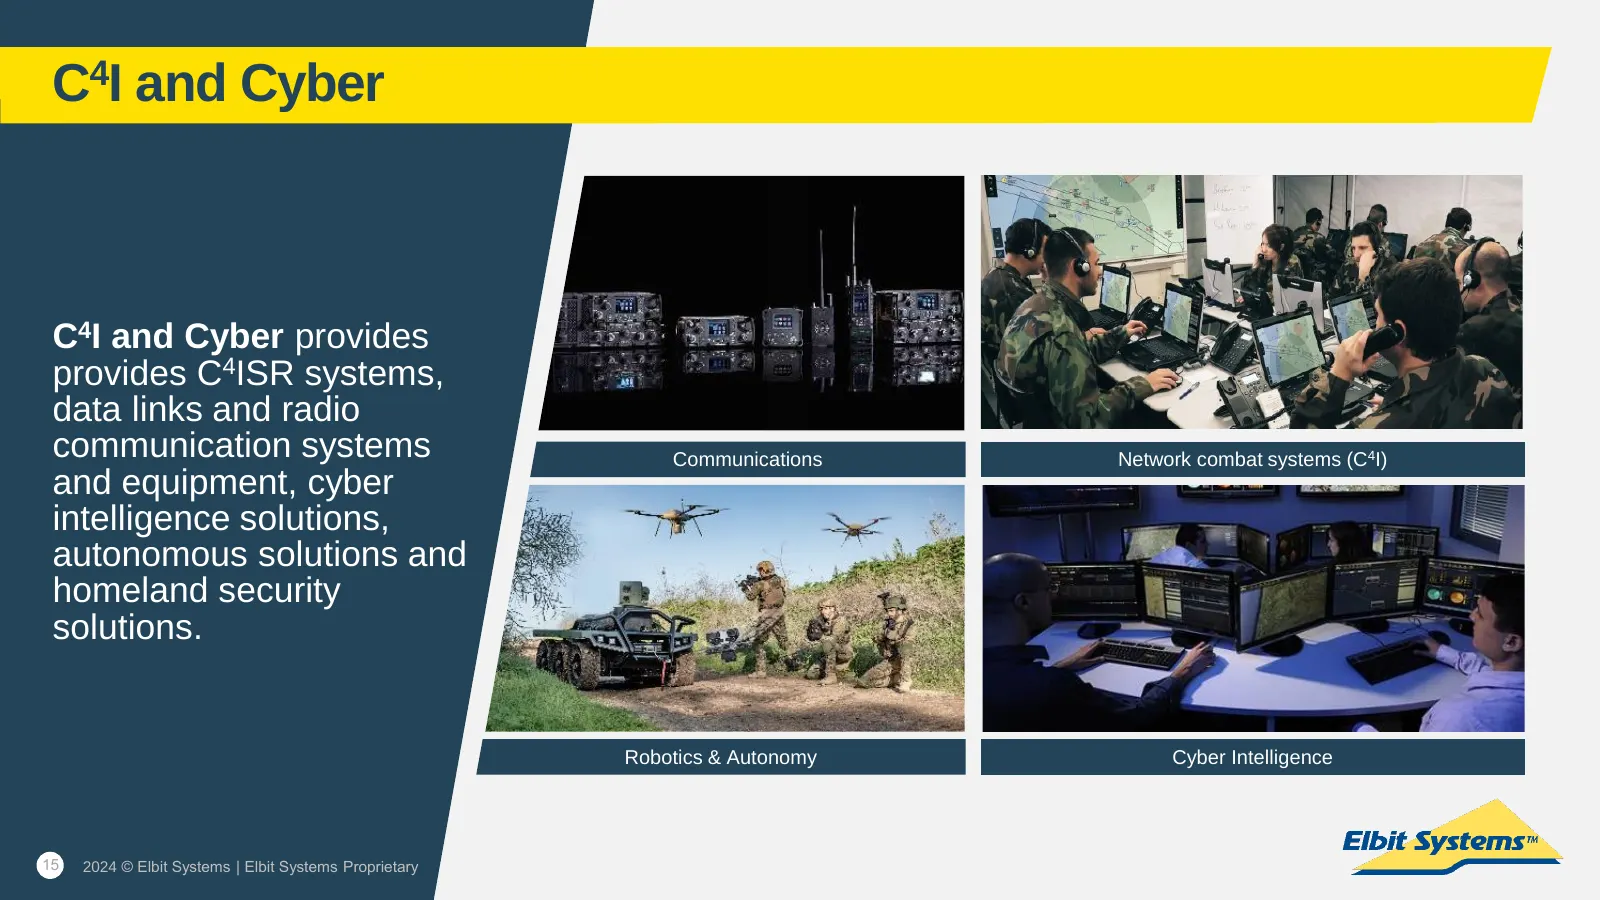
Slide 15: C4I and Cyber
C4I and Cyber C4I and Cyber provides provides C4ISR systems, data links and radio communication systems Communications Network combat systems (C4I) and equipment, cyber intelligence solutions, autonomous solutions and homeland security solutions. Robotics & Autonomy Cyber Intelligence 15 2024 © Elbi
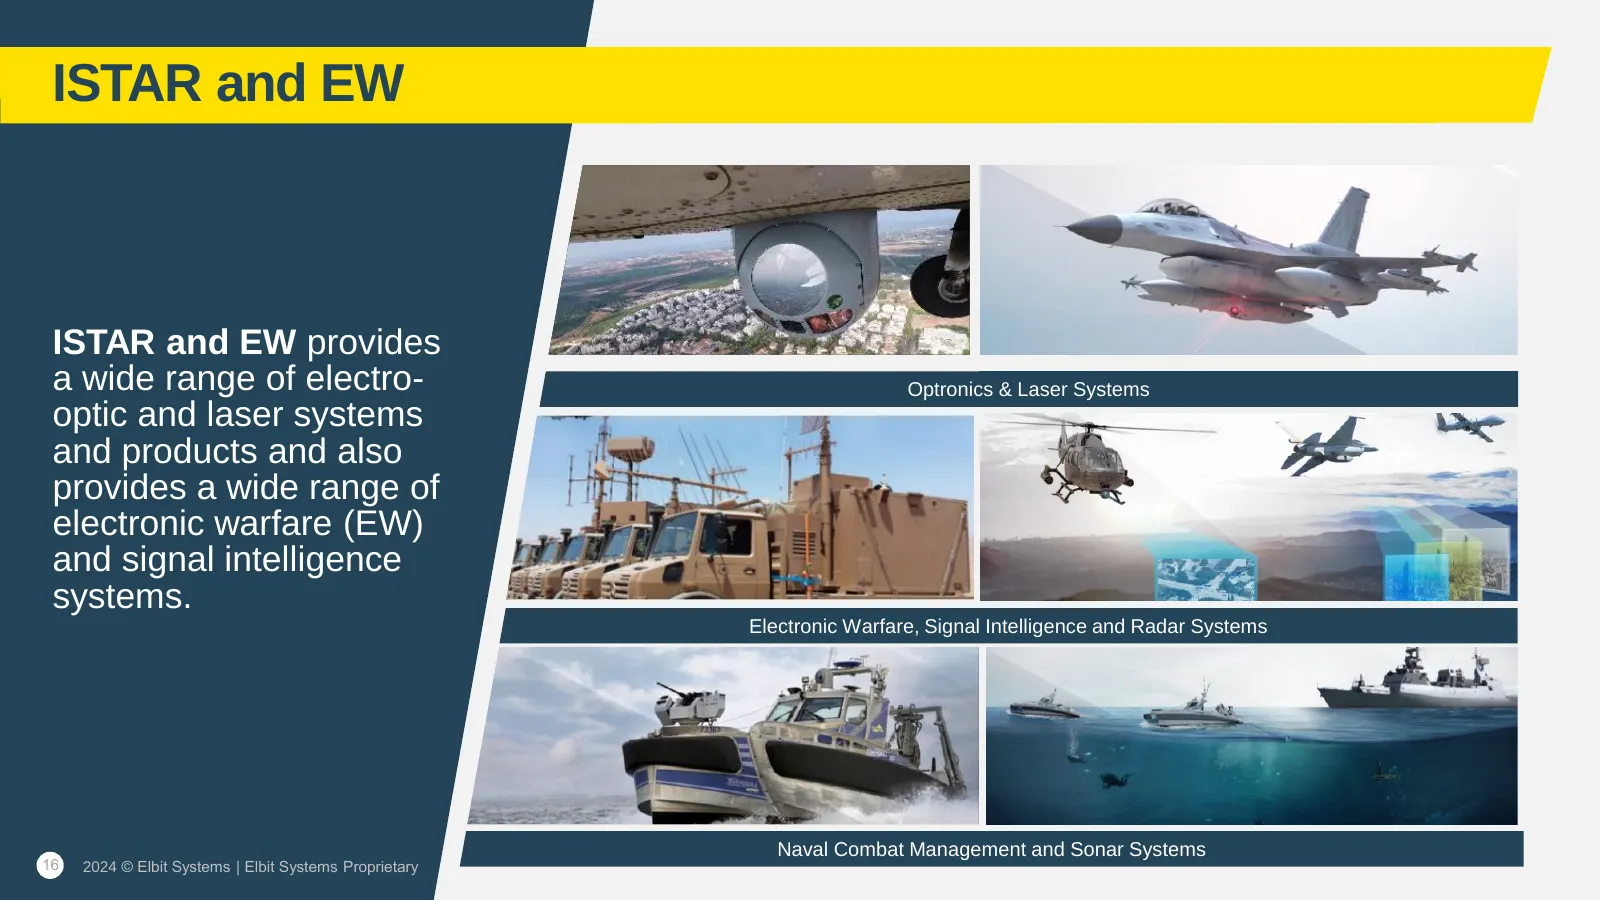
Slide 16: ISTAR and EW
ISTAR and EW ISTAR and EW provides a wide range of electro- Optronics & Laser Systems optic and laser systems and products and also provides a wide range of להוסיף תמונה electronic warfare (EW) and signal intelligence systems. Electronic Warfare, Signal Intelligence and Radar Systems Naval Combat
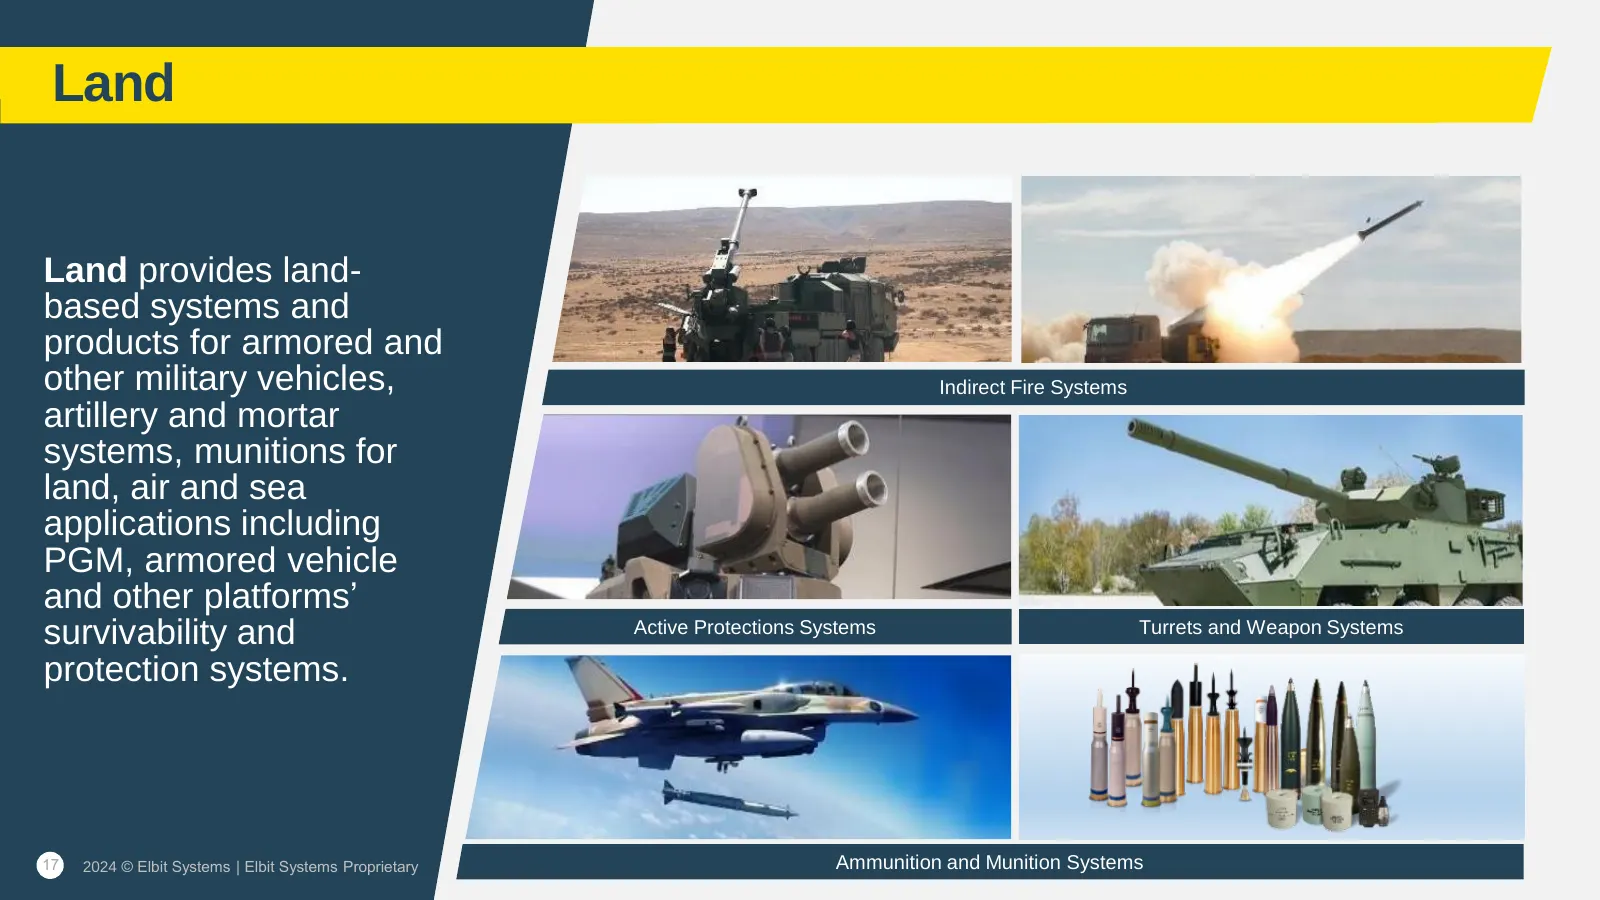
Slide 17: Land
Land Land provides land- based systems and products for armored and other military vehicles, Indirect Fire Systems artillery and mortar systems, munitions for land, air and sea applications including PGM, armored vehicle and other platforms’ survivability and Active Protections Systems Turrets and W
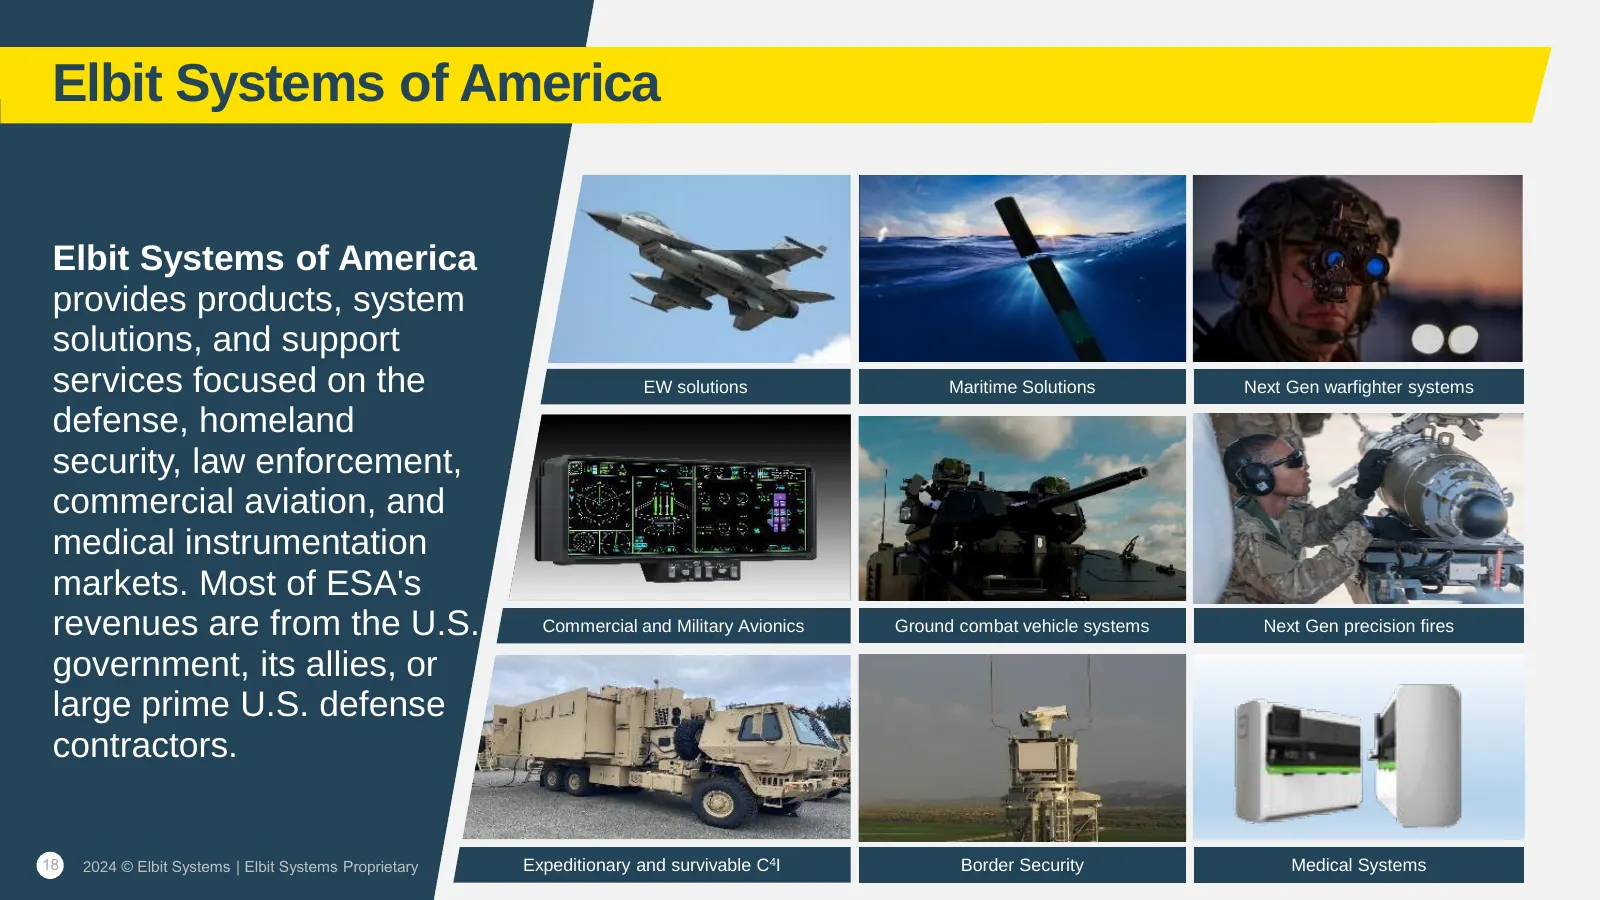
Slide 18: Elbit Systems of America
Elbit Systems of America Elbit Systems of America provides products, system solutions, and support services focused on the EW solutions Maritime Solutions Next Gen warfighter systems defense, homeland security, law enforcement, commercial aviation, and medical instrumentation markets. Most of ESA's
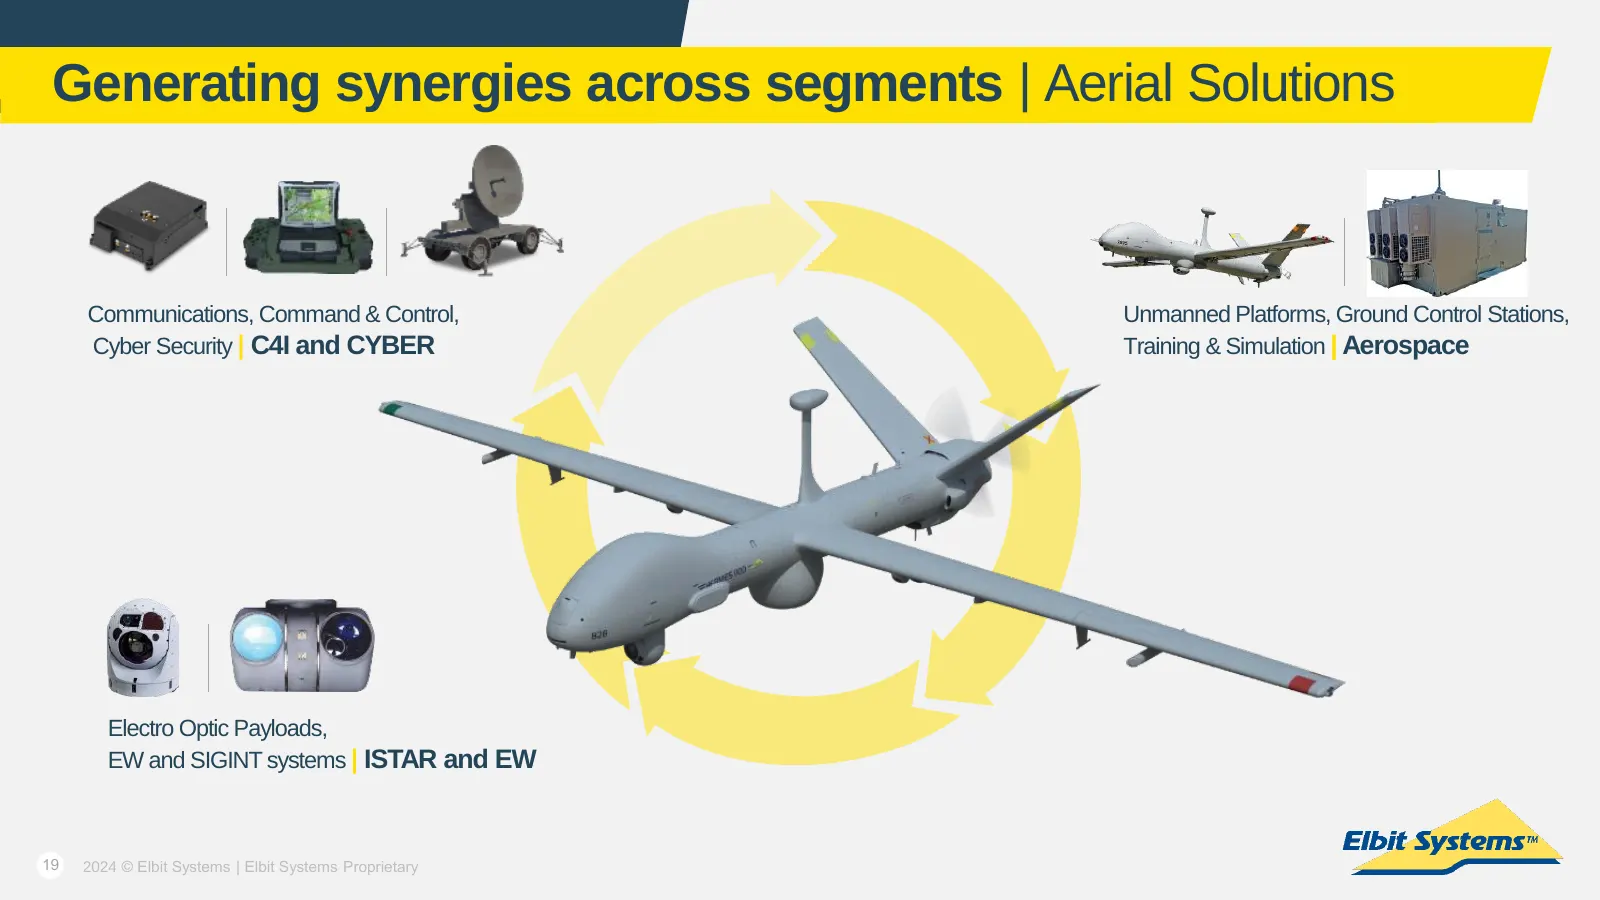
Slide 19: Generating synergies across segments | Aerial Solutions
Generating synergies across segments | Aerial Solutions Communications, Command & Control, Unmanned Platforms, Ground Control Stations, Cyber Security | C4I and CYBER Training & Simulation | Aerospace Electro Optic Payloads, EW and SIGINT systems | ISTAR and EW 19 2024 © Elbit Systems | Elbit System
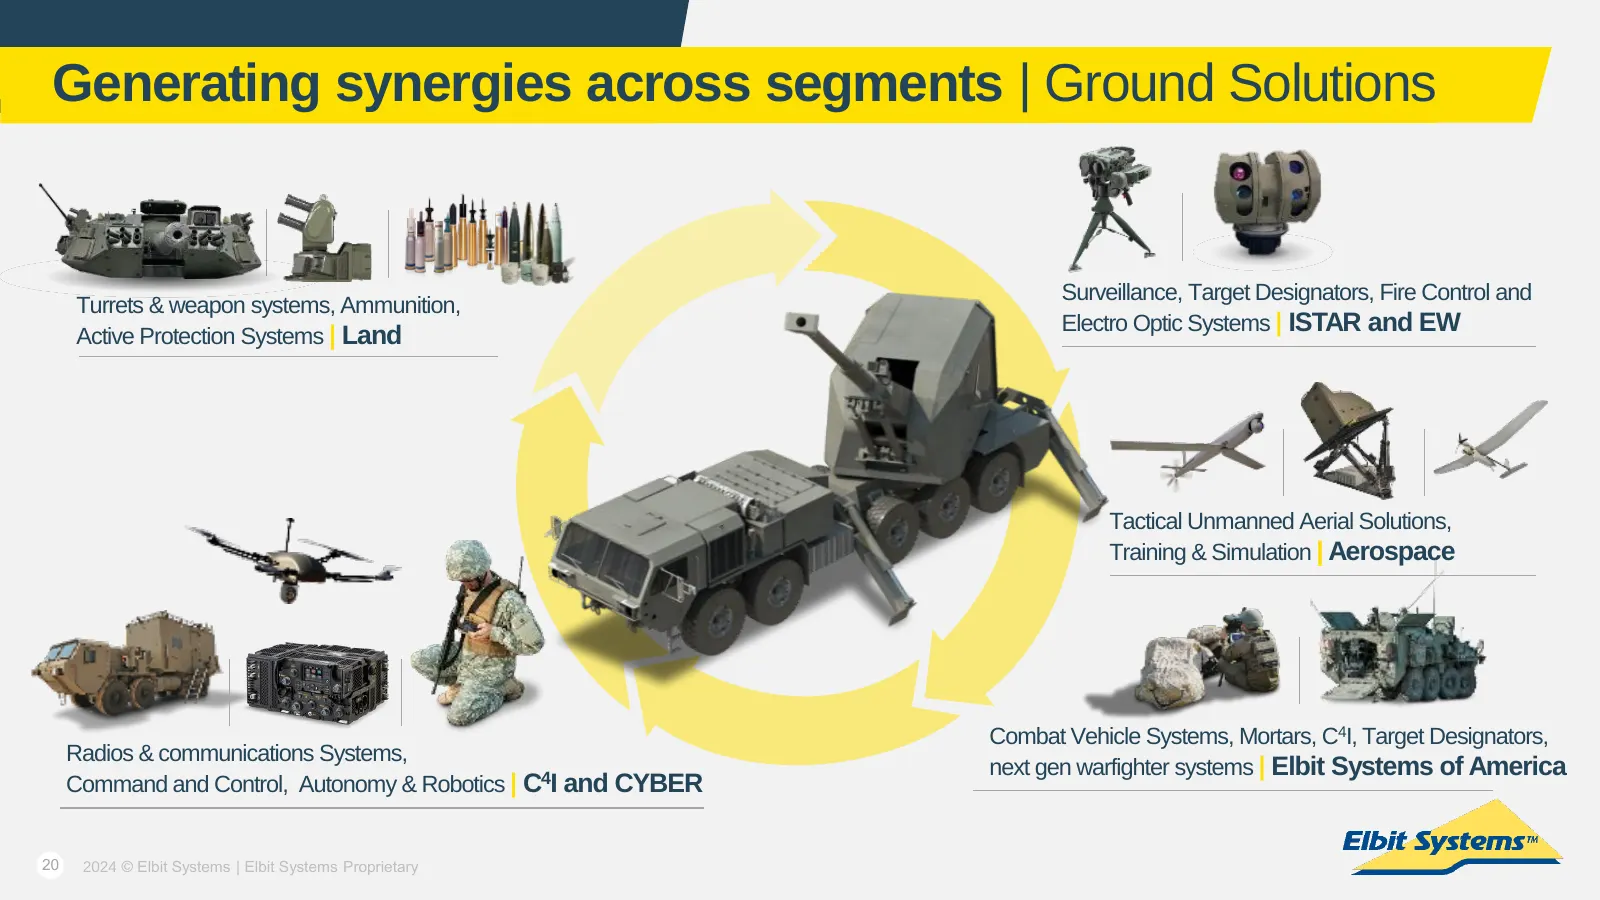
Slide 20: Generating synergies across segments | Ground Solutions
Generating synergies across segments | Ground Solutions Surveillance, Target Designators, Fire Control and Turrets & weapon systems, Ammunition, Electro Optic Systems | ISTAR and EW Active Protection Systems | Land Tactical Unmanned Aerial Solutions, Training & Simulation | Aerospace Combat Vehicle
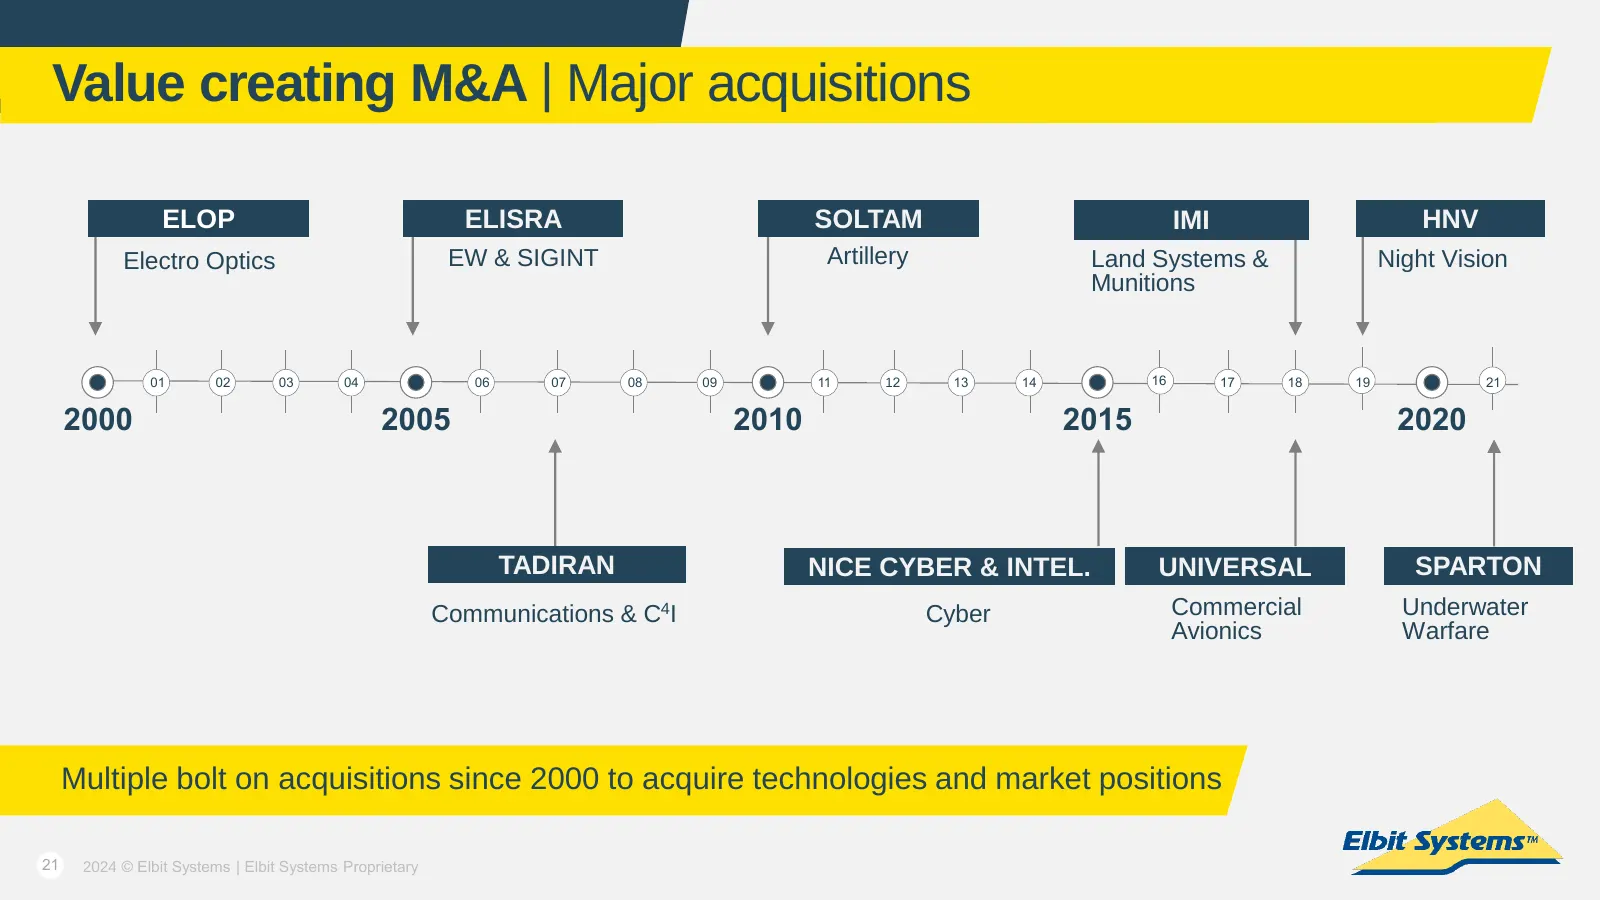
Slide 21: Value creating M&A | Major acquisitions
Value creating M&A | Major acquisitions ELOP ELISRA SOLTAM IMI HNV Electro Optics EW & SIGINT Artillery Land Systems & Night Vision Munitions 01 02 03 04 06 07 08 09 11 12 13 14 16 17 18 19 21 2000 2005 2010 2015 2020 TADIRAN NICE CYBER & INTEL. UNIVERSAL SPARTON Communications & C4I Cyber Commercia
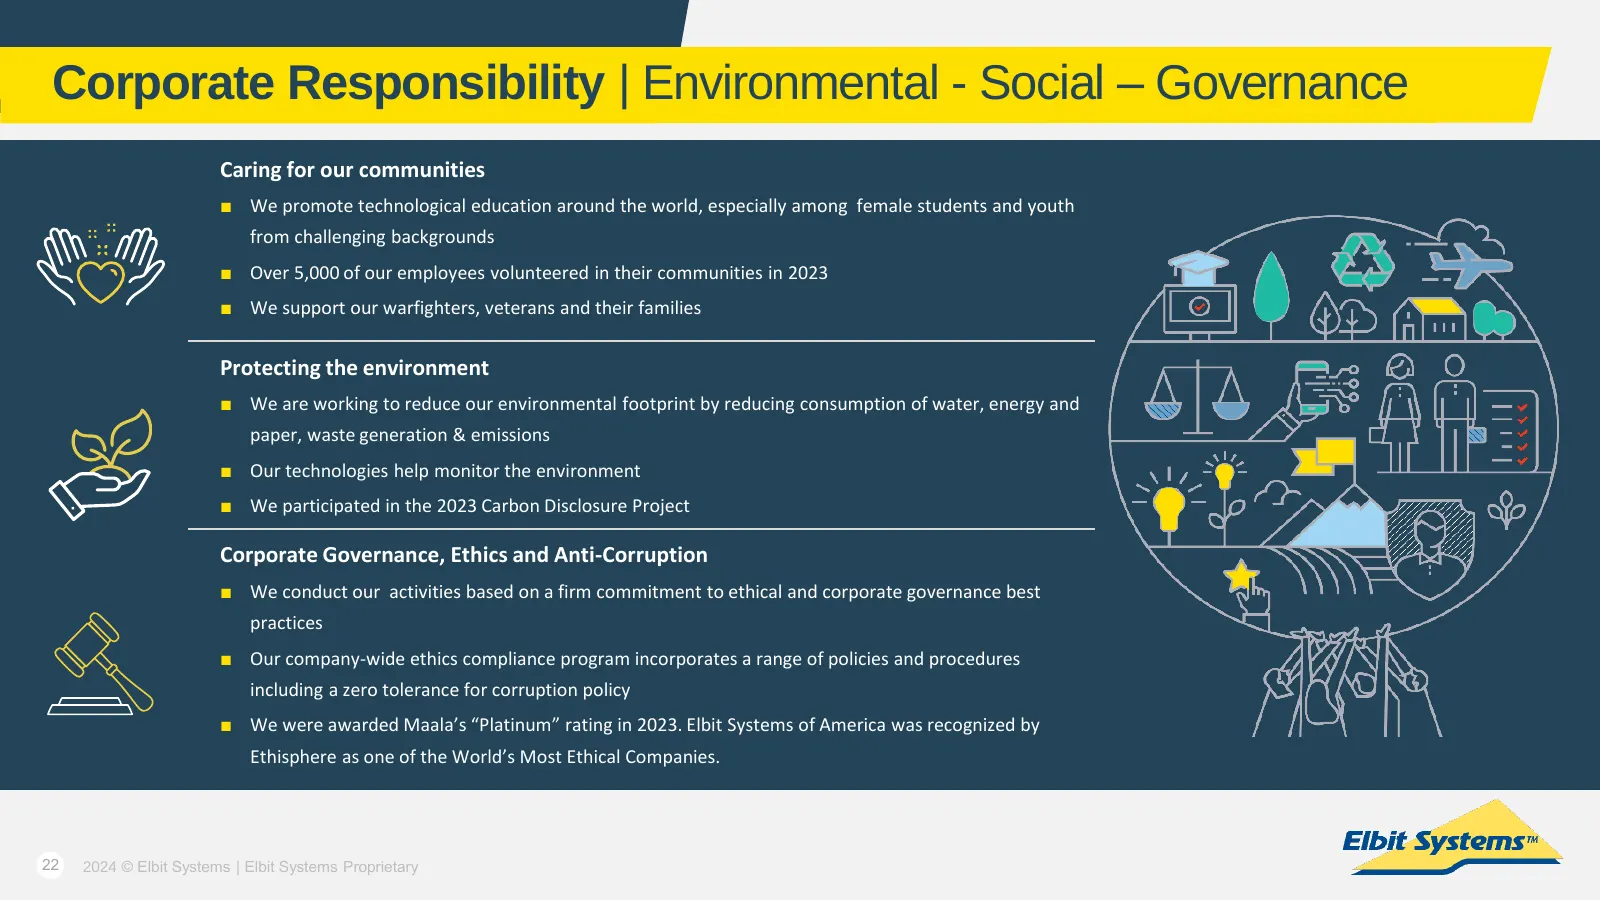
Slide 22: Corporate Responsibility | Environmental - Social – Governance
Corporate Responsibility | Environmental - Social – Governance Caring for our communities ■ We promote technological education around the world, especially among female students and youth from challenging backgrounds ■ Over 5,000 of our employees volunteered in their communities in 2023 ■ We support
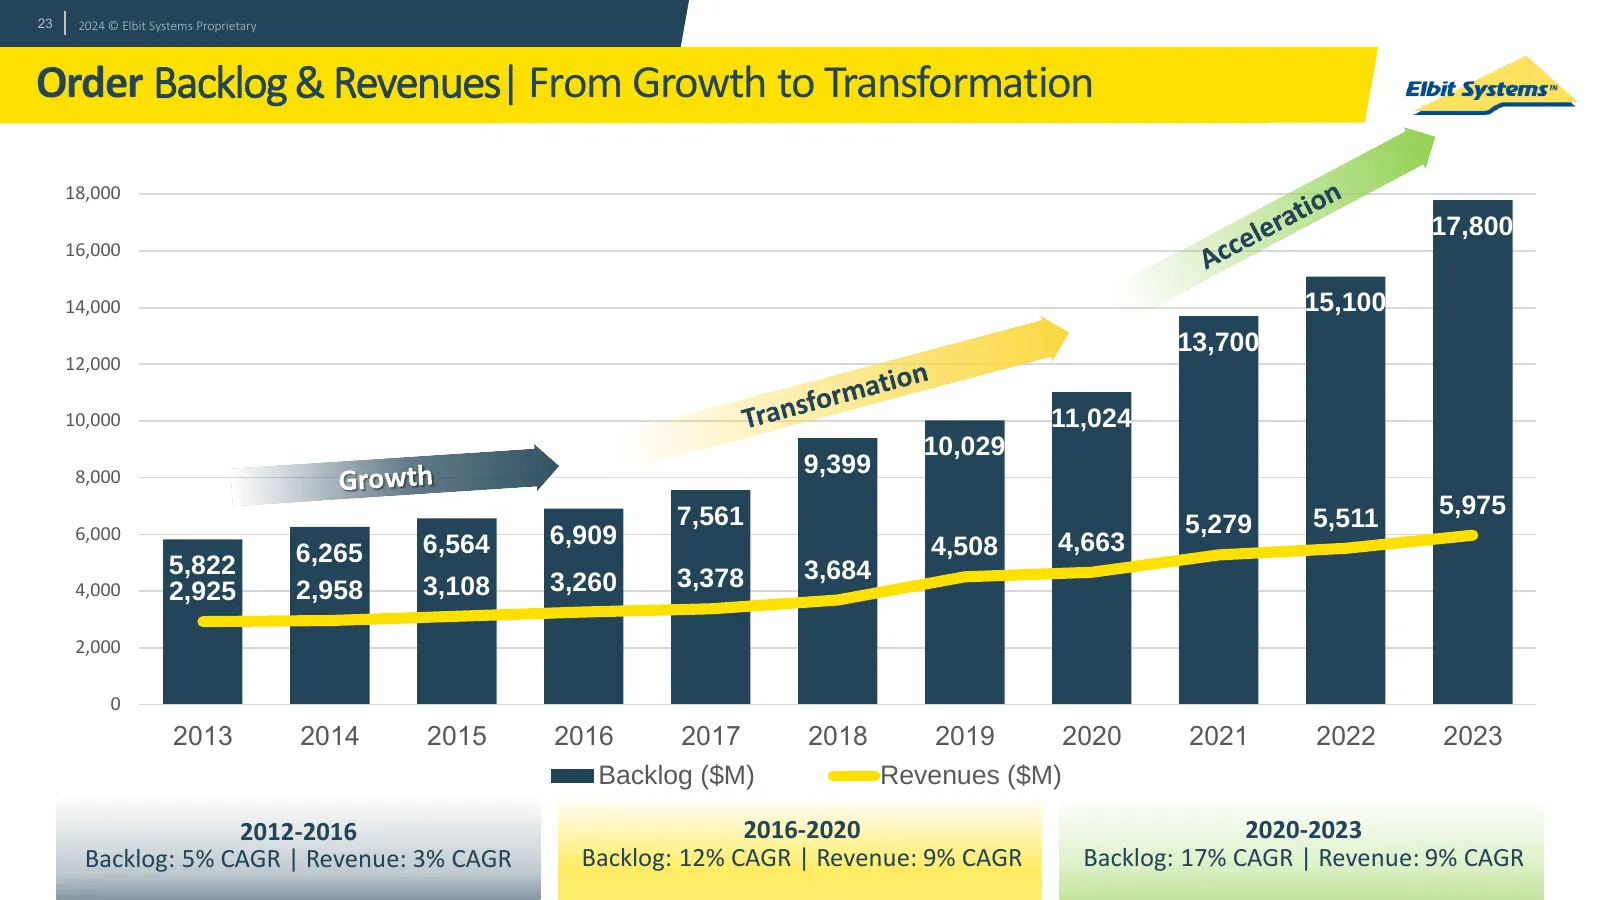
Slide 23: Order Backlog & Revenues | From Growth to Transformation
23 2024 © Elbit Systems Proprietary Order Backlog & Revenues| From Growth to Transformation 18,000 17,800 16,000 14,000 15,100 13,700 12,000 10,000 11,024 10,029 8,000 9,399 7,561 5,511 5,975 6,000 6,909 5,279 6,265 6,564 4,508 4,663 5,822 3,378 3,684 4,000 2,925 2,958 3,108 3,260 2,000 0 2013 2014
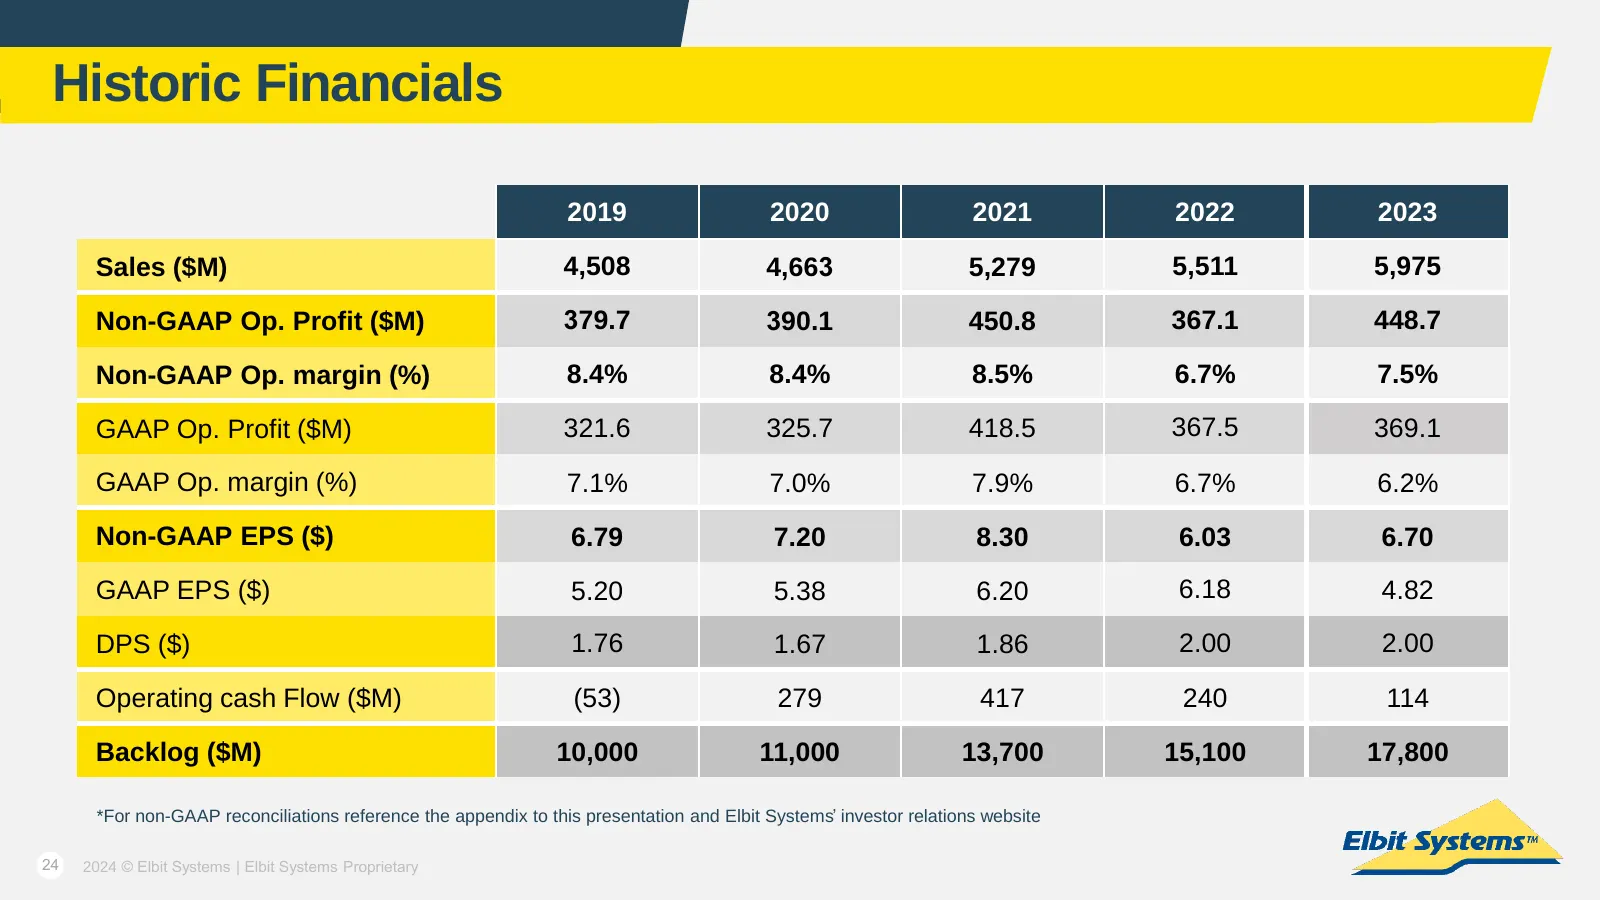
Slide 24: Historic Financials
Historic Financials 2019 2020 2021 2022 2023 Sales ($M) 4,508 4,663 5,279 5,511 5,975 Non-GAAP Op. Profit ($M) 379.7 390.1 450.8 367.1 448.7 Non-GAAP Op. margin (%) 8.4% 8.4% 8.5% 6.7% 7.5% GAAP Op. Profit ($M) 321.6 325.7 418.5 367.5 369.1 GAAP Op. margin (%) 7.1% 7.0% 7.9% 6.7% 6.2% Non-GAAP EPS (
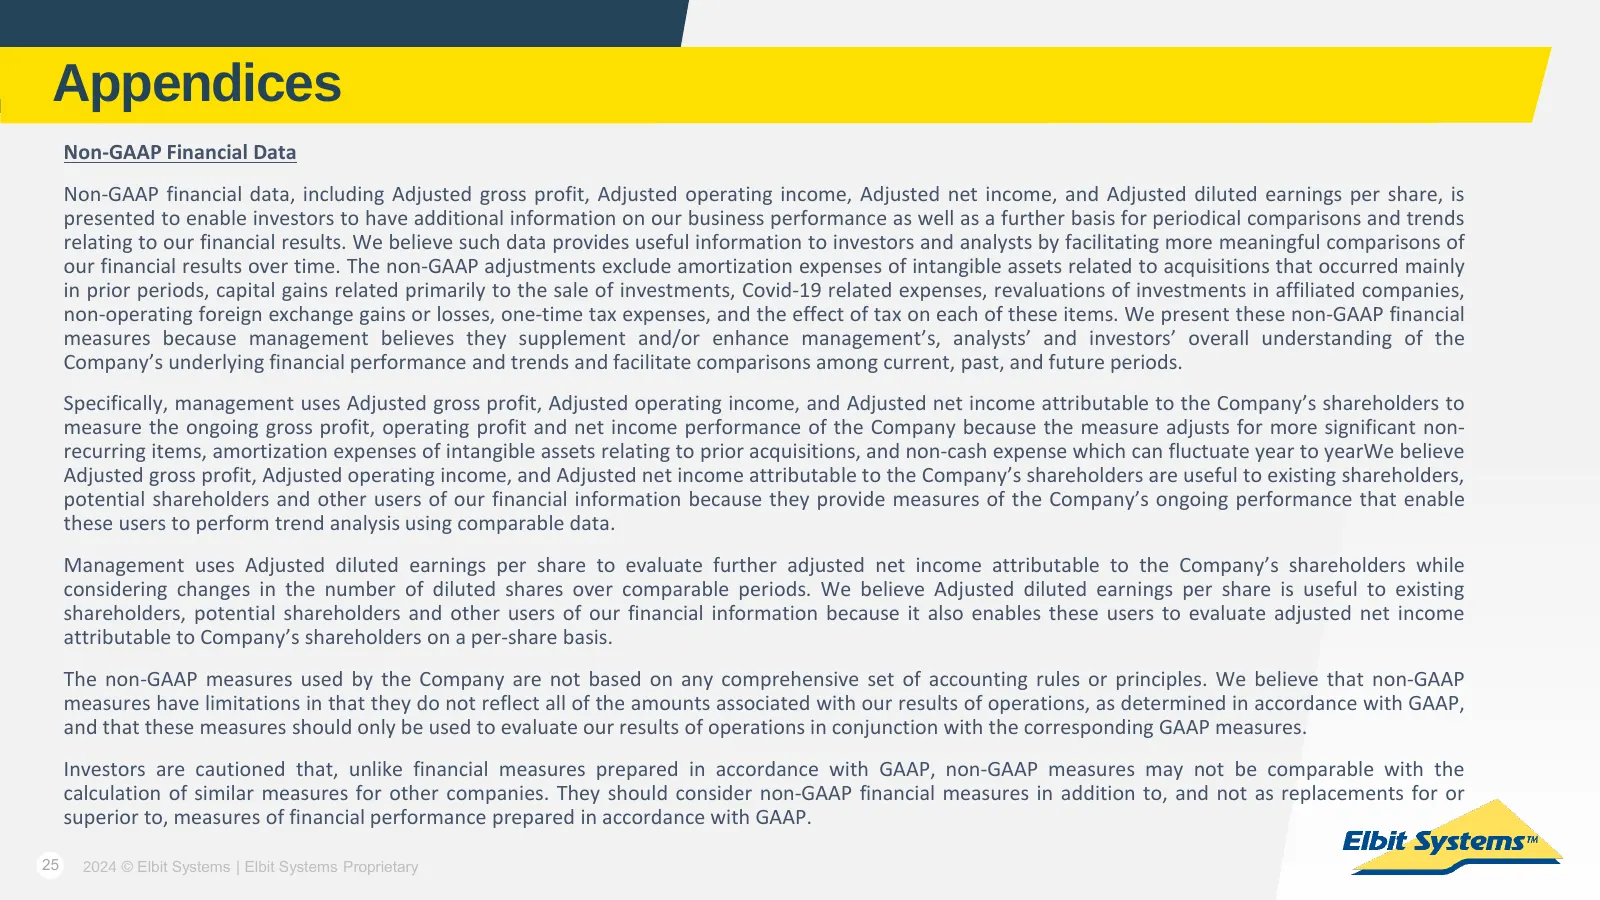
Slide 25: Appendices
Appendices Non-GAAP Financial Data Non-GAAP financial data, including Adjusted gross profit, Adjusted operating income, Adjusted net income, and Adjusted diluted earnings per share, is presented to enable investors to have additional information on our business performance as well as a further basis
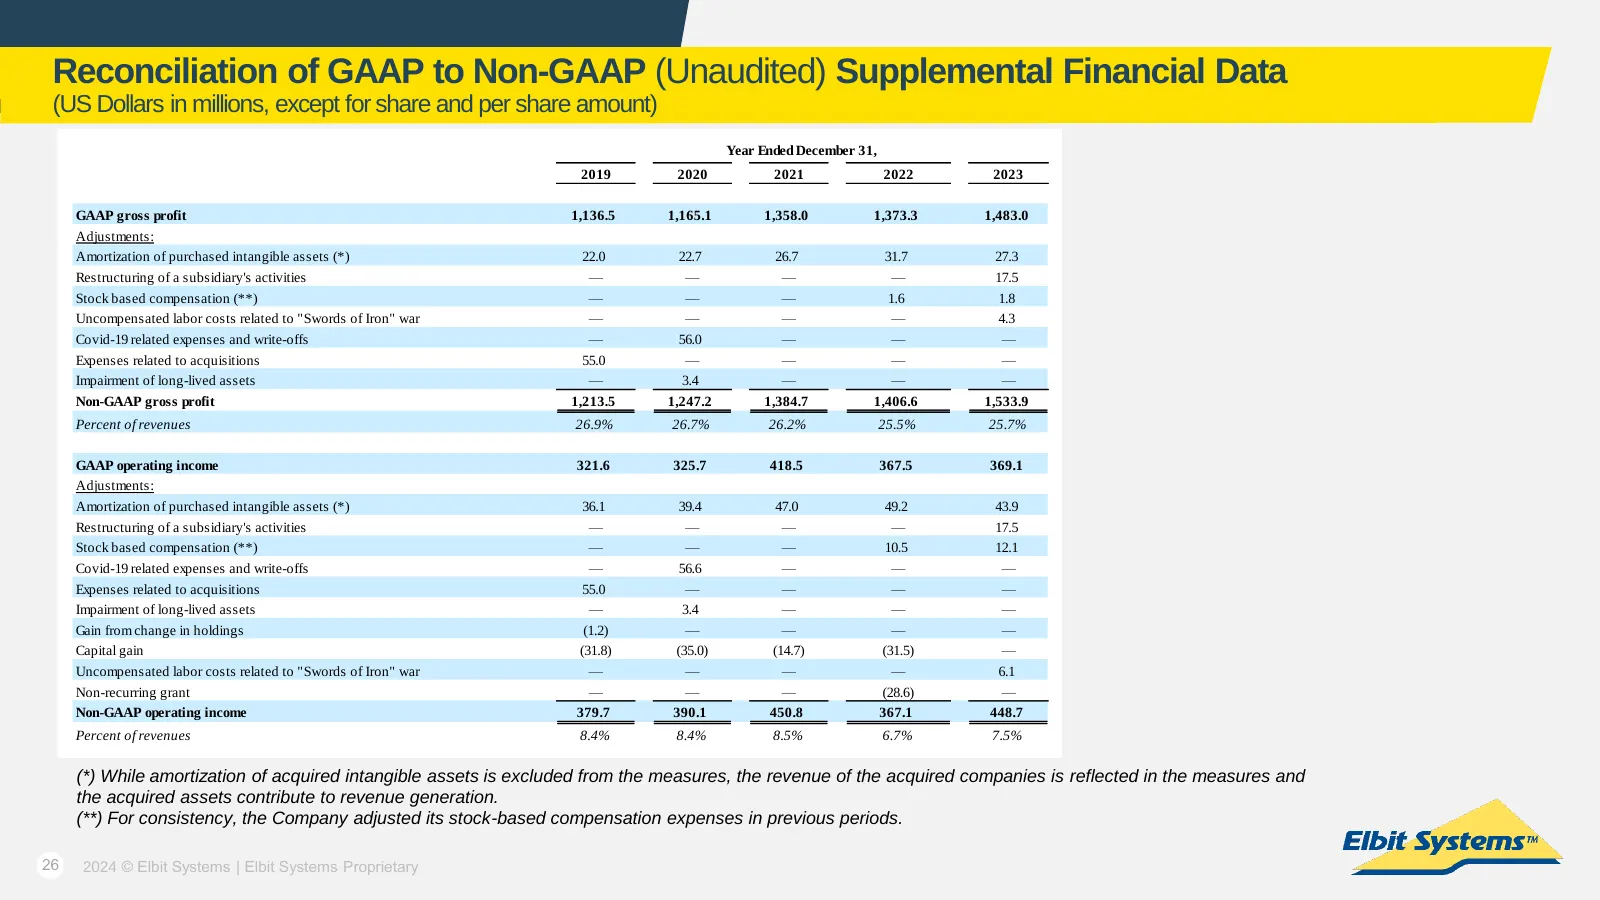
Slide 26: Reconciliation of GAAP to Non-GAAP Supplemental Financial Data
Reconciliation of GAAP to Non-GAAP (Unaudited) Supplemental Financial Data (US Dollars in millions, except for share and per share amount) Year Ended December 31, 2019 2020 2021 2022 2023 GAAP gross profit 1,136.5 1,165.1 1,358.0 1,373.3 1,483.0 Adjustments: Amortization of purchased intangible asse
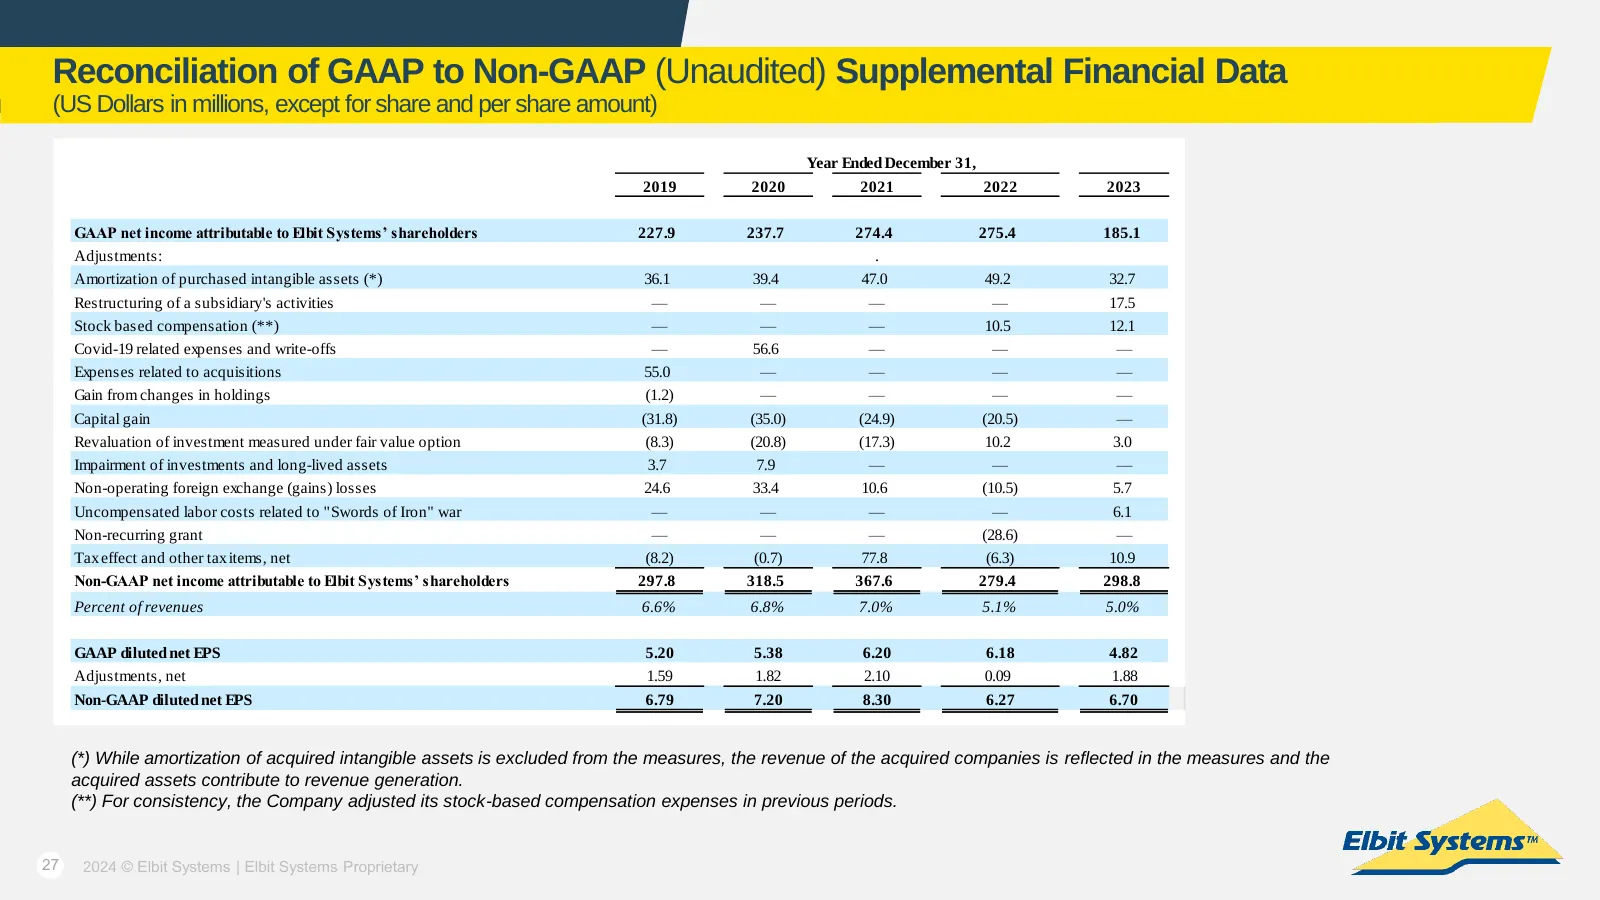
Slide 27: Reconciliation of GAAP to Non-GAAP Supplemental Financial Data
Reconciliation of GAAP to Non-GAAP (Unaudited) Supplemental Financial Data (US Dollars in millions, except for share and per share amount) Year Ended December 31, 2019 2020 2021 2022 2023 GAAP net income attributable to Elbit Systems’ shareholders 227.9 237.7 274.4 275.4 185.1 Adjustments: . Amortiz

Slide 28: Thank You
THANK YOU INVESTOR CONTACTS Dr. Yaacov (Kobi) Kagan, Executive VP – CFO Tel: +972-77296663 | kobi.kagan@elbitsystems.com Dr. David Ravia, Investor Relations Tel: +972-772947169 | david.ravia@elbitsystems.com elbitsystems.com
Source: company website
More decks from Elbit Systems Ltd
 Q3 2026 Earnings Presentation27 slides · November 2026
 Q2 2026 Earnings Presentation16 slides · August 2026
 Q1 2026 Earnings Presentation21 slides · Jun 3, 2026
 Q1 2026 Earnings Presentation17 slides · May 26, 2026
 Q4 2025 Earnings Presentation16 slides · Mar 17, 2026
 Q3 2025 Earnings Presentation19 slides · Nov 18, 2025