Elbit Systems Ltd · TASE:ESLT
Elbit Systems — Q3 2026 Earnings Presentation
27 slides from Elbit Systems's earnings presentation, November 2026
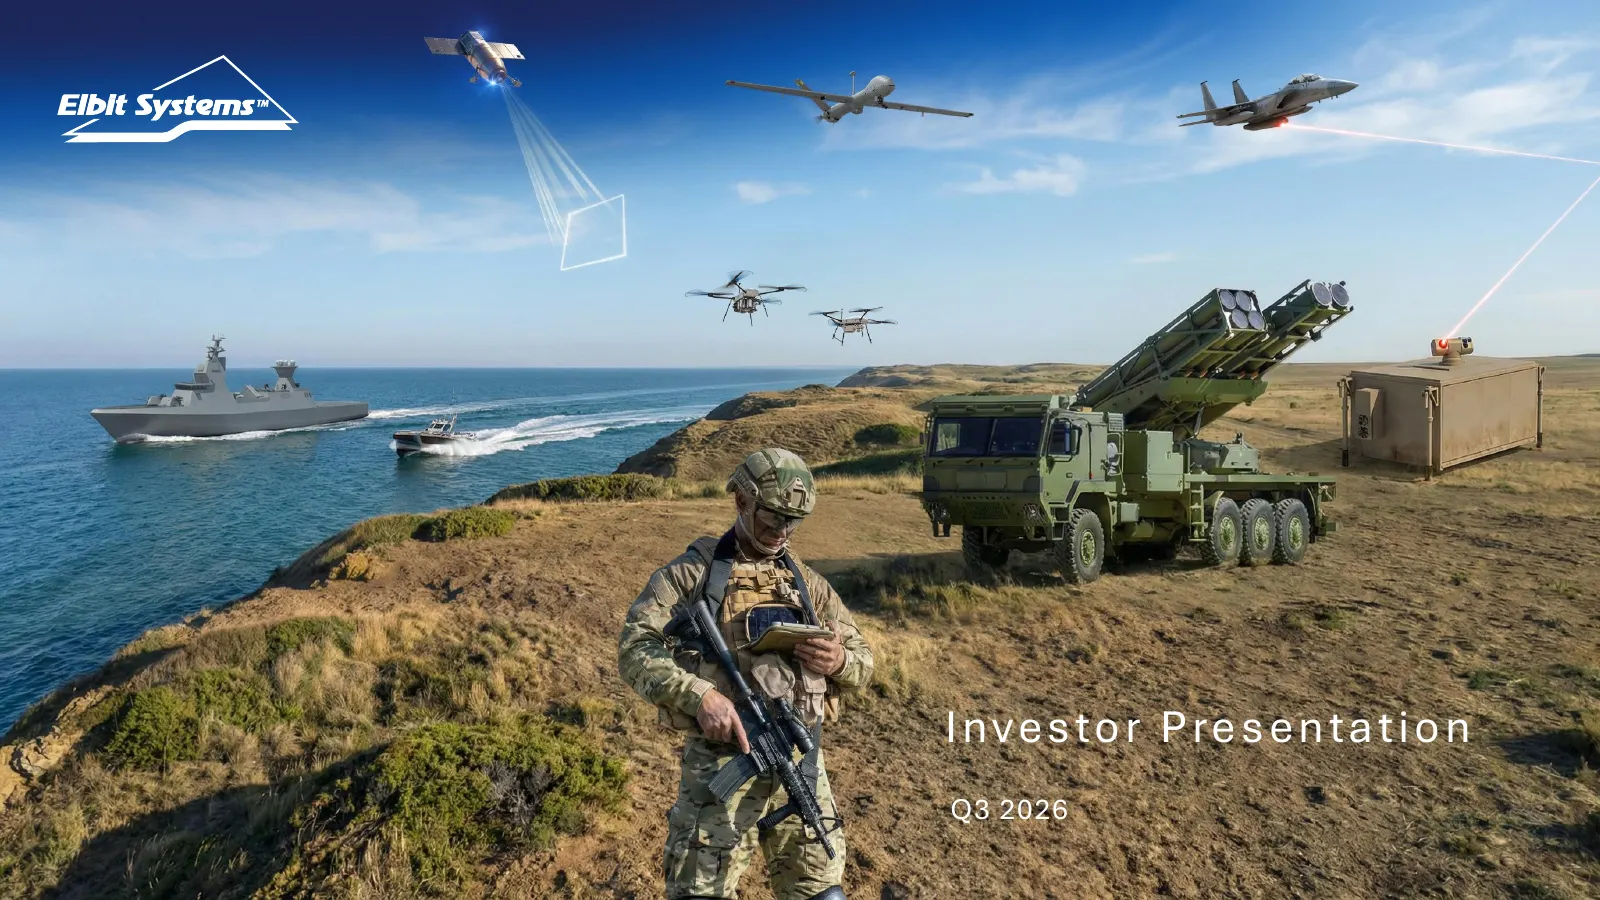
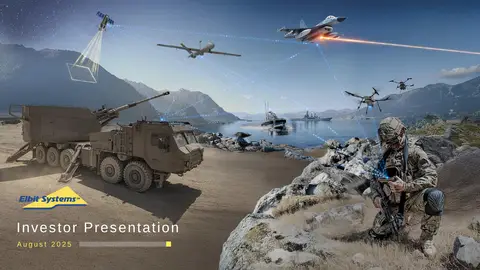
Slide 1: Investor Presentation Q3 2026
I n ve s t o r Pre s e n t at i o n Q3 2026
Slide 2: Disclaimer
// 2 DISCLAIMER This presentation, reference to which herein includes information that may be provided by 27A of the Securities Act of 1933, as amended, Section 21E of the Securities Exchange Act Elbit Systems Ltd. ("Elbit systems", and collectively with any or all of its subsidiaries, the of 1934,
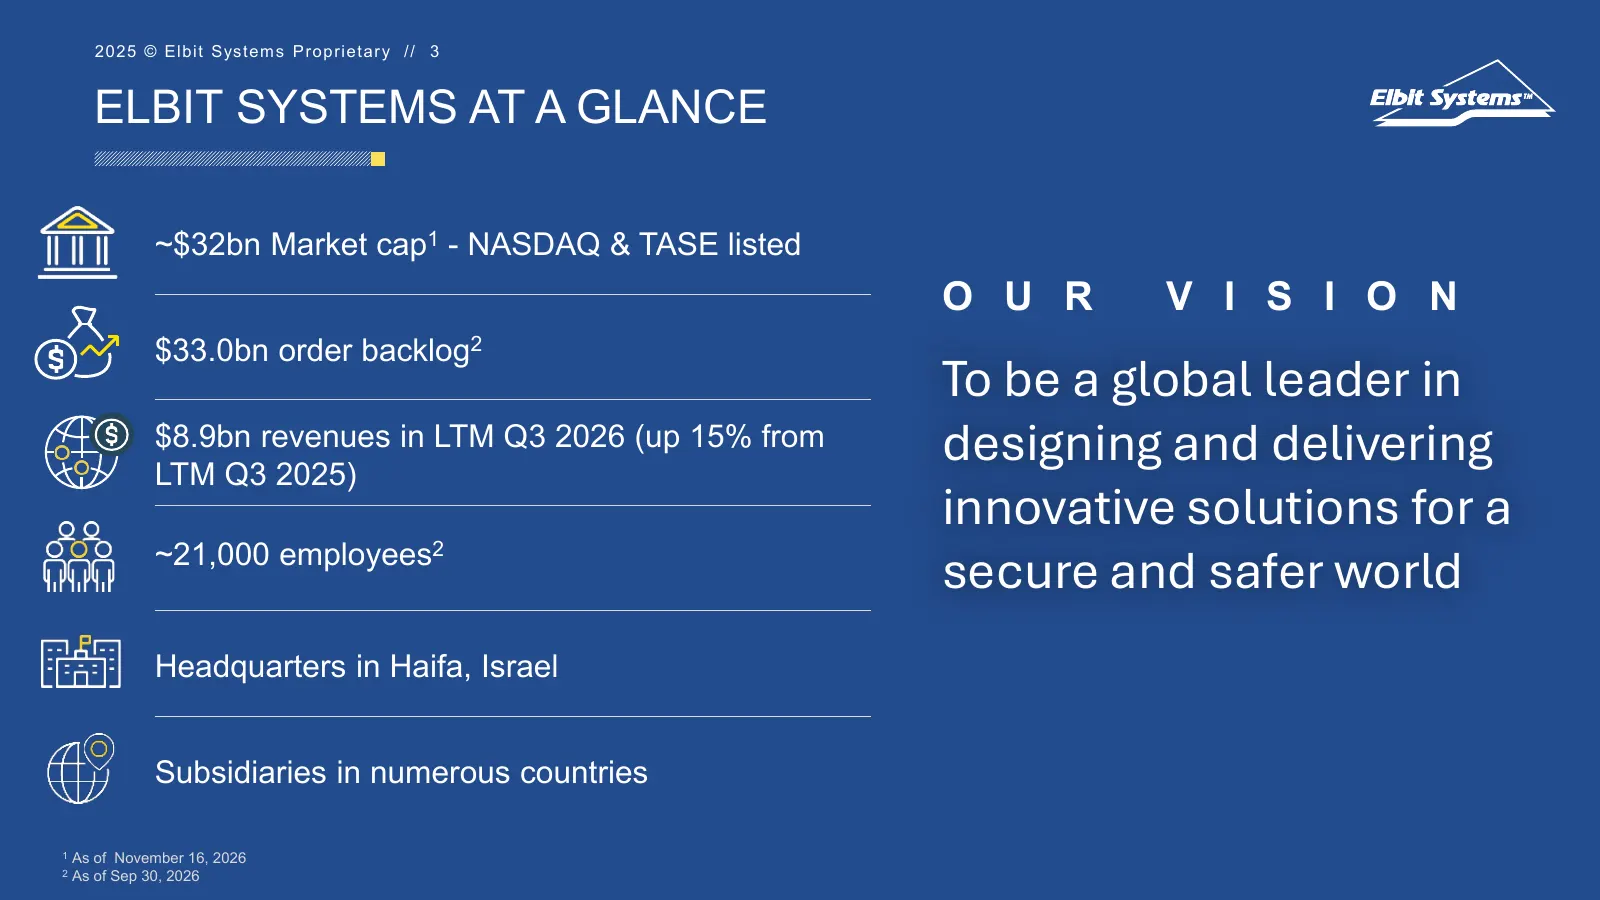
Slide 3: Elbit Systems at a Glance
2025 © Elbit Sys tem s Pr opr ietar y // 3 ELBIT SYSTEMS AT A GLANCE ~$32bn Market cap1 - NASDAQ & TASE listed O U R V I S I O N $33.0bn order backlog2 To be a global leader in $8.9bn revenues in LTM Q3 2026 (up 15% from LTM Q3 2025) designing and delivering innovative solutions for a ~21,000 employ
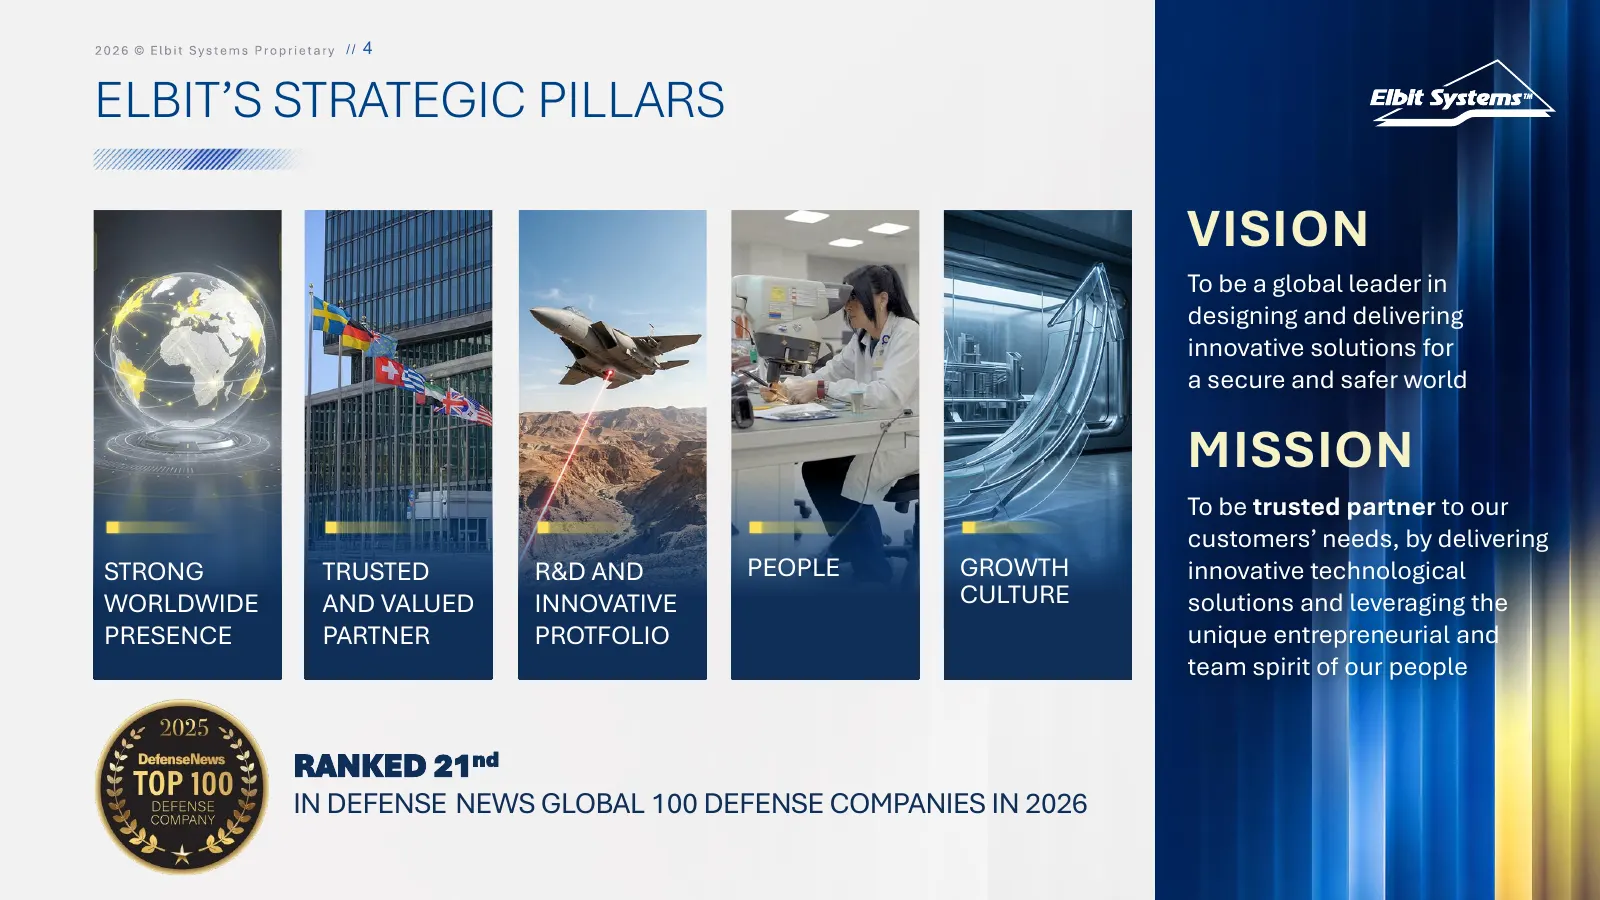
Slide 4: Elbit's Strategic Pillars
// 4 ELBIT’S STRATEGIC PILLARS VISION To be a global leader in designing and delivering innovative solutions for a secure and safer world MISSION To be trusted partner to our customers’ needs, by delivering STRONG TRUSTED R&D AND PEOPLE GROWTH innovative technological WORLDWIDE AND VALUED INNOVATIVE
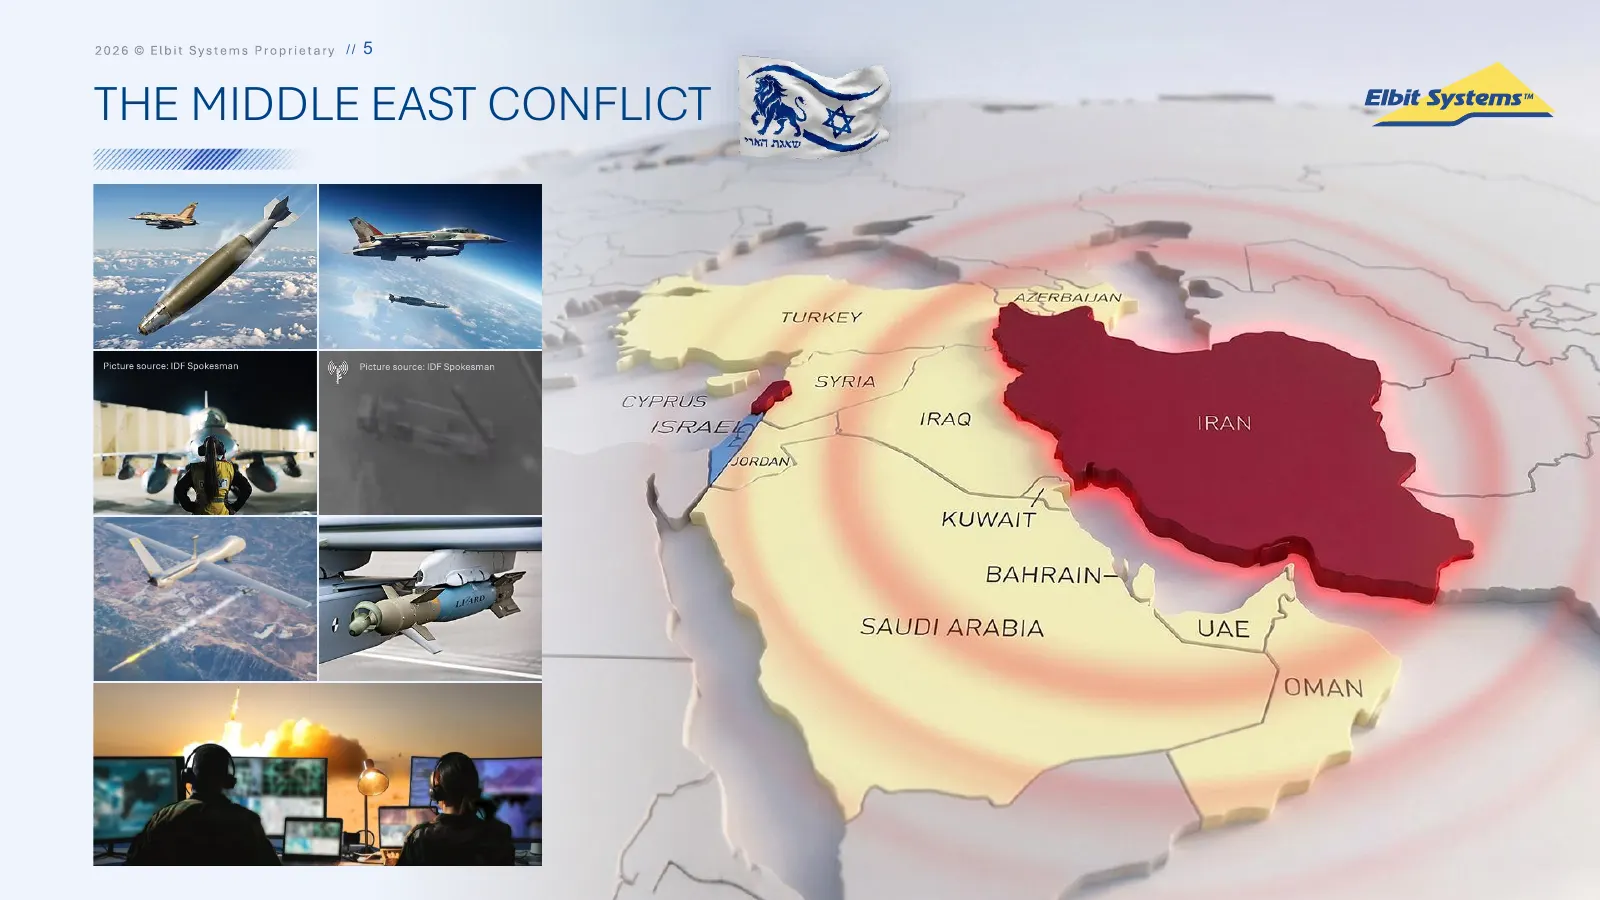
Slide 5: The Middle East Conflict
2026 © Elb! us THE MIDDLE EAST CONFLICT & he en sms ROE. WOOUWM « KUWAIT BAHRAIN-=4 N SAUDI ARABIA
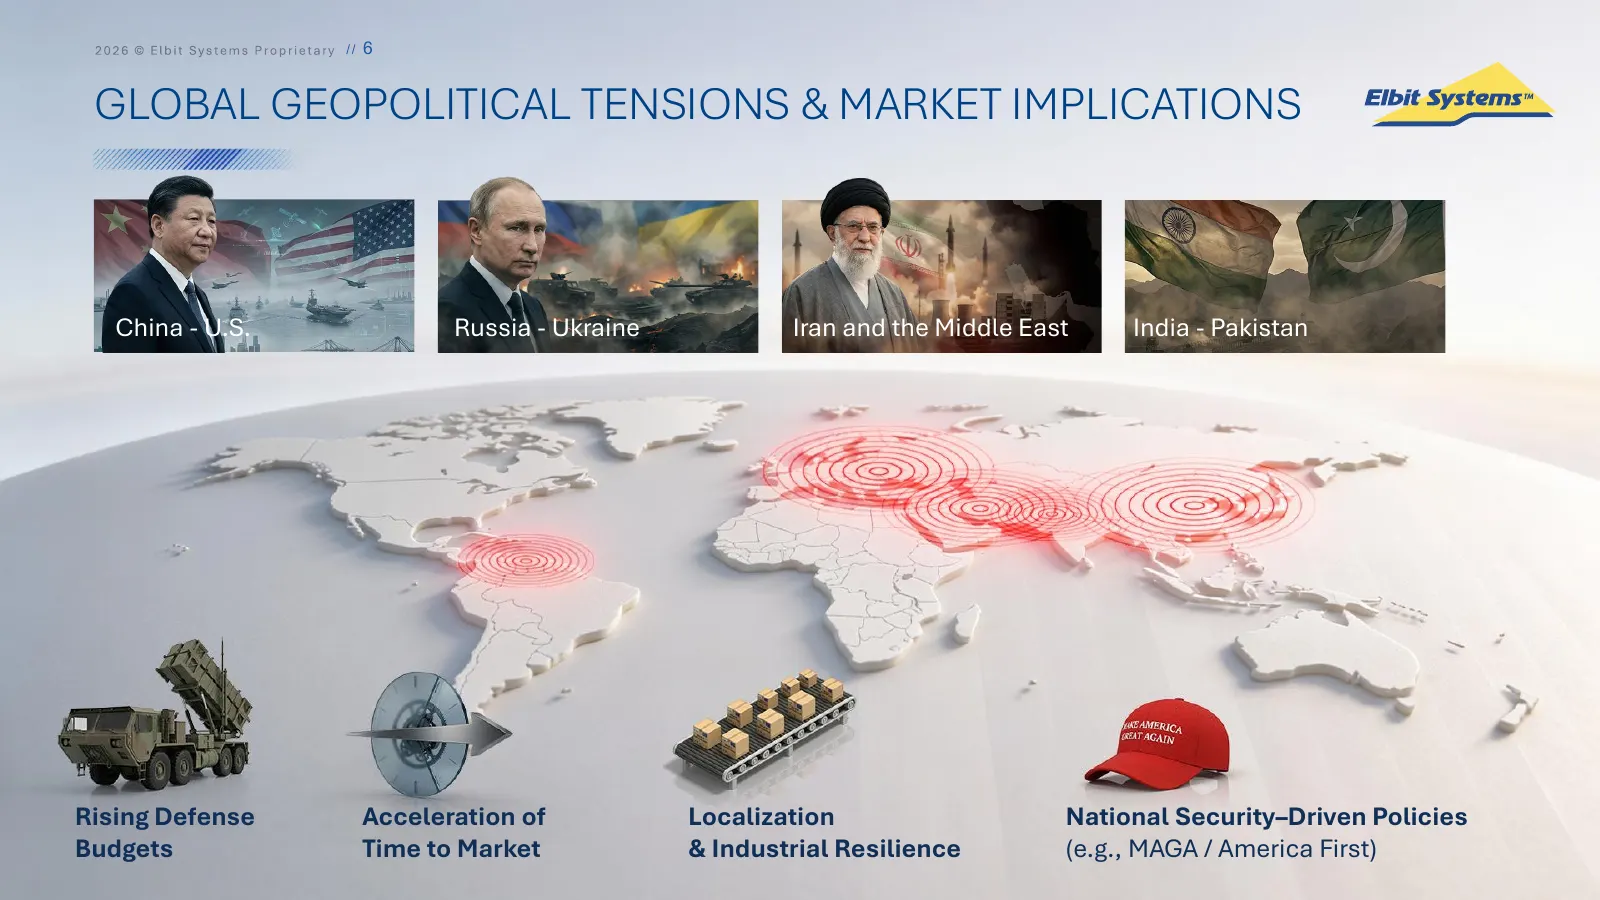
Slide 6: Global Geopolitical Tensions & Market Implications
// 6 GLOBAL GEOPOLITICAL TENSIONS & MARKET IMPLICATIONS China - U.S. Russia - Ukraine Iran and the Middle East India - Pakistan Rising Defense Acceleration of Localization National Security–Driven Policies Budgets Time to Market & Industrial Resilience (e.g., MAGA / America First)
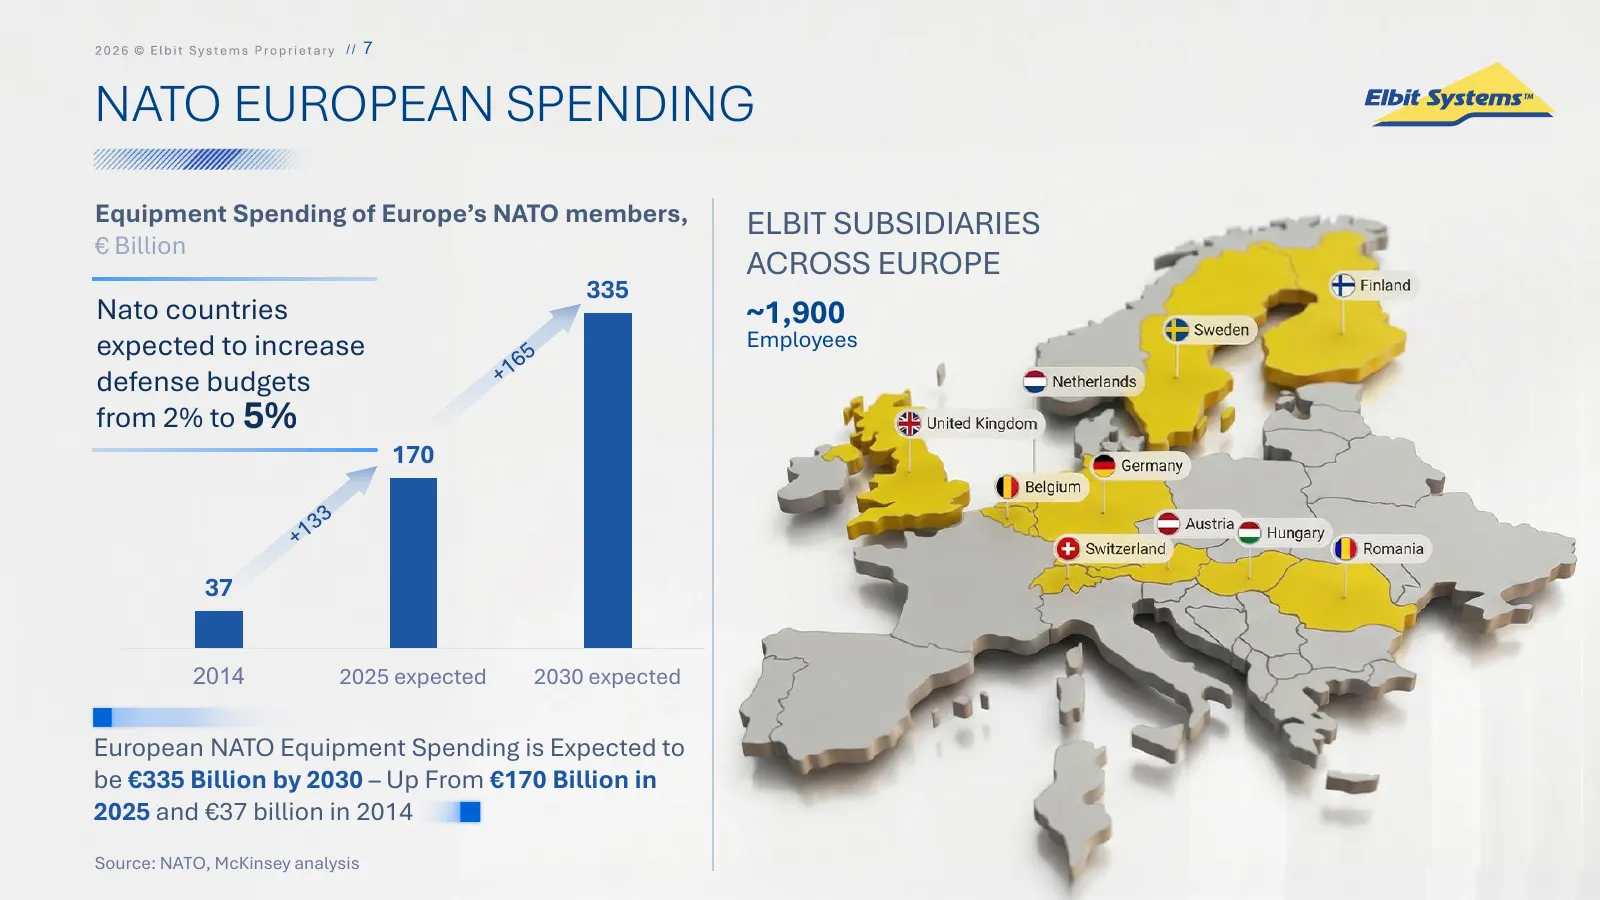
Slide 7: NATO European Spending
// 7 NATO EUROPEAN SPENDING Equipment Spending of Europe’s NATO members, ELBIT SUBSIDIARIES € Billion ACROSS EUROPE 335 Nato countries ~1,900 expected to increase Employees defense budgets from 2% to 5% 170 37 2014 2025 expected 2030 expected European NATO Equipment Spending is Expected to be €335 B
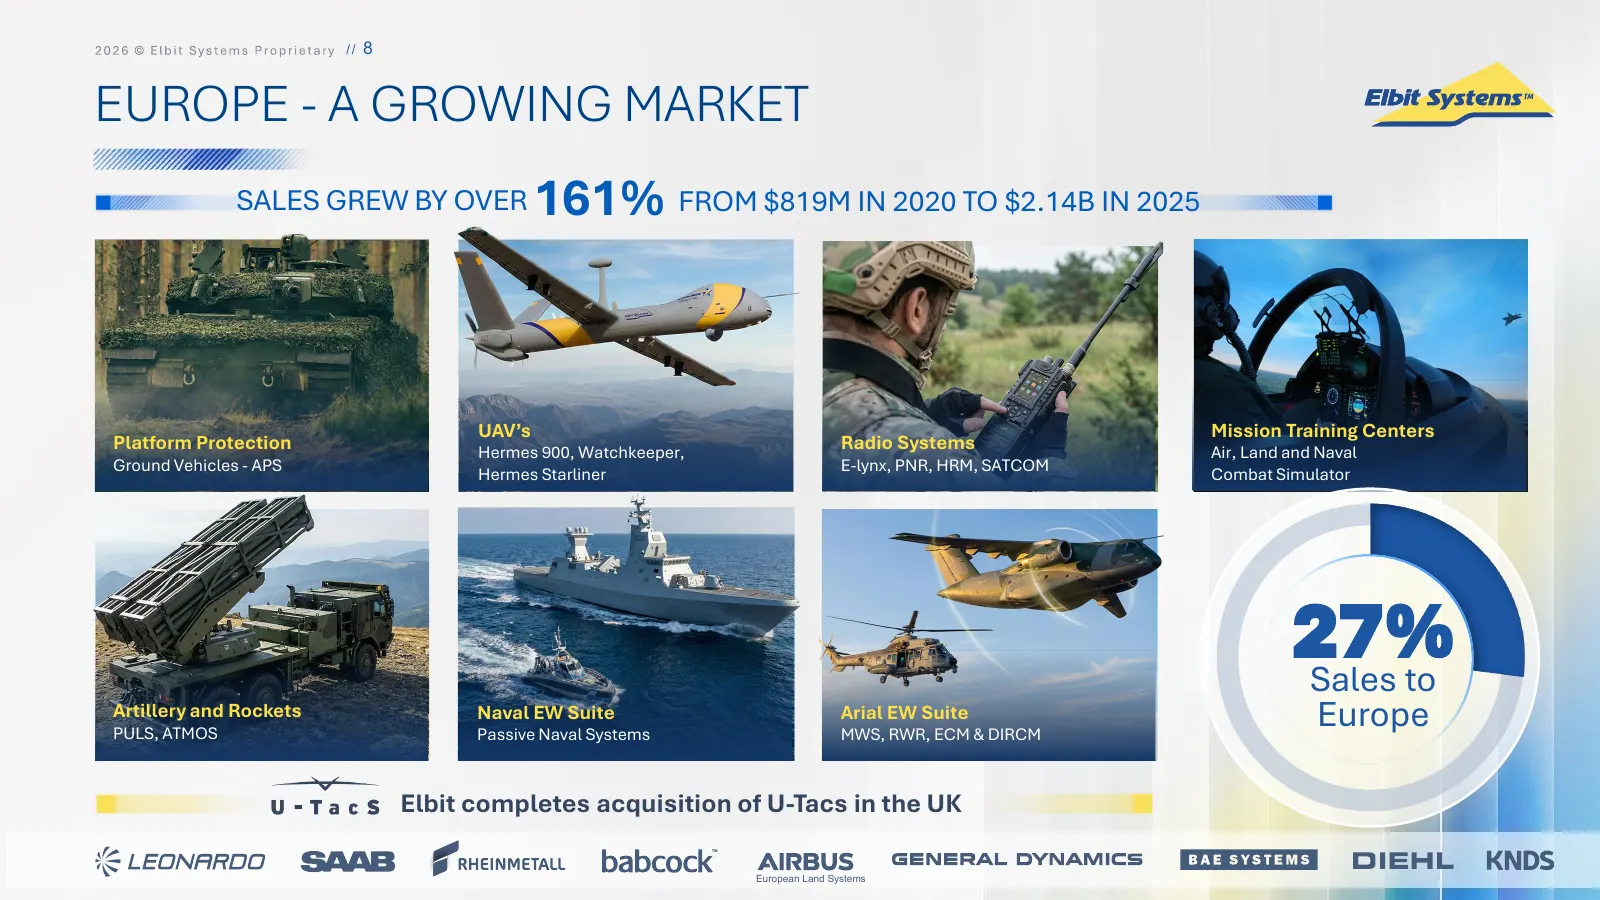
Slide 8: Europe - A Growing Market
// 8 EUROPE - A GROWING MARKET SALES GREW BY OVER 161% FROM $819M IN 2020 TO $2.14B IN 2025 UAV’s Mission Training Centers Platform Protection Hermes 900, Watchkeeper, Radio Systems Air, Land and Naval Ground Vehicles - APS Hermes Starliner E-lynx, PNR, HRM, SATCOM Combat Simulator 27% Sales to Arti
Slide 9: Germany Leading the Growth in Europe
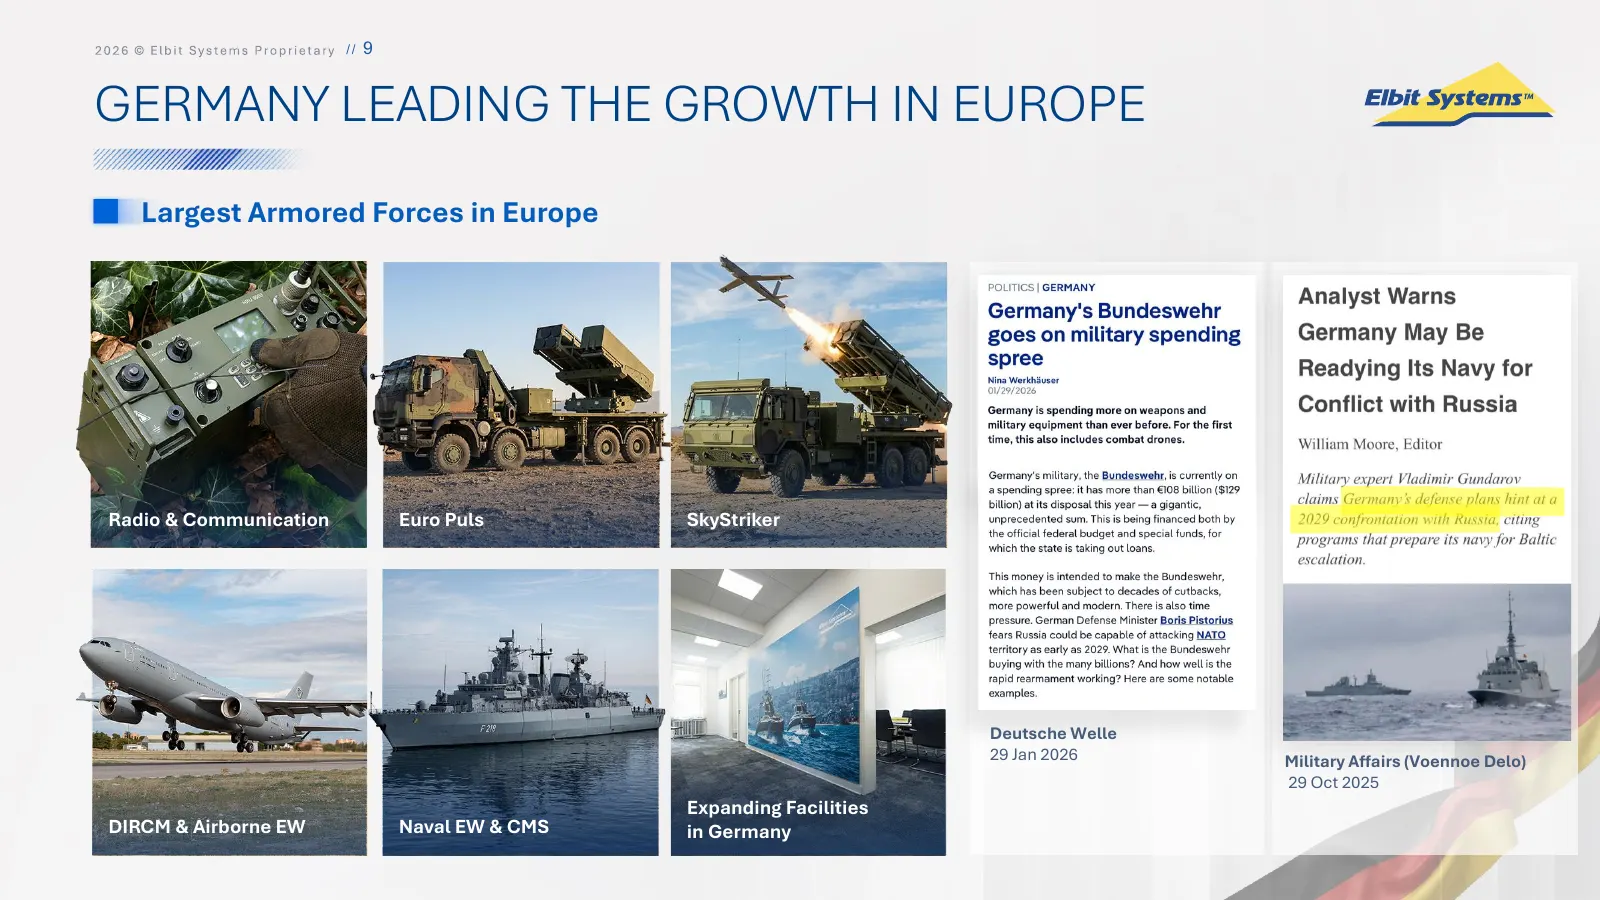
// 9 GERMANY LEADING THE GROWTH IN EUROPE Largest Armored Forces in Europe Radio & Communication Euro Puls SkyStriker Deutsche Welle 29 Jan 2026 Military Affairs (Voennoe Delo) 29 Oct 2025 Expanding Facilities DIRCM & Airborne EW Naval EW & CMS in Germany
Slide 10: Asia Pacific
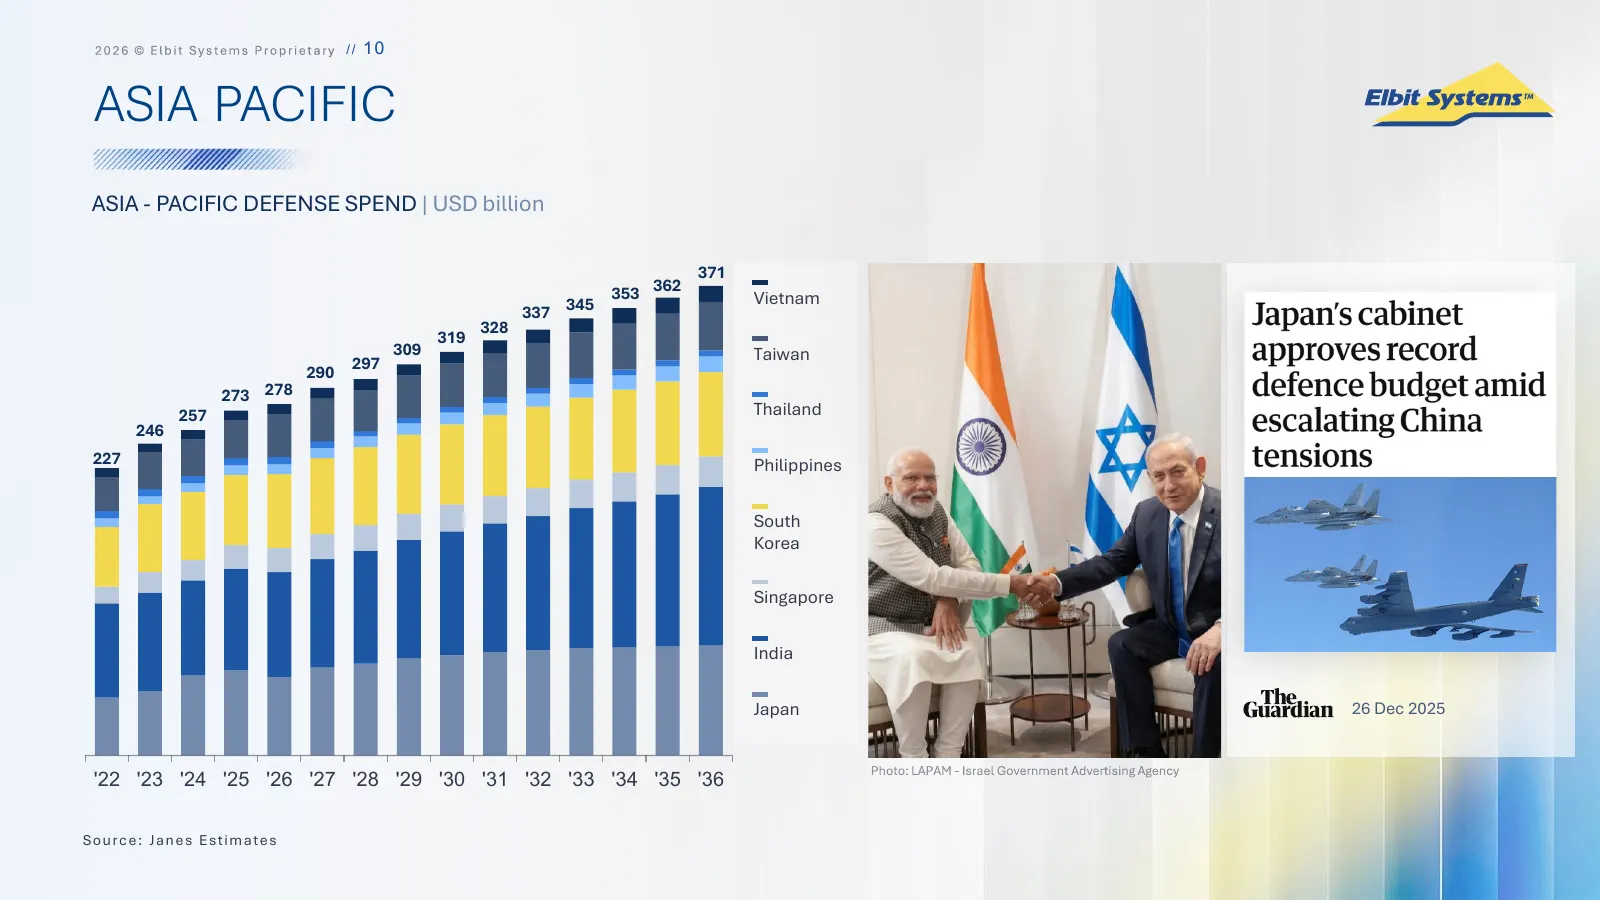
/ / 10 ASIA PACIFIC ASIA - PACIFIC DEFENSE SPEND | USD billion 371 353 362 Vietnam 337 345 328 319 309 Taiwan 297 290 273 278 257 Thailand 246 227 Philippines South Korea Singapore India Japan 26 Dec 2025 '22 '23 '24 '25 '26 '27 '28 '29 '30 '31 '32 '33 '34 '35 '36 Sou r c e : J a n e s E s t i m a t
Slide 11: Asia Pacific Sales Growth
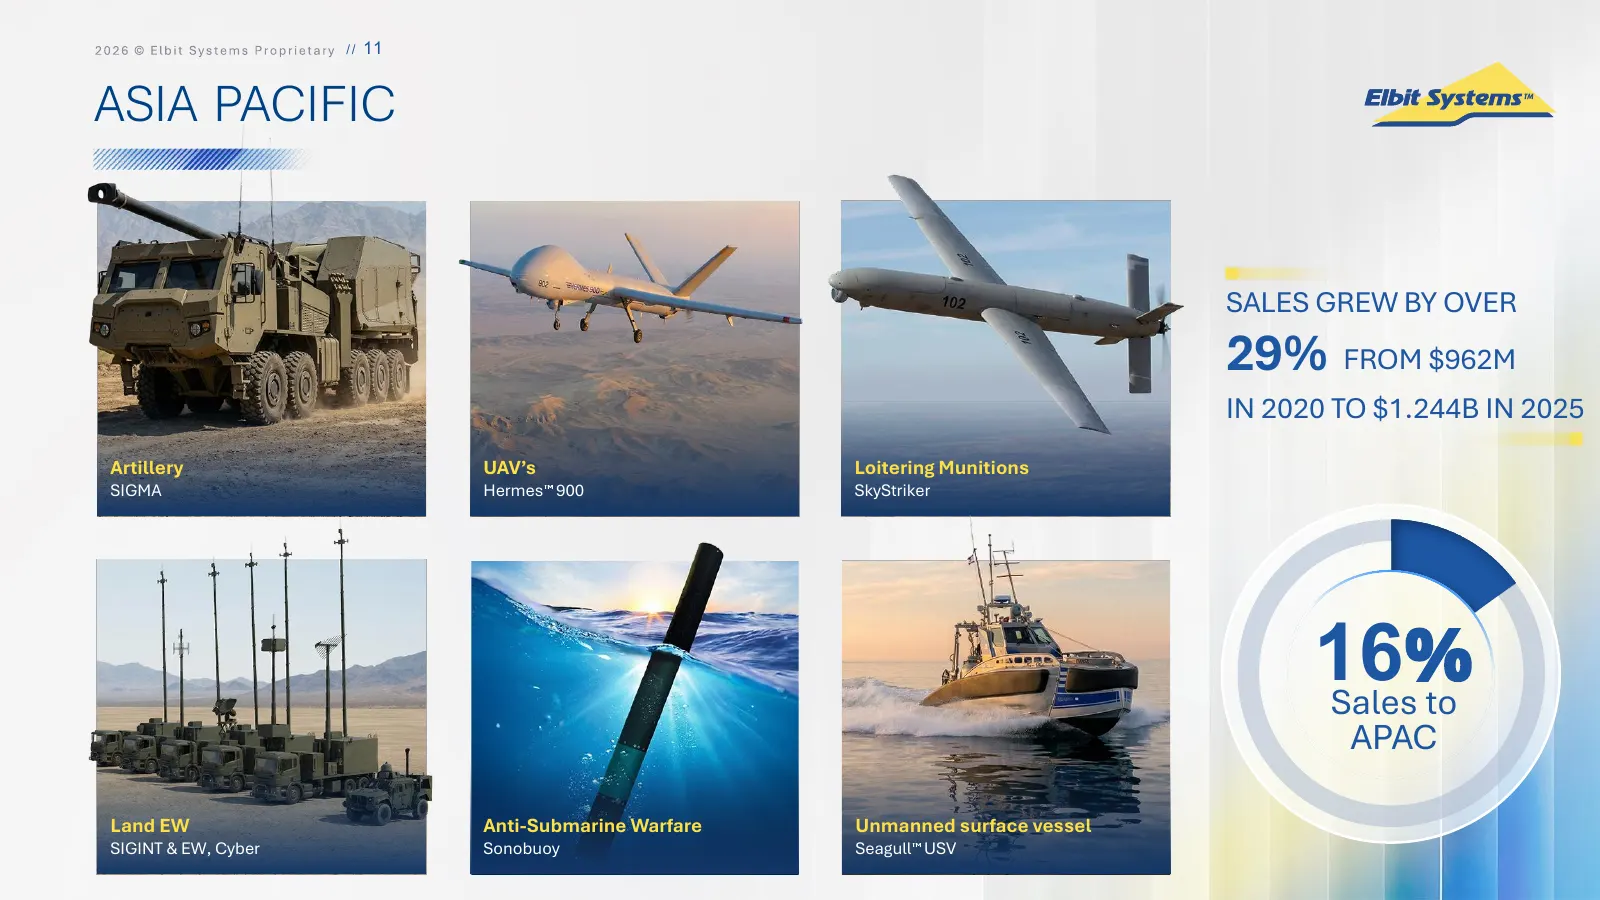
/ / 11 ASIA PACIFIC SALES GREW BY OVER 29% FROM $962M IN 2020 TO $1.244B IN 2025 Artillery UAV’s Loitering Munitions SIGMA Hermes 900 SkyStriker 16% Sales to APAC Land EW Anti-Submarine Warfare Unmanned surface vessel SIGINT & EW, Cyber Sonobuoy Seagull USV
Slide 12: Twenty-Six Defense
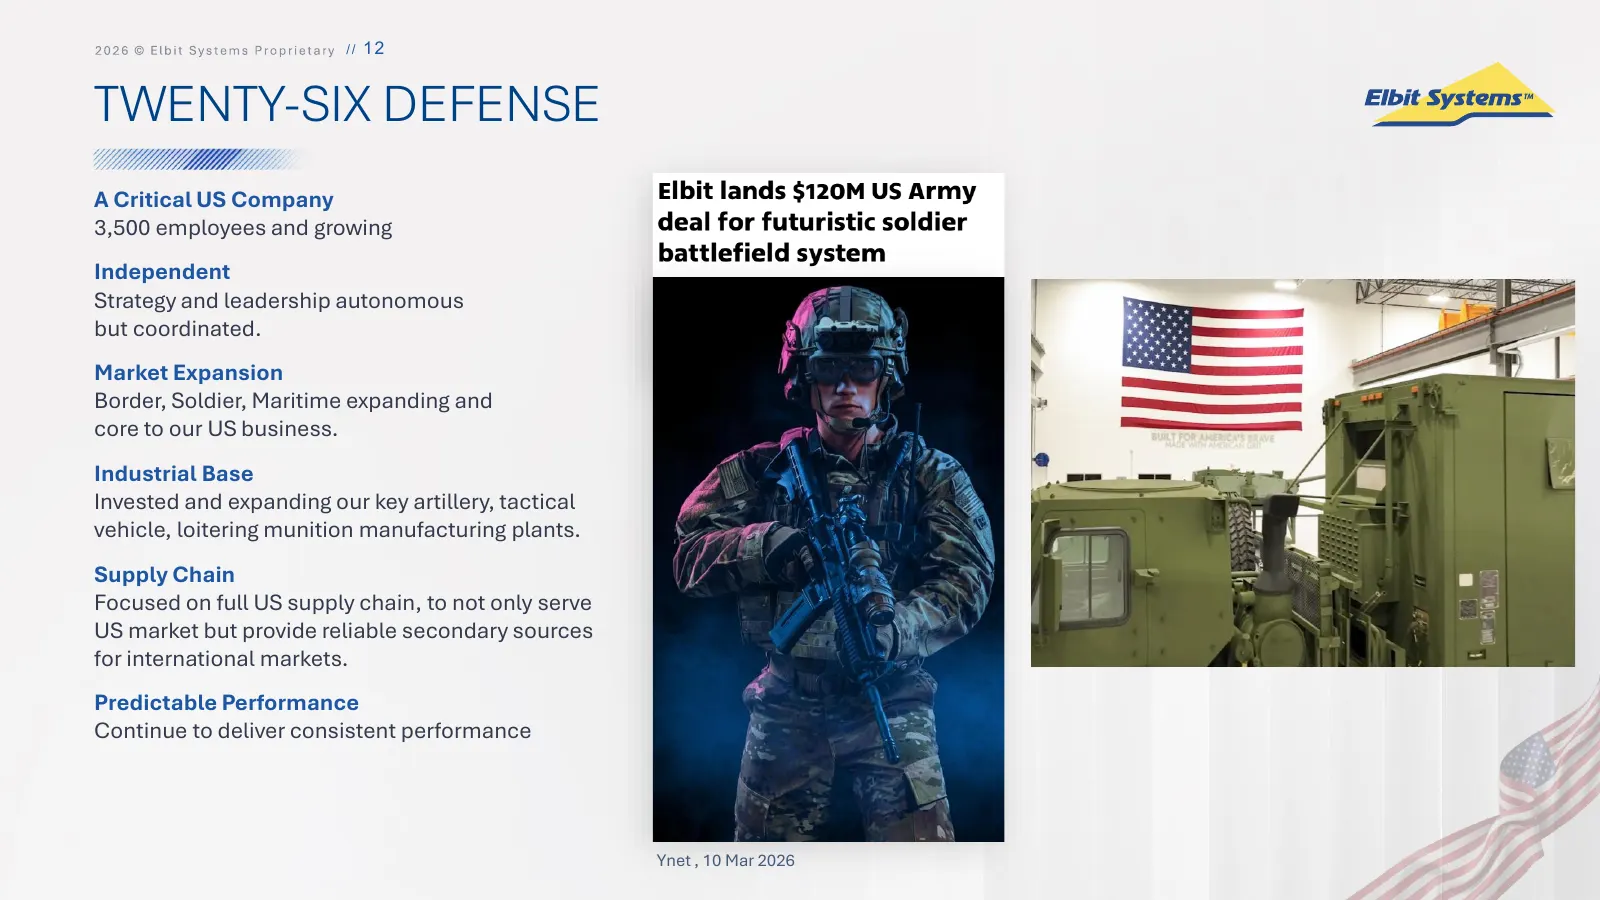
/ / 12 TWENTY-SIX DEFENSE A Critical US Company 3,500 employees and growing Independent Strategy and leadership autonomous but coordinated. Market Expansion Border, Soldier, Maritime expanding and core to our US business. Industrial Base Invested and expanding our key artillery, tactical vehicle, lo
Slide 13: R&D Spend Enables Technological Superiority
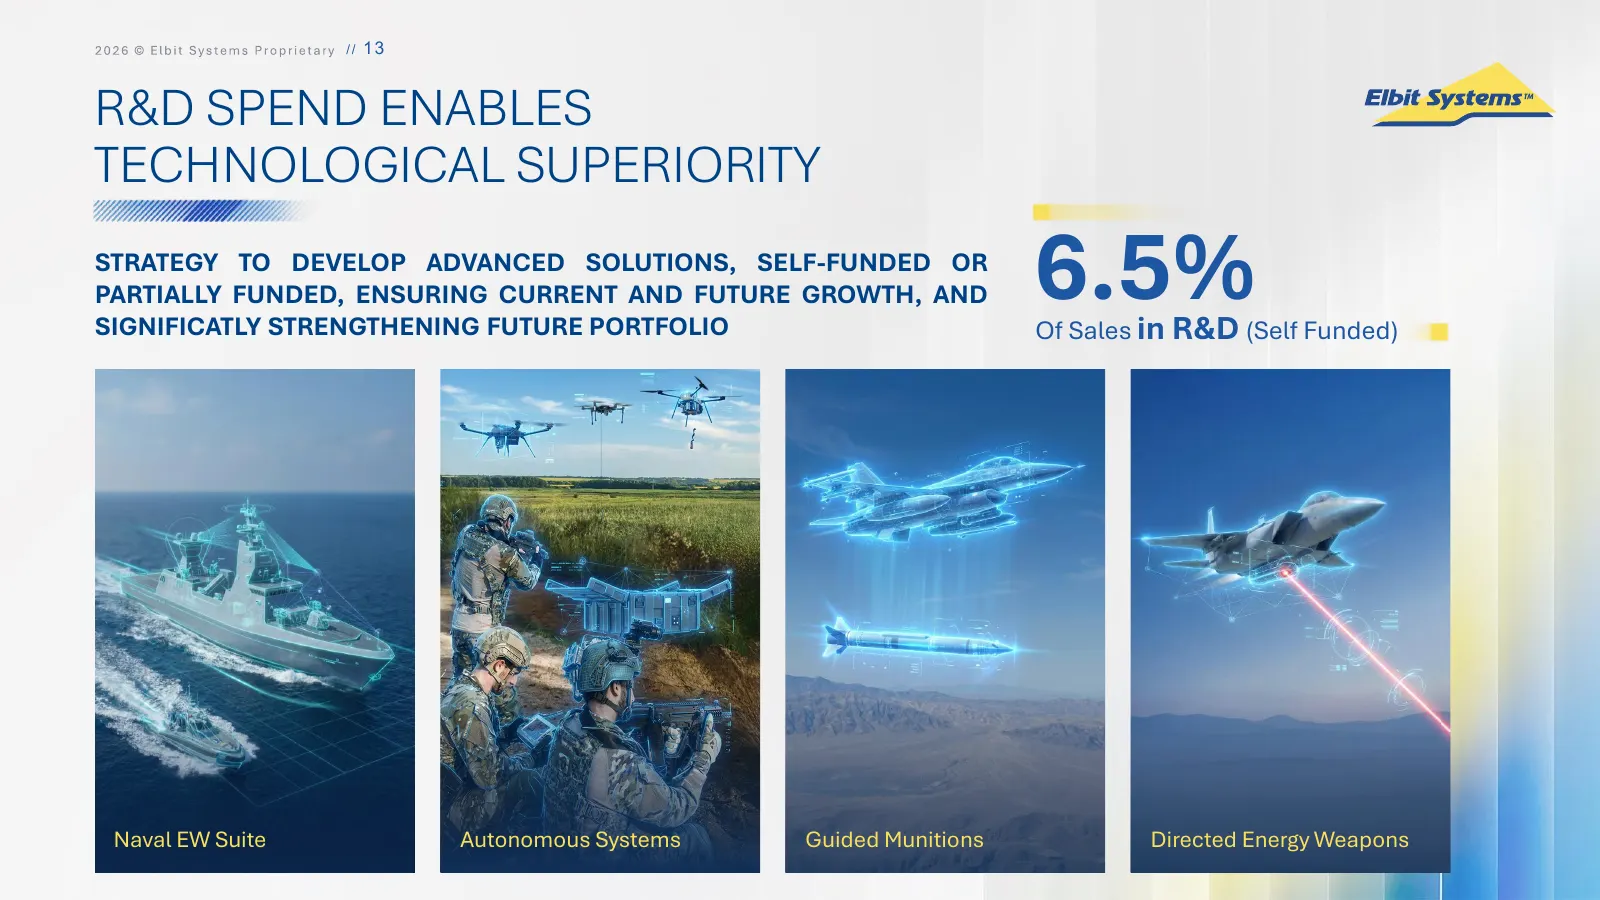
/ / 13 R&D SPEND ENABLES TECHNOLOGICAL SUPERIORITY STRATEGY TO DEVELOP ADVANCED SOLUTIONS, SELF-FUNDED OR PARTIALLY FUNDED, ENSURING CURRENT AND FUTURE GROWTH, AND SIGNIFICATLY STRENGTHENING FUTURE PORTFOLIO 6.5% Of Sales in R&D (Self Funded) Naval EW Suite Autonomous Systems Guided Munitions Direct
Slide 14: Value Creating M&A | Major Acquisitions
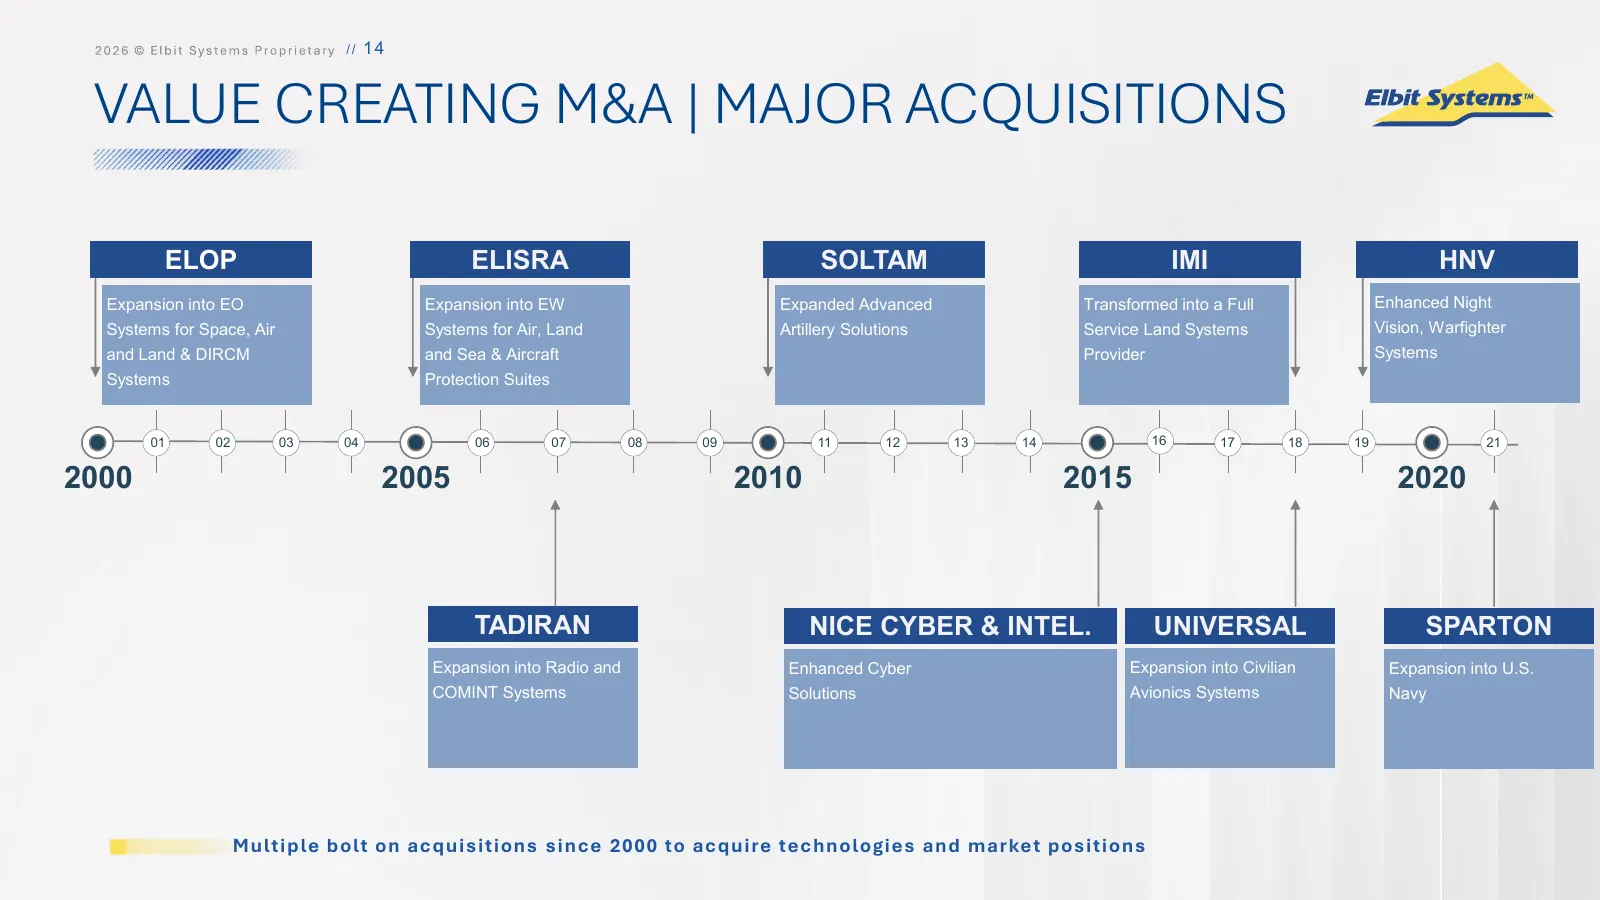
/ / 14 VALUE CREATING M&A | MAJOR ACQUISITIONS ELOP ELISRA SOLTAM IMI HNV Expansion into EO Expansion into EW Expanded Advanced Transformed into a Full Enhanced Night Systems for Space, Air Systems for Air, Land Artillery Solutions Service Land Systems Vision, Warfighter and Land & DIRCM and Sea & A

Slide 15: Financial Overview
F I N A N C I A L OV E R V I E W
Slide 16: 2025 Financial Highlights
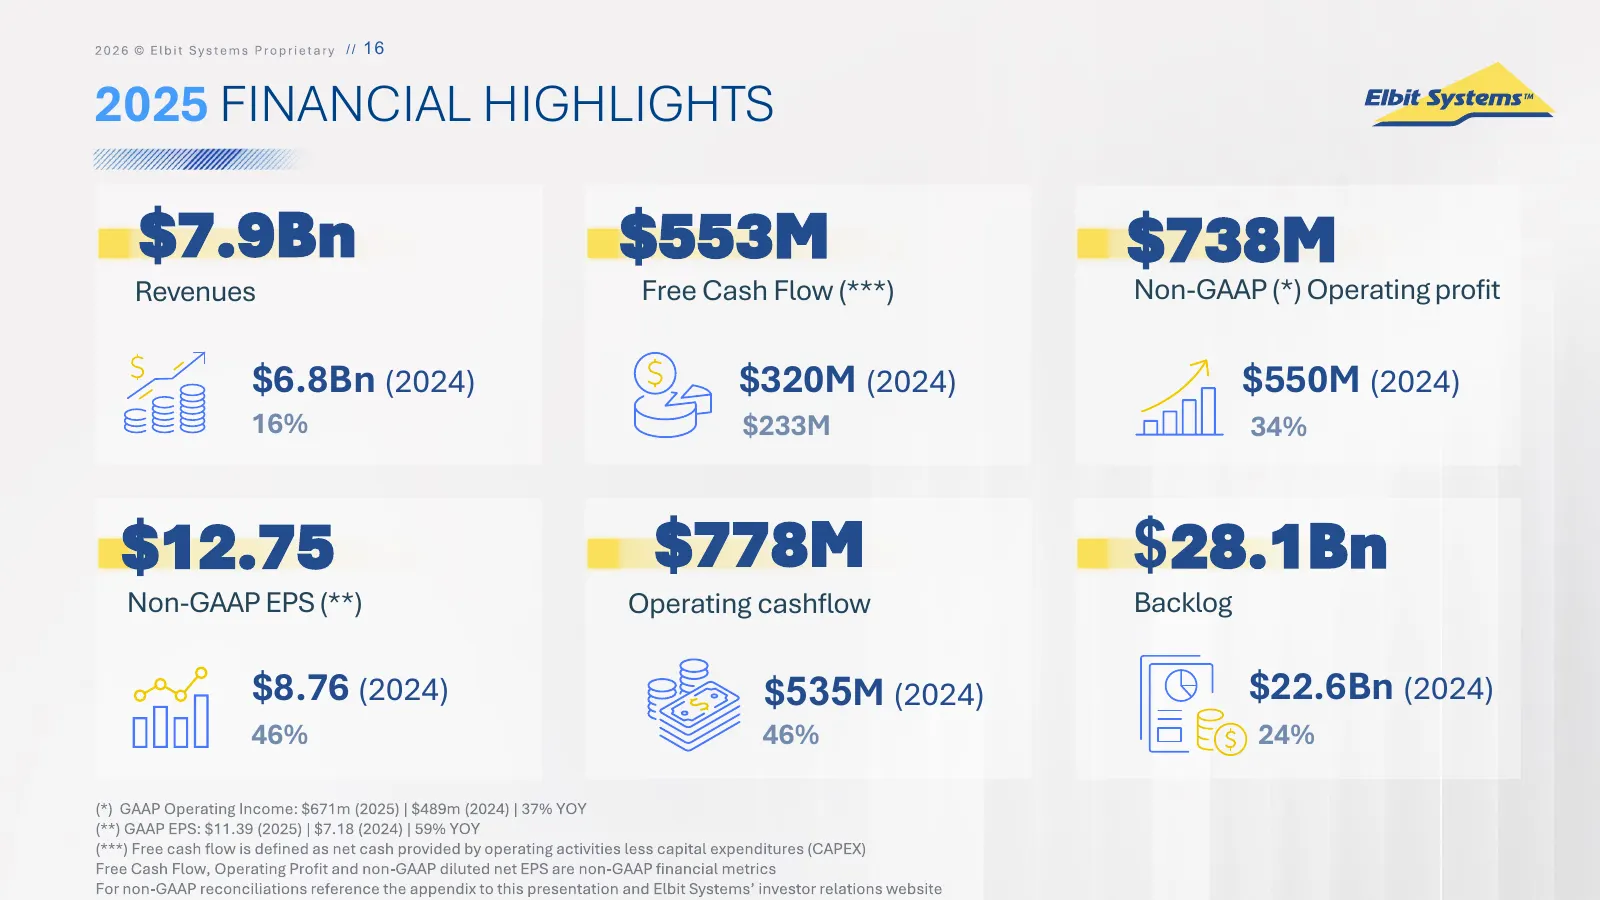
/ / 16 2025 FINANCIAL HIGHLIGHTS $7.9Bn $553M $738M Revenues Free Cash Flow (***) Non-GAAP (*) Operating profit $6.8Bn (2024) $320M (2024) $550M (2024) 16% $233M 34% $12.75 $778M $28.1Bn Non-GAAP EPS (**) Operating cashflow Backlog $8.76 (2024) $535M (2024) $22.6Bn (2024) 46% 46% 24%
Slide 17: Q3 2026 Financial Highlights
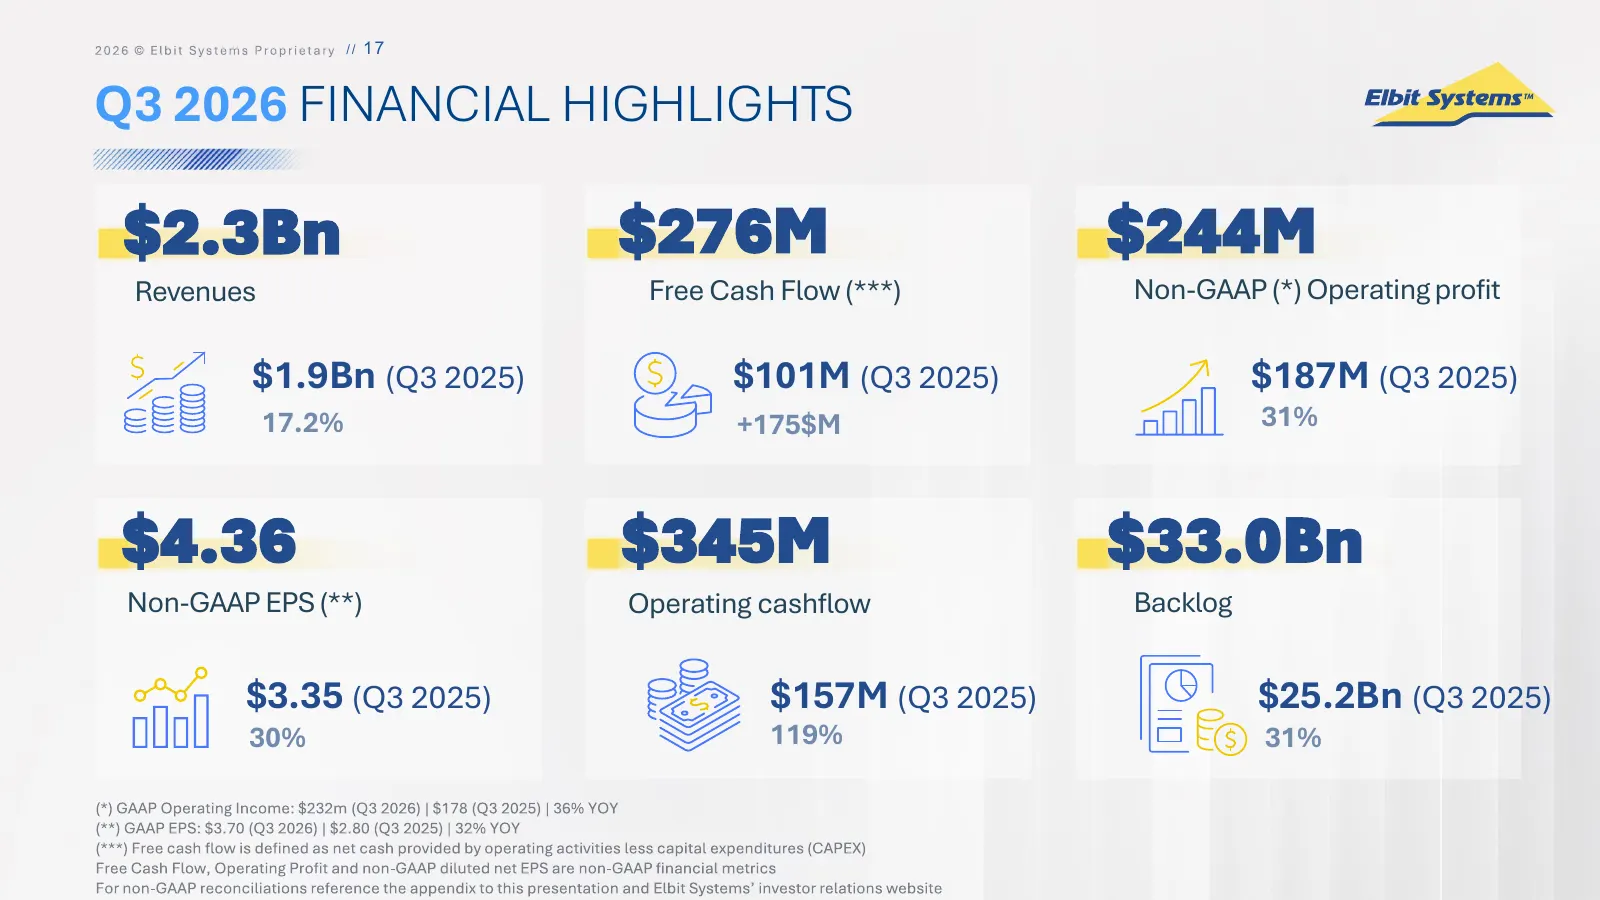
/ / 17 Q3 2026 FINANCIAL HIGHLIGHTS $2.3Bn $276M $244M Revenues Free Cash Flow (***) Non-GAAP (*) Operating profit $1.9Bn (Q3 2025) $101M (Q3 2025) $187M (Q3 2025) 17.2% +175$M 31% $4.36 $345M $33.0Bn Non-GAAP EPS (**) Operating cashflow Backlog $3.35 (Q3 2025) $157M (Q3 2025) $25.2Bn (Q3 2025) 30%
Slide 18: Q3 2026 Results | Revenue and Backlog
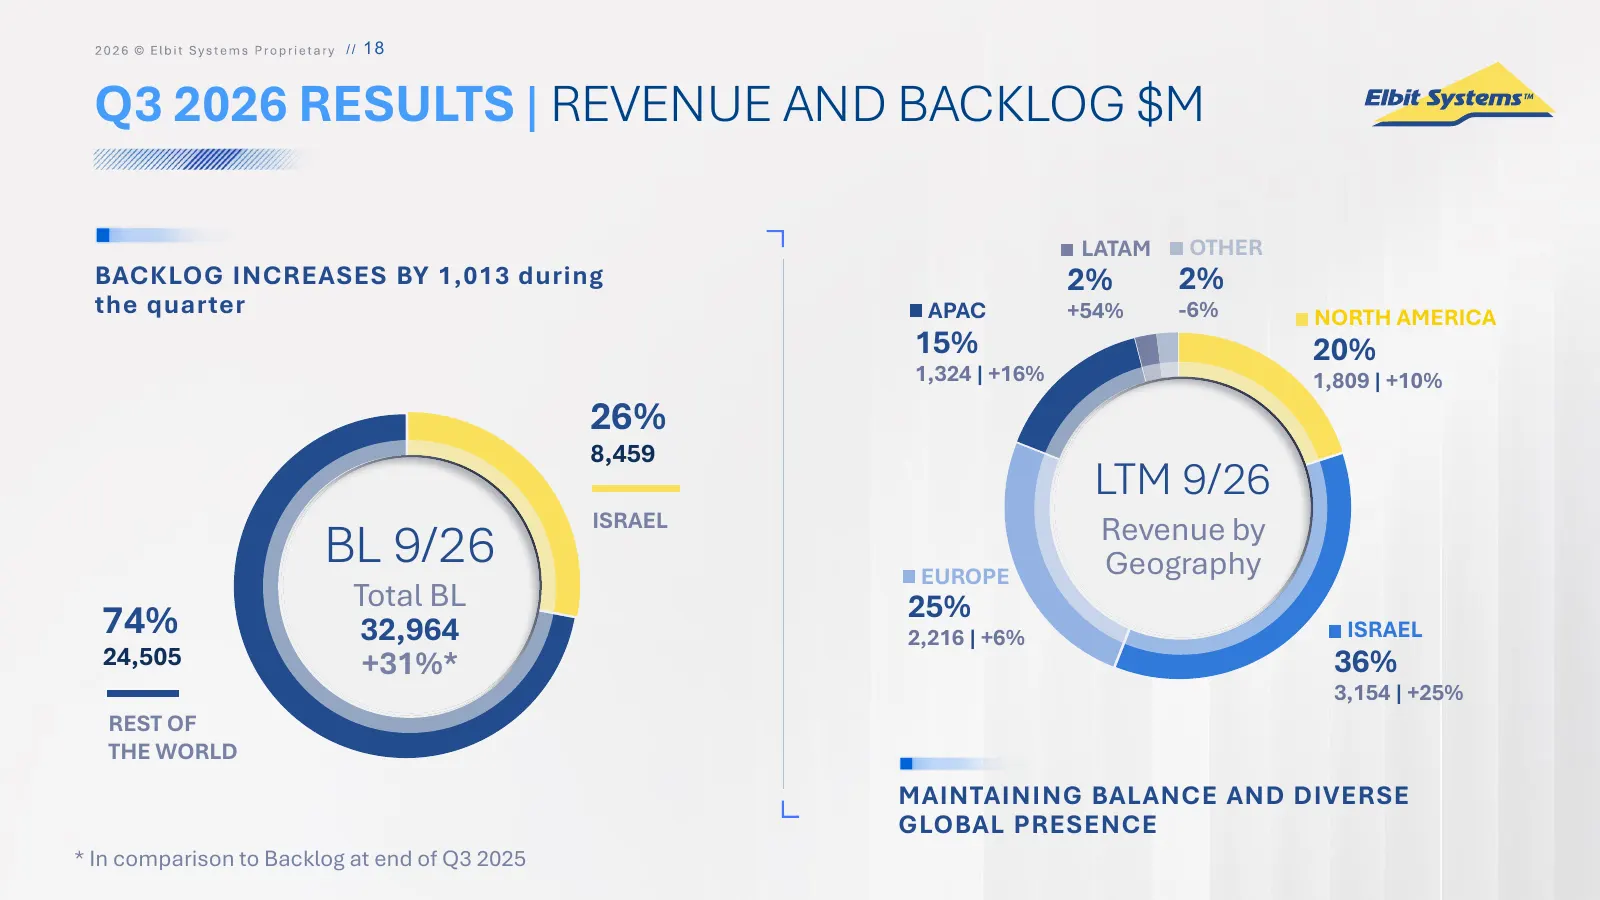
/ / 18 Q3 2026 RESULTS | REVENUE AND BACKLOG $M LATAM OTHER BACKLOG INCREASES BY 1,013 during 2% 2% the quarter APAC +54% -6% NORTH AMERICA 15% 20% 1,324 | +16% 1,809 | +10% 26% 8,459 LTM 9/26 ISRAEL Revenue by BL 9/26 EUROPE Geography Total BL 25% 74% 32,964 2,216 | +6% ISRAEL 24,505 +31%* 36% 3,15
Slide 19: Business Segments | Annual Revenue
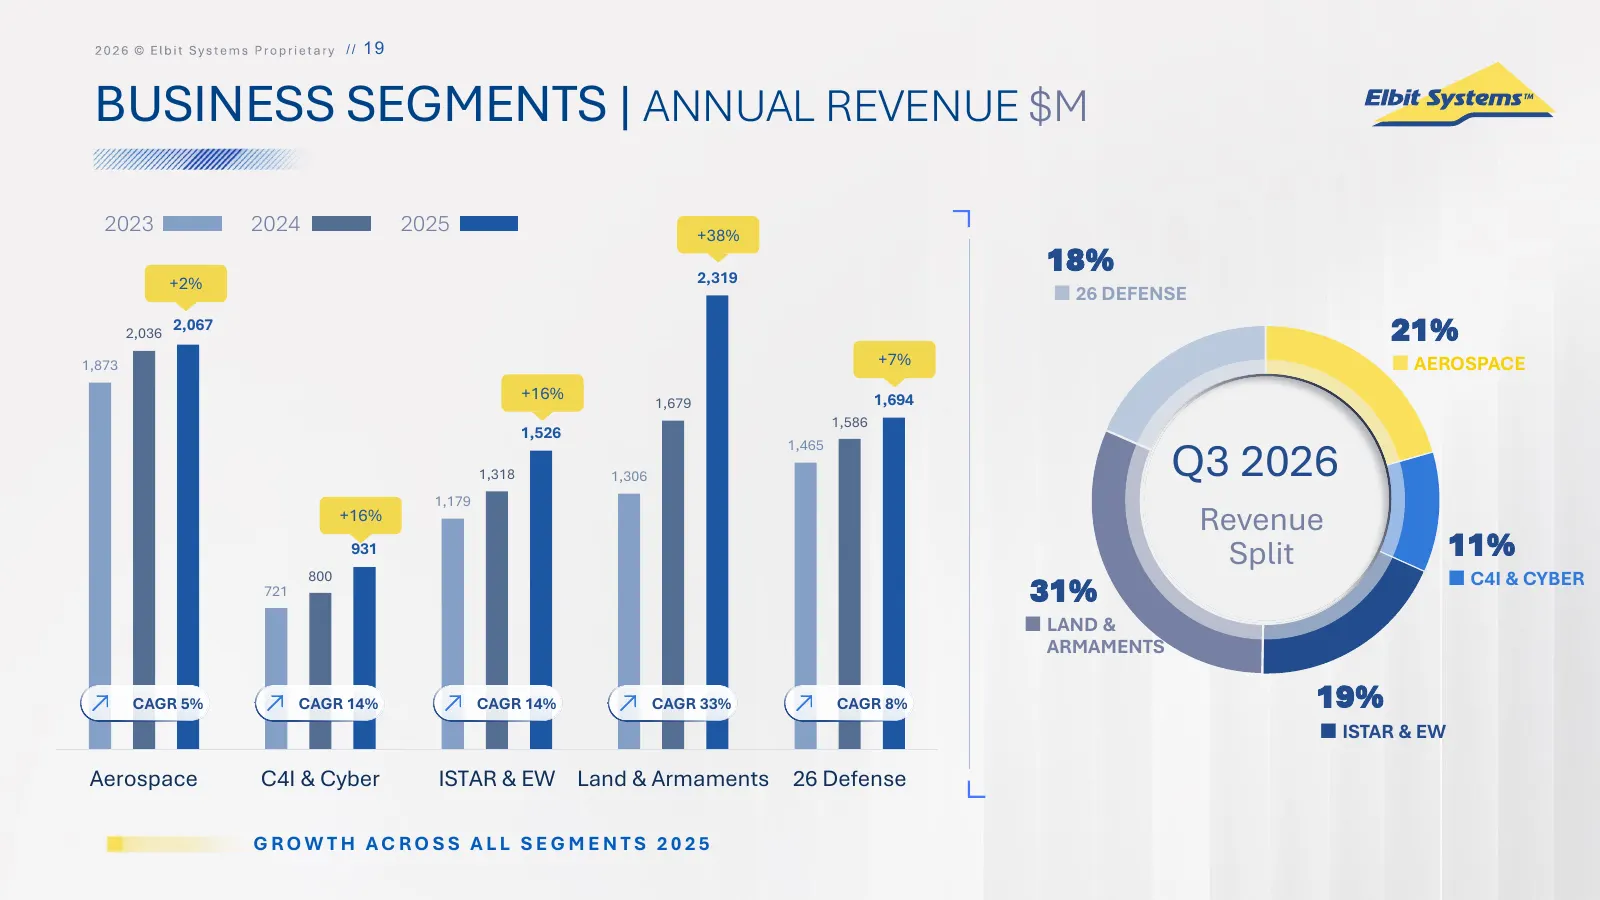
/ / 19 BUSINESS SEGMENTS | ANNUAL REVENUE $M 2023 2024 2025 +38% 2,319 18% +2% 26 DEFENSE 2,036 2,067 21% 1,873 +7% AEROSPACE +16% 1,694 1,679 1,586 1,526 Q3 2026 1,465 1,318 1,306 1,179 +16% Revenue 931 Split 11% 800 C4I & CYBER 721 31% LAND & ARMAMENTS CAGR 5% CAGR 14% CAGR 14% CAGR 33% CA
Slide 20: Business Segments | Annual Operating Income GAAP
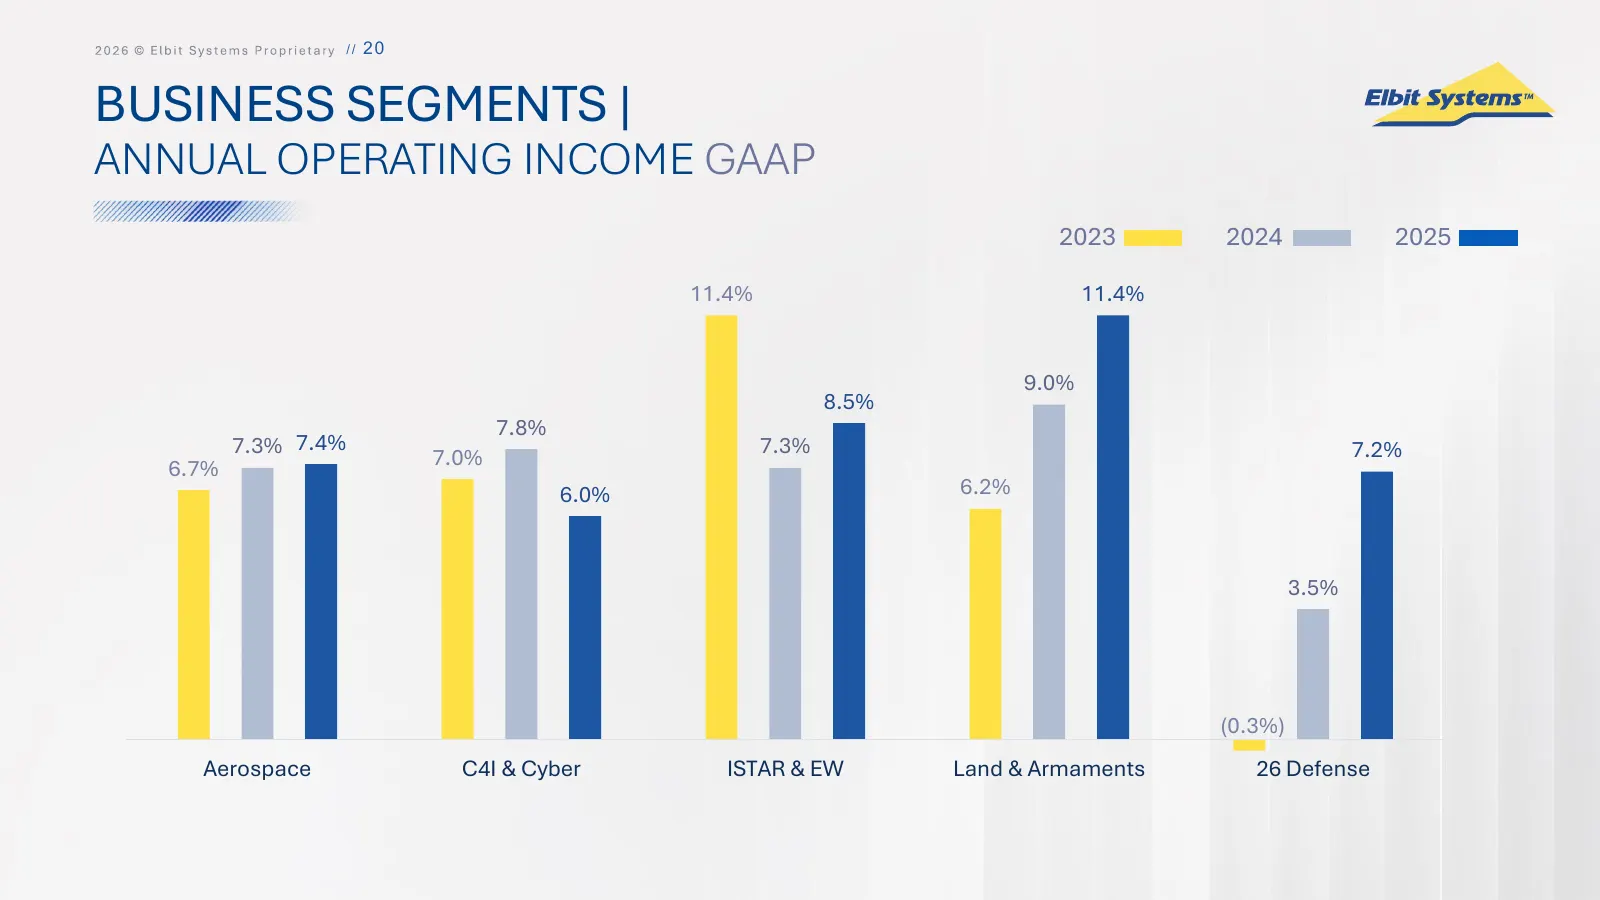
/ / 20 BUSINESS SEGMENTS | ANNUAL OPERATING INCOME GAAP 2023 2024 2025 11.4% 11.4% 9.0% 8.5% 7.8% 7.3% 7.4% 7.0% 7.3% 7.2% 6.7% 6.0% 6.2% 3.5% (0.3%) Aerospace C4I & Cyber ISTAR & EW Land & Armaments 26 Defense
Slide 21: EPS Non-GAAP
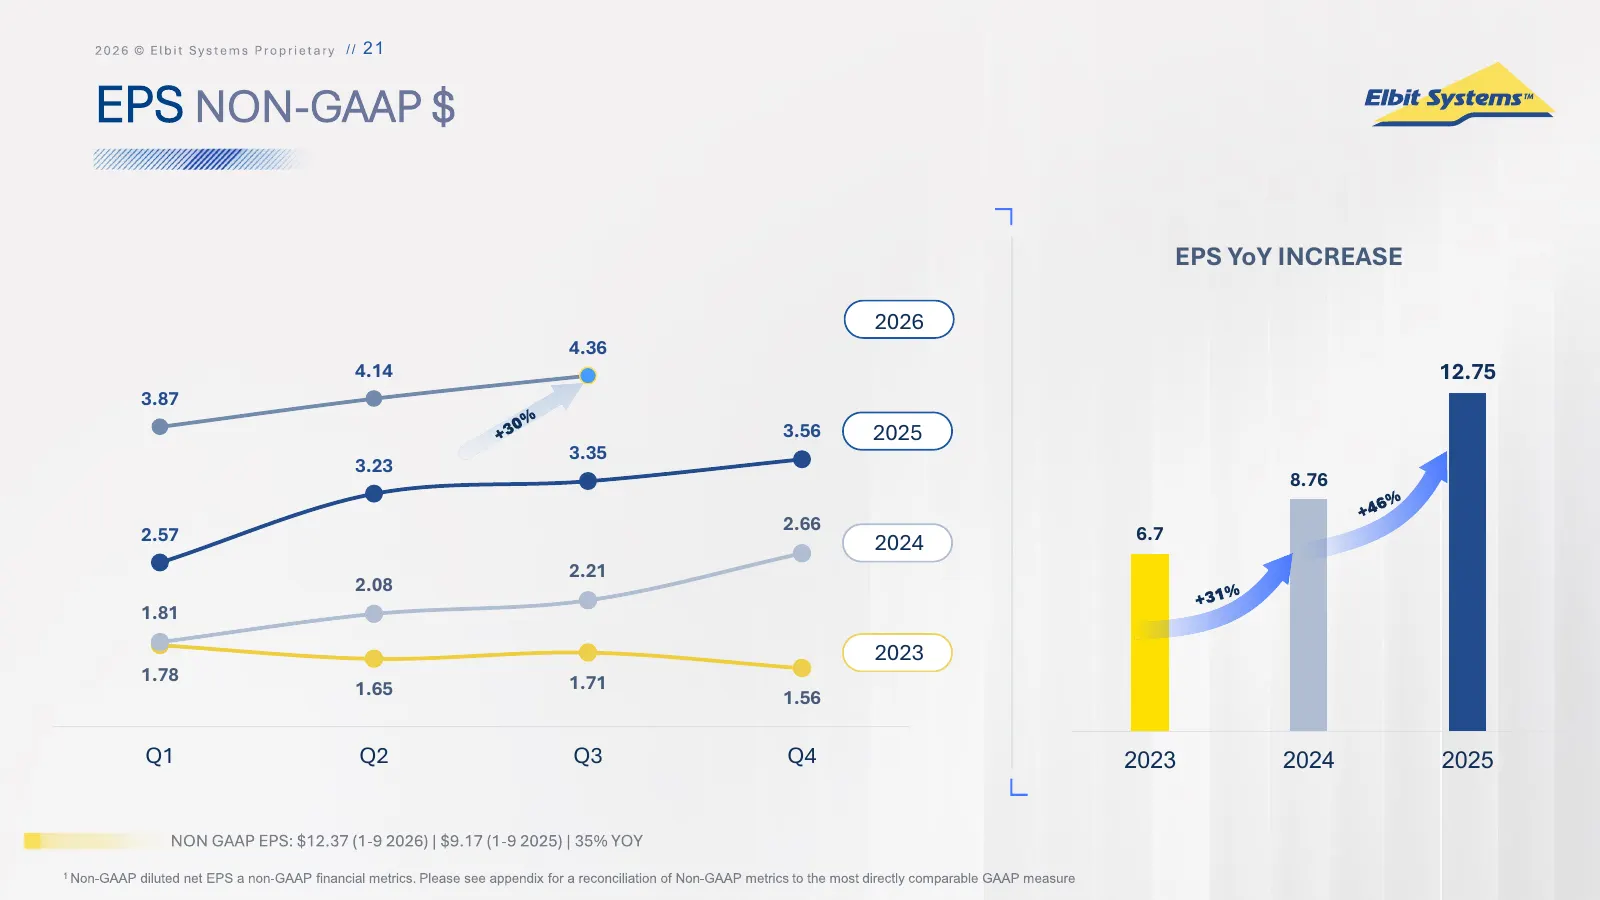
/ / 21 EPS NON-GAAP $ EPS YoY INCREASE 2026 4.36 4.14 12.75 3.87 3.56 2025 3.35 3.23 8.76 2.66 2.57 2024 6.7 2.21 2.08 1.81 2023 1.78 1.71 1.65 1.56 Q1 Q2 Q3 Q4 2023 2024 2025
Slide 22: Free Cash Flow
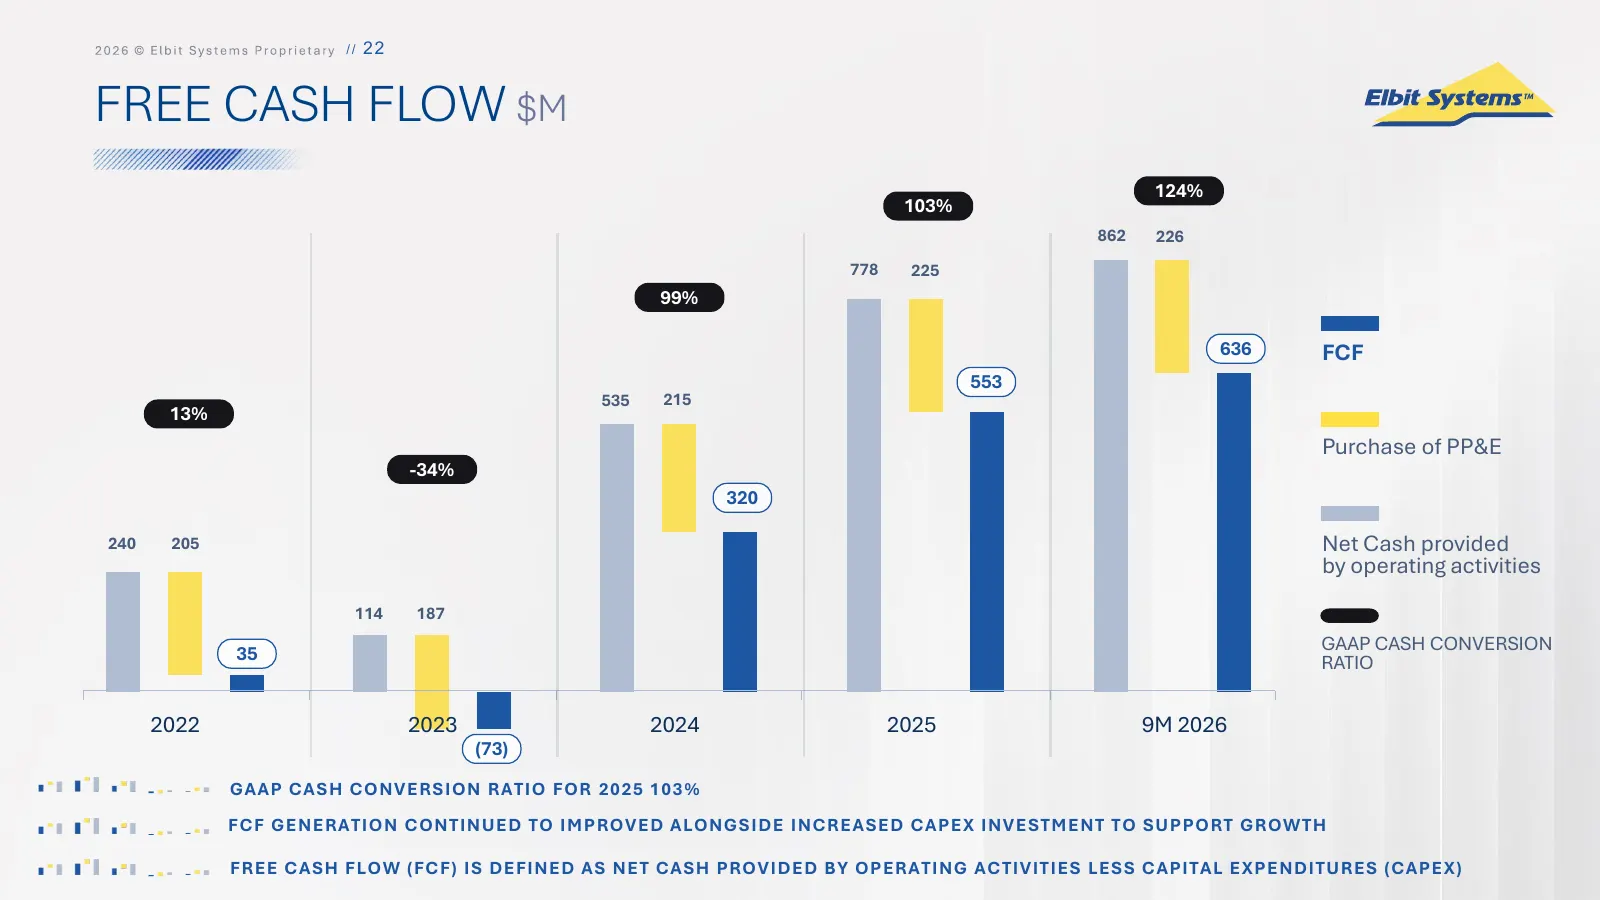
/ / 22 FREE CASH FLOW $M 124% 103% 862 226 778 225 99% 636 FCF 553 535 215 13% Purchase of PP&E -34% 320 240 205 Net Cash provided by operating activities 114 187 35 GAAP CASH CONVERSION RATIO 2022 2023 2024 2025 9M 2026 (73) GAAP CASH CONVERSION RATIO FOR 2025 103% FCF GENERATION CONTINUED TO IMPRO
Slide 23: Net Cash / EBITDA - GAAP
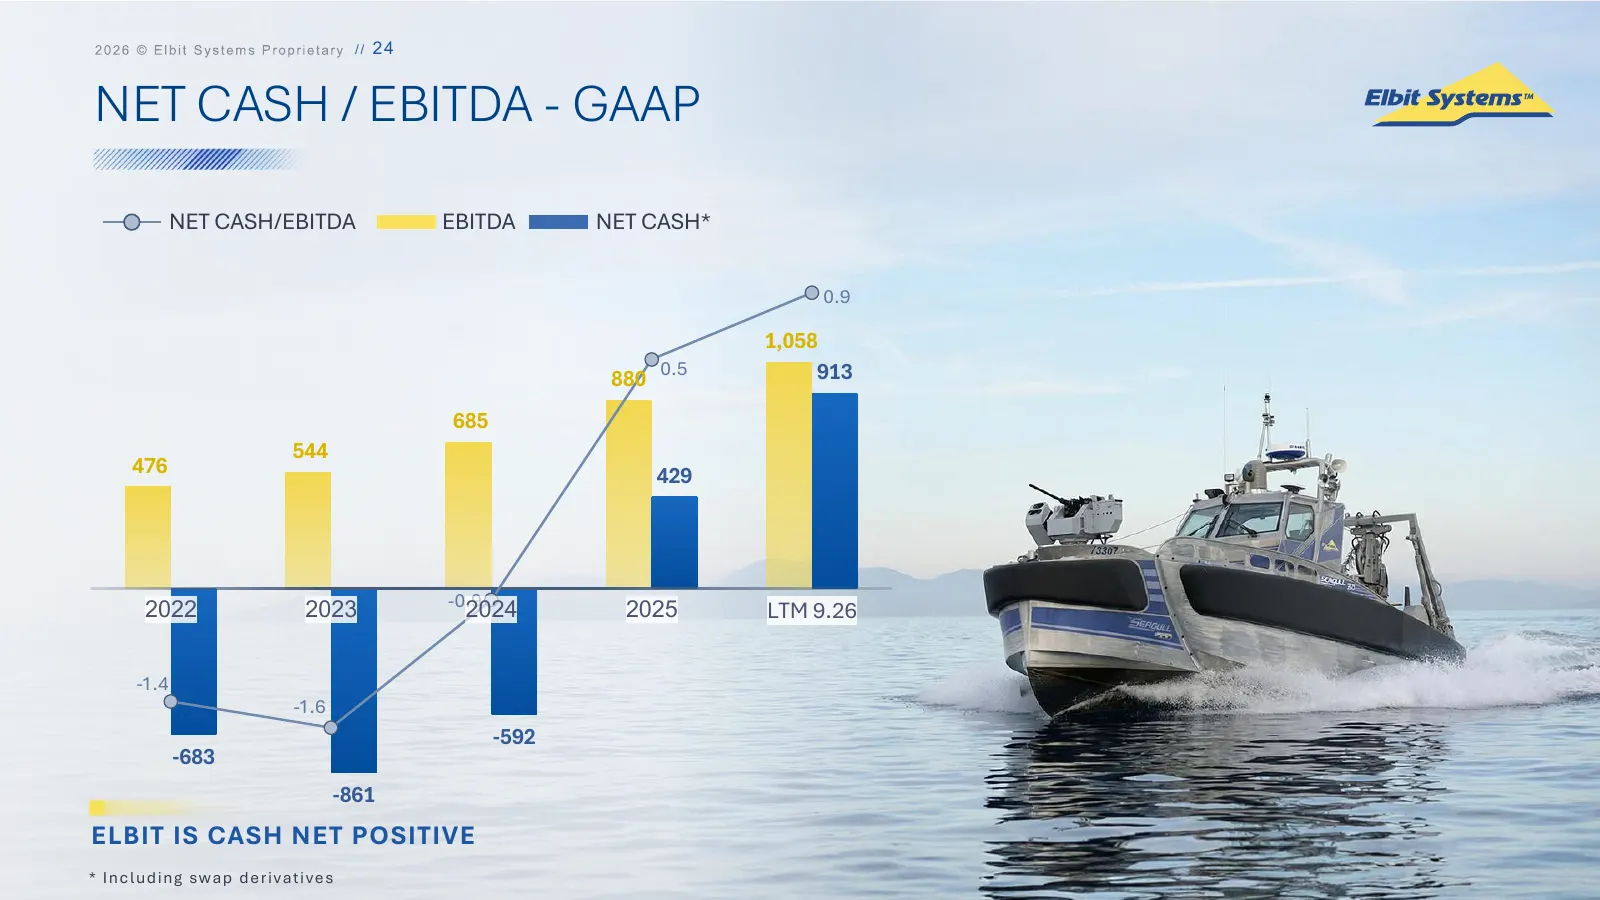
/ // /24 24 NET CASH / EBITDA - GAAP NET CASH/EBITDA EBITDA NET CASH* 0.9 1,058 0.5 913 880 685 544 476 429 -0.9 2022 2023 2024 2025 LTM 9.26 -1.4 -1.6 -592 -683 -861 ELBIT IS CASH NET POSITIVE * Inc lud ing swap d eriv ativ es
Slide 24: Order Backlog & Revenues
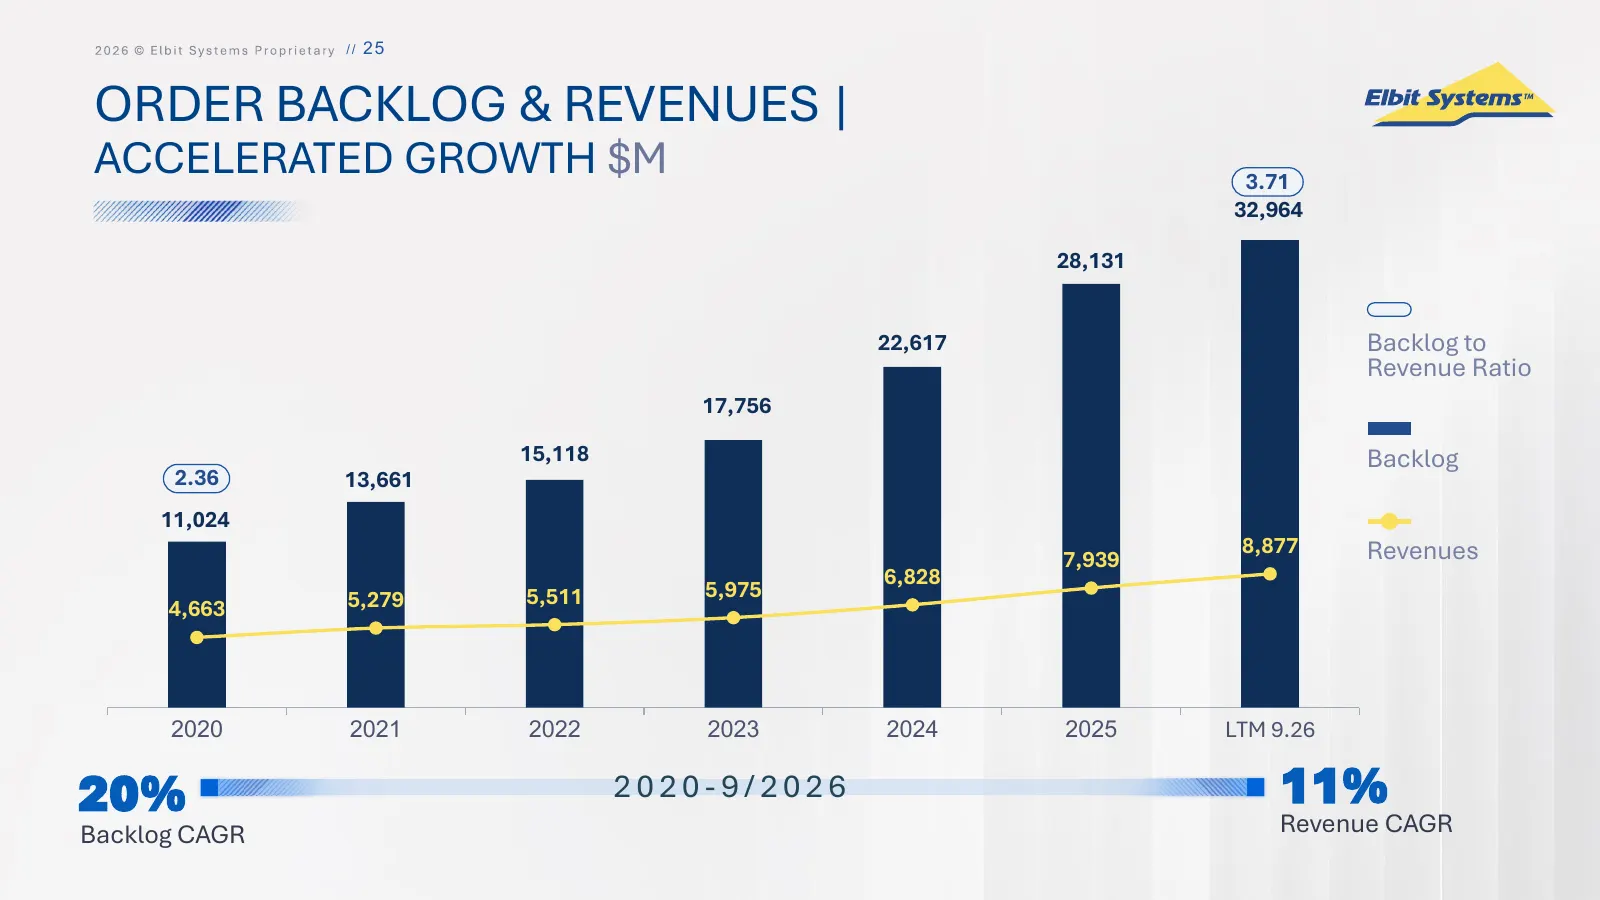
/ / 25 ORDER BACKLOG & REVENUES | ACCELERATED GROWTH $M 3.71 32,964 28,131 22,617 Backlog to Revenue Ratio 17,756 15,118 Backlog 2.36 13,661 11,024 8,877 Revenues 7,939 6,828 5,279 5,511 5,975 4,663 2020 2021 2022 2023 2024 2025 LTM 9.26 20% 2020-9/2026 11% Backlog CAGR Revenue CAGR
Slide 25: Capital Allocation Framework
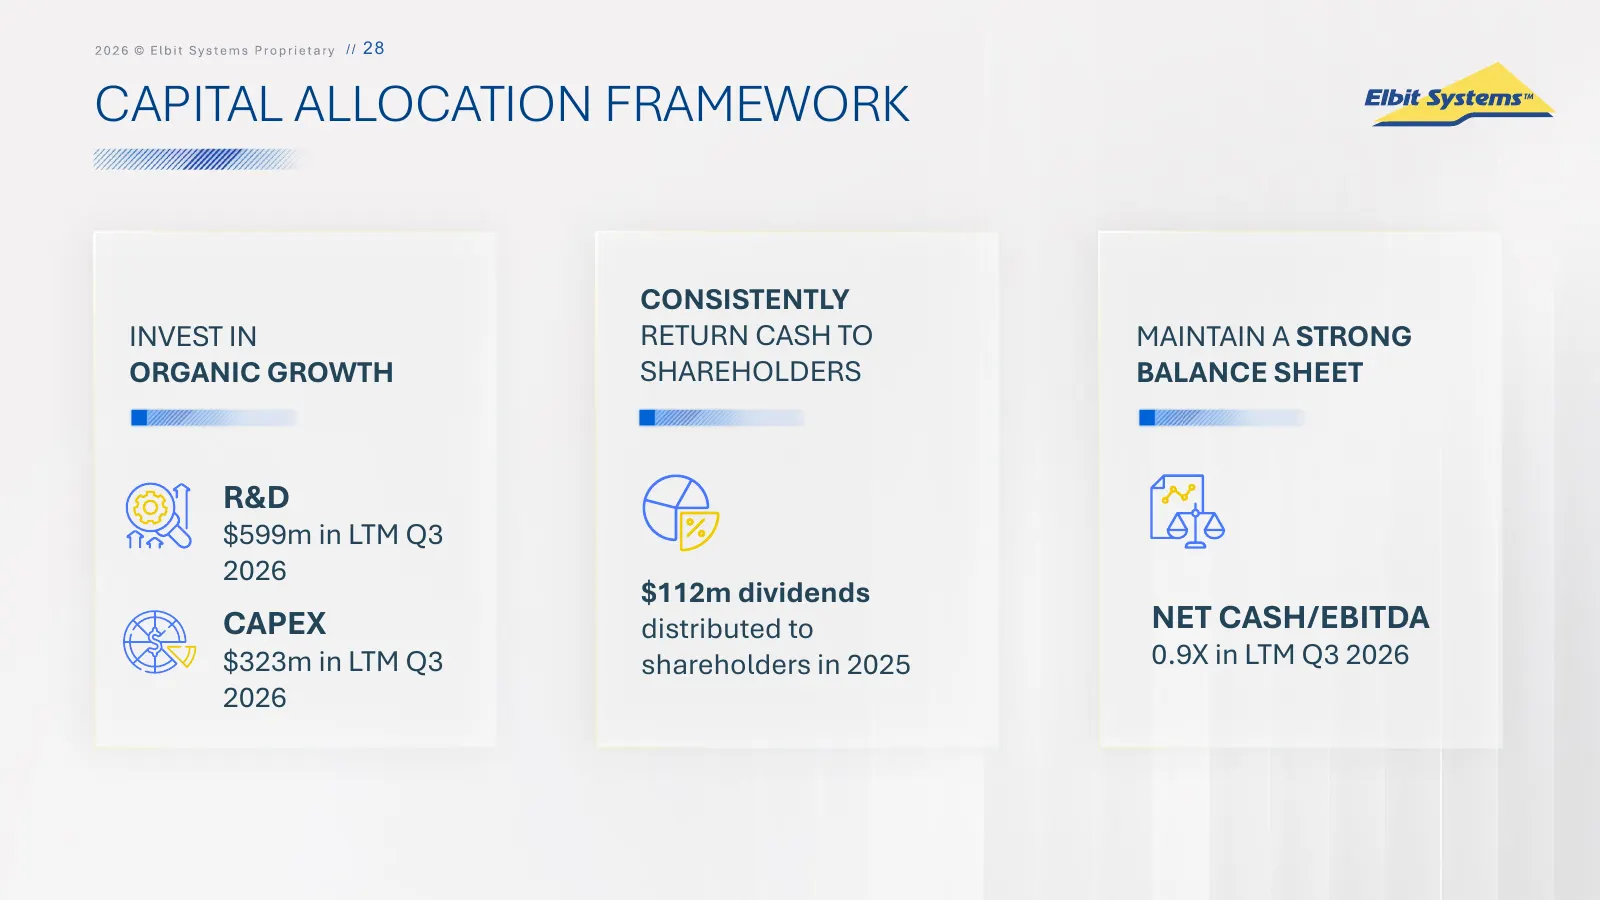
/ / 28 CAPITAL ALLOCATION FRAMEWORK CONSISTENTLY INVEST IN RETURN CASH TO MAINTAIN A STRONG ORGANIC GROWTH SHAREHOLDERS BALANCE SHEET R&D $599m in LTM Q3 2026 $112m dividends CAPEX distributed to NET CASH/EBITDA $323m in LTM Q3 shareholders in 2025 0.9X in LTM Q3 2026 2026
Slide 26: Appendix | Non-GAAP Financial Data
// 29 APPENDIX | NON-GAAP FINANCIAL DATA The non-GAAP financial data, including Adjusted gross profit, Adjusted operating income, We believe adjusted diluted earnings per share is useful to existing shareholders, potential Adjusted net income, and Adjusted diluted earnings per share, is presented to

Slide 27: Thank You
THANK YOU Dr. Yaacov (Kobi) Kagan, Executive VP - CFO Daniella L. Finn, Vice President Investor Relations Tel: +972-77296663 | kobi.kagan@elbitsystems.com Tel: +972-54-42636 | daniella.finn@elbitsystems.com
Source: company website
More decks from Elbit Systems Ltd
 Q2 2026 Earnings Presentation16 slides · August 2026
 Q1 2026 Earnings Presentation21 slides · Jun 3, 2026
 Q1 2026 Earnings Presentation17 slides · May 26, 2026
 Q4 2025 Earnings Presentation16 slides · Mar 17, 2026
 Q3 2025 Earnings Presentation19 slides · Nov 18, 2025
 Q2 2025 Earnings Presentation22 slides · Aug 13, 2025