Perion Network Ltd · NASDAQ:PERI
Perion Network — Investor Presentation (June 2021)
35 slides from Perion Network's investor presentation, June 2021
Slide 1: The capture & convince company
the capture & convince company Investor Presentation | June 2021 1
Slide 2: Forward Looking Statements
FORWARD LOOKING STATEMENTS This presentation and our remarks contain forward-looking statements (within the meaning of The Private Securities Litigation Reform Act of 1995) that involve substantial risks and uncertainties, including statements regarding our expectations and beliefs about our busines

Slide 3: Introduction
Introduction Doron Gerstel Maoz Sigron CEO CFO 3
Slide 4: Huge TAM (and getting huger)
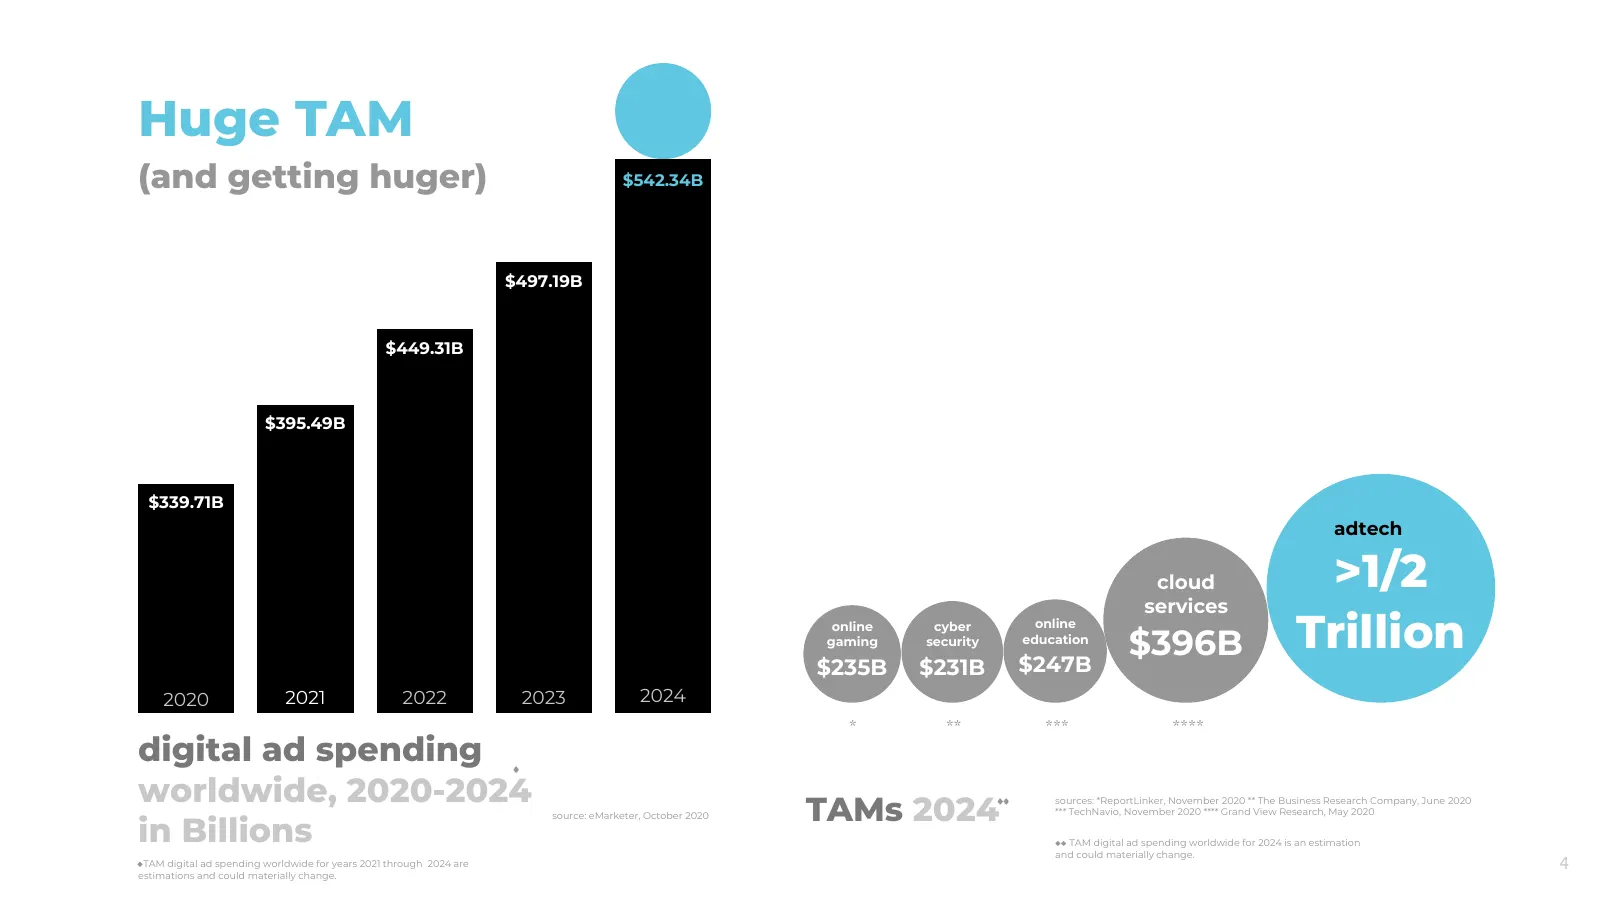
Huge TAM (and getting huger) $542.34B $497.19B $449.31B $395.49B $339.71B adtech cloud >1/2 services online gaming cyber security online education $396B Trillion $235B $231B $247B 2020 2021 2022 2023 2024 * ** *** **** digital ad spending worldwide, 2020-2024 TAMs 2024 sources: *ReportLinker, Novemb
Slide 5: Sources of growth
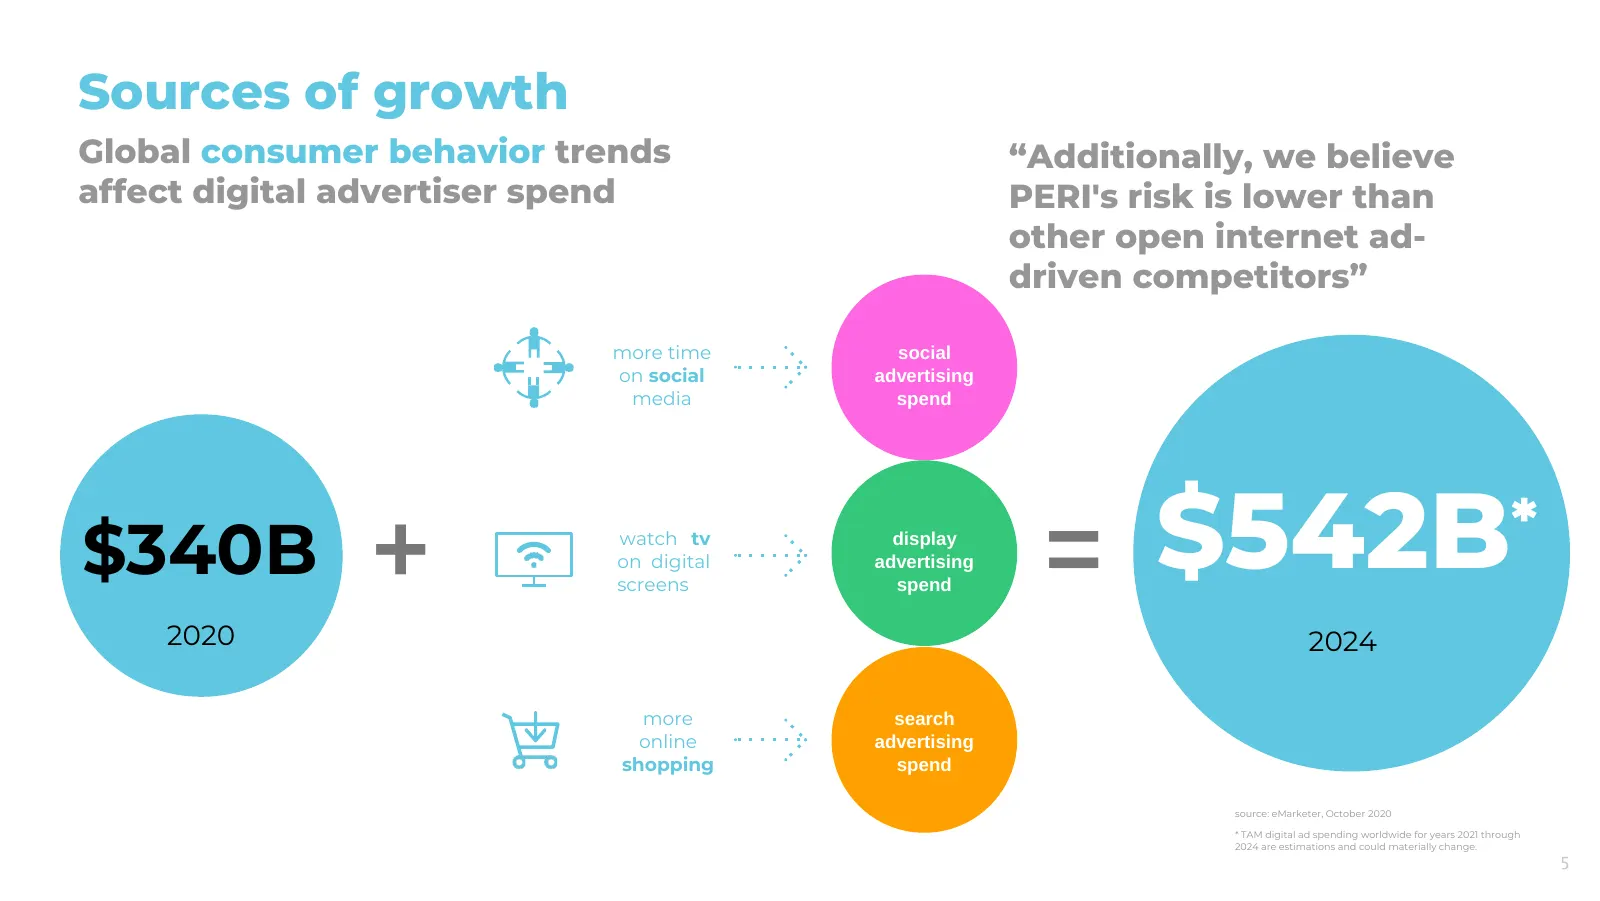
Sources of growth Global consumer behavior trends “Additionally, we believe affect digital advertiser spend PERI's risk is lower than other open internet ad- driven competitors” more time social on social advertising media spend $340B + watch tv on digital screens display advertising spend = $542B *
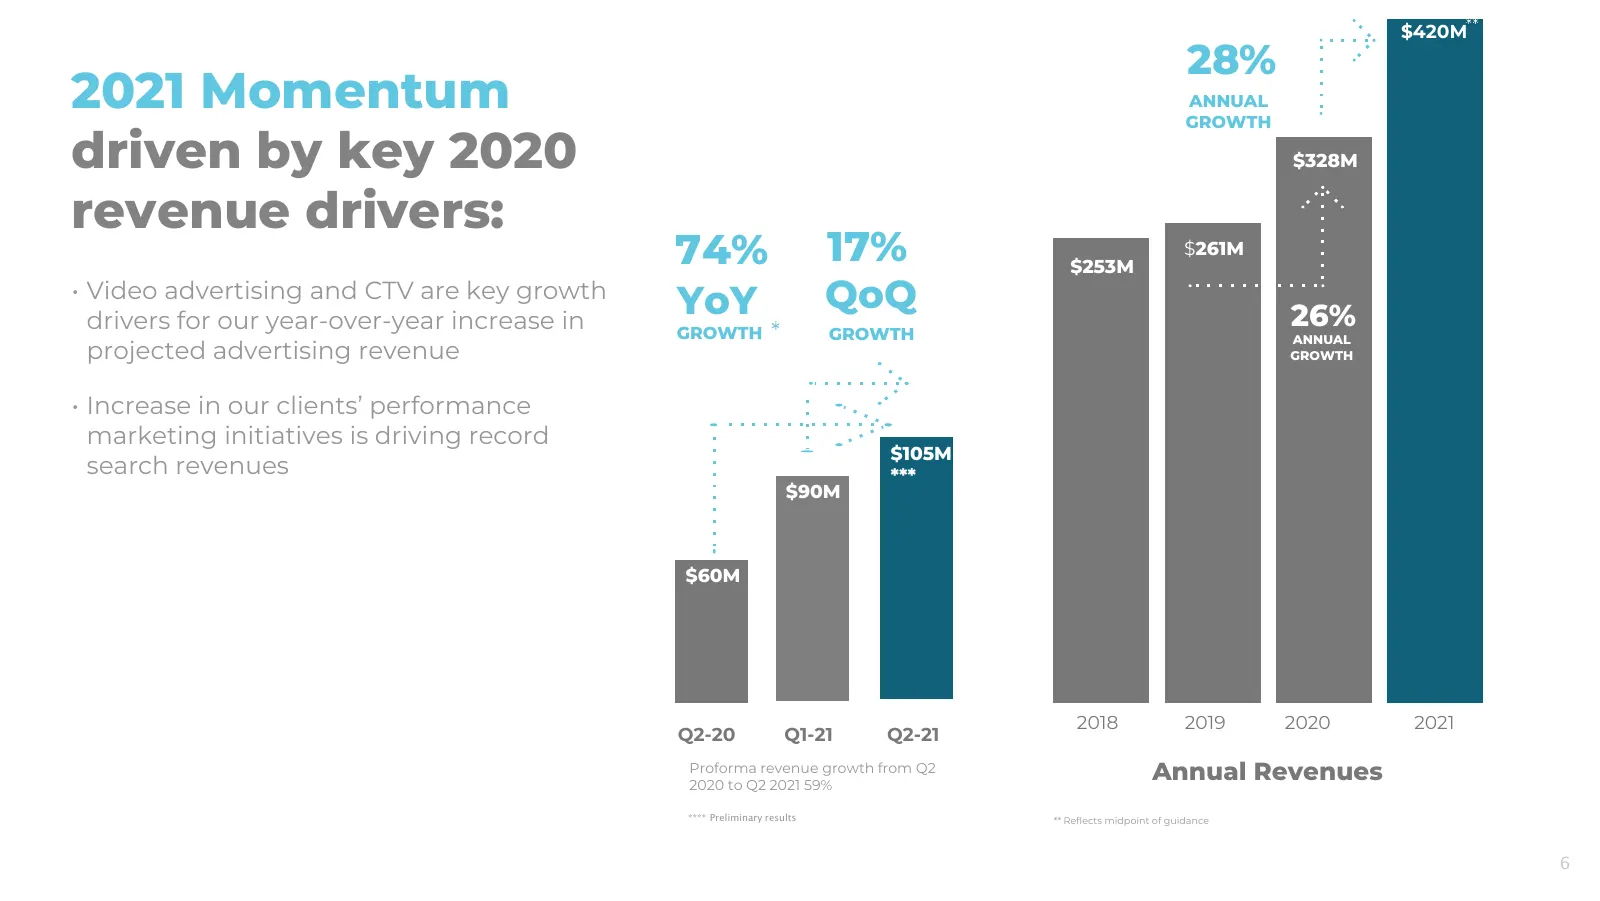
Slide 6: 2021 Momentum driven by key 2020 revenue drivers
$420M 28% 2021 Momentum ANNUAL GROWTH driven by key 2020 $328M revenue drivers: 74% 17% $253M $261M • Video advertising and CTV are key growth YoY QoQ 26% drivers for our year-over-year increase in GROWTH GROWTH ANNUAL projected advertising revenue GROWTH • Increase in our clients’ performance marke
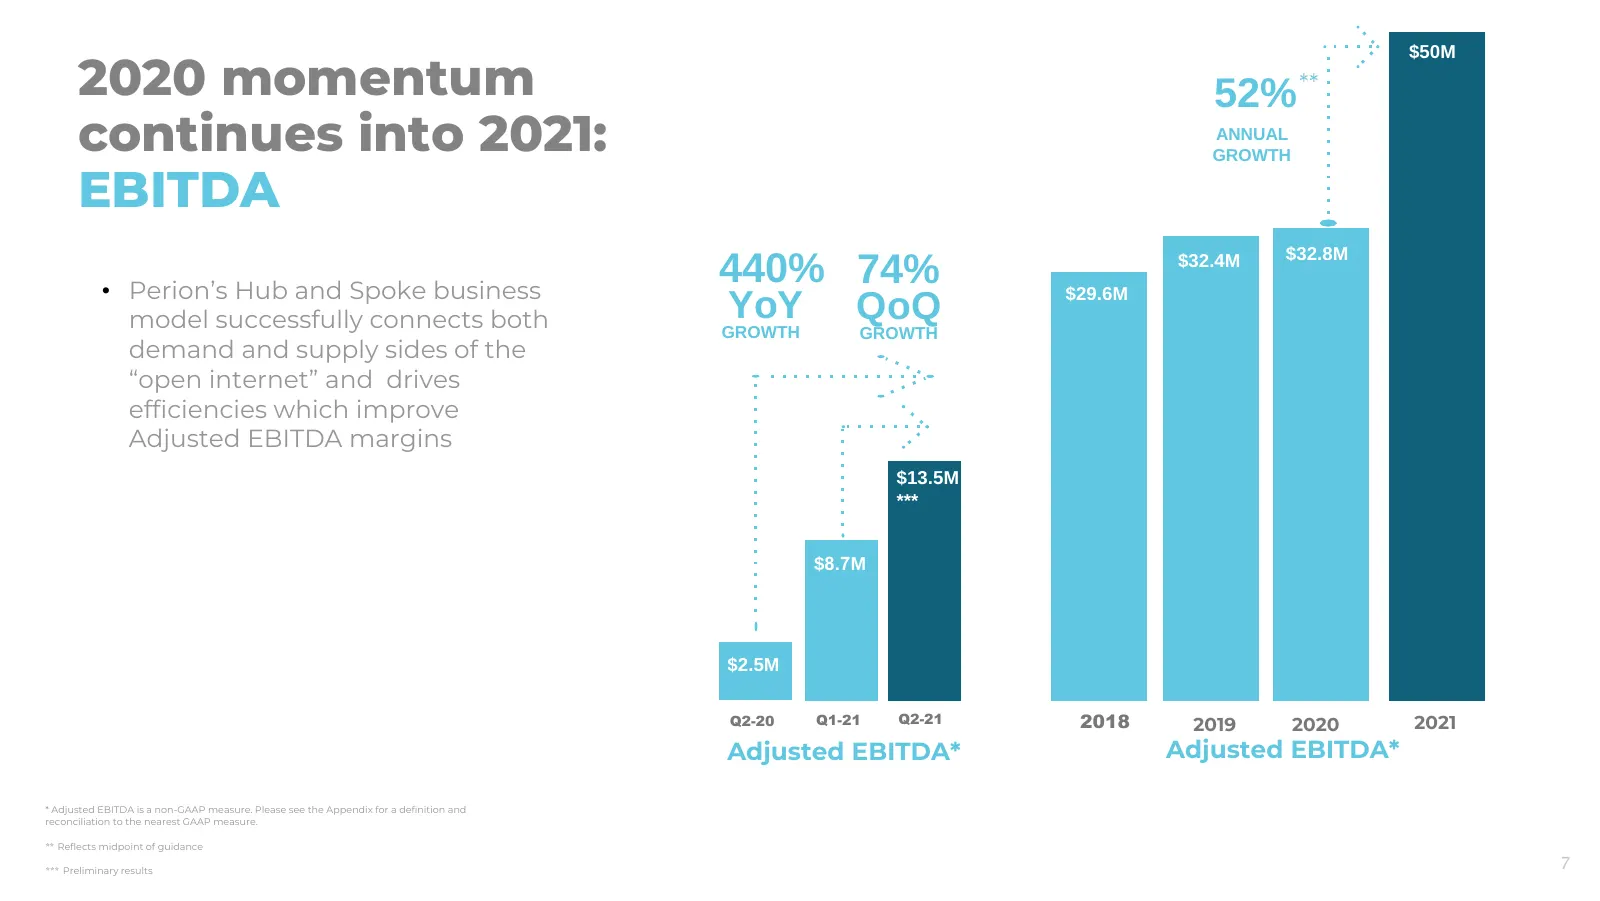
Slide 7: 2020 momentum continues into 2021: EBITDA
$50M 2020 momentum 52% continues into 2021: ANNUAL GROWTH EBITDA $32.8M • Perion’s Hub and Spoke business 440% 74% $29.6M $32.4M model successfully connects both YoY QoQ GROWTH GROWTH demand and supply sides of the “open internet” and drives efficiencies which improve Adjusted EBITDA margins $84M- $
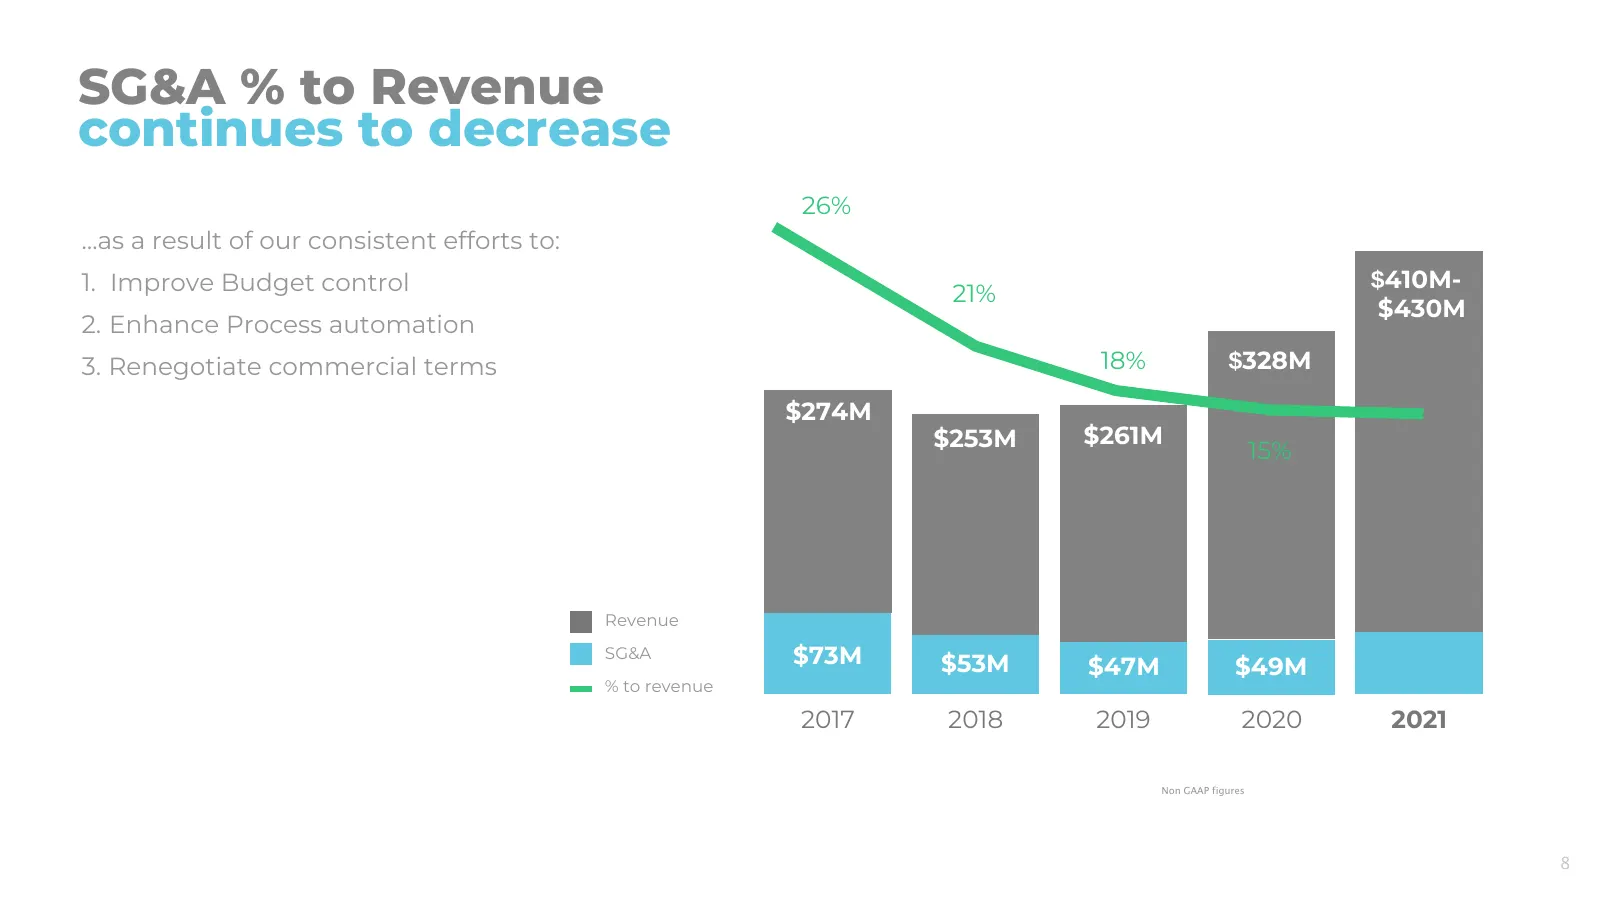
Slide 8: SG&A % to Revenue continues to decrease
SG&A % to Revenue continues to decrease 26% …as a result of our consistent efforts to: 1. Improve Budget control 21% $410M- $430M 2. Enhance Process automation 3. Renegotiate commercial terms 18% $328M $274M $253M $261M 15% Revenue SG&A $73M $53M $47M $49M % to revenue 2017 2018 2019 2020 2021 Non G
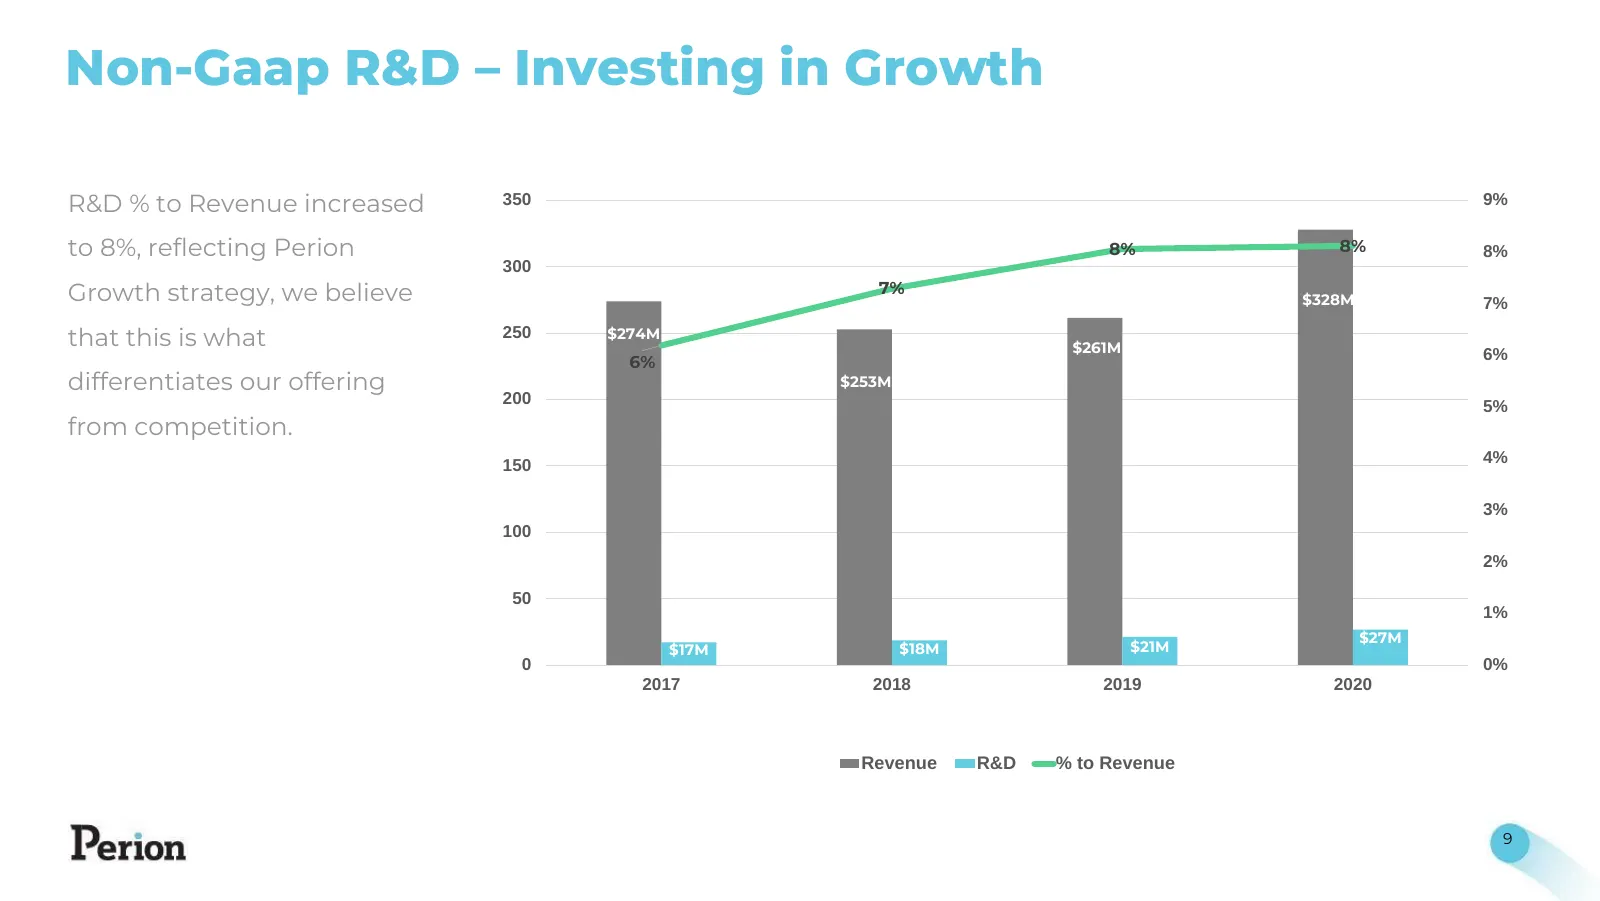
Slide 9: Non-GAAP R&D – Investing in Growth
Non-Gaap R&D – Investing in Growth R&D % to Revenue increased 350 9% to 8%, reflecting Perion 8% 8% 8% 300 Growth strategy, we believe 7% $328M 7% that this is what 250 $274M $261M 6% 6% differentiates our offering $253M 200 5% from competition. 150 4% 3% 100 2% 50 1% $27M $17M $18M $21M 0 0% 2017 2
Slide 10: Improved & Strong Balance Sheet
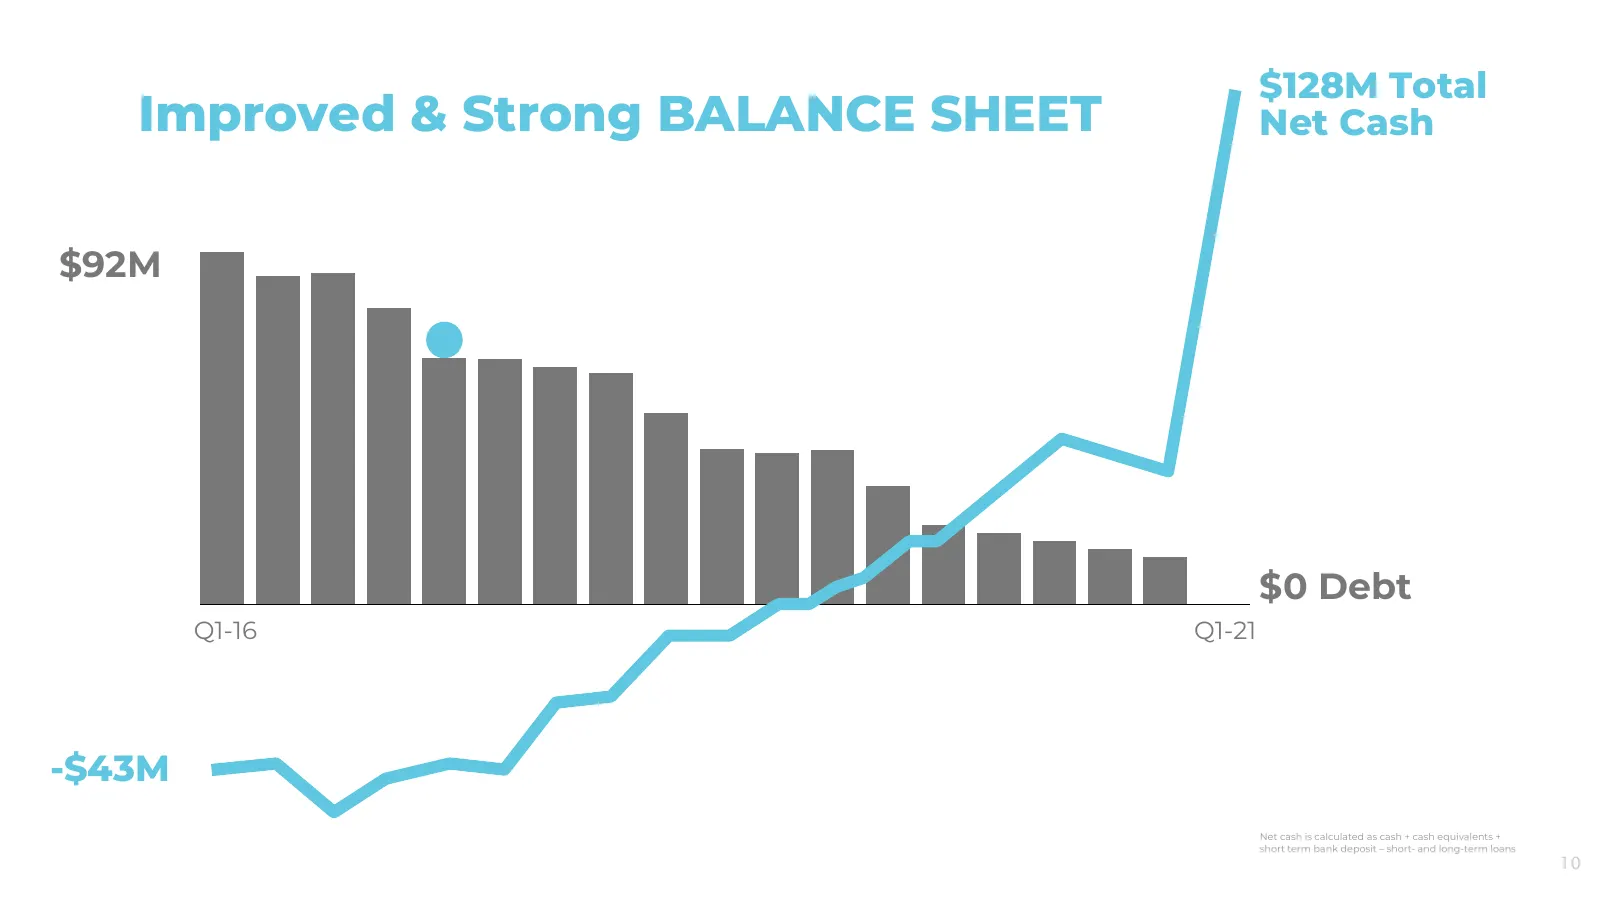
$128M Total Improved & Strong BALANCE SHEET Net Cash $92M $0 Debt Q1-16 Q1-21 -$43M Net cash is calculated as cash + cash equivalents + short term bank deposit – short- and long-term loans 10
Slide 11: Strategy: diversification
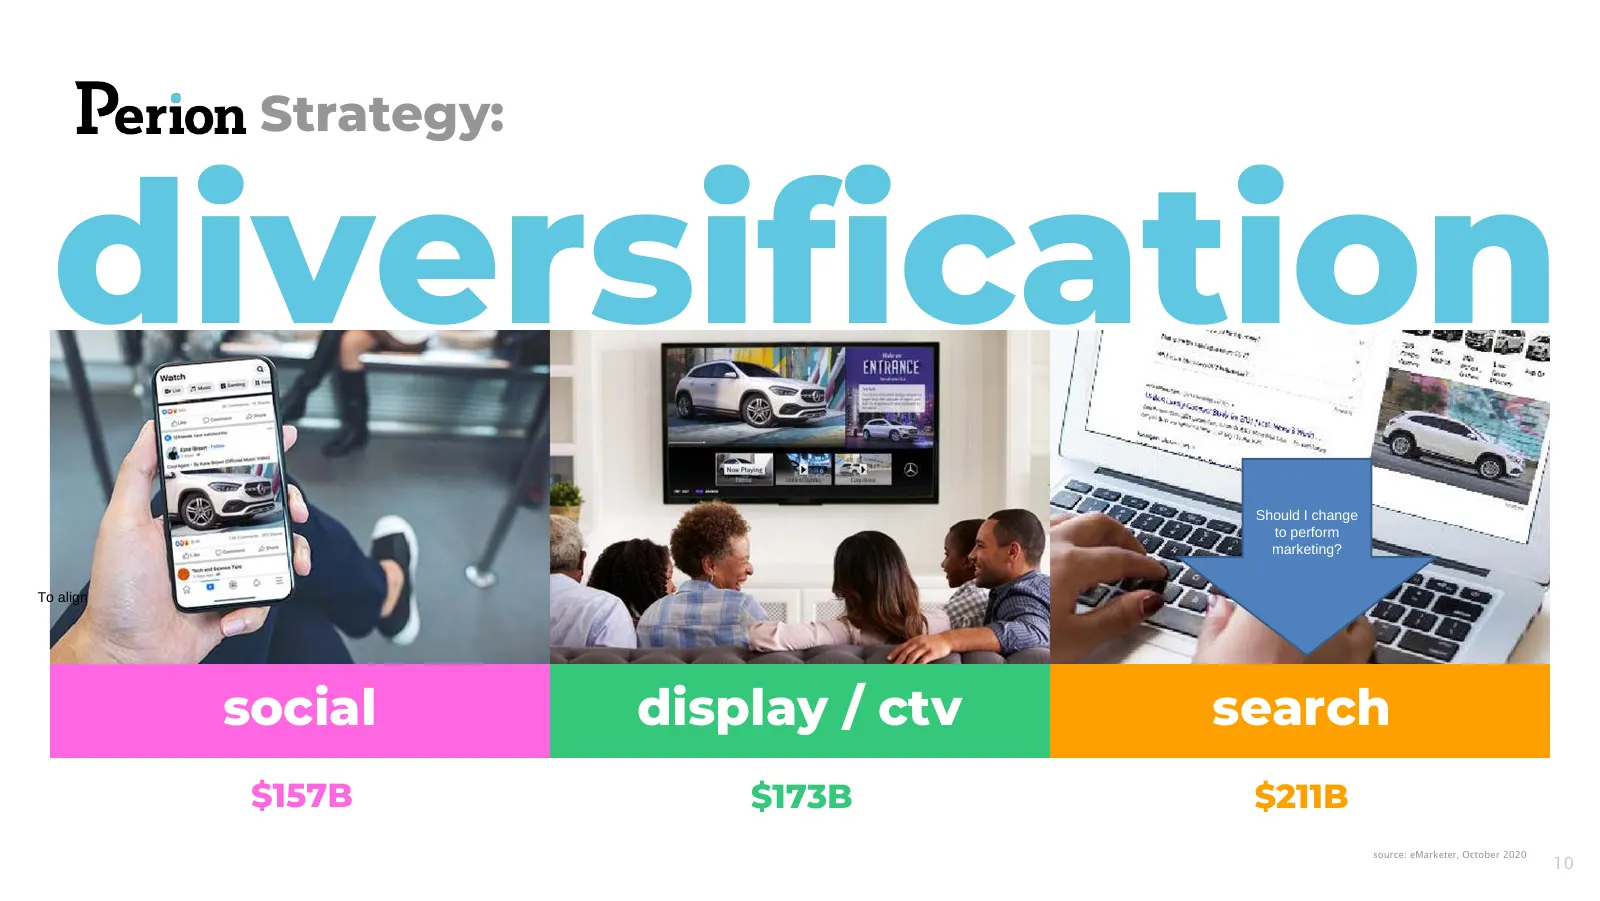
Strategy: diversification Should I change to perform marketing? To align social display / ctv search $157B $173B $211B source: eMarketer, October 2020 10
Slide 12: Ahead of Plan
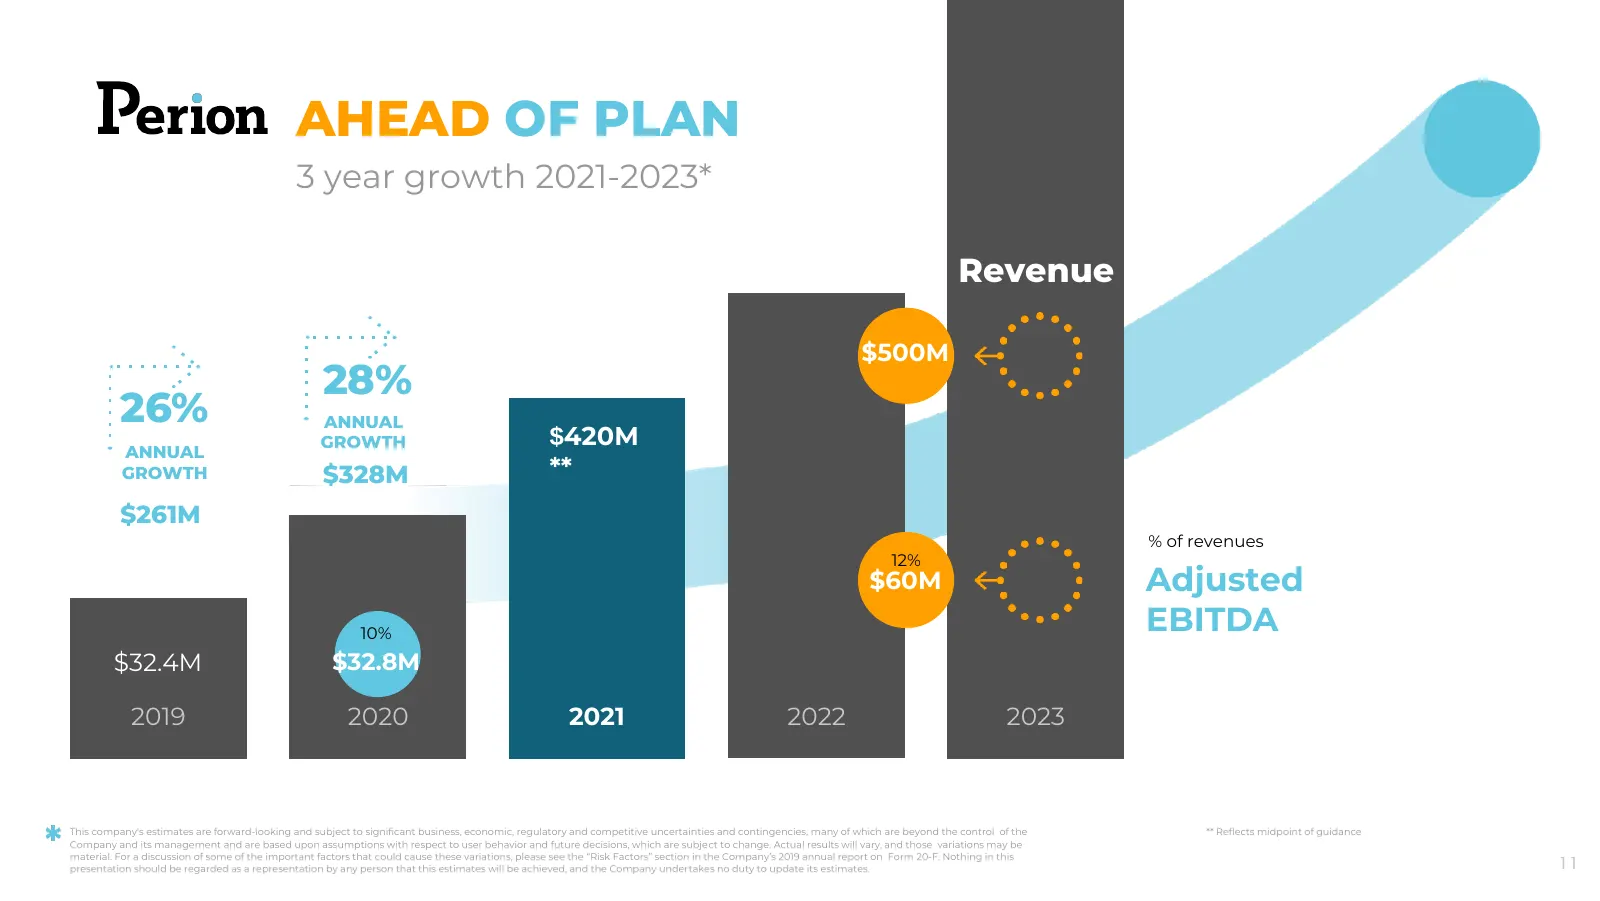
AHEAD OF PLAN 3 year growth 2021-2023* Revenue $500M 28% 26% ANNUAL ANNUAL GROWTH $420M GROWTH $328M ** $261M % of revenues 12% $60M Adjusted 10% EBITDA $32.4M $32.8M 2019 2020 2021 2022 2023 This company's estimates are forward-looking and subject to significant business, economic, regulatory and c
Slide 13: Hub&Spoke strategy generates revenue from both demand and supply sides
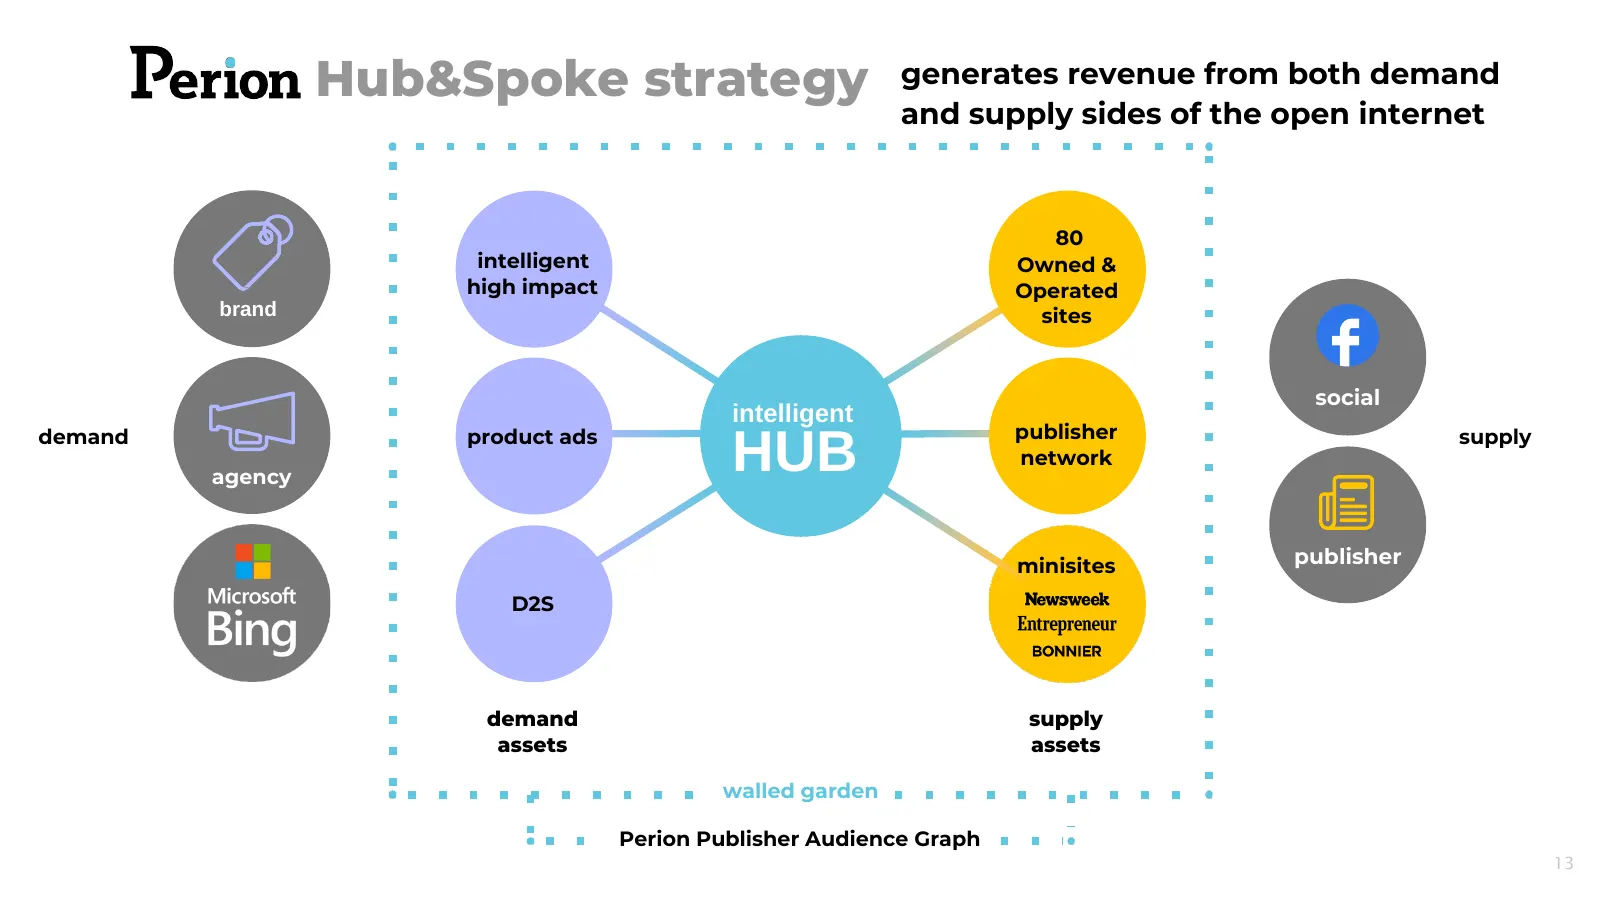
Hub&Spoke strategy generates revenue from both demand and supply sides of the open internet 80 intelligent Owned & high impact Operated brand sites social intelligent demand product ads publisher supply agency HUB network minisites publisher D2S demand supply assets assets walled garden Perion Publi
Slide 14: Display & Social Advertising Revenues
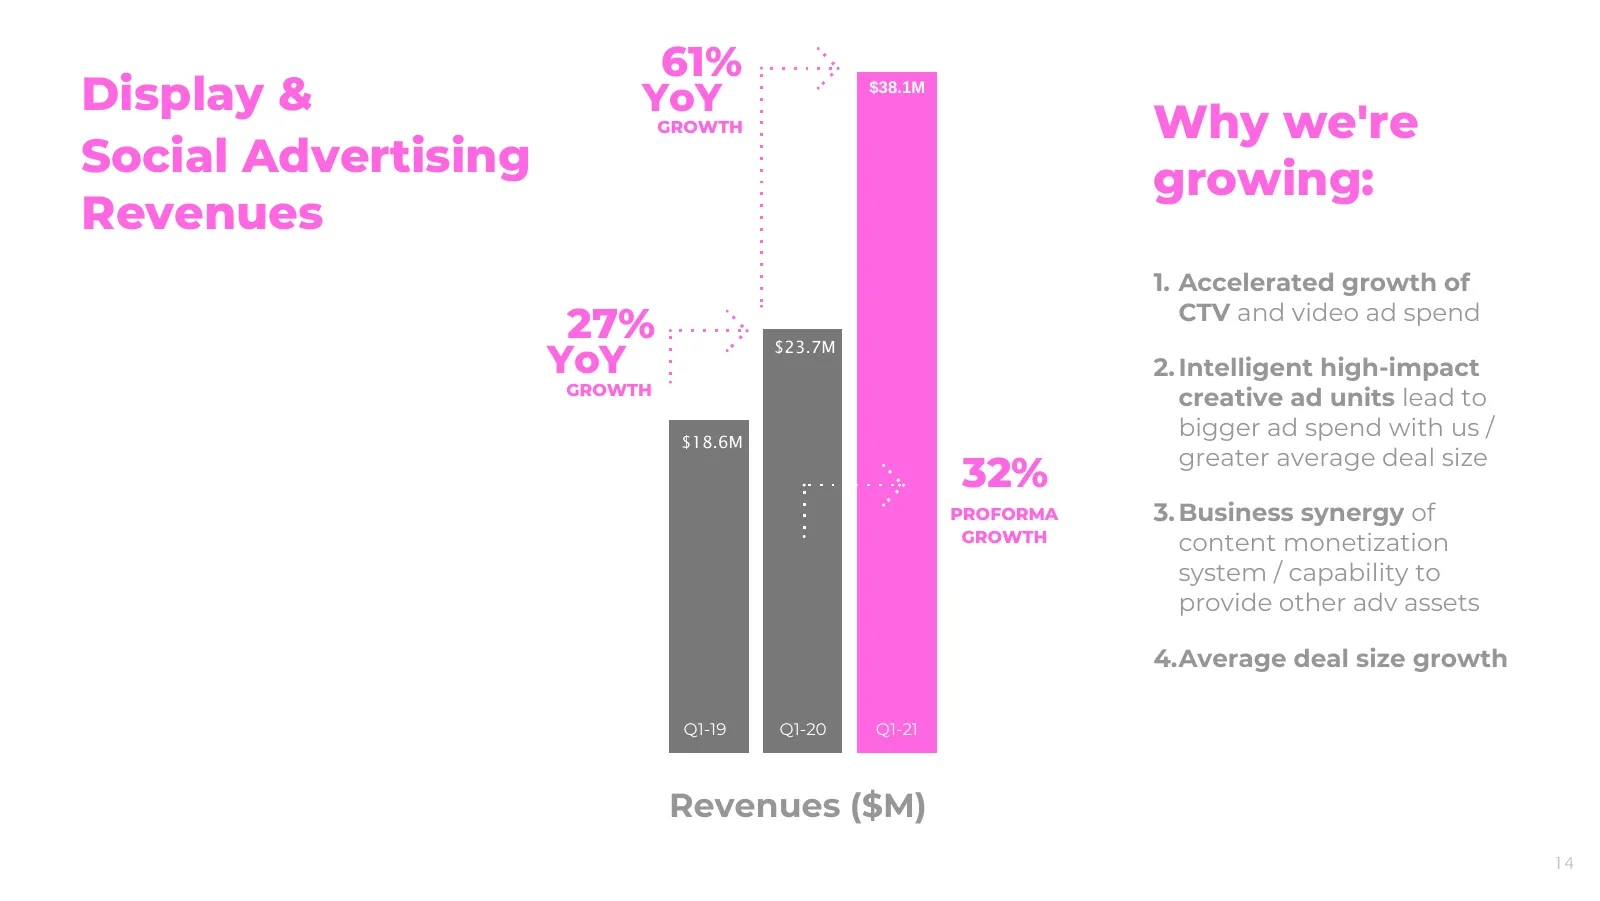
61% Display & YoY $38.1M GROWTH Why we're Social Advertising growing: Revenues 1. Accelerated growth of CTV and video ad spend 27% YoY $23.7M 2. Intelligent high-impact GROWTH creative ad units lead to $18.6M bigger ad spend with us / greater average deal size 32% PROFORMA 3. Business synergy of GRO
Slide 15: CTV Ad Spend growth driver
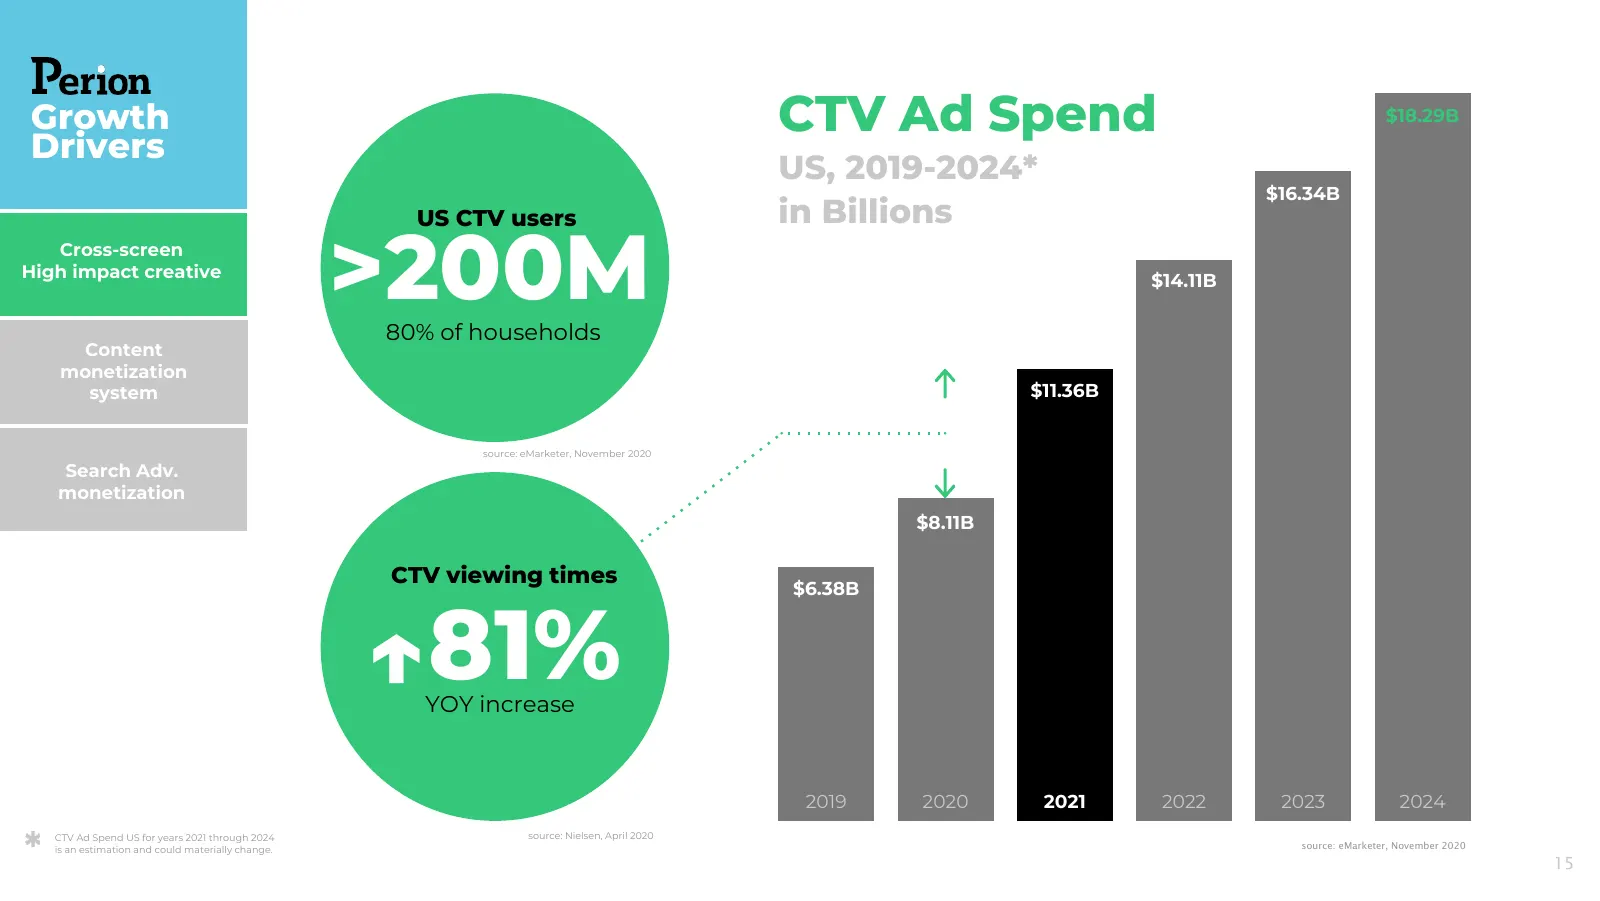
Growth CTV Ad Spend $18.29B Drivers US, 2019-2024* $16.34B US CTV users in Billions Cross-screen High impact creative >200M 80% of households $14.11B Content monetization system $11.36B source: eMarketer, November 2020 Search Adv. monetization $8.11B CTV viewing times $6.38B ↑81% YOY increase 2019 2
Slide 16: iCTV interactive ad engagement
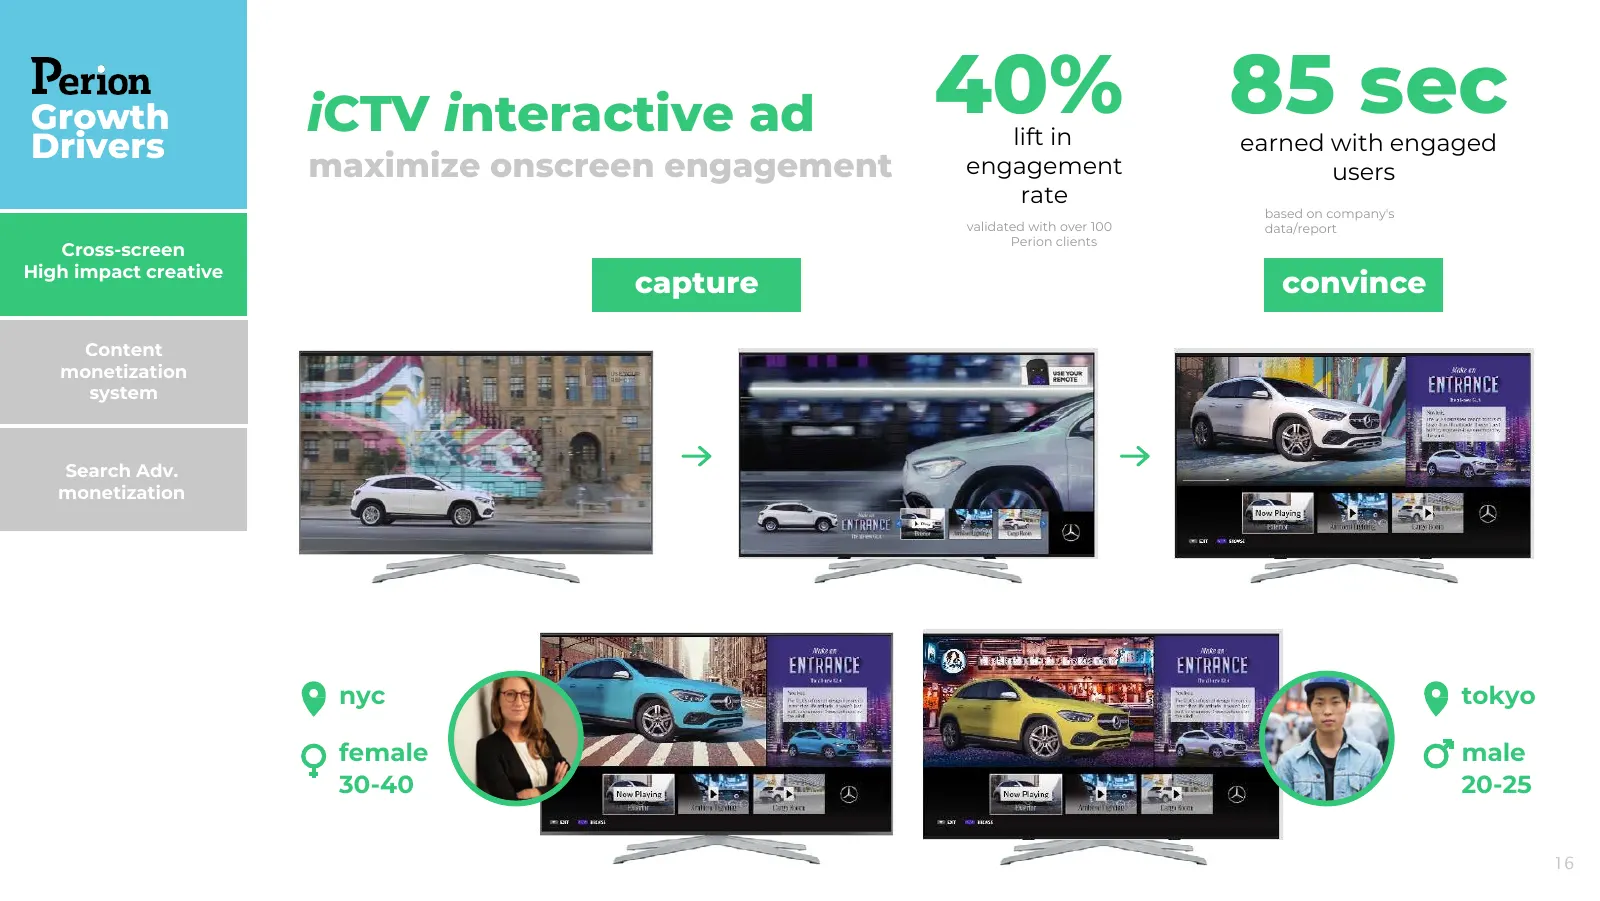
Growth iCTV interactive ad 40%lift in 85 sec Drivers earned with engaged maximize onscreen engagement engagement users rate based on company's validated with over 100 data/report Perion clients Cross-screen High impact creative capture convince Content monetization system Search Adv. monetization ny

Slide 17: iCTV as part of a multi-screen experience
Growth iCTV Drivers as part of a Cross-screen High impact creative multi-screen experience Content monetization system CTV solution served as a key factor for new customer acquisition and primary Search Adv. monetization contributor to 11% increase in average deal size 17
Slide 18: Publishers are struggling
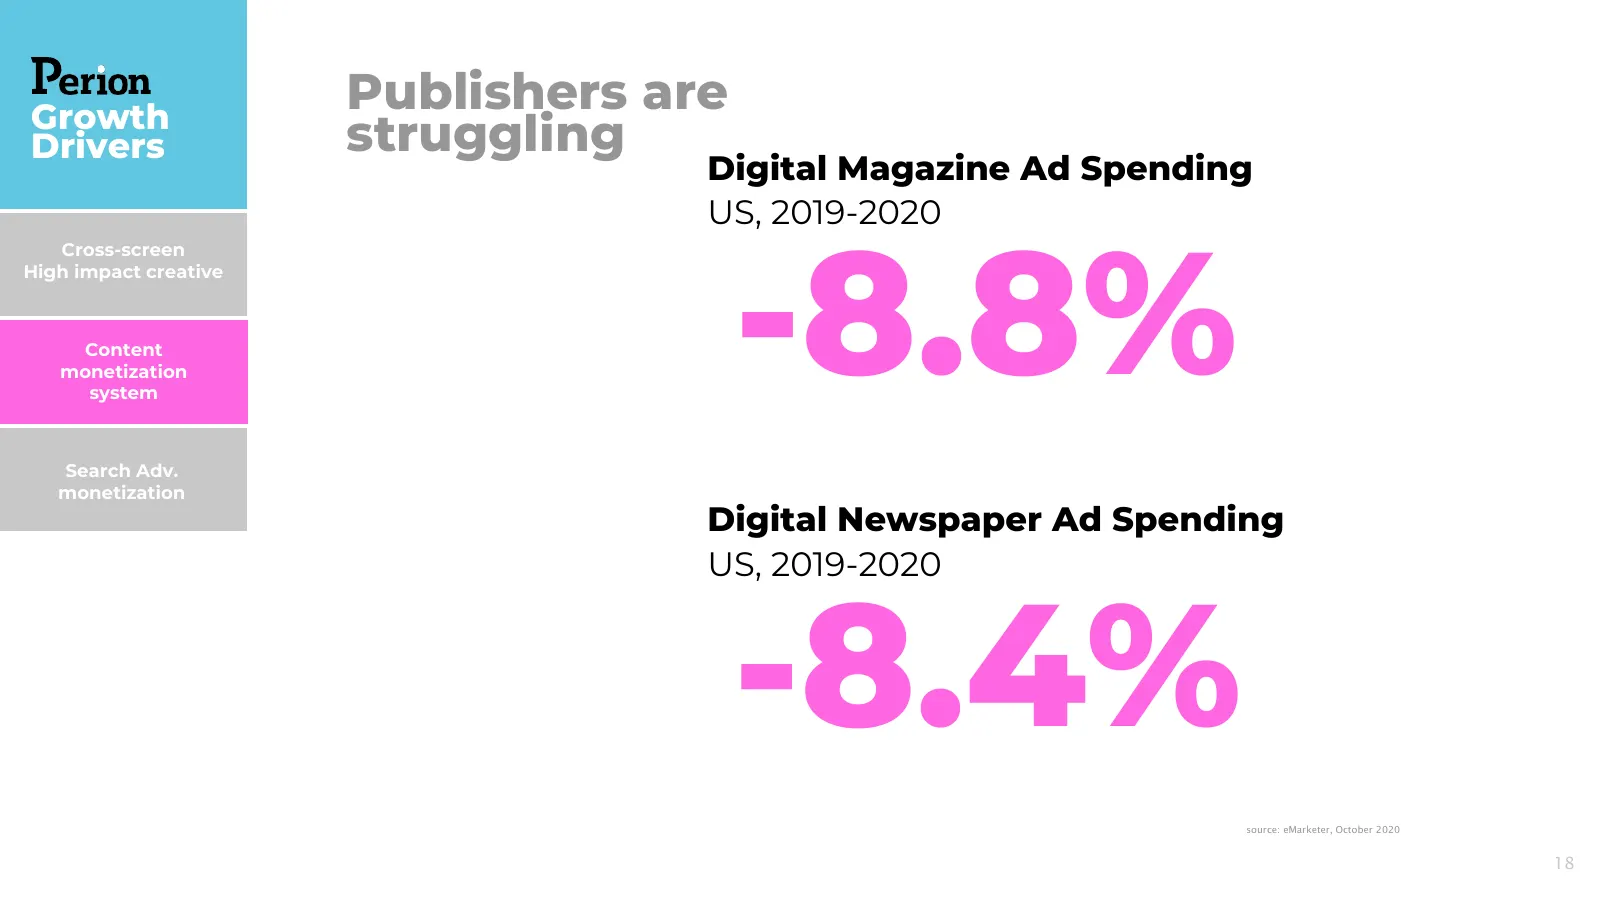
Growth Publishers are Drivers struggling Digital Magazine Ad Spending US, 2019-2020 -8.8% Cross-screen High impact creative Content monetization system Search Adv. monetization Digital Newspaper Ad Spending US, 2019-2020 -8.4% source: eMarketer, October 2020 18
Slide 19: Content monetization system
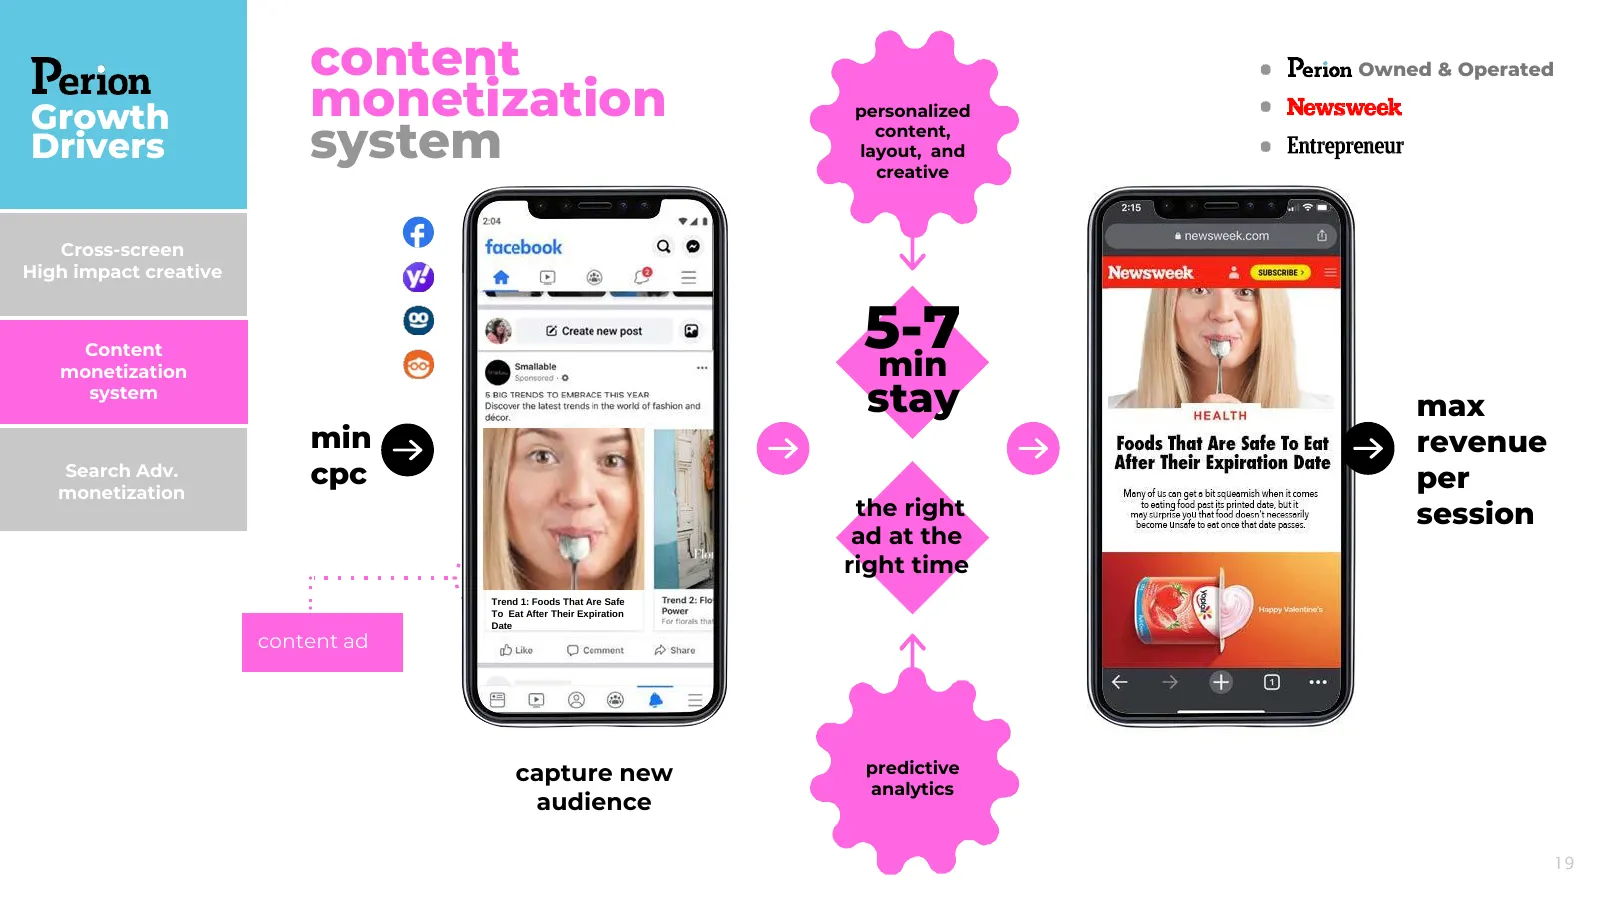
content Owned & Operated Growth monetization personalized Drivers system content, layout, and creative Cross-screen High impact creative Content 5-7 min monetization system stay max min revenue Search Adv. cpc per monetization the right session ad at the right time Trend 1: Foods That Are Safe To Ea
Slide 20: Key Growth Drivers Search Ad Spending
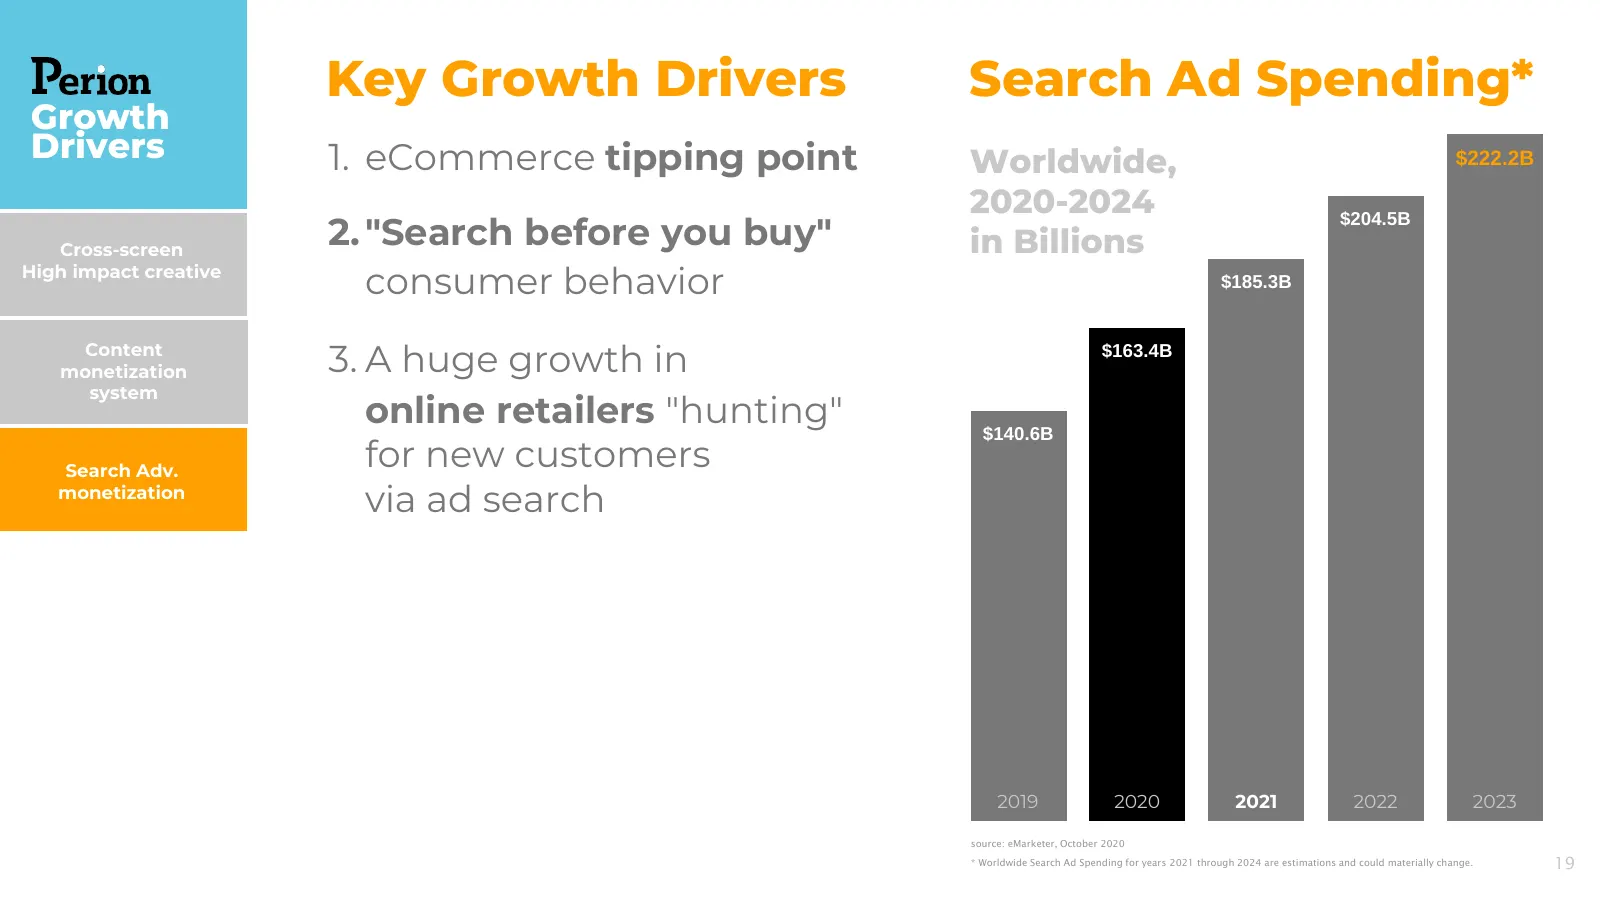
Key Growth Drivers Search Ad Spending* Growth Drivers 1. eCommerce tipping point Worldwide, $222.2B 2020-2024 2. "Search before you buy" $204.5B Cross-screen in Billions High impact creative consumer behavior $185.3B Content monetization 3. A huge growth in $163.4B system online retailers "hunting"
Slide 21: New monetization opportunities within apps
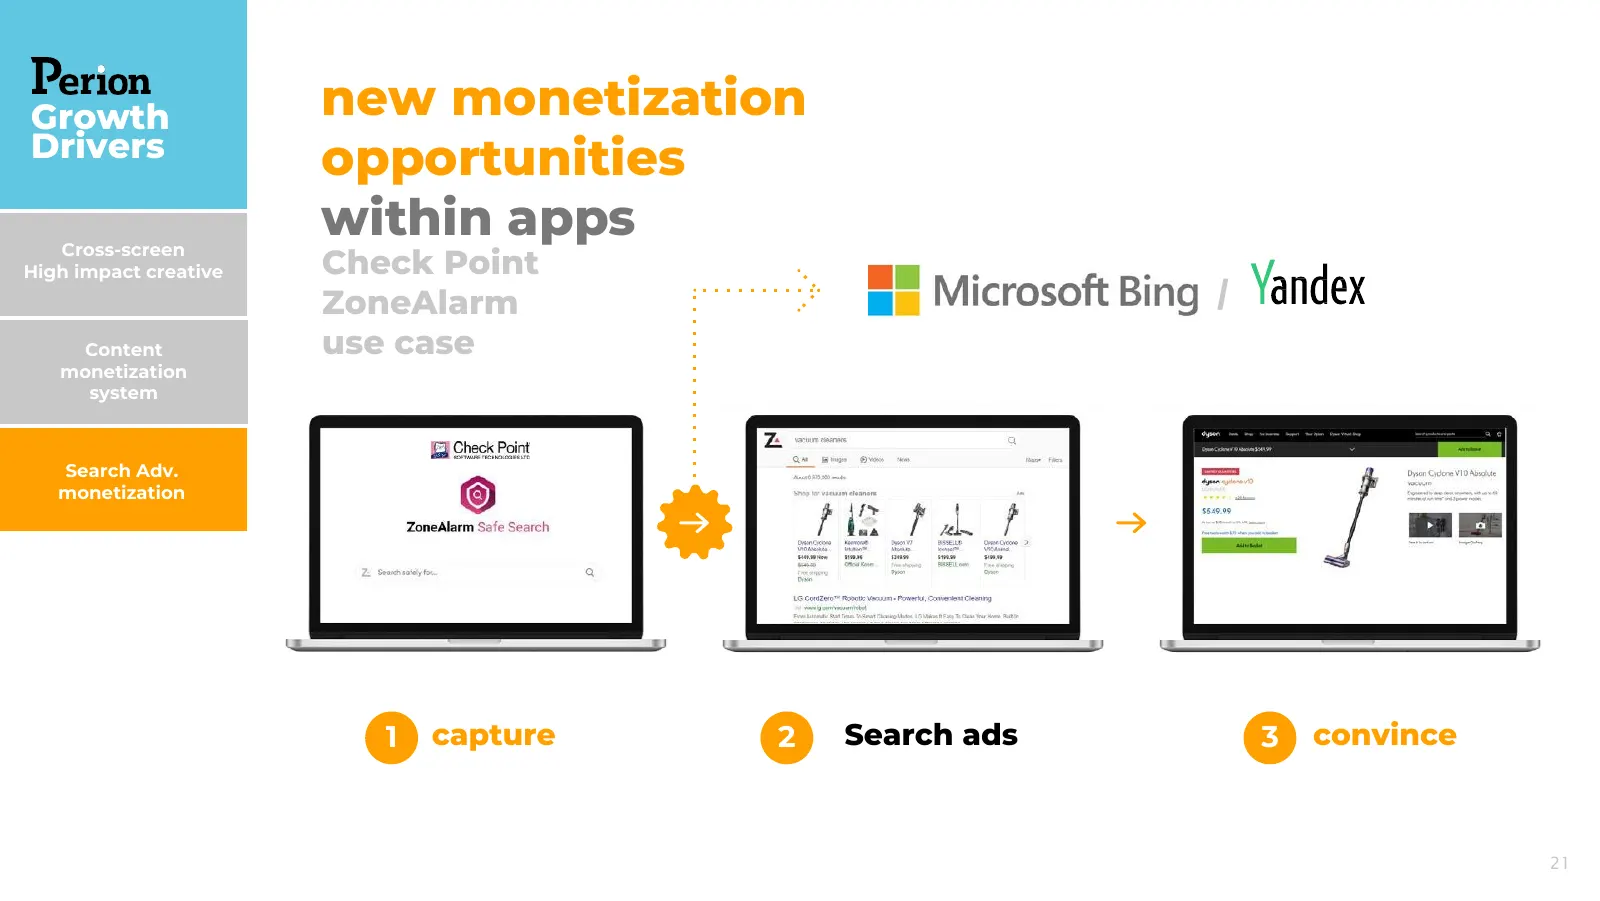
Growth new monetization Drivers opportunities Cross-screen within apps High impact creative Check Point ZoneAlarm / Content use case monetization system Search Adv. monetization 1 capture 2 Search ads 3 convince 21

Slide 22: Search mediation for publishers
Search mediation Growth for publishers Drivers Cross-screen High impact creative Content monetization system Search Adv. monetization channel chosen contextual match of according to best search results to text chances of action 1 2 Display to Search convince 22
Slide 23: $900M new agreement signed Nov. 2020
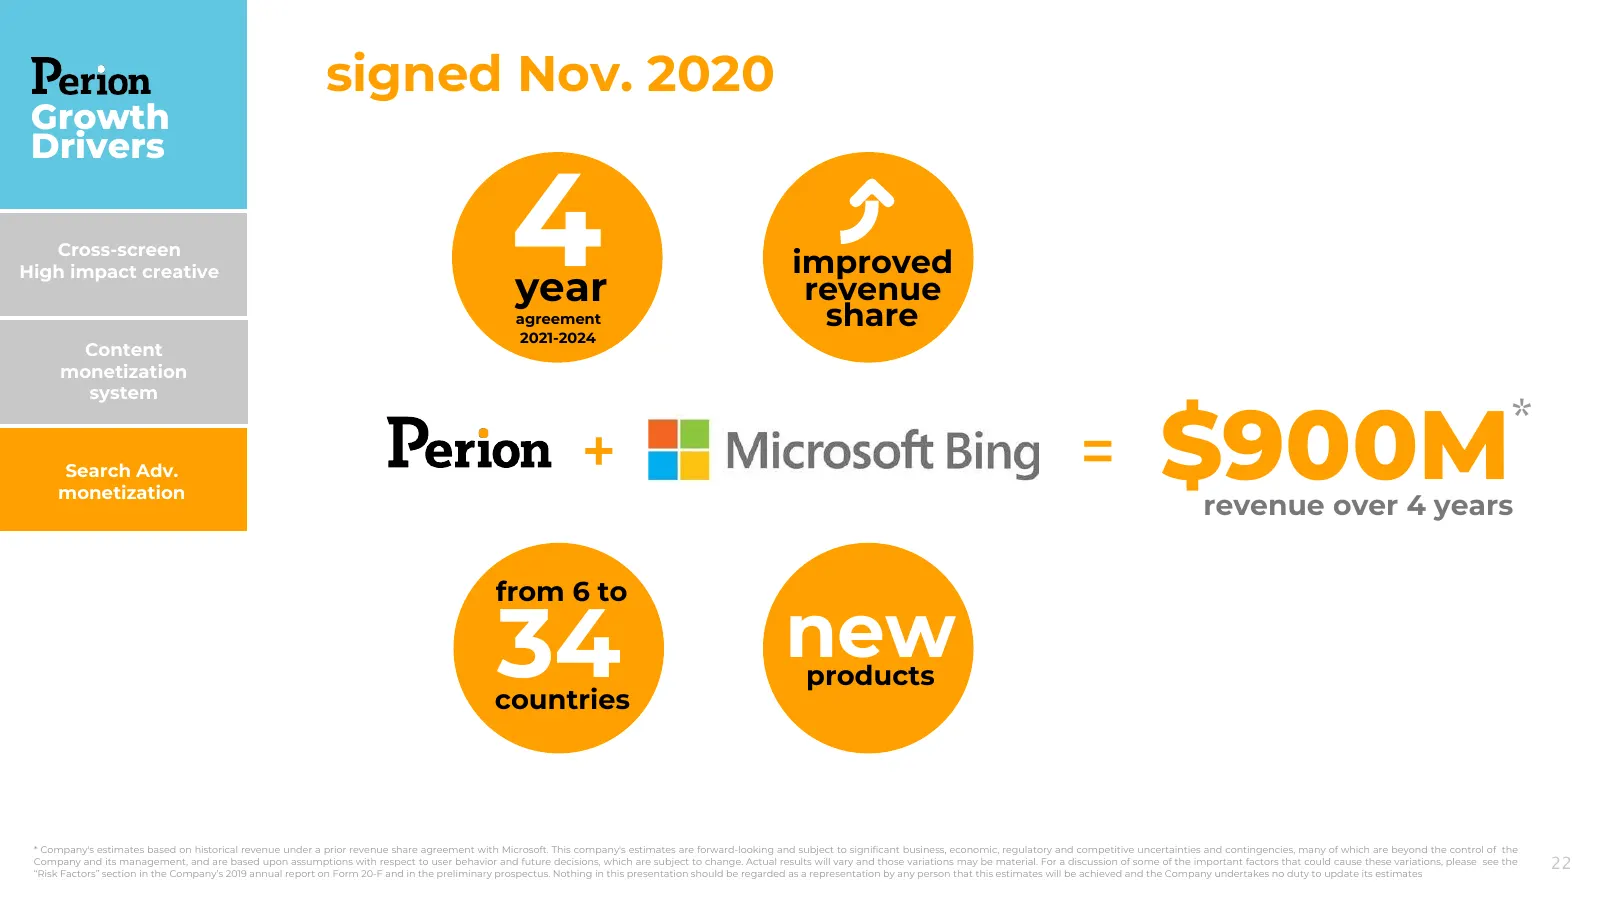
signed Nov. 2020 Growth Drivers Cross-screen High impact creative 4year agreement improved revenue share 2021-2024 Content monetization system Search Adv. monetization + = $900M revenue over 4 years * from 6 to 34 countries new products * Company's estimates based on historical revenue under a prior
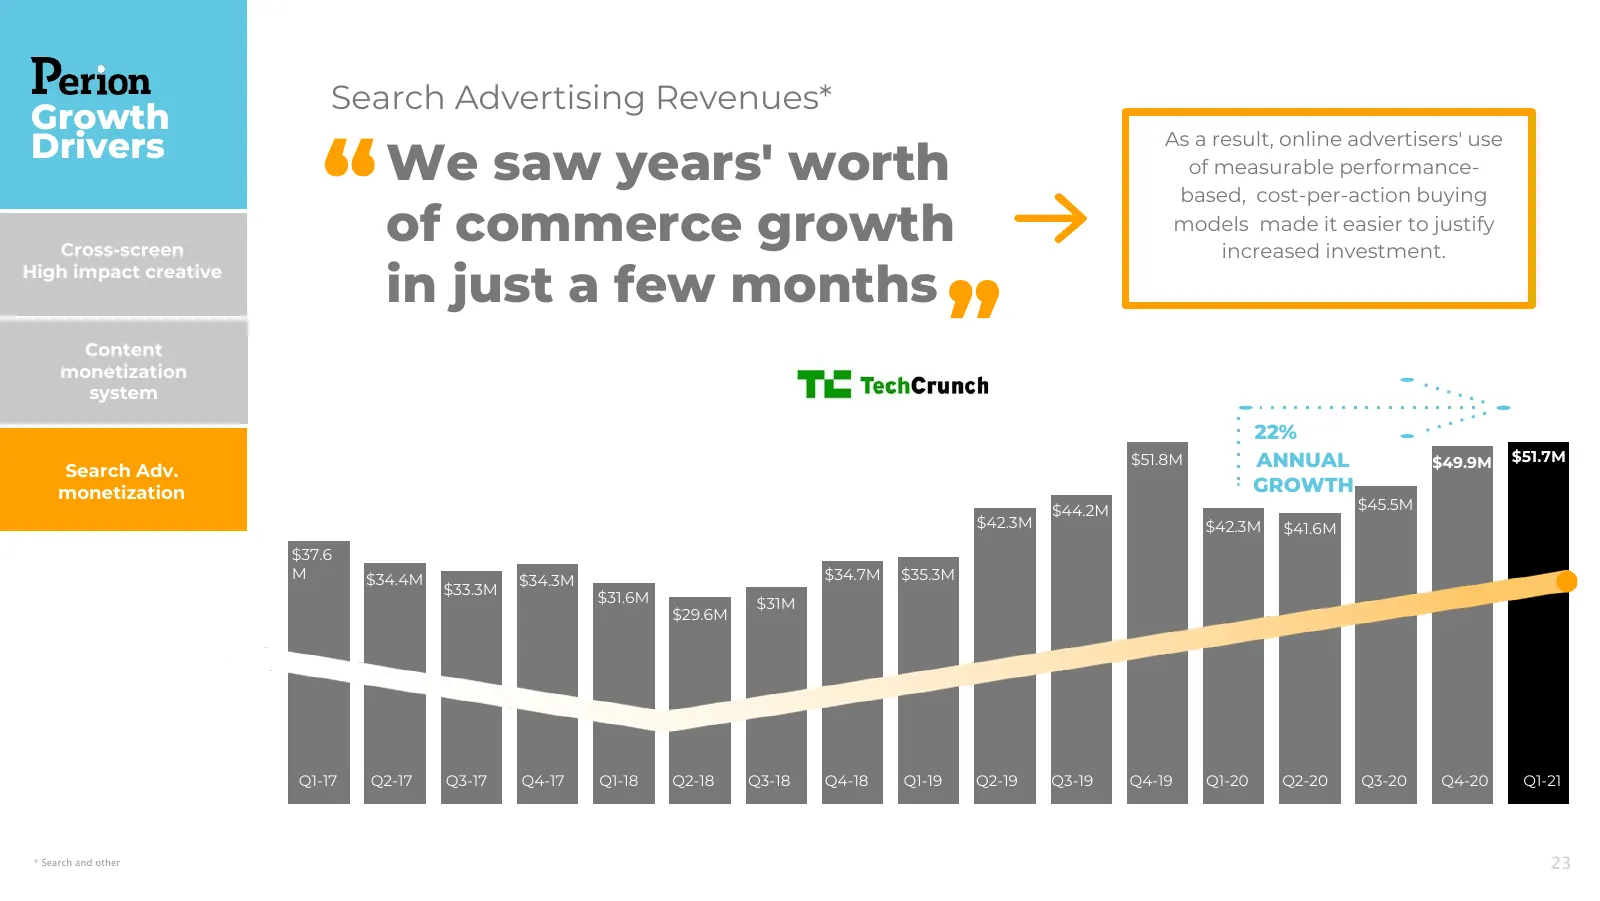
Slide 24: We saw years' worth of commerce growth in just a few months
Search Advertising Revenues* Growth Drivers As a result, online advertisers' use We saw years' worth of measurable performance- based, cost-per-action buying Cross-screen of commerce growth models made it easier to justify increased investment. High impact creative in just a few months Content monet
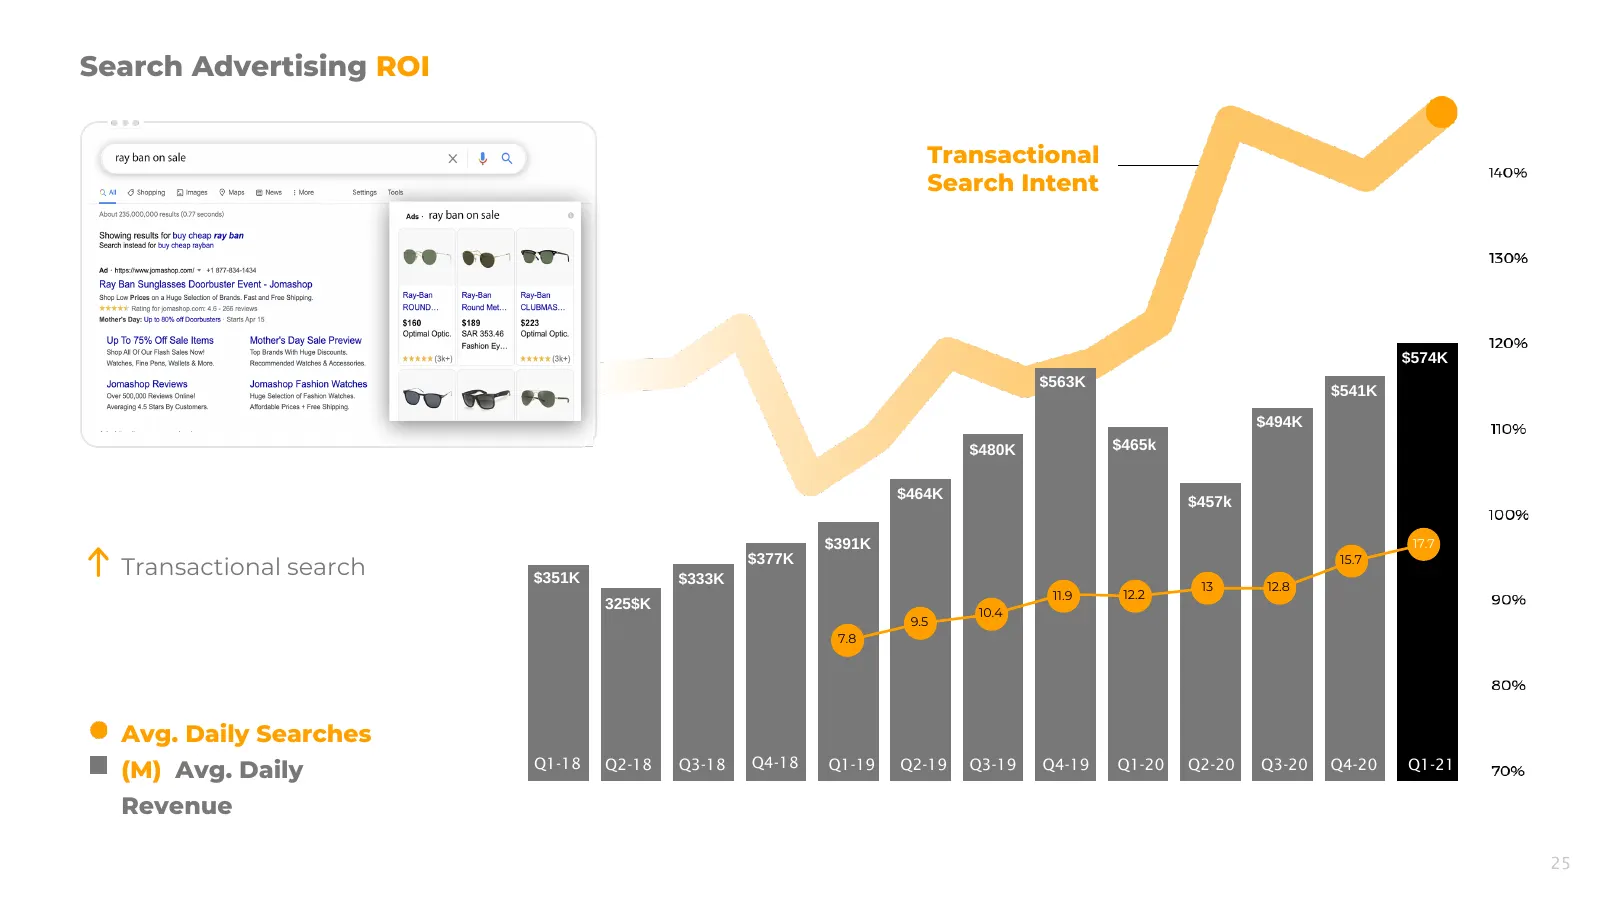
Slide 25: Search Advertising ROI
Search Advertising ROI Transactional Search Intent $574K $563K $541K $494K $480K $465k $464K $457k $391K 17.7 15.7 Transactional search $351K $333K $377K 13 12.8 11.9 12.2 325$K 10.4 9.5 7.8 Avg. Daily Searches Q1-18 Q2-18 Q3-18 Q4-18 Q1-19 Q2-19 Q3-19 Q4-19 Q1-20 Q2-20 Q3-20 Q4-20 Q1-21 (M) Avg. Da
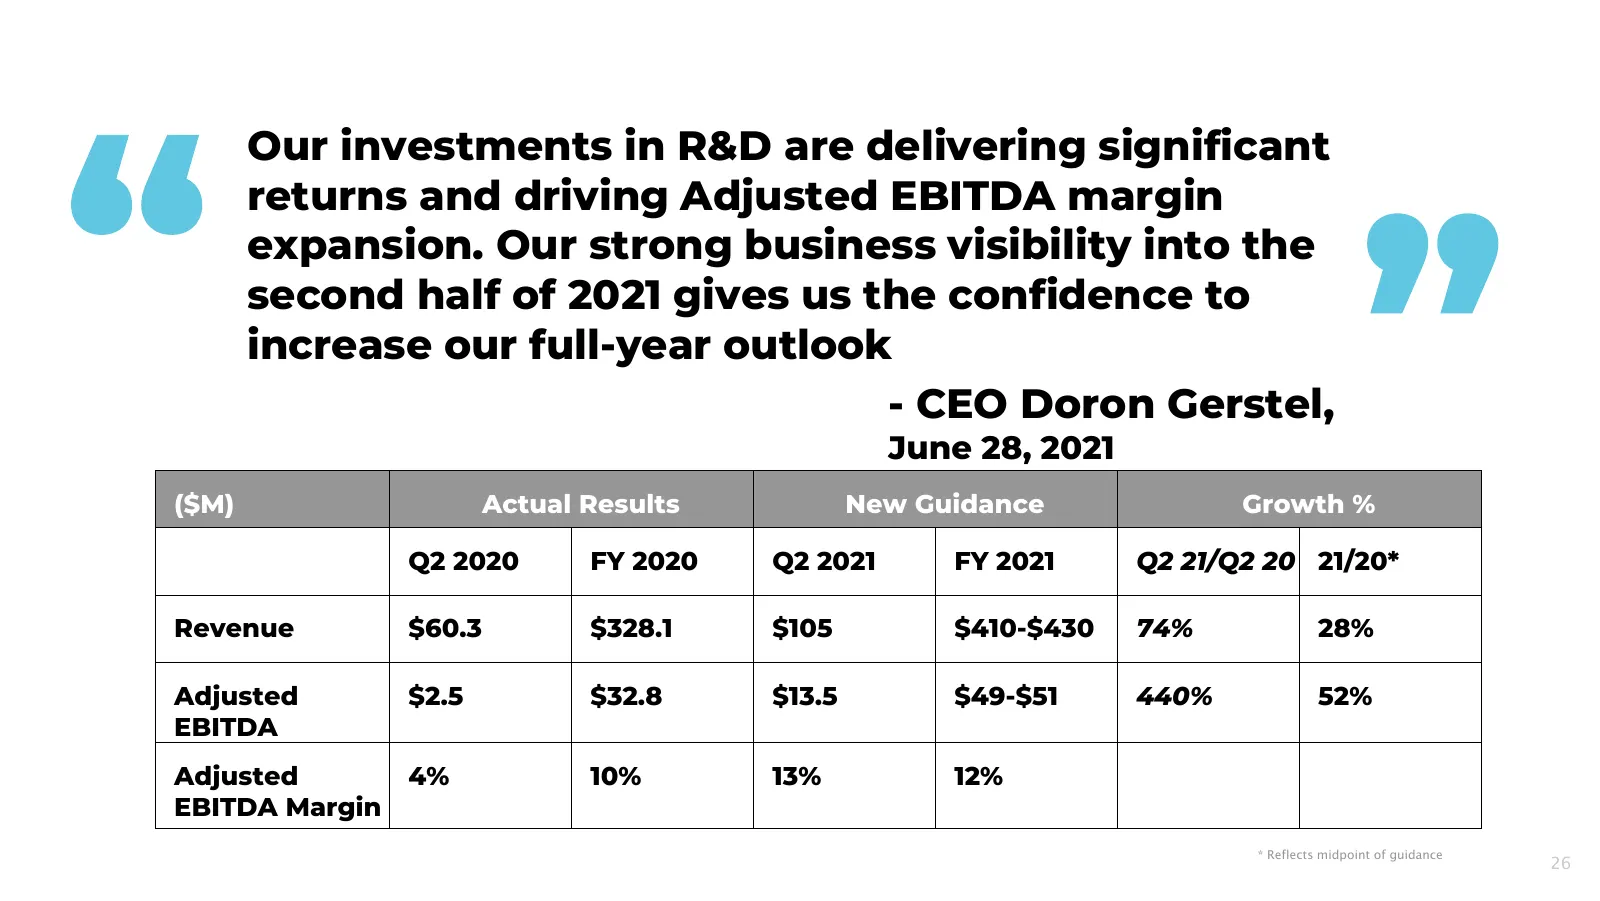
Slide 26: Actual results and new guidance
Our investments in R&D are delivering significant returns and driving Adjusted EBITDA margin expansion. Our strong business visibility into the second half of 2021 gives us the confidence to increase our full-year outlook - CEO Doron Gerstel, June 28, 2021 ($M) Actual Results New Guidance Growth % Q
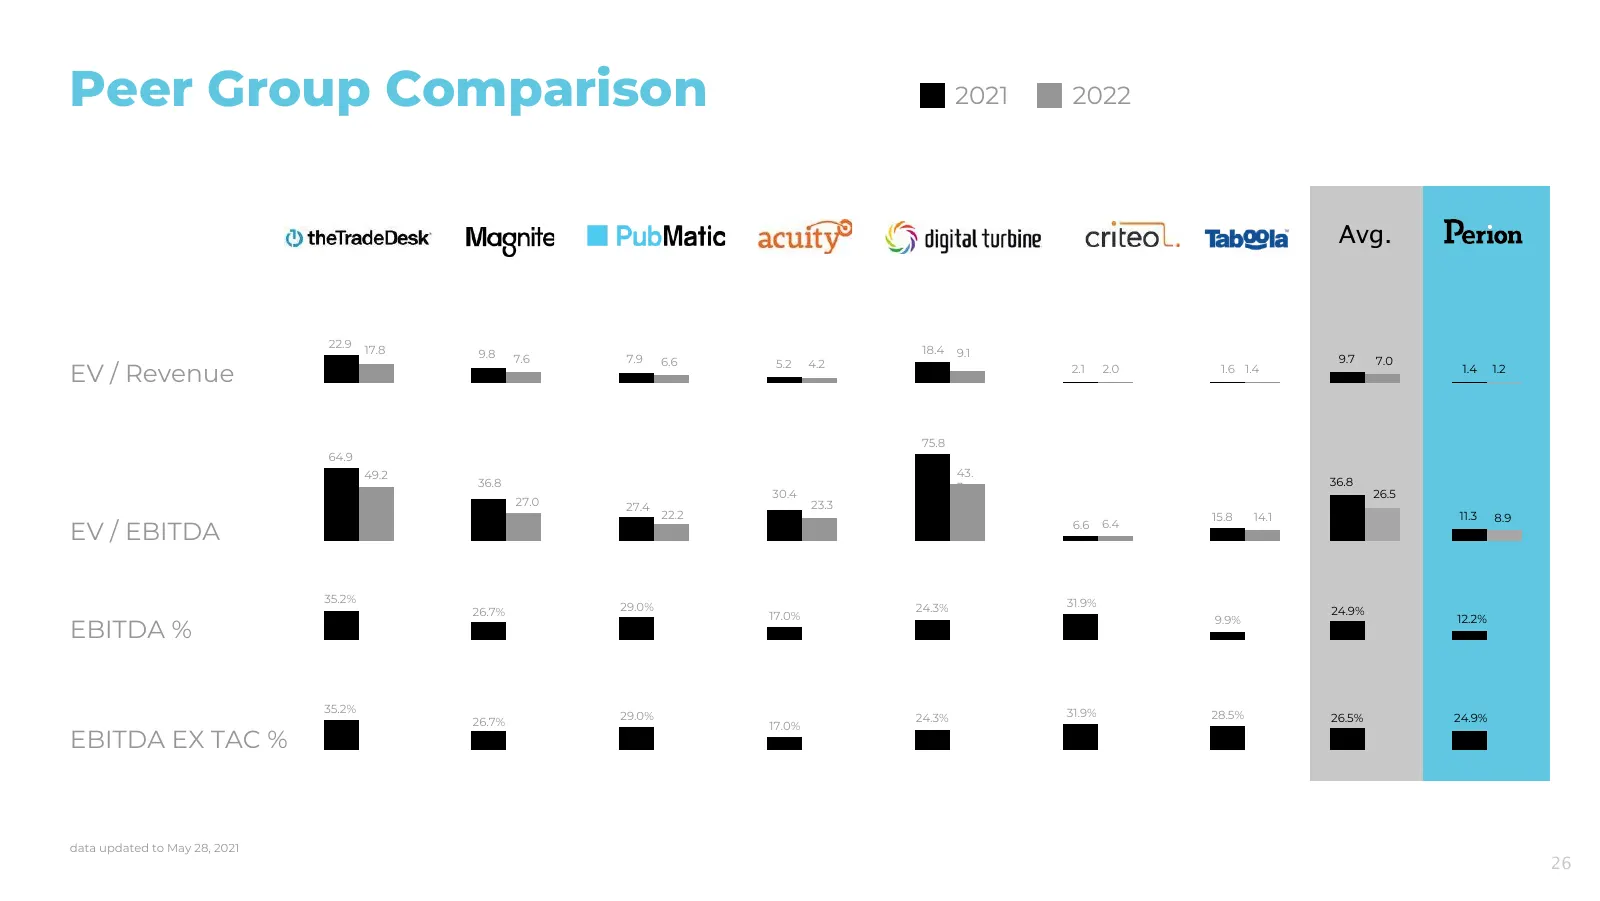
Slide 27: Peer Group Comparison
Peer Group Comparison 2021 2022 Avg. 22.9 17.8 9.8 18.4 9.1 7.6 7.9 6.6 5.2 4.2 9.7 7.0 EV / Revenue 2.1 2.0 1.6 1.4 1.4 1.2 75.8 64.9 49.2 43. 36.8 3 36.8 30.4 26.5 27.0 27.4 23.3 22.2 15.8 14.1 11.3 8.9 EV / EBITDA 6.6 6.4 35.2% 31.9% 26.7% 29.0% 24.3% 24.9% 17.0% 9.9% 12.2% EBITDA % 35.2% 31.9% 2

Slide 28: capture&convince
Perion ~ 7 capture&convince

Slide 29: Thank you
thank you

Slide 30: Appendix
appendix 30
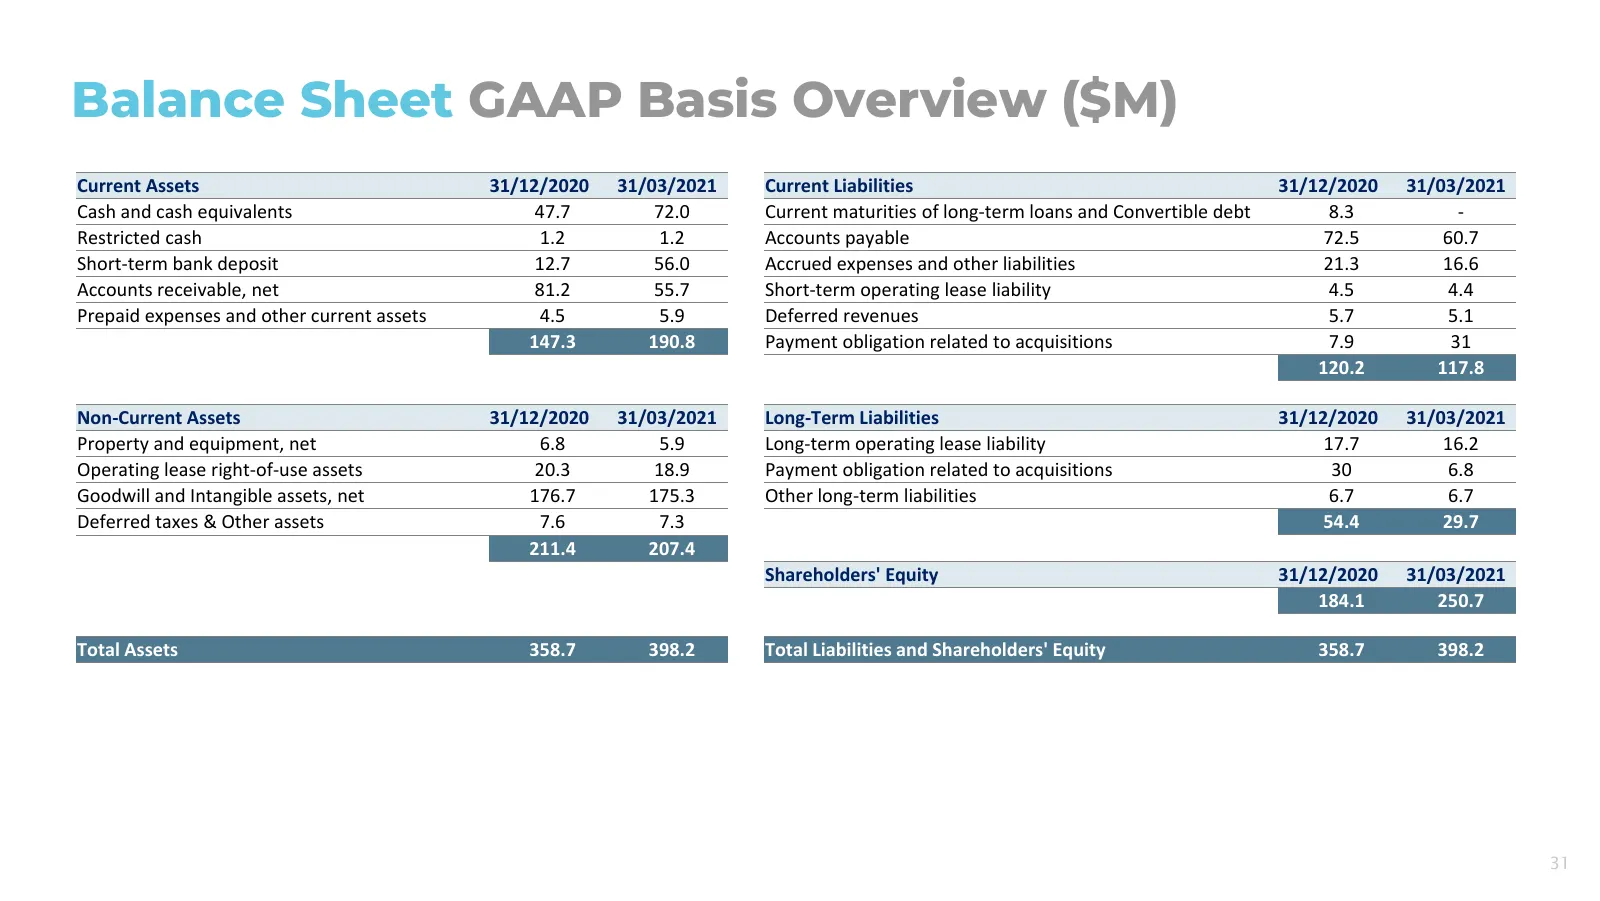
Slide 31: Balance Sheet GAAP Basis Overview ($M)
Balance Sheet GAAP Basis Overview ($M) Current Assets 31/12/2020 31/03/2021 Current Liabilities 31/12/2020 31/03/2021 Cash and cash equivalents 47.7 72.0 Current maturities of long-term loans and Convertible debt 8.3 - Restricted cash 1.2 1.2 Accounts payable 72.5 60.7 Short-term bank deposit 12.7 5
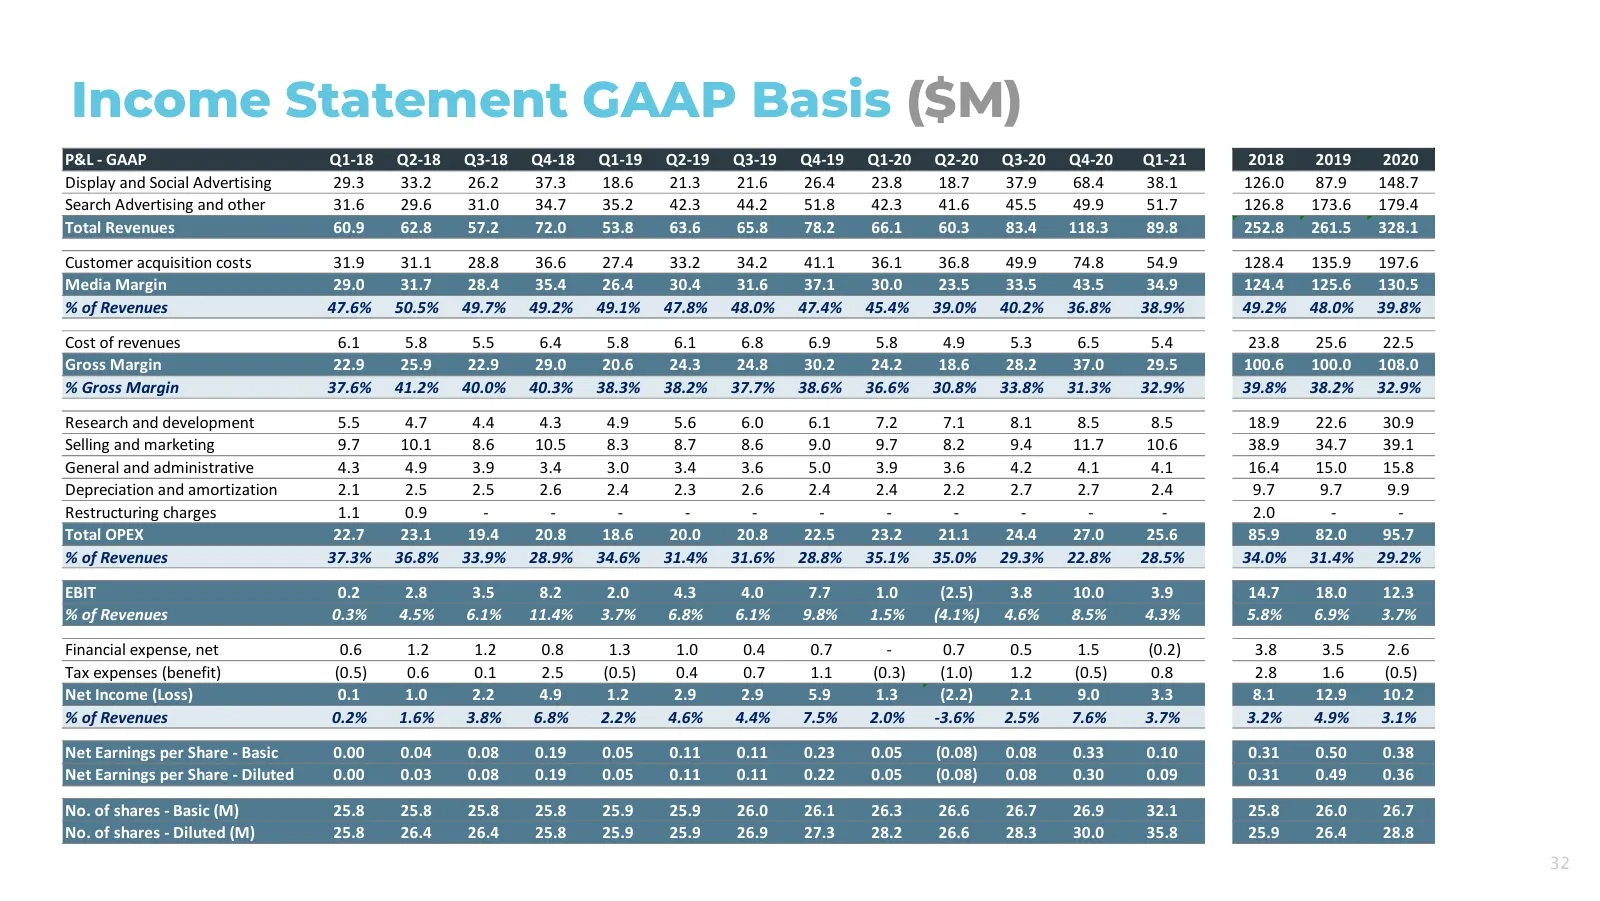
Slide 32: Income Statement GAAP Basis ($M)
Income Statement GAAP Basis ($M) P&L - GAAP Q1-18 Q2-18 Q3-18 Q4-18 Q1-19 Q2-19 Q3-19 Q4-19 Q1-20 Q2-20 Q3-20 Q4-20 Q1-21 2018 2019 2020 Display and Social Advertising 29.3 33.2 26.2 37.3 18.6 21.3 21.6 26.4 23.8 18.7 37.9 68.4 38.1 126.0 87.9 148.7 Search Advertising and other 31.6 29.6 31.0 34.7 3
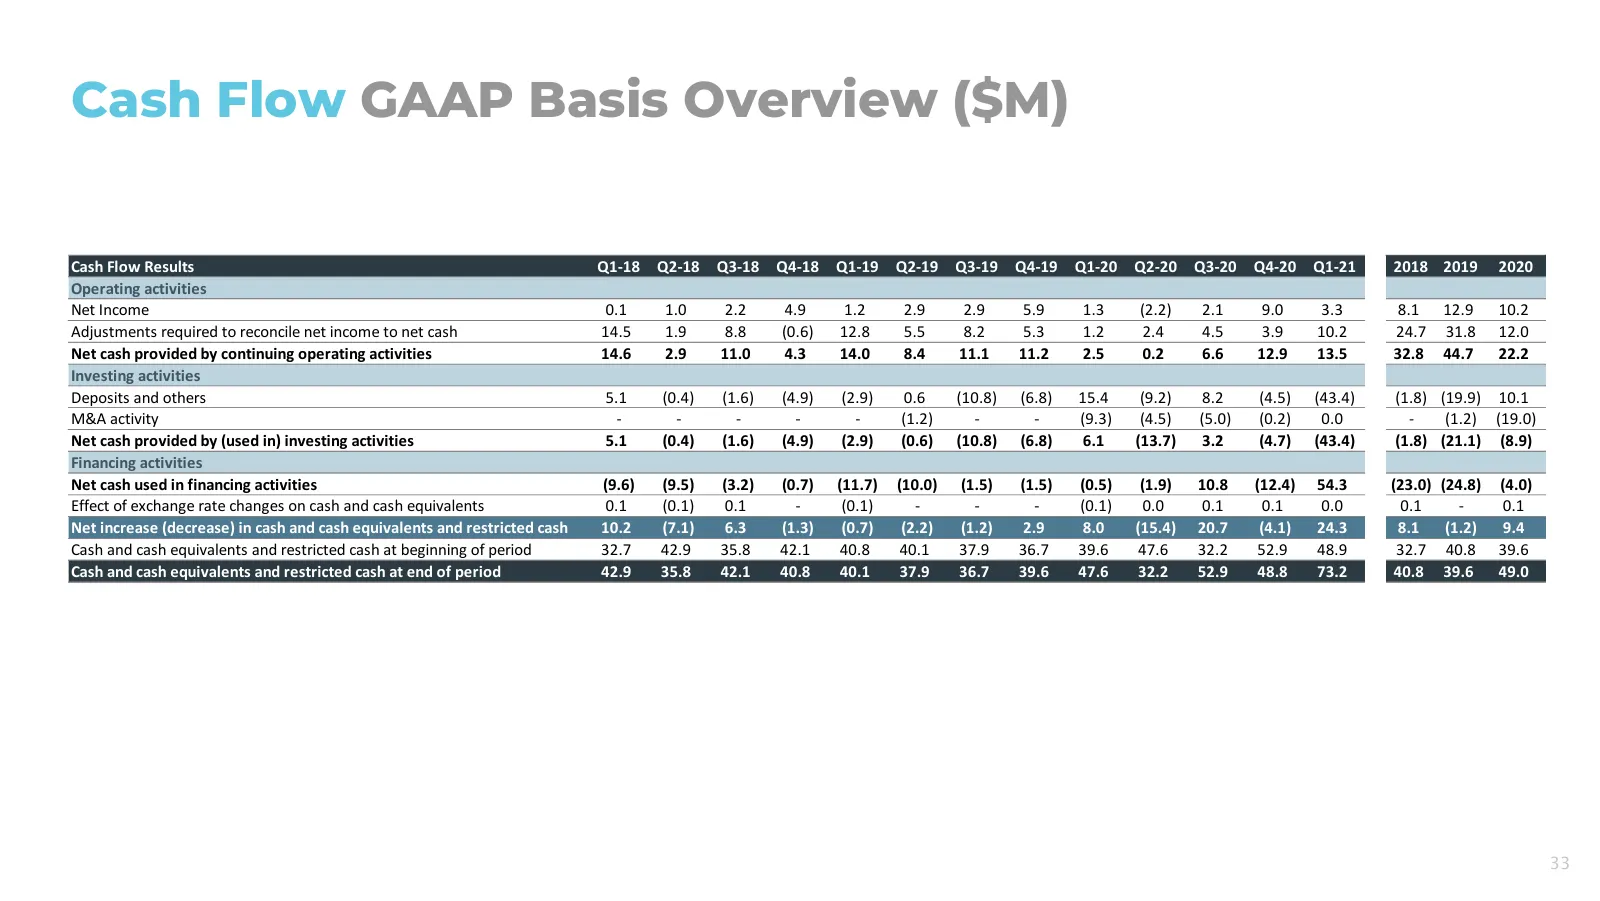
Slide 33: Cash Flow GAAP Basis Overview ($M)
Cash Flow GAAP Basis Overview ($M) Cash Flow Results Q1-18 Q2-18 Q3-18 Q4-18 Q1-19 Q2-19 Q3-19 Q4-19 Q1-20 Q2-20 Q3-20 Q4-20 Q1-21 2018 2019 2020 Operating activities Net Income 0.1 1.0 2.2 4.9 1.2 2.9 2.9 5.9 1.3 (2.2) 2.1 9.0 3.3 8.1 12.9 10.2 Adjustments required to reconcile net income to net ca
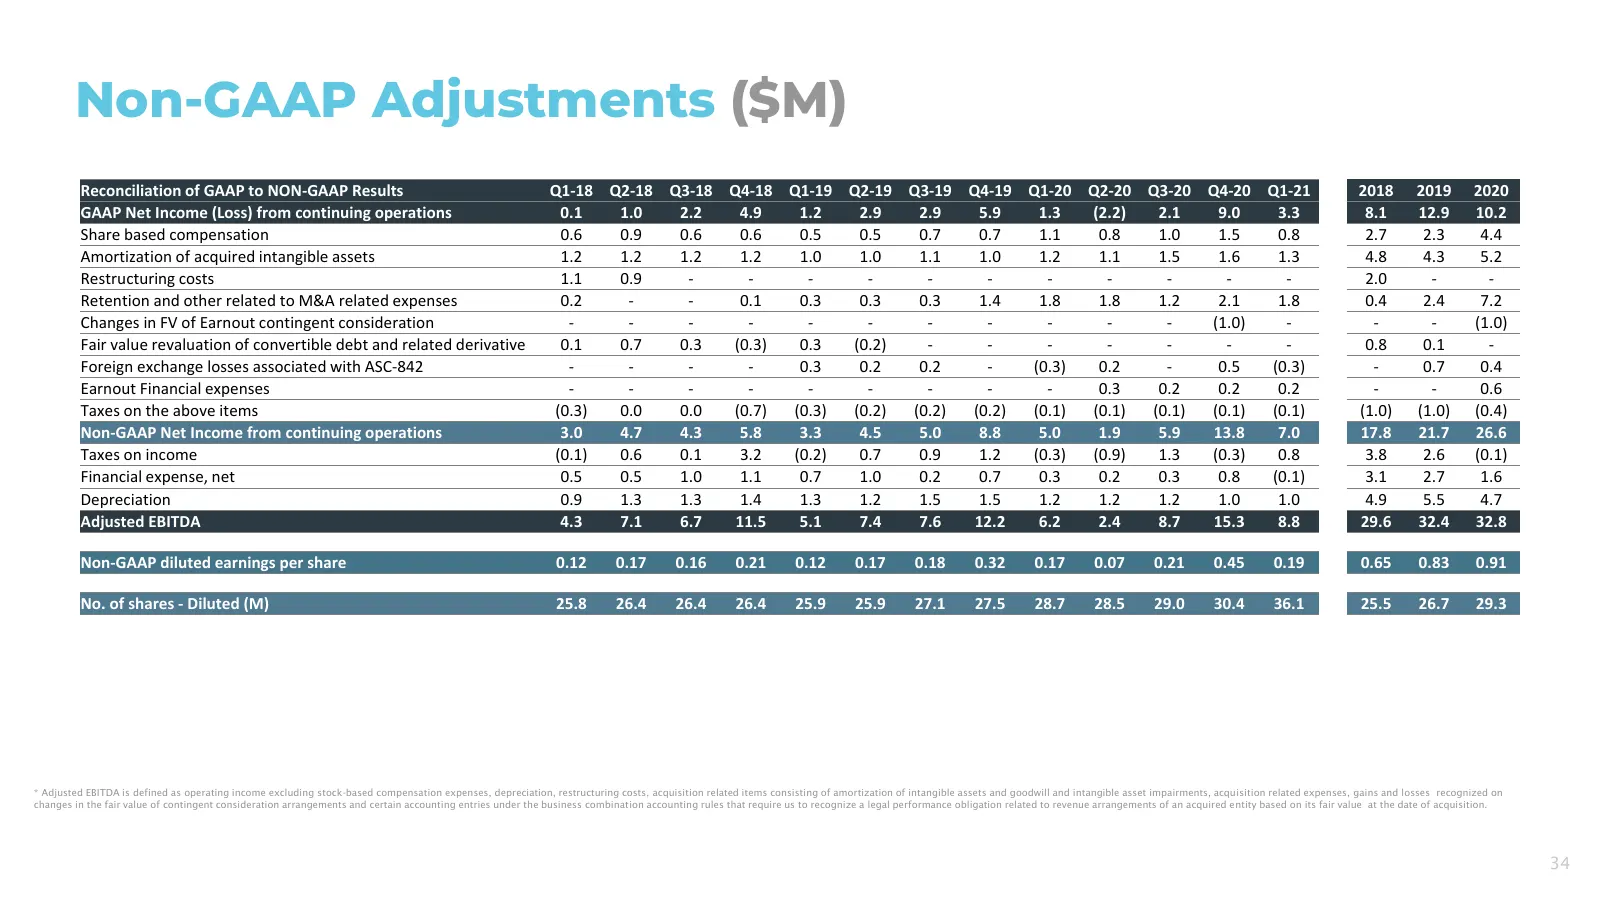
Slide 34: Non-GAAP Adjustments ($M)
Non-GAAP Adjustments ($M) Reconciliation of GAAP to NON-GAAP Results Q1-18 Q2-18 Q3-18 Q4-18 Q1-19 Q2-19 Q3-19 Q4-19 Q1-20 Q2-20 Q3-20 Q4-20 Q1-21 2018 2019 2020 GAAP Net Income (Loss) from continuing operations 0.1 1.0 2.2 4.9 1.2 2.9 2.9 5.9 1.3 (2.2) 2.1 9.0 3.3 8.1 12.9 10.2 Share based compensa
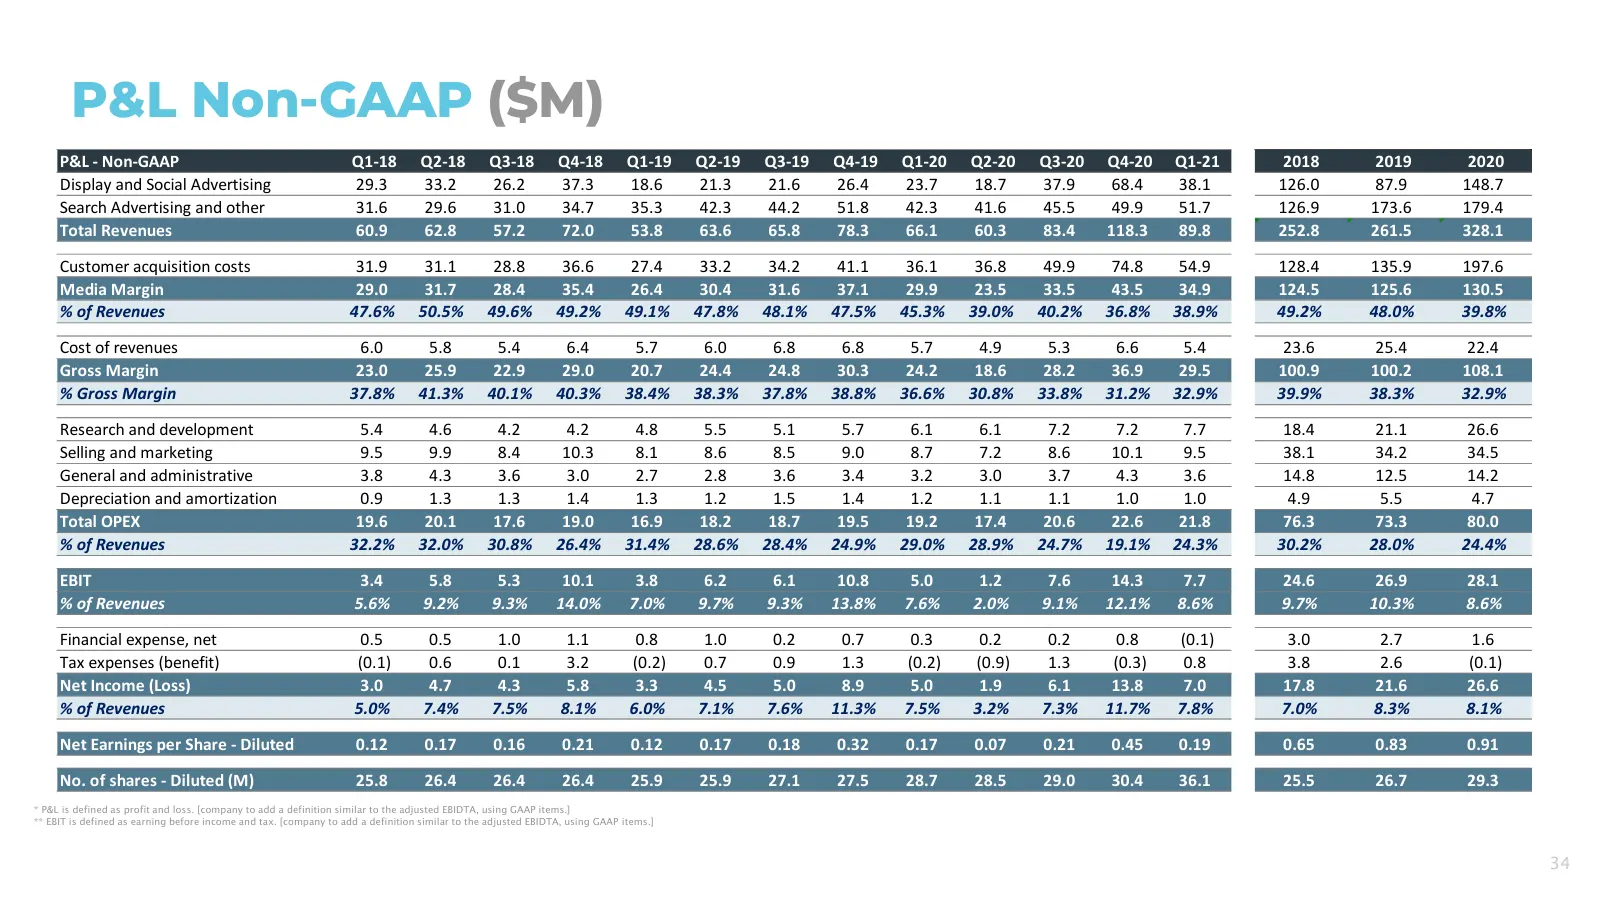
Slide 35: P&L Non-GAAP ($M)
P&L Non-GAAP ($M) P&L - Non-GAAP Q1-18 Q2-18 Q3-18 Q4-18 Q1-19 Q2-19 Q3-19 Q4-19 Q1-20 Q2-20 Q3-20 Q4-20 Q1-21 2018 2019 2020 Display and Social Advertising 29.3 33.2 26.2 37.3 18.6 21.3 21.6 26.4 23.7 18.7 37.9 68.4 38.1 126.0 87.9 148.7 Search Advertising and other 31.6 29.6 31.0 34.7 35.3 42.3 44
Source: Internet Archive copy of wp-cdn.perion.com
More decks from Perion Network Ltd
 Q2 2026 Earnings Presentation43 slides · Aug 10, 2026
 Investor Presentation (August 2026)83 slides · August 2026
 Investor Presentation (June 2026)80 slides · Jun 29, 2026
 Q1 2026 Earnings Presentation39 slides · May 20, 2026
 Q4 2025 Earnings Presentation54 slides · Feb 18, 2026
 Q3 2025 Earnings Presentation40 slides · Nov 12, 2025