Bridge Capital — Investor Presentation (August 2006)
19 slides from Bridge Capital's investor presentation, Aug 21, 2006
Slide 1: Investor Presentation
Investor Presentation August 2006 Daniel P. Myers Thomas A. Sa President and CEO Executive Vice President Bridge Capital Holdings Chief Financial Officer Bridge Capital Holdings 1
Slide 2: Forward Looking Statement
Forward Looking Statement Certain matters discussed in this press release constitute forward-looking statements within the meaning of the Private Securities Litigation Reform Act of 1995, and are subject to the safe harbors created by that Act. Forward-looking statements describe future plans, strat
Slide 3: Financial and Trading Information
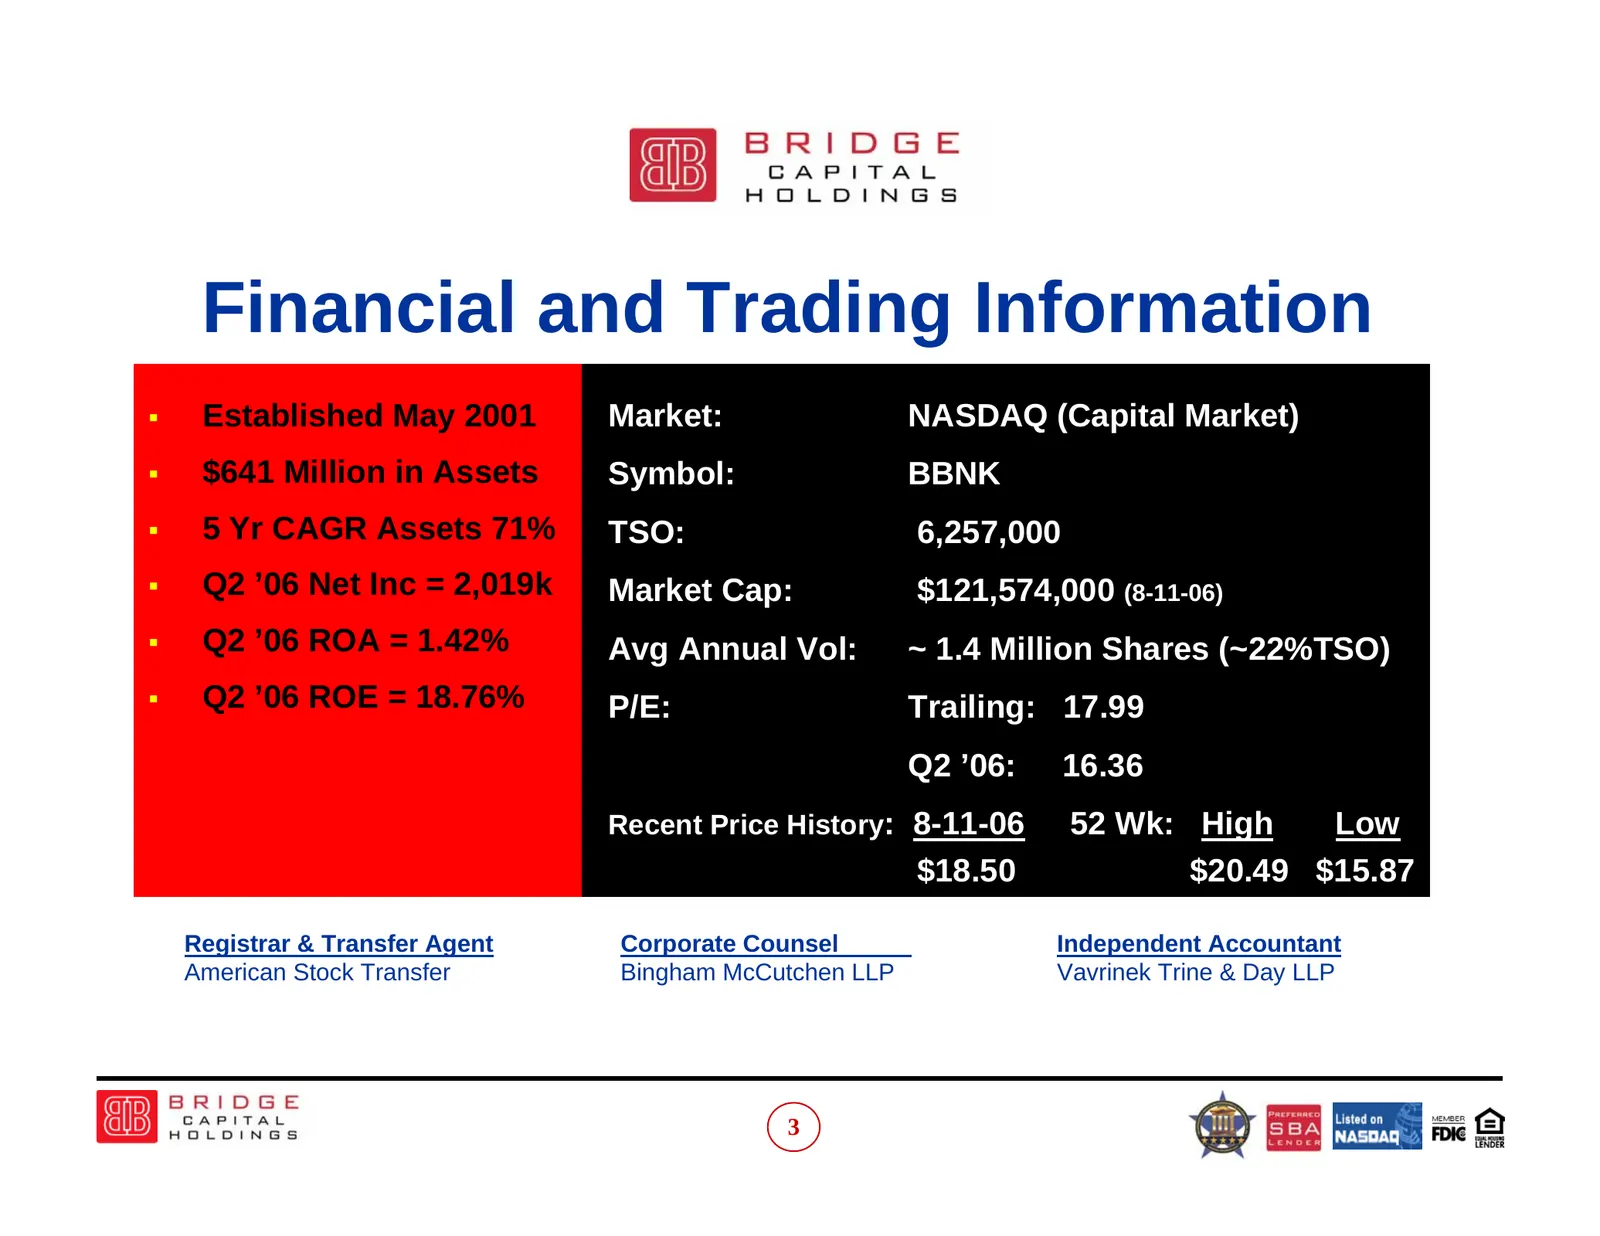
Financial and Trading Information Established May 2001 Market: NASDAQ (Capital Market) $641 Million in Assets Symbol: BBNK 5 Yr CAGR Assets 71% TSO: 6,257,000 Q2 ’06 Net Inc = 2,019k Market Cap: $121,574,000 (8-11-06) Q2 ’06 ROA = 1.42% Avg Annual Vol: ~ 1.4 Million Shares (~22%TSO) Q2 ’
Slide 4: Strategic Positioning
Strategic Positioning A business banking franchise that is the Professional Business Bank of Choice for small, middle-market, and emerging technology companies in Silicon Valley, California, and the Nation. 4
Slide 5: Our Approach
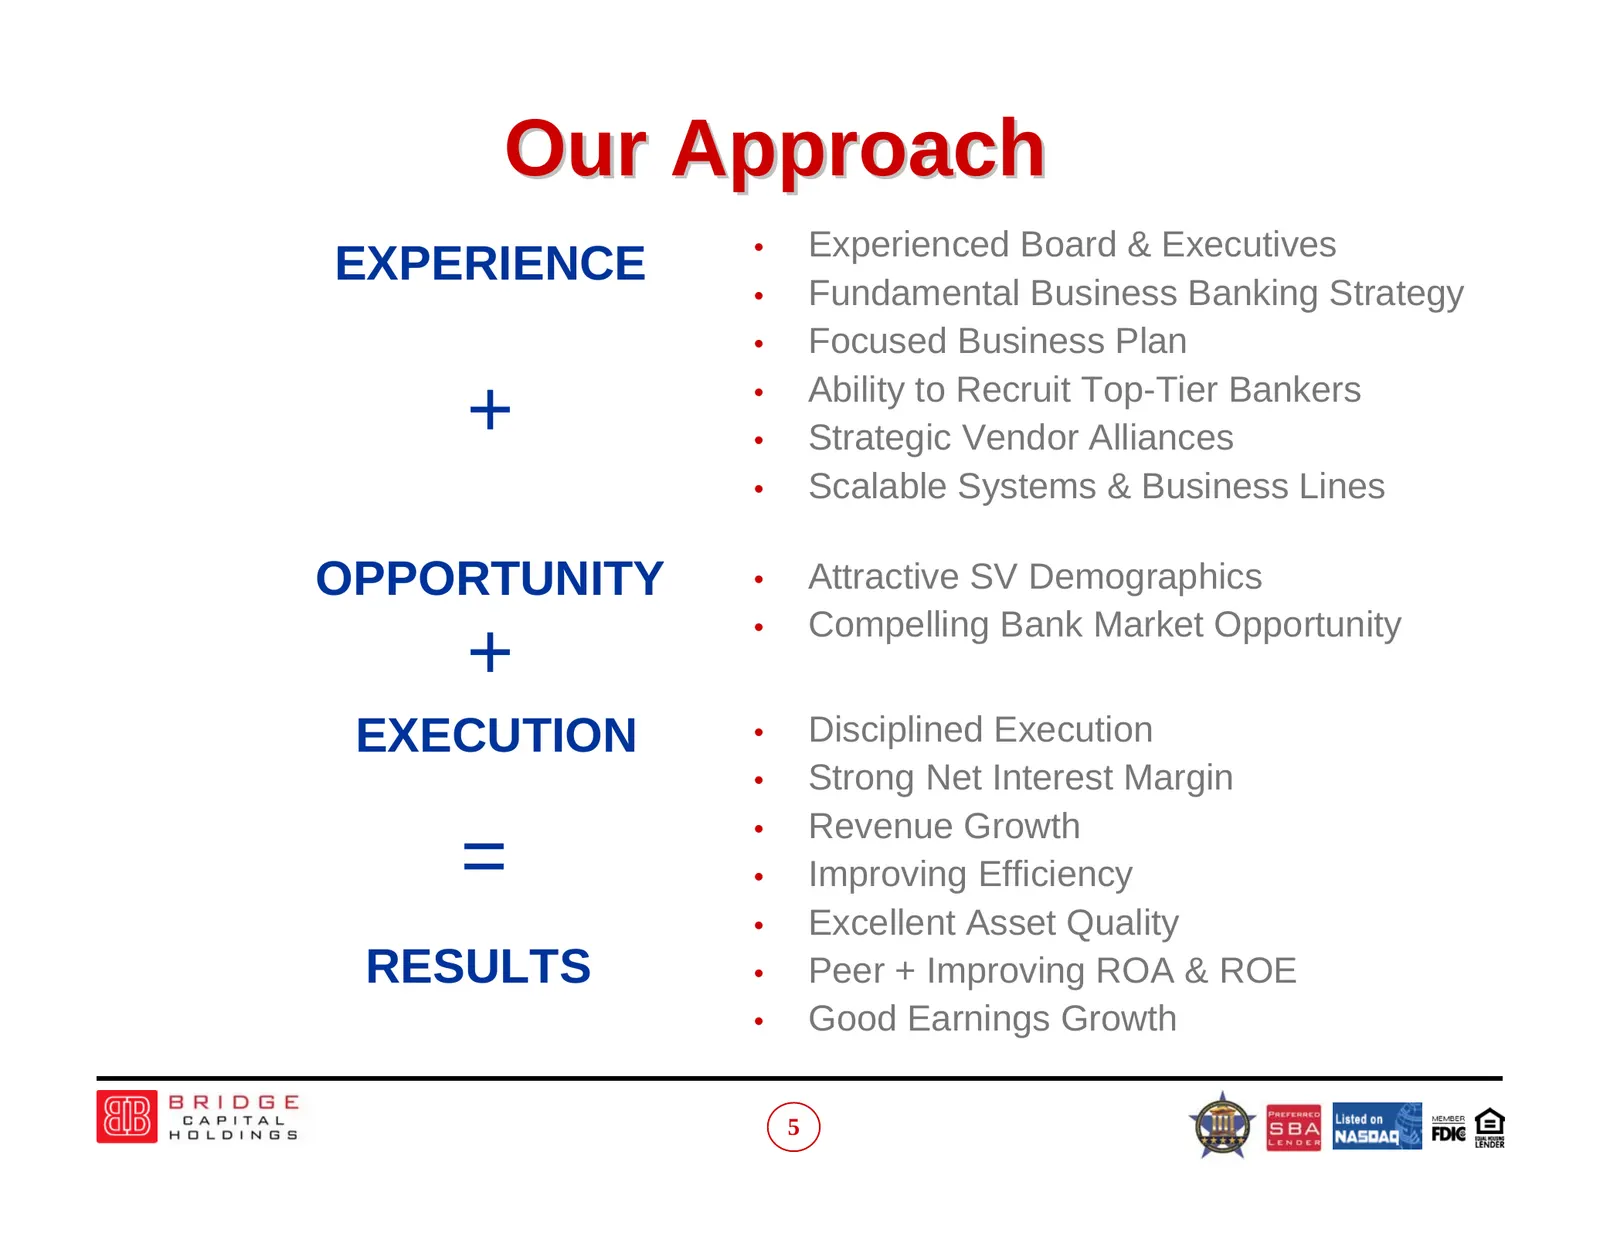
Our Approach • Experienced Board & Executives EXPERIENCE • Fundamental Business Banking Strategy • Focused Business Plan Ability to Recruit Top-Tier Bankers + • • Strategic Vendor Alliances • Scalable Systems & Business Lines OPPORTUNITY • Attractive SV Demographics • Compelling Bank Market Opportun
Slide 6: Milestones
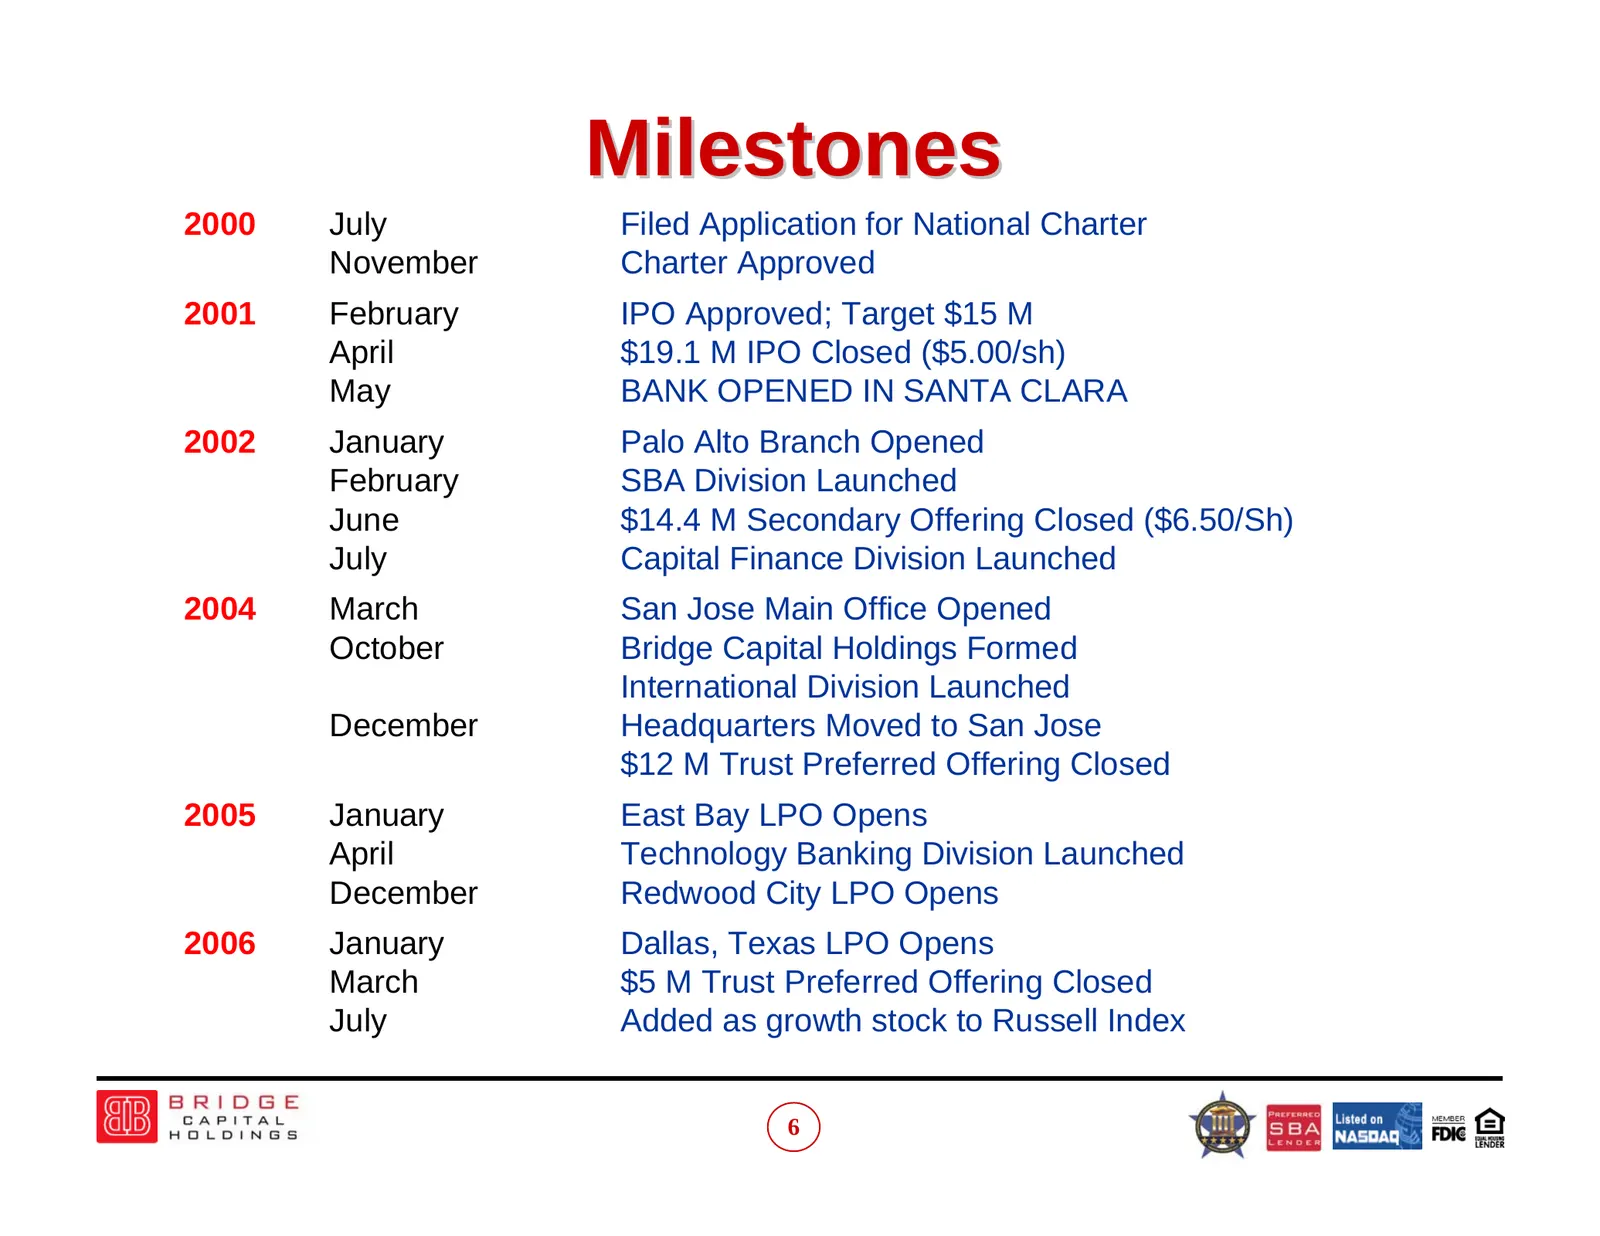
Milestones 2000 July Filed Application for National Charter November Charter Approved 2001 February IPO Approved; Target $15 M April $19.1 M IPO Closed ($5.00/sh) May BANK OPENED IN SANTA CLARA 2002 January Palo Alto Branch Opened February SBA Division Launched June $14.4 M Secondary Offering Closed
Slide 7: Experienced Board and Executive Team
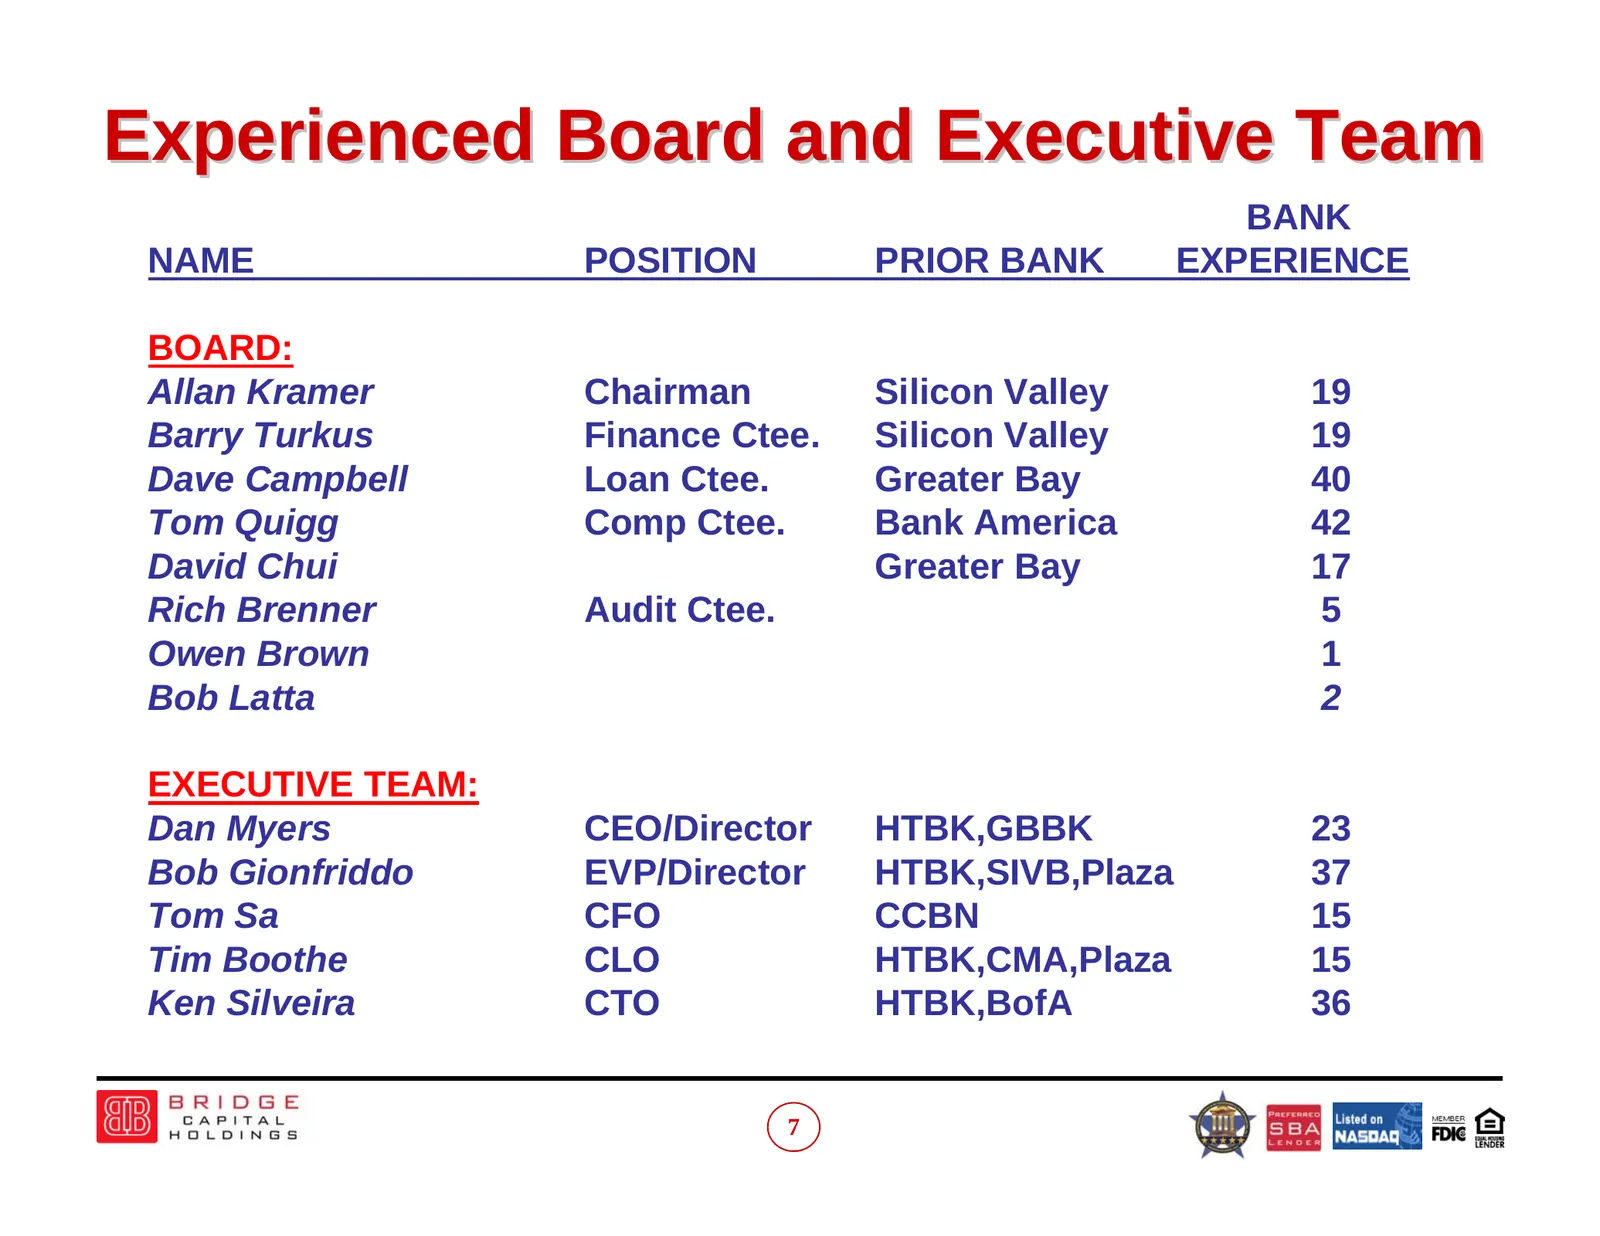
Experienced Board and Executive Team BANK NAME POSITION PRIOR BANK EXPERIENCE BOARD: Allan Kramer Chairman Silicon Valley 19 Barry Turkus Finance Ctee. Silicon Valley 19 Dave Campbell Loan Ctee. Greater Bay 40 Tom Quigg Comp Ctee. Bank America 42 David Chui Greater Bay 17 Rich Brenner Audit Ctee. 5
Slide 8: Operating Divisions and Leadership
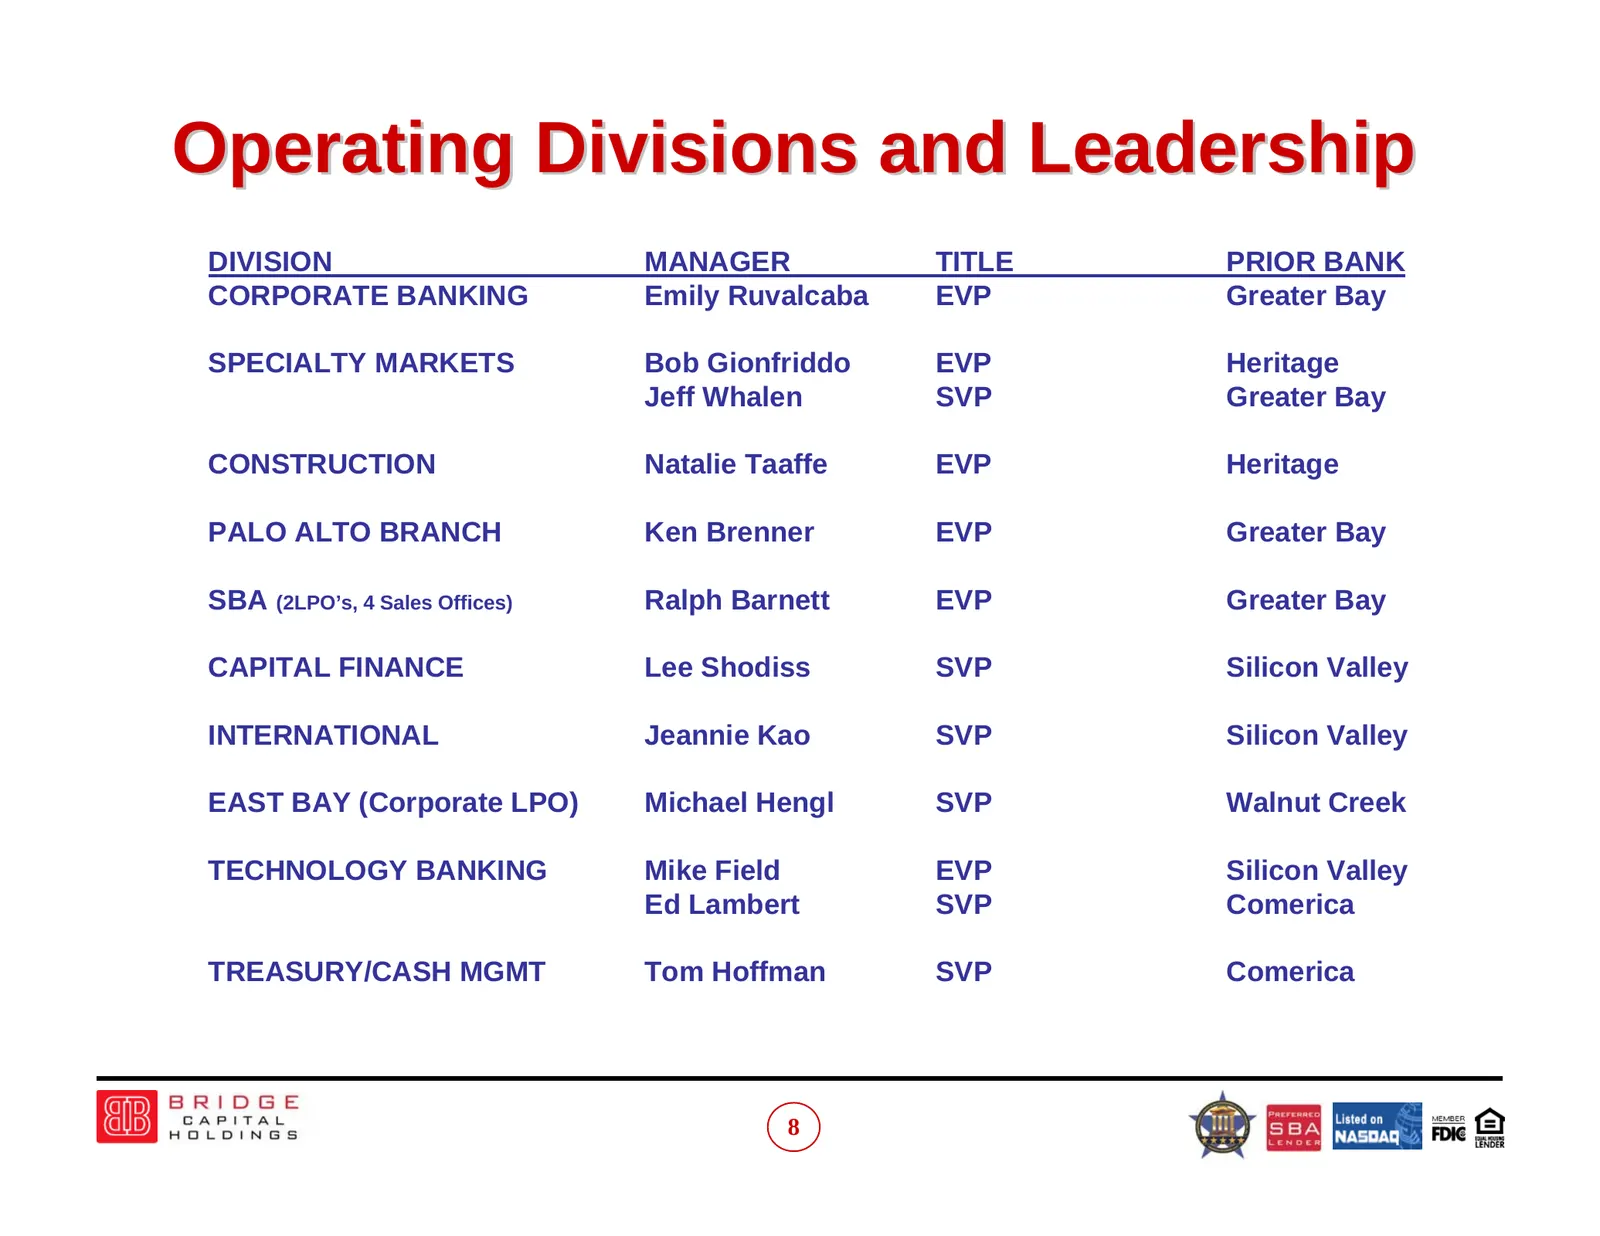
Operating Divisions and Leadership DIVISION MANAGER TITLE PRIOR BANK CORPORATE BANKING Emily Ruvalcaba EVP Greater Bay SPECIALTY MARKETS Bob Gionfriddo EVP Heritage Jeff Whalen SVP Greater Bay CONSTRUCTION Natalie Taaffe EVP Heritage PALO ALTO BRANCH Ken Brenner EVP Greater Bay SBA (2LPO’s, 4 Sales
Slide 9: Our Market: Santa Clara County/ Silicon Valley
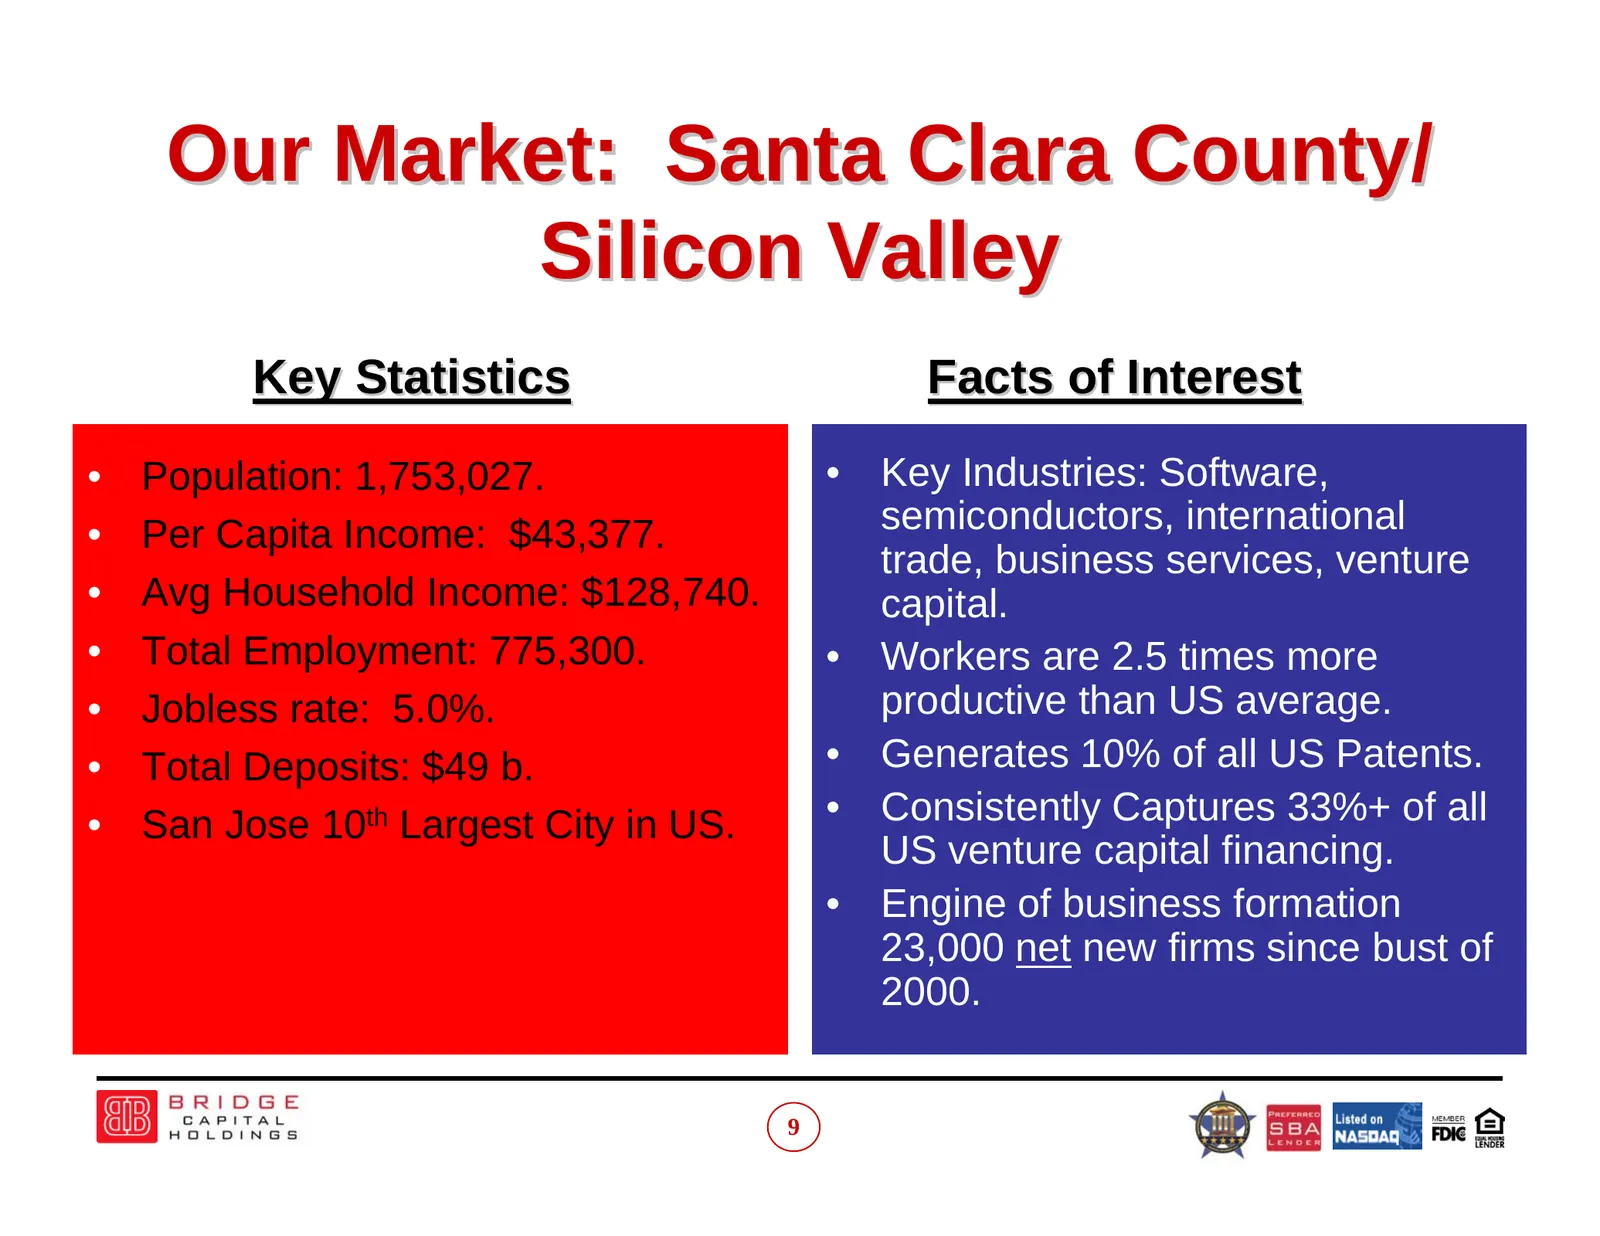
Our Market: Santa Clara County/ Silicon Valley Key Statistics Facts of Interest • Population: 1,753,027. • Key Industries: Software, • Per Capita Income: $43,377. semiconductors, international trade, business services, venture • Avg Household Income: $128,740. capital. • Total Employment: 775,300. •
Slide 10: A Growing Local Market For Fewer Local Banks
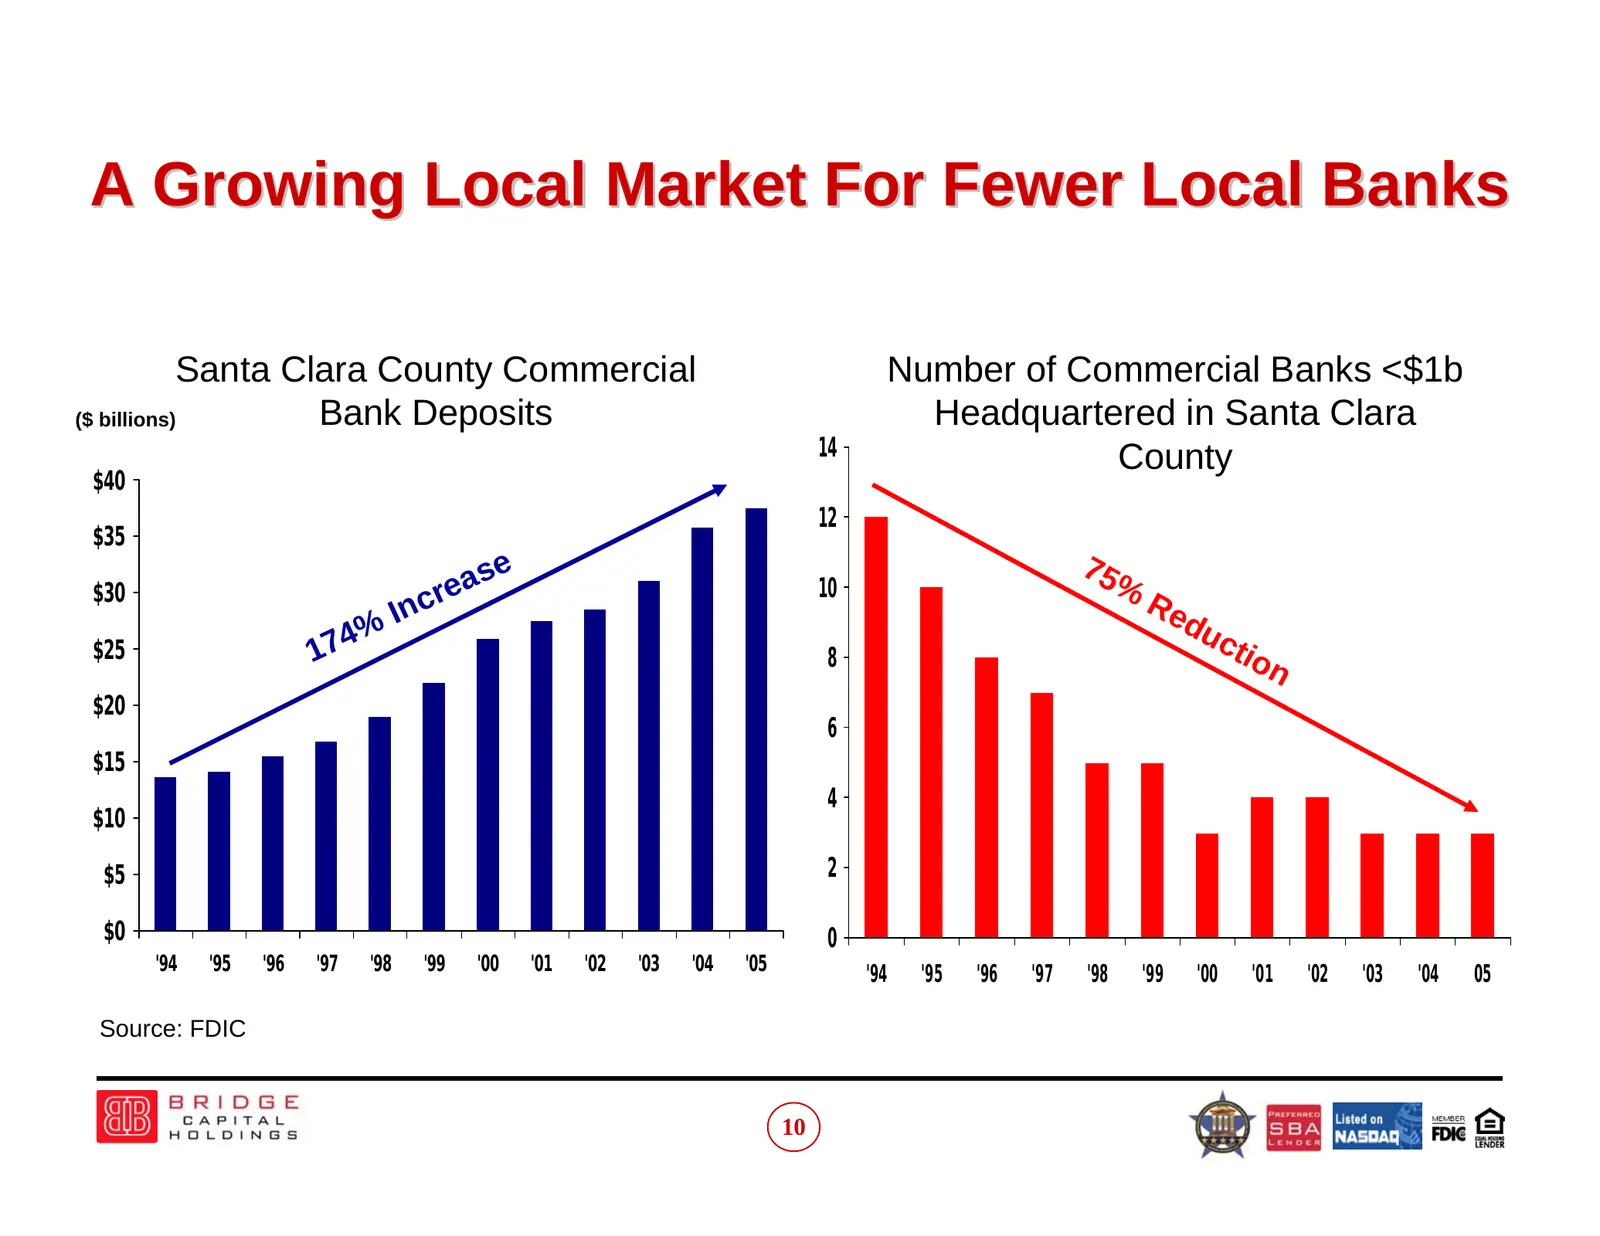
A Growing Local Market For Fewer Local Banks Santa Clara County Commercial Number of Commercial Banks <$1b ($ billions) Bank Deposits Headquartered in Santa Clara 14 County $40 12 $35 ase 75 $30 re 10 % Inc Re % du $25 174 8 ct i on $20 6 $15 4 $10 $5 2 $0 0 '94 '95 '96 '97 '98 '99 '00 '01 '02 '03 '
Slide 11: Significant Market Opportunity For Properly Positioned Bank
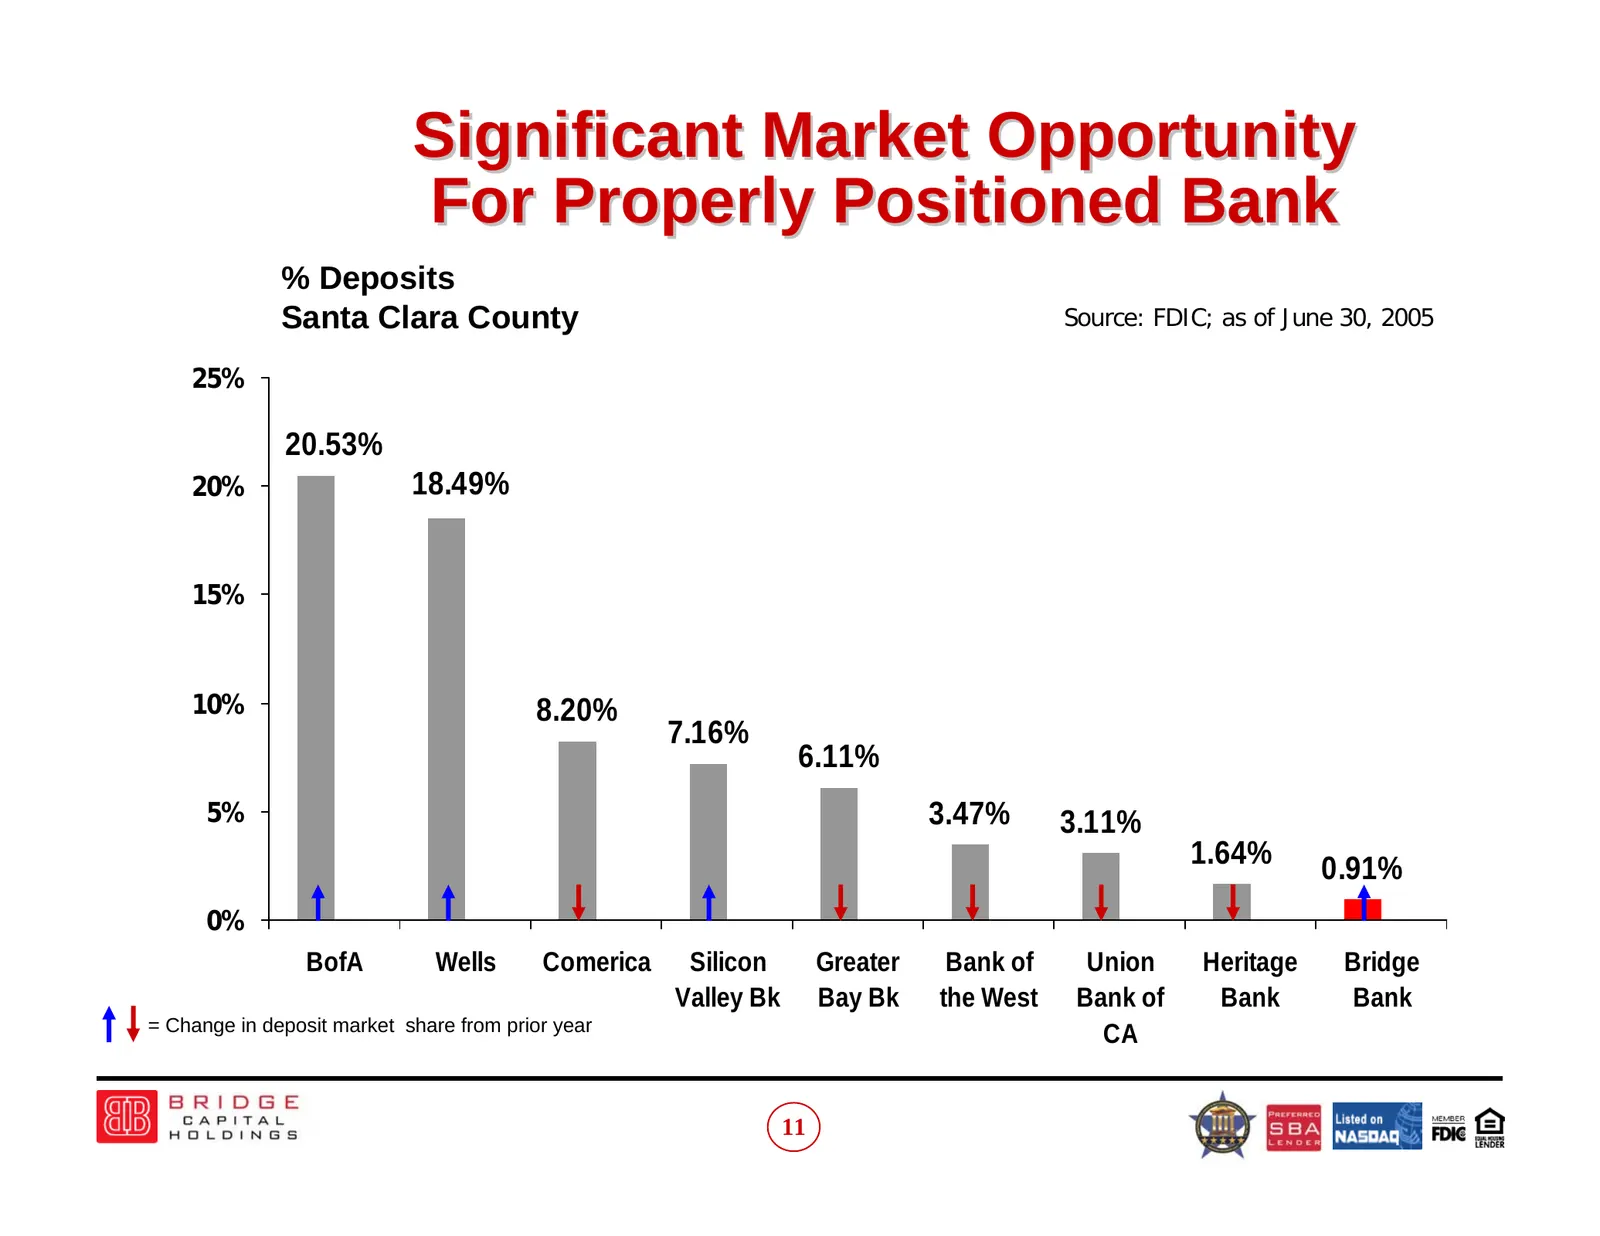
Significant Market Opportunity For Properly Positioned Bank % Deposits Santa Clara County Source: FDIC; as of June 30, 2005 25% 20.53% 20% 18.49% 15% 10% 8.20% 7.16% 6.11% 5% 3.47% 3.11% 1.64% 0.91% 0% BofA Wells Comerica Silicon Greater Bank of Union Heritage Bridge Valley Bk Bay Bk the West Bank o
Slide 12: Balance Sheet Growth
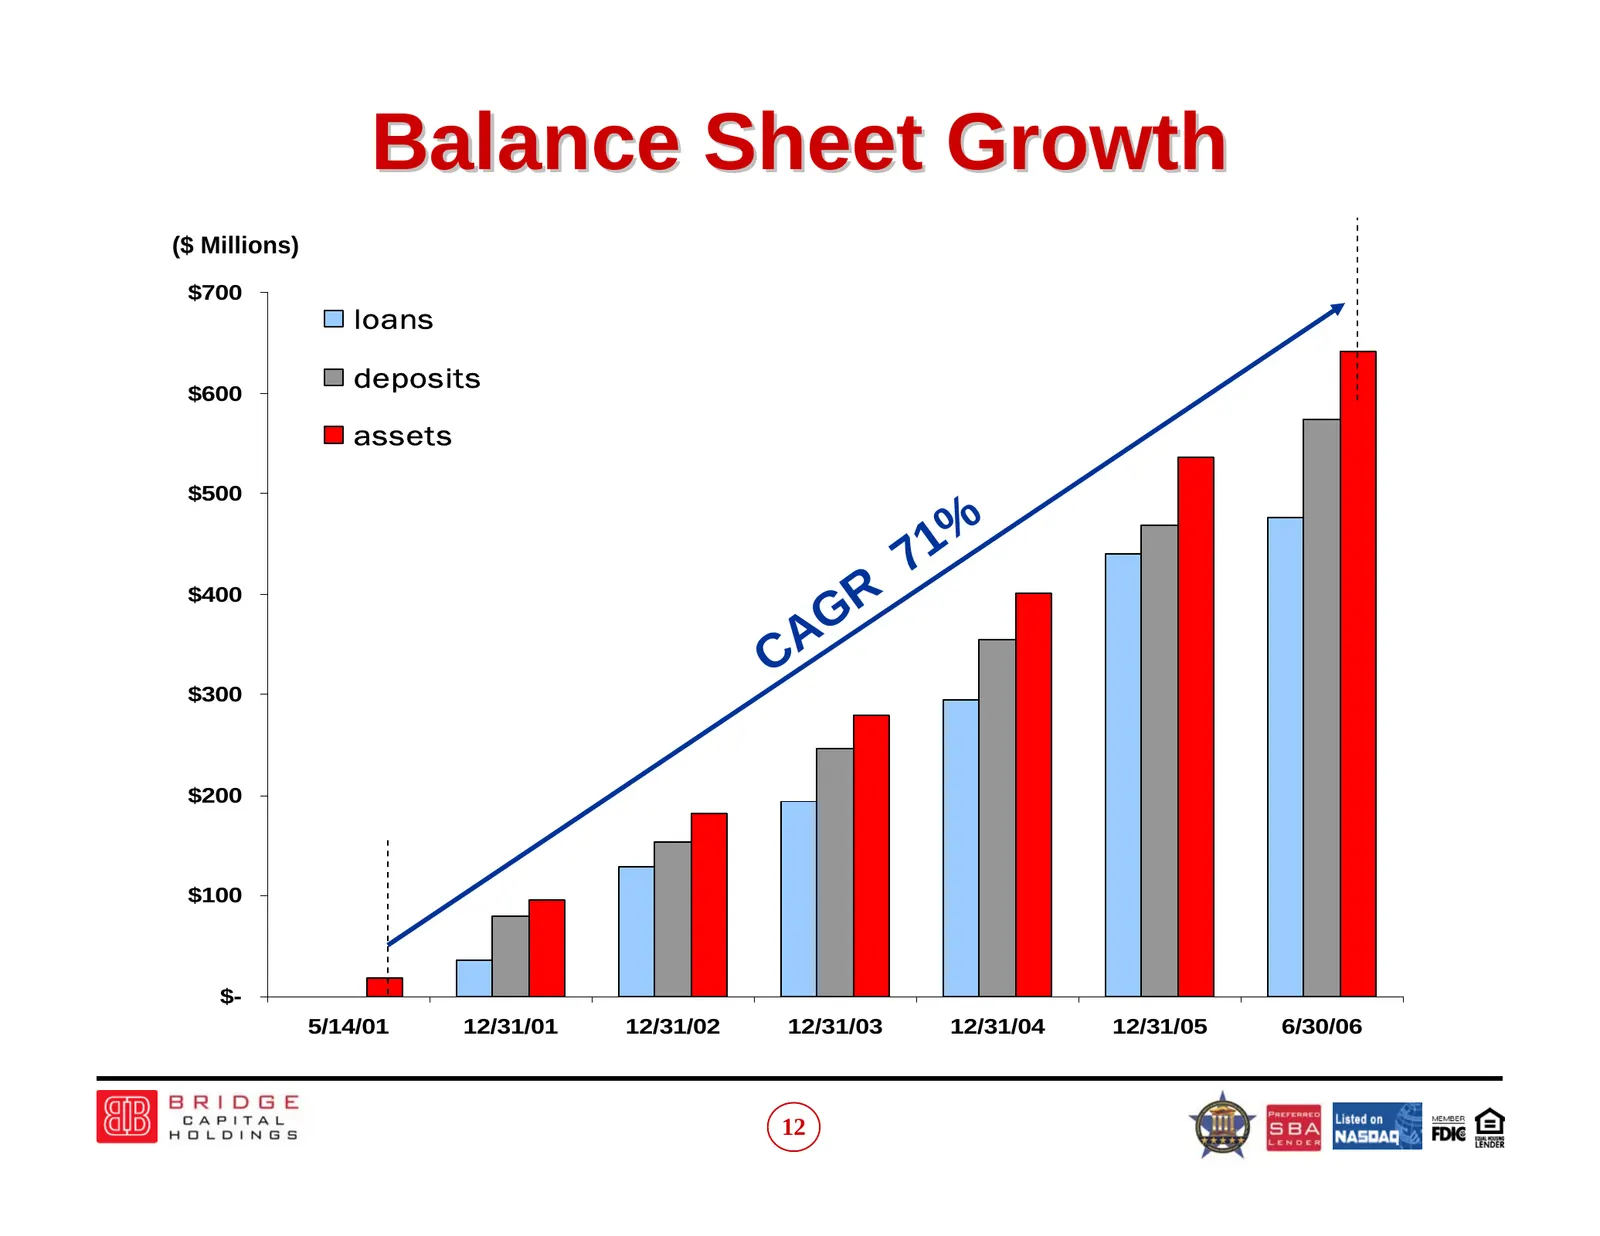
Balance Sheet Growth ($ Millions) $700 loans $600 deposits assets $500 1 % 7 $400 G R C A $300 $200 $100 $- 5/14/01 12/31/01 12/31/02 12/31/03 12/31/04 12/31/05 6/30/06 12
Slide 13: Diversification of Lending Activity Focus on Core Funding Sources
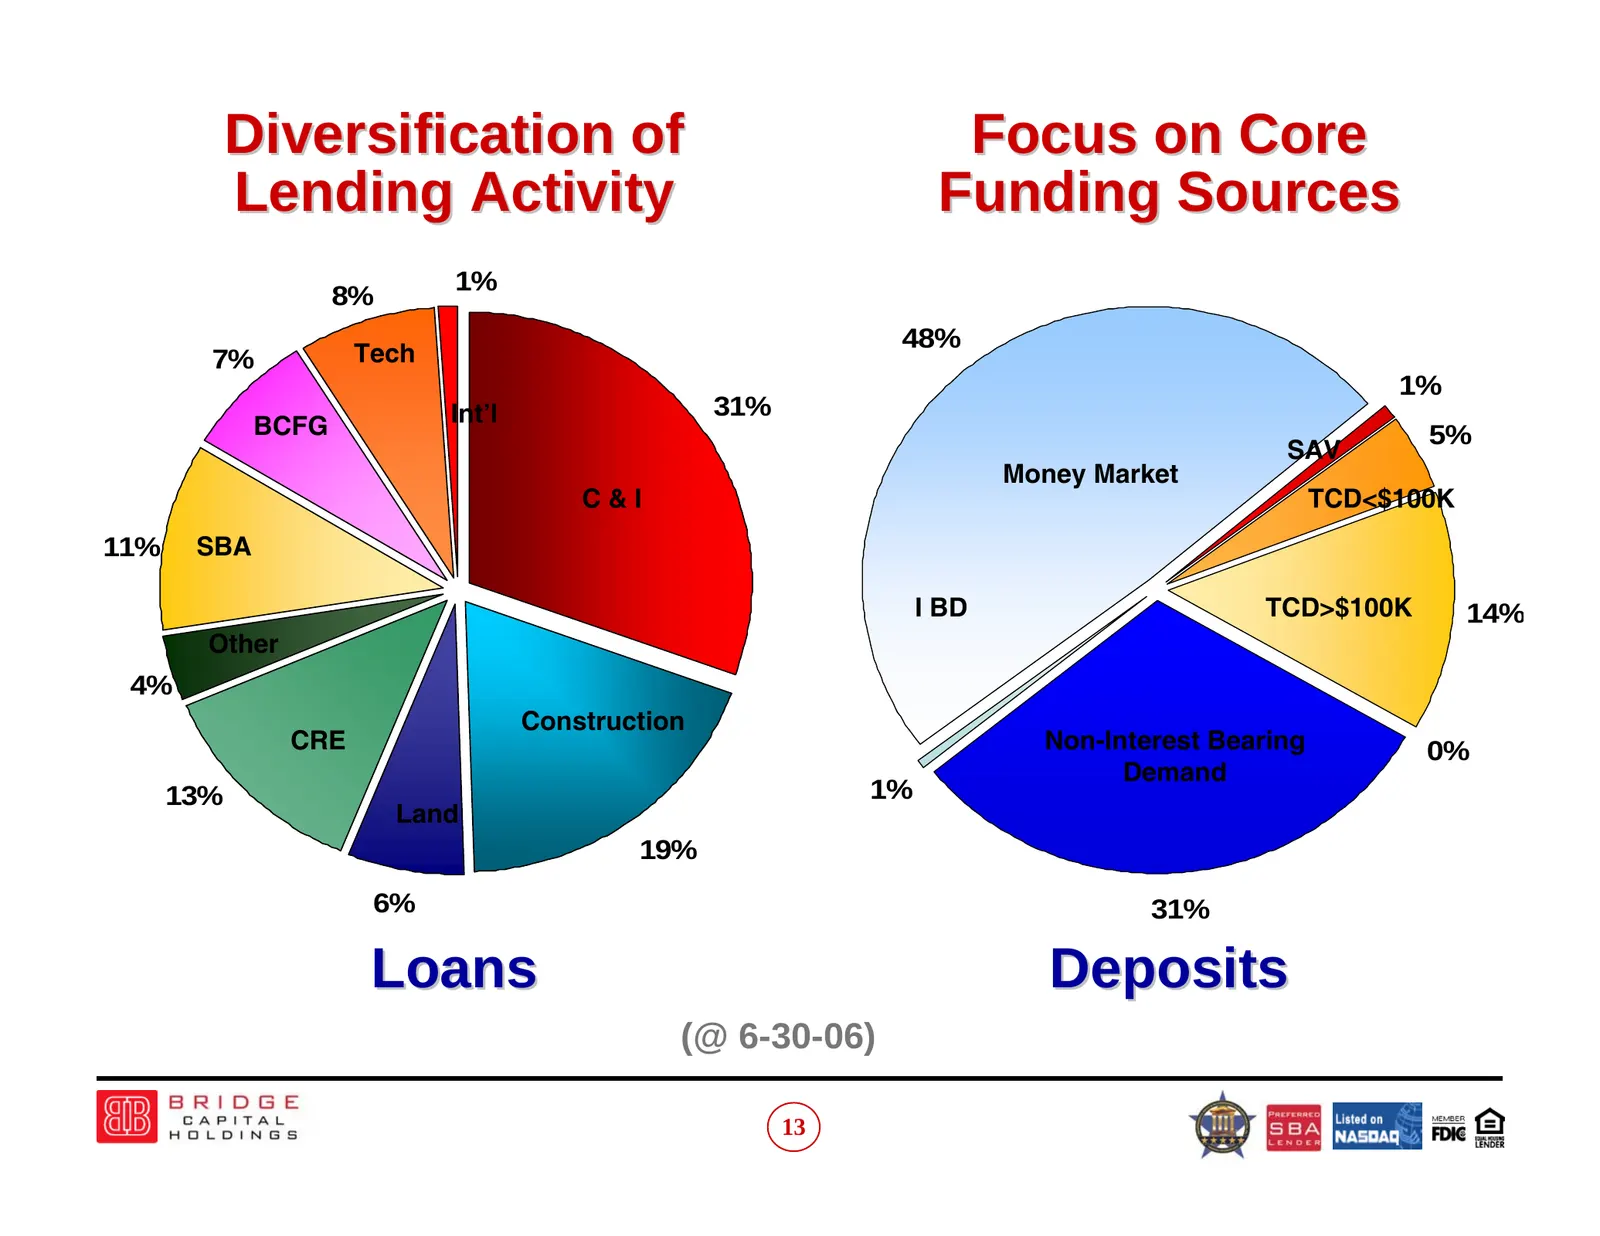
Diversification of Focus on Core Lending Activity Funding Sources 1% 8% 48% 7% Tech 1% Int’l 31% BCFG 5% SAV Money Market Money Market C&I TCD<$100K Savings 11% SBA Time Deposits Interest Bearing <$100K Demand Time Deposits I BD TCD>$100K >$100K 14% Other 4% Non-Interest Bearing Construction Demand
Slide 14: Revenue Growth
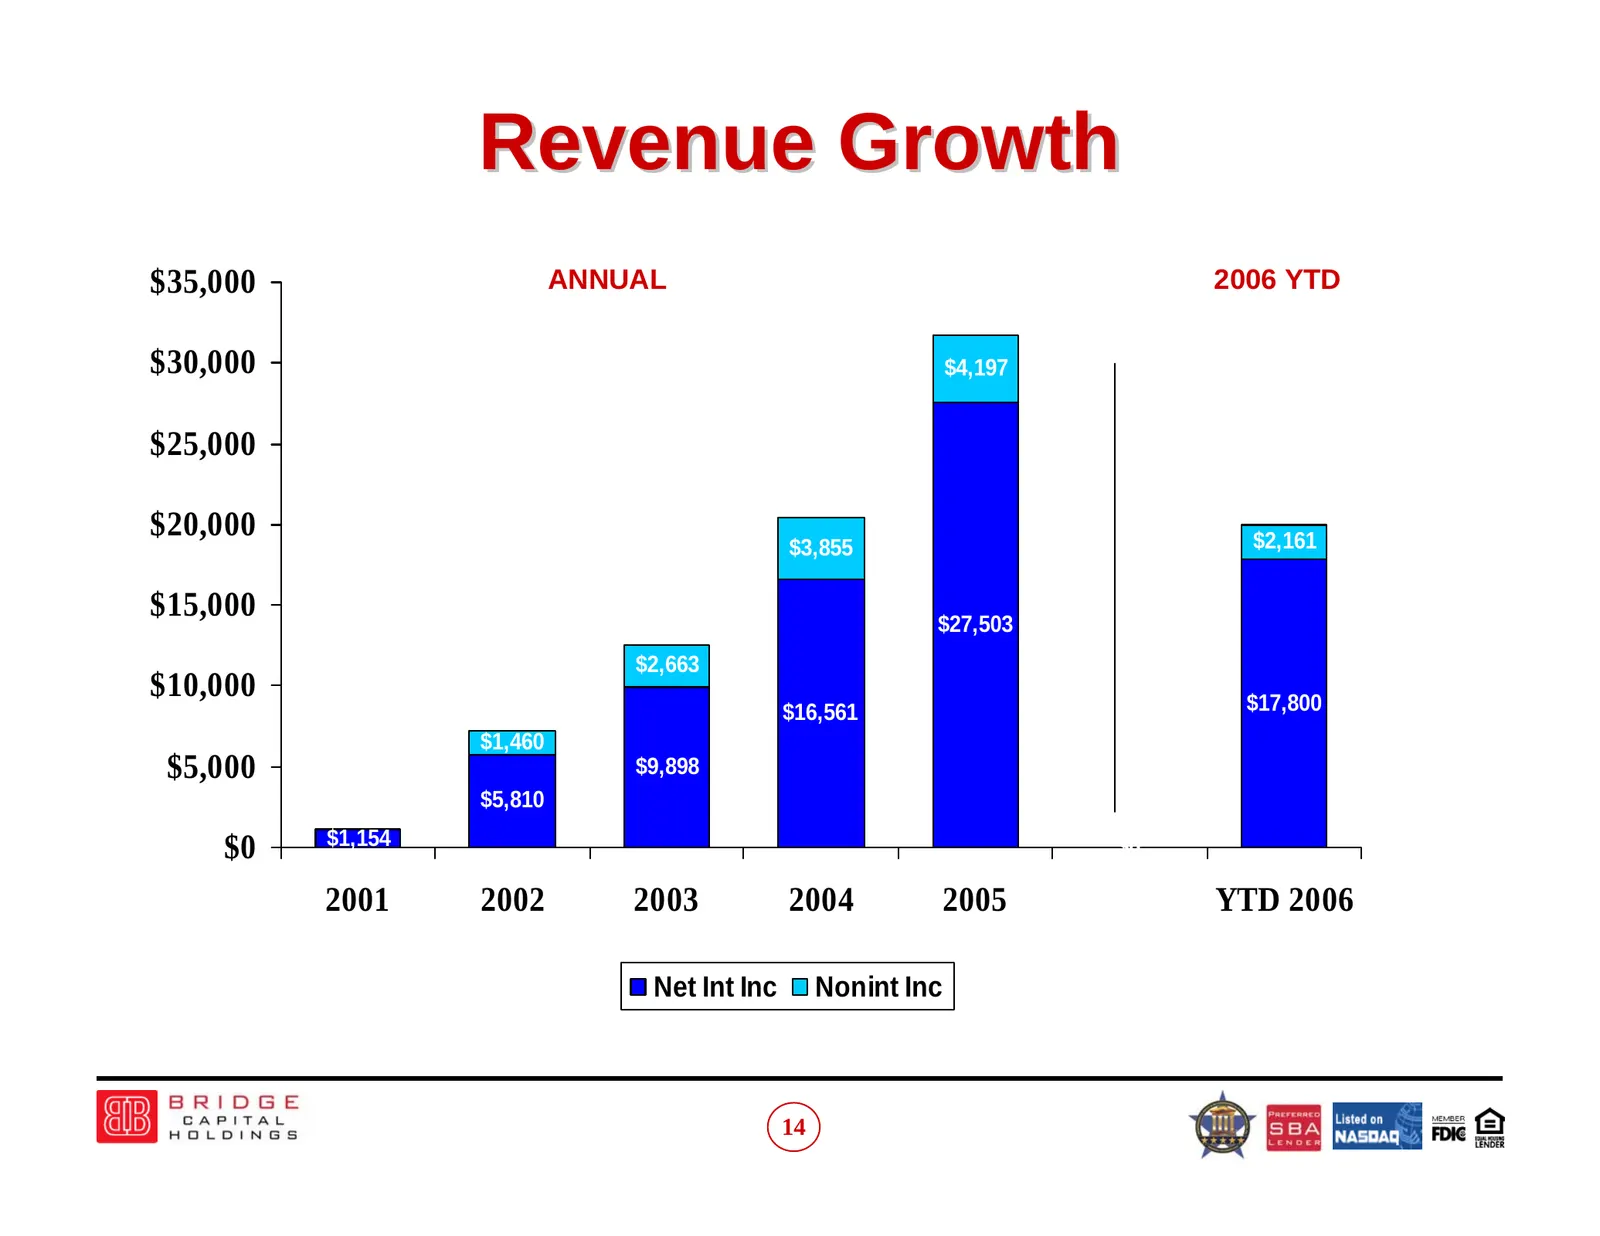
Revenue Growth $35,000 ANNUAL 2006 YTD $30,000 $4,197 $25,000 $20,000 $2,161 $3,855 $15,000 $27,503 $2,663 $10,000 $17,800 $16,561 $1,460 $5,000 $9,898 $5,810 $1,154 $0 $0 2001 2002 2003 2004 2005 YTD 2006 Net Int Inc Nonint Inc 14
Slide 15: Diversified Revenue Sources
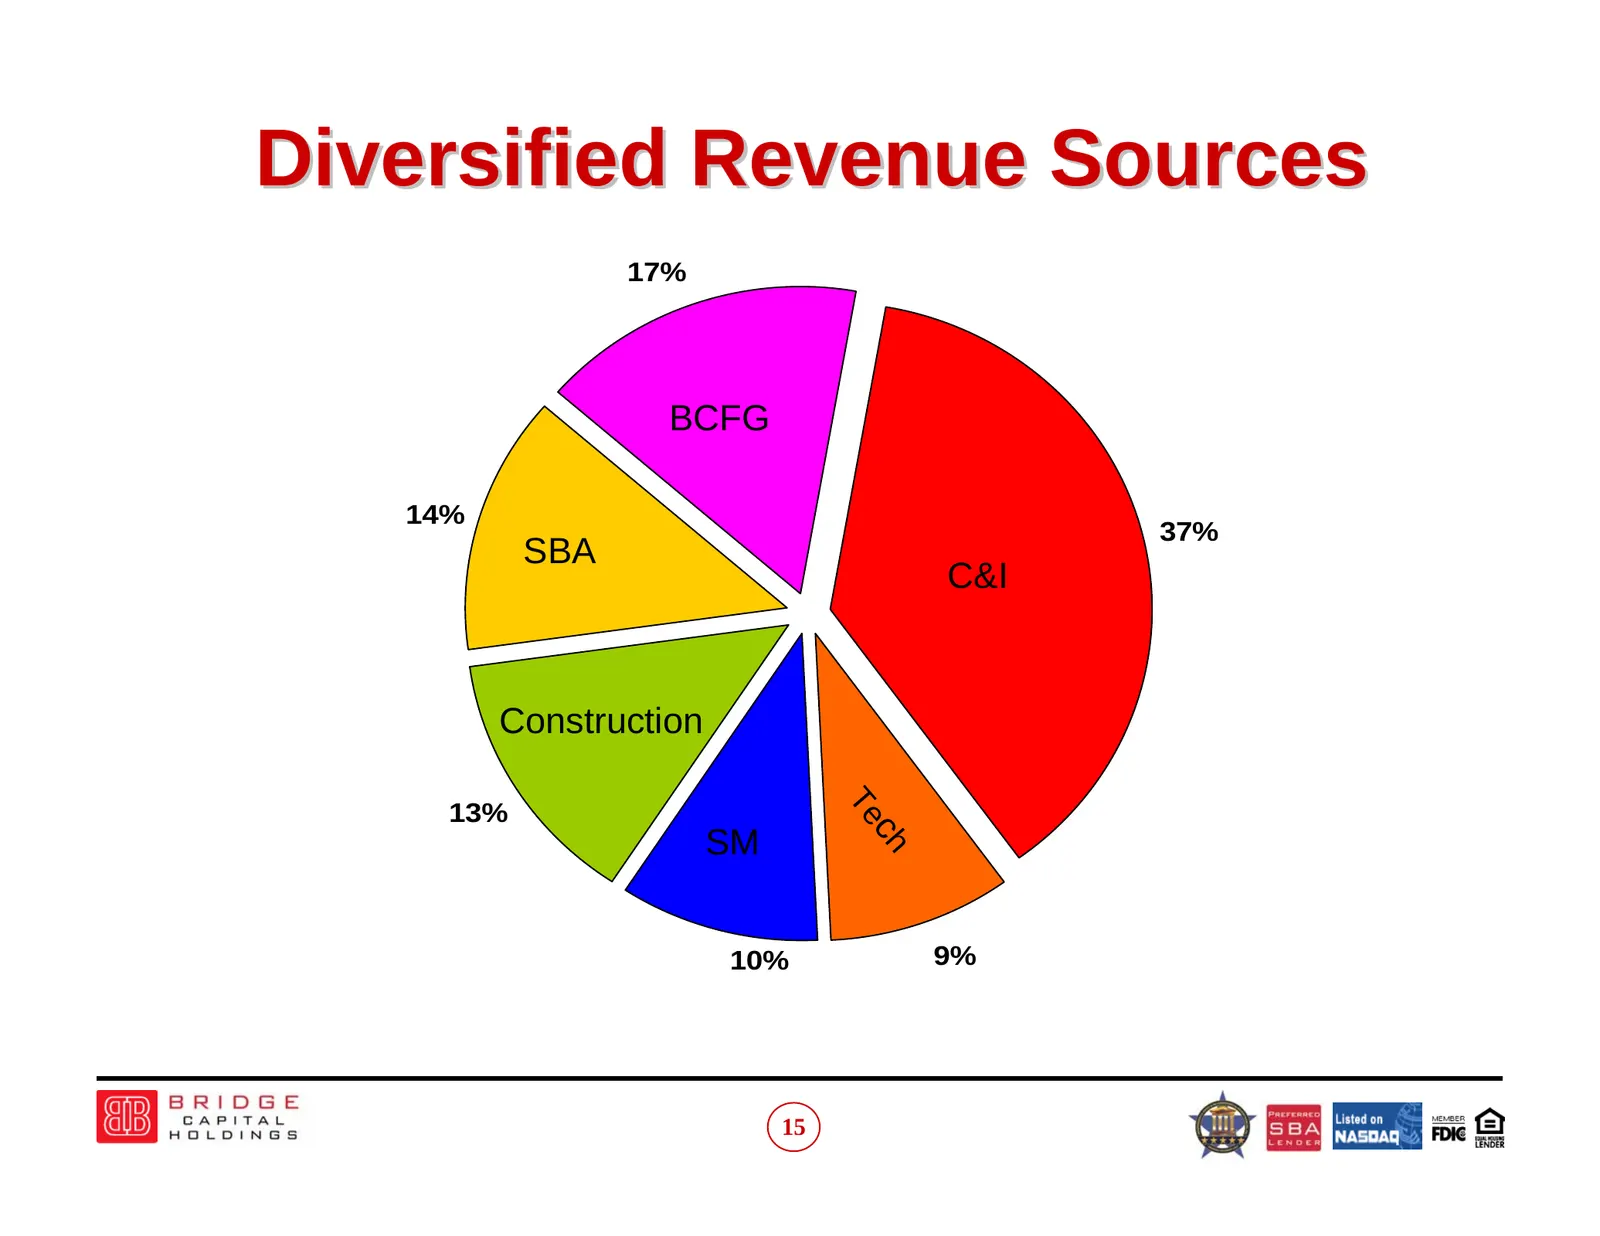
Diversified Revenue Sources 17% BCFG 14% 37% SBA C&I Construction Te 13% SM ch 10% 9% 15
Slide 16: Efficiency Ratio Net Interest Margin Asset Quality
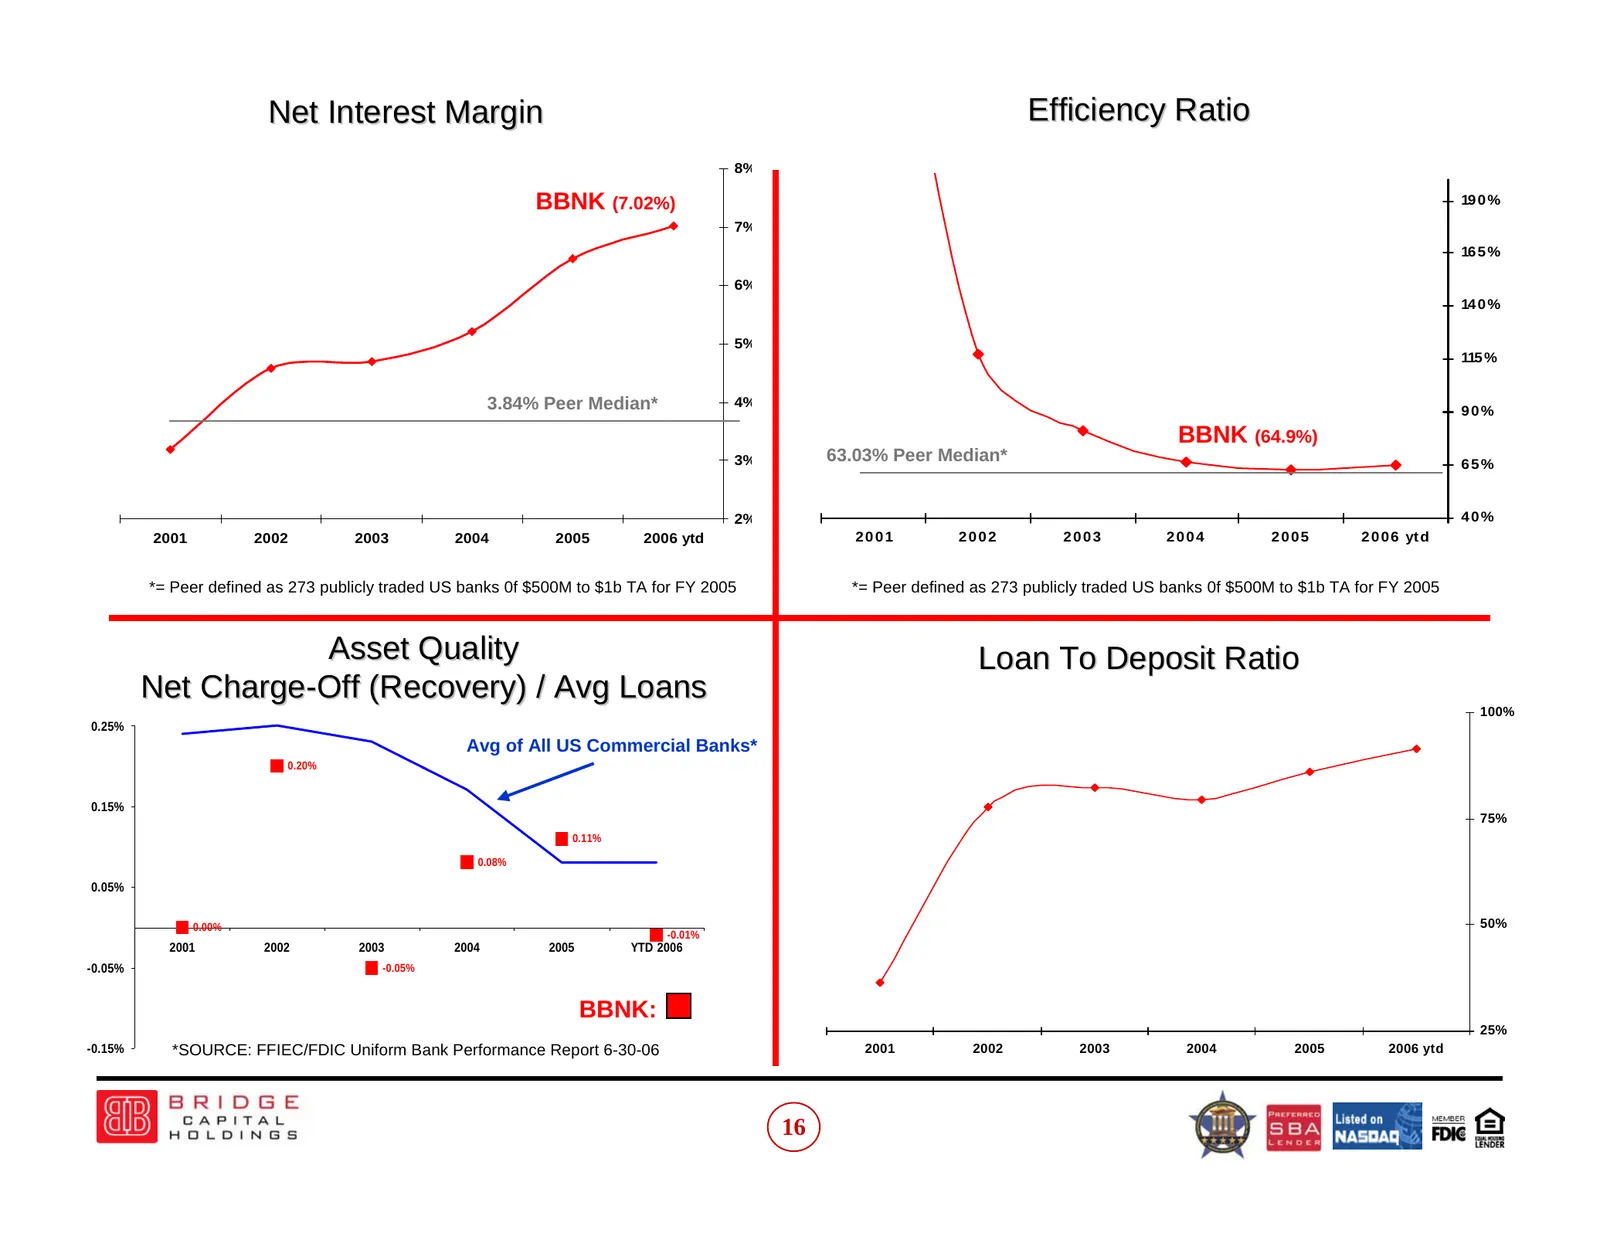
Net Interest Margin Efficiency Ratio 8% BBNK (7.02%) 19 0 % 7% 16 5 % 6% 14 0 % 5% 115 % 3.84% Peer Median* 4% 90% BBNK (64.9%) 3% 63.03% Peer Median* 65% 2% 40% 2001 2002 2003 2004 2005 2006 ytd 2001 2002 2003 2004 2005 2 0 0 6 yt d *= Peer defined as 273 publicly traded US banks 0f $500M to $1b TA
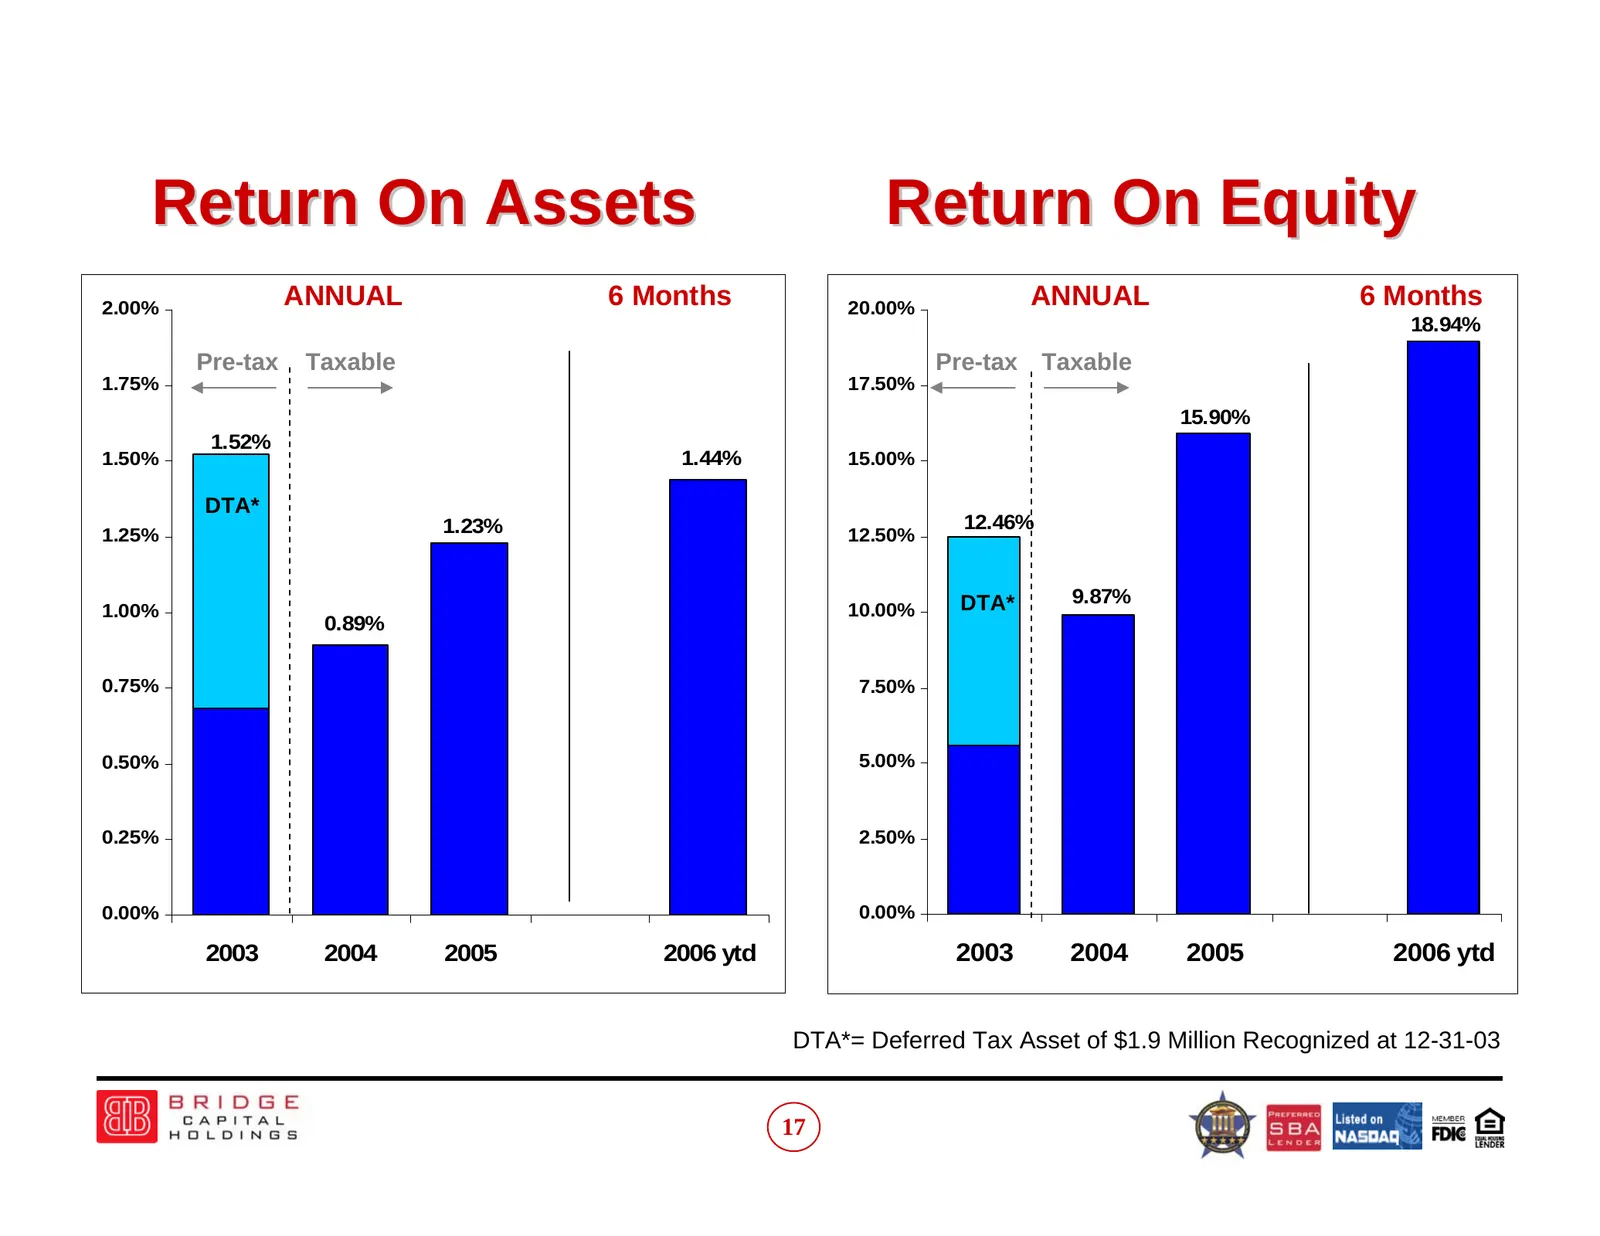
Slide 17: Return On Assets Return On Equity
Return On Assets Return On Equity 2.00% ANNUAL 6 Months 20.00% ANNUAL 6 Months 18.94% Pre-tax Taxable Pre-tax Taxable 1.75% 17.50% 15.90% 1.52% 1.50% 1.44% 15.00% DTA* 1.23% 12.46% 1.25% 12.50% DTA* 9.87% 1.00% 10.00% 0.89% 0.75% 7.50% 0.50% 5.00% 0.25% 2.50% 0.00% 0.00% 2003 2004 2005 2006 ytd 2003
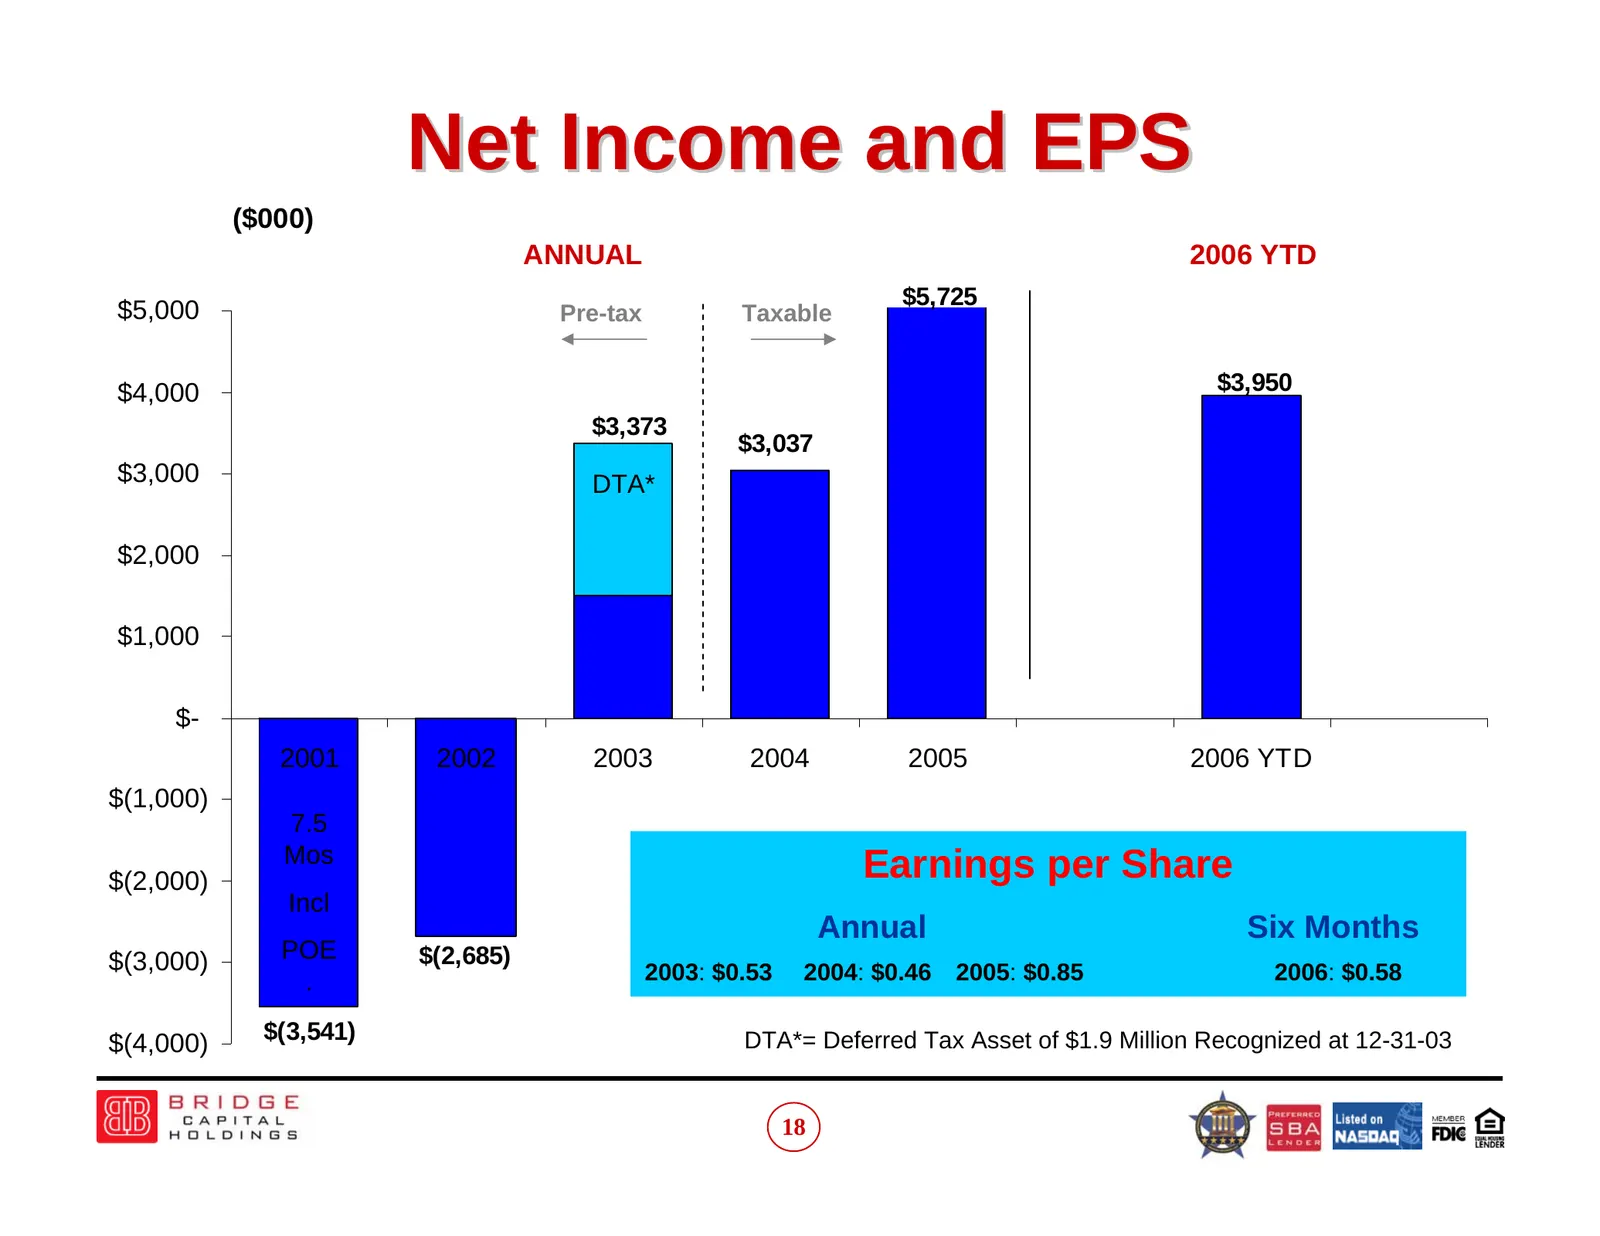
Slide 18: Net Income and EPS
Net Income and EPS ($000) ANNUAL 2006 YTD $5,725 $5,000 Pre-tax Taxable $4,000 $3,950 $3,373 $3,037 $3,000 DTA* $2,000 $1,000 $- 2001 2002 2003 2004 2005 2006 YTD $(1,000) 7.5 Mos $(2,000) Earnings per Share Incl Annual Six Months $(3,000) POE $(2,685) . 2003: $0.53 2004: $0.46 2005: $0.85 2006: $0.
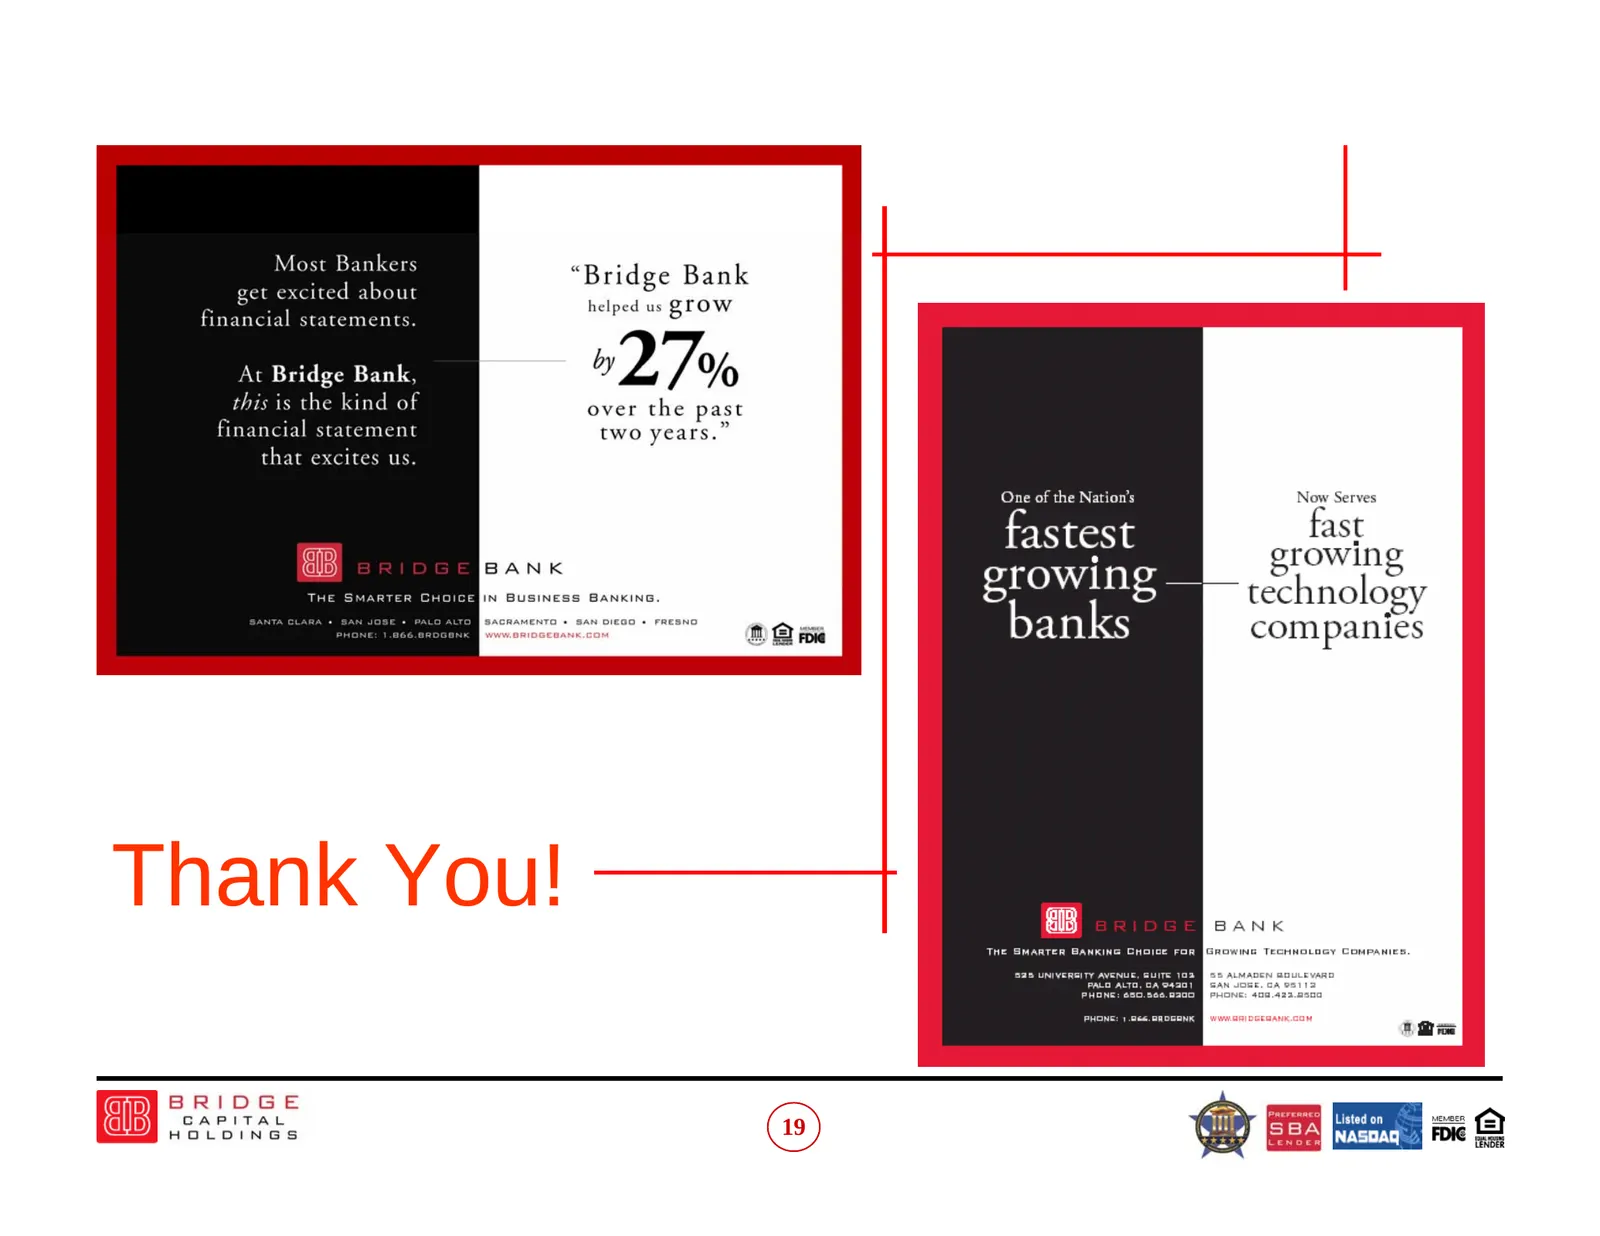
Slide 19: Thank You!
Most Bankers “Pe: : Bridge Bank g ited about ae helped us ZFOW financi statements. At Bridge Bank, "D7 o% this is the kind of over the past financi tement two years.” that One of the Nation’s Now Serves fast BANK itu growing ME |. cusiwess oxncive, § aes — technology —— lees es com painice eB oeeeee
Source: SEC EDGAR · 8-K filed Aug 21, 2006
More decks from Bridge Capital Holdings
 Merger or Acquisition (March 2015)11 slides · Mar 9, 2015
 Q4 2014 Earnings Presentation22 slides · Feb 4, 2015
 Q2 2014 Earnings Presentation23 slides · Jul 29, 2014
 Shareholder Meeting (May 2014)19 slides · May 28, 2014
 Q1 2014 Earnings Presentation23 slides · May 13, 2014
 Q4 2013 Earnings Presentation24 slides · Feb 5, 2014