Chittenden — Investor Presentation (April 2004)
16 slides from Chittenden's investor presentation, Apr 27, 2004

Slide 1: Chittenden Corporation presentation as of March 31, 2004
reaching by As reaching of March more out 31, customers with 2004more
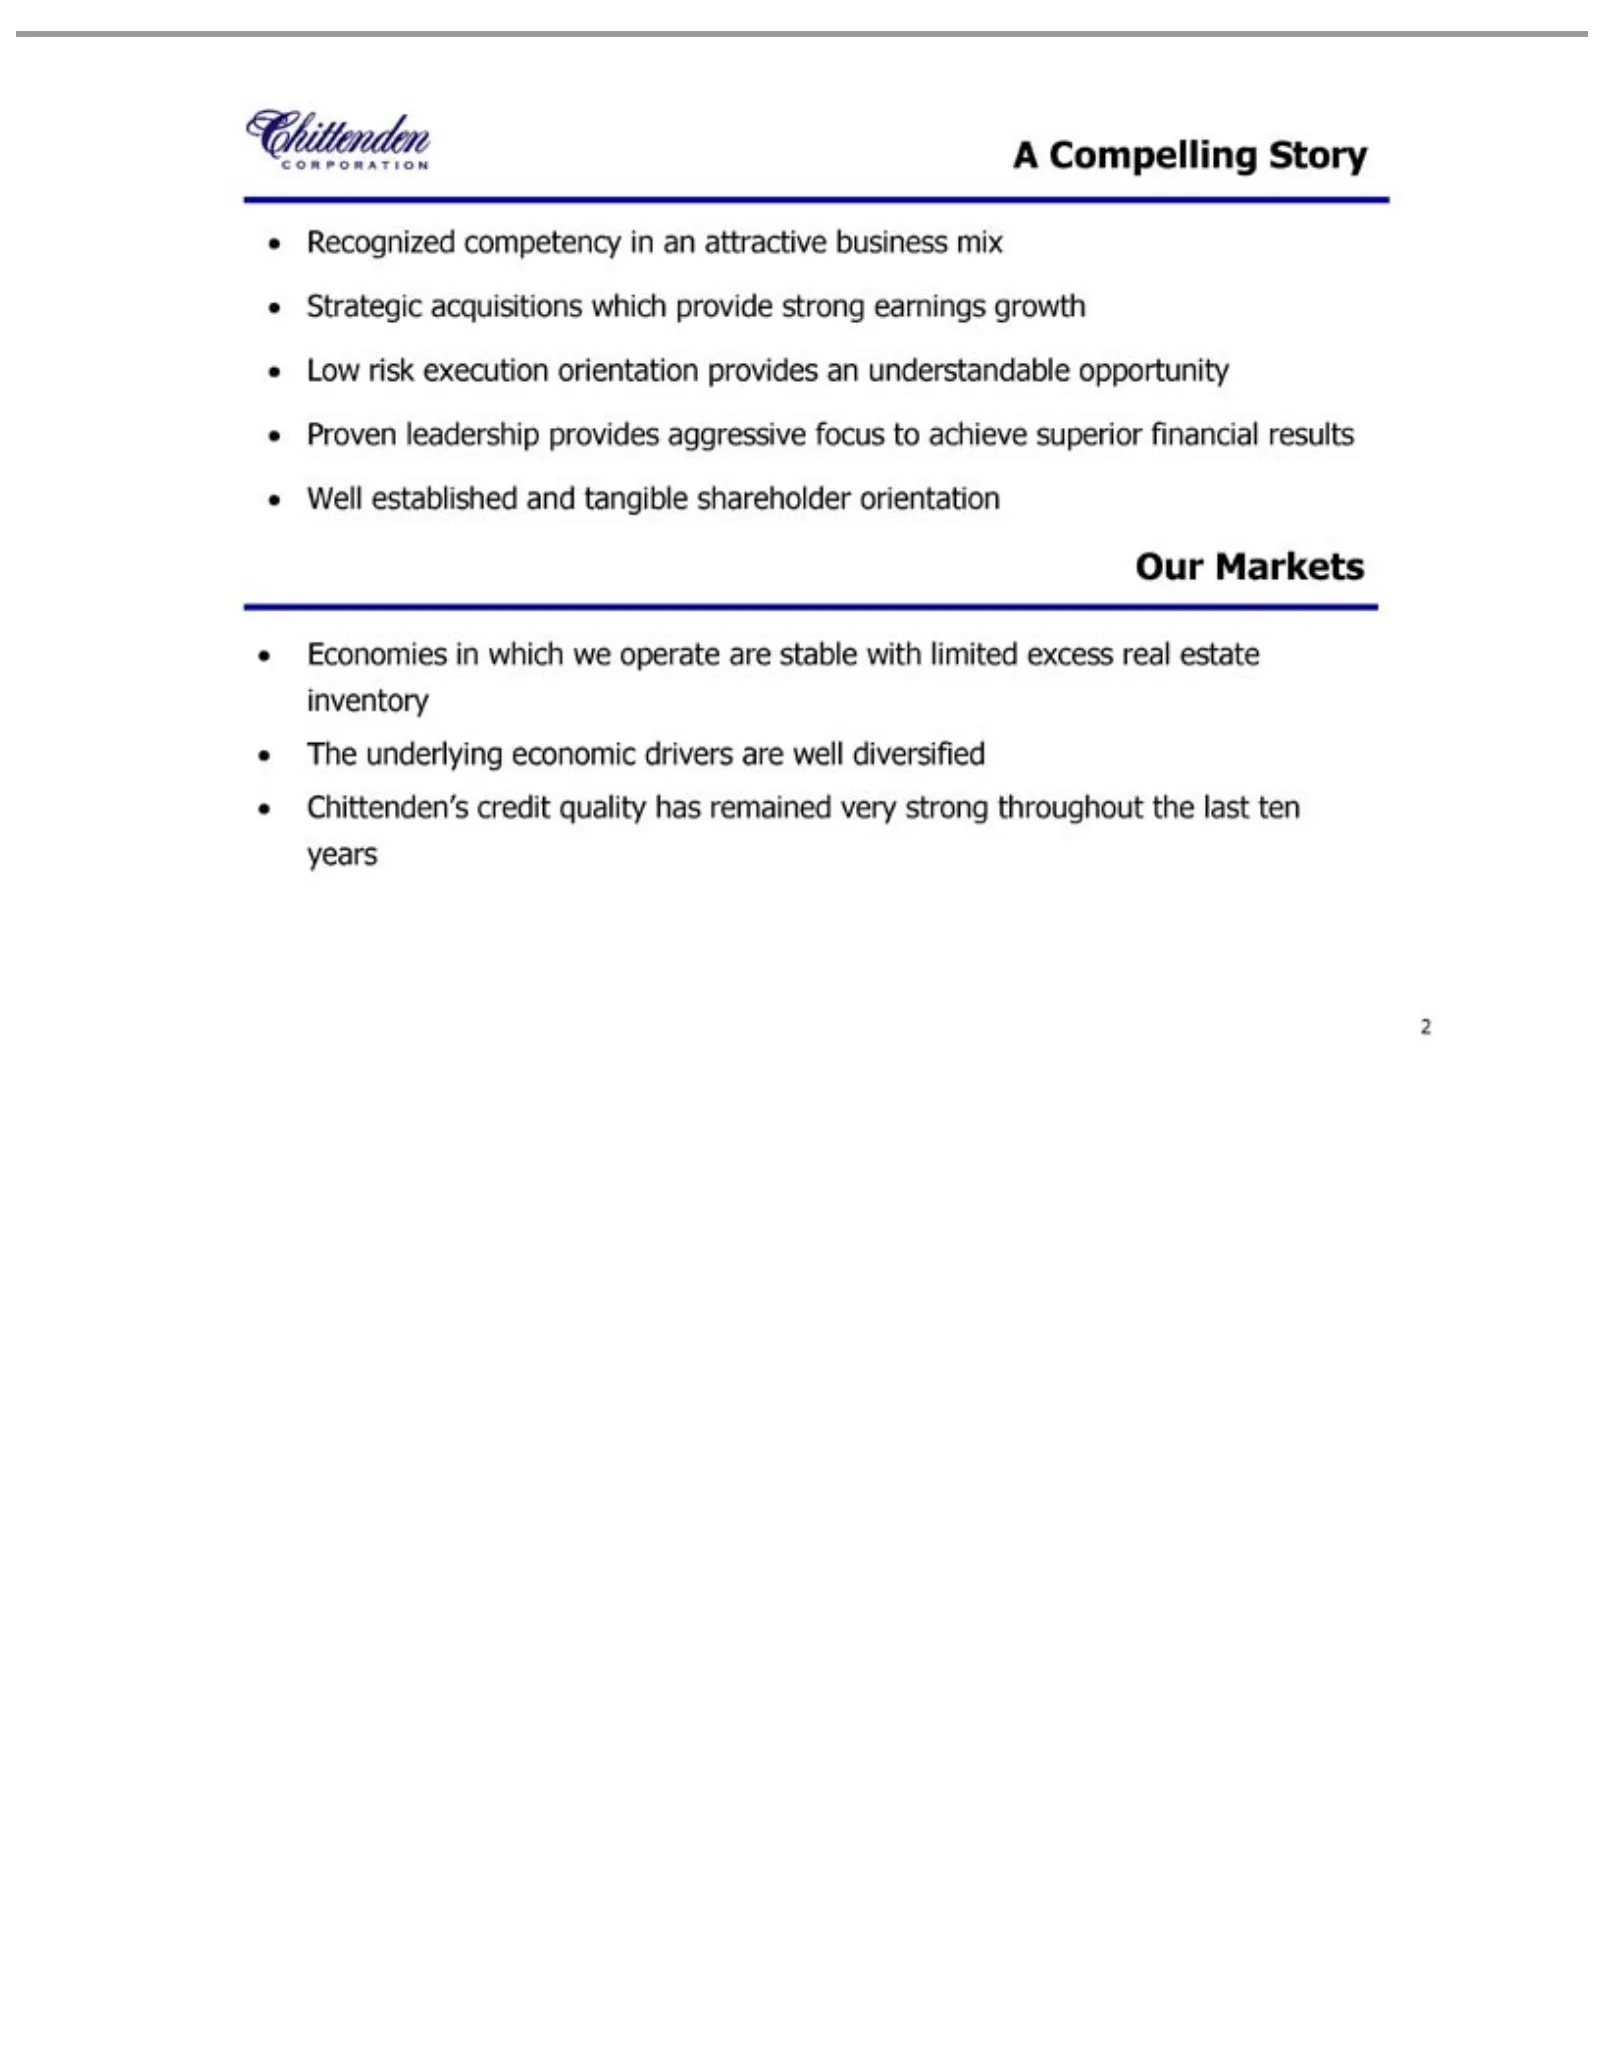
Slide 2: A Compelling Chittenden Story
AThe .Our 2Well Recognized Strategic Low Proven Economies Chittenden’s Compelling Markets underlying risk established leadership acquisitions execution in competency credit Story which economic and provides quality orientation we tangible which operate indrivers has an aggressive provide shareholder
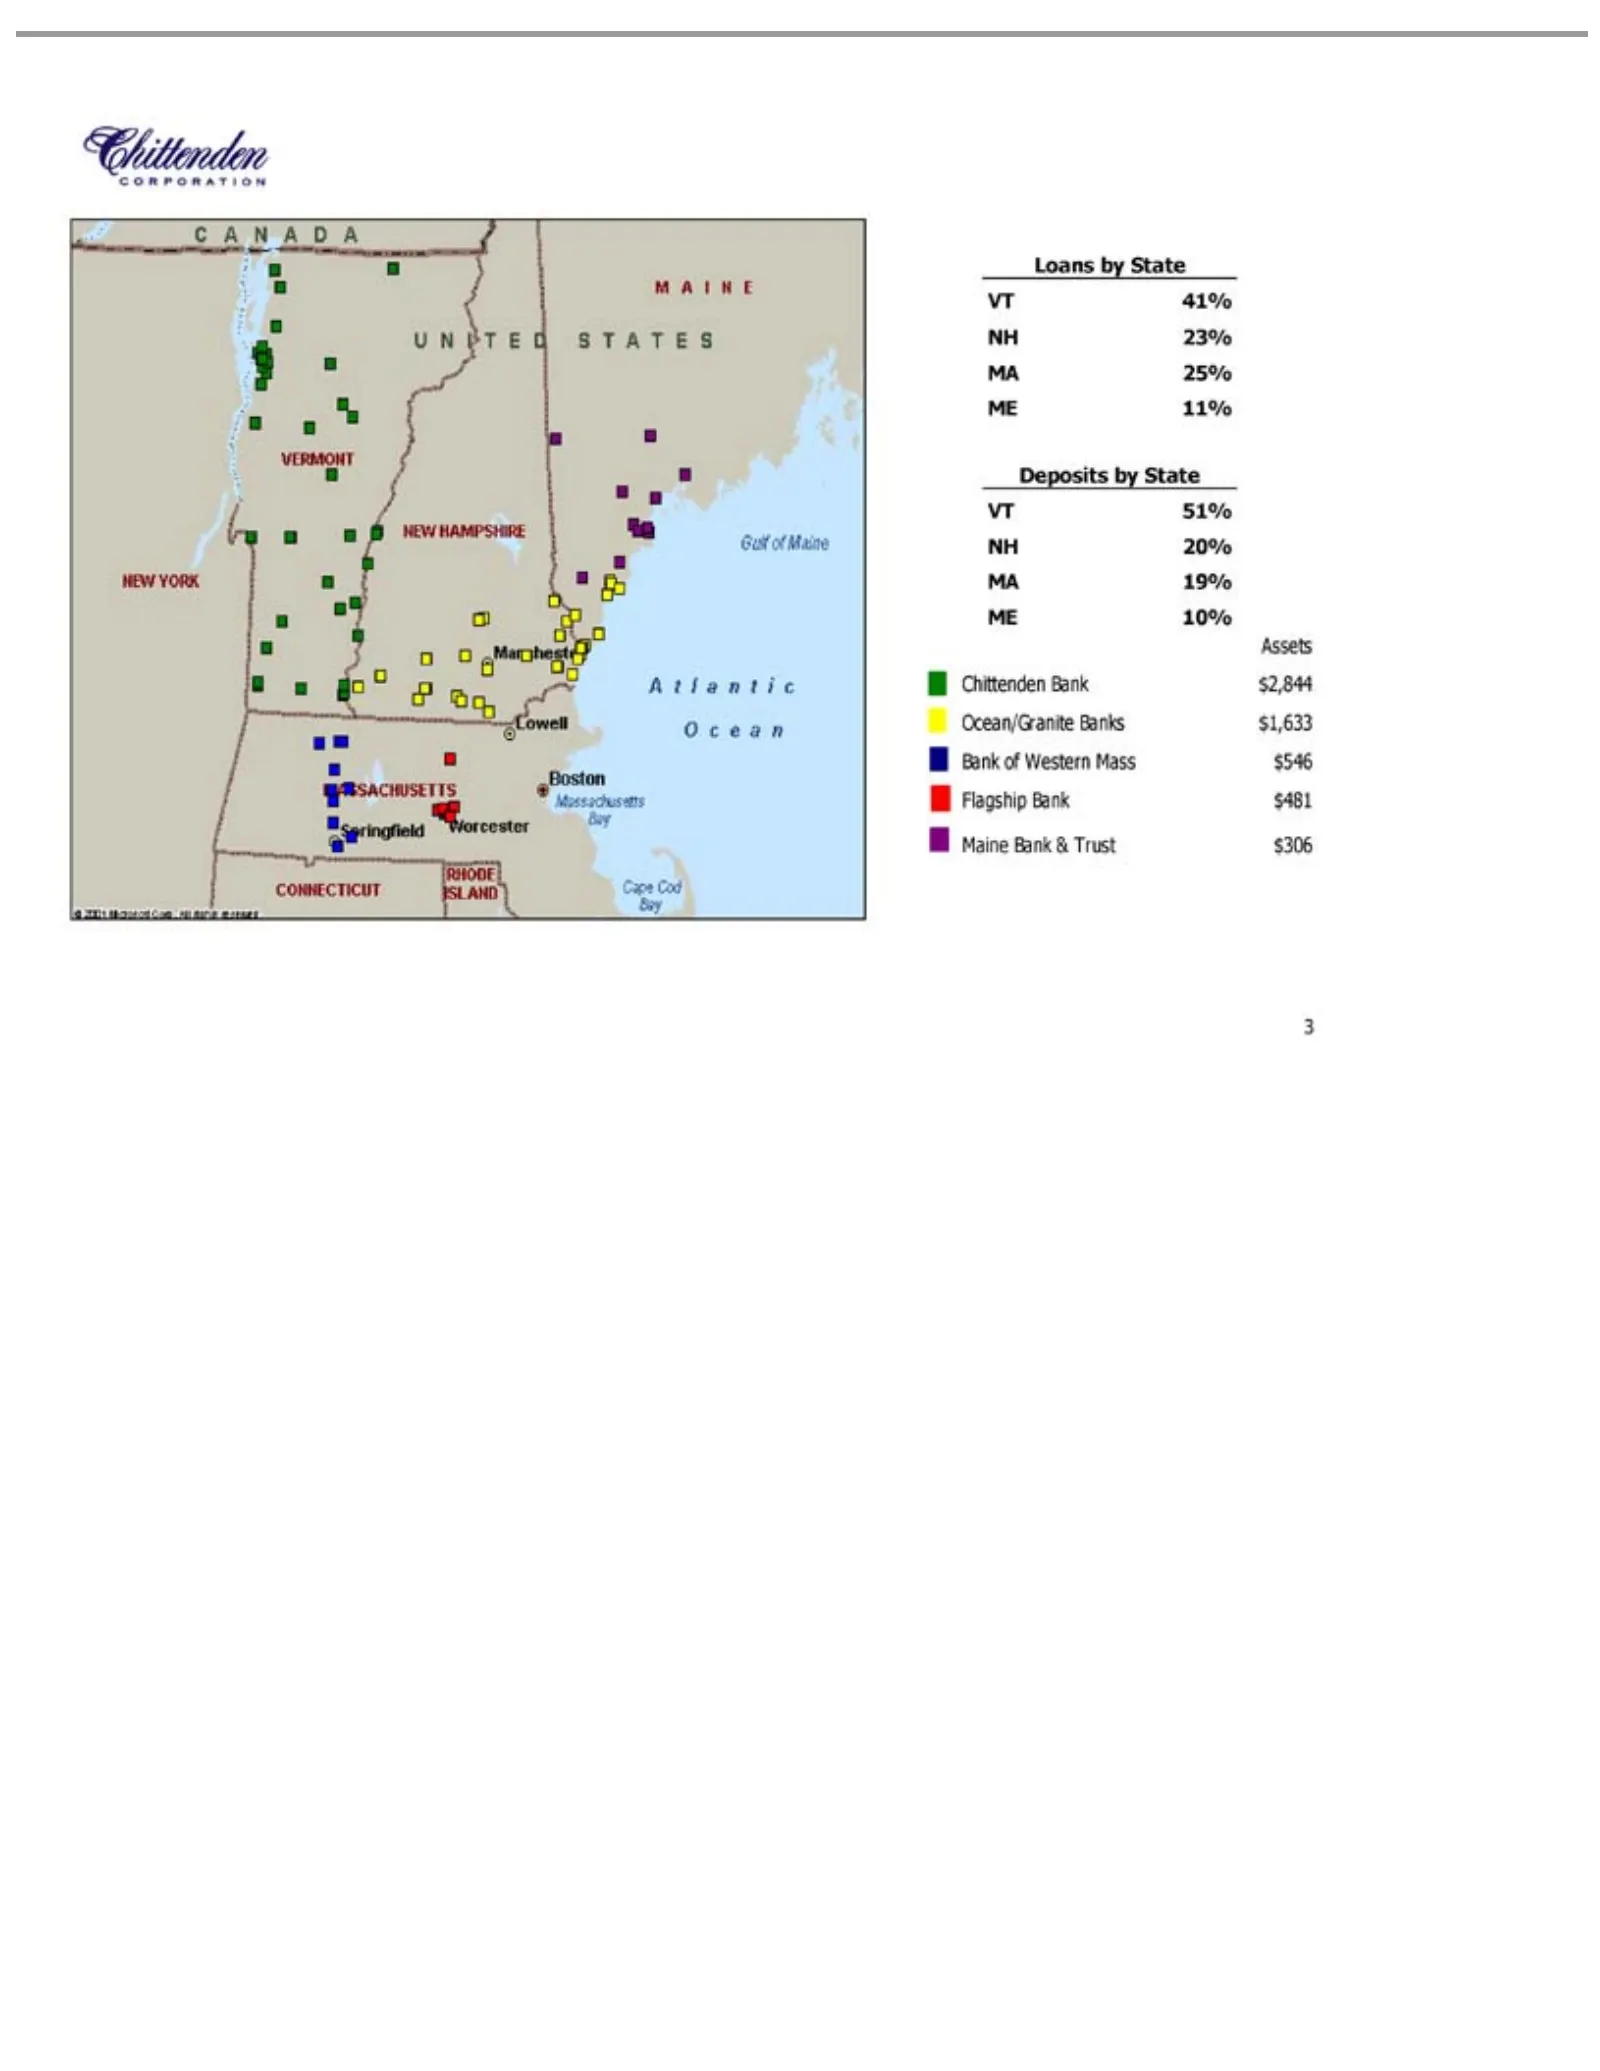
Slide 3: Chittenden Corporation Banks by State
Loans Deposits VT NH MA ME Chittenden Assets Ocean/Granite Bank Flagship Maine 3 41% 51% 23% 20% 11% 10% 25% 19% ofby Bank Western Bank by State Bank State & $Banks Trust 481 Mass $ 2,844 $$306 $1,633 546
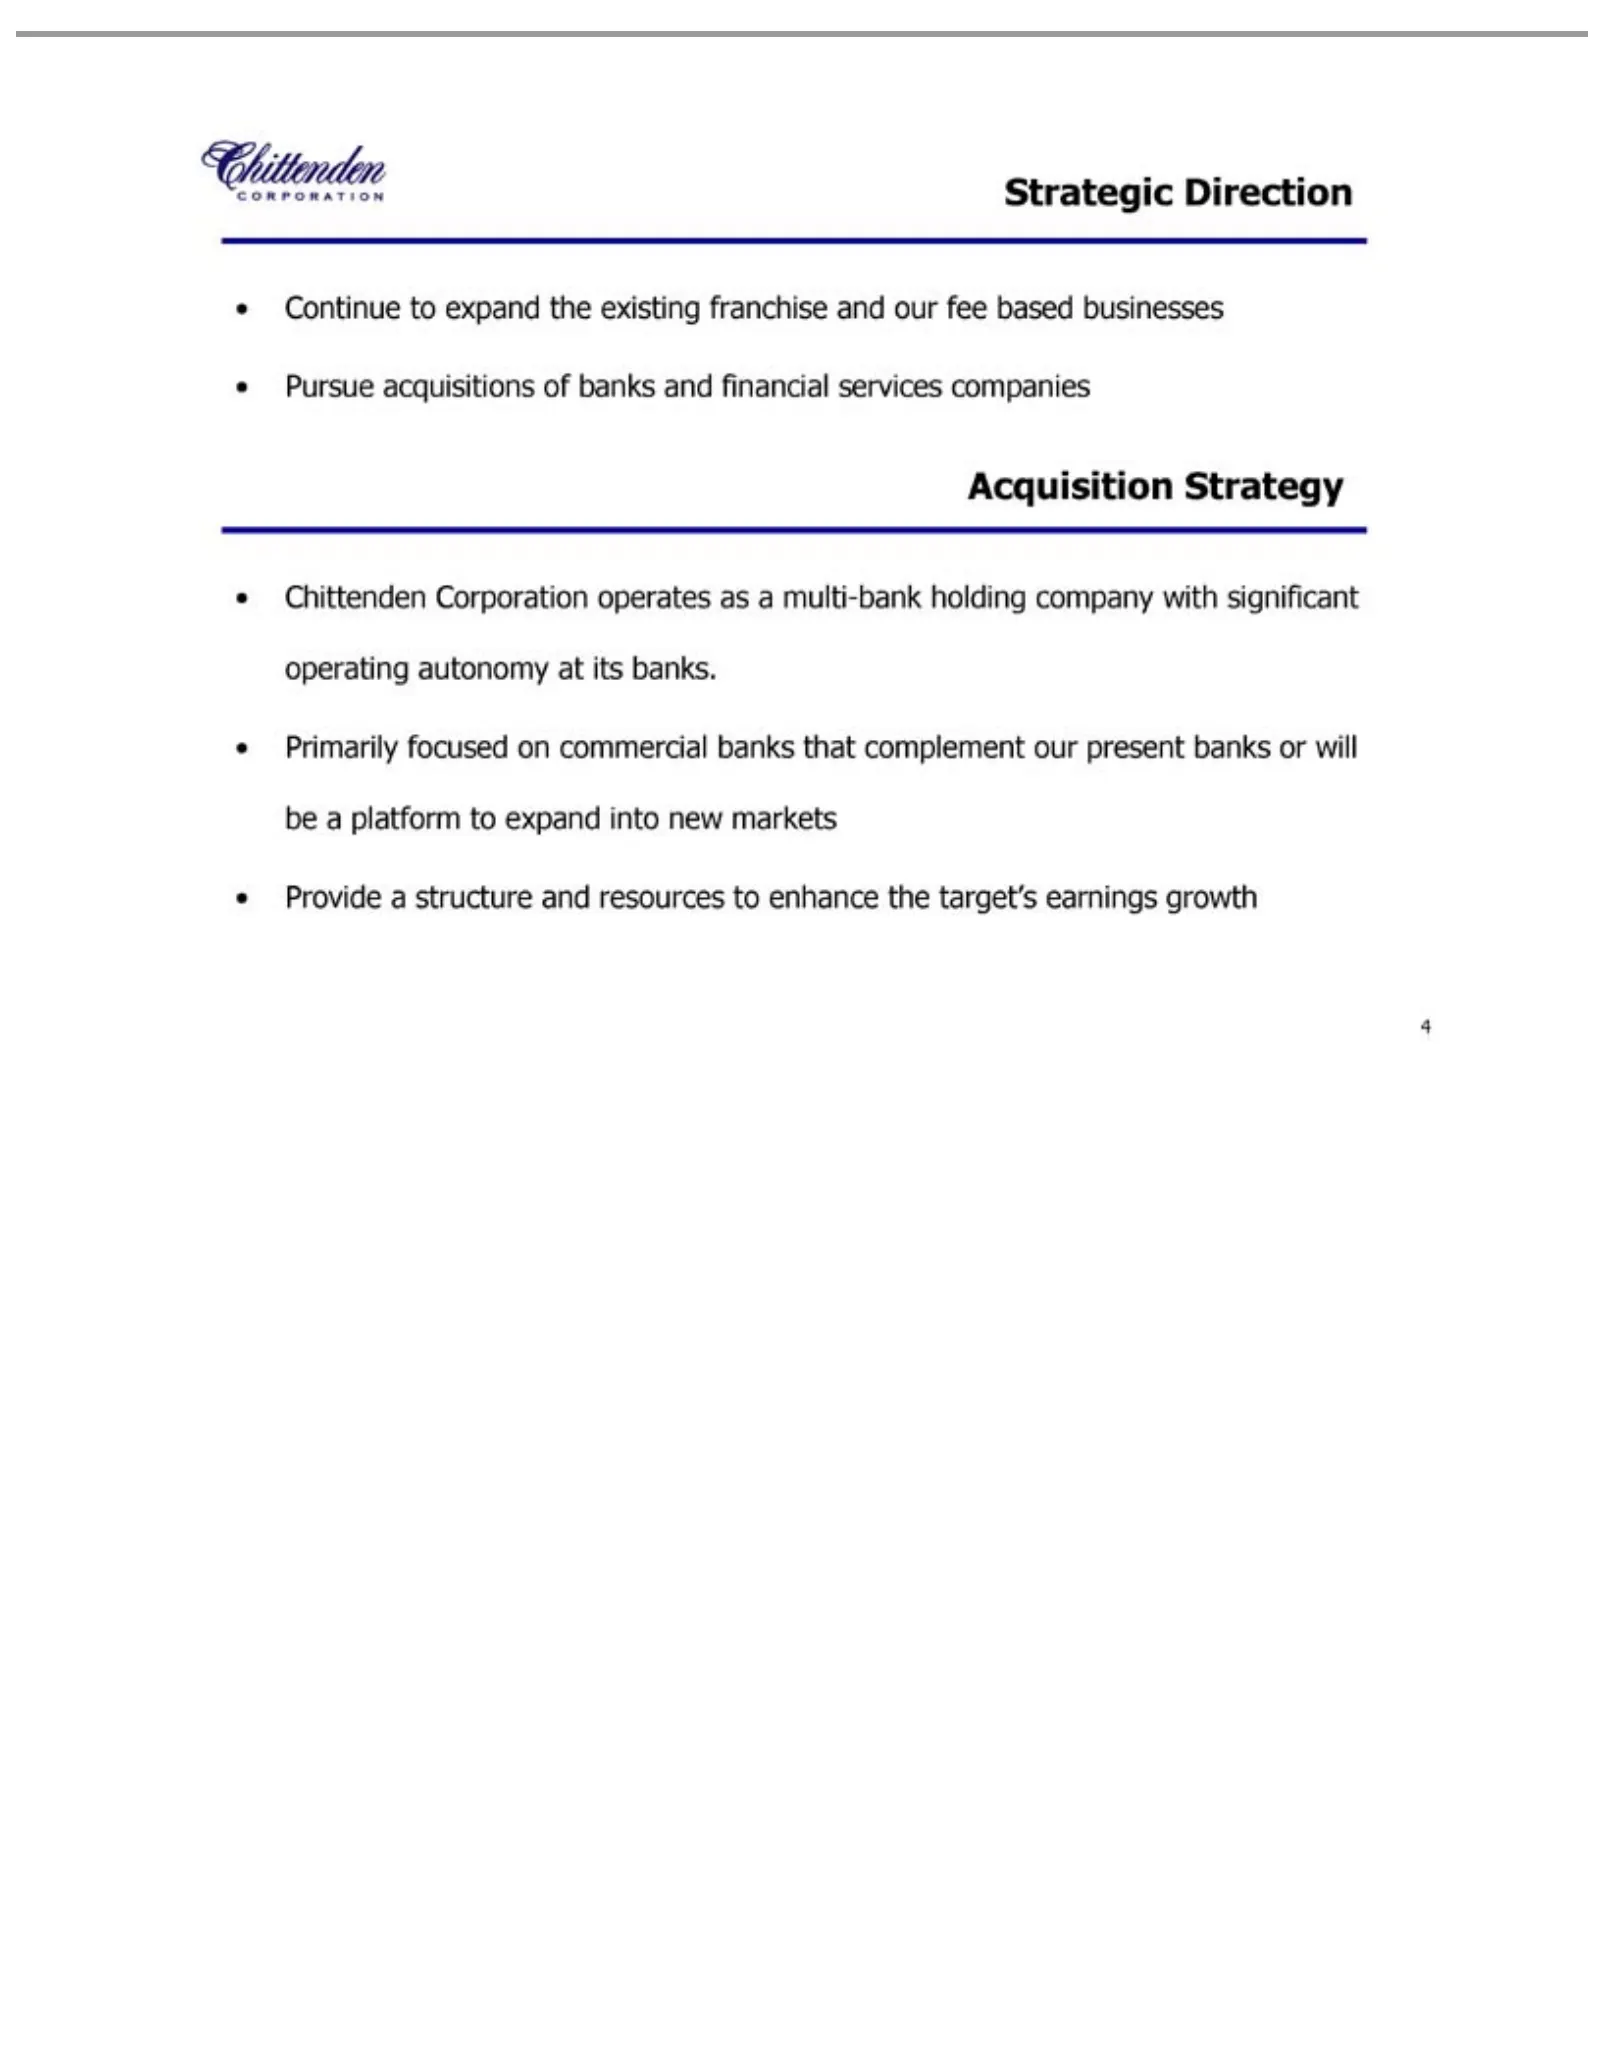
Slide 4: Strategic Direction: Acquisition Strategy
Strategic •Acquisition 4 Continue Pursue Chittenden Primarily Provideacquisitions Direction a to focused structure Strategy Corporation expandon and of the commercial banks resources existing operates andfranchise as financial to banks aenhance multi-bank that and services complement the ourtarget’s
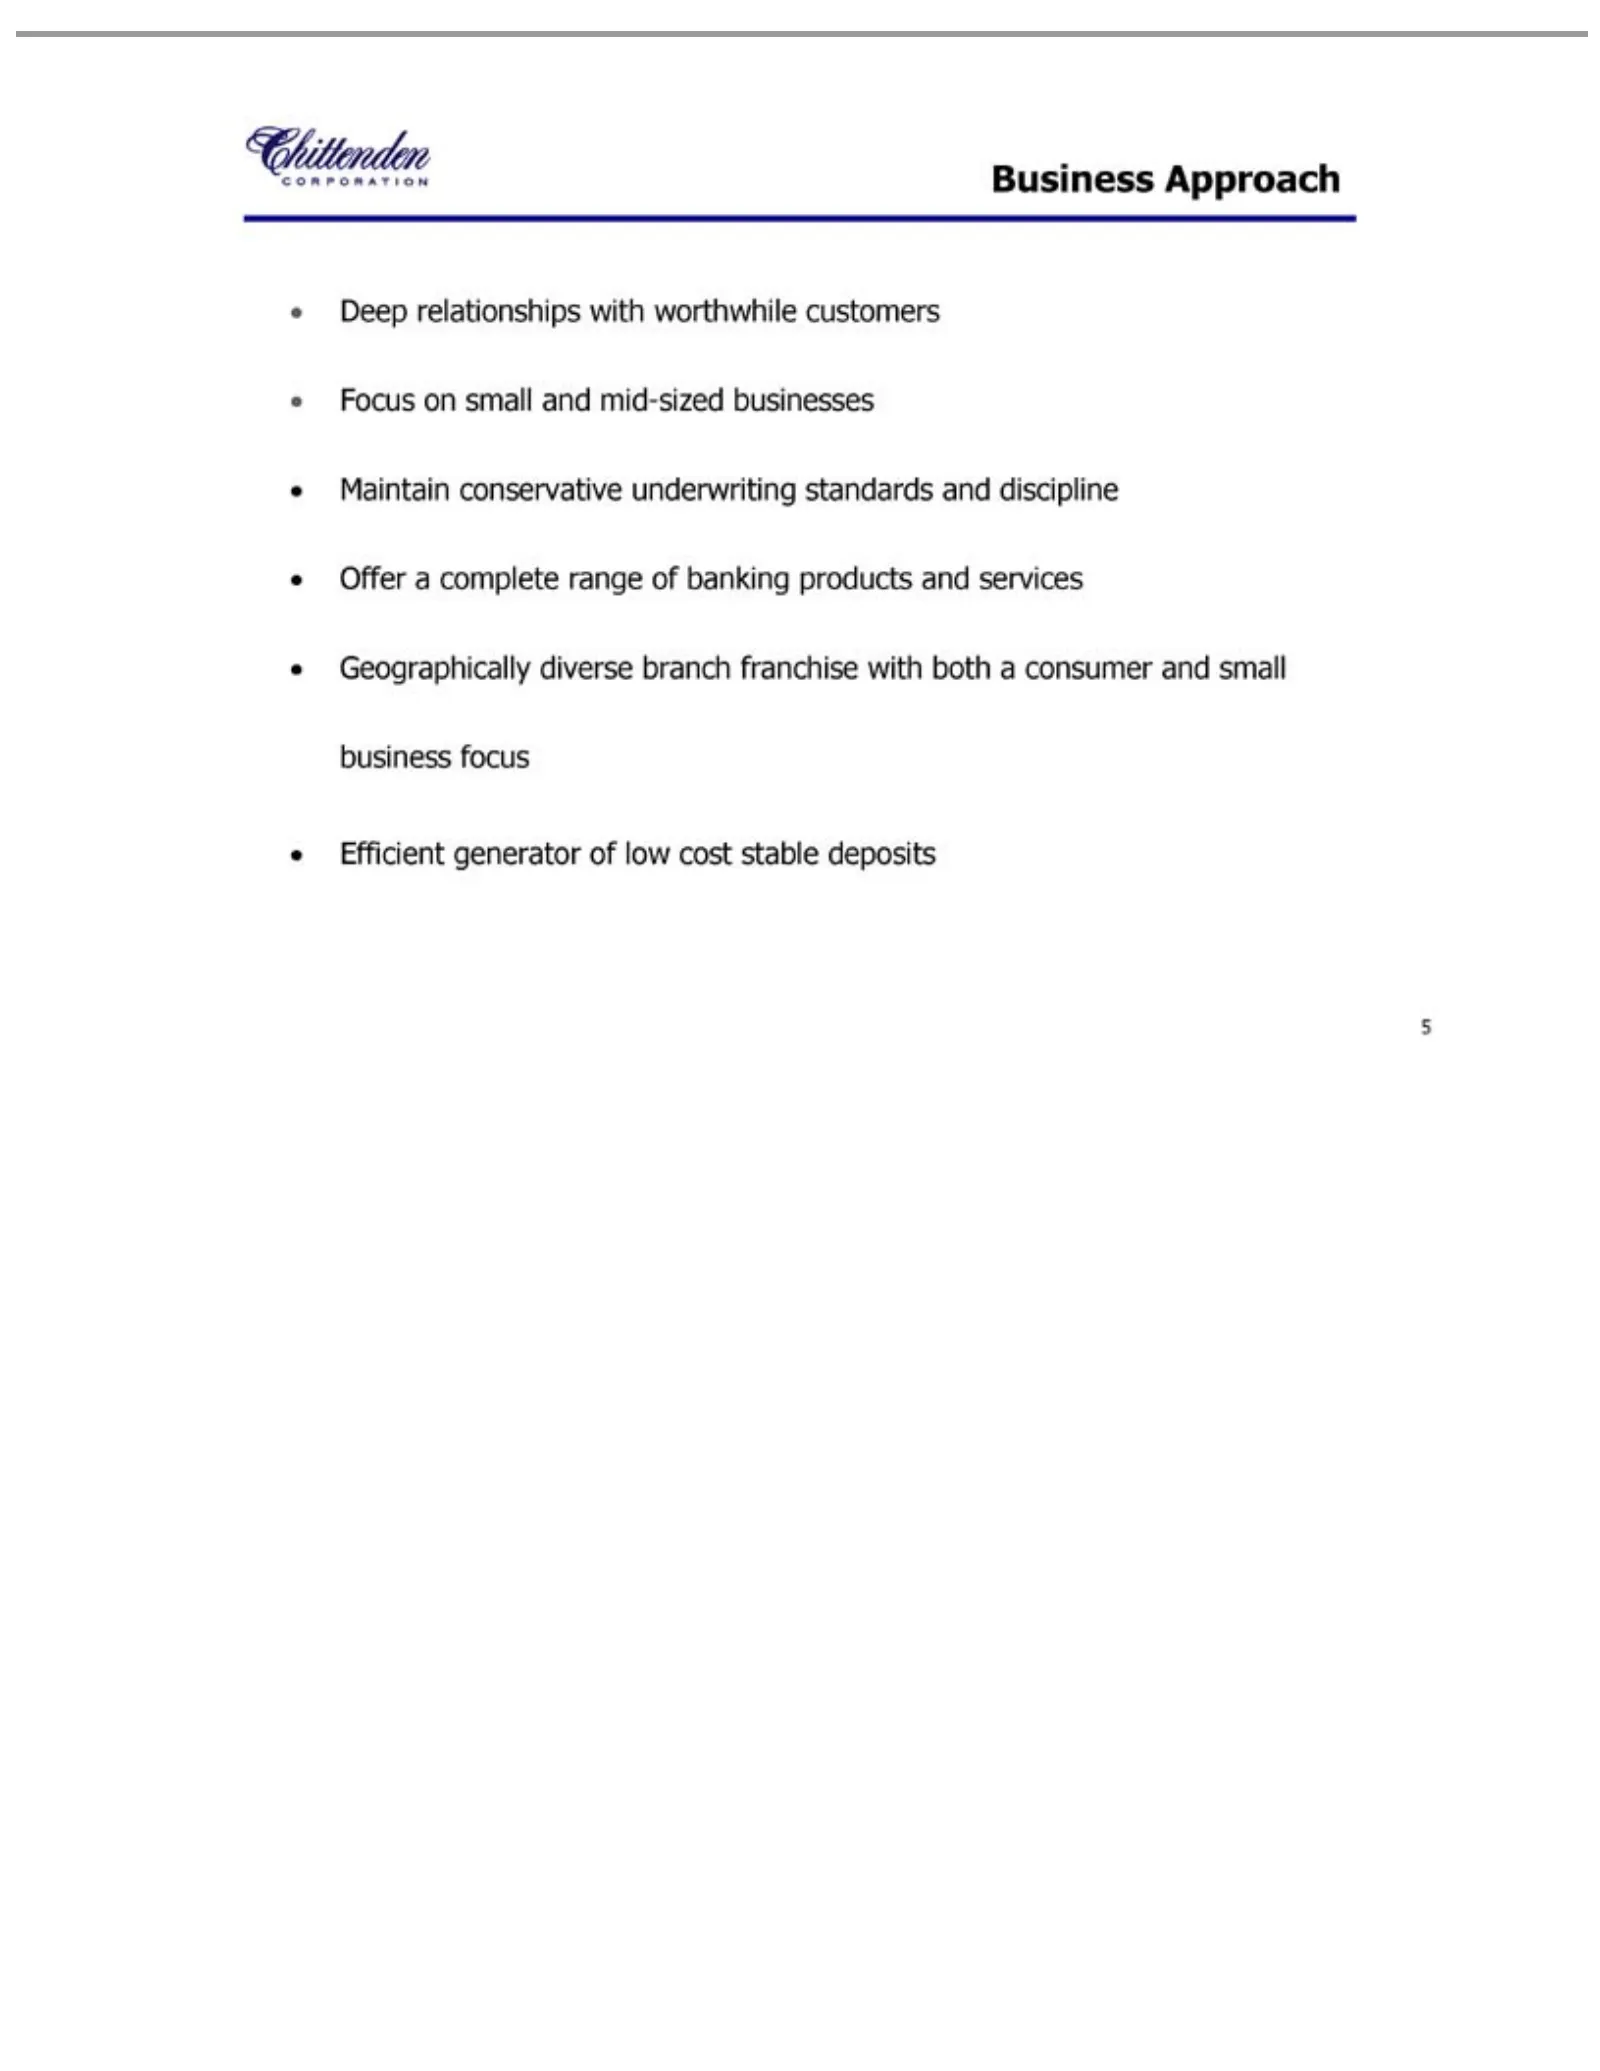
Slide 5: Business Focus and Approach
.Business 5 Deep relationships Focus Maintain Offer Geographically Efficient aon complete Approach generator conservative small and diverse range with of mid-sized low underwriting of branch worthwhile banking costbusinesses stable franchise products customers standards deposits withand both and ser
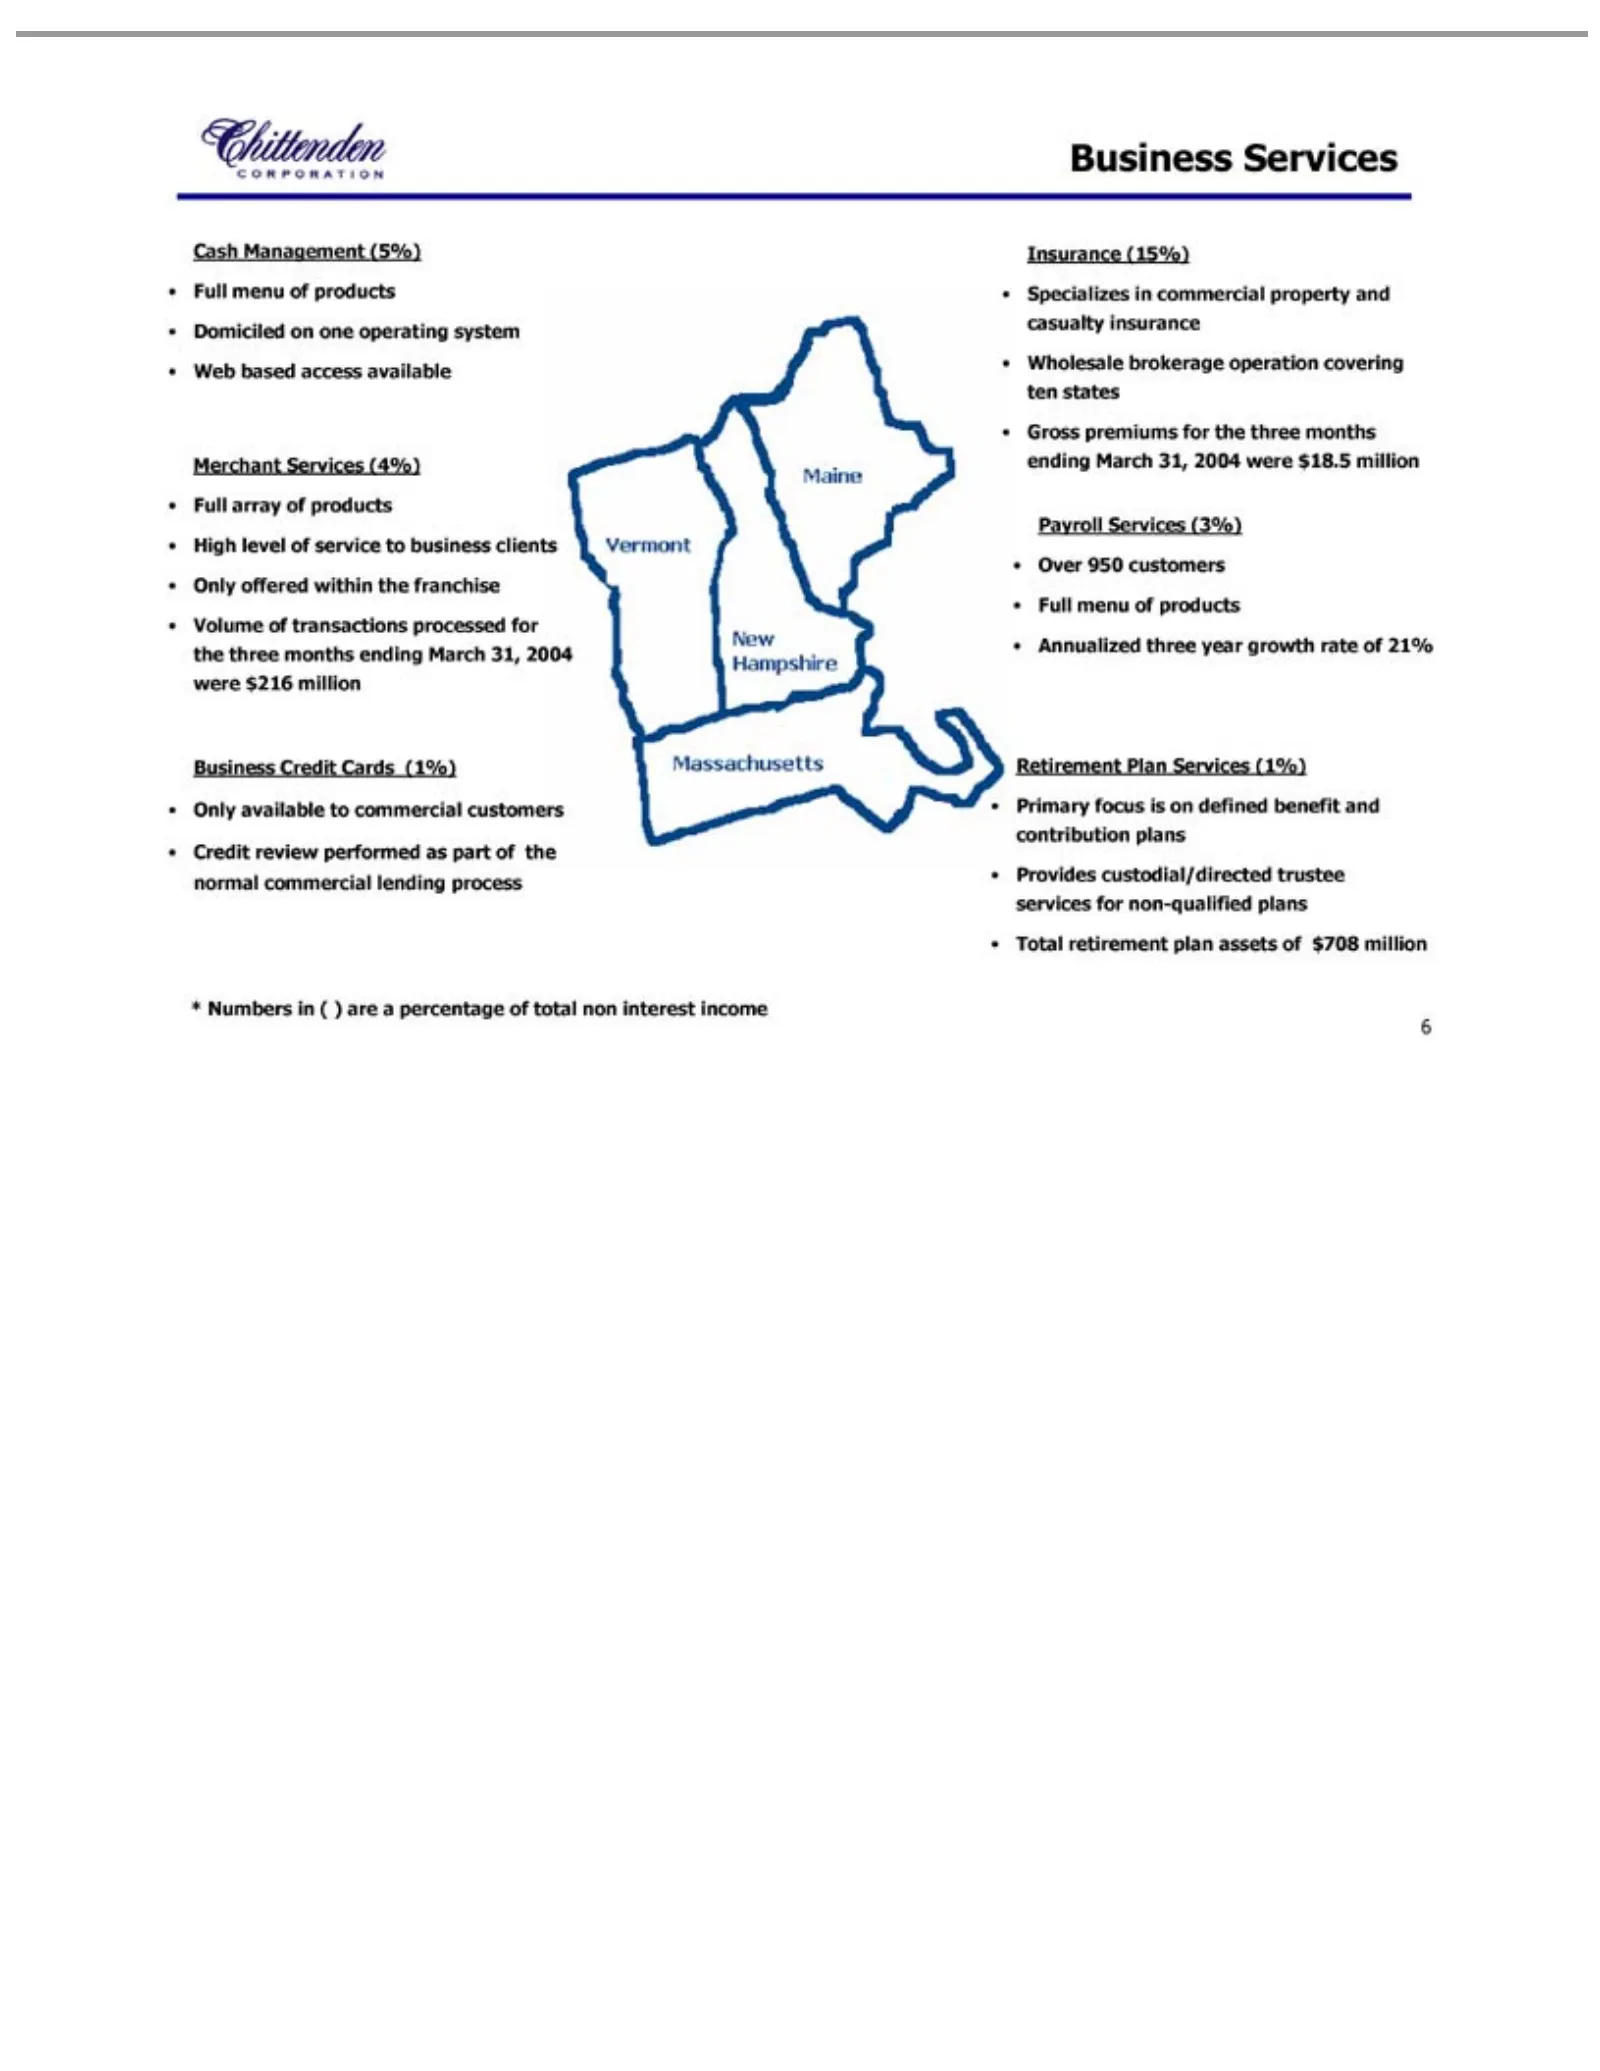
Slide 6: Fee-Based Business Services
Cash Merchant Business Insurance Payroll •Retirement * 6 Annualized Web Volume Wholesale Total Domiciled High Only Credit Specializes Gross Over Full Primary Provides Numbers Management array menu based 950 level offered available retirement Services premiums review Services Credit of focus Services
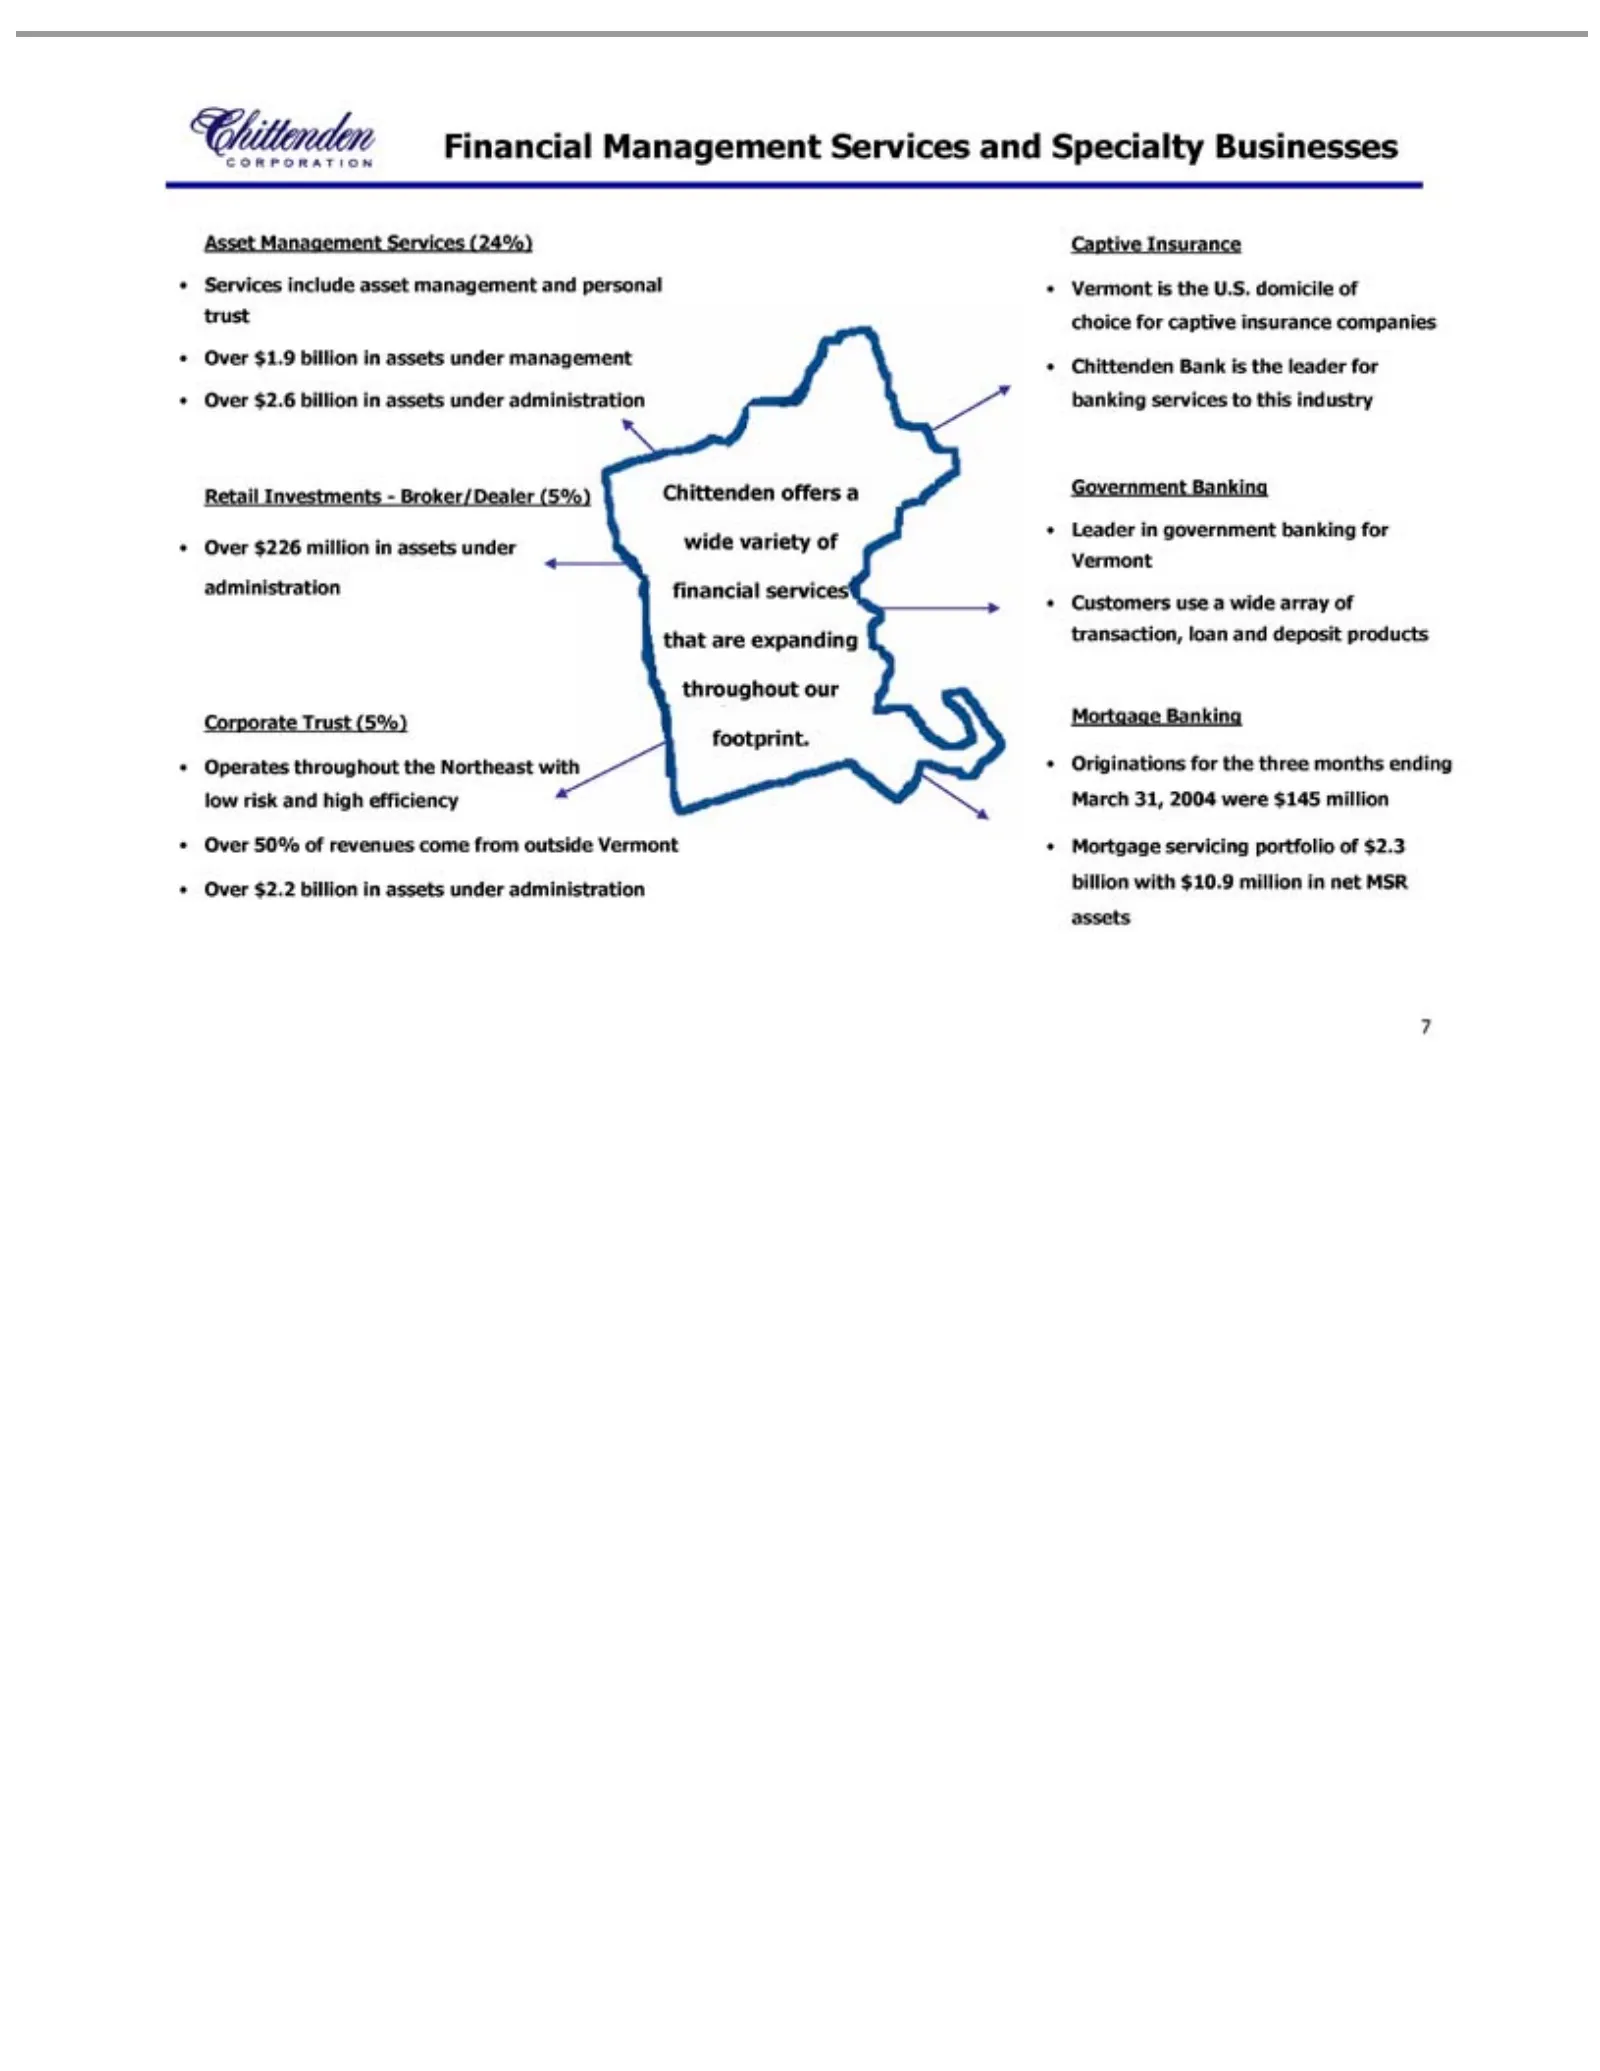
Slide 7: Financial Services
Financial Chittenden Asset Retail Corporate Captive Government •Mortgage 7 Vermont Services Operates Over Chittenden Leader Customers Originations Mortgage Management Investments—Broker/Dealer $1.9 $2.6 $226 50% $2.2 Insurance inManagement Banking Trust include is throughout offers government servic
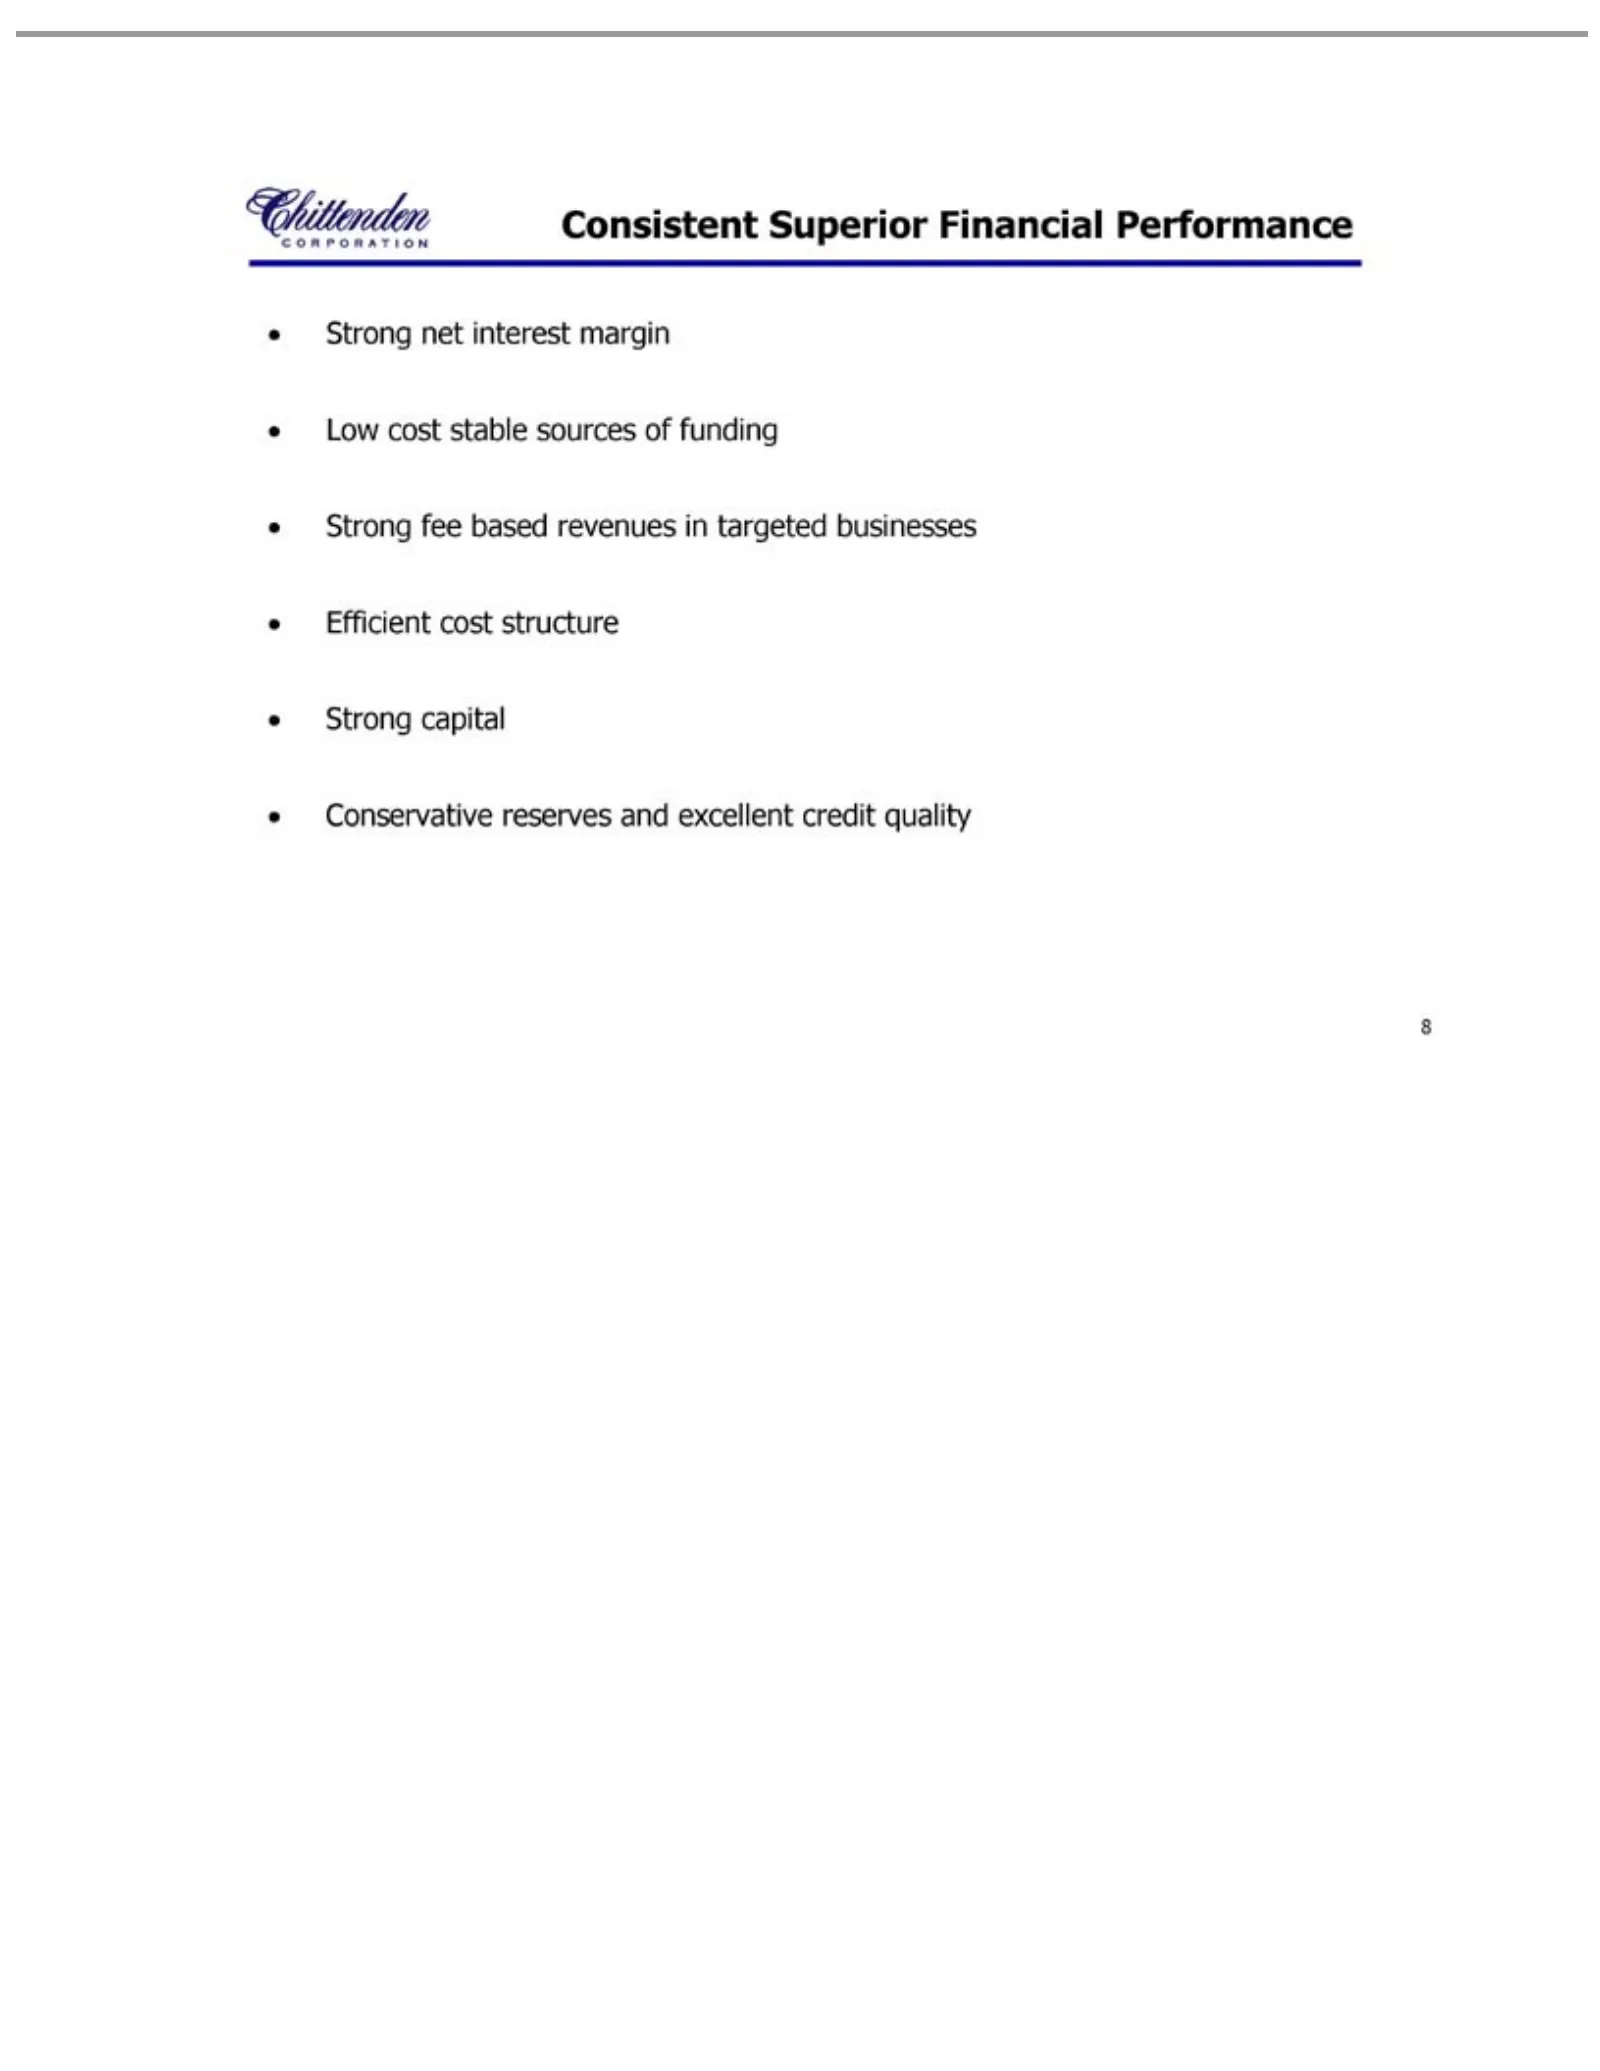
Slide 8: Consistent, Efficient, Low Cost Financial Performance
.Consistent 8 Low cost Efficient Strong Conservative netcost fee capital stable Superior based interest reserves structure sources revenues margin Financial and of in excellent funding Performance targetedcredit businesses quality
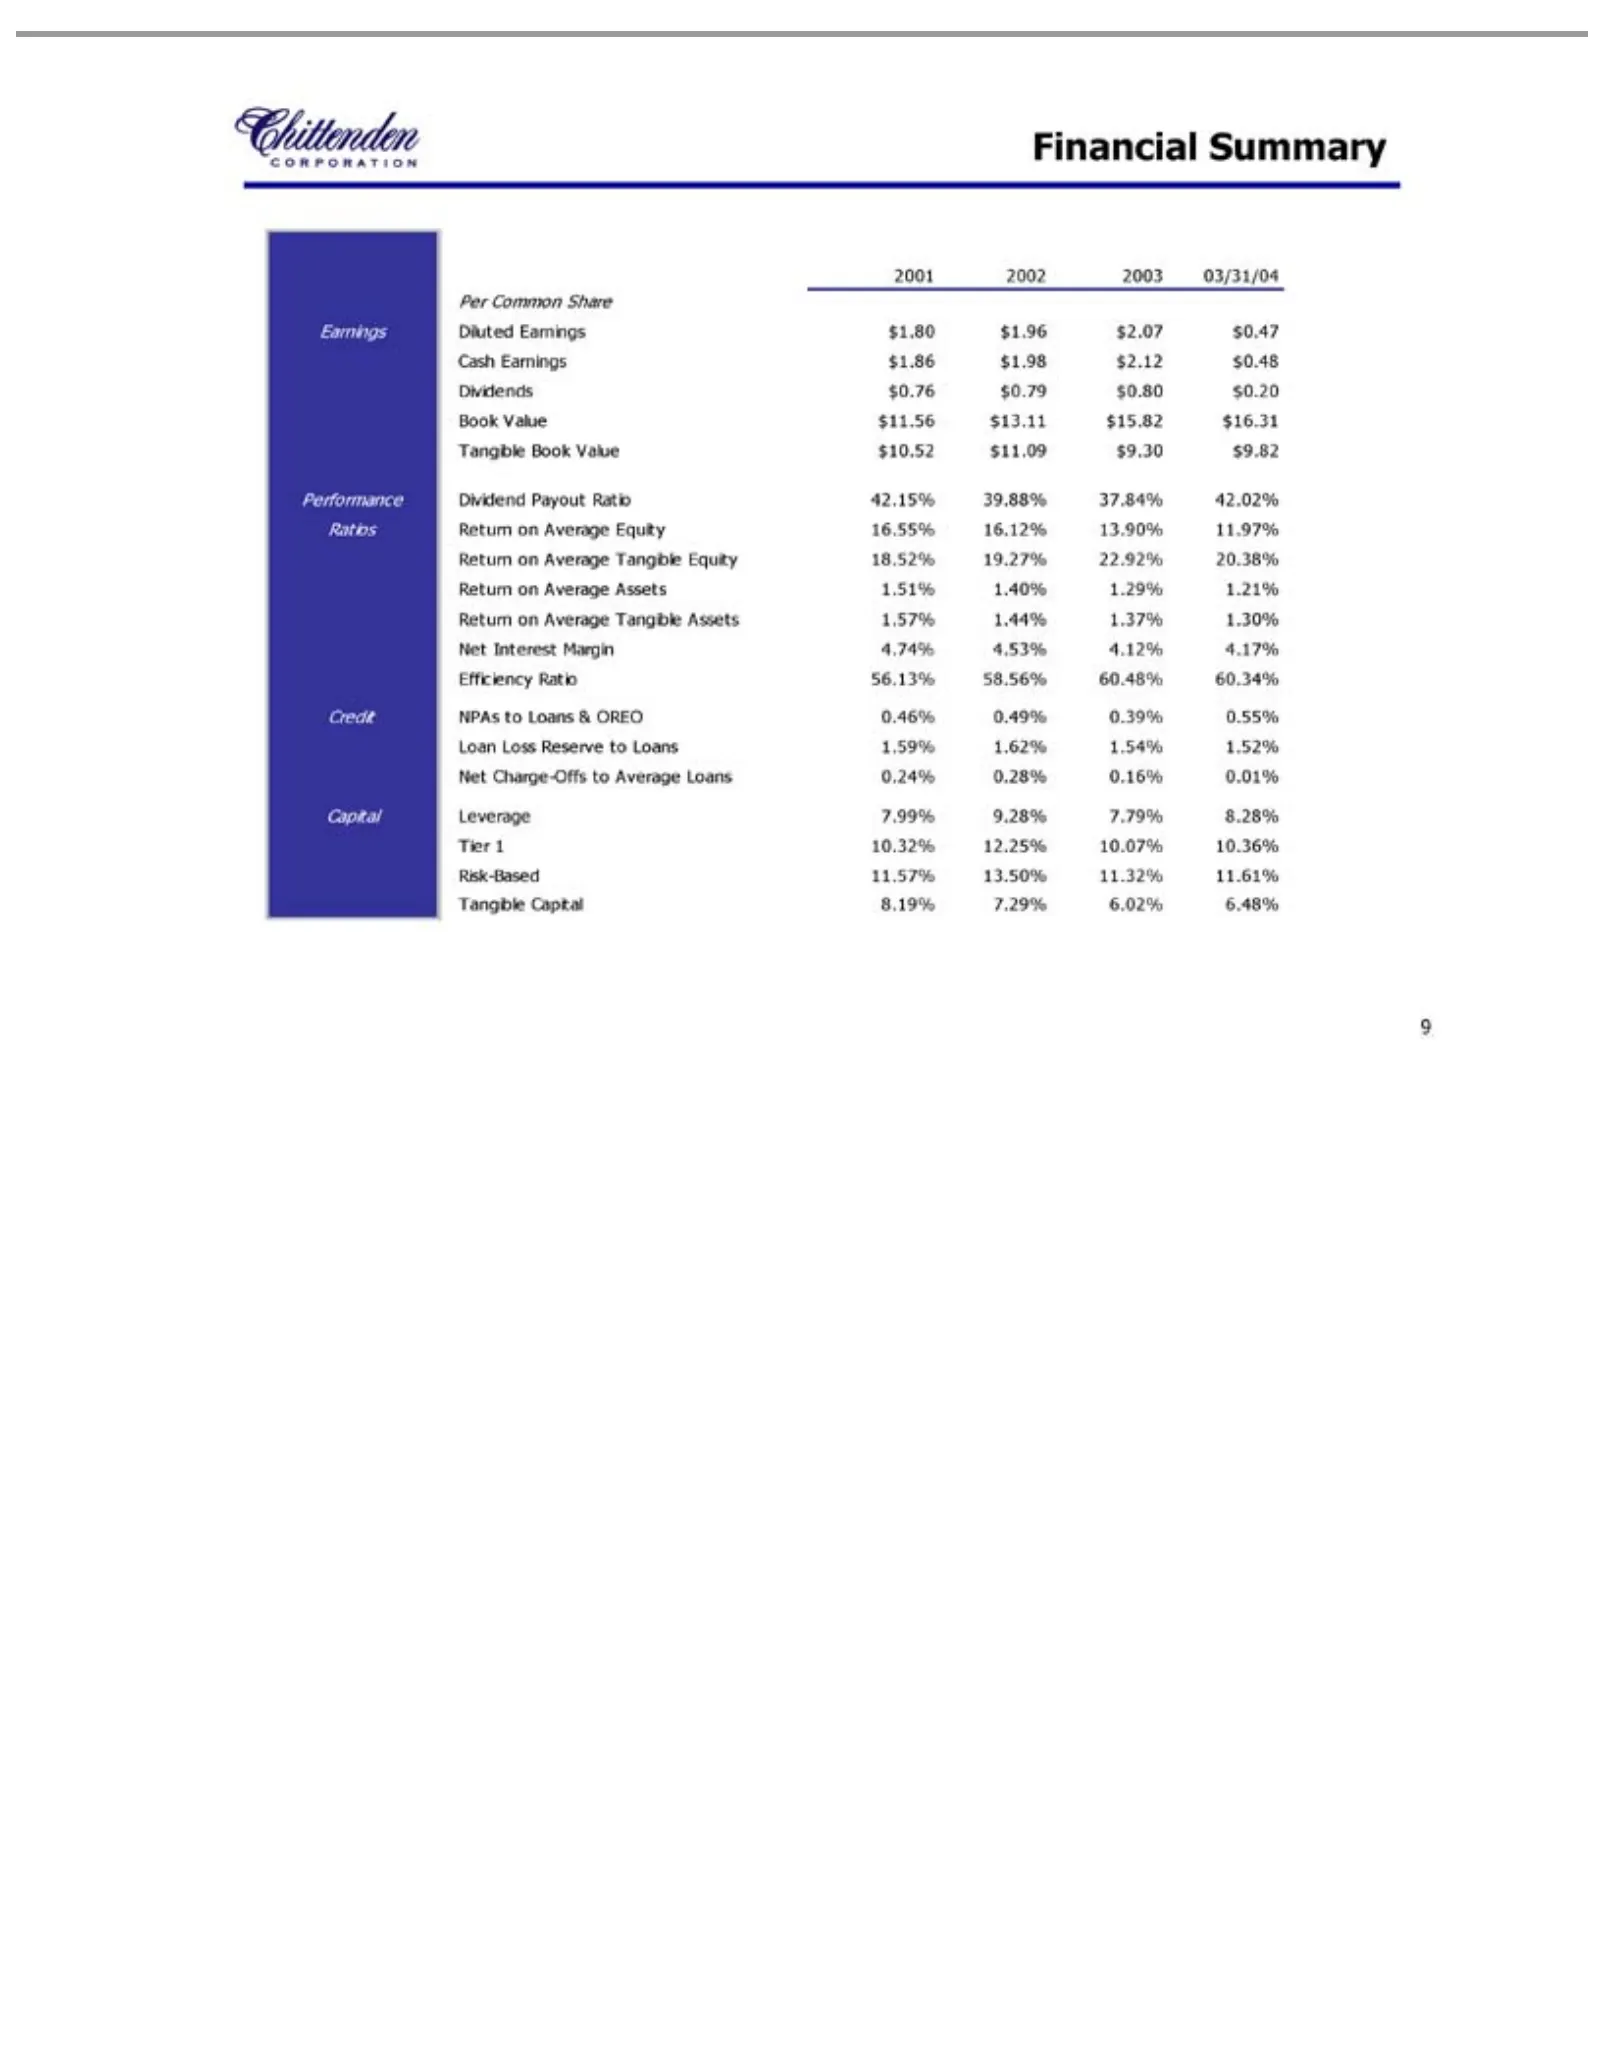
Slide 9: Financial Performance Summary
Financial Performance Earnings 2001 Capital Credit Per Diluted Cash Dividends Book Dividend Return Efficiency NPAs Loan Net Leverage Tier Risk-Based Tangible 9 Common Interest Charge-Offs 12002 Earnings Loss Value to 10.32% on Earnings Loans Book Capital 7.99% Summary Payout Average $Ratio Reserve 2
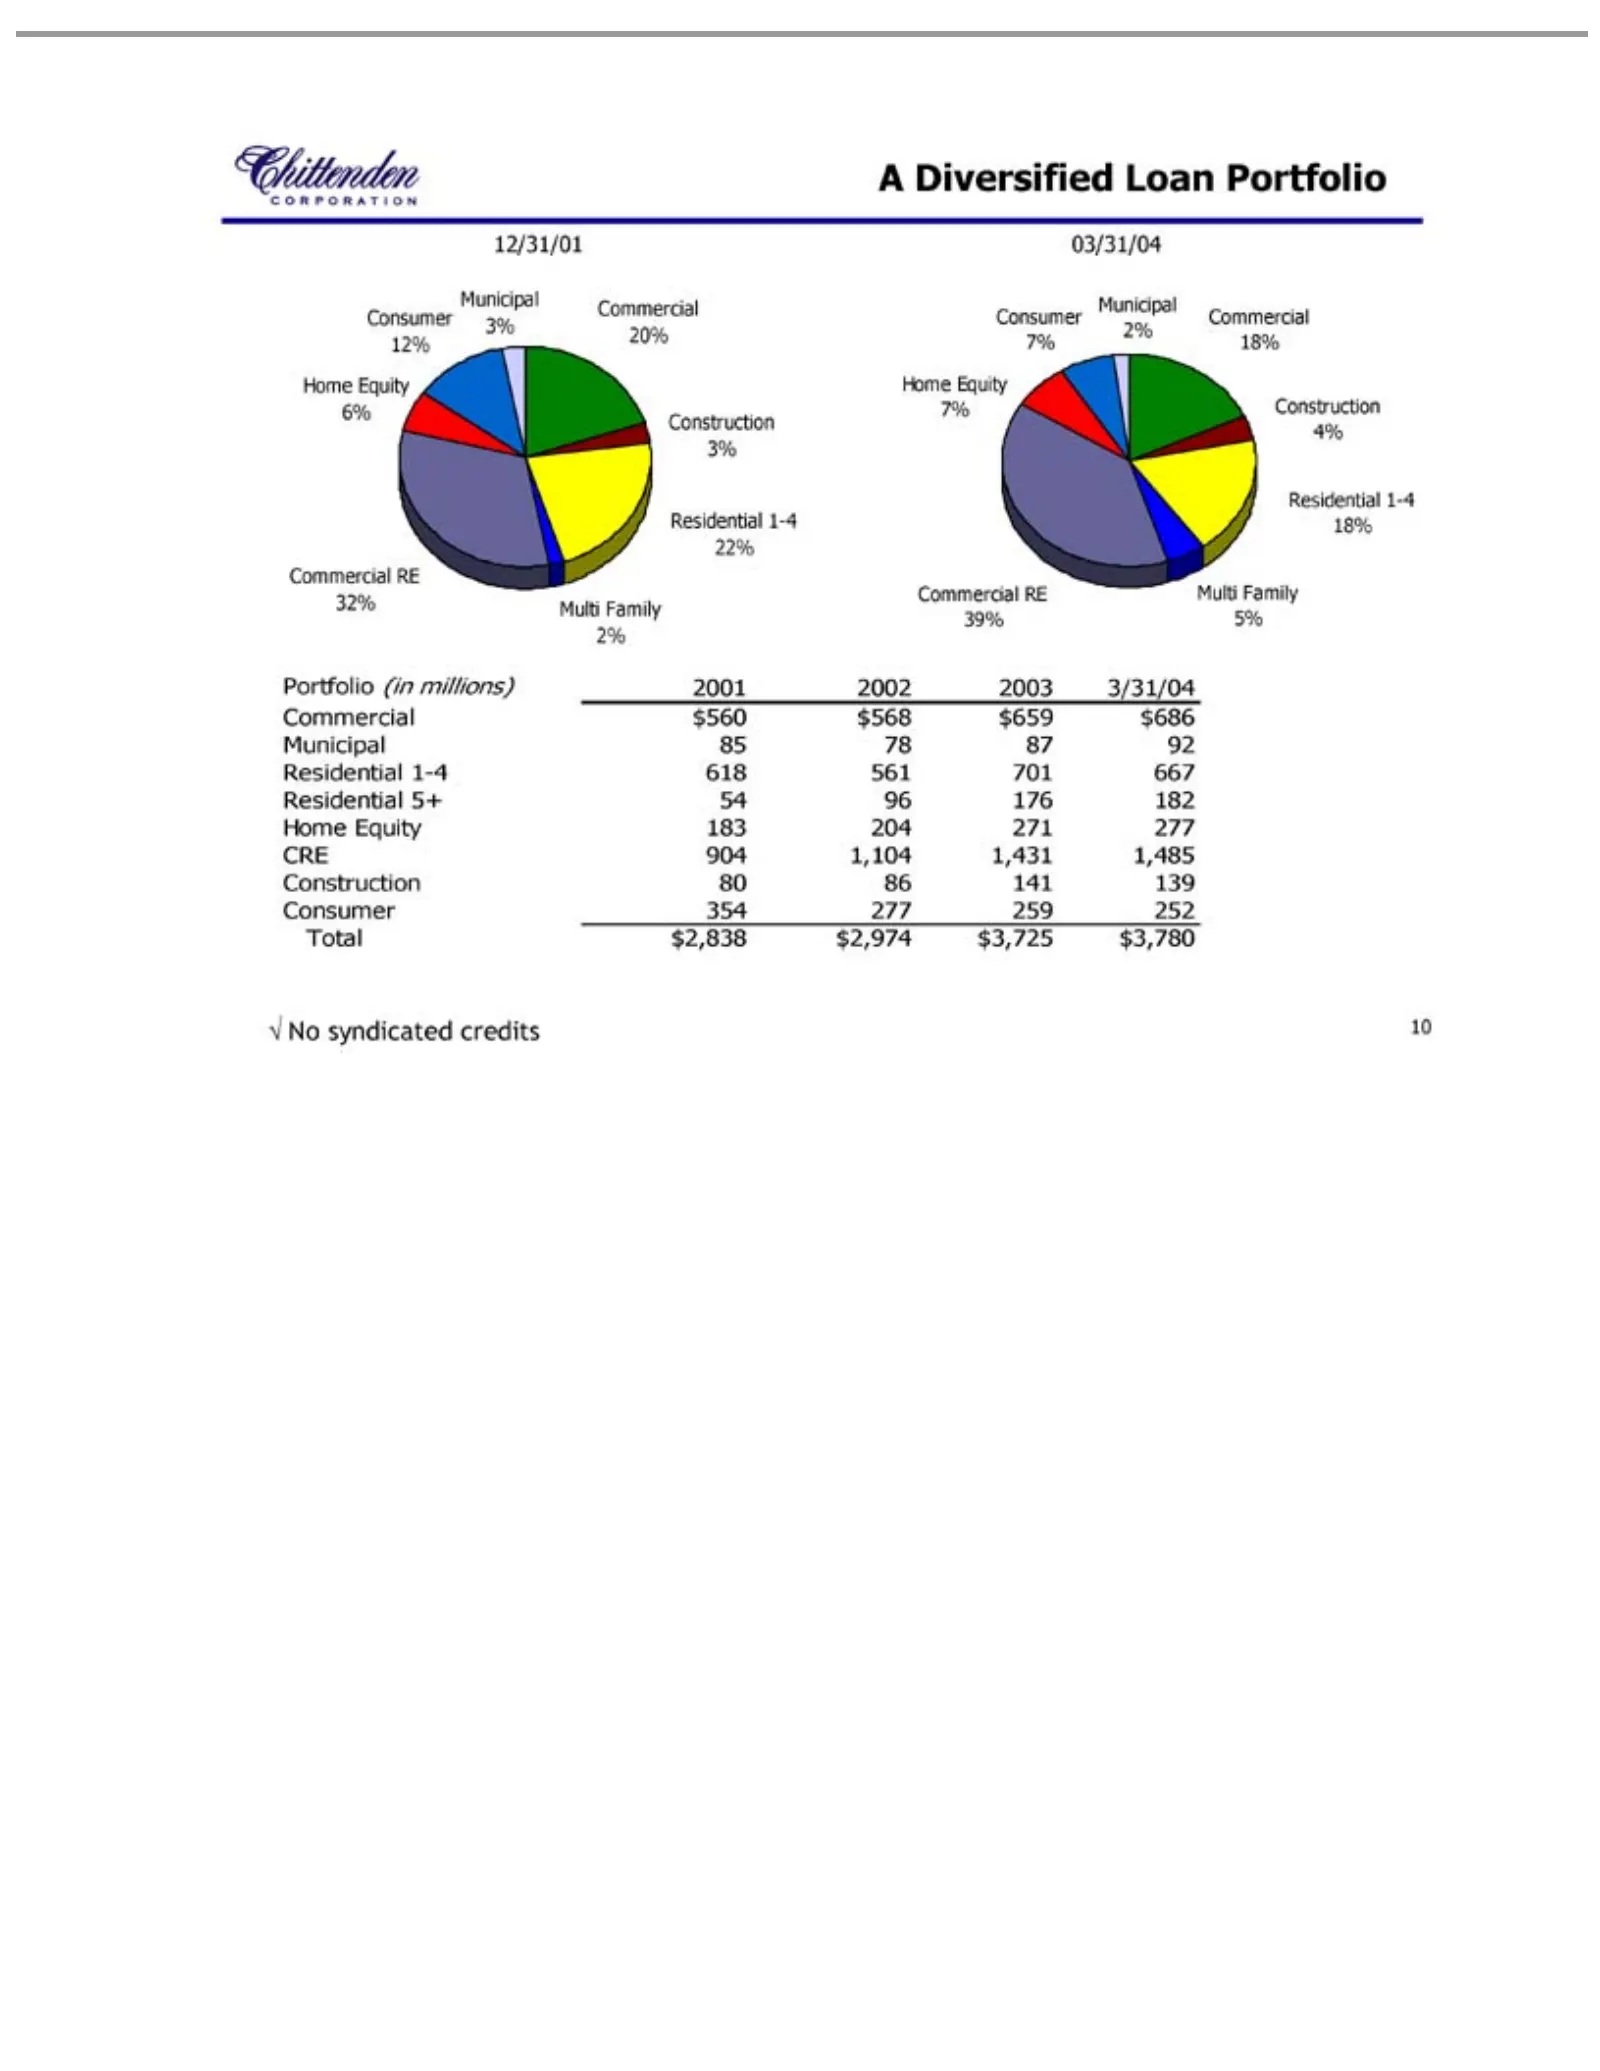
Slide 10: A Diversified Multi-Portfolio Loan Portfolio
A Diversified 12/31/01 03/31/04 Multi Portfolio Commercial Municipal Residential Home CRE Construction Consumer Total No syndicated 904 $Family Equity 2,838 (in 1,104 3% 2% 85 12% 7% 354 1-4 5+ millions) 20% 18% RE $3% 4% 80 $2,974 2% 5% 6% 7% 183 78 Loan 560 credits 54 277 22% 18% 618 1,431 86 32%
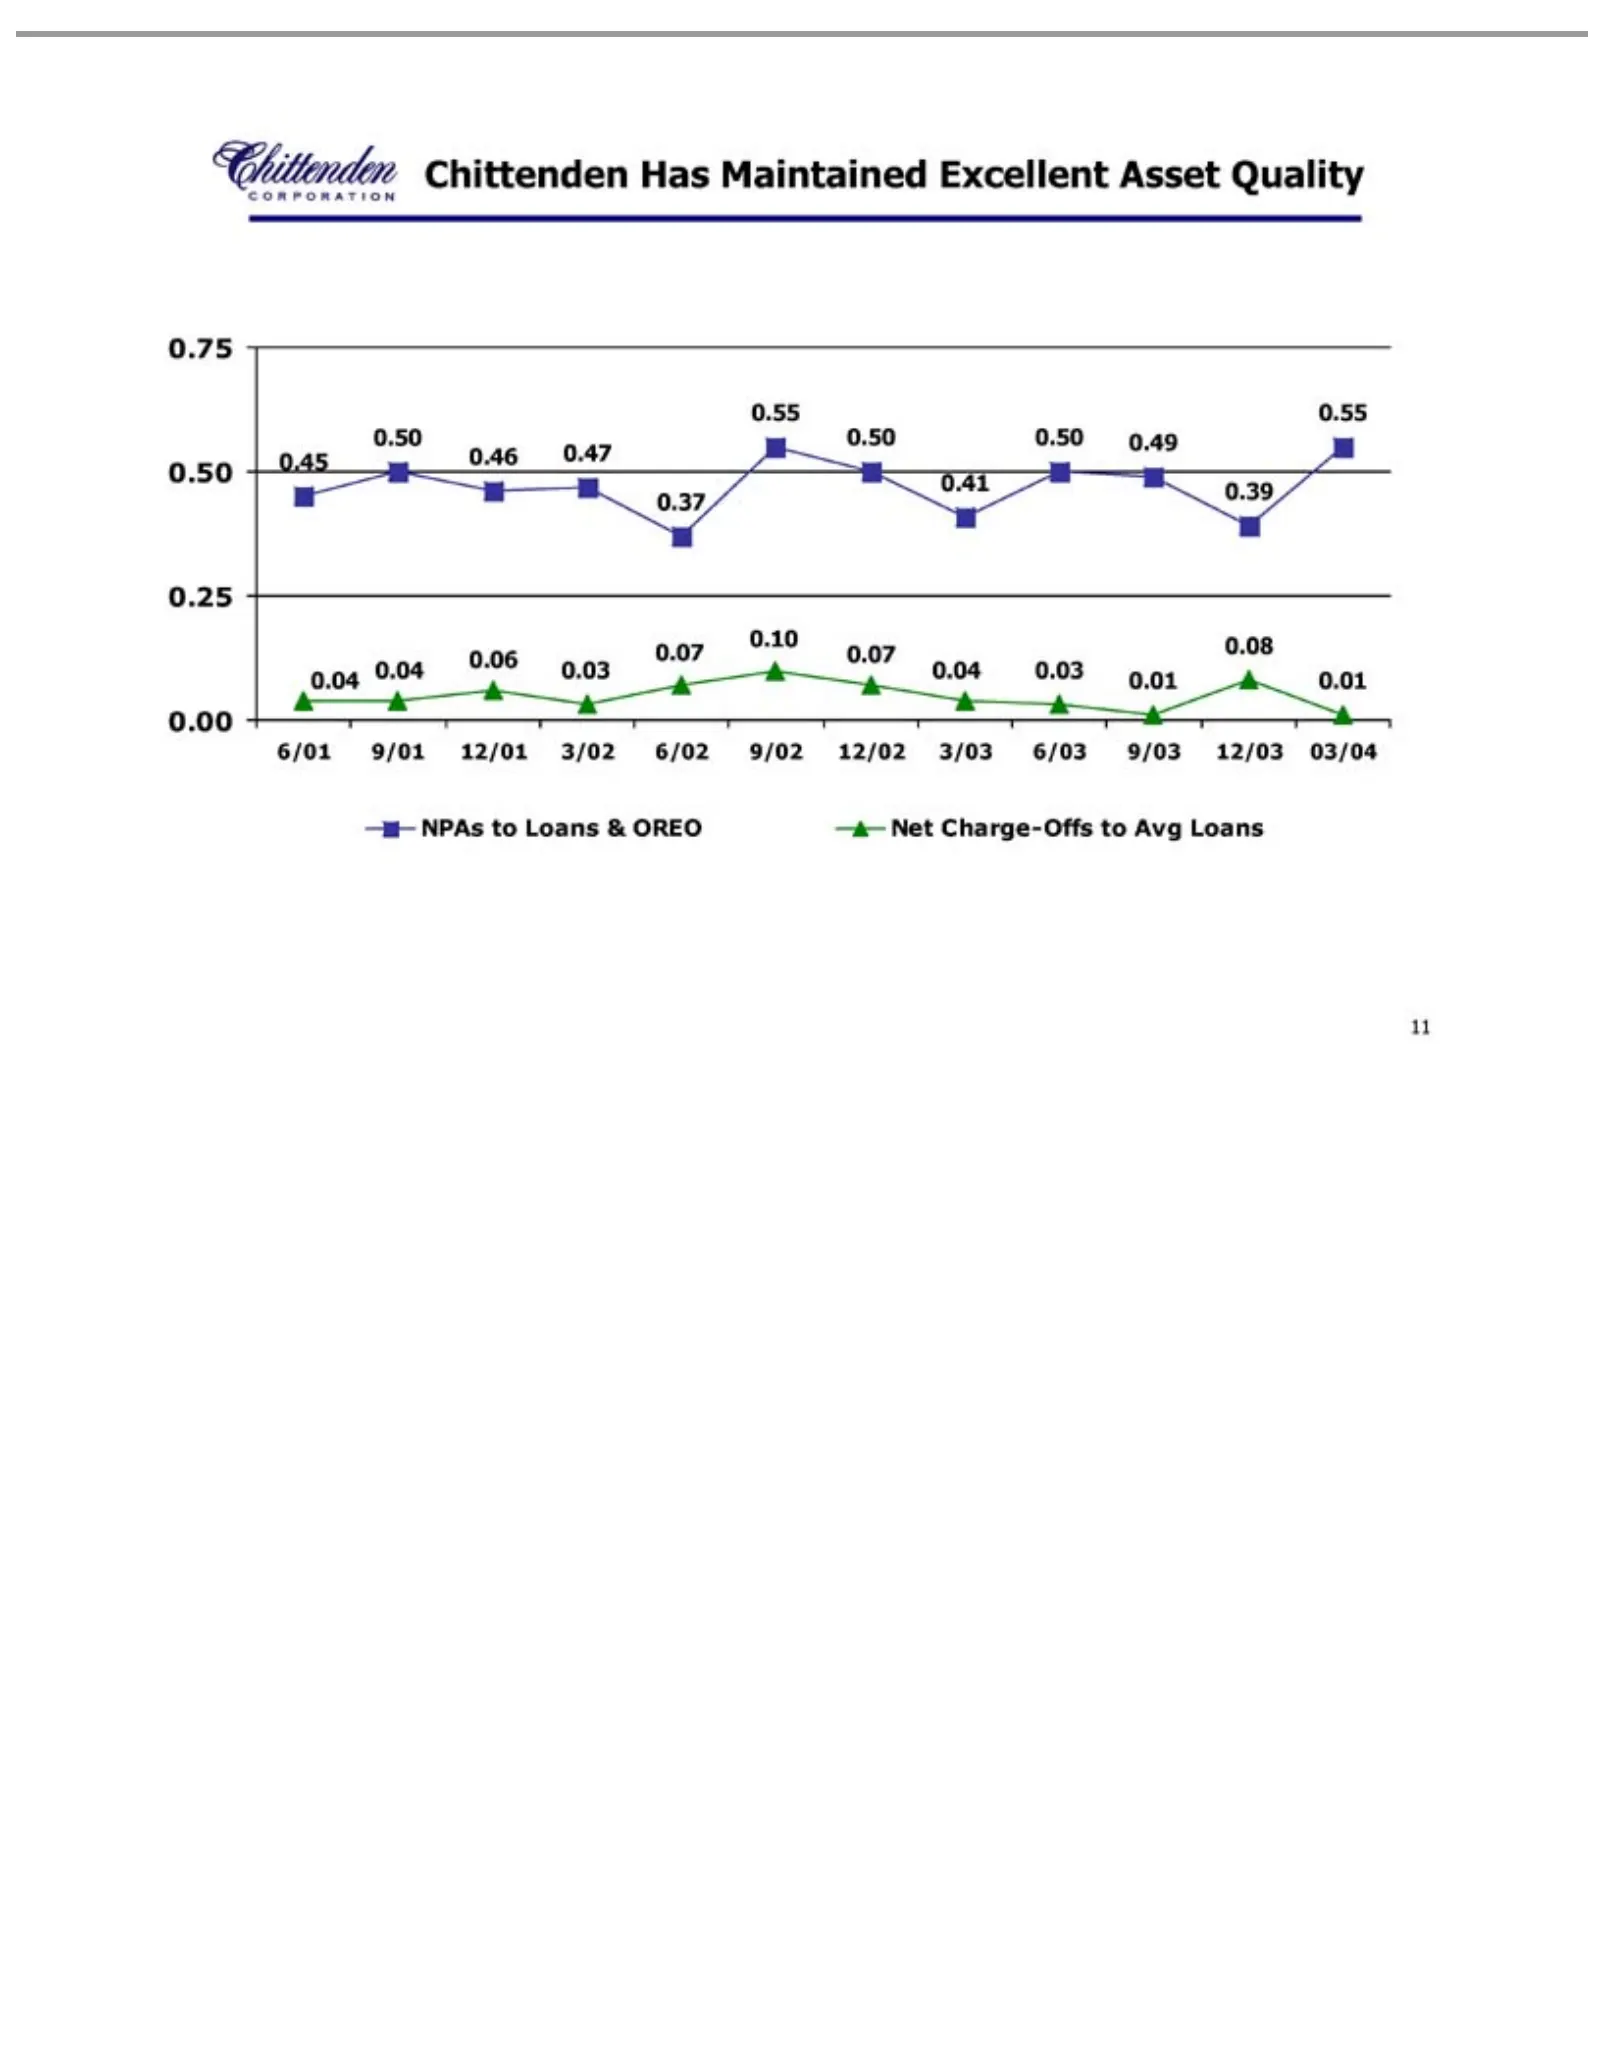
Slide 11: Chittenden NPAs to Loans
Chittenden 0.45 0.46 0.47 0.37 0.41 0.50 0.49 0.39 0.55 NPAs 11 0.06 0.10 0.07 0.04 0.03 0.08 0.01 to Loans 6/01 9/01 12/01 3/02 6/02 9/02 12/02 3/03 6/03 9/03 12/03 03/04 Has &Maintained OREO NetExcellent Charge-Offs AssettoQuality Avg Loans
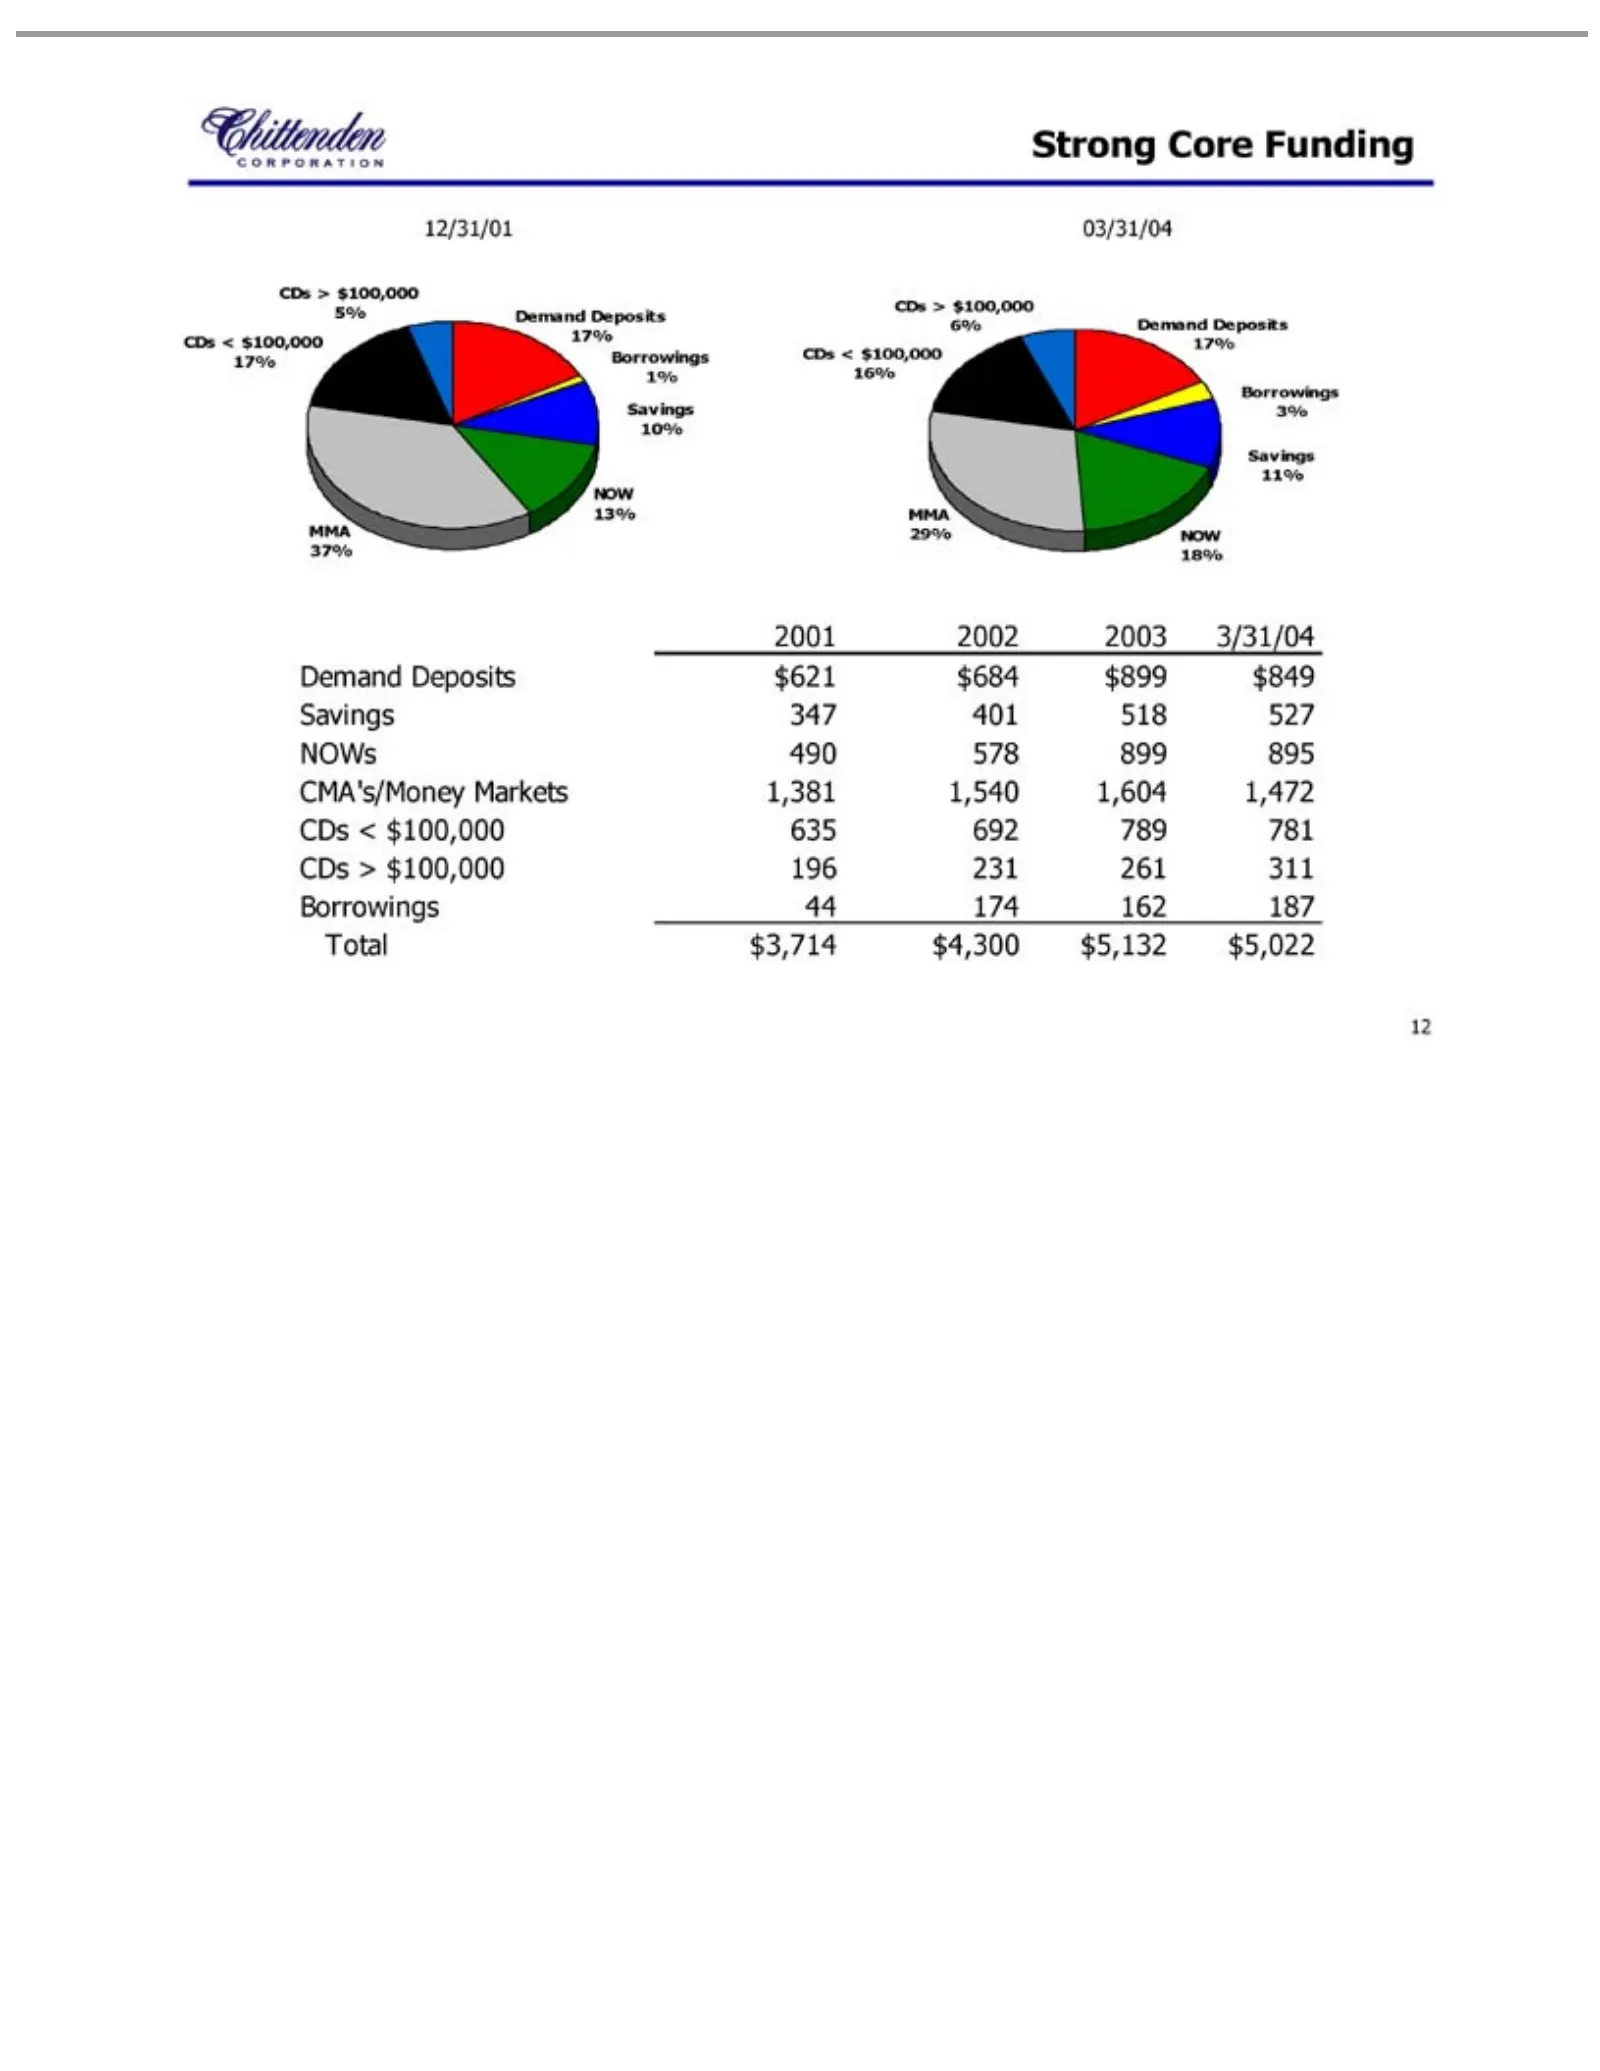
Slide 12: Strong Core Deposit Funding Markets
Strong 12/31/01 03/31/04 MMA NOW 2001 Demand Savings NOWs CMA’s/Money CDs Borrowings Total 12 <2002 >$18% 13% 37% 29% $100,000 Core 490 3,714 10% 11% 347 Deposits 2003 578 1% 3% 44 Funding 401 $4,300 Markets 174 899 3/31/04 5% 17% 16% 6% 635 196 518 17% $621 162 895 $5,132 692 231 527 $684 187 1,381
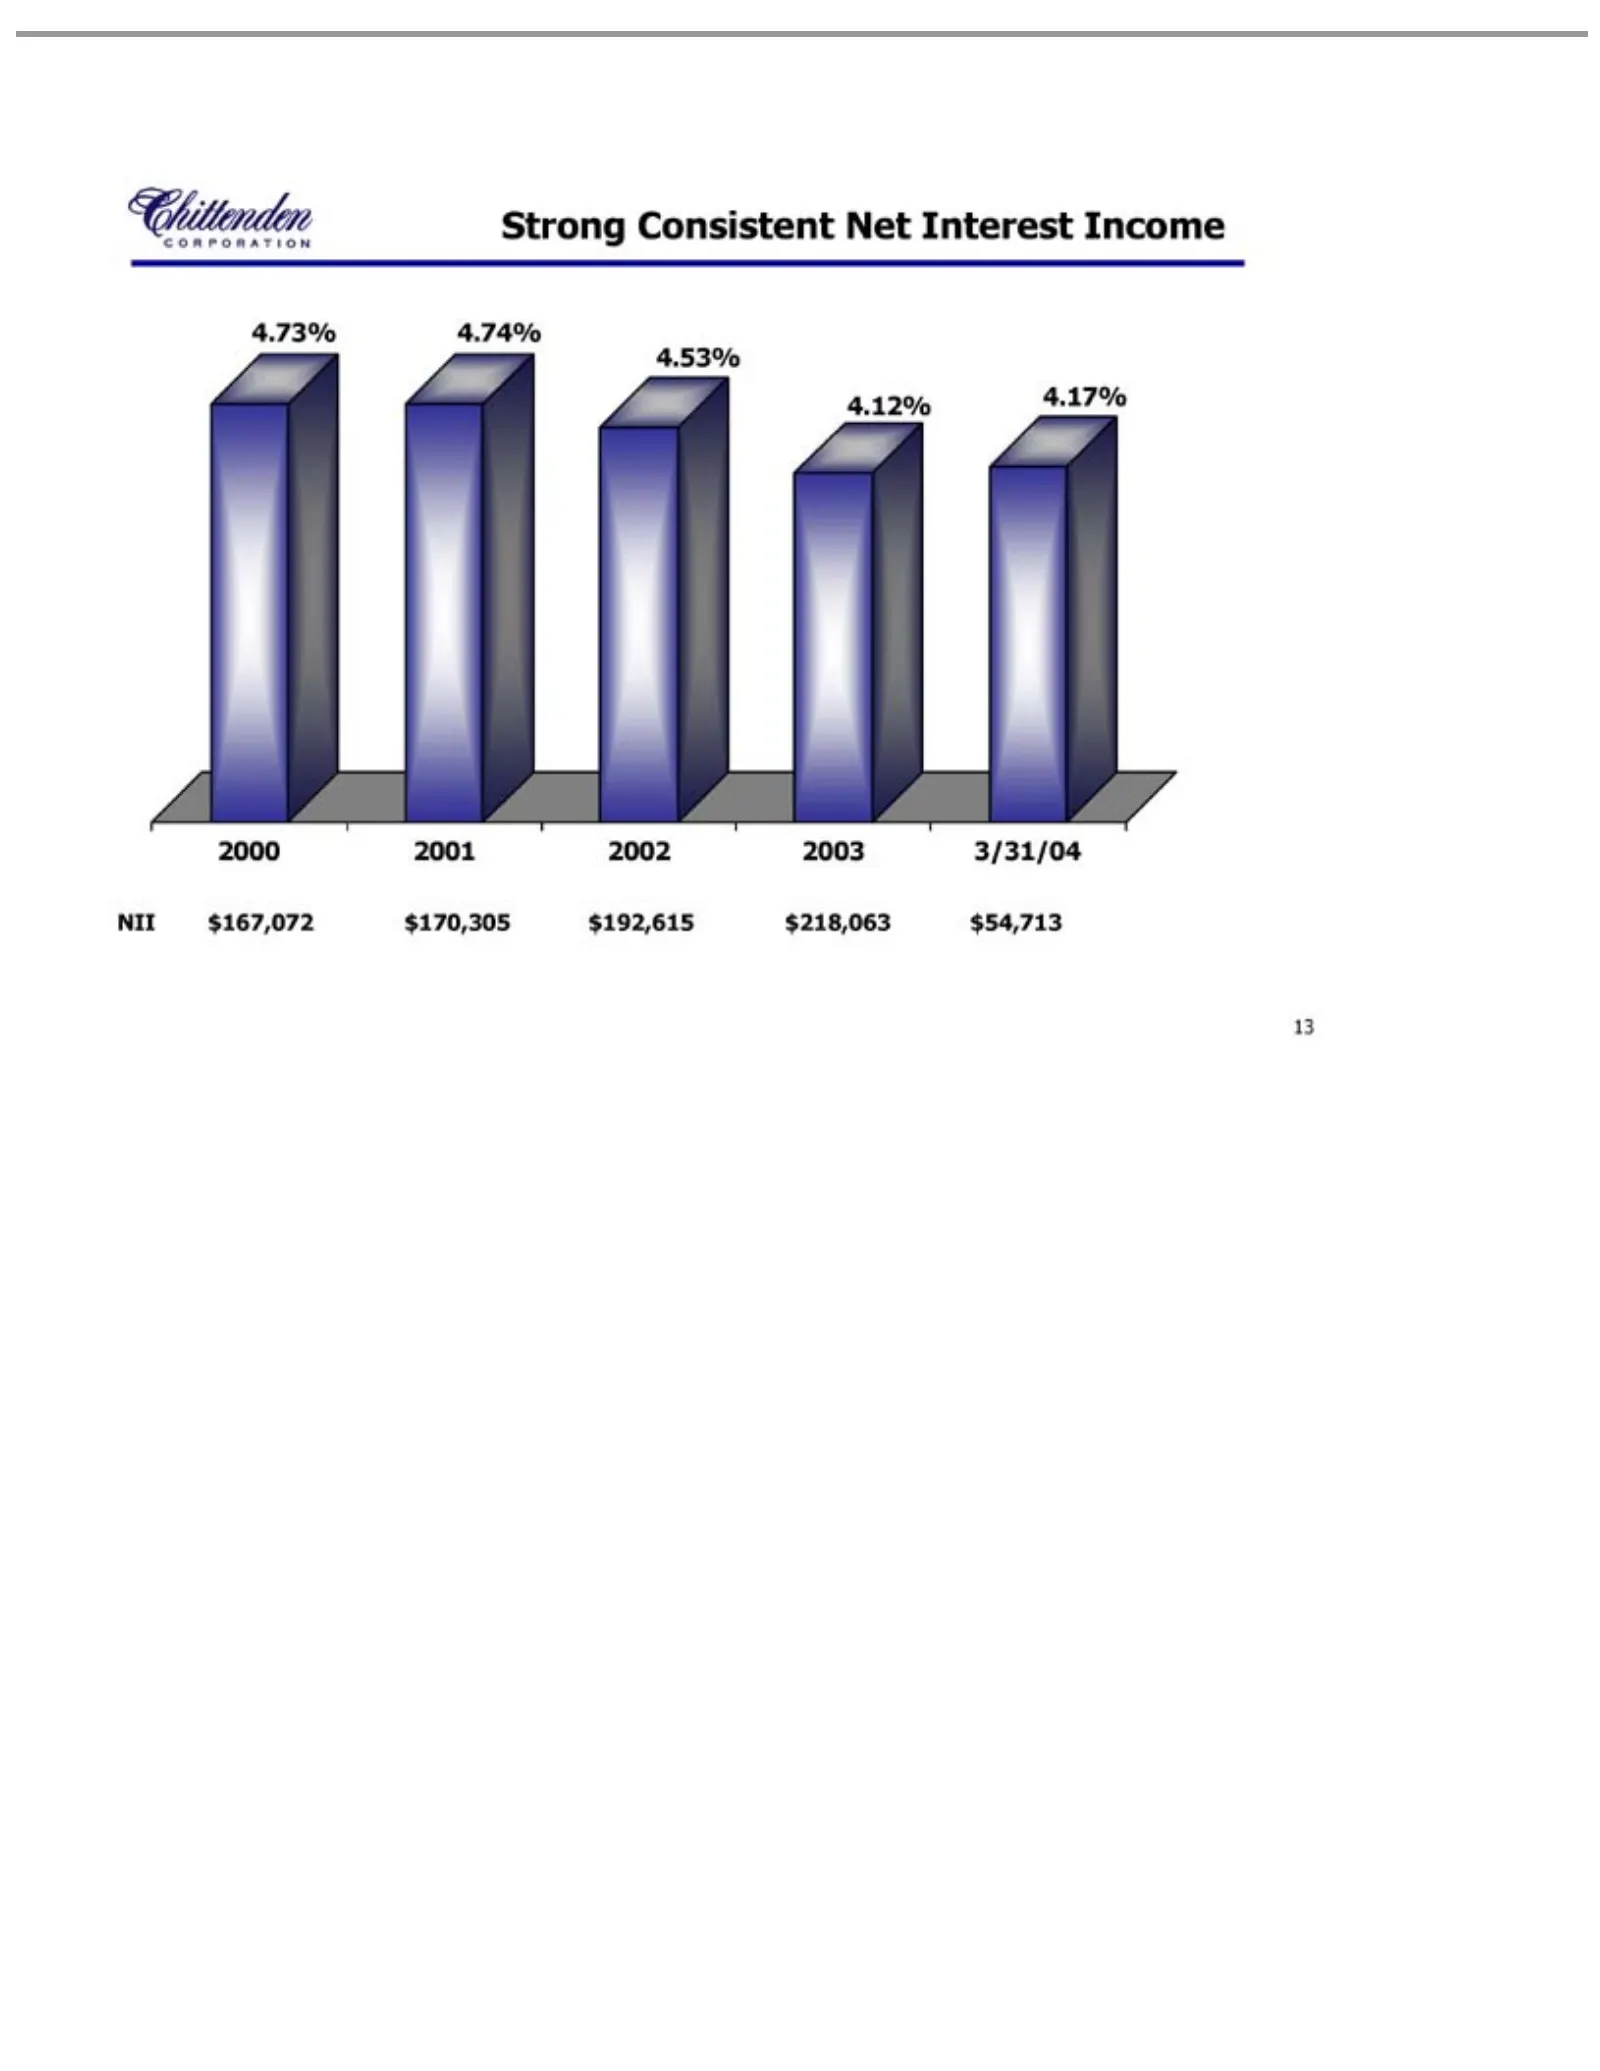
Slide 13: Strong and Consistent Net Interest Income
Strong 3/31/04 4.73% NII 4.74% 4.53% 4.12% 4.17% 13 2000 2001 2002 2003 Consistent $167,072 $170,305 $192,615 $218,063 $54,713 Net Interest Income
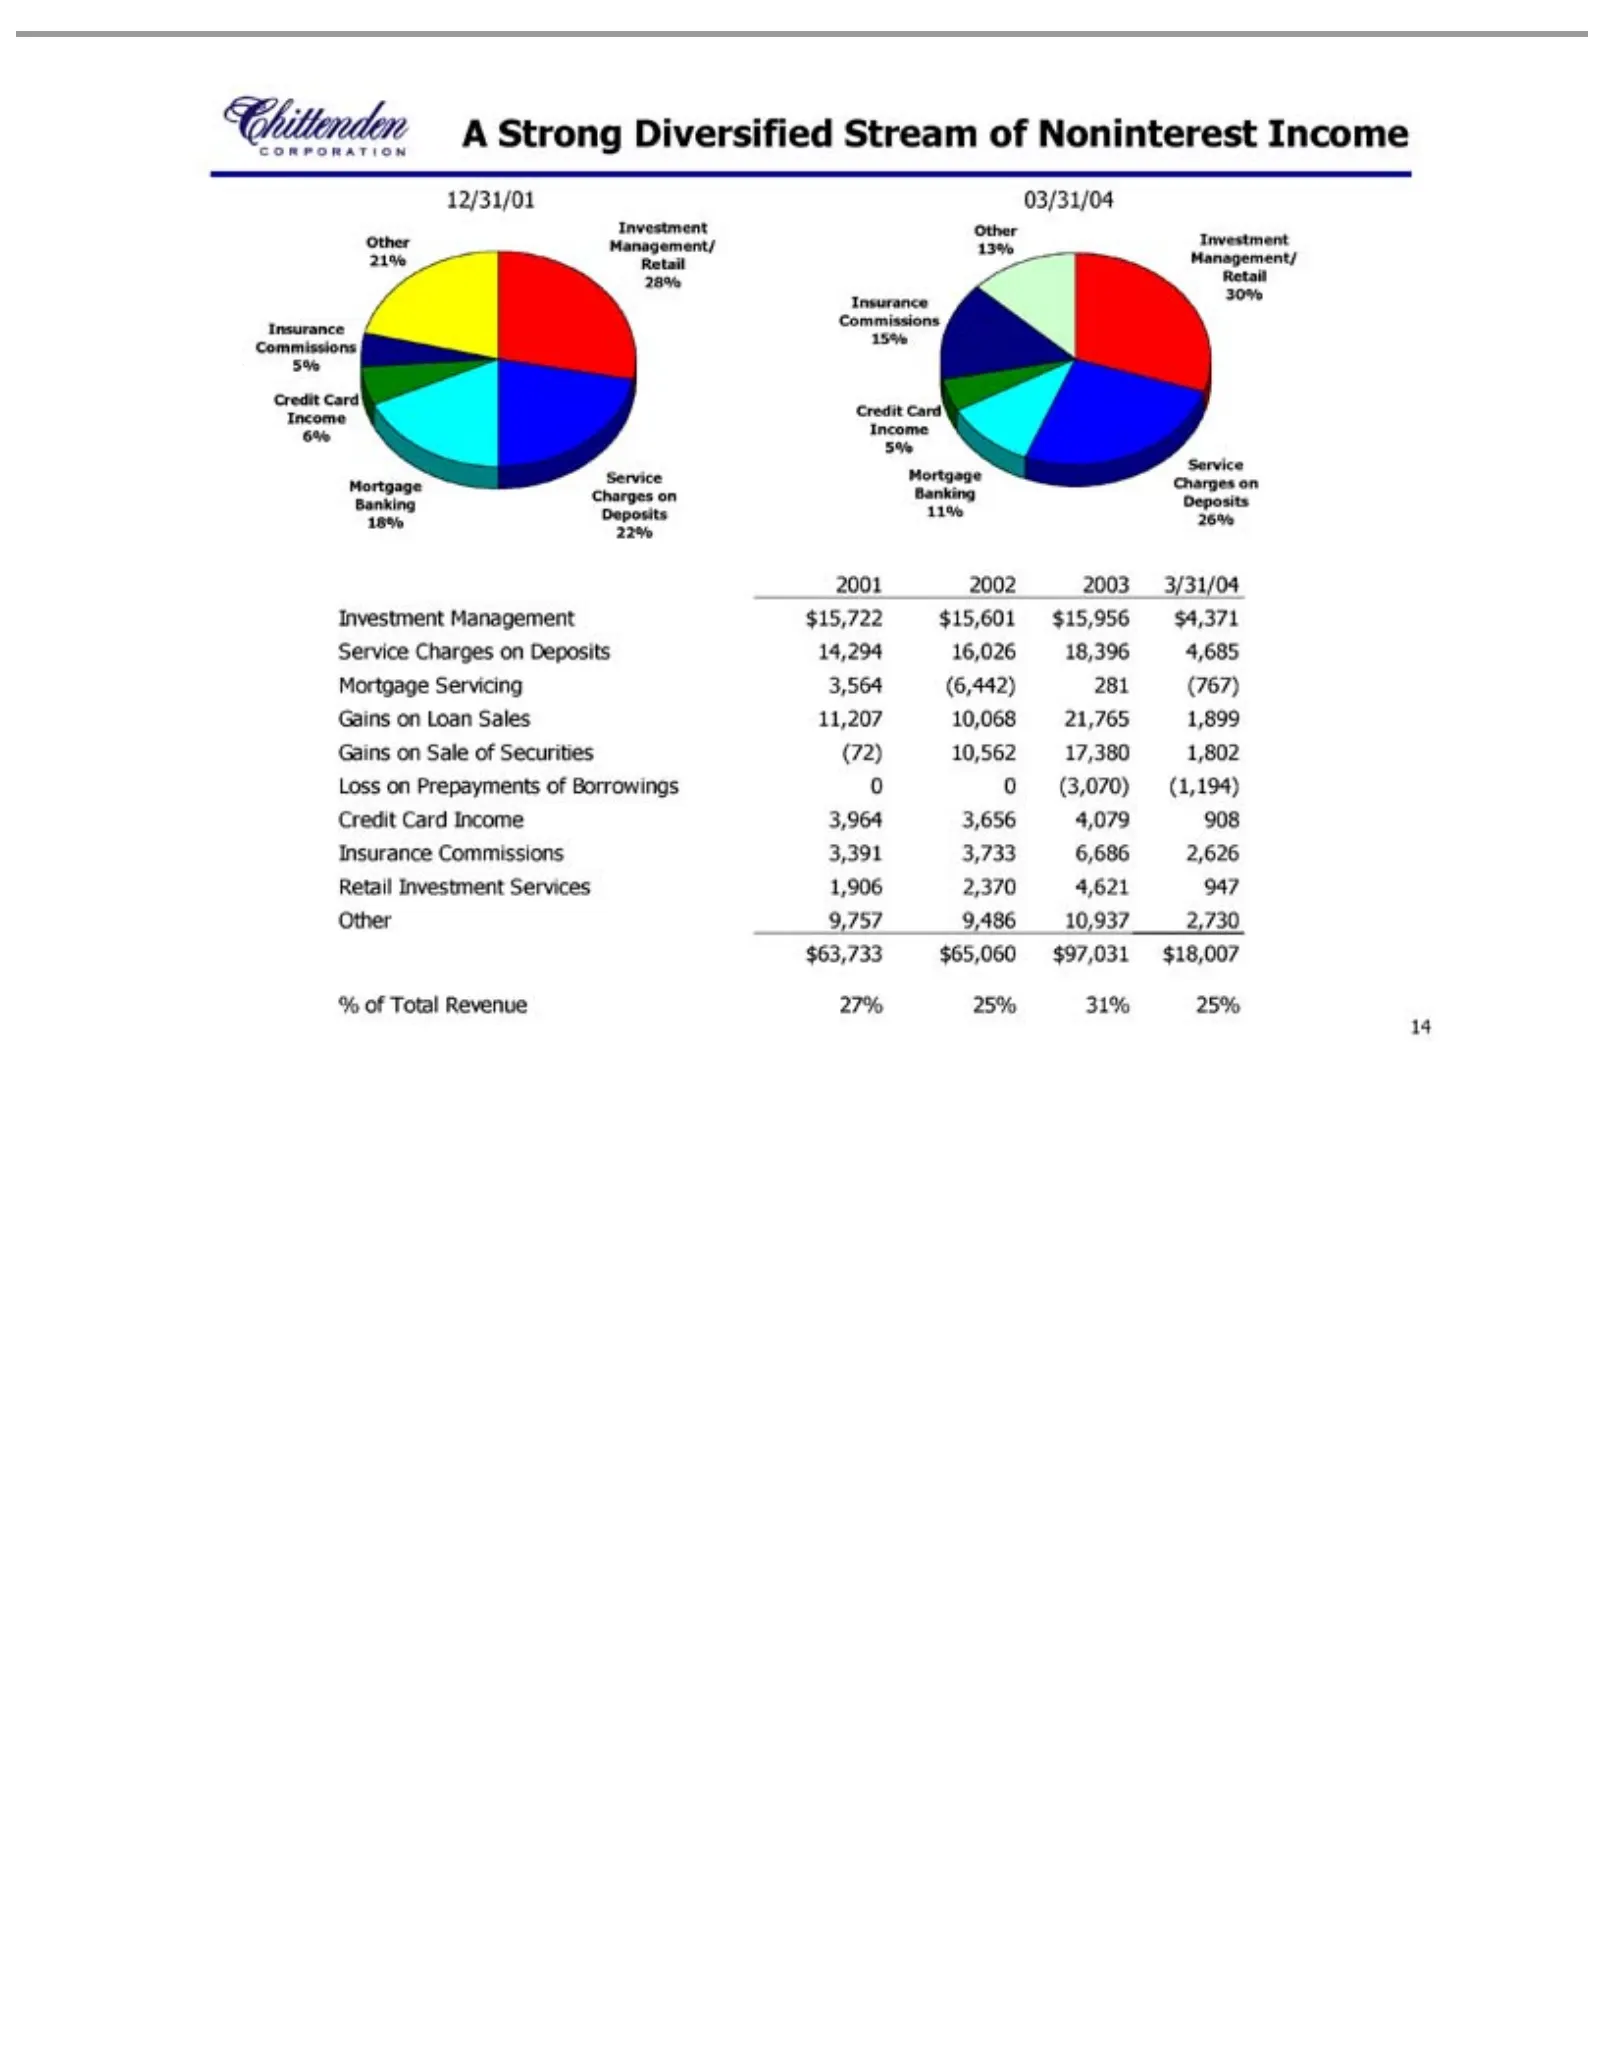
Slide 14: A Strong Diversified Investment Service Revenue Stream
A Strong 12/31/01 03/31/04 2001 Investment Service Mortgage Gains Loss Credit Insurance Retail Other $63,733 % 14 of on Total 2002 21% 13% 9,757 on Investment Card Charges Prepayments $65,060 Loan Sale Diversified Commissions Banking Servicing Revenue 2003 Management/ Management Income 9,486 ofSales
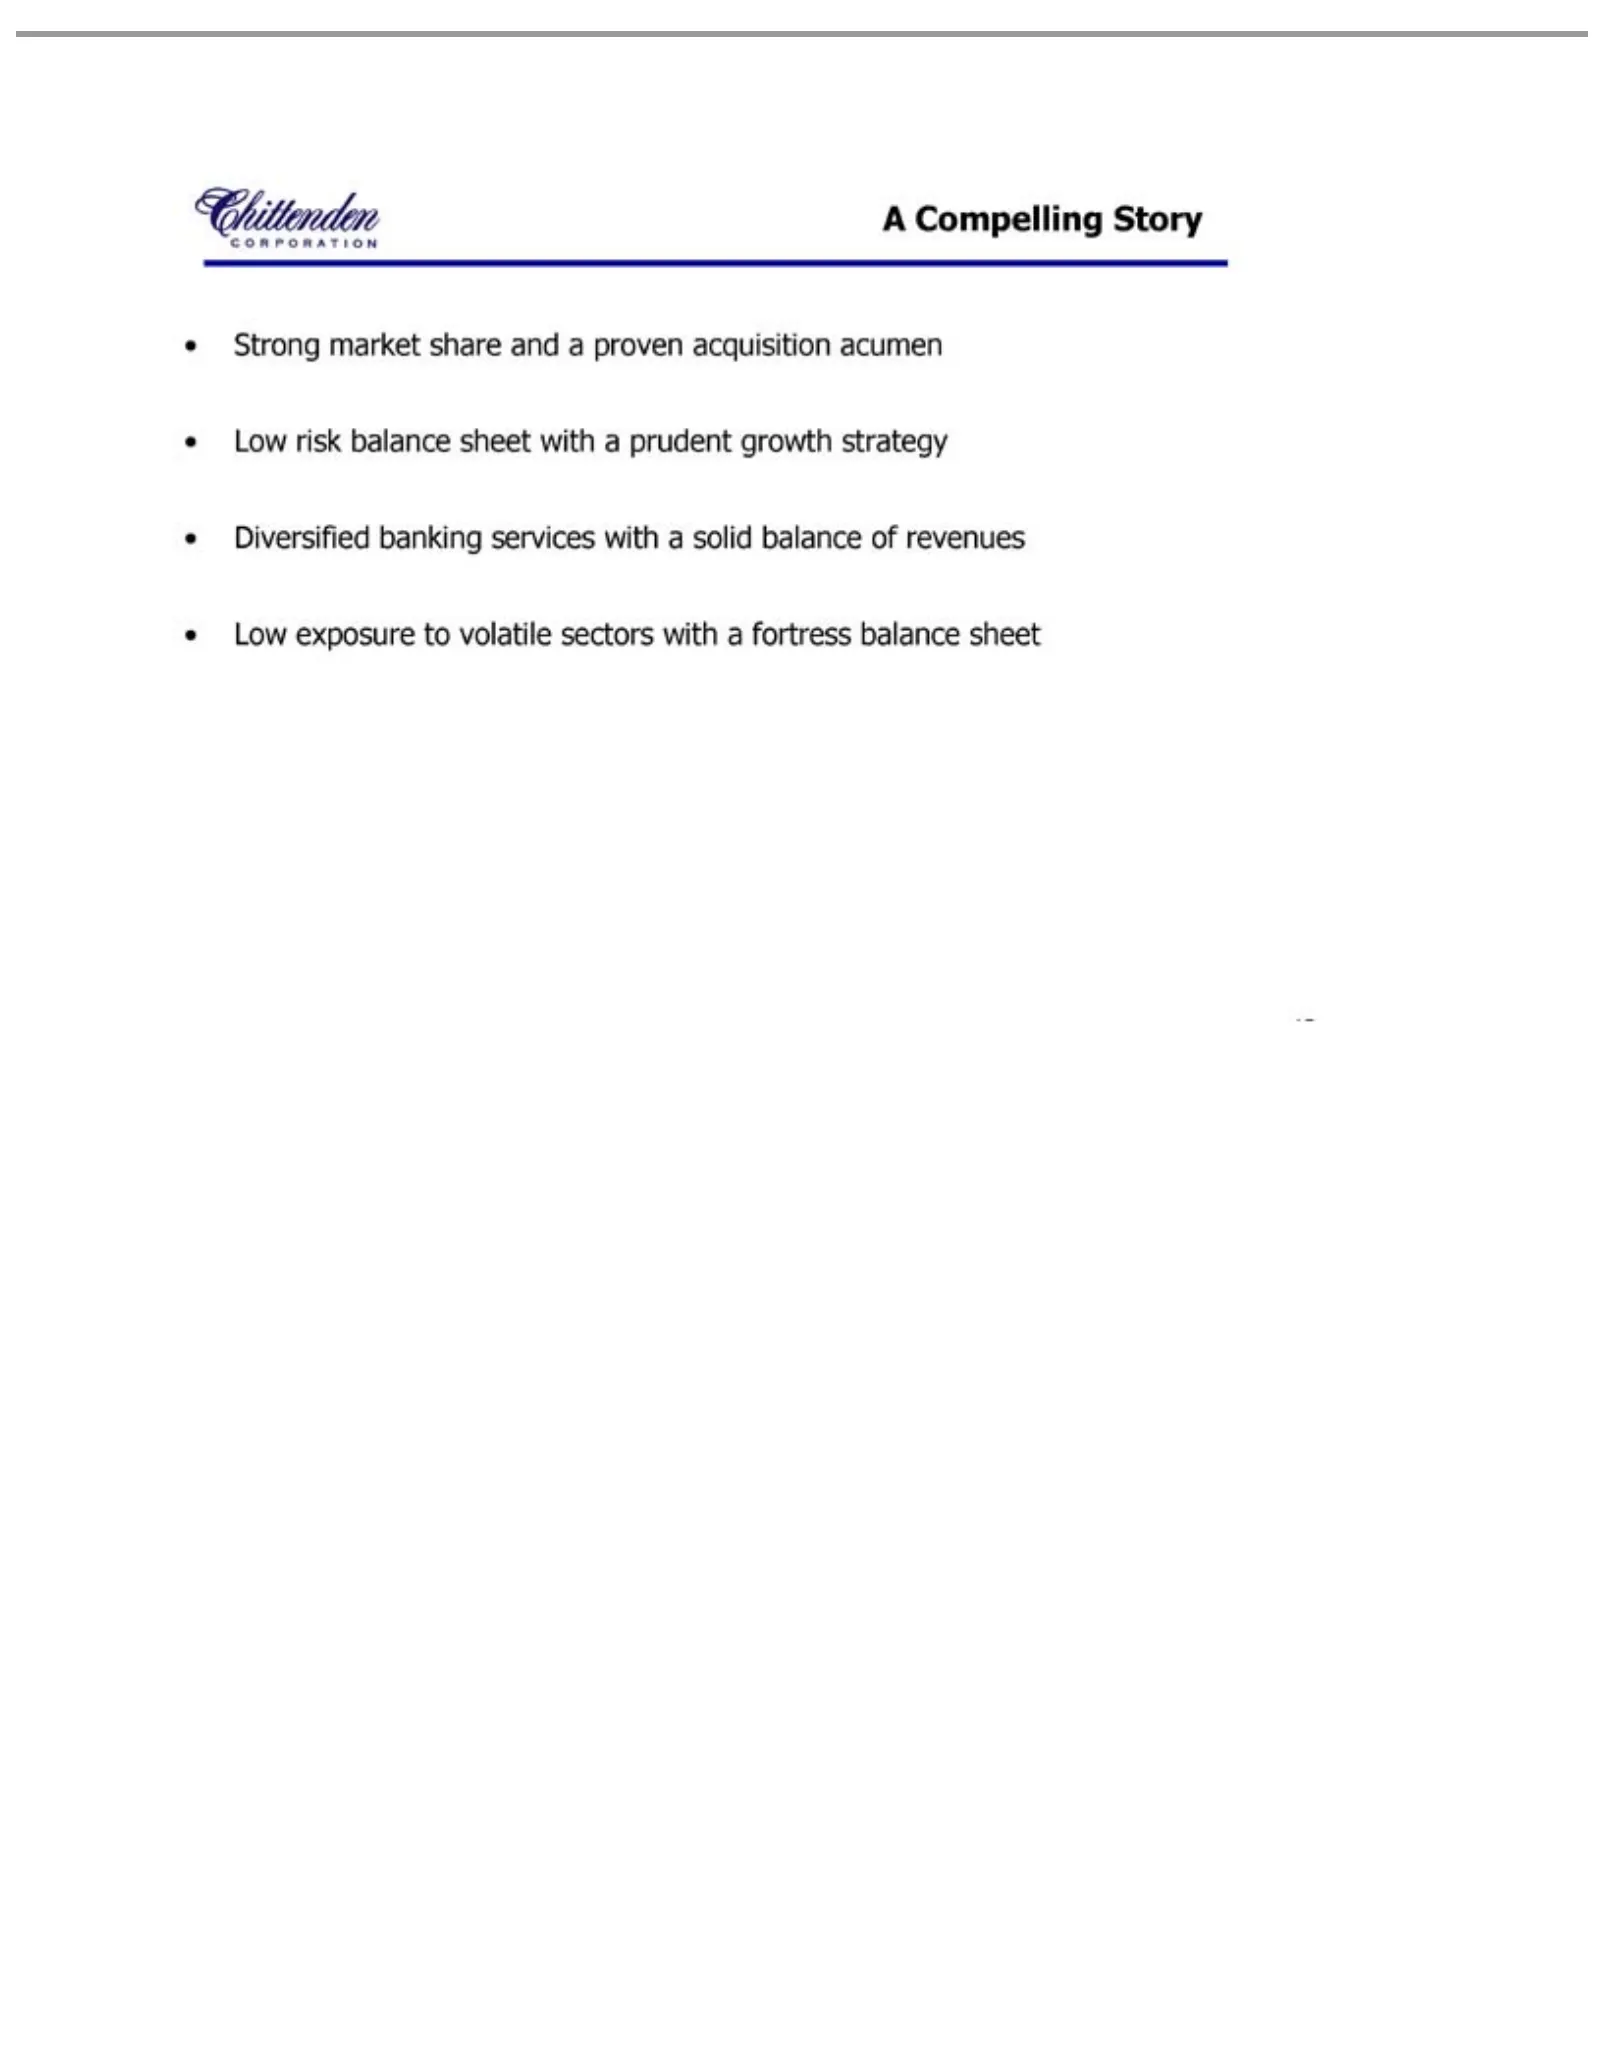
Slide 15: A Compelling Story
•ALow 15 Strong Diversified Compelling risk exposure market balance banking Story to share volatile sheet services andwith asectors proven awith prudent with acquisition a solid agrowth fortress balance acumen strategy balance of revenues sheet
Slide 16: Visit our website; forward-looking statements
Visit presentation other This which 16 our interactive arewebsite subjectservices: for contains to aa number wide www.chittendencorp.com “forward-looking range of factors of products, and statements” uncertainties latest financial which that reports could may describe cause and many future future re
Source: SEC EDGAR · 8-K filed Apr 27, 2004
More decks from Chittenden Corp
 Investor Presentation (September 2007)38 slides · Sep 7, 2007
 Merger or Acquisition (June 2007)27 slides · Jun 27, 2007
 Chittenden — Merger or Acquisition (June 2007)25 slides · Jun 27, 2007
 Merger or Acquisition (June 2007)9 slides · Jun 5, 2007
 Investor Presentation (May 2007)36 slides · May 14, 2007
 Investor Presentation (February 2007)37 slides · Feb 16, 2007