Coface SA · EURONEXT:COFA
Coface SA — Coface Country Risk Conference 2023, Hong Kong
18 slides from Coface SA's conference presentation, May 18, 2023

Slide 1: Country Risk 2023, Hong Kong
coface Pe 2023 COUNTRY RISK 18 MAY 2023, HONG KONG
Slide 2: Global Economic Outlook: From Excessive Pessimism to Excessive Optimism
GLOBAL ECONOMIC OUTLOOK: FROM EXCESSIVE PESSIMISM TO EXCESSIVE OPTIMISM J E A N - C H R I S TO P H E C A F F E T G R O U P C H I E F E C O N O M I S T, C O FA C E
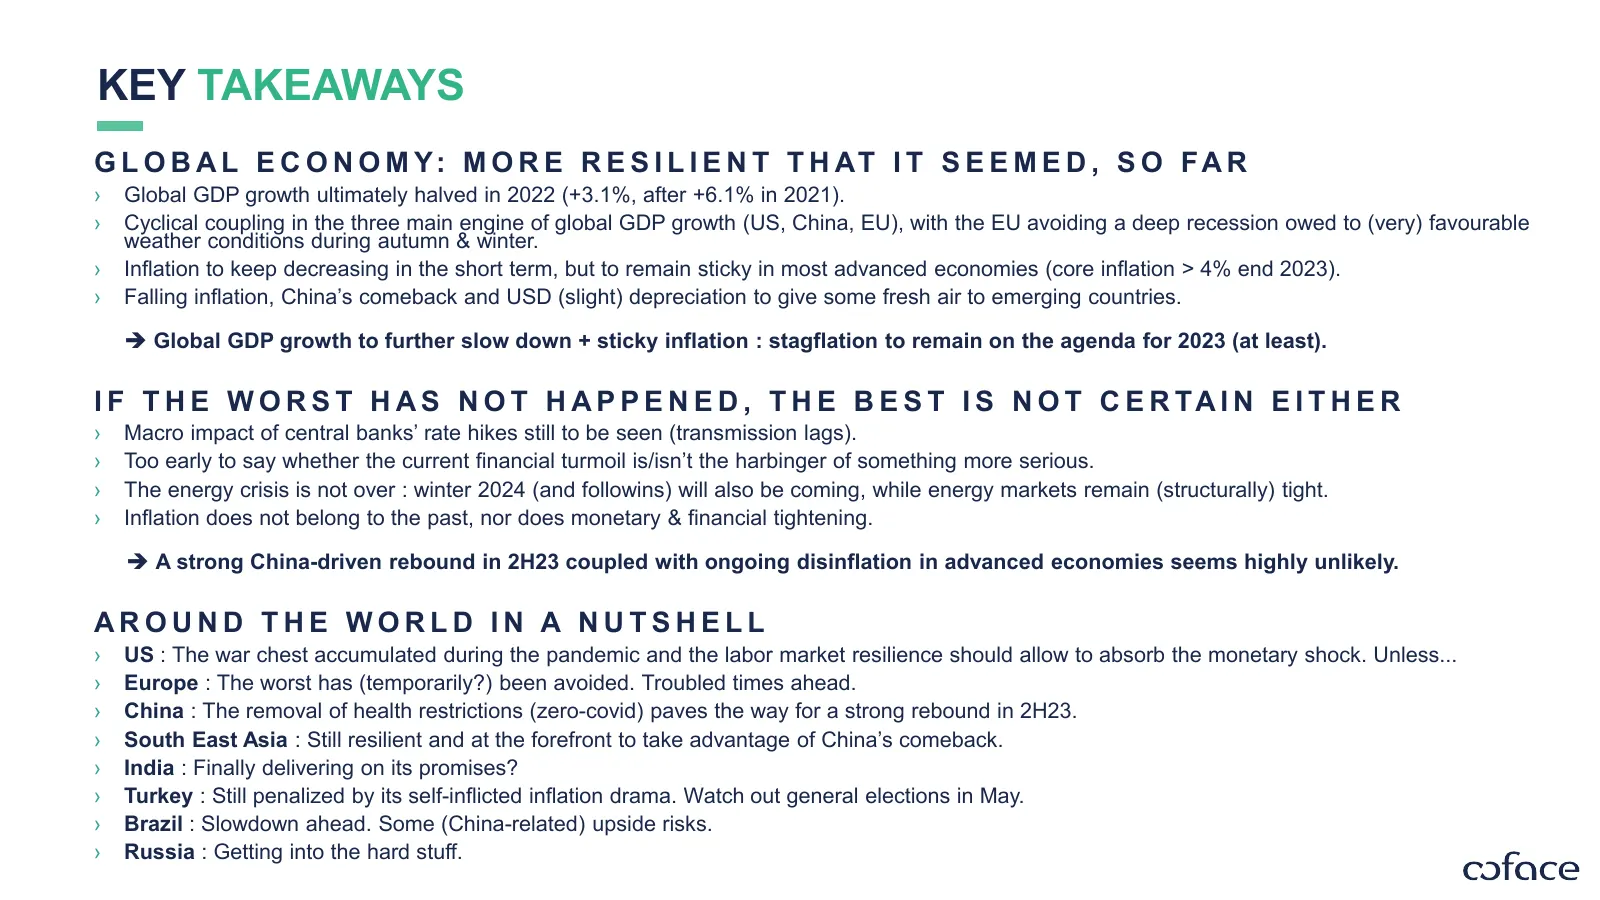
Slide 3: Key Takeaways
KEY TAKEAWAYS G L O B A L E C O N O M Y : M O R E R E S I L I E N T T H AT I T S E E M E D , S O F A R › Global GDP growth ultimately halved in 2022 (+3.1%, after +6.1% in 2021). › Cyclical coupling in the three main engine of global GDP growth (US, China, EU), with the EU avoiding a deep recession
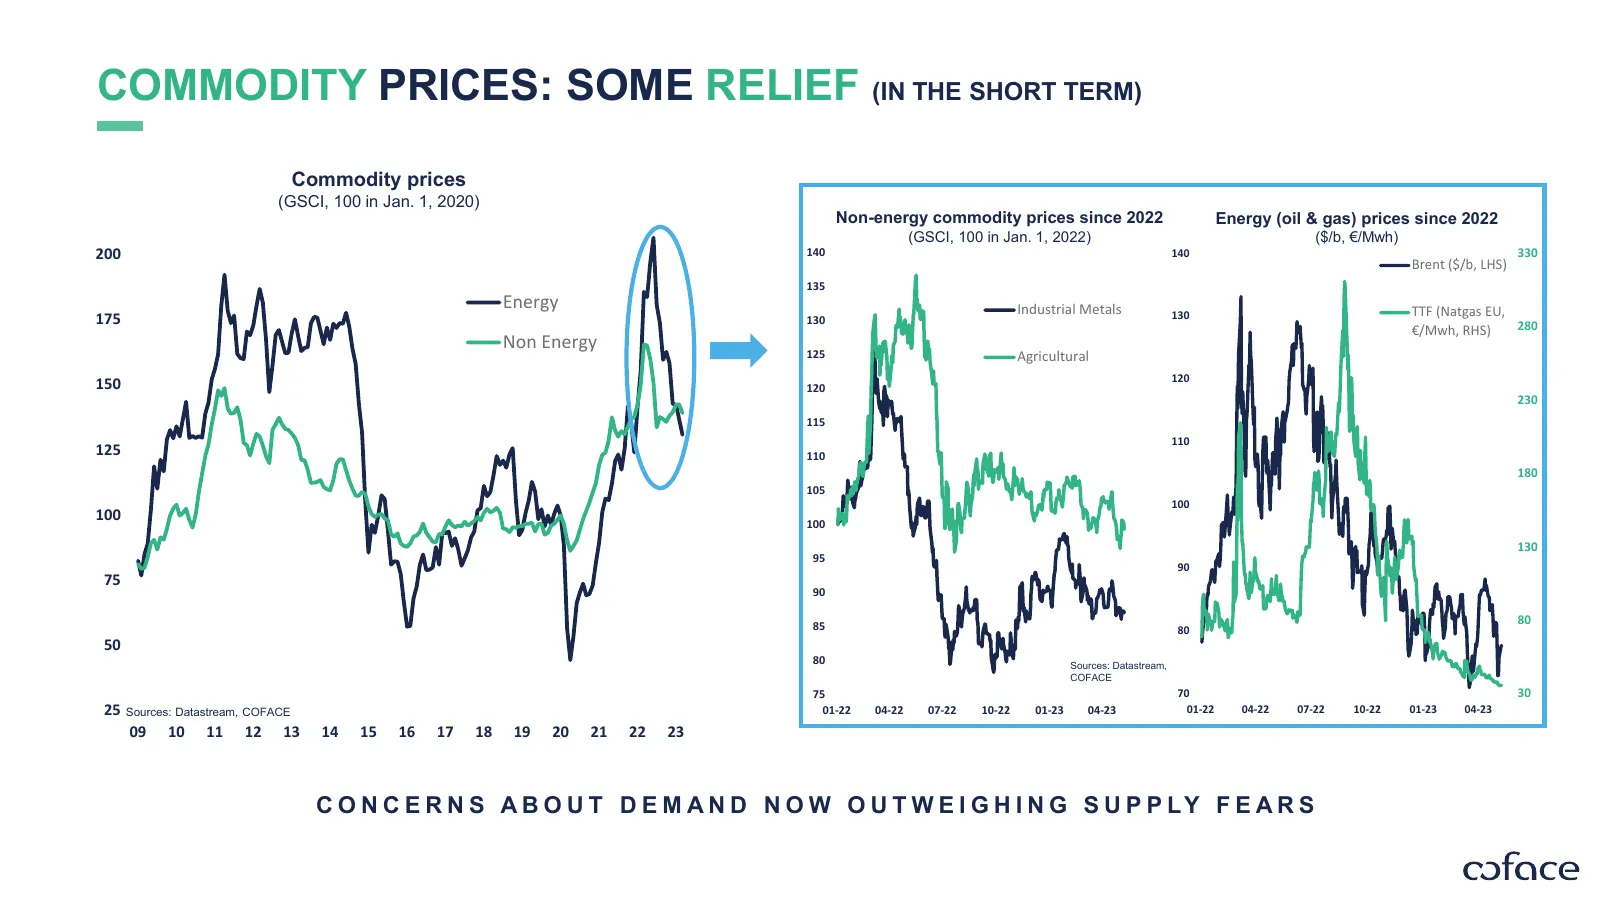
Slide 4: Commodity Prices: Some Relief (In the Short Term)
COMMODITY PRICES: SOME RELIEF (IN THE SHORT TERM) Commodity prices (GSCI, 100 in Jan. 1, 2020) Non-energy commodity prices since 2022 Energy (oil & gas) prices since 2022 (GSCI, 100 in Jan. 1, 2022) ($/b, €/Mwh) 200 140 140 330 Brent ($/b, LHS) 135 Energy Industrial Metals TTF (Natgas EU, 175 130 13
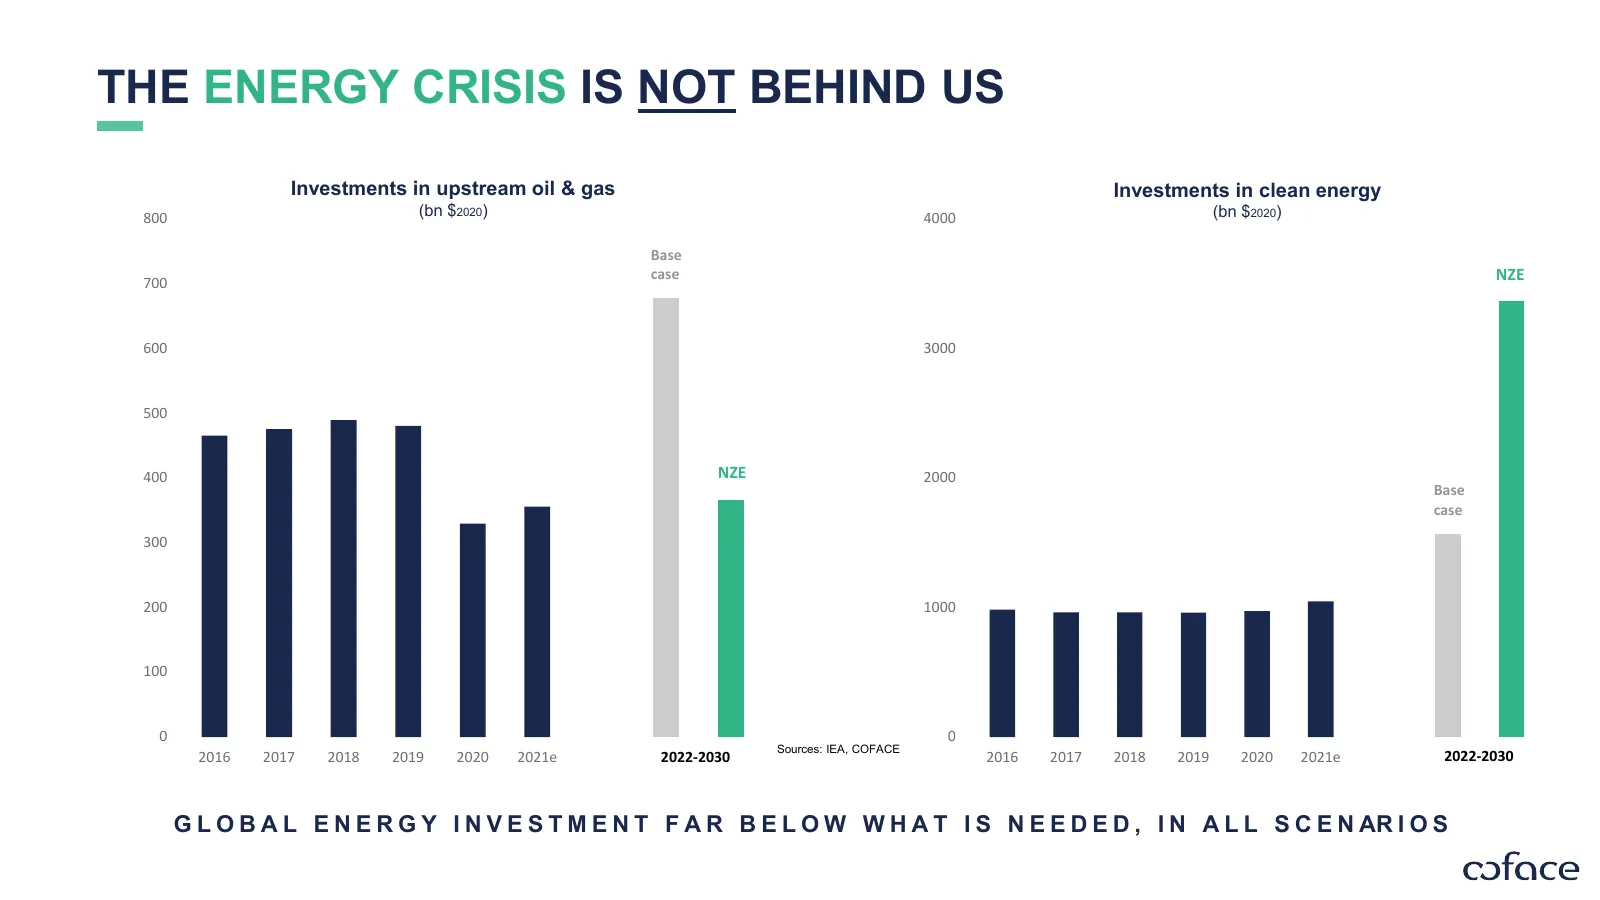
Slide 5: The Energy Crisis Is Not Behind Us
THE ENERGY CRISIS IS NOT BEHIND US Investments in upstream oil & gas Investments in clean energy 800 (bn $2020) 4000 (bn $2020) Base 700 case NZE 600 3000 500 400 NZE 2000 Base case 300 200 1000 100 0 0 Sources: IEA, COFACE 2016 2017 2018 2019 2020 2021e 2022-2030 2016 2017 2018 2019 2020 2021e 2022
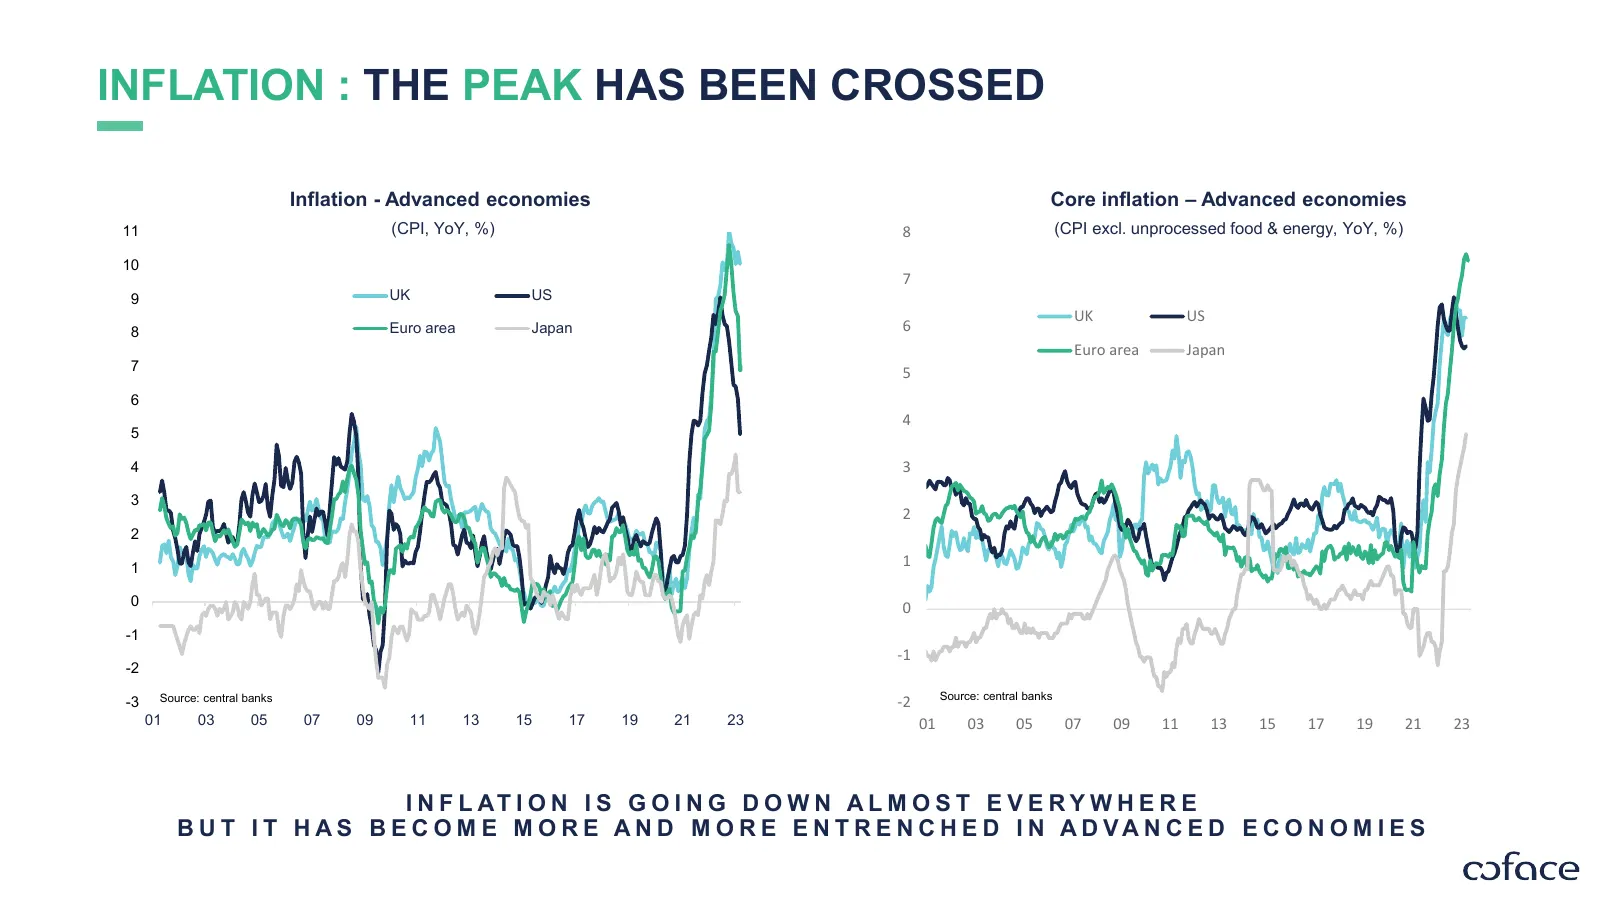
Slide 6: Inflation: The Peak Has Been Crossed
INFLATION : THE PEAK HAS BEEN CROSSED Inflation - Advanced economies Core inflation – Advanced economies 11 (CPI, YoY, %) 8 (CPI excl. unprocessed food & energy, YoY, %) 10 7 9 UK US UK US 8 Euro area Japan 6 Euro area Japan 7 5 6 4 5 4 3 3 2 2 1 1 0 0 -1 -1 -2 Source: central banks Source: central
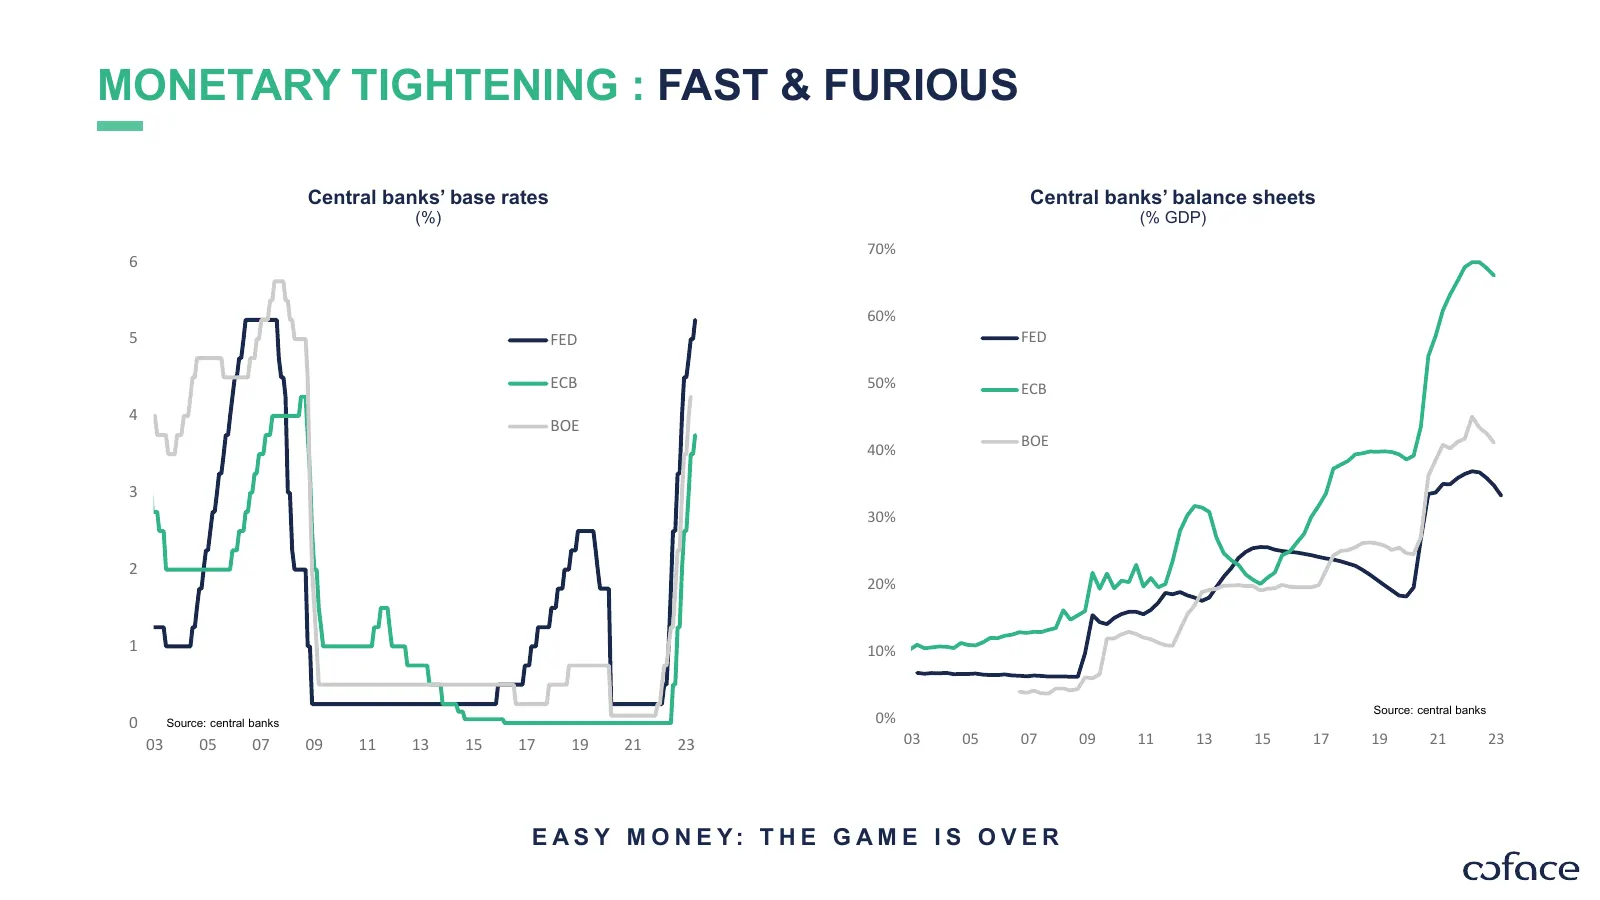
Slide 7: Monetary Tightening: Fast & Furious
MONETARY TIGHTENING : FAST & FURIOUS Central banks’ base rates Central banks’ balance sheets (%) (% GDP) 70% 6 60% 5 FED FED ECB 50% ECB 4 BOE BOE 40% 3 30% 2 20% 1 10% Source: central banks 0 Source: central banks 0% 03 05 07 09 11 13 15 17 19 21 23 03 05 07 09 11 13 15 17 19 21 23 E A S Y M O N E
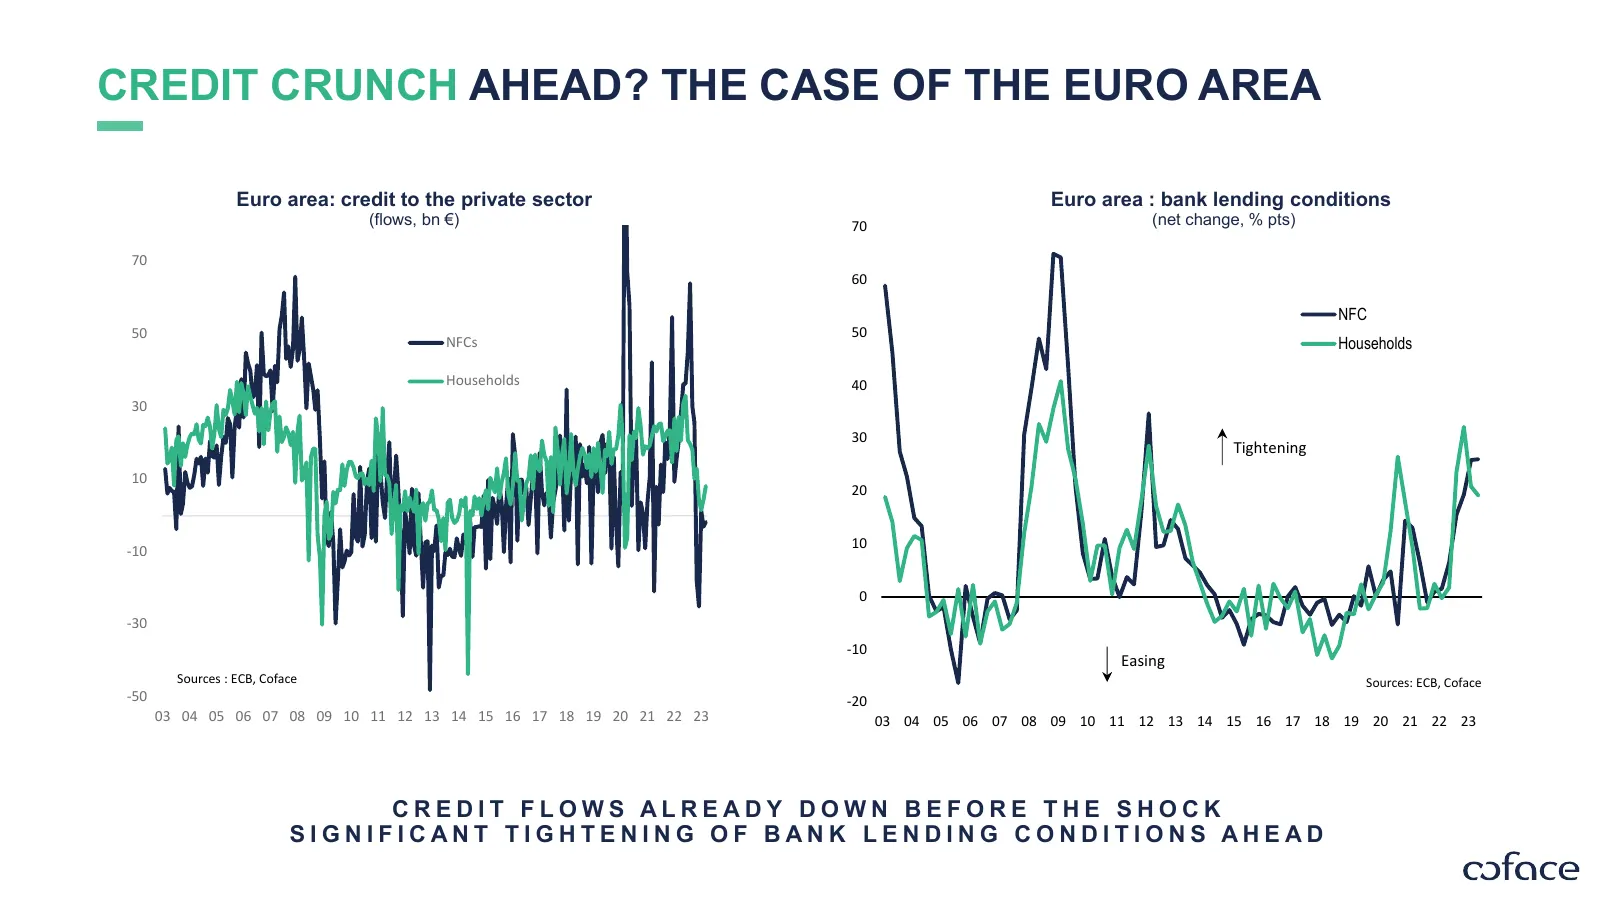
Slide 8: Credit Crunch Ahead? The Case of the Euro Area
CREDIT CRUNCH AHEAD? THE CASE OF THE EURO AREA Euro area: credit to the private sector Euro area : bank lending conditions (flows, bn €) 70 (net change, % pts) 70 60 NFC 50 50 NFCs Households Households 40 30 30 Tightening 10 20 10 -10 0 -30 -10 Easing Sources : ECB, Coface Sources: ECB, Coface -50
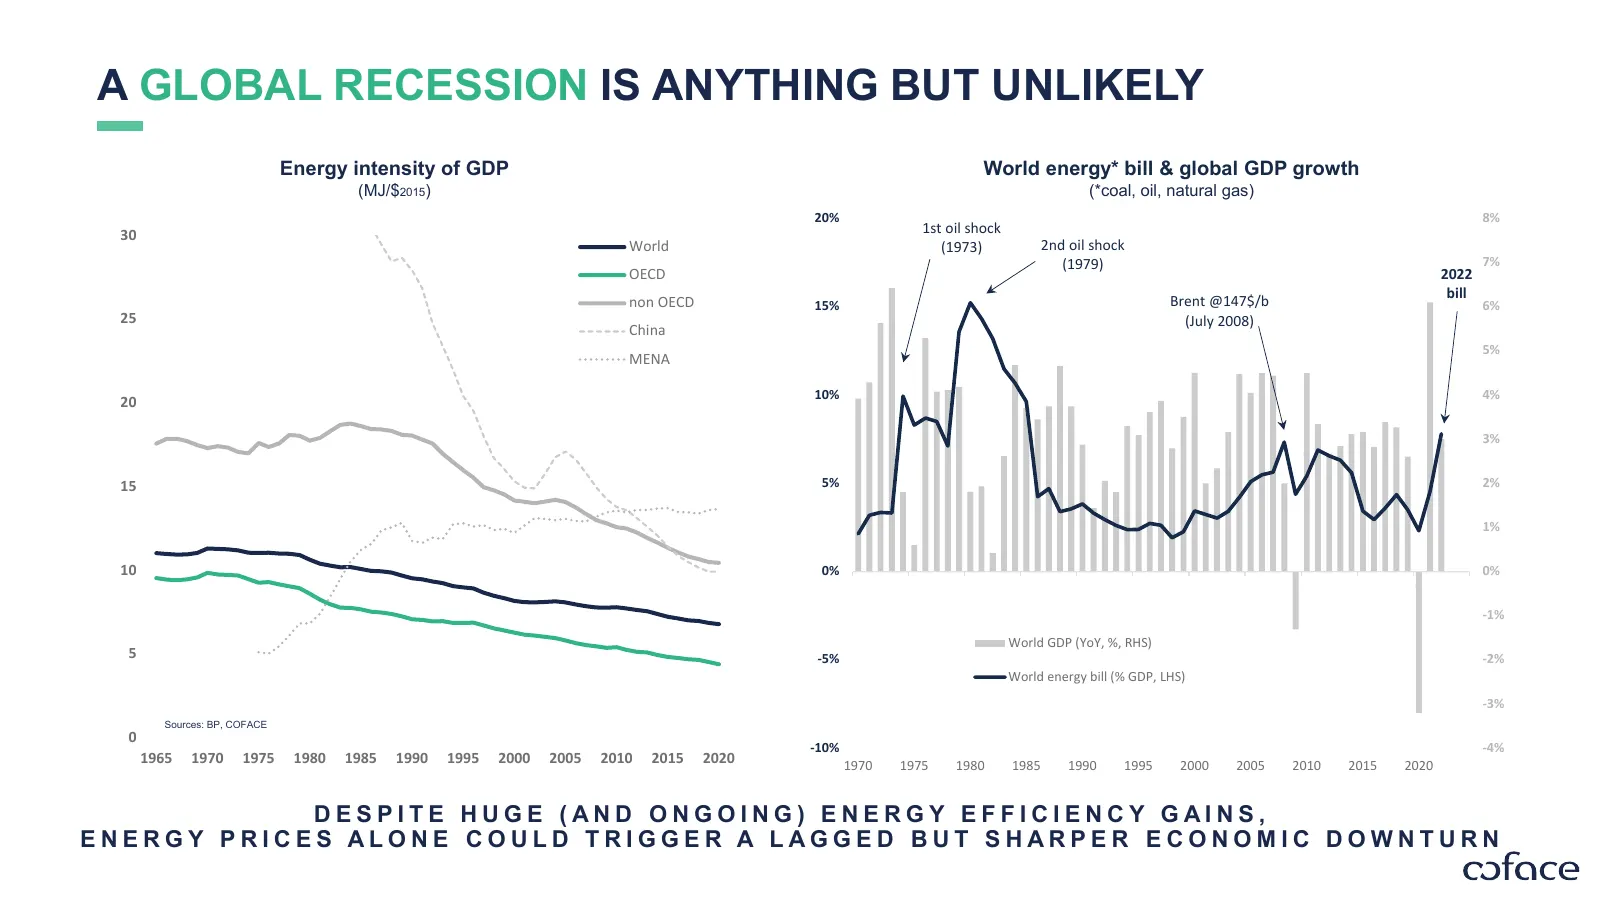
Slide 9: A Global Recession Is Anything But Unlikely
A GLOBAL RECESSION IS ANYTHING BUT UNLIKELY Energy intensity of GDP World energy* bill & global GDP growth (MJ/$2015) (*coal, oil, natural gas) 20% 8% 30 1st oil shock World (1973) 2nd oil shock (1979) 7% OECD 2022 bill non OECD 15% Brent @147$/b 6% 25 (July 2008) China 5% MENA 10% 4% 20 3% 15 5% 2%
Slide 10: Central Scenario: GDP Growth Forecasts
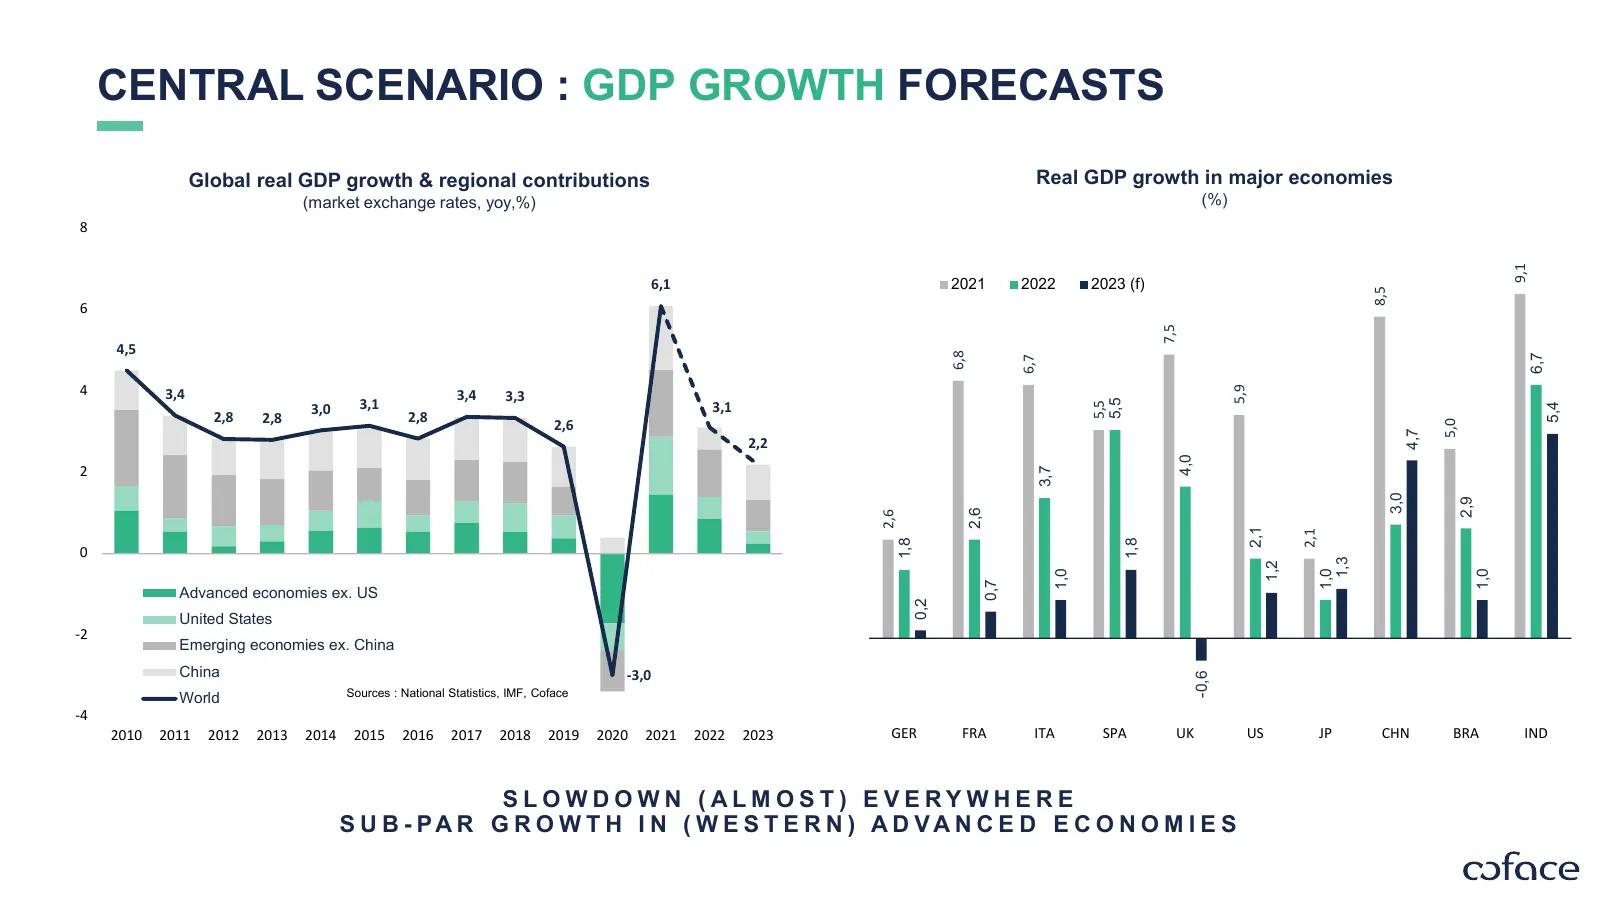
CENTRAL SCENARIO : GDP GROWTH FORECASTS Global real GDP growth & regional contributions Real GDP growth in major economies (market exchange rates, yoy,%) (%) 8 9,1 6,1 2021 2022 2023 (f) 8,5 6 7,5 4,5 6,8 6,7 6,7 4 3,4 3,4 5,9 3,3 3,0 3,1 3,1 5,5 5,5 5,4 2,8 2,8 2,8 2,6 5,0 4,7 2,2 4,0 2 3,7 3,0 2,9
Slide 11: GDP Growth in 2023 (Well) Below Trend in Most Countries
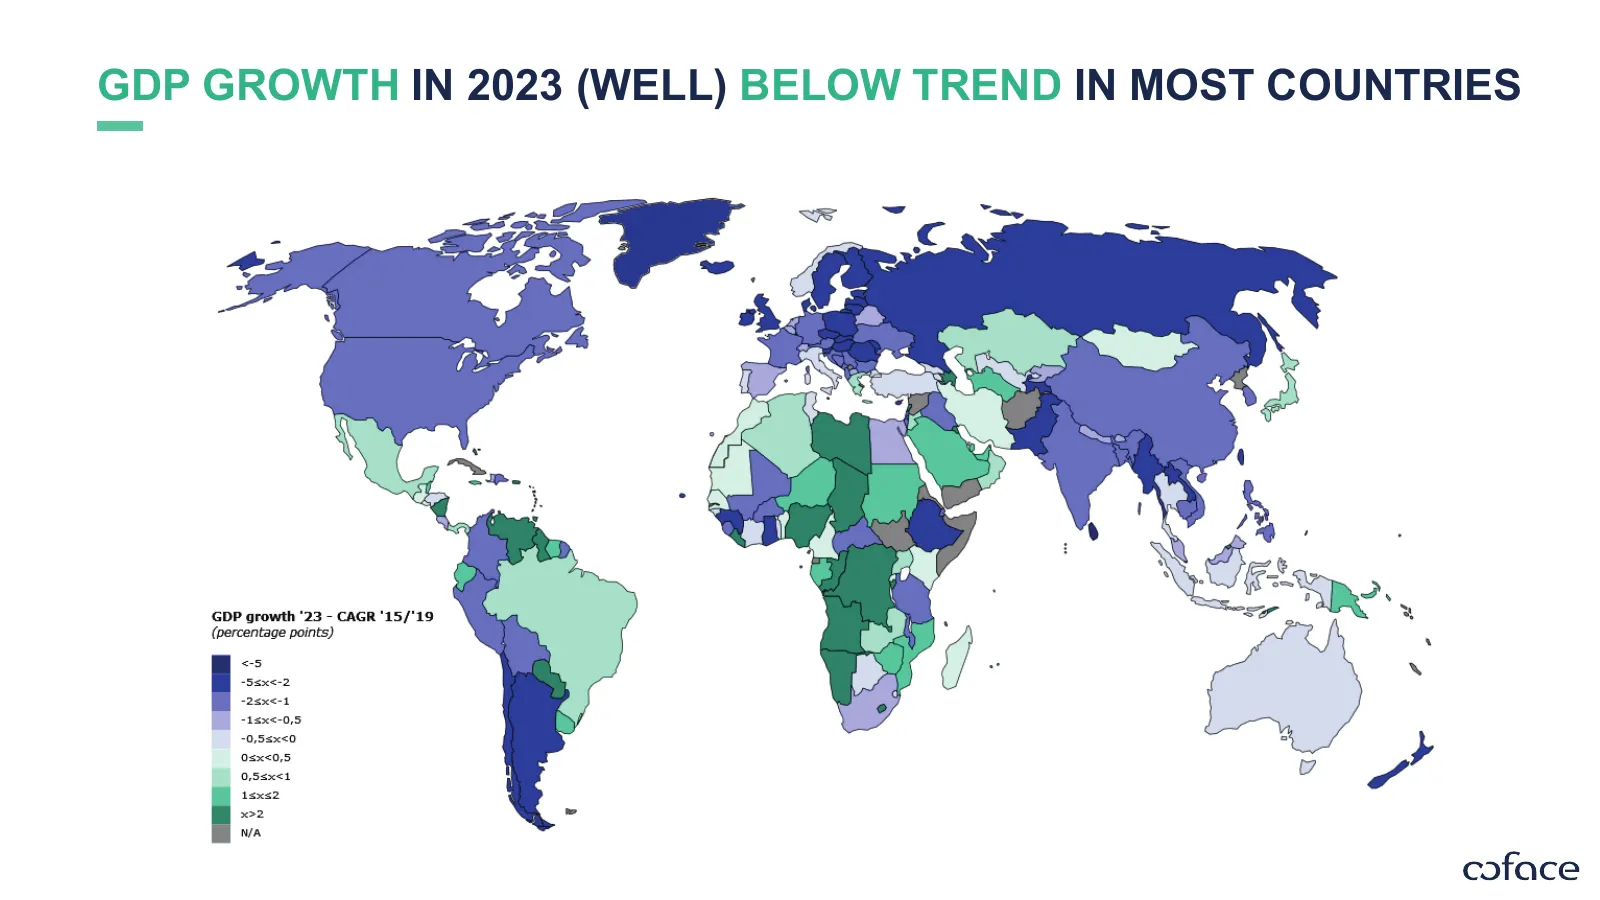
GDP GROWTH IN 2023 (WELL) BELOW TREND IN MOST COUNTRIES
Slide 12: Country Risk Assessment Map – Q4 2022
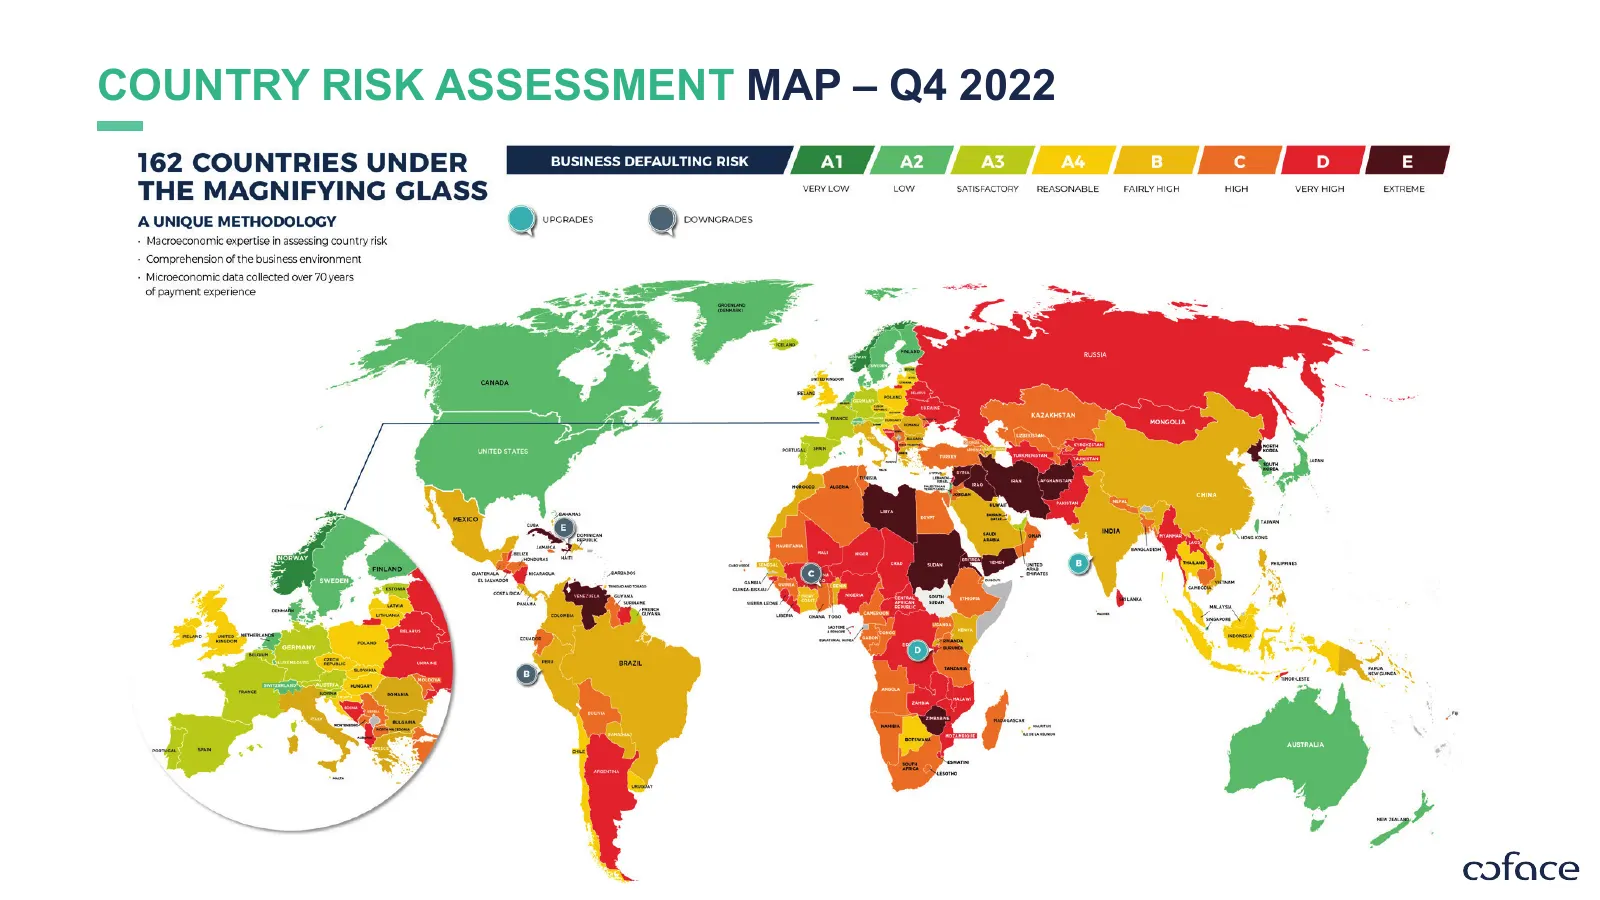
COUNTRY RISK ASSESSMENT MAP – Q4 2022
Slide 13: Regional Sector Risk Assessments – Q4 2022
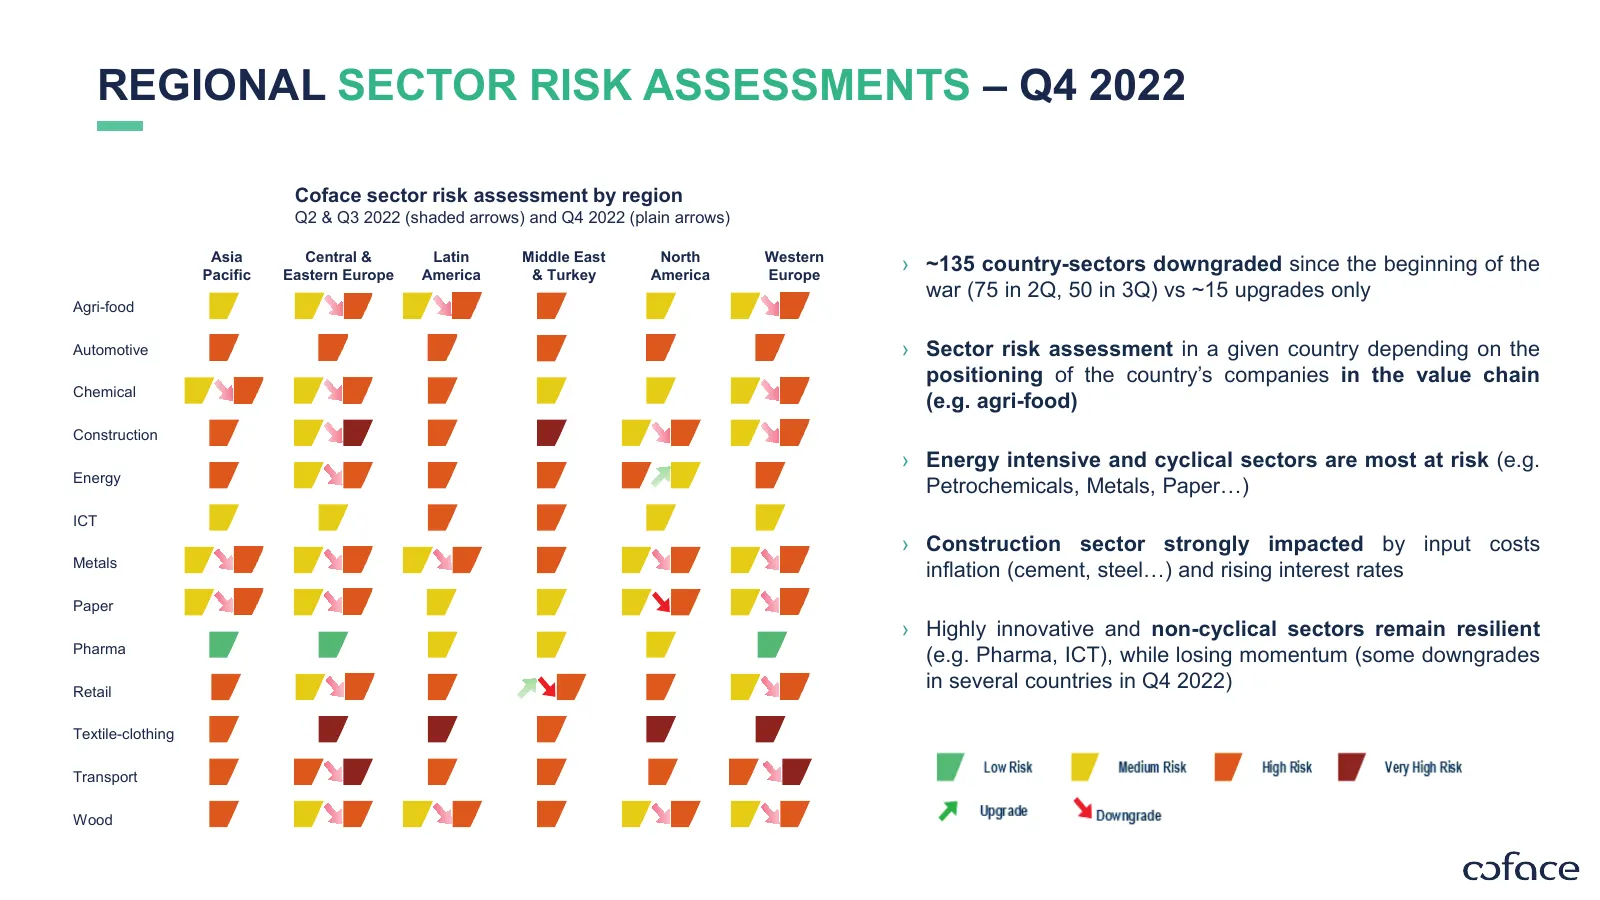
REGIONAL SECTOR RISK ASSESSMENTS – Q4 2022 Coface sector risk assessment by region Q2 & Q3 2022 (shaded arrows) and Q4 2022 (plain arrows) Asia Central & Latin Middle East North Western Pacific Eastern Europe America & Turkey America Europe › ~135 country-sectors downgraded since the beginning of th
Slide 14: What Does All That Mean for Corporate Insolvencies?
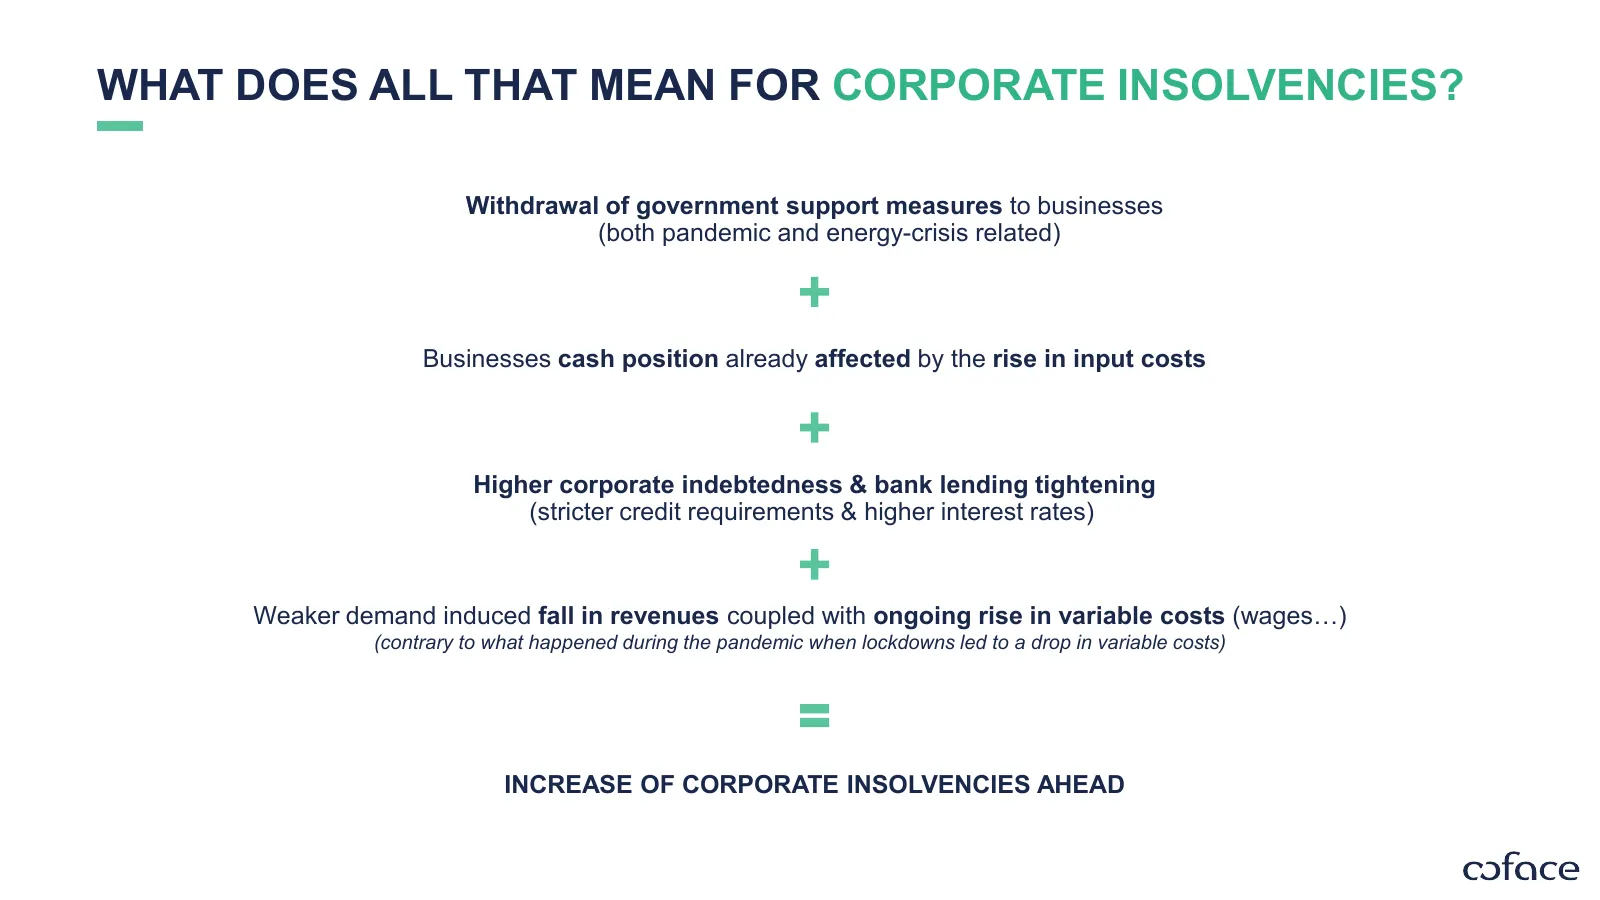
WHAT DOES ALL THAT MEAN FOR CORPORATE INSOLVENCIES? Withdrawal of government support measures to businesses (both pandemic and energy-crisis related) Businesses cash position already affected by the rise in input costs Higher corporate indebtedness & bank lending tightening (stricter credit requirem
Slide 15: Corporate Insolvencies: Acceleration Ahead
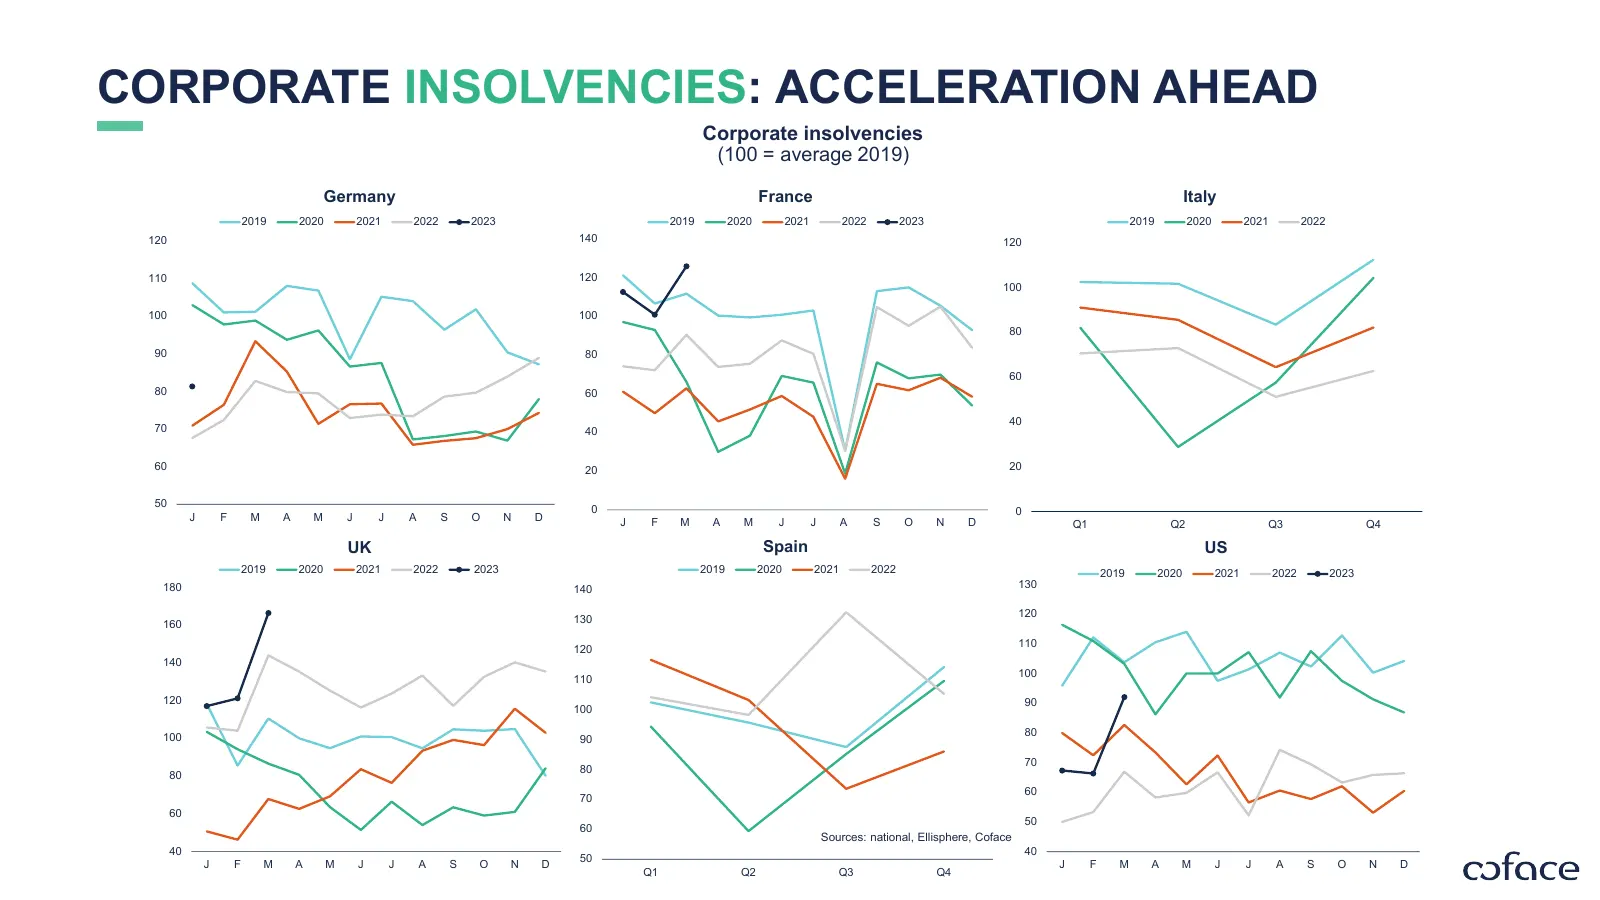
CORPORATE INSOLVENCIES: ACCELERATION AHEAD Corporate insolvencies (100 = average 2019) Germany France Italy 2019 2020 2021 2022 2023 2019 2020 2021 2022 2023 2019 2020 2021 2022 120 140 120 110 120 100 100 100 80 90 80 60 80 60 40 70 40 60 20 20 50 0 0 J F M A M J J A S O N D J F M A M J J A S O N D

Slide 16: Follow Coface's Company Page on LinkedIn
TO GET OUR LATEST ECONOMIC ANALYSIS FOLLOW COFACE'S COMPANY PAGE ON LINKEDIN
Slide 17: Thank You
_ THANK YOU FOR TRADE
Slide 18: Disclaimer
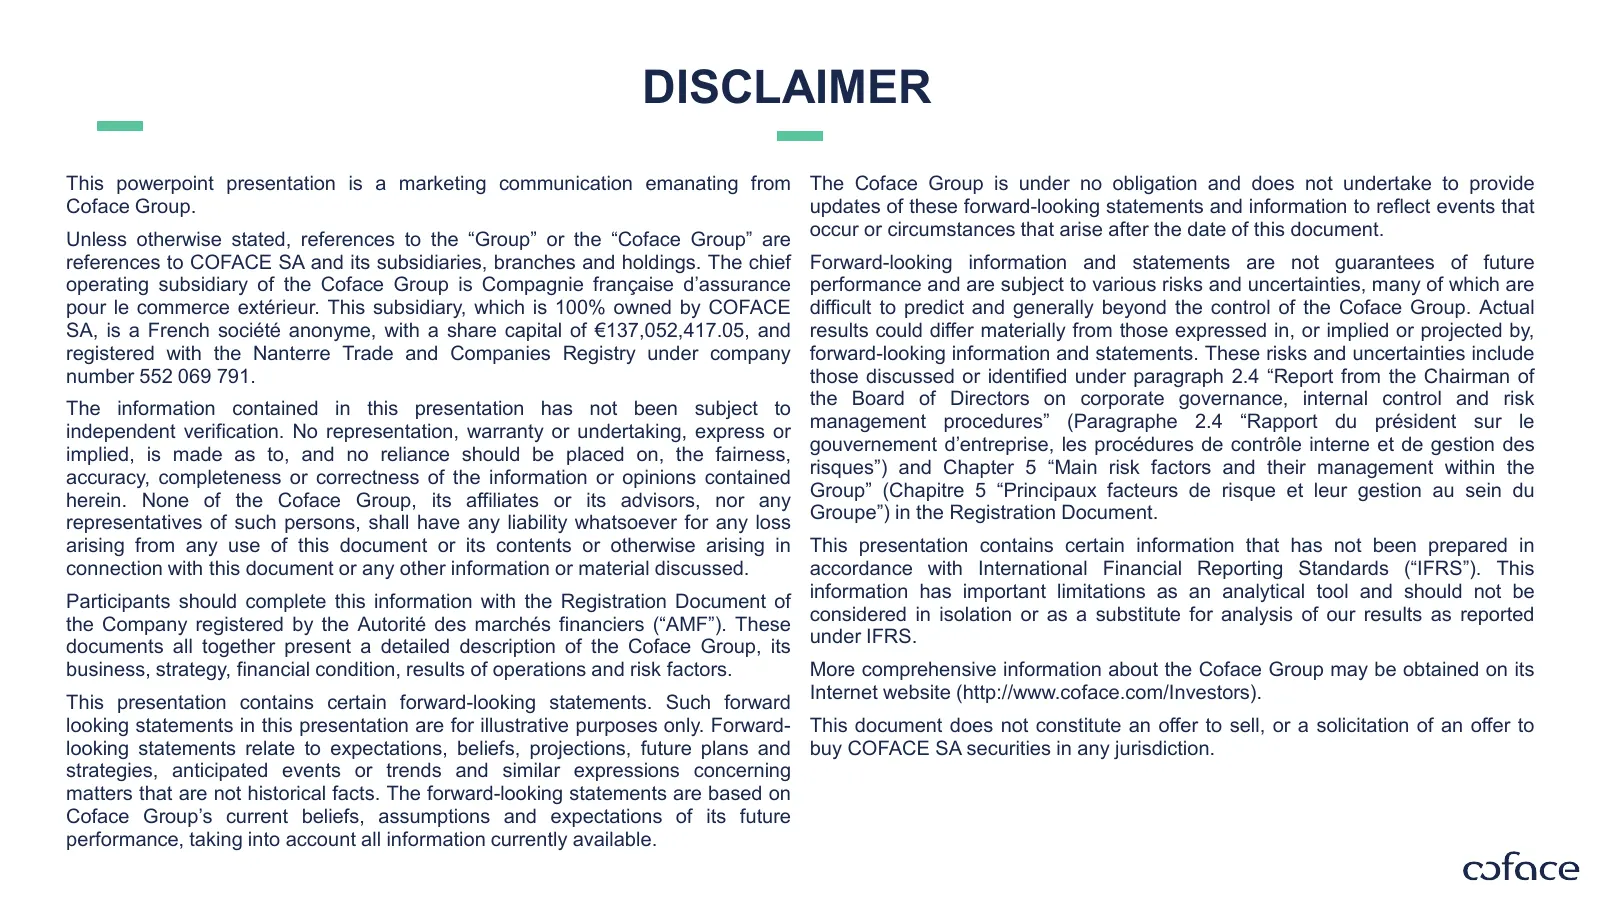
DISCLAIMER This powerpoint presentation is a marketing communication emanating from The Coface Group is under no obligation and does not undertake to provide Coface Group. updates of these forward-looking statements and information to reflect events that Unless otherwise stated, references to the “G
Source: Internet Archive copy of img.go.coface.com
More decks from Coface SA
 9M-2026 Earnings Presentation28 slides · Nov 2, 2026
 H1 2026 Earnings Presentation37 slides · Jul 30, 2026
 Shareholder Meeting (May 2026)82 slides · May 19, 2026
 Q1 2026 Earnings Presentation28 slides · May 12, 2026
 FY2025 Earnings Presentation37 slides · Feb 19, 2026
 Q3 2025 Earnings Presentation27 slides · Nov 3, 2025