comScore, Inc. · NASDAQ:SCOR
comScore — The State of Mobile EU5 Webinar (June 2010)
34 slides from comScore's conference presentation, Jun 10, 2010
Slide 1: The State of Mobile
The State of Mobile EU5 Mobile Media Landscape and Trends Alistair Hill, Sr. Analyst June 10, 2010
Slide 2: Agenda
Agenda comScore Mobile Data Mobile Media Trends Shifting Mobile Media Landscape Smartphones Summing Up © comScore, Inc. Proprietary and Confidential. 2
Slide 3: comScore Mobile Data
comScore Mobile Data © comScore, Inc. Proprietary and Confidential. 3
Slide 4: comScore Mobile Data
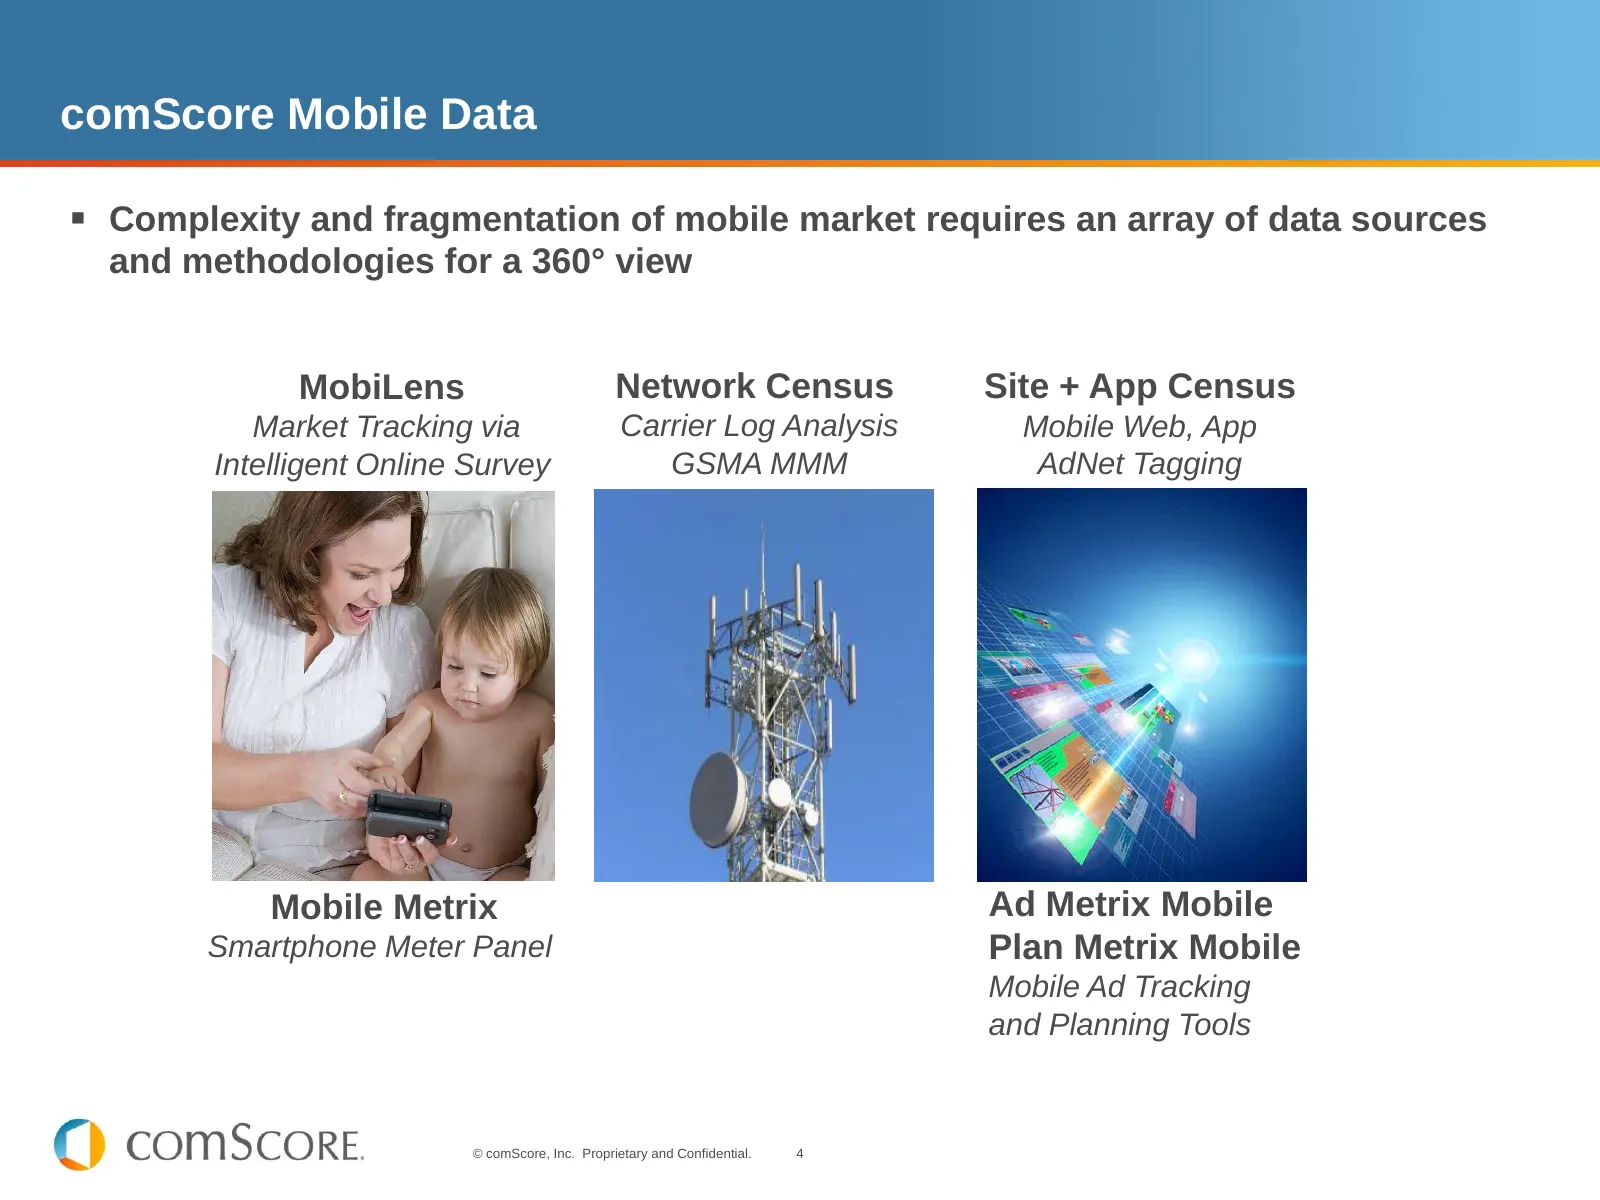
comScore Mobile Data Complexity and fragmentation of mobile market requires an array of data sources and methodologies for a 360° view MobiLens Network Census Site + App Census Market Tracking via Carrier Log Analysis Mobile Web, App Intelligent Online Survey GSMA MMM AdNet Tagging Mobile Metrix A
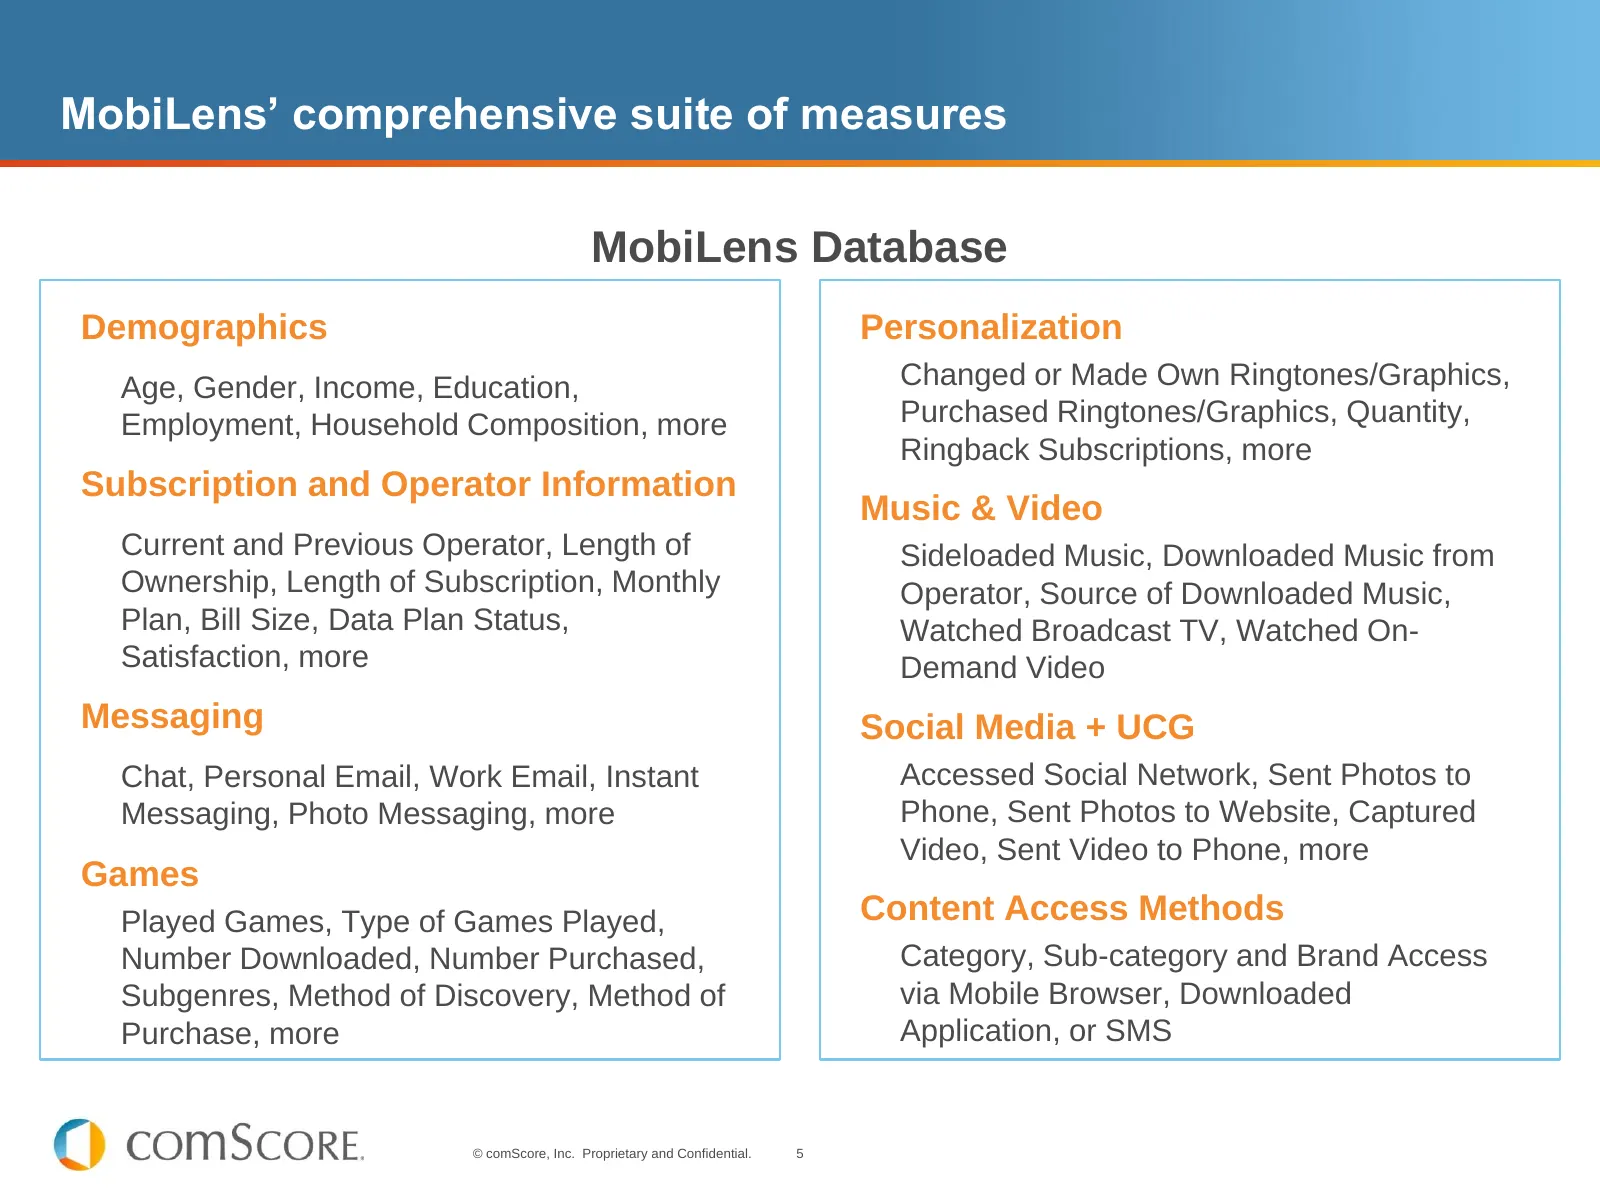
Slide 5: MobiLens' comprehensive suite of measures
MobiLens’ comprehensive suite of measures MobiLens Database Demographics Personalization Age, Gender, Income, Education, Changed or Made Own Ringtones/Graphics, Employment, Household Composition, more Purchased Ringtones/Graphics, Quantity, Ringback Subscriptions, more Subscription and Operator Info
Slide 6: Mobile Media Trends
Mobile Media Trends © comScore, Inc. Proprietary and Confidential. 6
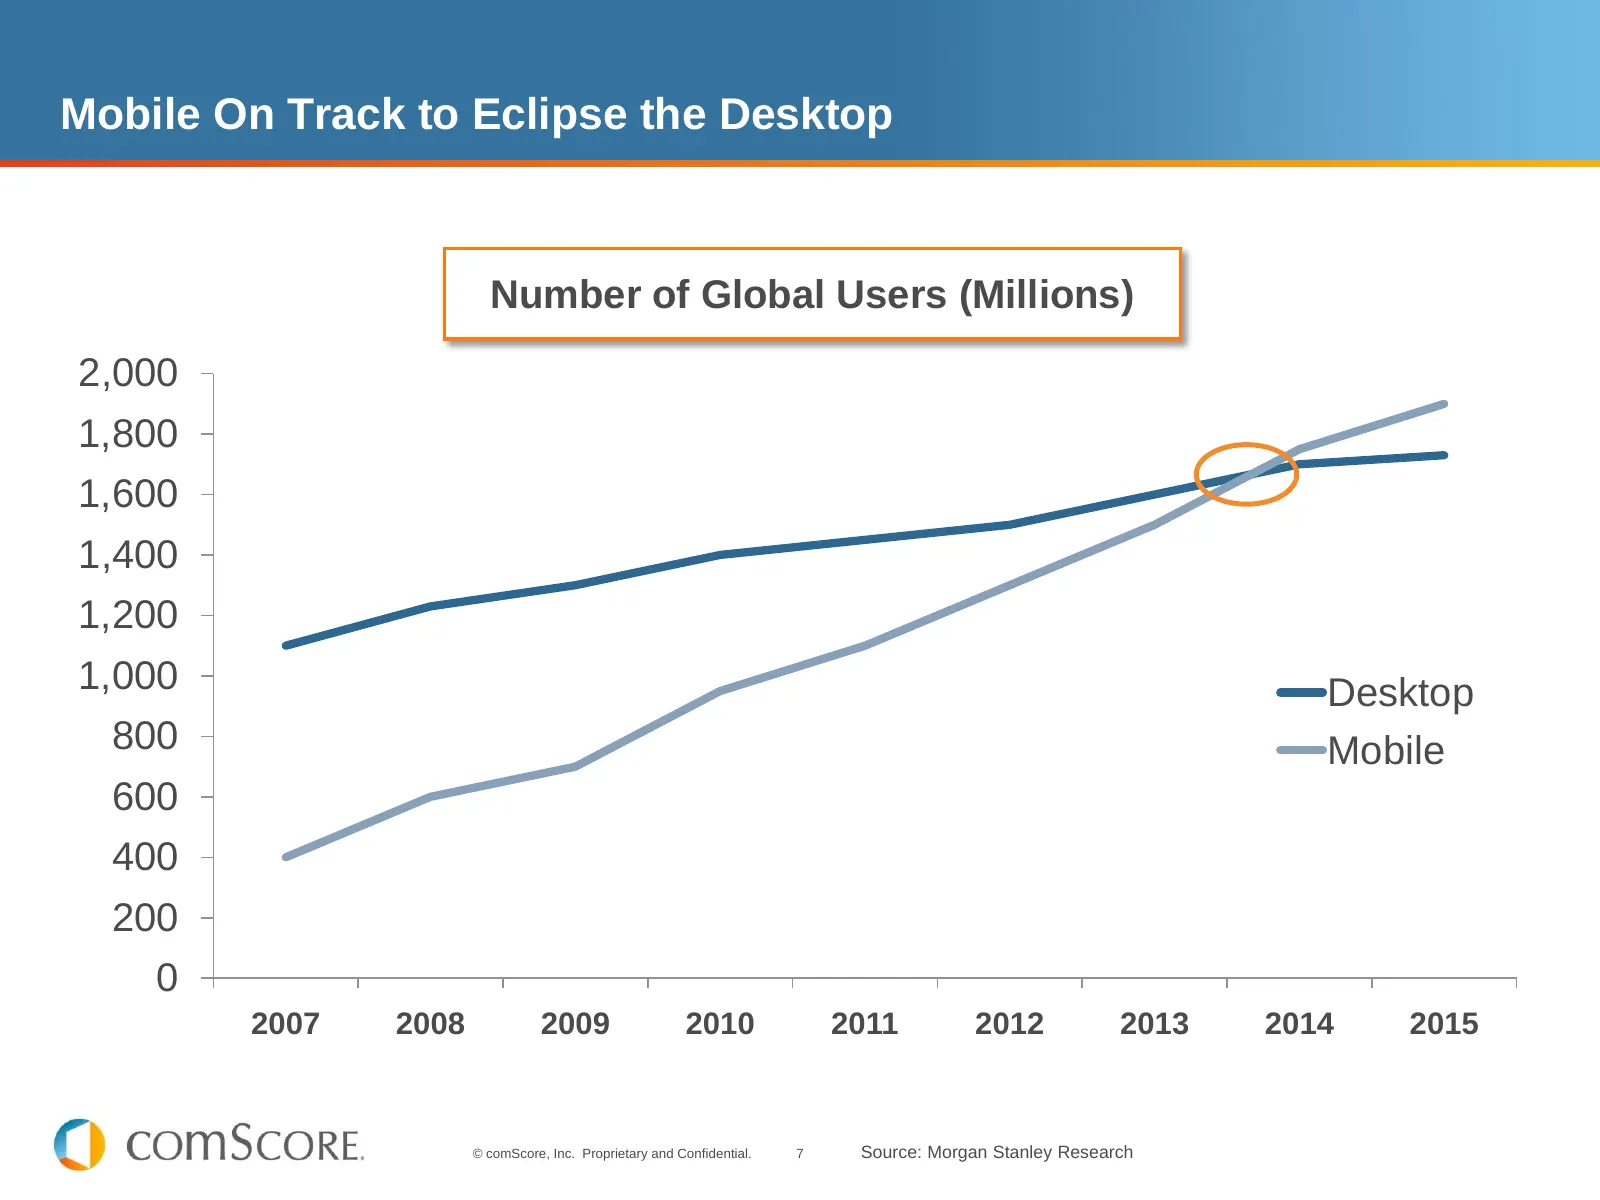
Slide 7: Mobile On Track to Eclipse the Desktop
Mobile On Track to Eclipse the Desktop Number of Global Users (Millions) 2,000 1,800 1,600 1,400 1,200 1,000 Desktop 800 Mobile 600 400 200 0 2007 2008 2009 2010 2011 2012 2013 2014 2015 © comScore, Inc. Proprietary and Confidential. 7 Source: Morgan Stanley Research
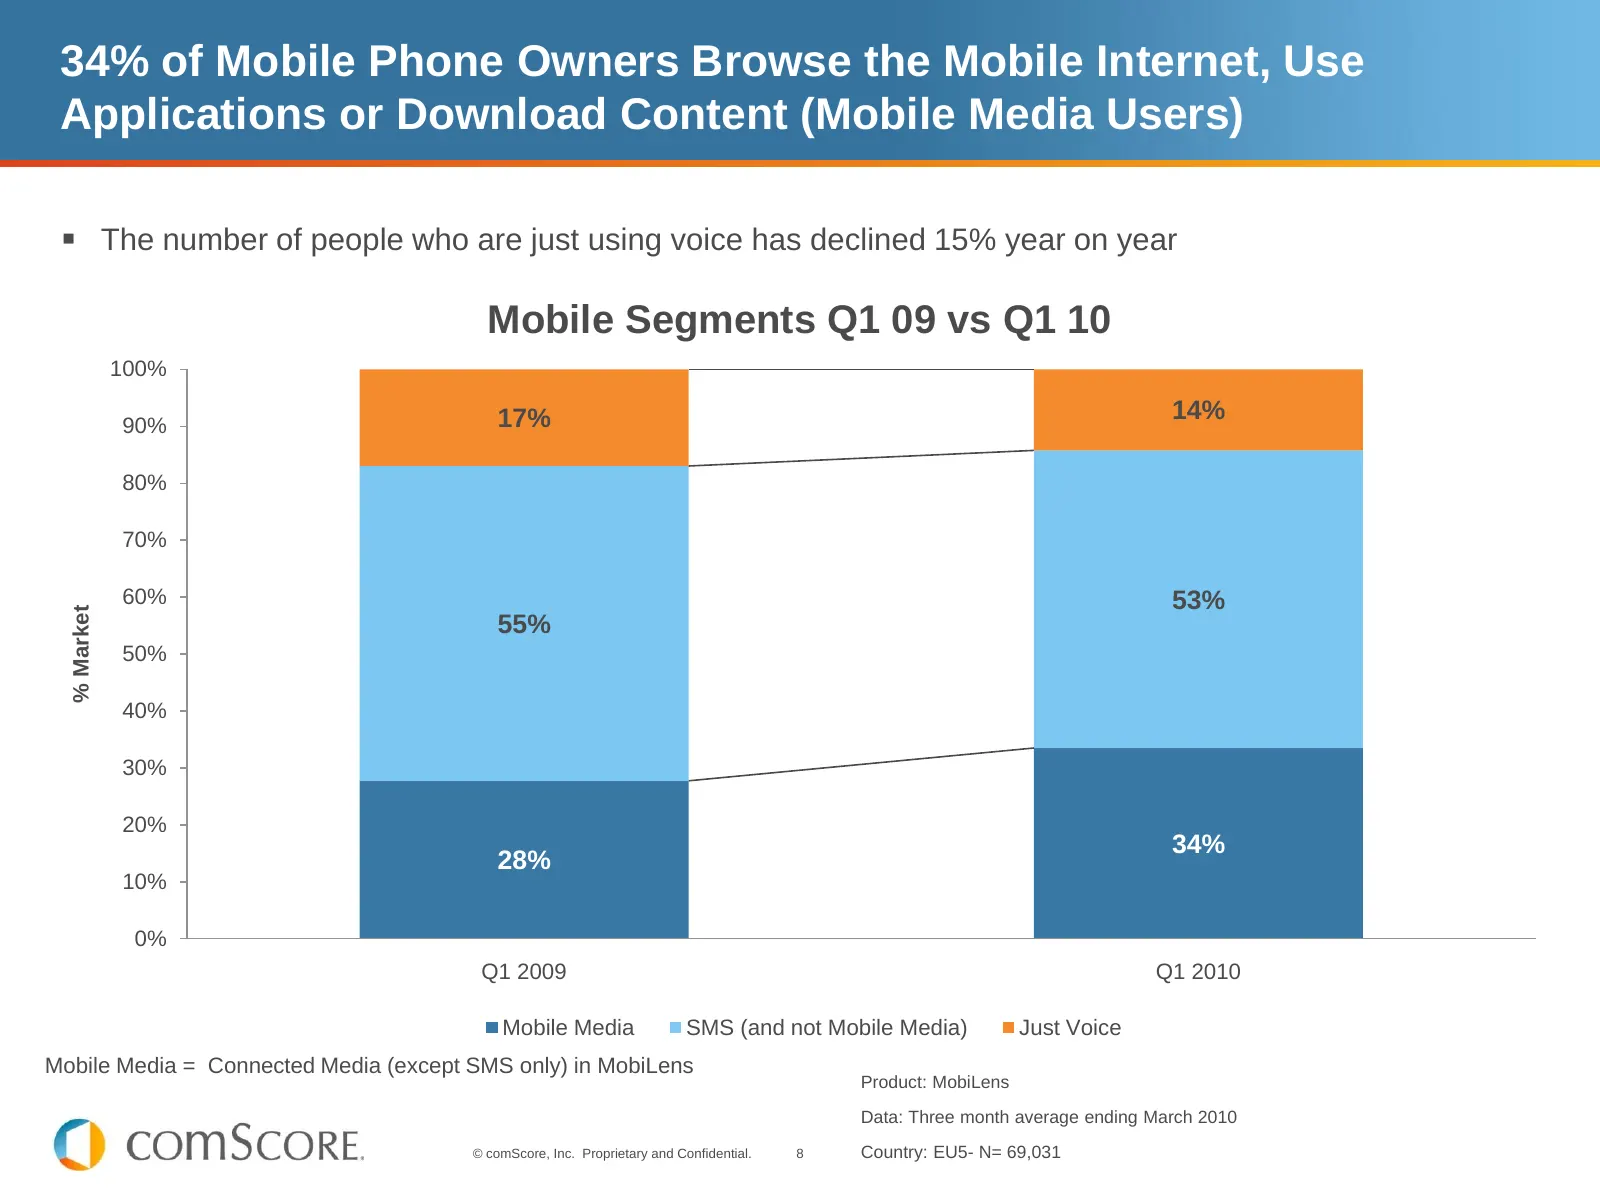
Slide 8: 34% of Mobile Phone Owners Use Mobile Media
34% of Mobile Phone Owners Browse the Mobile Internet, Use Applications or Download Content (Mobile Media Users) The number of people who are just using voice has declined 15% year on year Mobile Segments Q1 09 vs Q1 10 100% 17% 14% 90% 80% 70% 60% 53% % Market 55% 50% 40% 30% 20% 34% 28% 10% 0% Q
Slide 9: Growth of the Key Market Enablers Continues
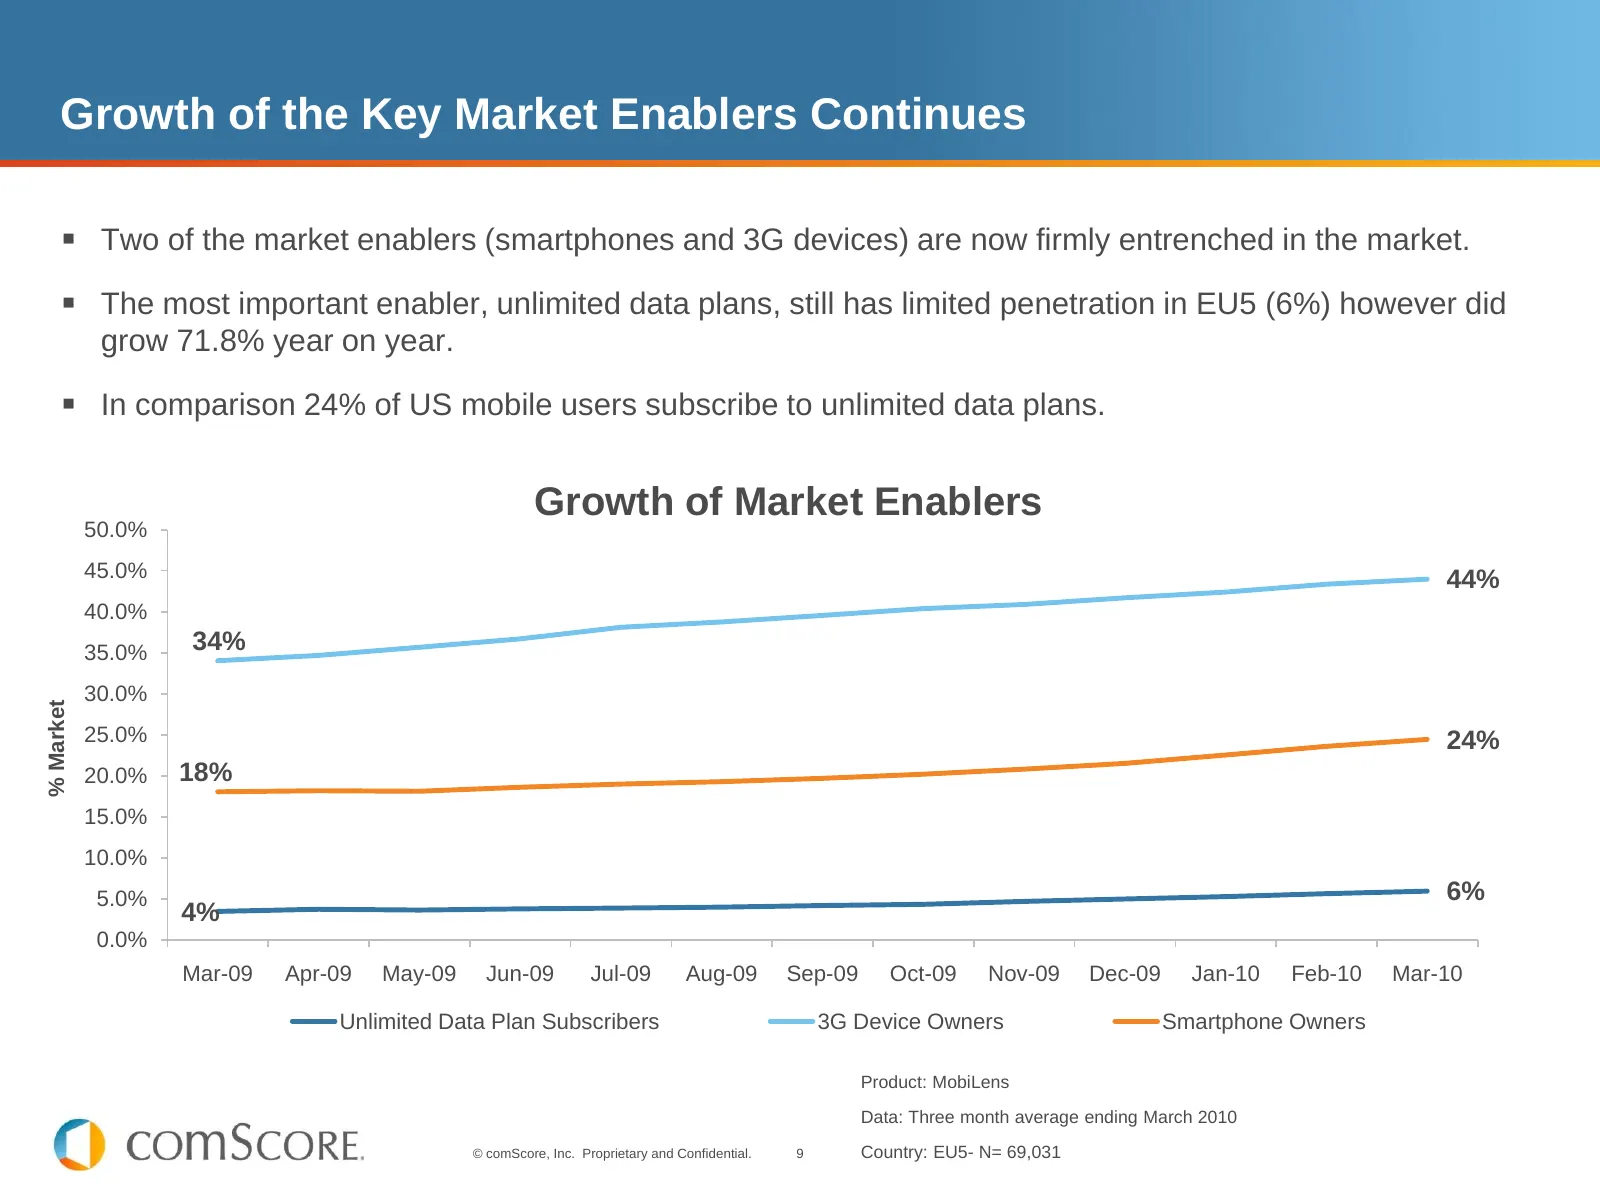
Growth of the Key Market Enablers Continues Two of the market enablers (smartphones and 3G devices) are now firmly entrenched in the market. The most important enabler, unlimited data plans, still has limited penetration in EU5 (6%) however did grow 71.8% year on year. In comparison 24% of US
Slide 10: The Average Mobile Media User and Demographics
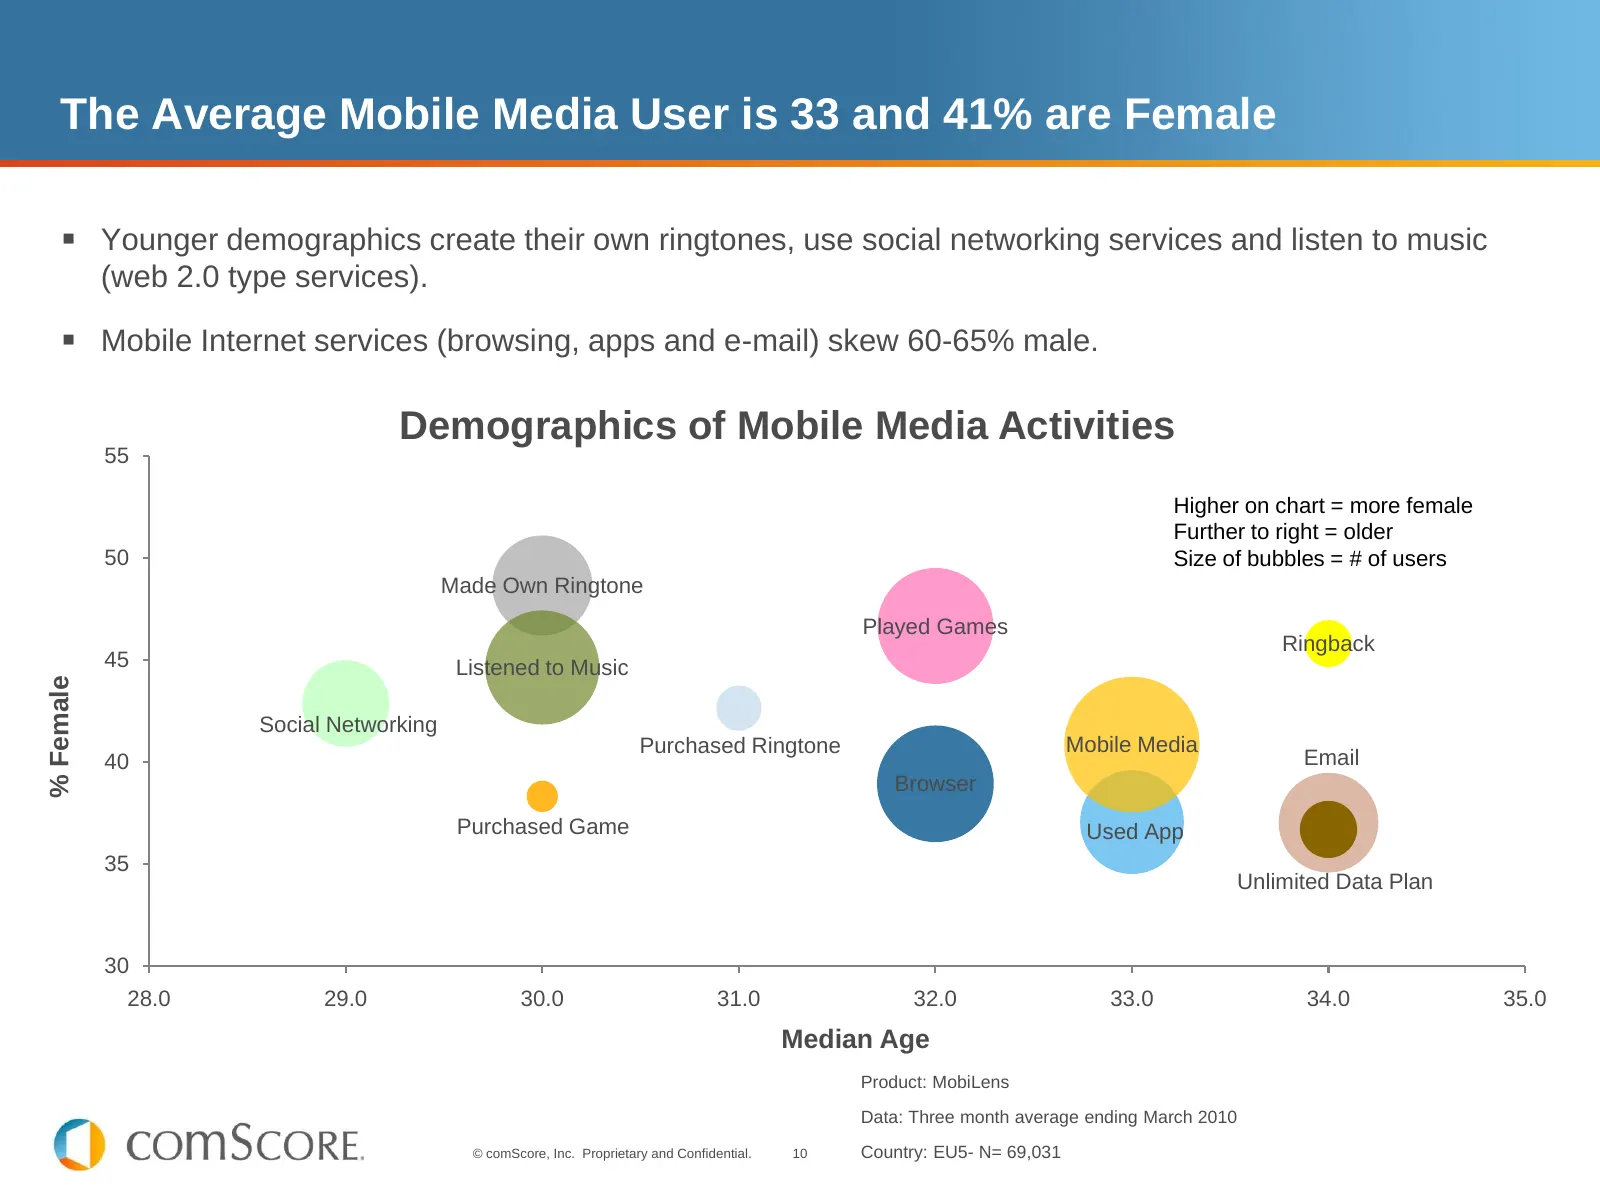
The Average Mobile Media User is 33 and 41% are Female Younger demographics create their own ringtones, use social networking services and listen to music (web 2.0 type services). Mobile Internet services (browsing, apps and e-mail) skew 60-65% male. Demographics of Mobile Media Activities 55 Hi
Slide 11: Nokia Leads OEM Market for Device Owners
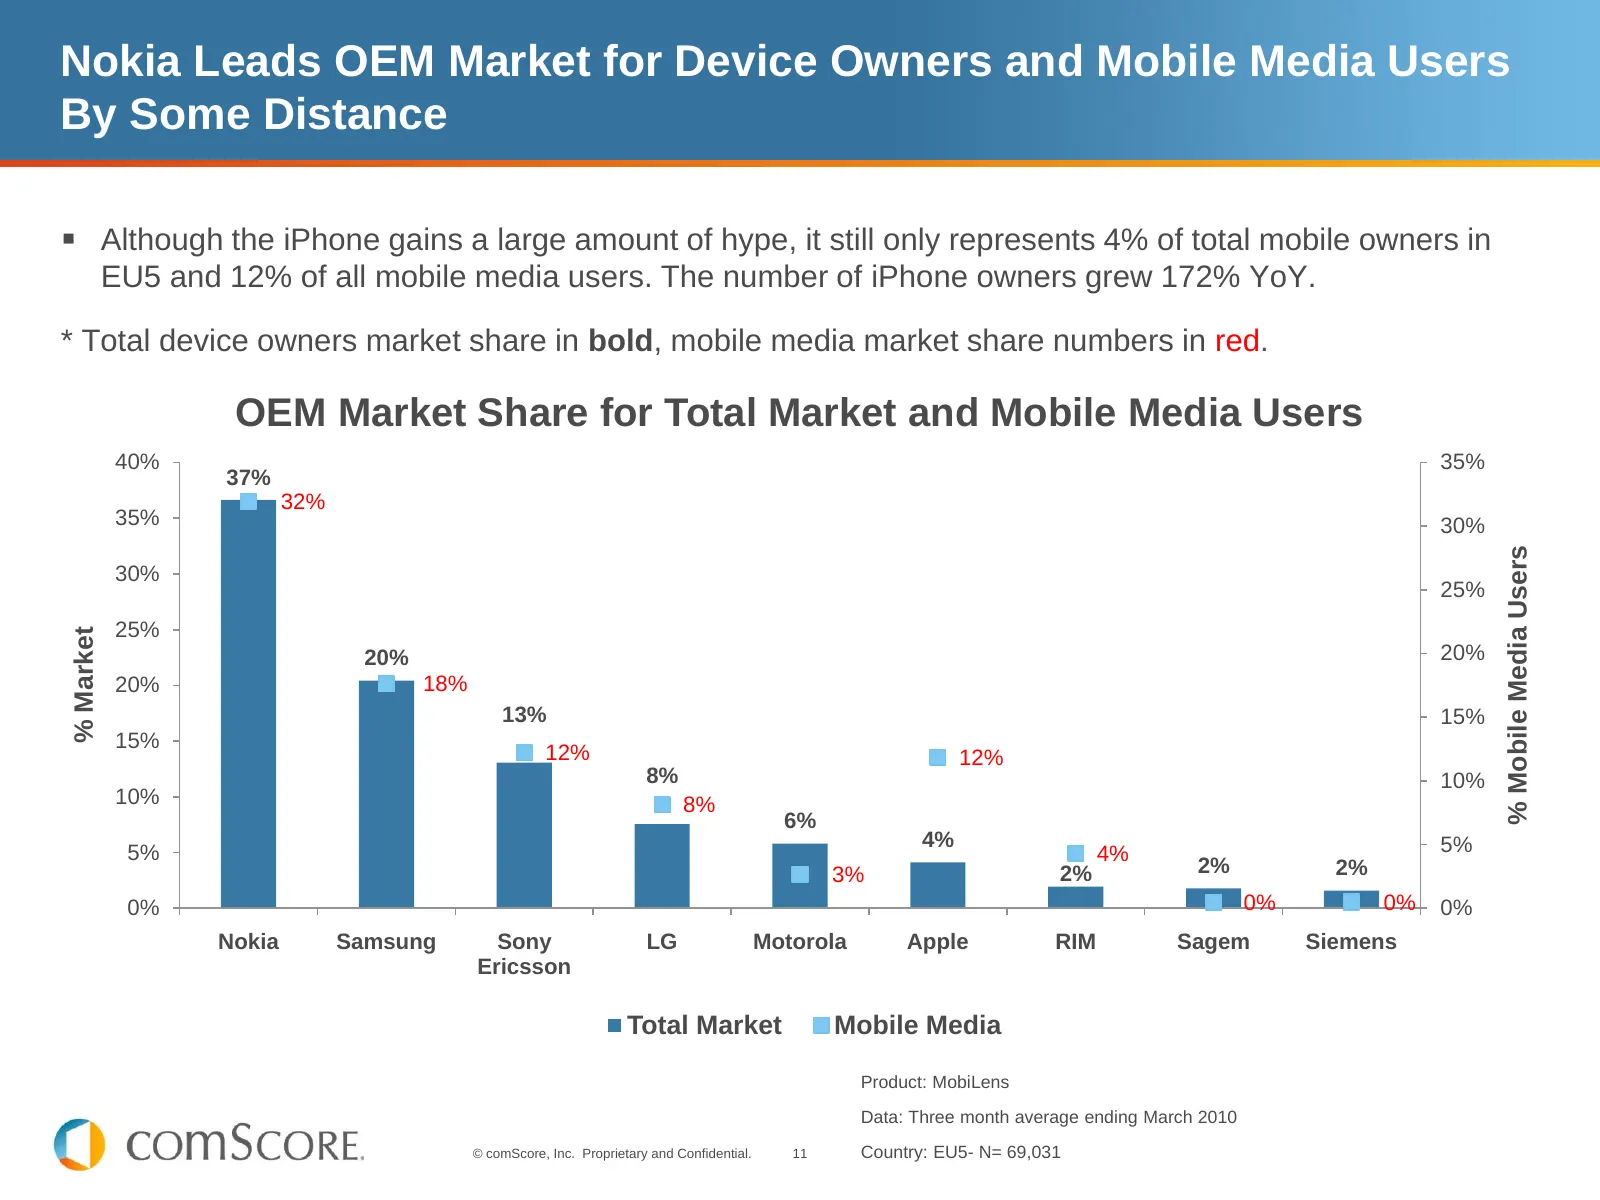
Nokia Leads OEM Market for Device Owners and Mobile Media Users By Some Distance Although the iPhone gains a large amount of hype, it still only represents 4% of total mobile owners in EU5 and 12% of all mobile media users. The number of iPhone owners grew 172% YoY. * Total device owners market sh
Slide 12: Shifting Mobile Media Landscape
Shifting Mobile Media Landscape © comScore, Inc. Proprietary and Confidential. 12
Slide 13: The Mobile Content Industry Flat / Declining
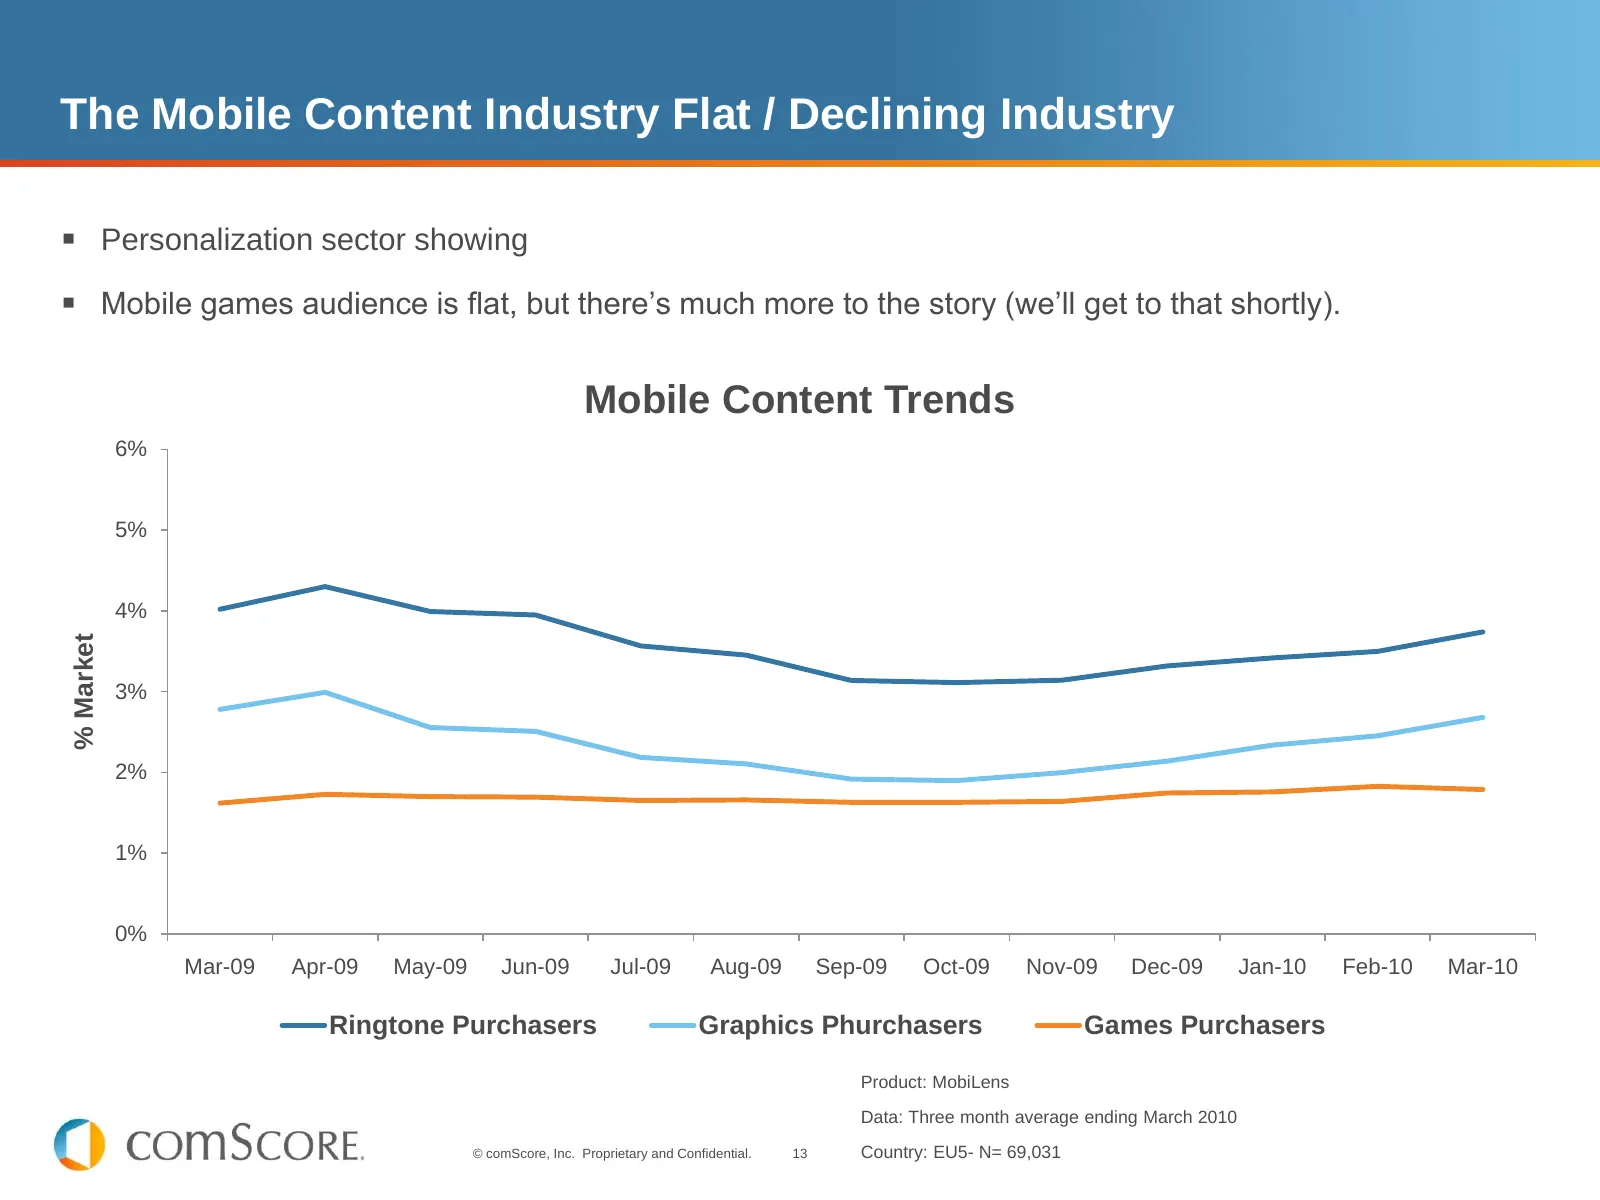
The Mobile Content Industry Flat / Declining Industry Personalization sector showing Mobile games audience is flat, but there’s much more to the story (we’ll get to that shortly). Mobile Content Trends 6% 5% 4% % Market 3% 2% 1% 0% Mar-09 Apr-09 May-09 Jun-09 Jul-09 Aug-09 Sep-09 Oct-09 Nov-09 D
Slide 14: A Quarter of EU5 Mobile Owners Browse the Mobile Internet
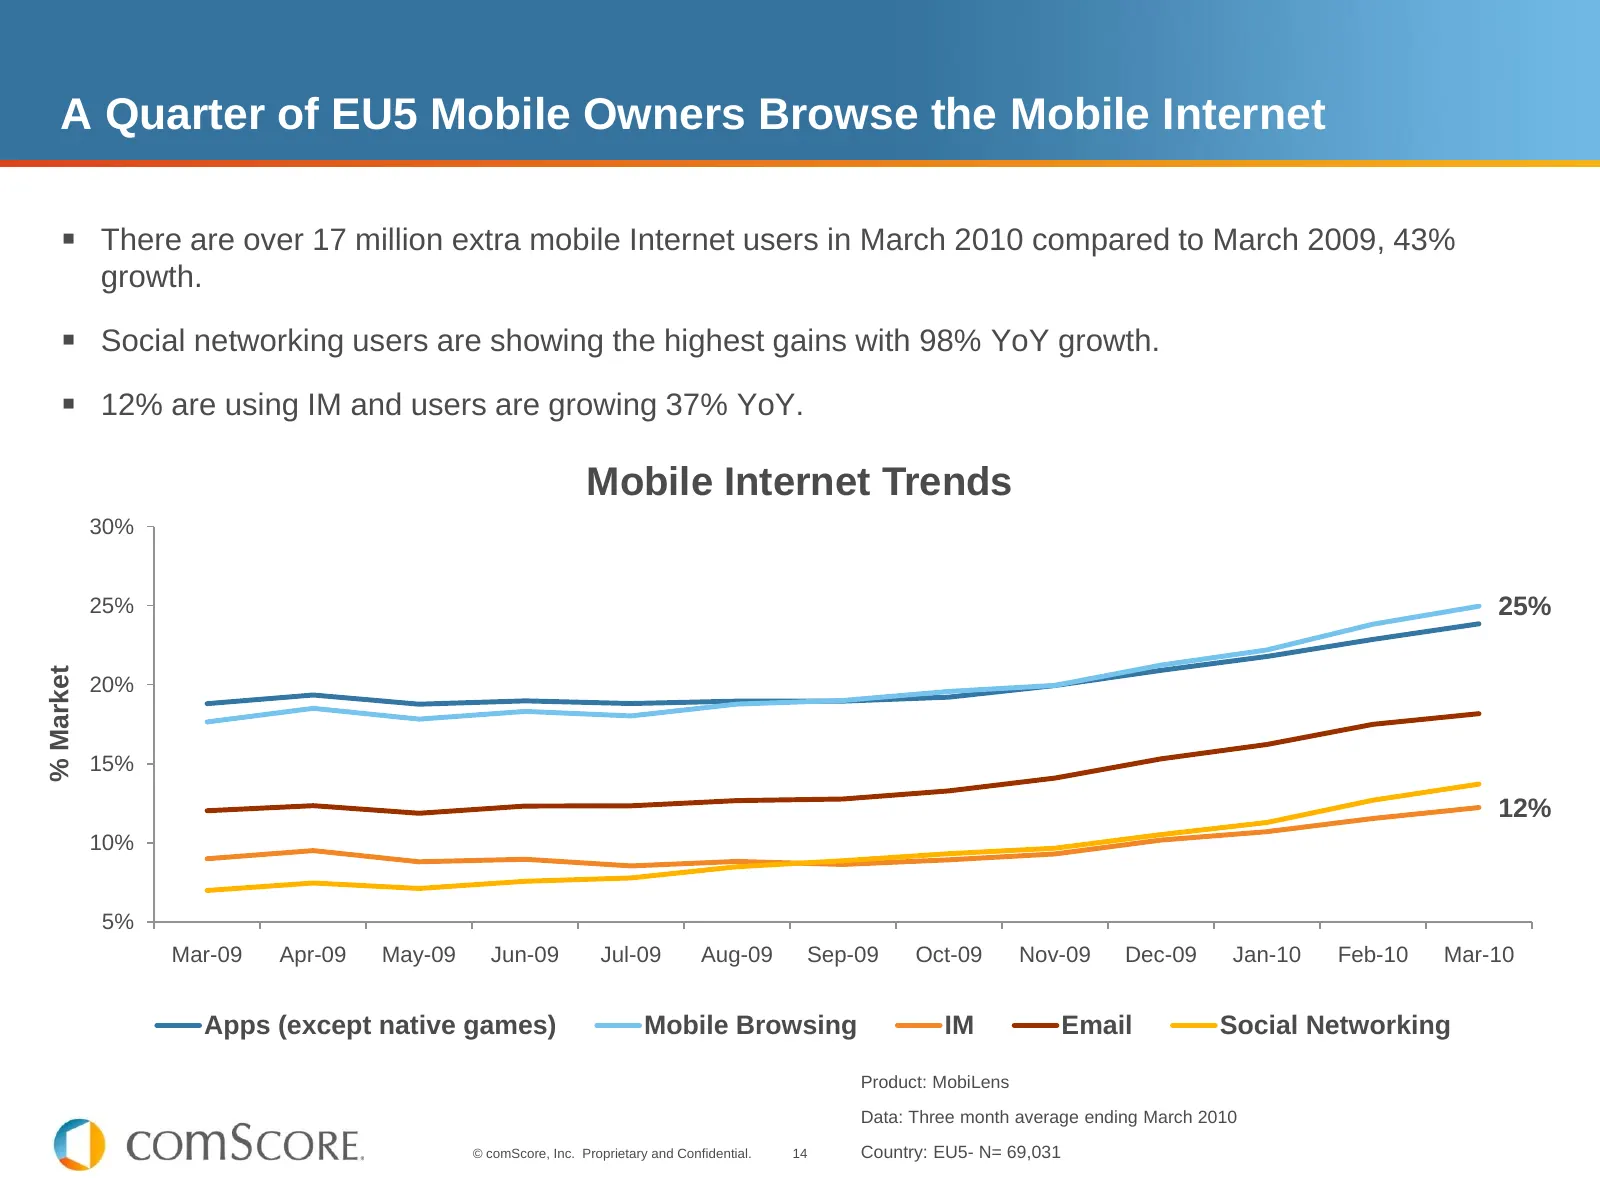
A Quarter of EU5 Mobile Owners Browse the Mobile Internet There are over 17 million extra mobile Internet users in March 2010 compared to March 2009, 43% growth. Social networking users are showing the highest gains with 98% YoY growth. 12% are using IM and users are growing 37% YoY. Mobile In
Slide 15: Communicating & Sharing Drives Mobile Web
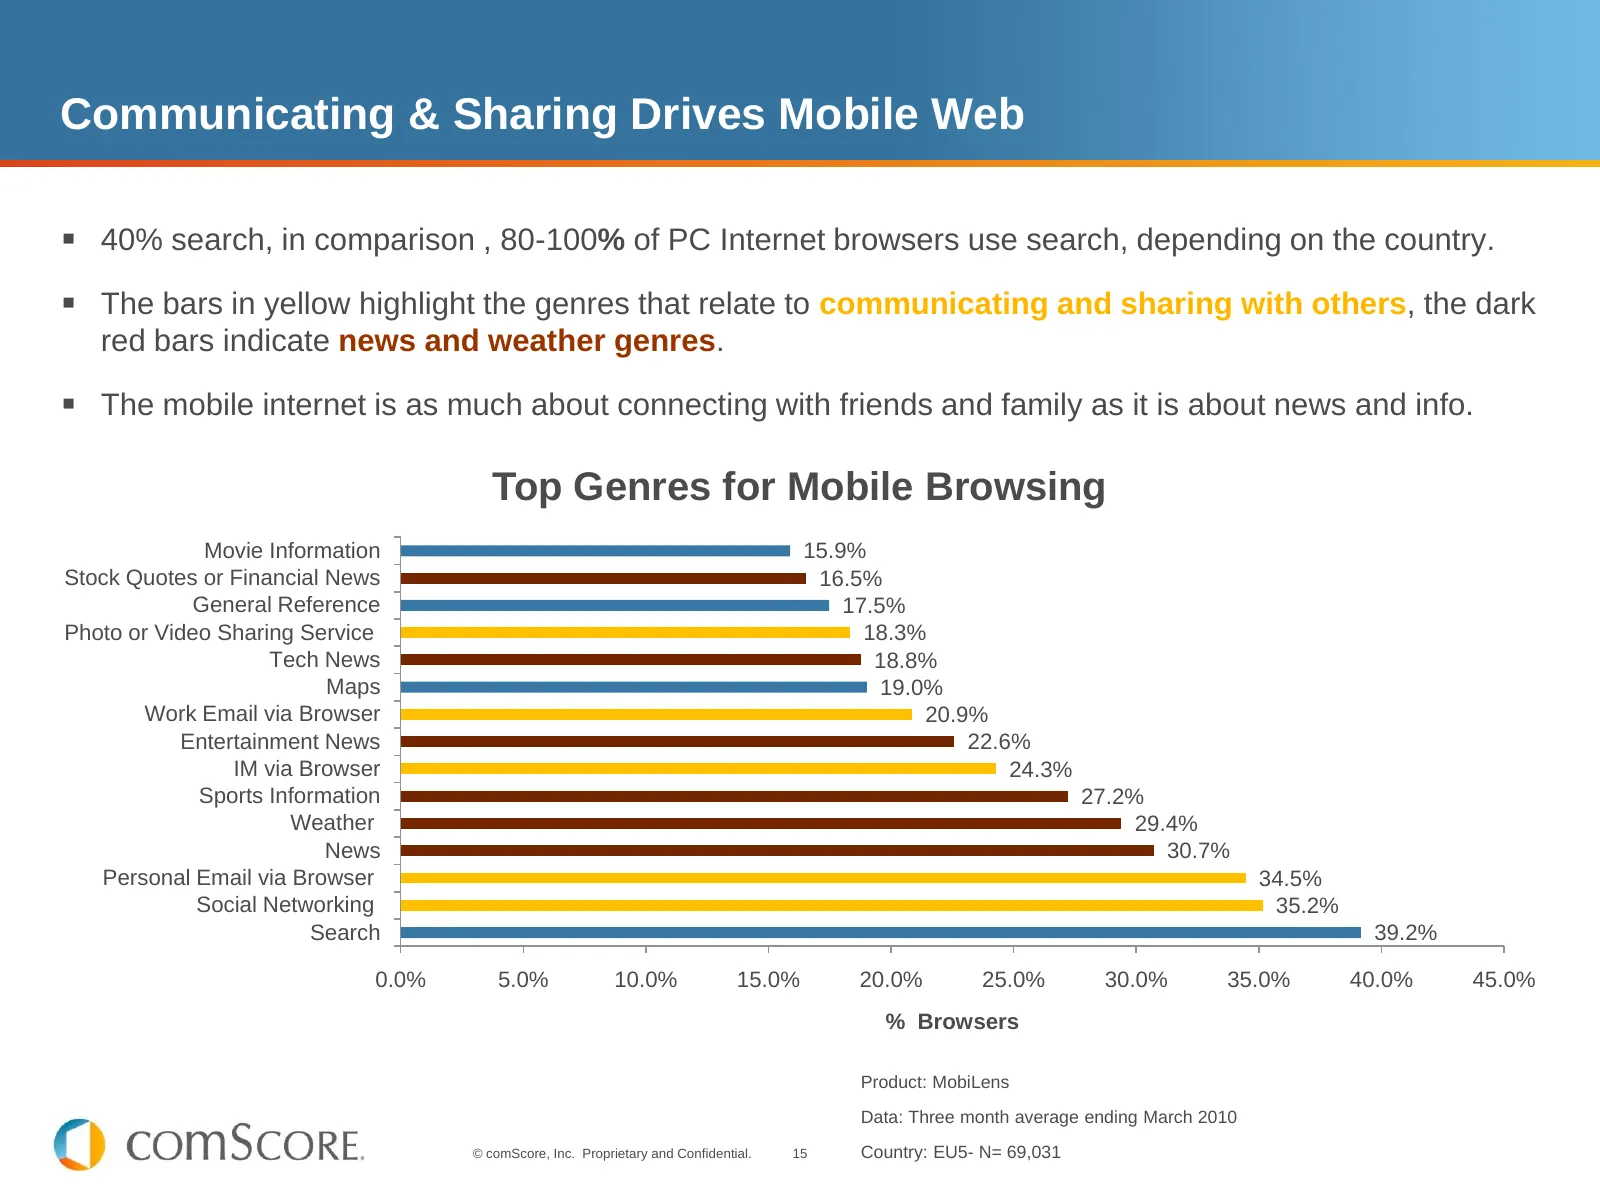
Communicating & Sharing Drives Mobile Web 40% search, in comparison , 80-100% of PC Internet browsers use search, depending on the country. The bars in yellow highlight the genres that relate to communicating and sharing with others, the dark red bars indicate news and weather genres. The mobi
Slide 16: Google the Most Popular Mobile Internet Site in the UK
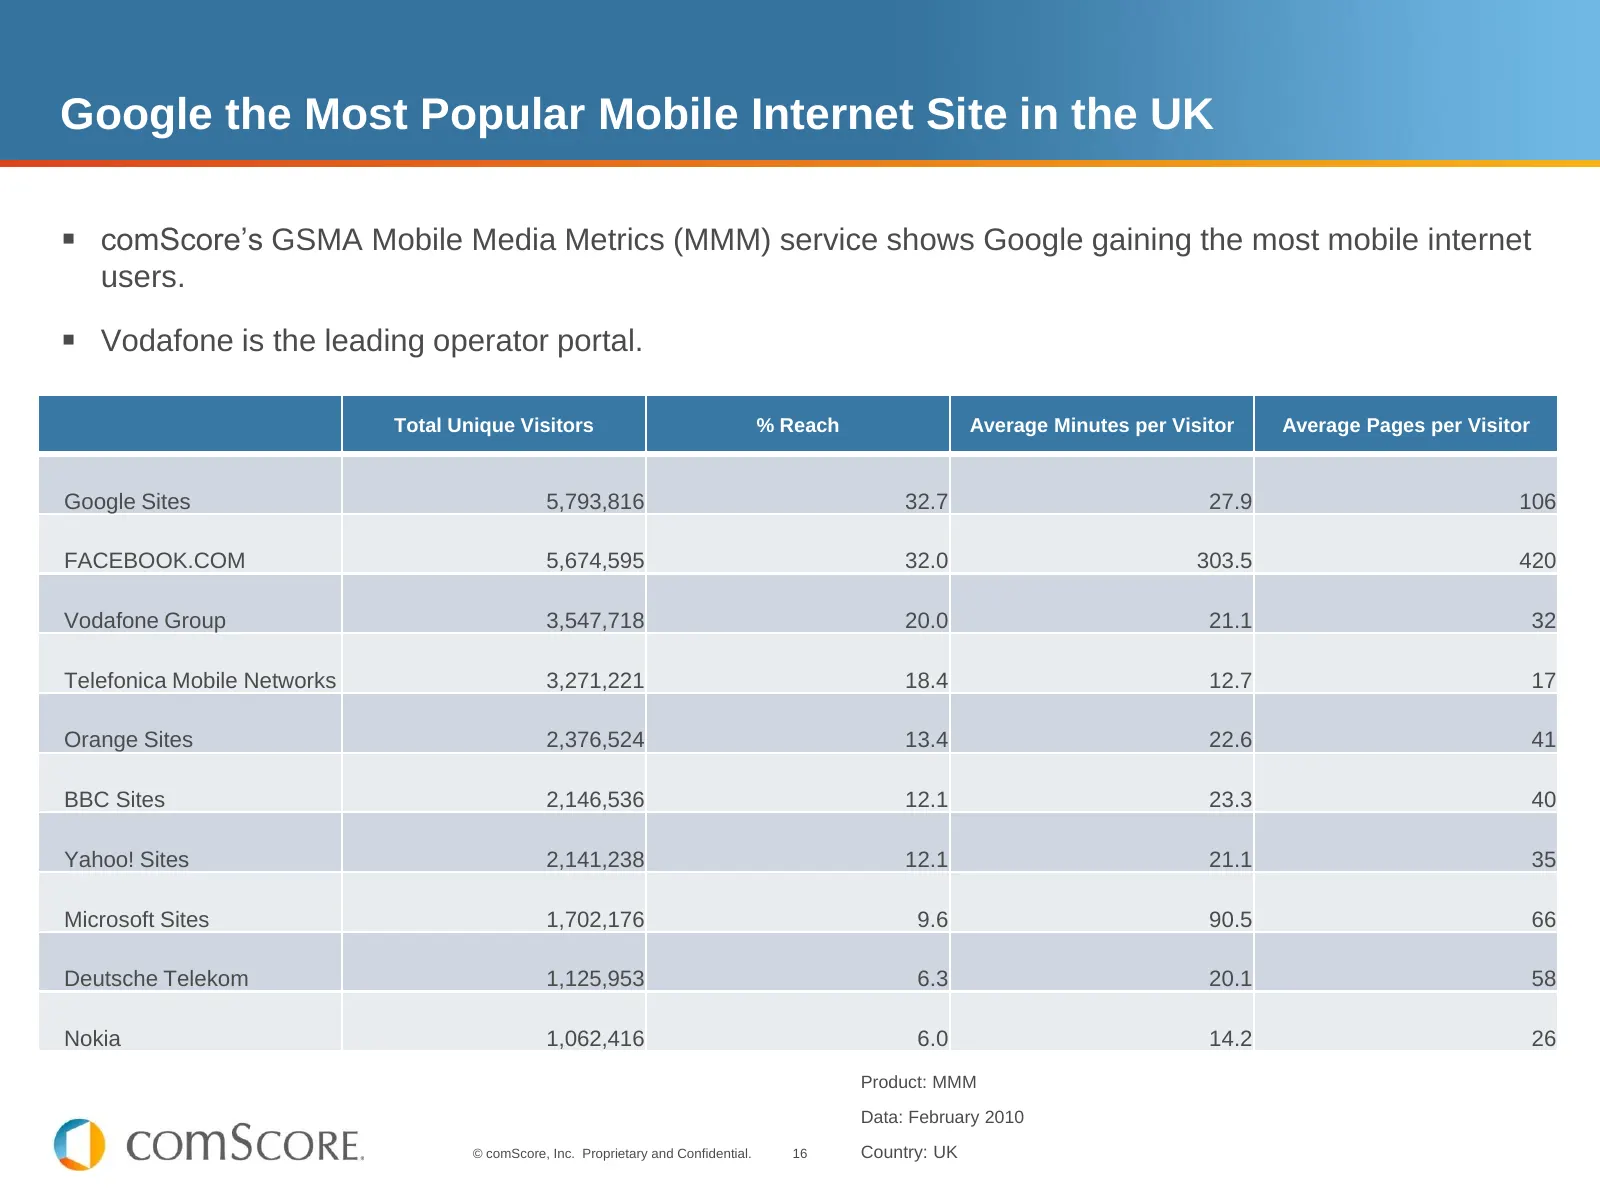
Google the Most Popular Mobile Internet Site in the UK comScore’s GSMA Mobile Media Metrics (MMM) service shows Google gaining the most mobile internet users. Vodafone is the leading operator portal. Total Unique Visitors % Reach Average Minutes per Visitor Average Pages per Visitor Google Sites
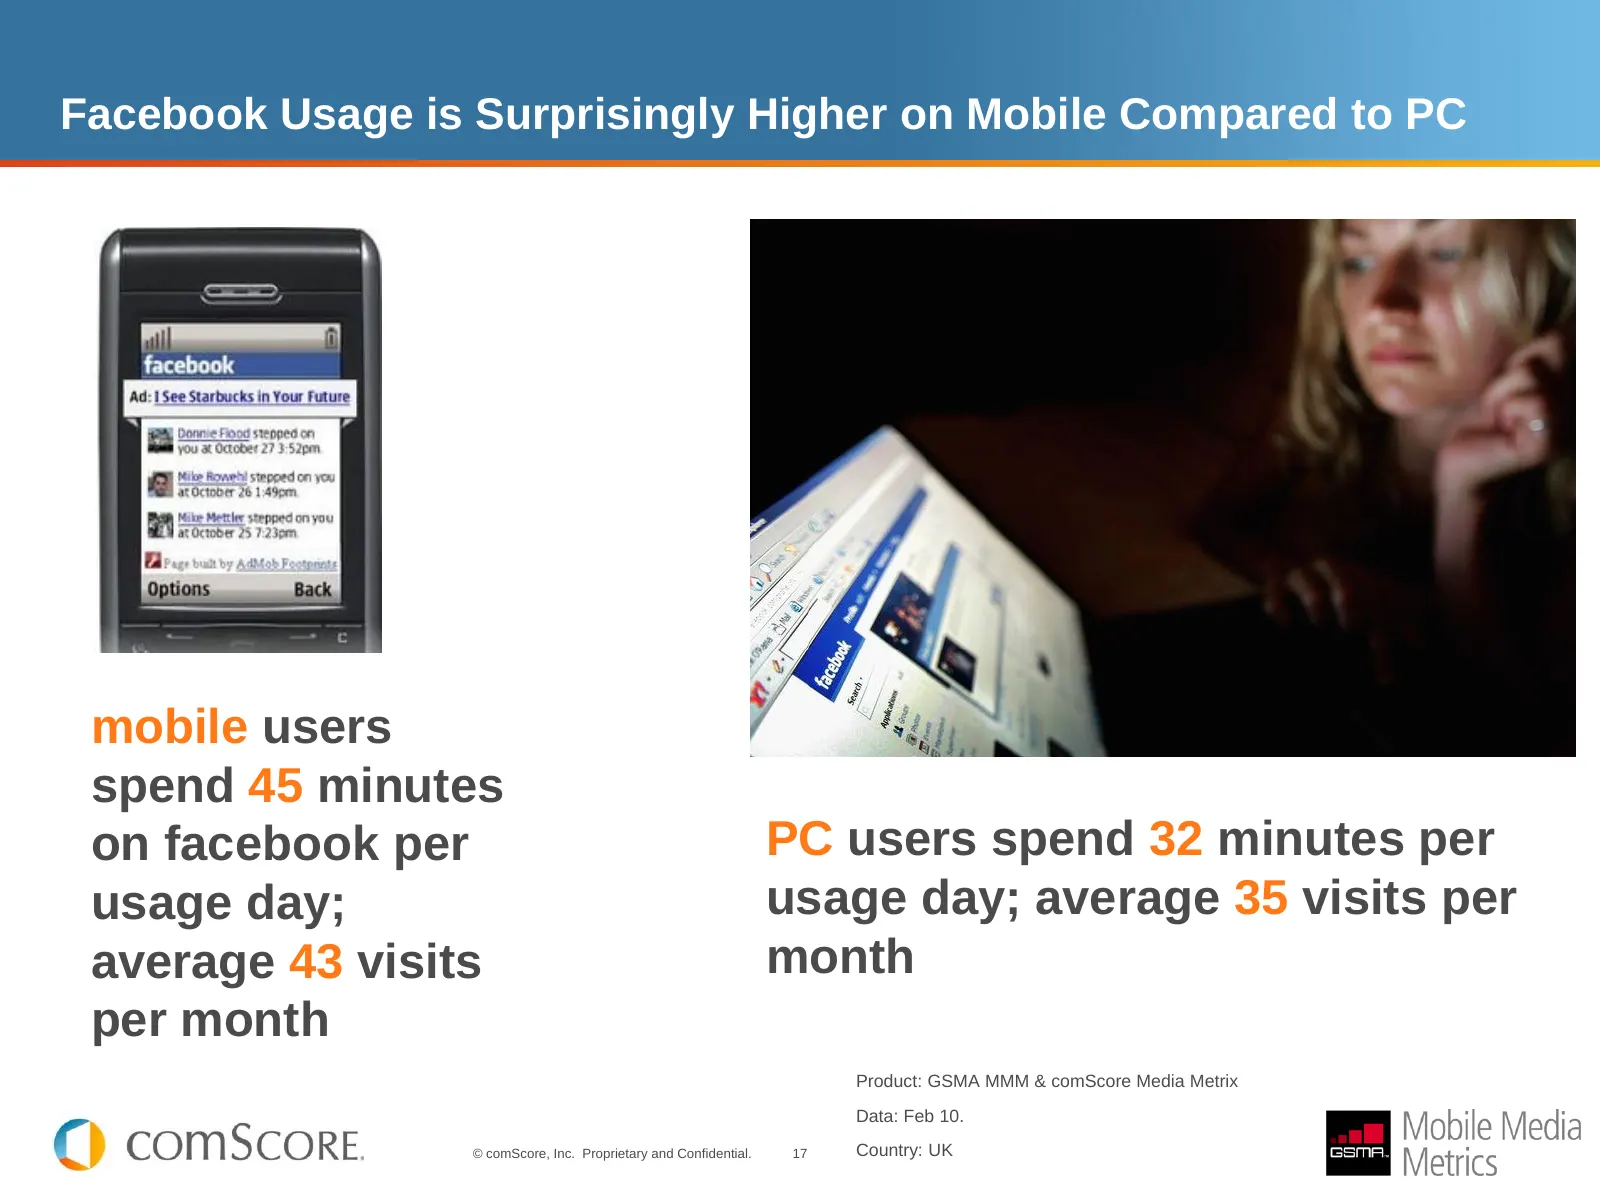
Slide 17: Facebook Usage is Higher on Mobile Compared to PC
Facebook Usage is Surprisingly Higher on Mobile Compared to PC mobile users spend 45 minutes on facebook per PC users spend 32 minutes per usage day; usage day; average 35 visits per average 43 visits month per month Product: GSMA MMM & comScore Media Metrix Data: Feb 10. © comScore, Inc. Proprietar
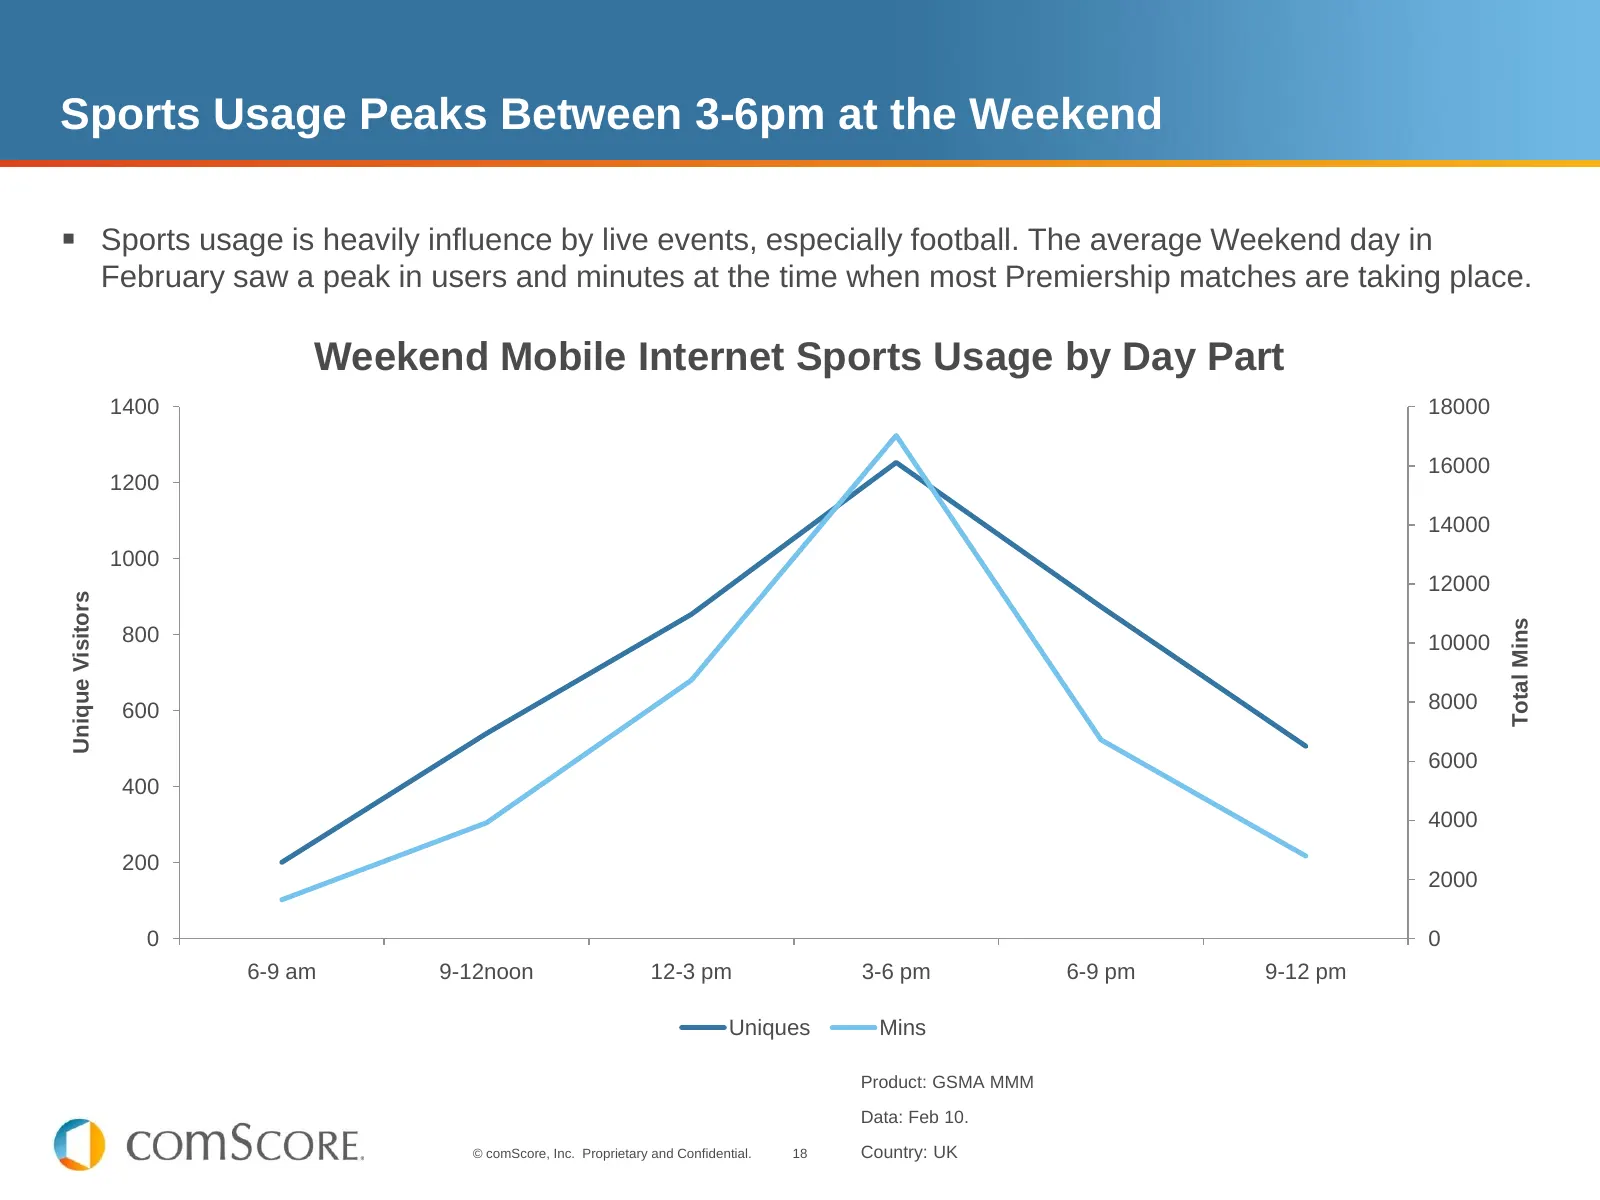
Slide 18: Sports Usage Peaks Between 3-6pm at the Weekend
Sports Usage Peaks Between 3-6pm at the Weekend Sports usage is heavily influence by live events, especially football. The average Weekend day in February saw a peak in users and minutes at the time when most Premiership matches are taking place. Weekend Mobile Internet Sports Usage by Day Part 14
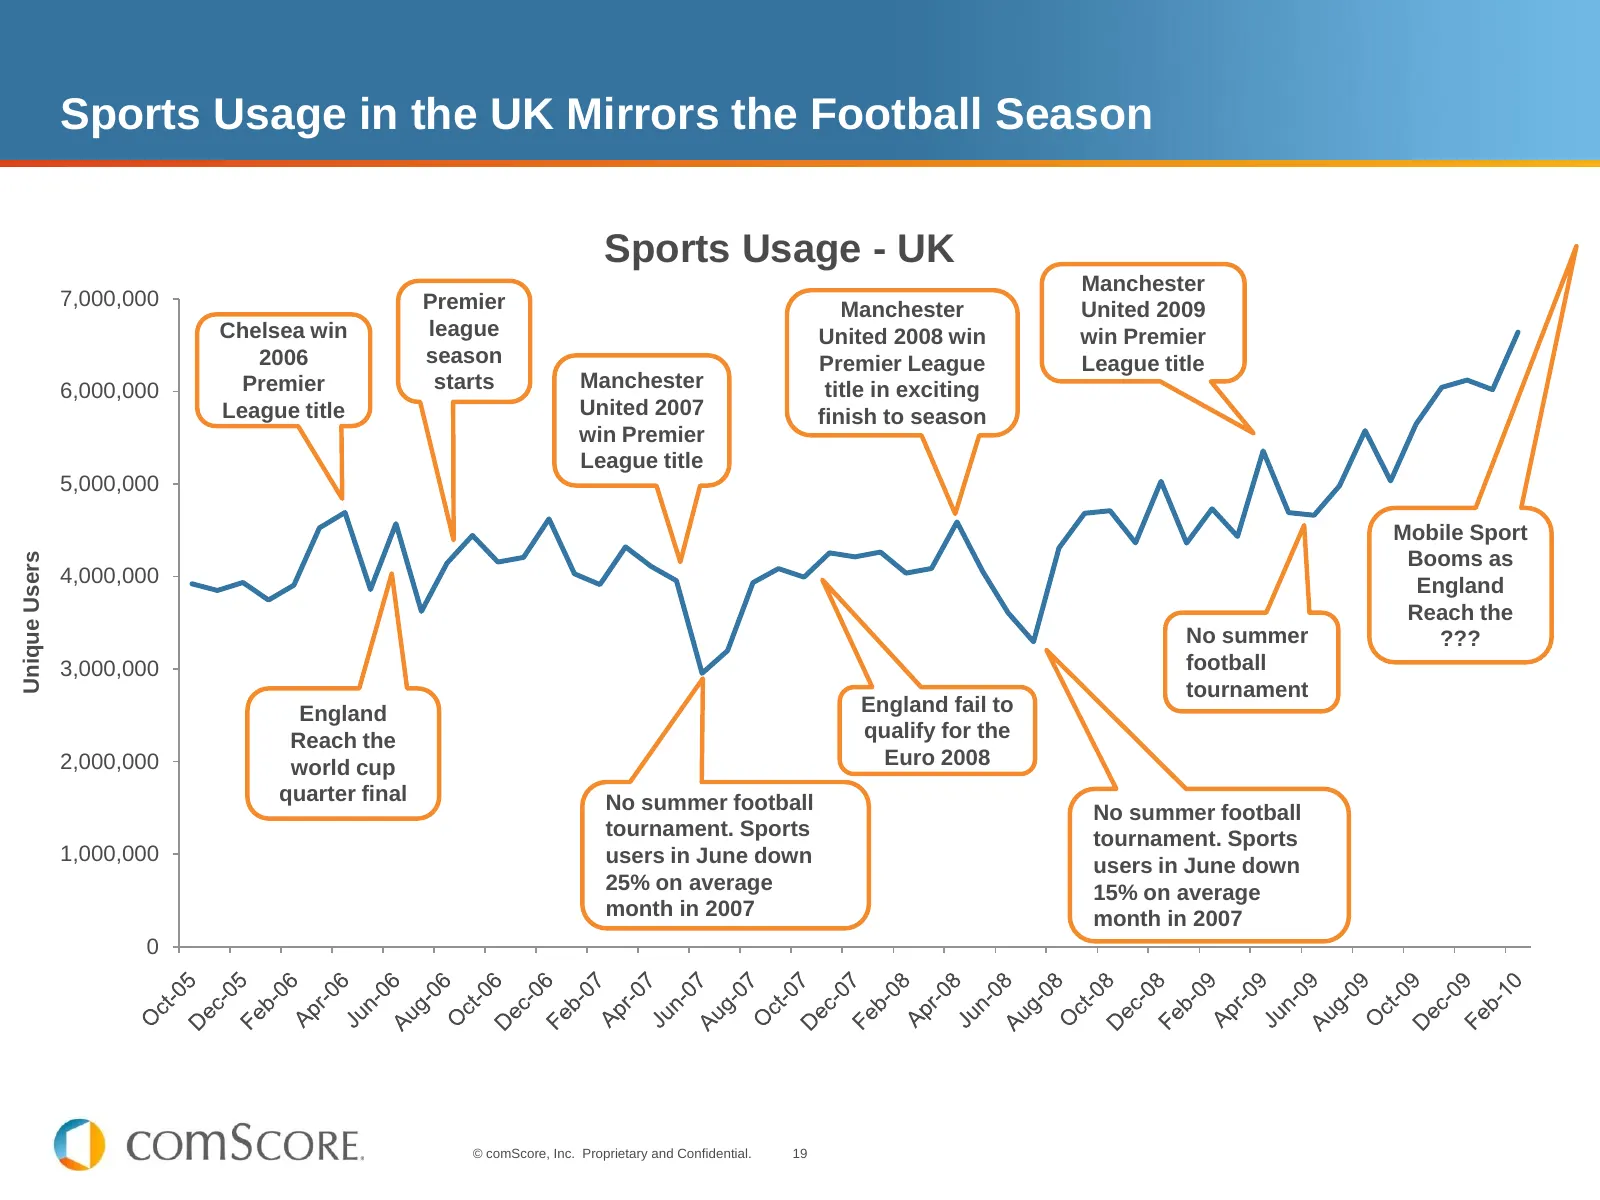
Slide 19: Sports Usage in the UK Mirrors the Football Season
Sports Usage in the UK Mirrors the Football Season Sports Usage - UK Manchester 7,000,000 Premier Manchester United 2009 Chelsea win league United 2008 win win Premier 2006 season Premier League League title 6,000,000 Premier starts Manchester title in exciting League title United 2007 finish to sea
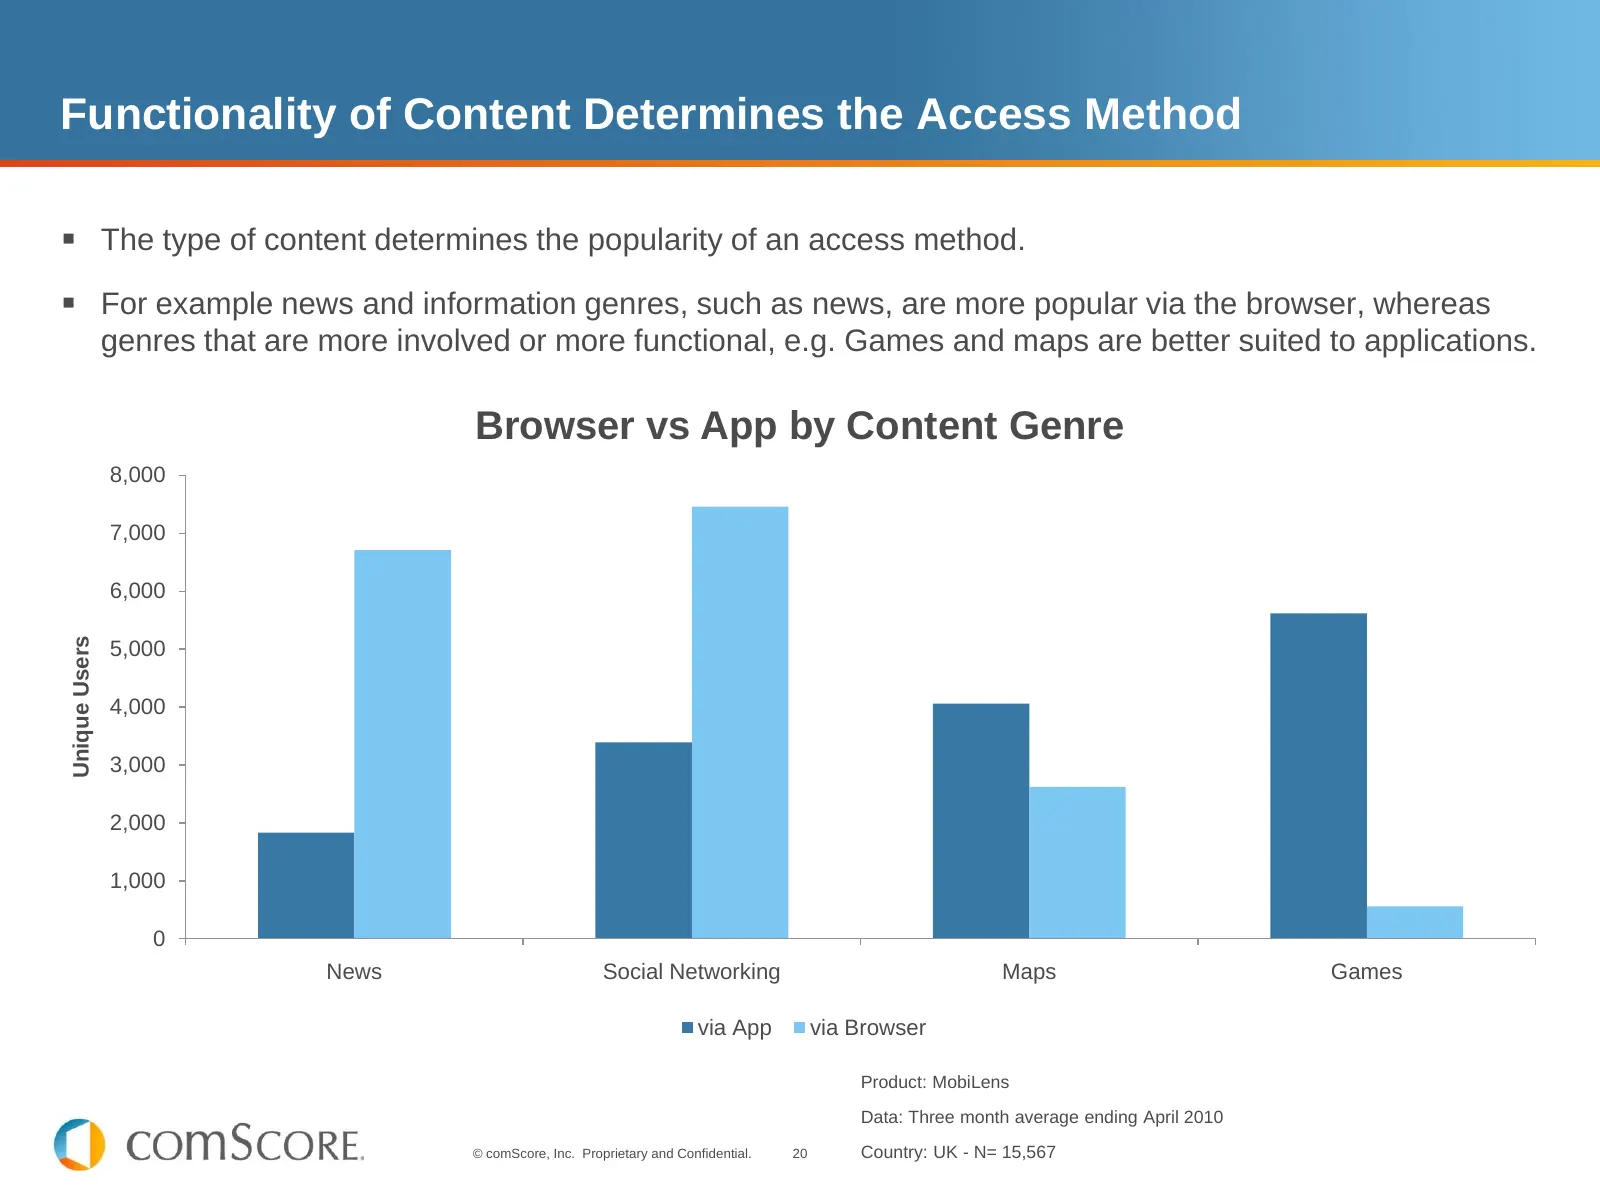
Slide 20: Functionality of Content Determines the Access Method
Functionality of Content Determines the Access Method The type of content determines the popularity of an access method. For example news and information genres, such as news, are more popular via the browser, whereas genres that are more involved or more functional, e.g. Games and maps are bett
Slide 21: Mobile Games Purchasers Flat
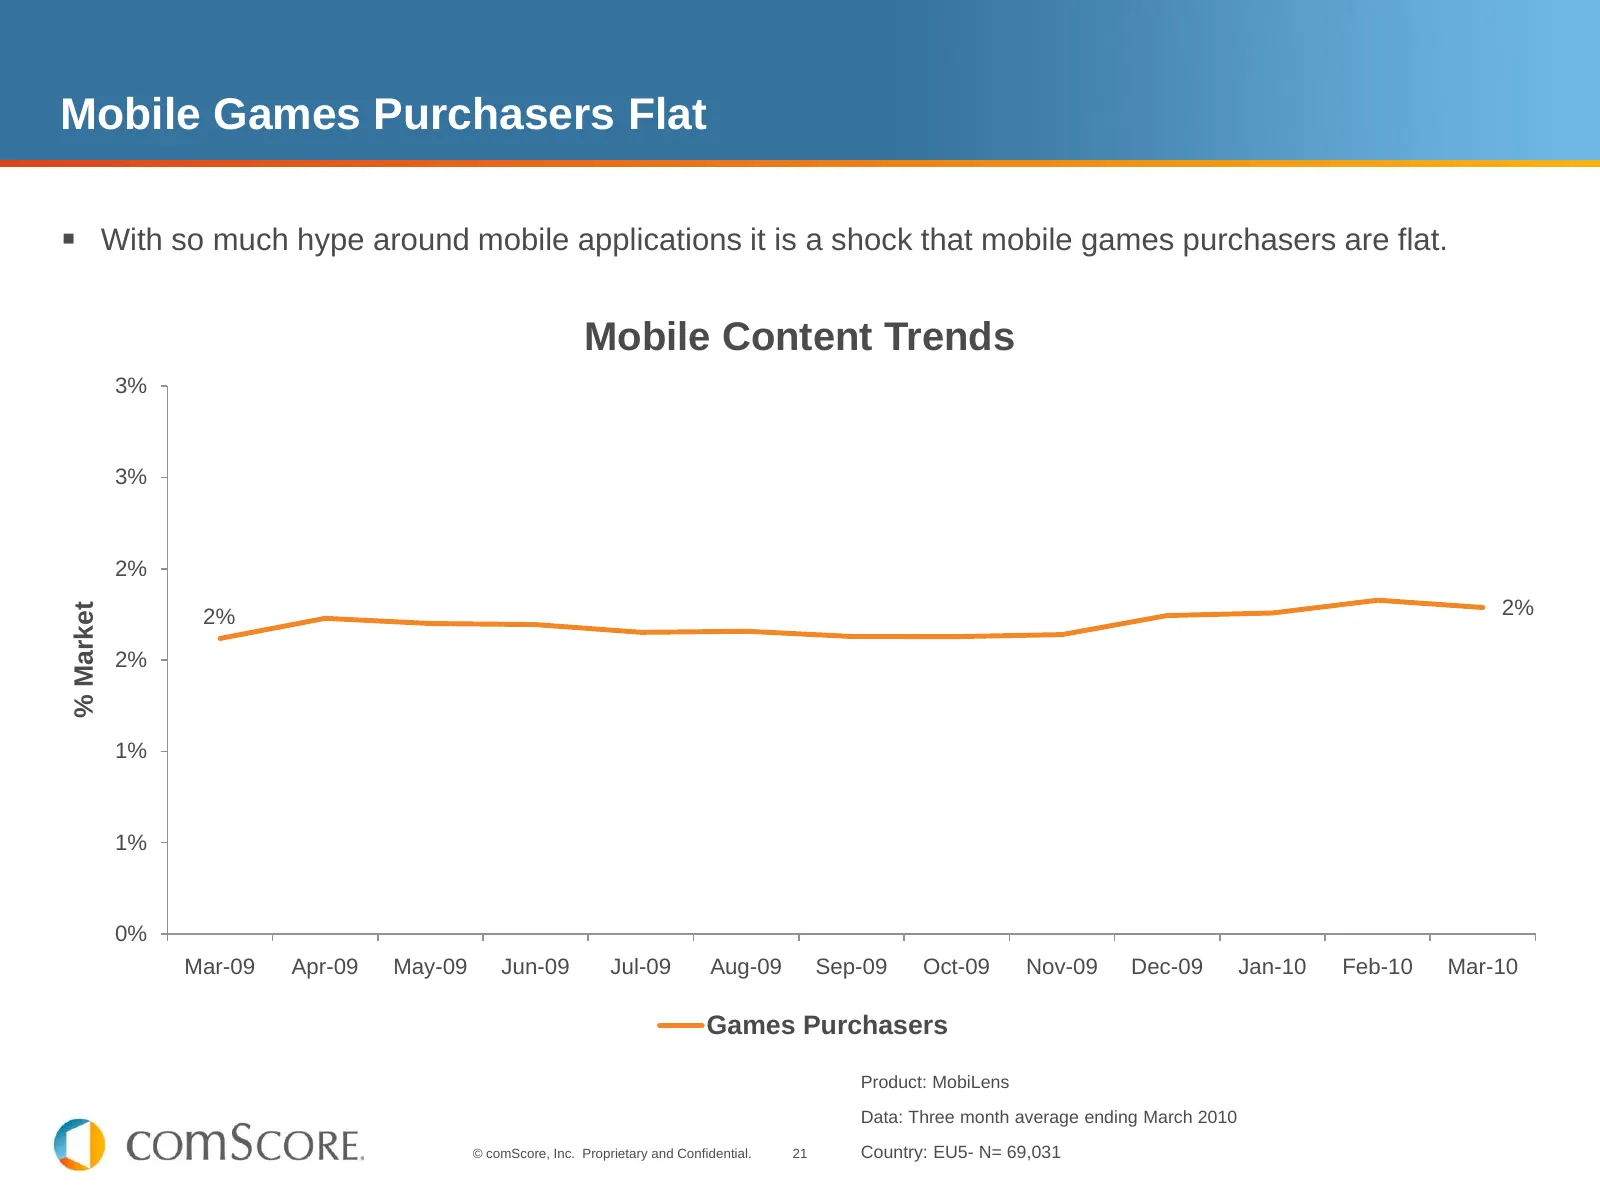
Mobile Games Purchasers Flat With so much hype around mobile applications it is a shock that mobile games purchasers are flat. Mobile Content Trends 3% 3% 2% 2% % Market 2% 2% 1% 1% 0% Mar-09 Apr-09 May-09 Jun-09 Jul-09 Aug-09 Sep-09 Oct-09 Nov-09 Dec-09 Jan-10 Feb-10 Mar-10 Games Purchasers Produ
Slide 22: Free Business Model Gaining Traction at Expense of Paid
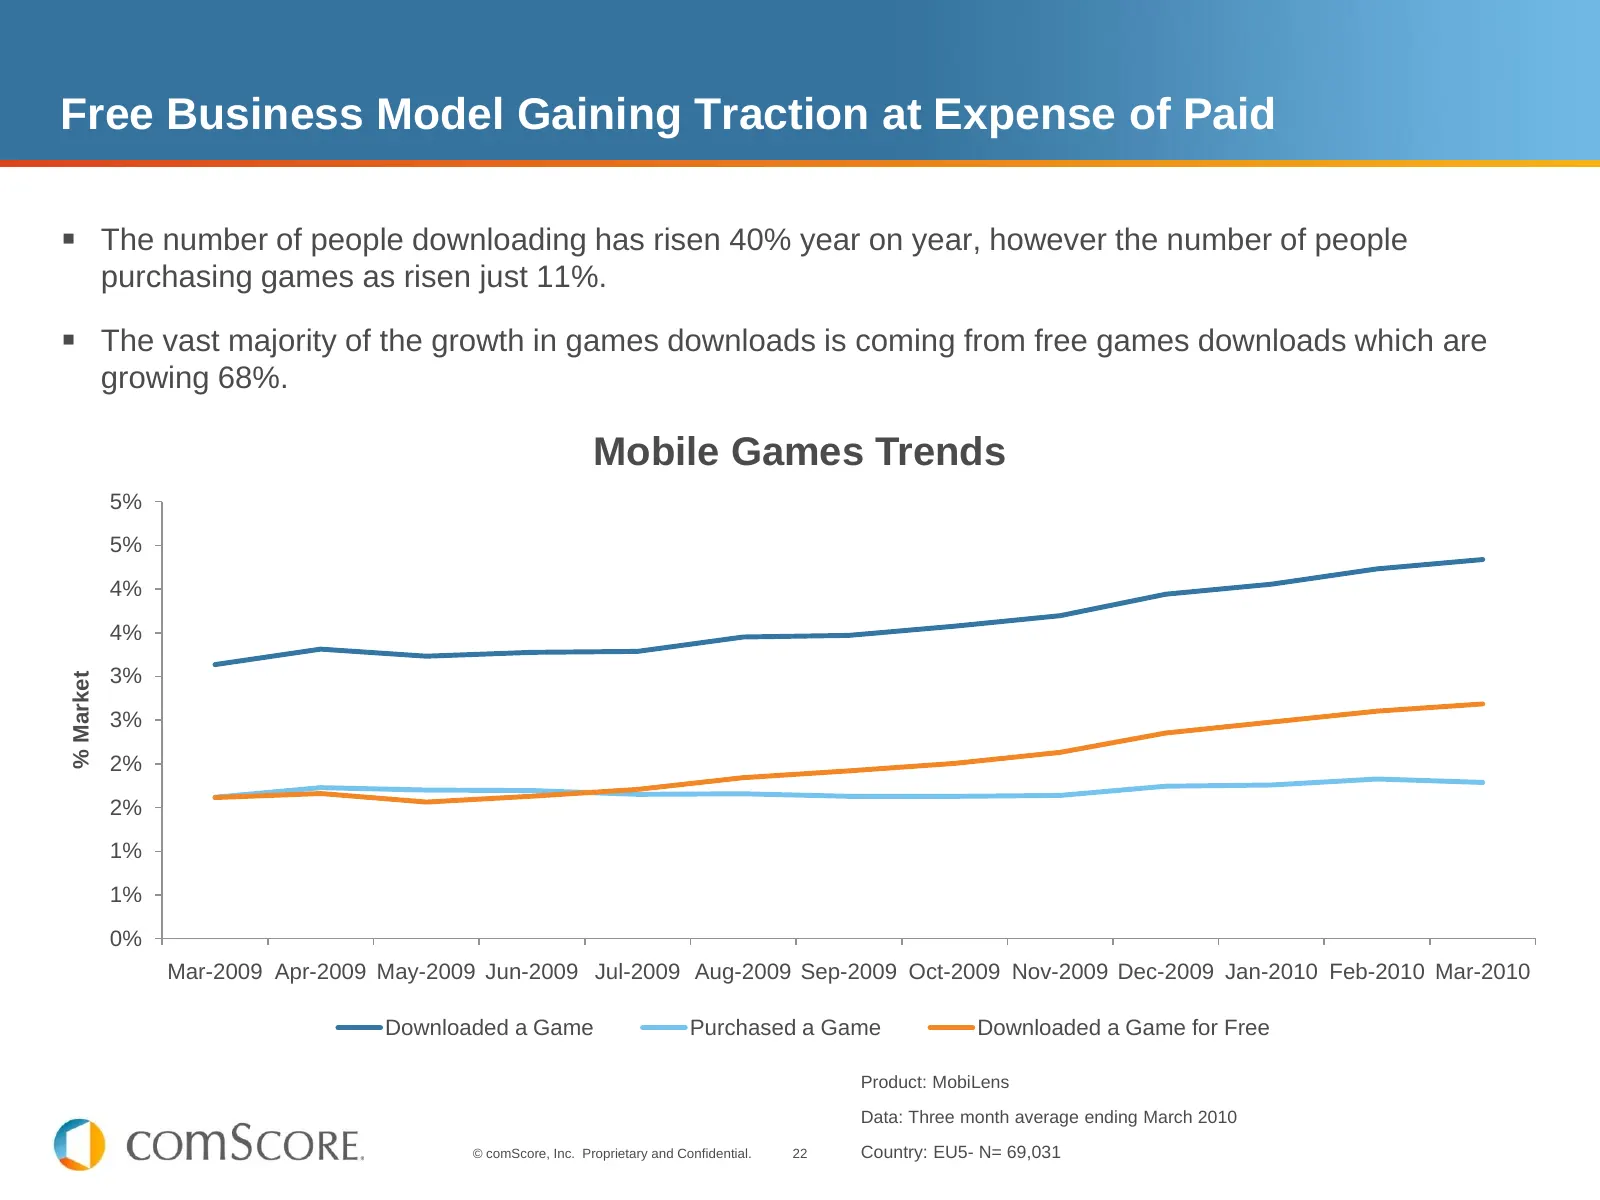
Free Business Model Gaining Traction at Expense of Paid The number of people downloading has risen 40% year on year, however the number of people purchasing games as risen just 11%. The vast majority of the growth in games downloads is coming from free games downloads which are growing 68%. Mobi
Slide 23: Steady Growth Continues for Mobile Banner Advertising
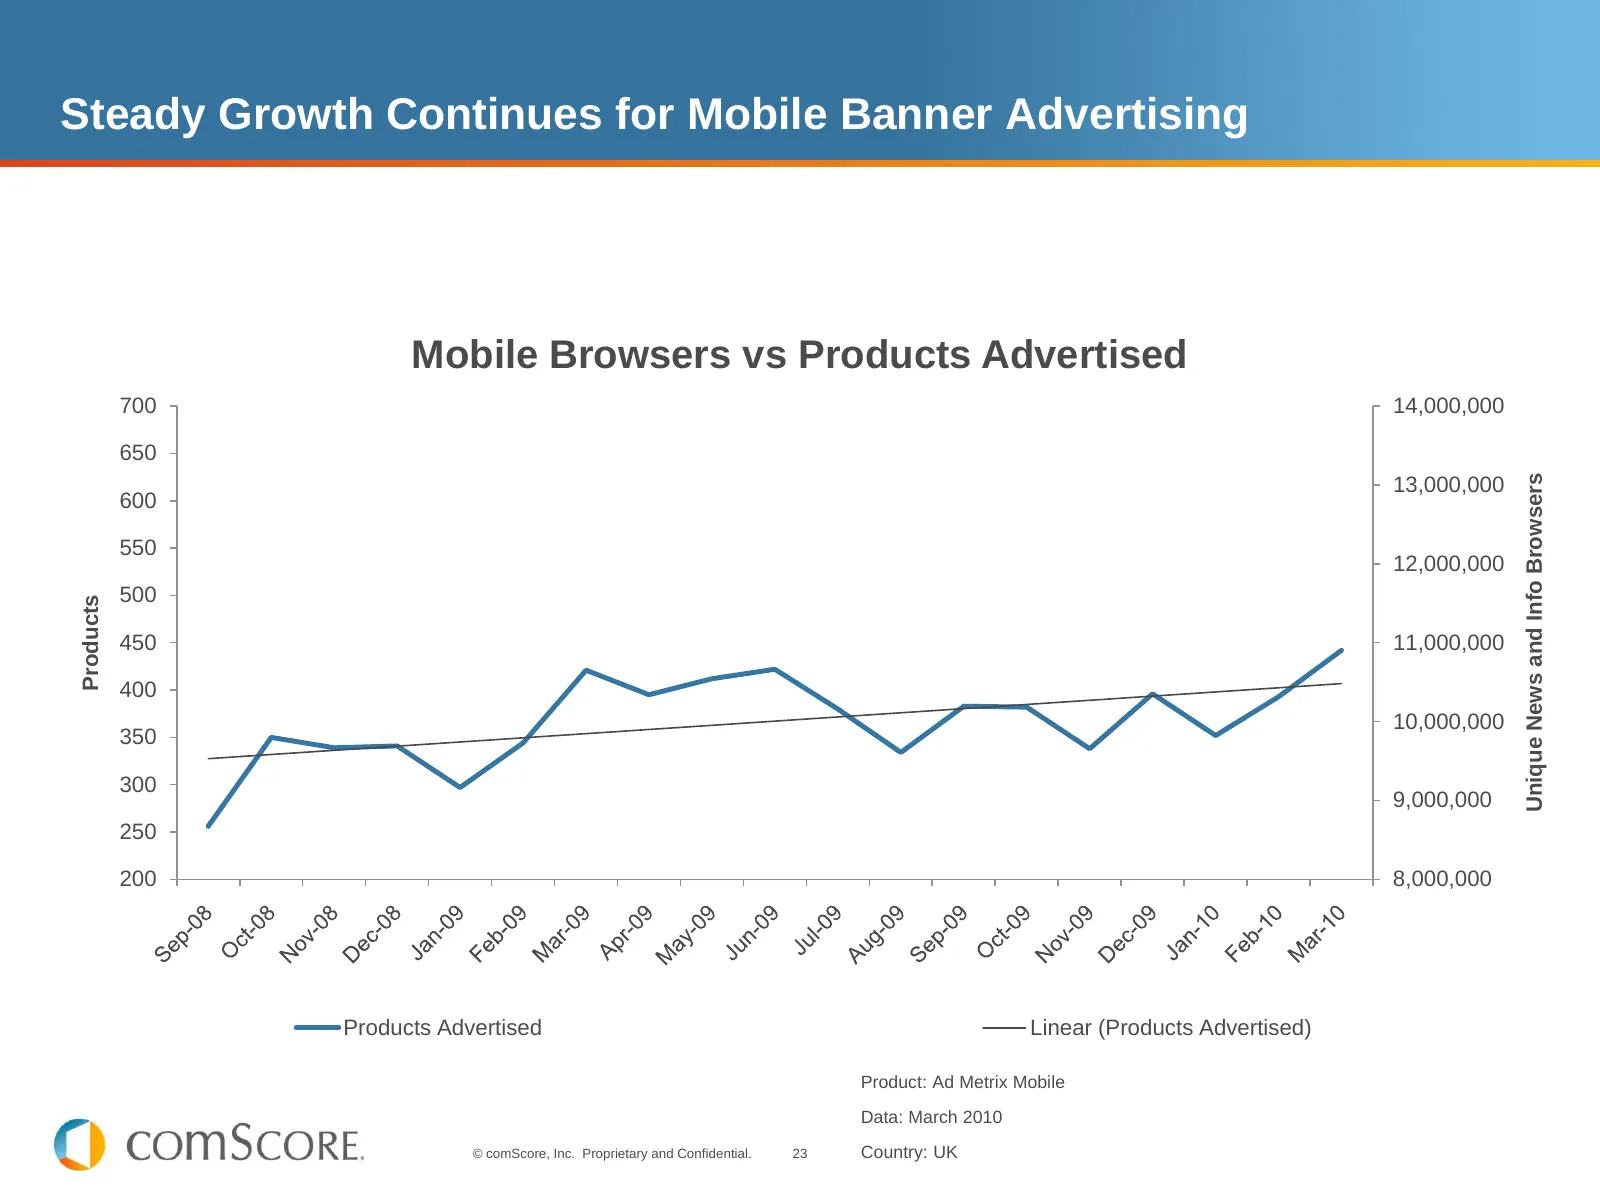
Steady Growth Continues for Mobile Banner Advertising Mobile Browsers vs Products Advertised 700 14,000,000 650 Unique News and Info Browsers 13,000,000 600 550 12,000,000 500 Products 450 11,000,000 400 10,000,000 350 300 9,000,000 250 200 8,000,000 Products Advertised Mobile News + Info Browsers L
Slide 24: Steady Growth Continues for Mobile Banner Advertising
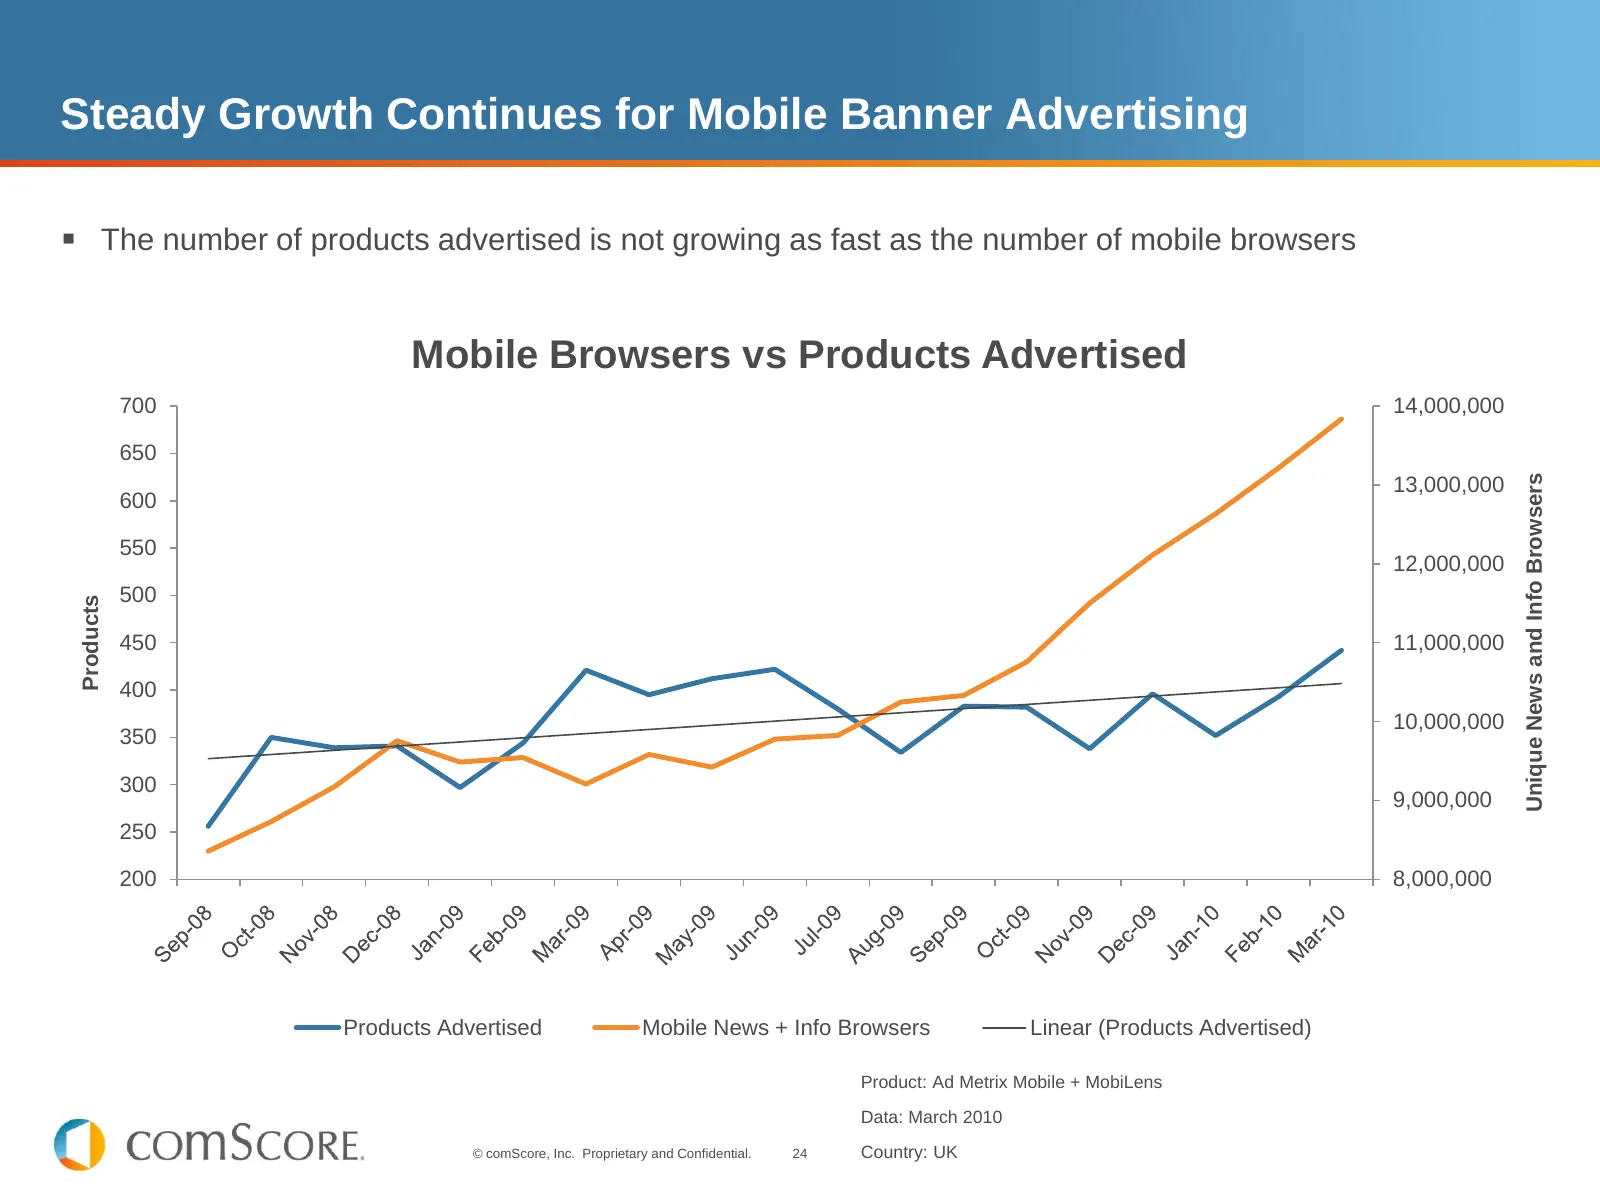
Steady Growth Continues for Mobile Banner Advertising The number of products advertised is not growing as fast as the number of mobile browsers Mobile Browsers vs Products Advertised 700 14,000,000 650 Unique News and Info Browsers 13,000,000 600 550 12,000,000 500 Products 450 11,000,000 400 10,0
Slide 25: Ad Spend is Not Following the Consumers Digital Behaviour
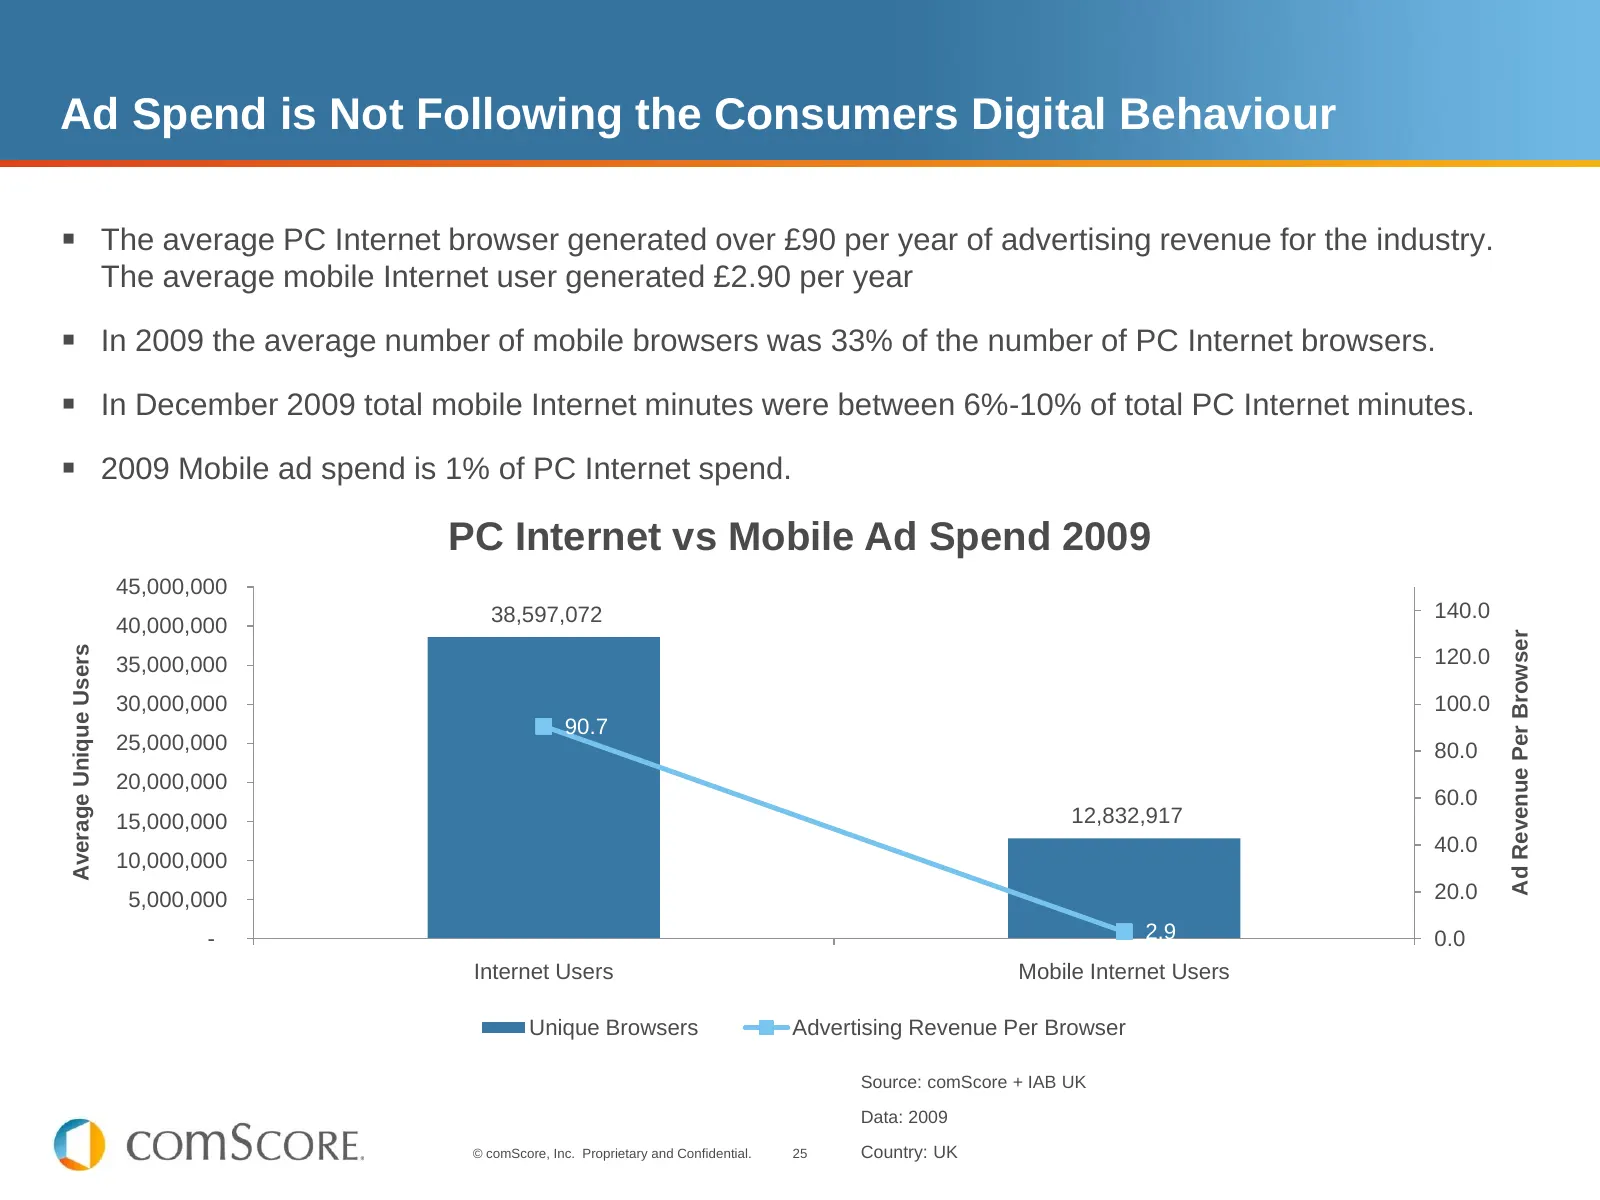
Ad Spend is Not Following the Consumers Digital Behaviour The average PC Internet browser generated over £90 per year of advertising revenue for the industry. The average mobile Internet user generated £2.90 per year In 2009 the average number of mobile browsers was 33% of the number of PC Inter
Slide 26: © comScore, Inc. Proprietary and Confidential.
© comScore, Inc. Proprietary and Confidential. 26
Slide 27: Smartphones
Smartphones © comScore, Inc. Proprietary and Confidential. 27
Slide 28: Growth of Smartphone Ownership in EU5
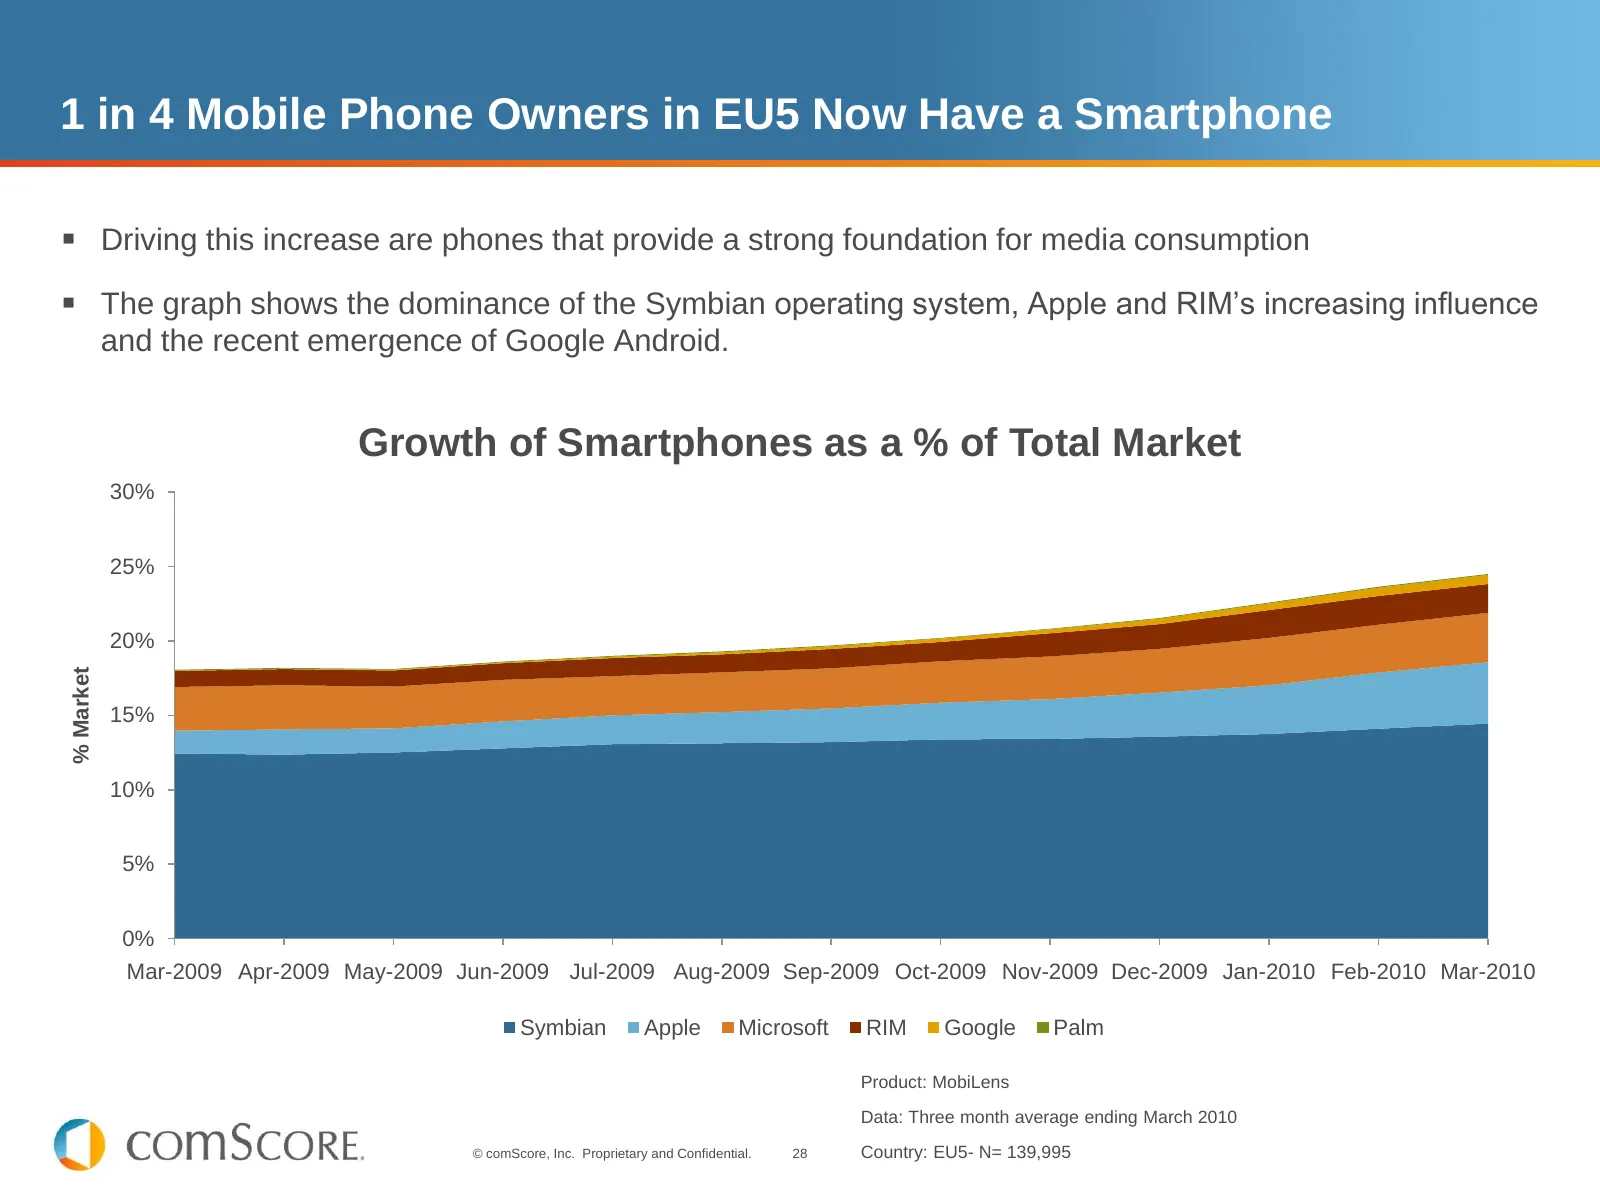
1 in 4 Mobile Phone Owners in EU5 Now Have a Smartphone Driving this increase are phones that provide a strong foundation for media consumption The graph shows the dominance of the Symbian operating system, Apple and RIM’s increasing influence and the recent emergence of Google Android. Growth o
Slide 29: Symbian Owners Growing but Losing Share
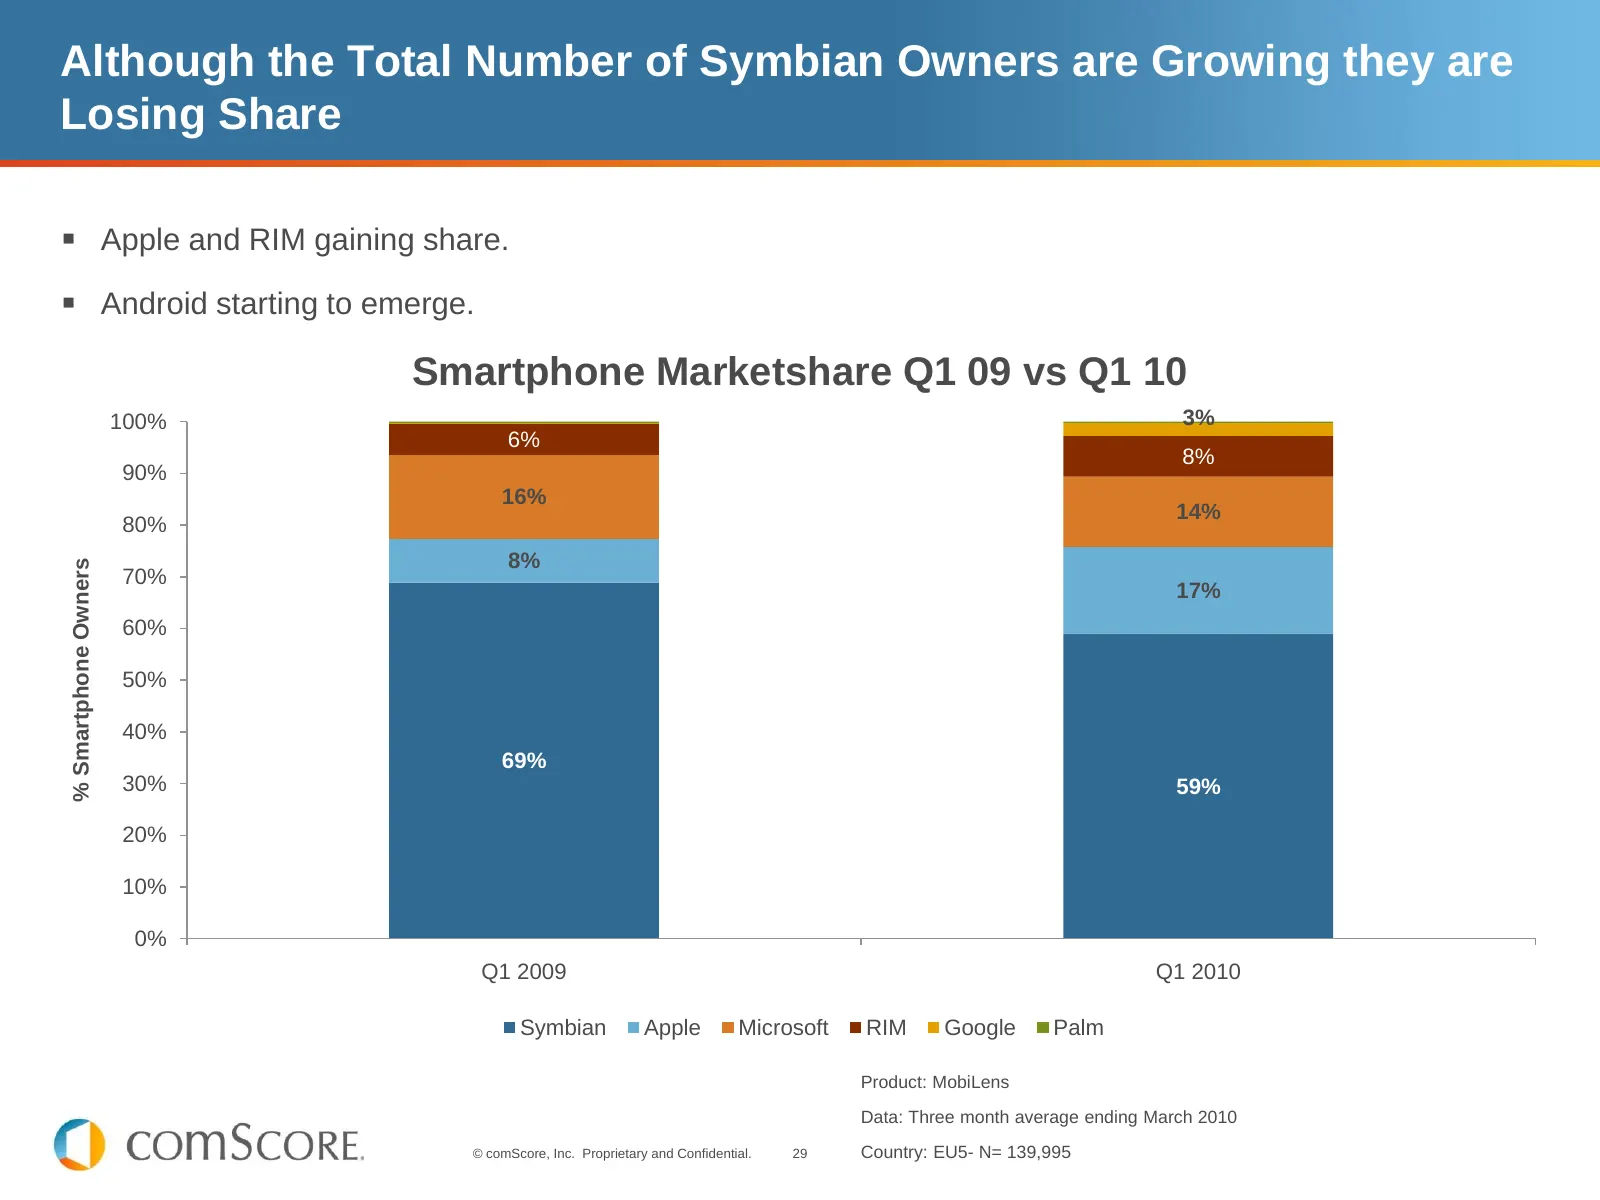
Although the Total Number of Symbian Owners are Growing they are Losing Share Apple and RIM gaining share. Android starting to emerge. Smartphone Marketshare Q1 09 vs Q1 10 100% 3% 6% 8% 90% 16% 14% 80% 8% % Smartphone Owners 70% 17% 60% 50% 40% 69% 30% 59% 20% 10% 0% Q1 2009 Q1 2010 Symbian App
Slide 30: The Tail of Two Touch Screen Smartphones
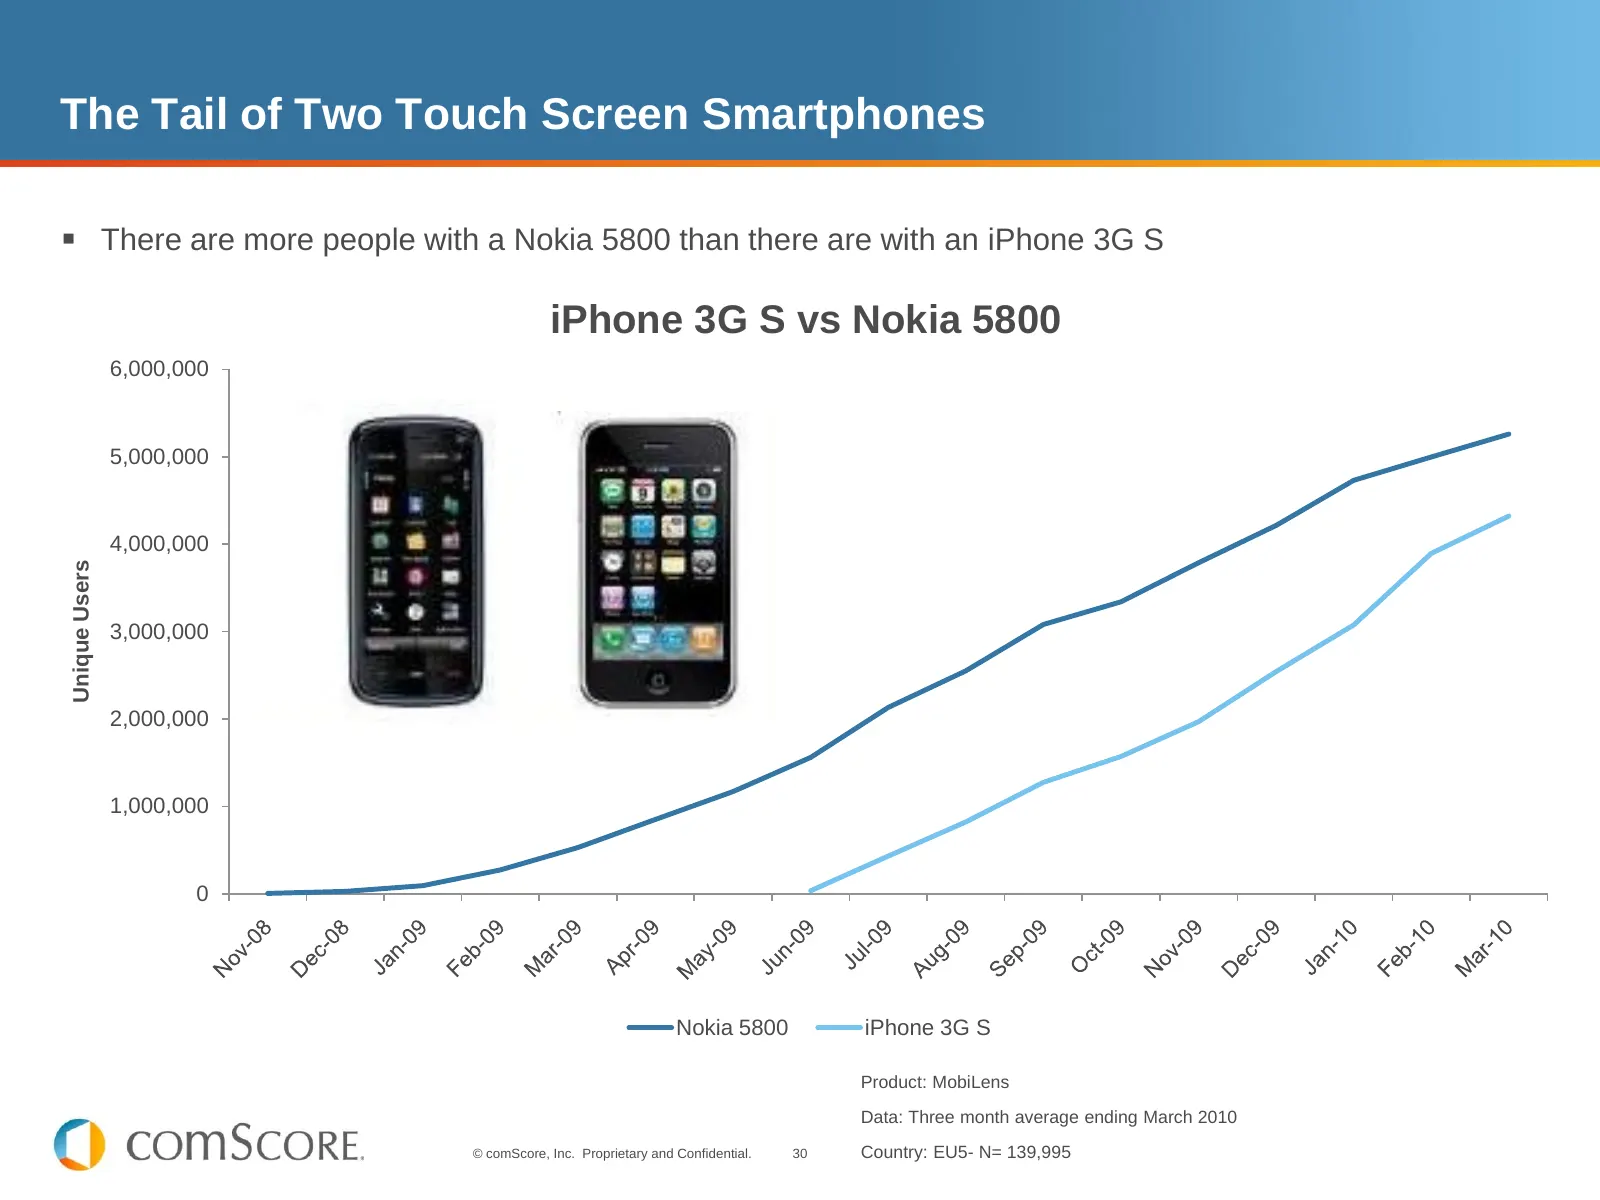
The Tail of Two Touch Screen Smartphones There are more people with a Nokia 5800 than there are with an iPhone 3G S iPhone 3G S vs Nokia 5800 6,000,000 5,000,000 4,000,000 Unique Users 3,000,000 2,000,000 1,000,000 0 Nokia 5800 iPhone 3G S Product: MobiLens Data: Three month average ending March 2
Slide 31: Smartphone Owners More Likely to Use Mobile Media
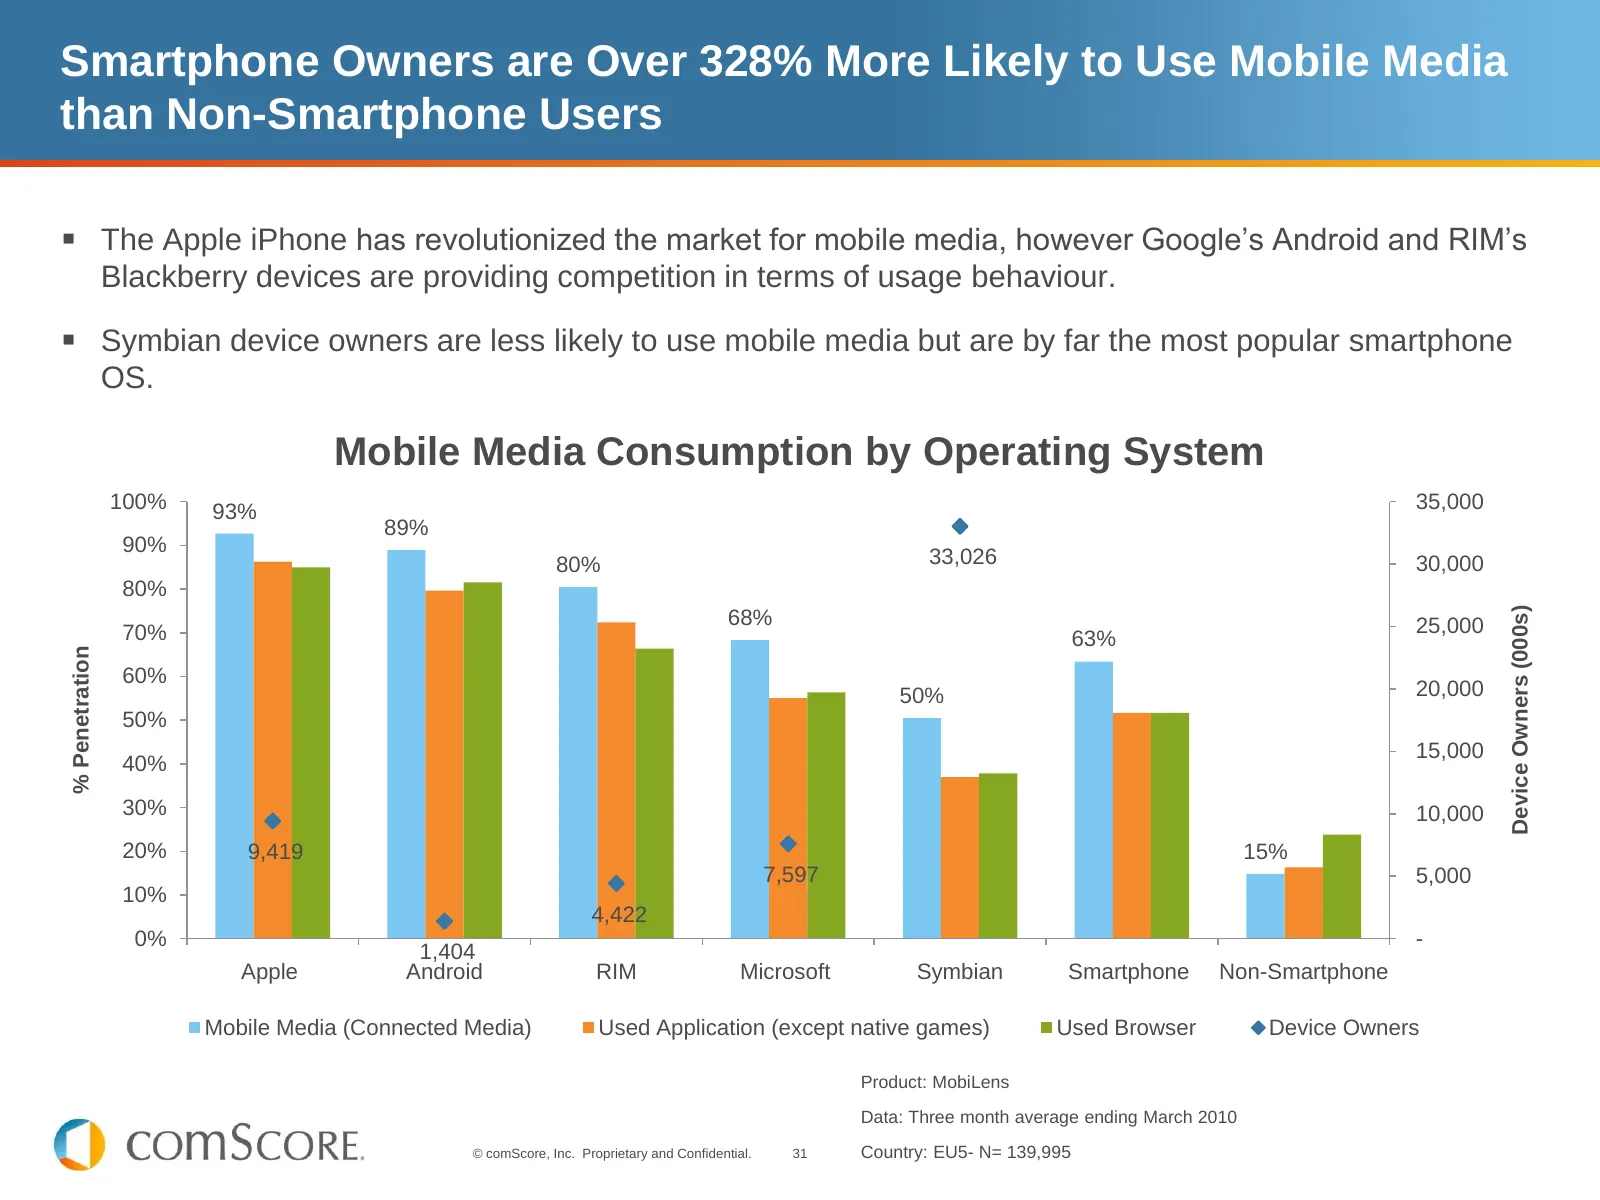
Smartphone Owners are Over 328% More Likely to Use Mobile Media than Non-Smartphone Users The Apple iPhone has revolutionized the market for mobile media, however Google’s Android and RIM’s Blackberry devices are providing competition in terms of usage behaviour. Symbian device owners are less l

Slide 32: Summing Up
Summing Up © comScore, Inc. Proprietary and Confidential. 32
Slide 33: Summing Up: The Big Picture
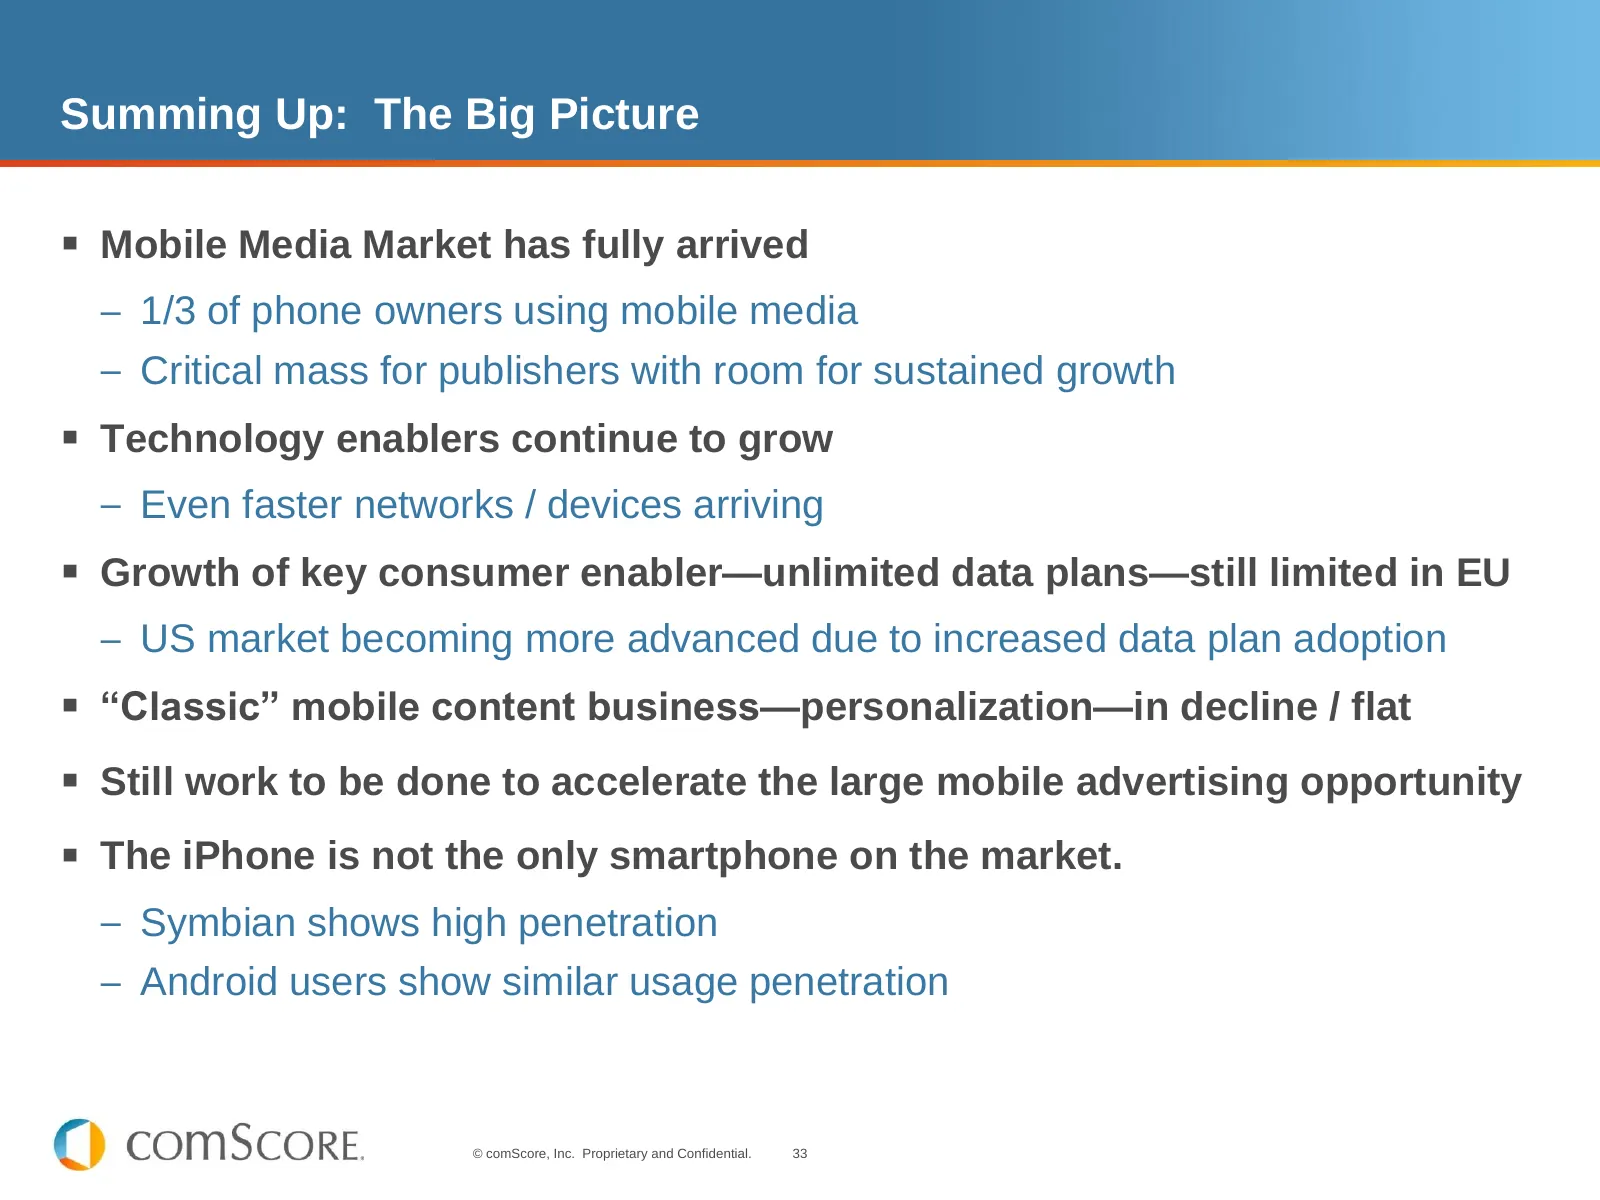
Summing Up: The Big Picture Mobile Media Market has fully arrived – 1/3 of phone owners using mobile media – Critical mass for publishers with room for sustained growth Technology enablers continue to grow – Even faster networks / devices arriving Growth of key consumer enabler—unlimited data

Slide 34: Thank You.
Thank You. THE GLOBAL SOURCE OF DIGITAL MARKET INTELLIGENCE™ For more information, please contact comScore Mobile info@comscore.com
Source: Internet Archive copy of comscore.com
More decks from comScore, Inc.
 Q3 2026 Earnings Presentation17 slides · Nov 3, 2026
 Q2 2026 Earnings Presentation20 slides · Aug 12, 2026
 Investor Presentation (June 2026)27 slides · Jun 10, 2026
 Q4 2025 Earnings Presentation13 slides · Mar 17, 2026
 Q3 2025 Earnings Presentation15 slides · Nov 4, 2025
 Q2 2025 Earnings Presentation11 slides · Aug 5, 2025