FGC Rosseti · RUS:FEES
FGC Rosseti — Federal Grid Company — FY2014 Earnings Presentation
15 slides from FGC Rosseti's earnings presentation, April 2015
Slide 1: IFRS FY2014 Operational and Financial Results
Federal Grid Company IFRS FY2014 Operational and Financial Results Andrey Kazachenkov First Deputy Chairman of the Management Board LISTED April 2015 STANDARD DEPOSITARY RECEIPTS
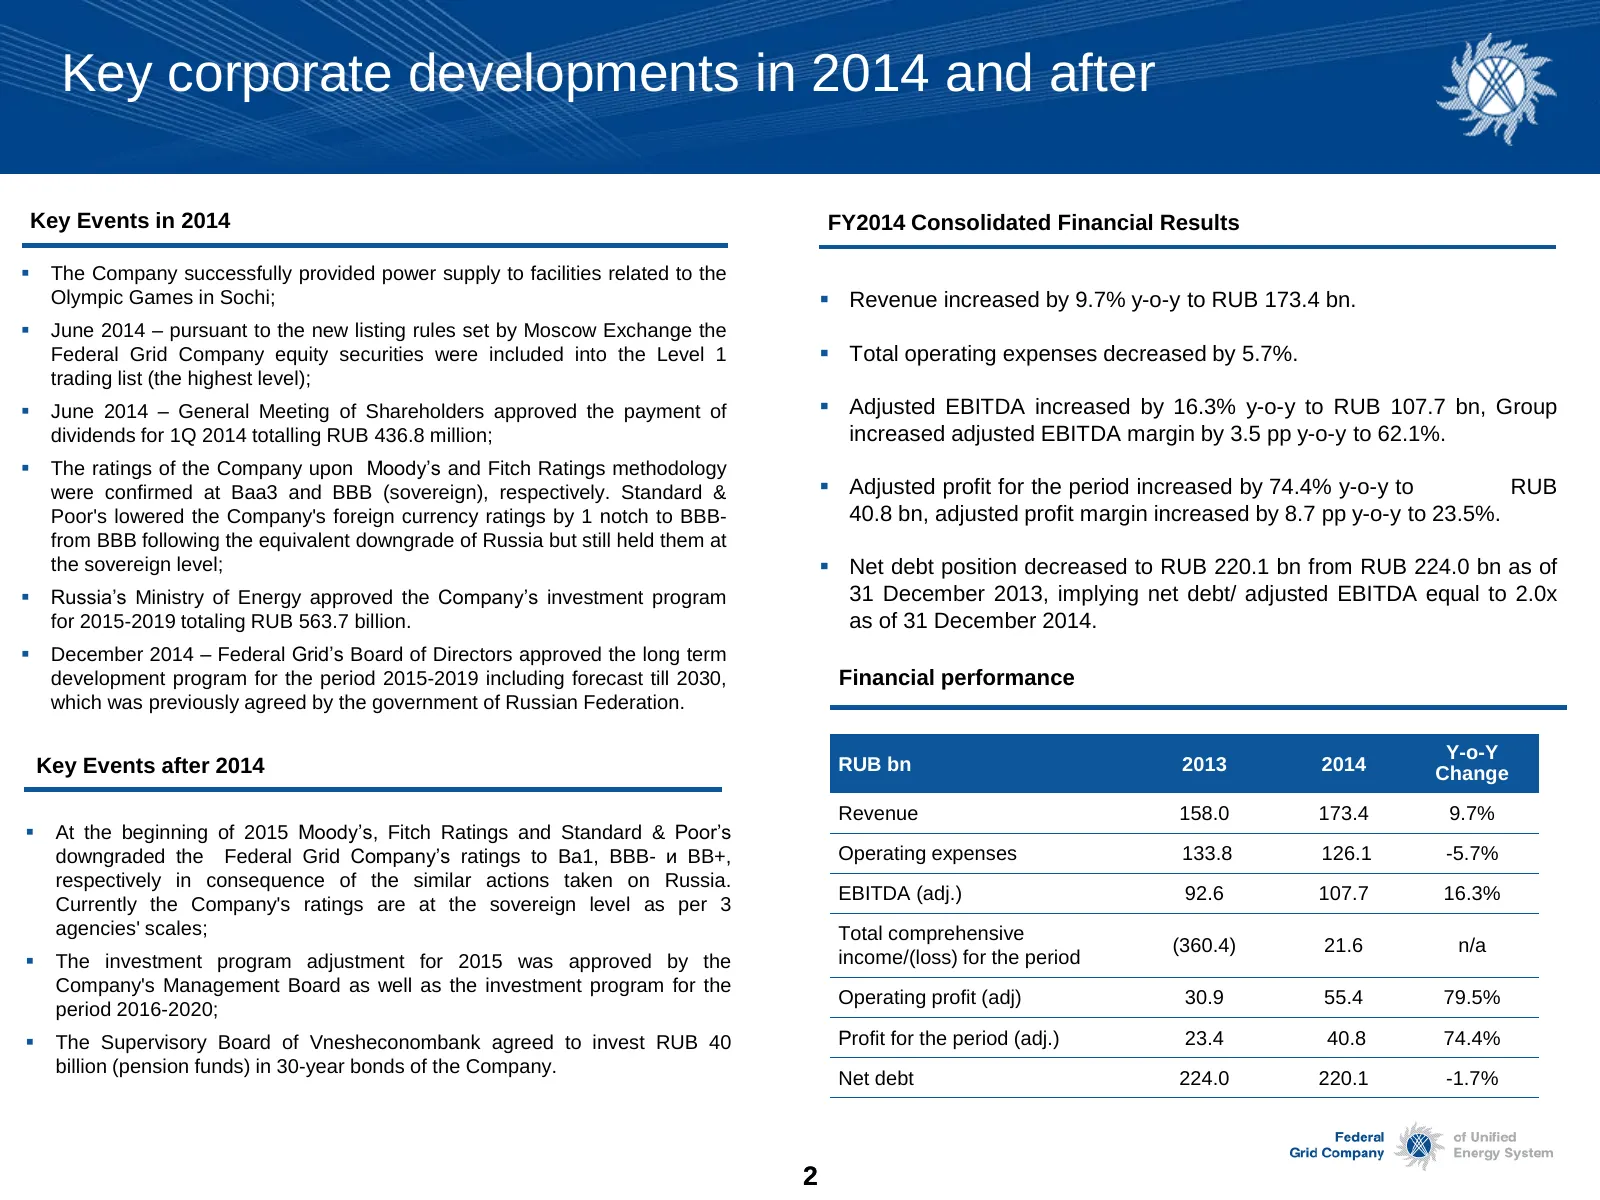
Slide 2: Key corporate developments in 2014 and after
Key corporate developments in 2014 and after Key Events in 2014 FY2014 Consolidated Financial Results The Company successfully provided power supply to facilities related to the Olympic Games in Sochi; Revenue increased by 9.7% y-o-y to RUB 173.4 bn. June 2014 – pursuant to the new listing rul
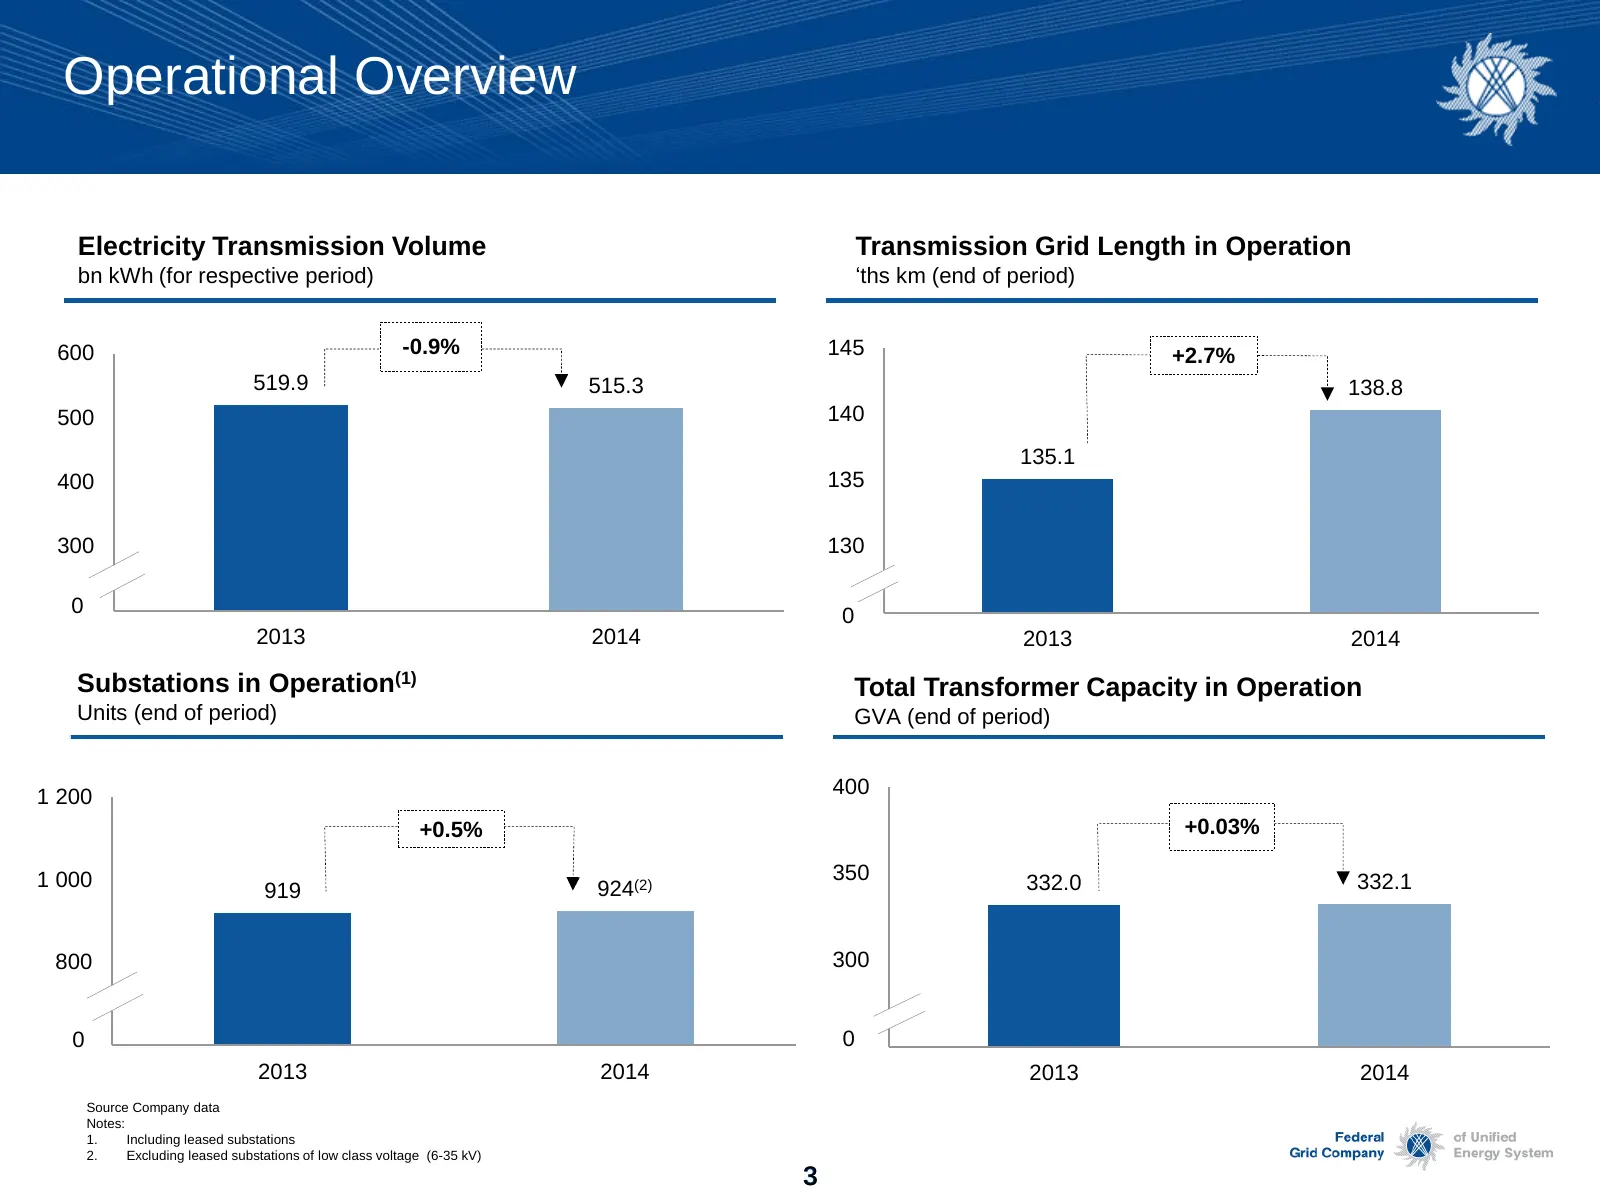
Slide 3: Operational Overview
Operational Overview Electricity Transmission Volume Transmission Grid Length in Operation bn kWh (for respective period) ‘ths km (end of period) 600 -0.9% 145 +2.7% 519.9 515.3 138.8 500 140 135.1 400 135 300 130 0 200 125 0 2013 2014 2013 2014 Substations in Operation(1) Total Transformer Capacity
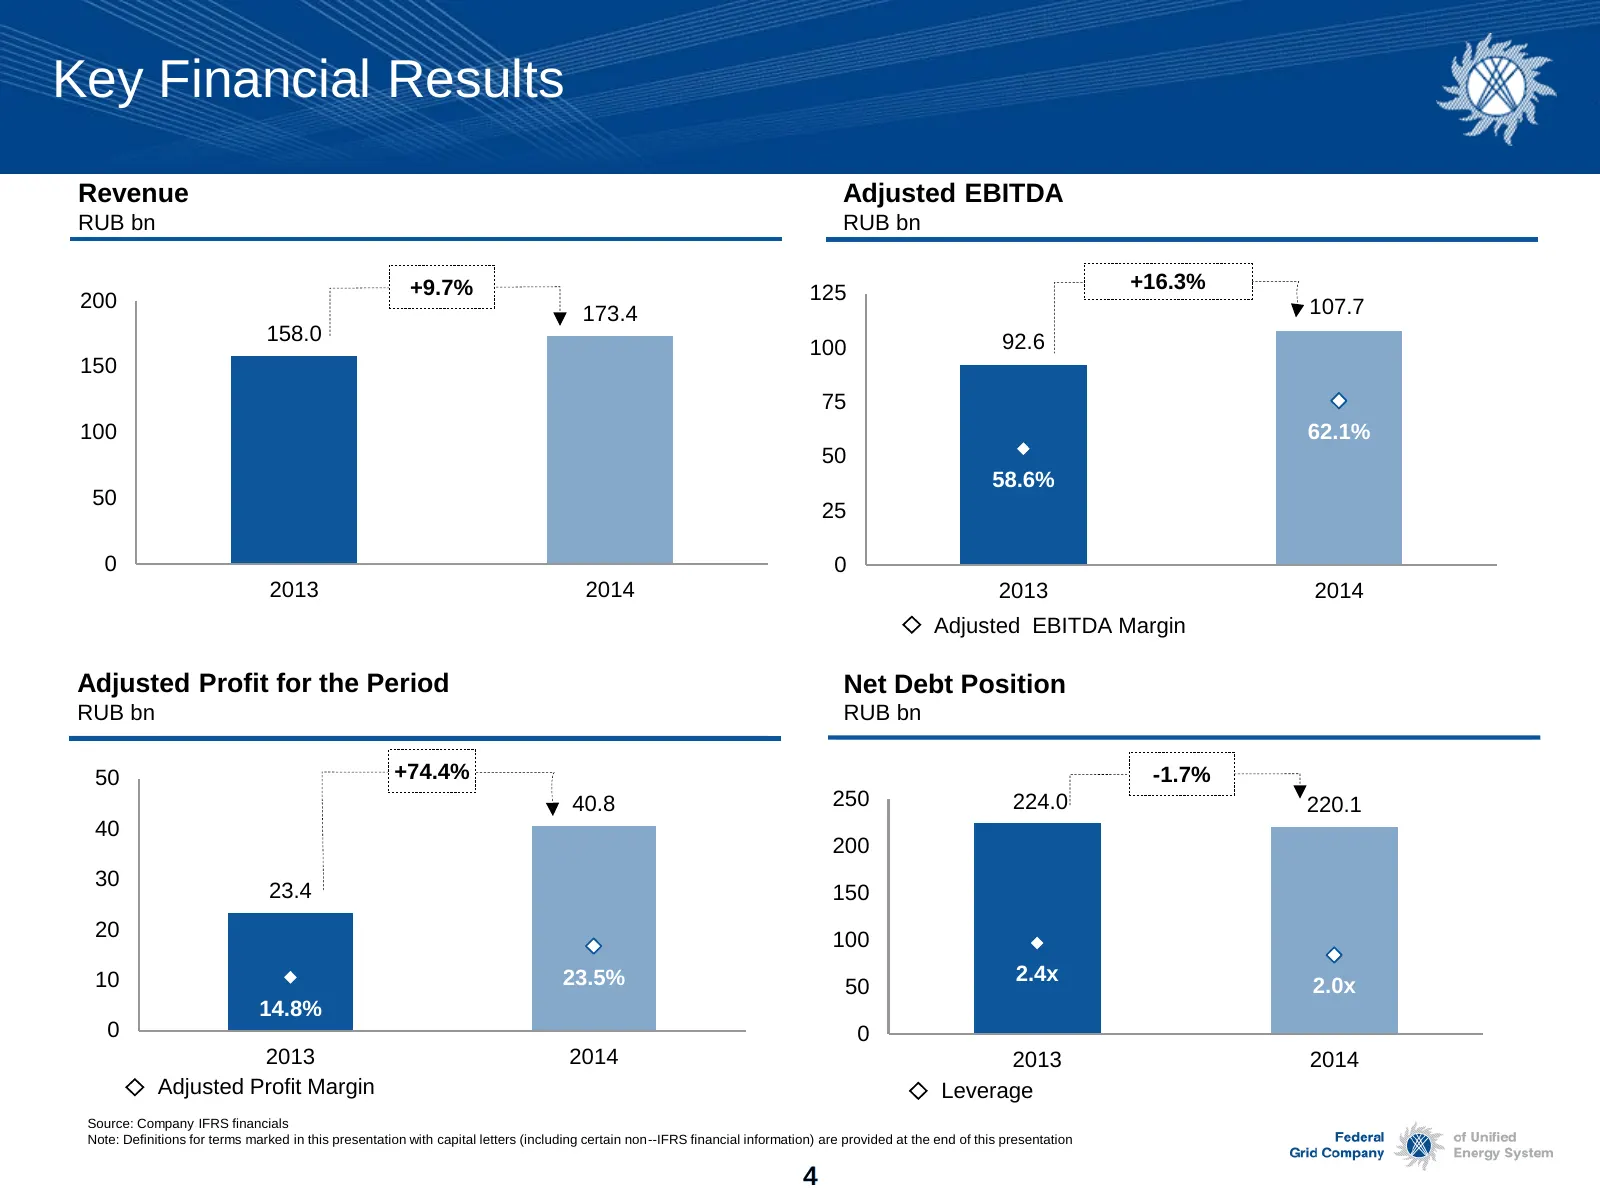
Slide 4: Key Financial Results
Key Financial Results Revenue Adjusted EBITDA RUB bn RUB bn +9.7% +16.3% 200 125 70,0 173.4 107.7 158.0 92.6 100 150 65,0 75 100 62.1% 60,0 50 58.6% 50 55,0 25 0 0 50,0 2013 2014 2013 2014 Adjusted EBITDA Margin Adjusted Profit for the Period Net Debt Position RUB bn RUB bn 50 +74.4% -1.7% 40.8 250
Slide 5: Revenue Structure
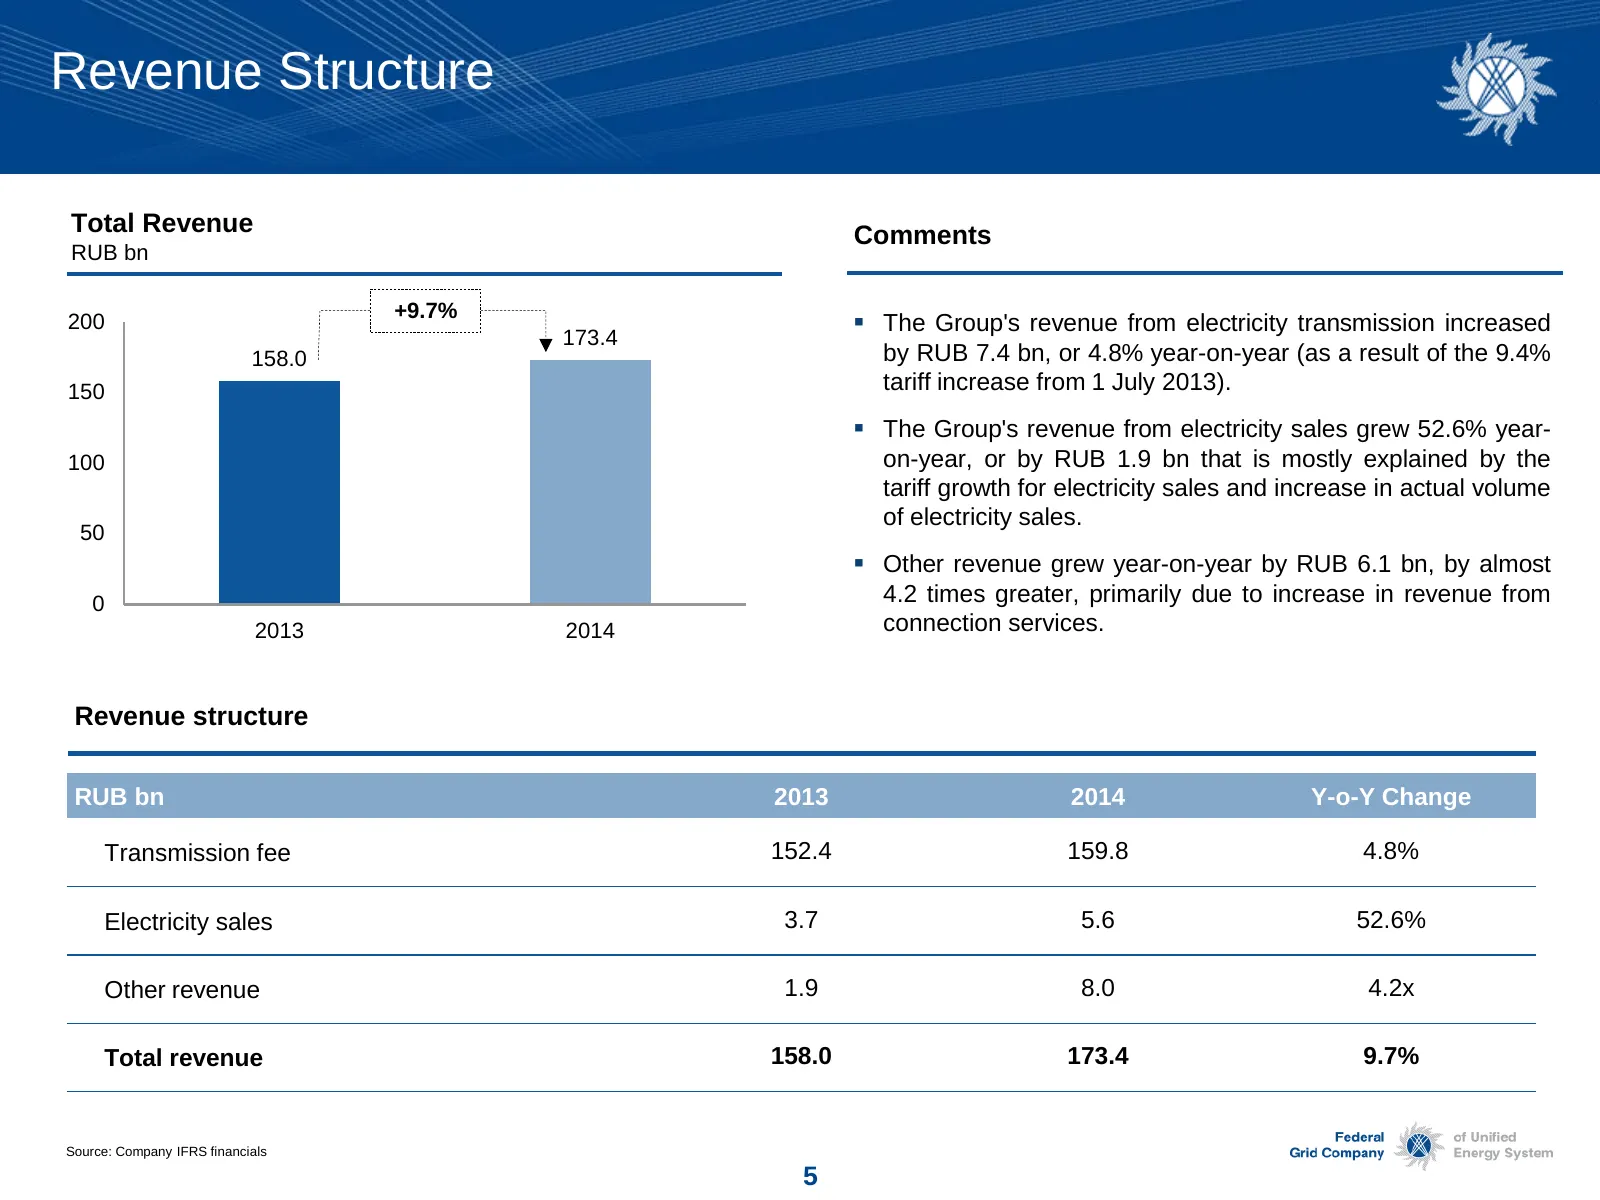
Revenue Structure Total Revenue Comments RUB bn +9.7% 200 The Group's revenue from electricity transmission increased 173.4 158.0 by RUB 7.4 bn, or 4.8% year-on-year (as a result of the 9.4% 150 tariff increase from 1 July 2013). The Group's revenue from electricity sales grew 52.6% year- 100 on
Slide 6: Operating Cost Structure
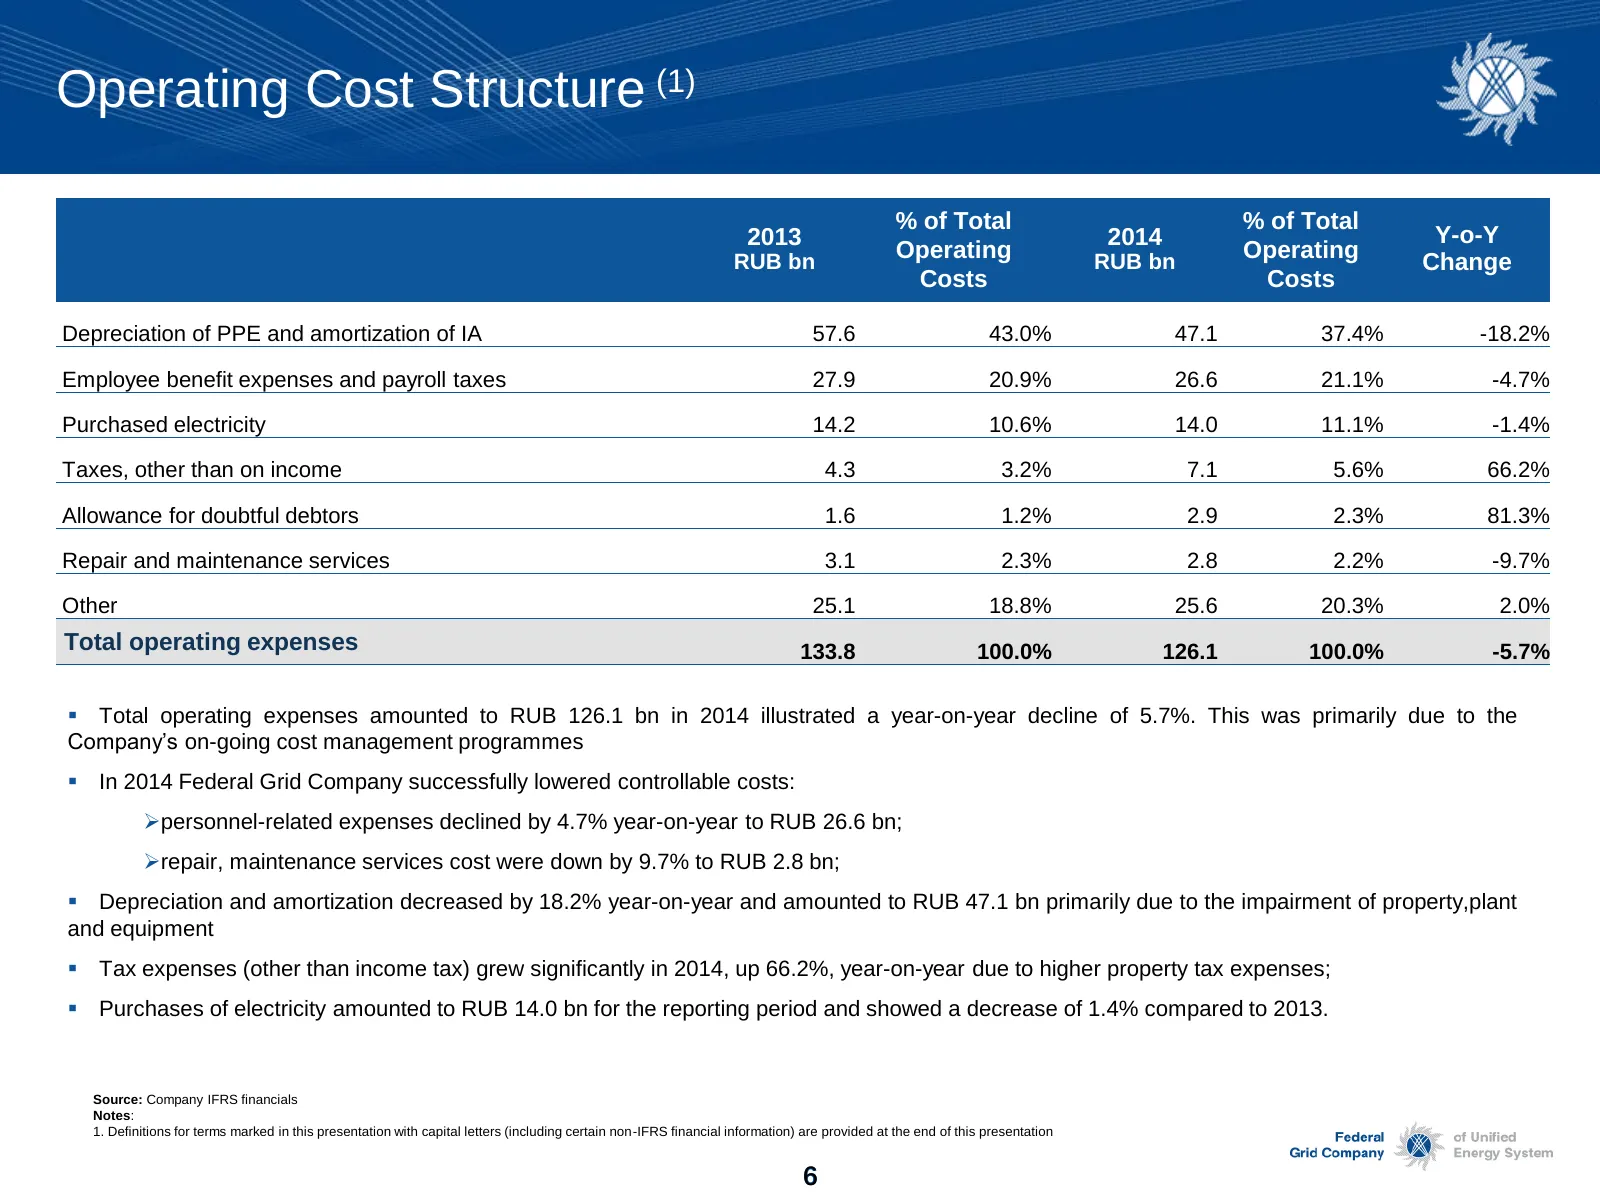
Operating Cost Structure (1) % of Total % of Total 2013 2014 Y-o-Y RUB bn Operating RUB bn Operating Change Costs Costs Depreciation of PPE and amortization of IA 57.6 43.0% 47.1 37.4% -18.2% Employee benefit expenses and payroll taxes 27.9 20.9% 26.6 21.1% -4.7% Purchased electricity 14.2 10.6% 14.
Slide 7: Earnings Analysis
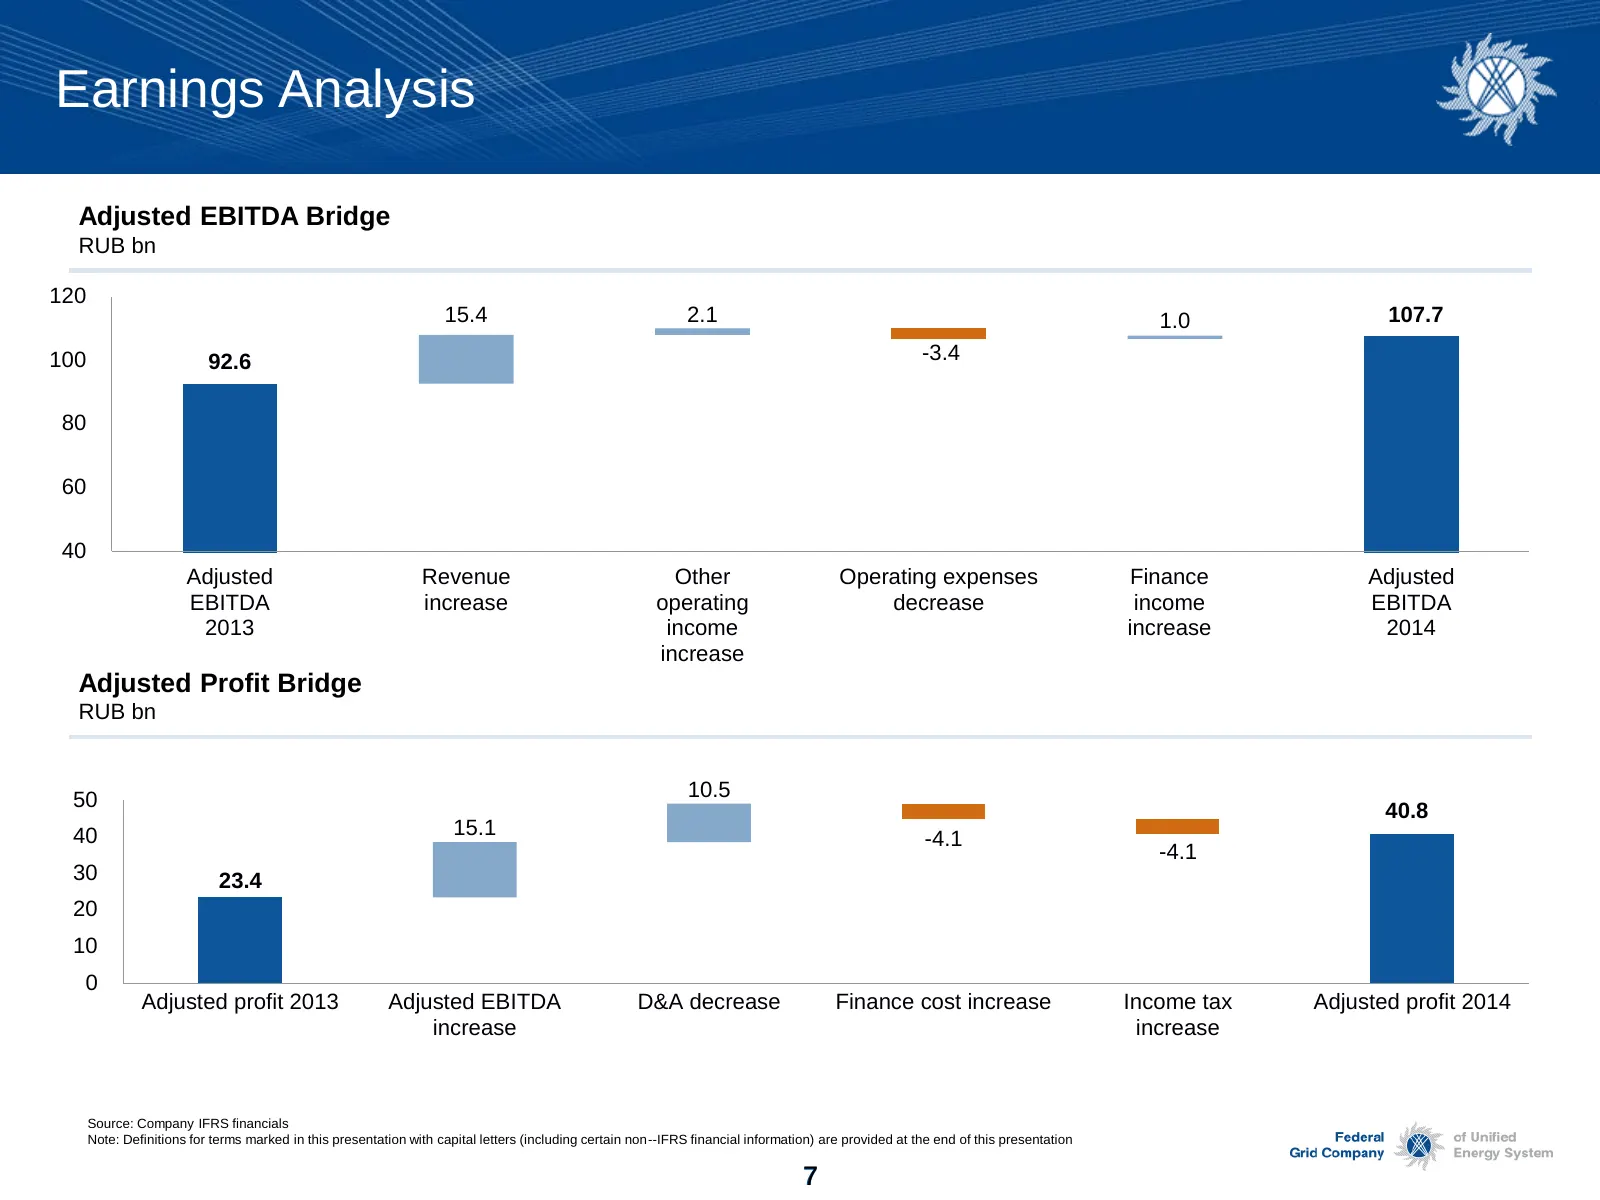
Earnings Analysis Adjusted EBITDA Bridge RUB bn 120 15.4 2.1 1.0 107.7 100 92.6 -3.4 80 60 40 Adjusted Revenue Other Operating expenses Finance Adjusted EBITDA increase operating decrease income EBITDA 2013 income increase 2014 increase Adjusted Profit Bridge RUB bn 50 10.5 40.8 40 15.1 -4.1 -4.1 30
Slide 8: Free Cash Flow
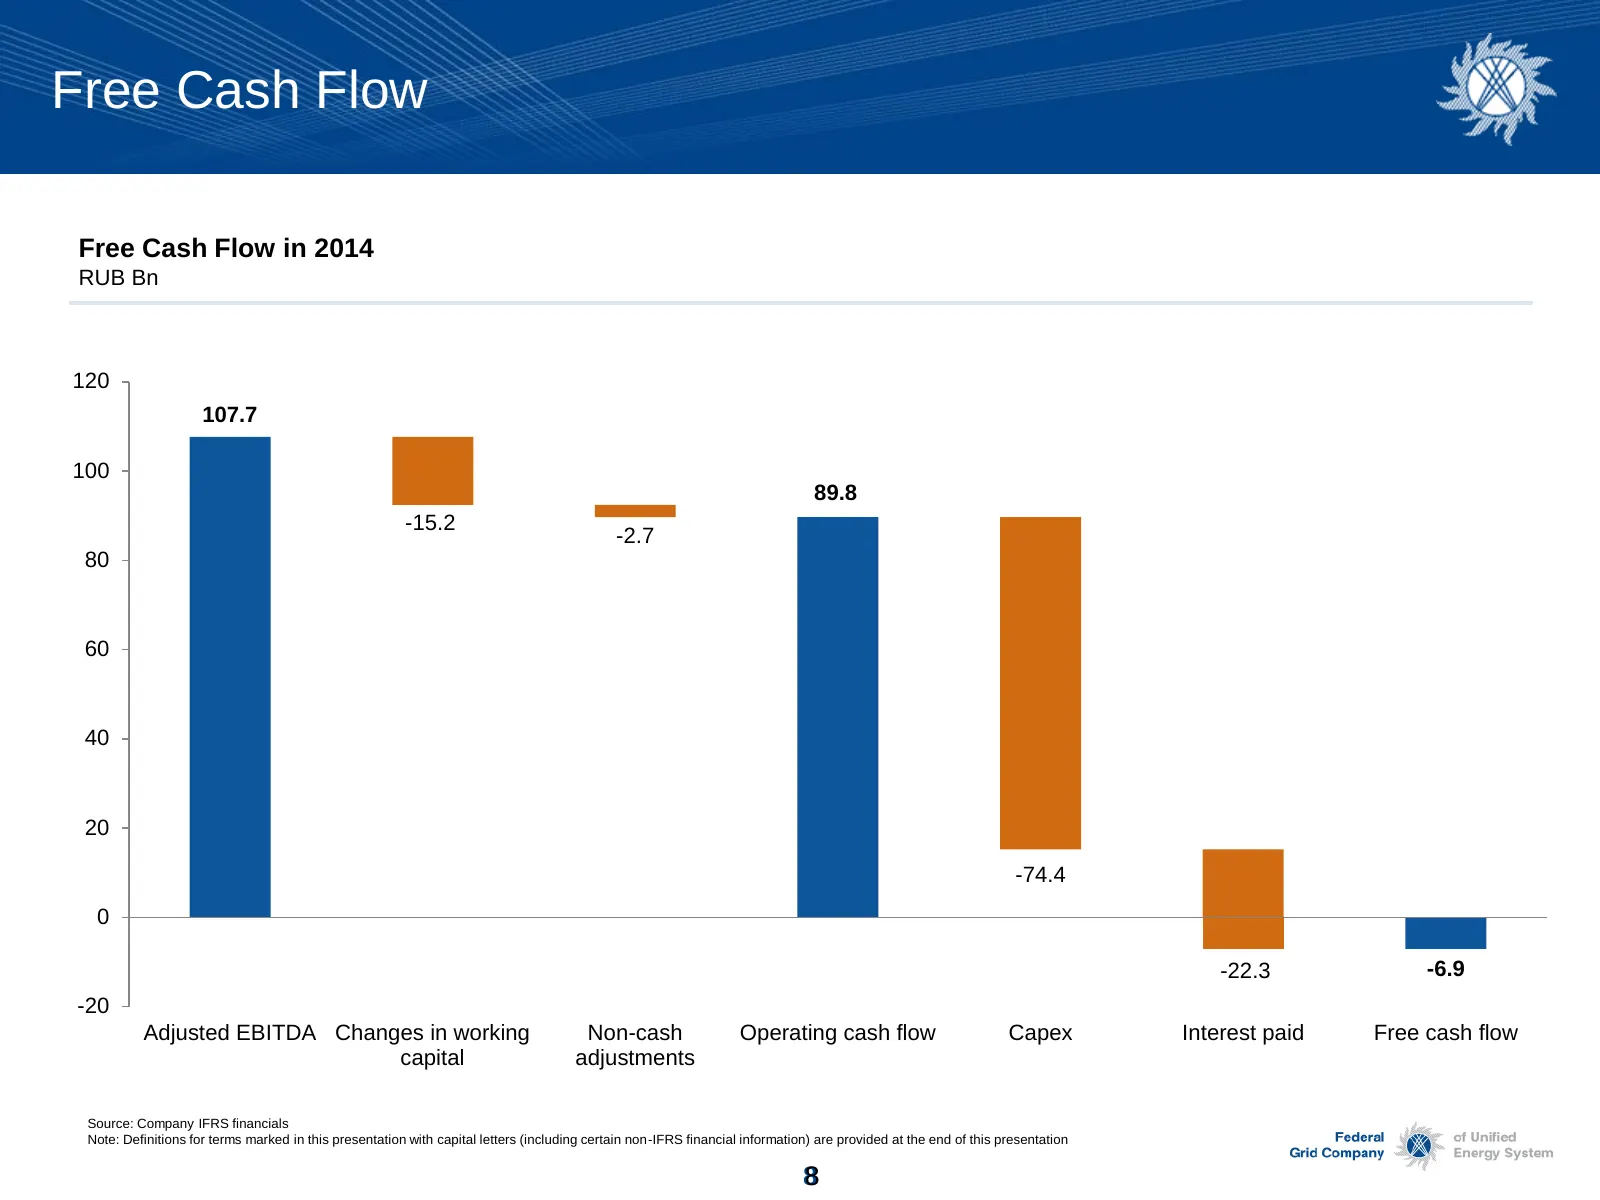
Free Cash Flow Free Cash Flow in 2014 RUB Bn 120 107.7 100 89.8 -15.2 -2.7 80 60 40 20 -74.4 0 -22.3 -6.9 -20 Adjusted EBITDA Changes in working Non-cash Operating cash flow Capex Interest paid Free cash flow capital adjustments Source: Company IFRS financials Note: Definitions for terms marked in t
Slide 9: Debt Capital Structure
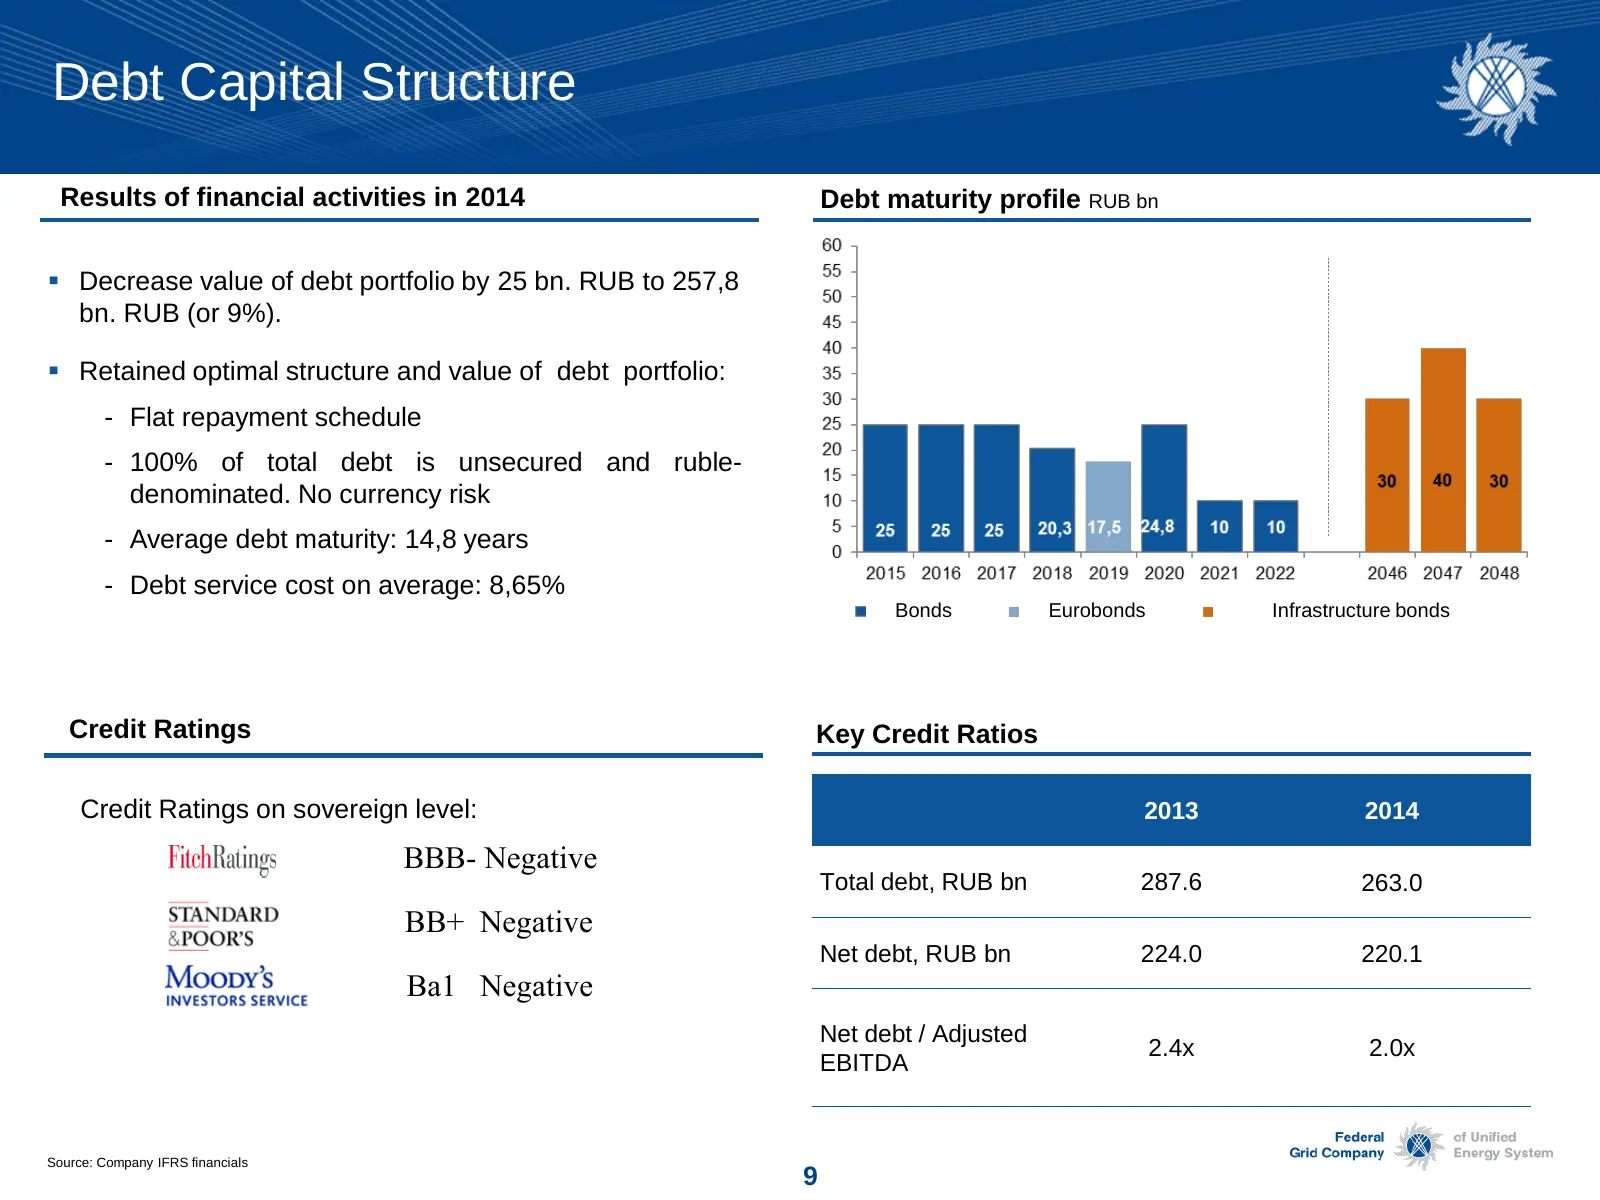
Debt Capital Structure Results of financial activities in 2014 Debt maturity profile RUB bn Decrease value of debt portfolio by 25 bn. RUB to 257,8 bn. RUB (or 9%). Retained optimal structure and value of debt portfolio: - Flat repayment schedule - 100% of total debt is unsecured and ruble- deno
Slide 10: Key focus directions
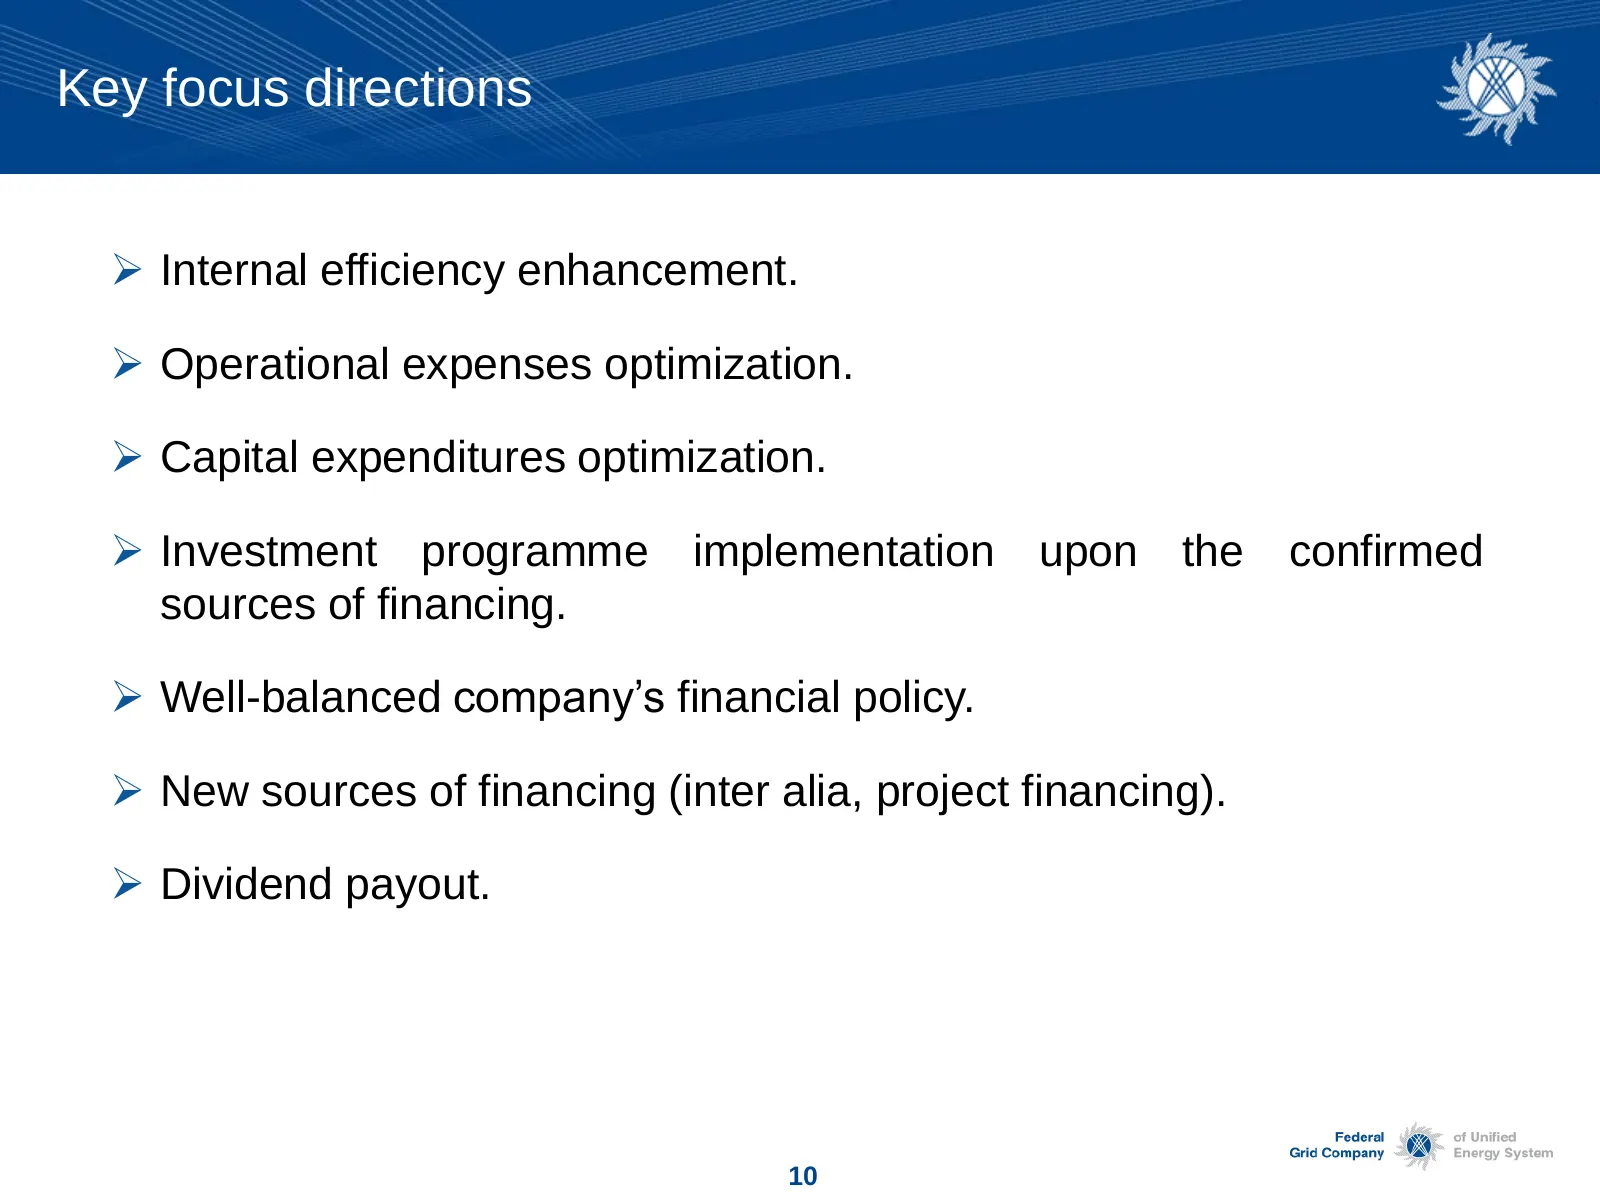
Key focus directions Internal efficiency enhancement. Operational expenses optimization. Capital expenditures optimization. Investment programme implementation upon the confirmed sources of financing. Well-balanced company’s financial policy. New sources of financing (inter alia, project
Slide 11: Appendices
Appendices
Slide 12: Priority Investment Projects: assimilation of capital investments in 2014
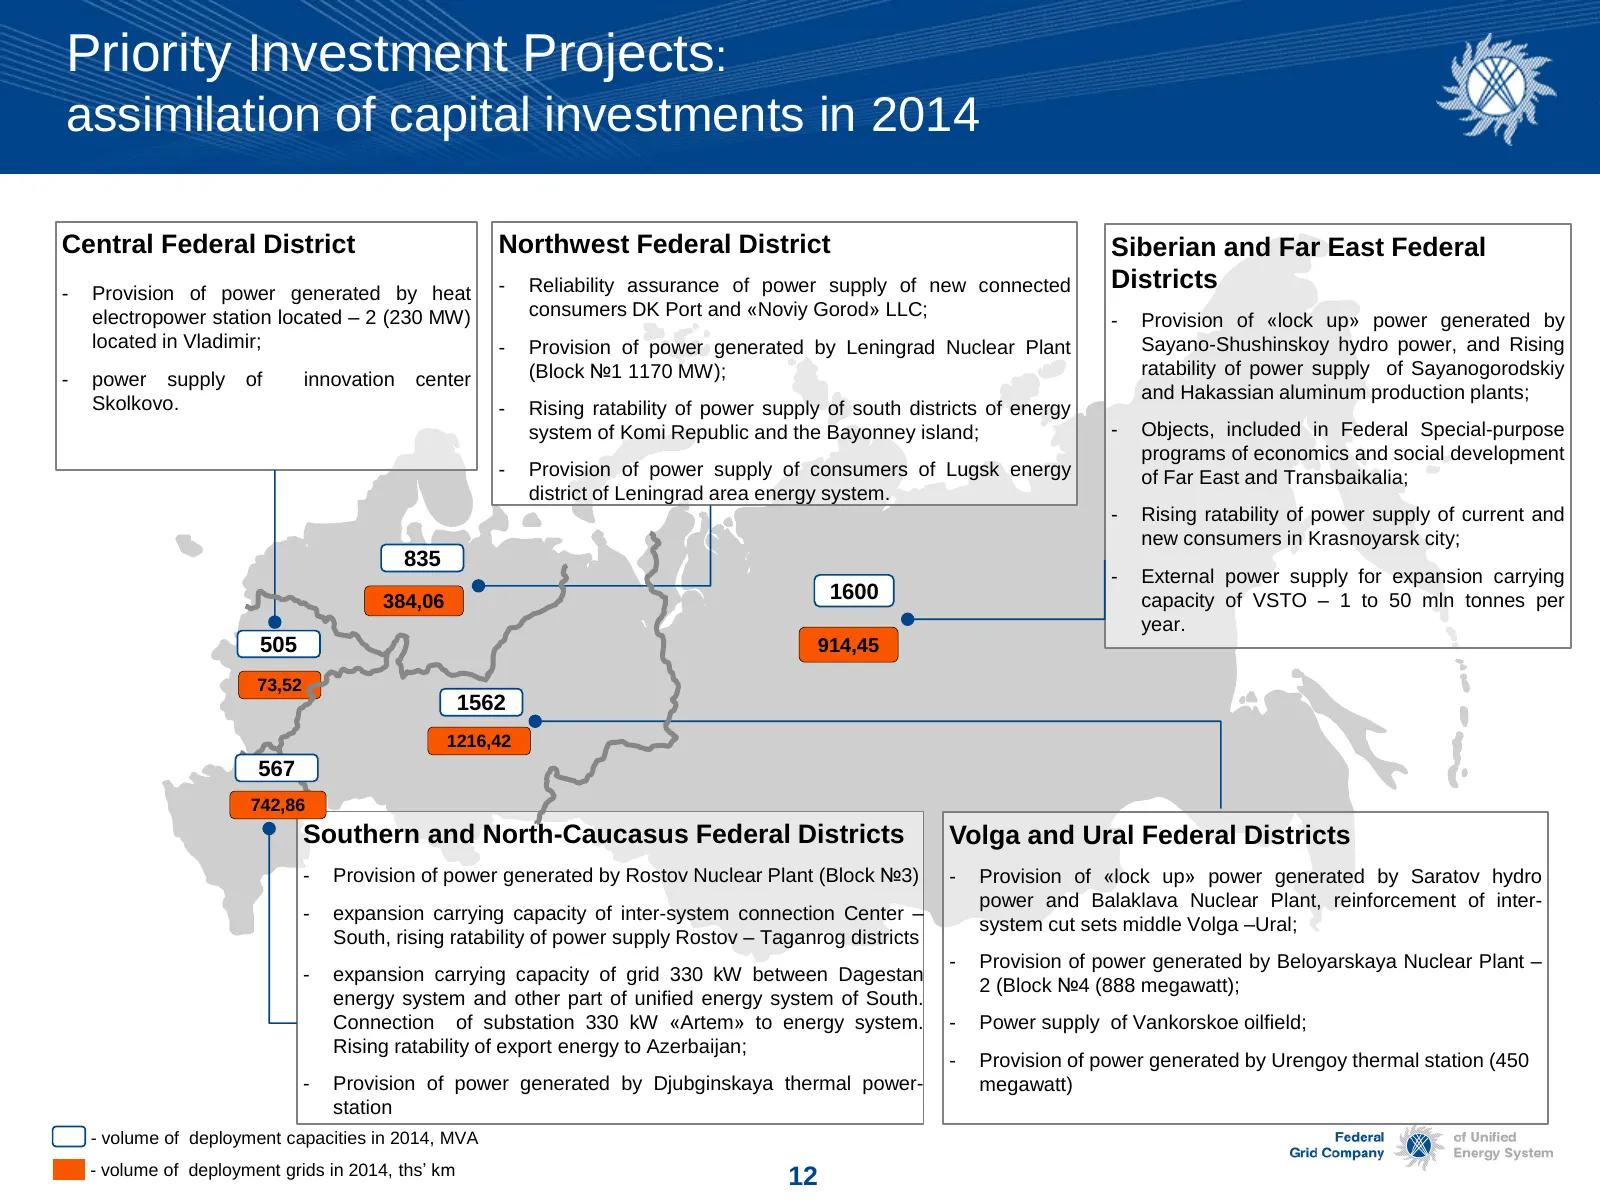
Priority Investment Projects: assimilation of capital investments in 2014 Central Federal District Northwest Federal District Siberian and Far East Federal - Provision of power generated by heat - Reliability assurance of power supply of new connected Districts electropower station located – 2 (230
Slide 13: Glossary
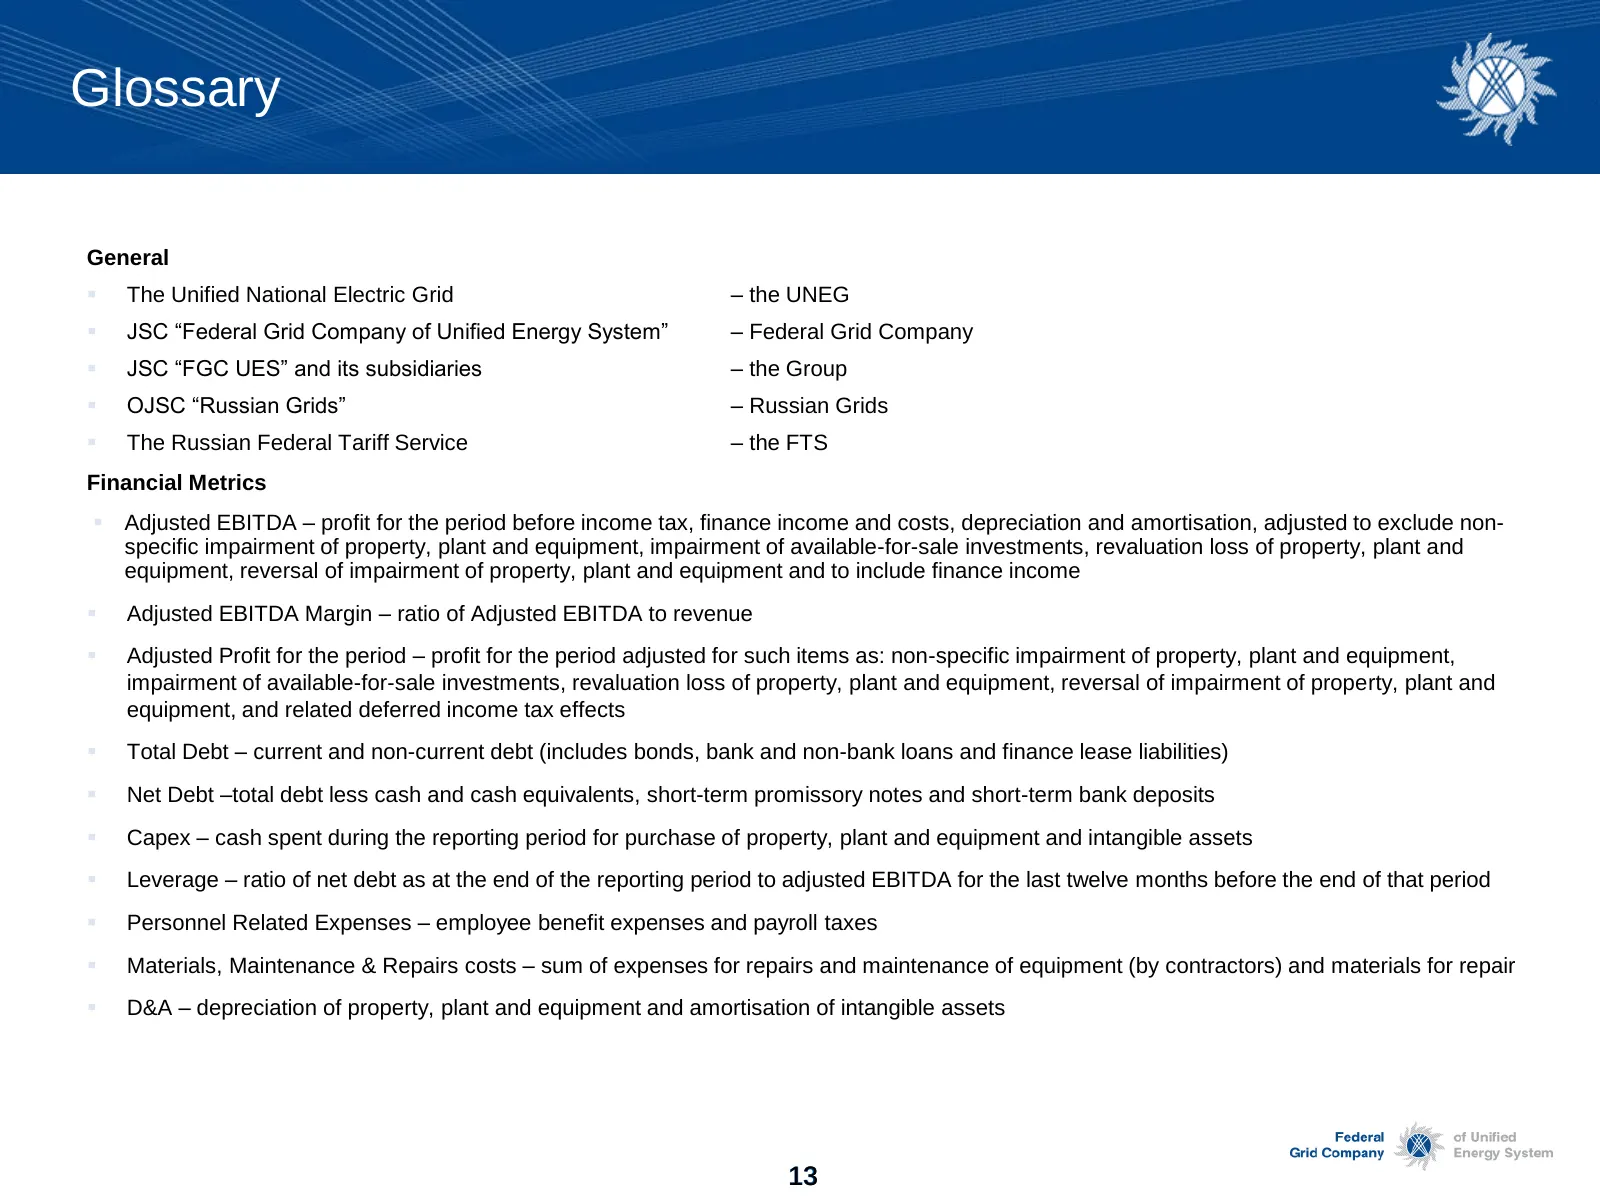
Glossary General The Unified National Electric Grid – the UNEG JSC “Federal Grid Company of Unified Energy System” – Federal Grid Company JSC “FGC UES” and its subsidiaries – the Group OJSC “Russian Grids” – Russian Grids The Russian Federal Tariff Service – the FTS Financial Metrics Adj
Slide 14: Investor Relations Contacts
Investor Relations Contacts Egor Toropov Tel.: +7 495 710 9333 ext. 2275 E-mail: toropov-ev@fsk-ees.ru Alexey Novikov Tel.: +7 495 710 9333 ext. 2143 E-mail: novikov-as@fsk-ees.ru 14
Slide 15: Disclaimer
Disclaimer The materials comprising this Presentation have been prepared by the Company solely for use by the Company’s management at investor meetings with a limited number of institutional investors who have agreed to attend such meetings and to be subject to obligations to maintain Company to con
Source: Internet Archive copy of fsk-ees.ru
More decks from FGC Rosseti
 пао «фск еэс» — 9M 2021 Earnings Presentation9 slides · November 2021
 Rosseti FGC UES — 9M 2021 Earnings Presentation9 slides · November 2021
 PJSC FGC UES (Rosseti FGC UES) — FY2020 Earnings Presentation9 slides · Jun 1, 2021
 пао «фск еэс» — FY2020 Earnings Presentation10 slides · 2021
 Россети (Rosseti) / ПАО «ФСК ЕЭС» — FY2020 Earnings Presentation20 slides · 2021
 пао «фск еэс» — FY2019 Earnings Presentation11 slides · Mar 5, 2020