AAR Corp. · NYSE:AIR
AAR — Investor Day (July 2023)
92 slides from AAR's investor day presentation, Jul 20, 2023

Slide 1: Investor Day
Investor Day July 20, 2023 aarcorp.com © 2023 AAR CORP. All rights reserved worldwide. 1
Slide 2: Forward-looking statements
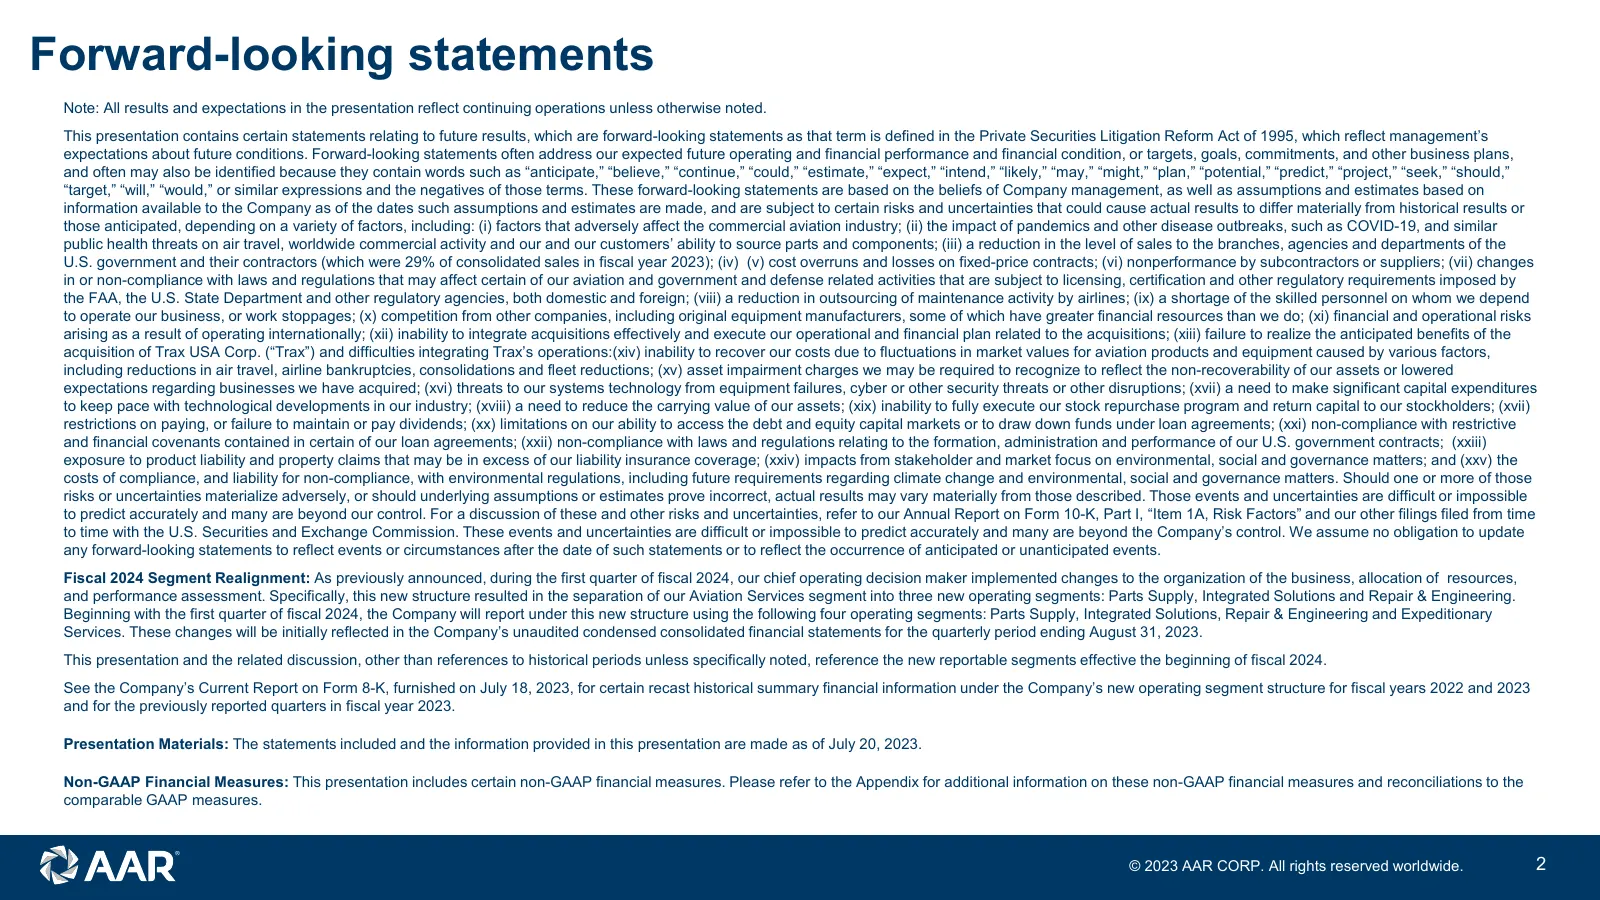
Forward-looking statements Note: All results and expectations in the presentation reflect continuing operations unless otherwise noted. This presentation contains certain statements relating to future results, which are forward-looking statements as that term is defined in the Private Securities Lit
Slide 3: Agenda
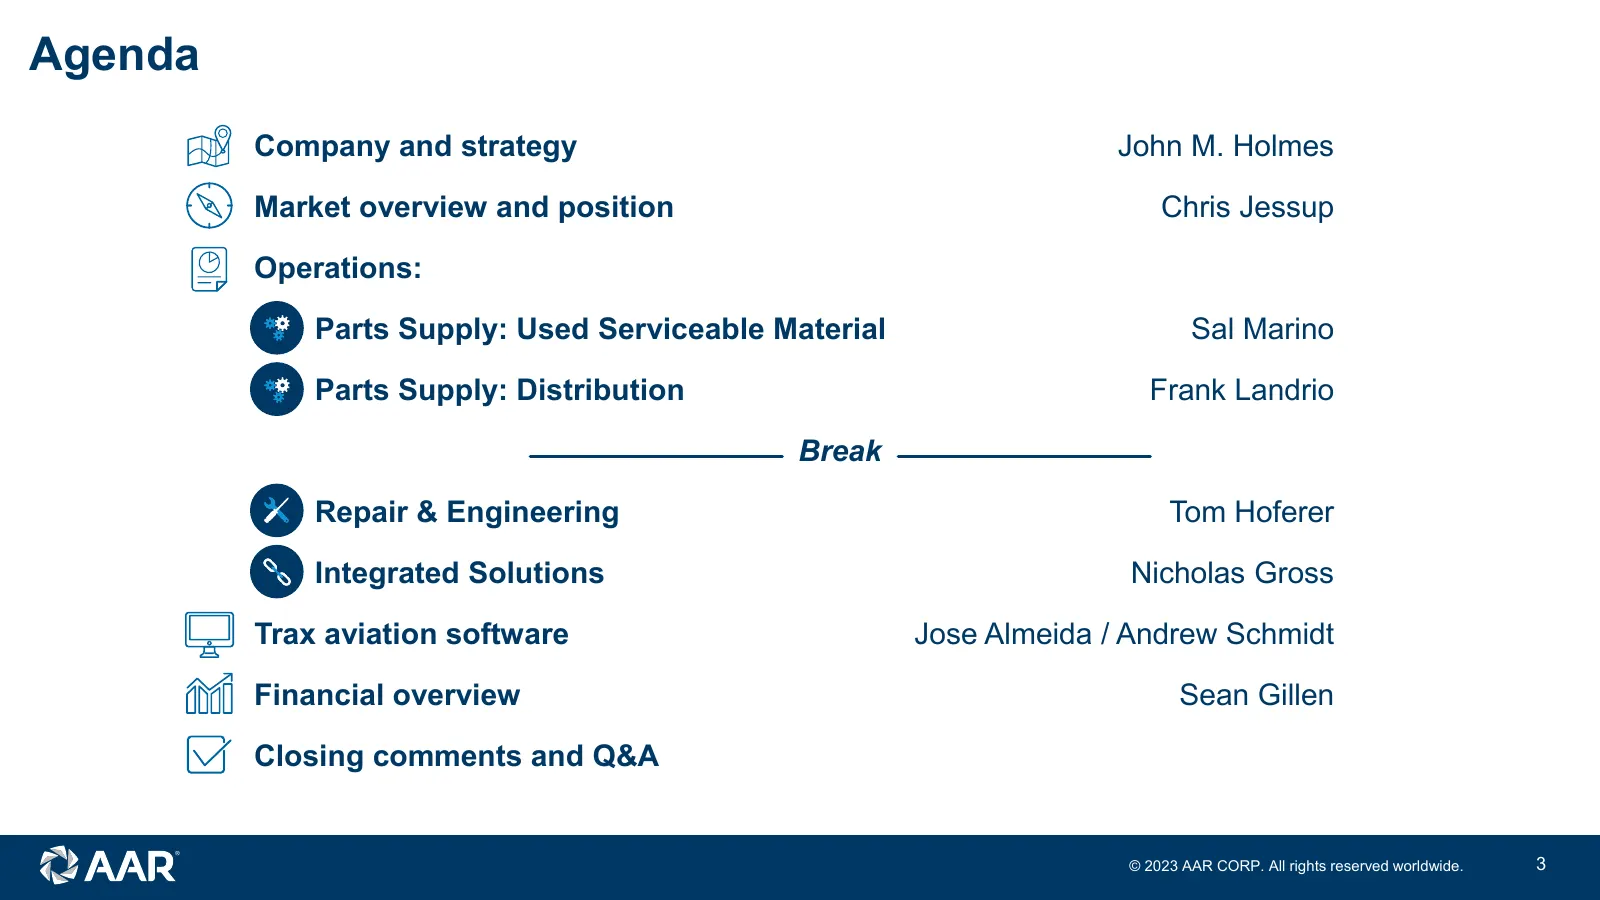
Agenda Company and strategy John M. Holmes Market overview and position Chris Jessup Operations: Parts Supply: Used Serviceable Material Sal Marino Parts Supply: Distribution Frank Landrio Break Repair & Engineering Tom Hoferer Integrated Solutions Nicholas Gross Trax aviation software Jose Almeida
Slide 4: Company and strategy
Company and strategy John M. Holmes Chairman, President and Chief Executive Officer © 2023 AAR CORP. All rights reserved worldwide. 4
Slide 5: John M. Holmes
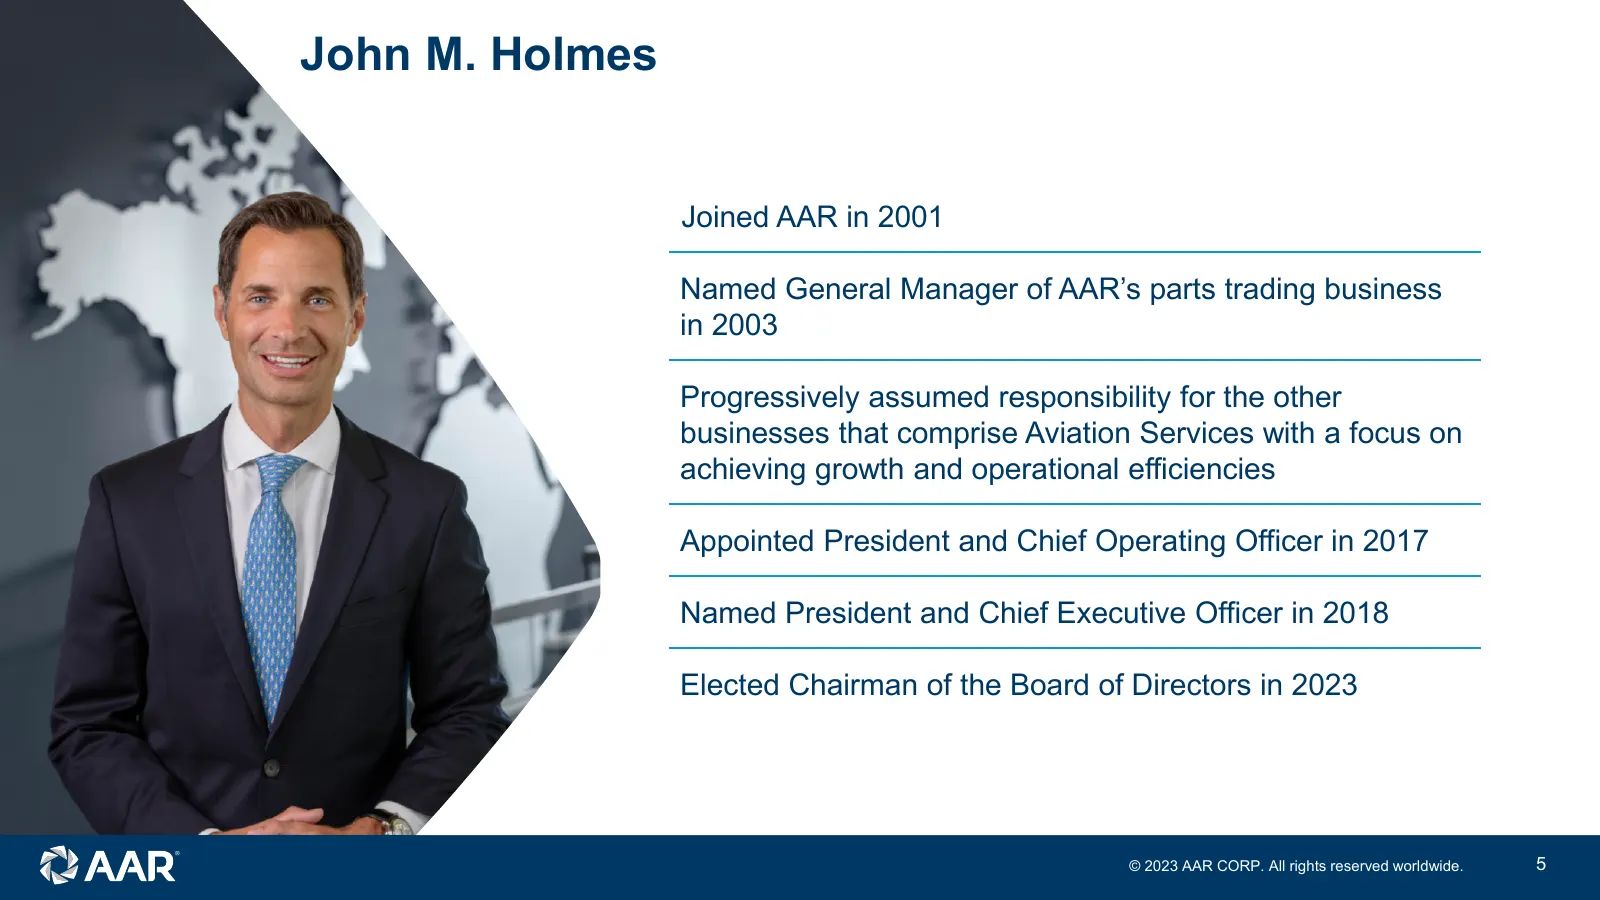
John M. Holmes Joined AAR in 2001 Named General Manager of AAR’s parts trading business in 2003 Progressively assumed responsibility for the other businesses that comprise Aviation Services with a focus on achieving growth and operational efficiencies Appointed President and Chief Operating Officer

Slide 6: Vision
Vision Be the most respected global independent provider of aviation parts and repair services Create value for customers through differentiated capabilities and offerings, resulting in a sustainable, unique competitive advantage © 2023 AAR CORP. All rights reserved worldwide. 6
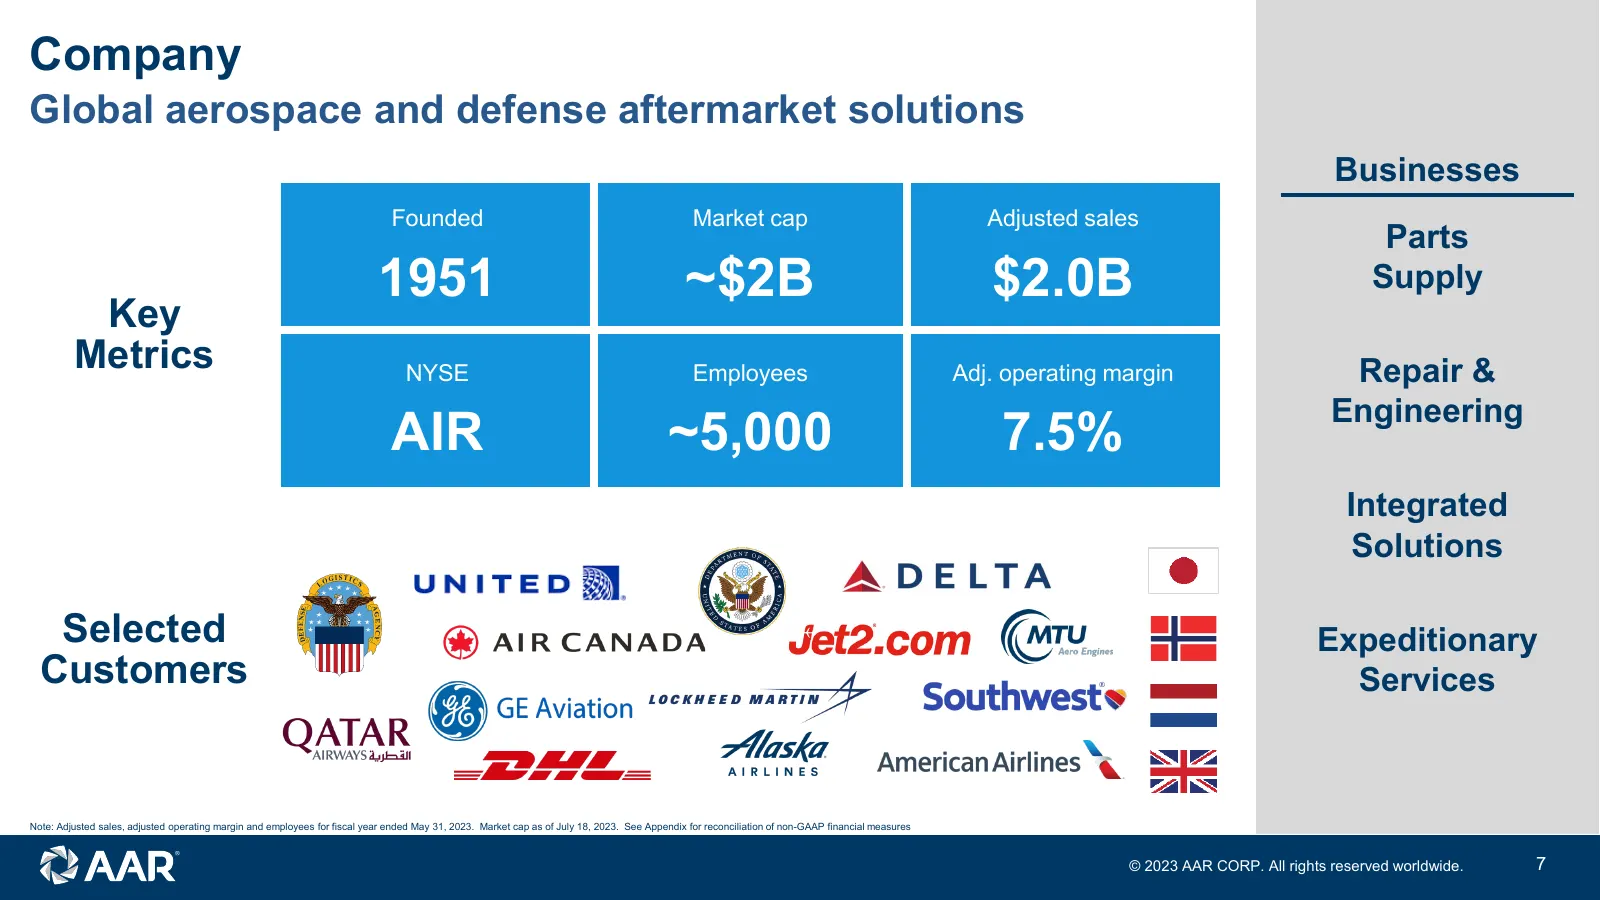
Slide 7: Global aerospace and defense aftermarket solutions
Company Global aerospace and defense aftermarket solutions Businesses Founded Market cap Adjusted sales Parts 1951 ~$2B $2.0B Supply Key Metrics NYSE Employees Adj. operating margin Repair & Engineering AIR ~5,000 7.5% Integrated Solutions Selected Expeditionary Customers Services Note: Adjusted sal
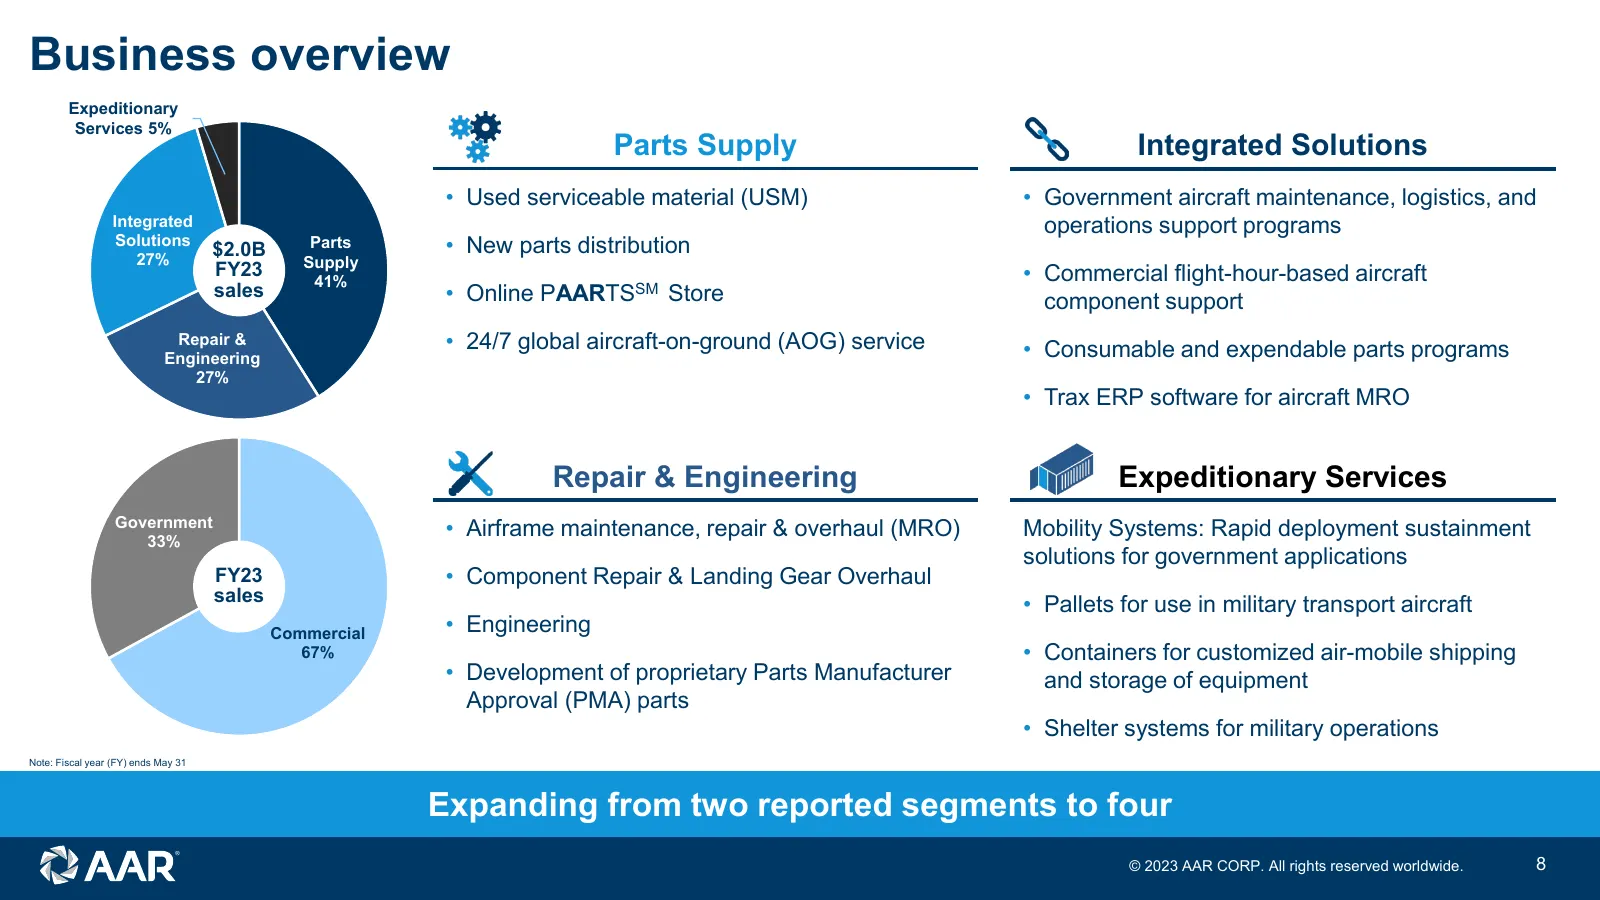
Slide 8: Business overview
Business overview Expeditionary Services 5% Parts Supply Integrated Solutions • Used serviceable material (USM) • Government aircraft maintenance, logistics, and Integrated operations support programs Solutions $2.0B Parts • New parts distribution 27% Supply FY23 • Commercial flight-hour-based aircr
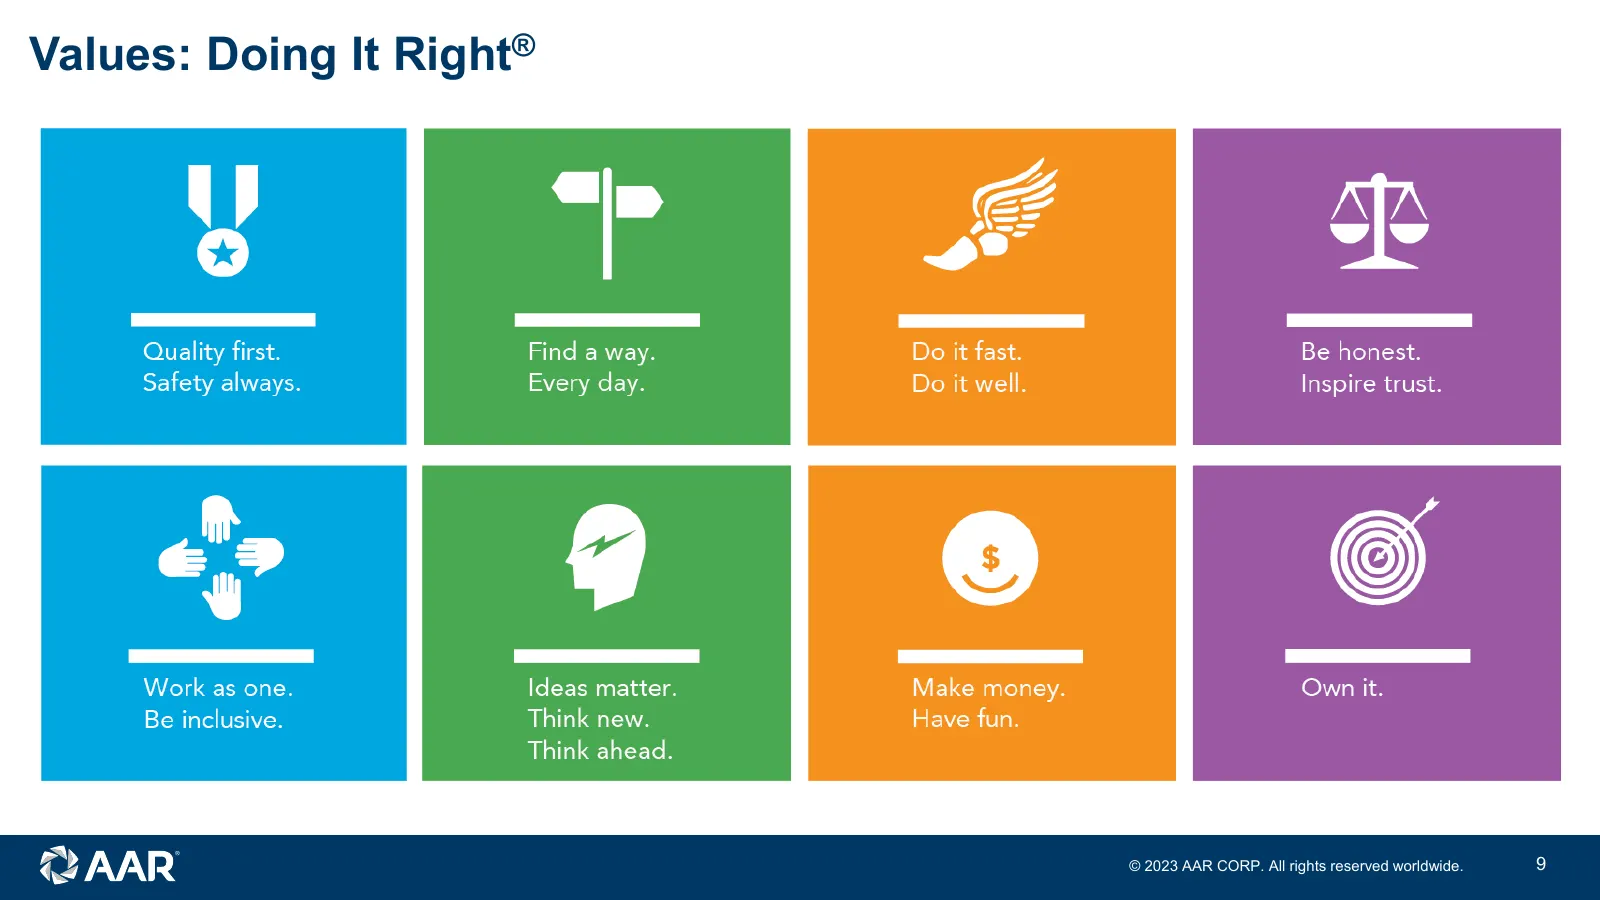
Slide 9: Values: Doing It Right
Values: Doing It Right® © 2023 AAR CORP. All rights reserved worldwide. 9
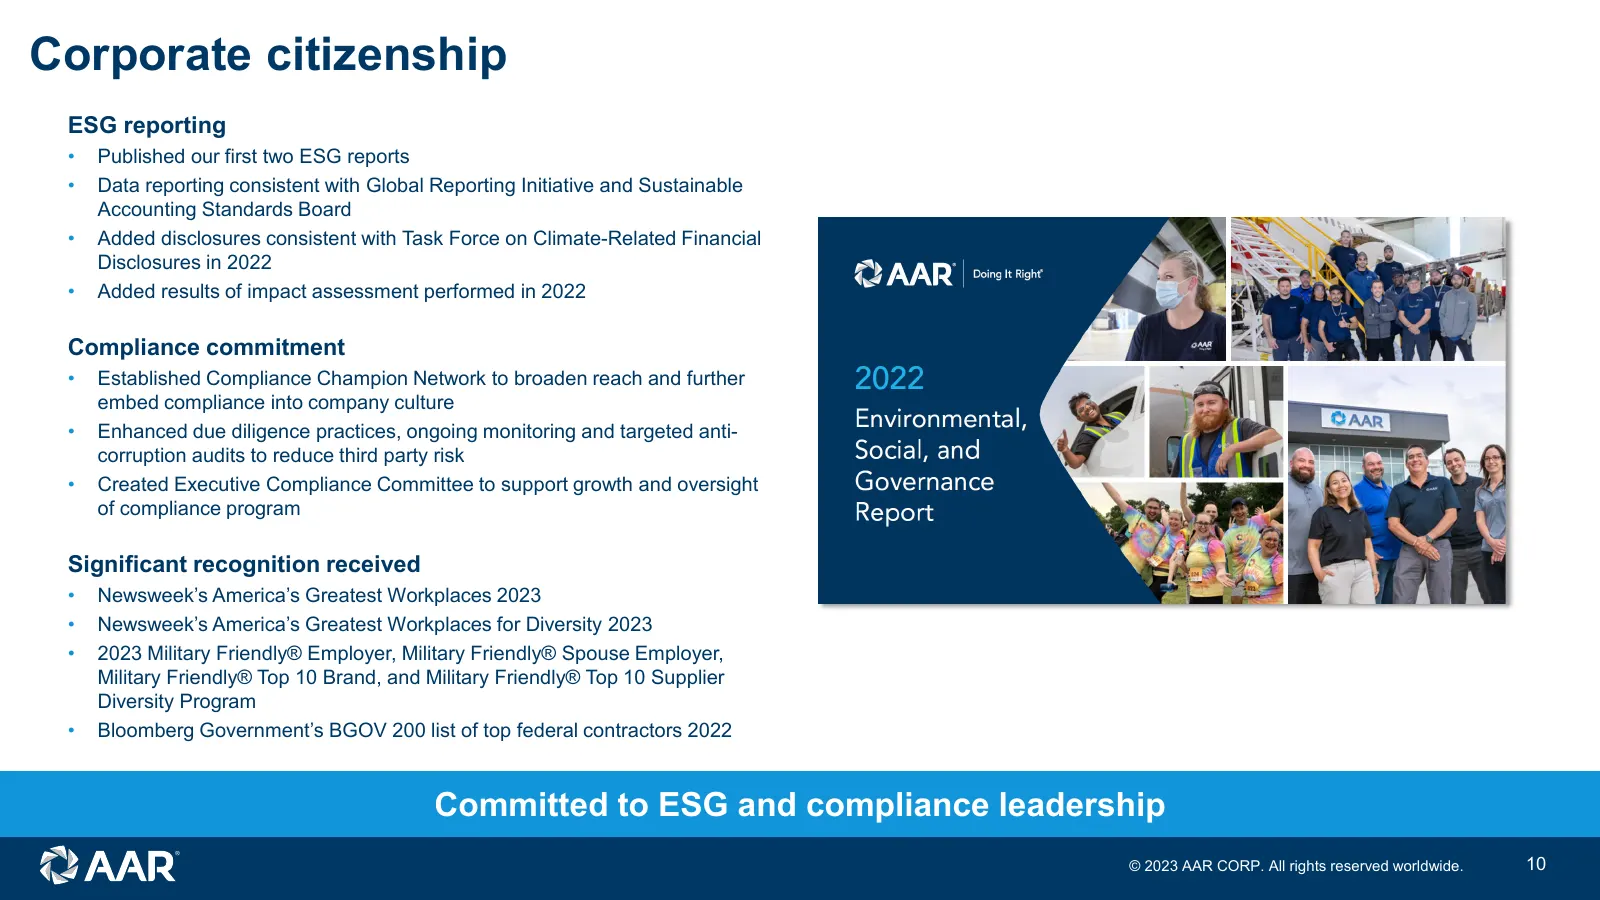
Slide 10: Corporate citizenship
Corporate citizenship ESG reporting • Published our first two ESG reports • Data reporting consistent with Global Reporting Initiative and Sustainable Accounting Standards Board • Added disclosures consistent with Task Force on Climate-Related Financial Disclosures in 2022 • Added results of impact
Slide 11: Key messages
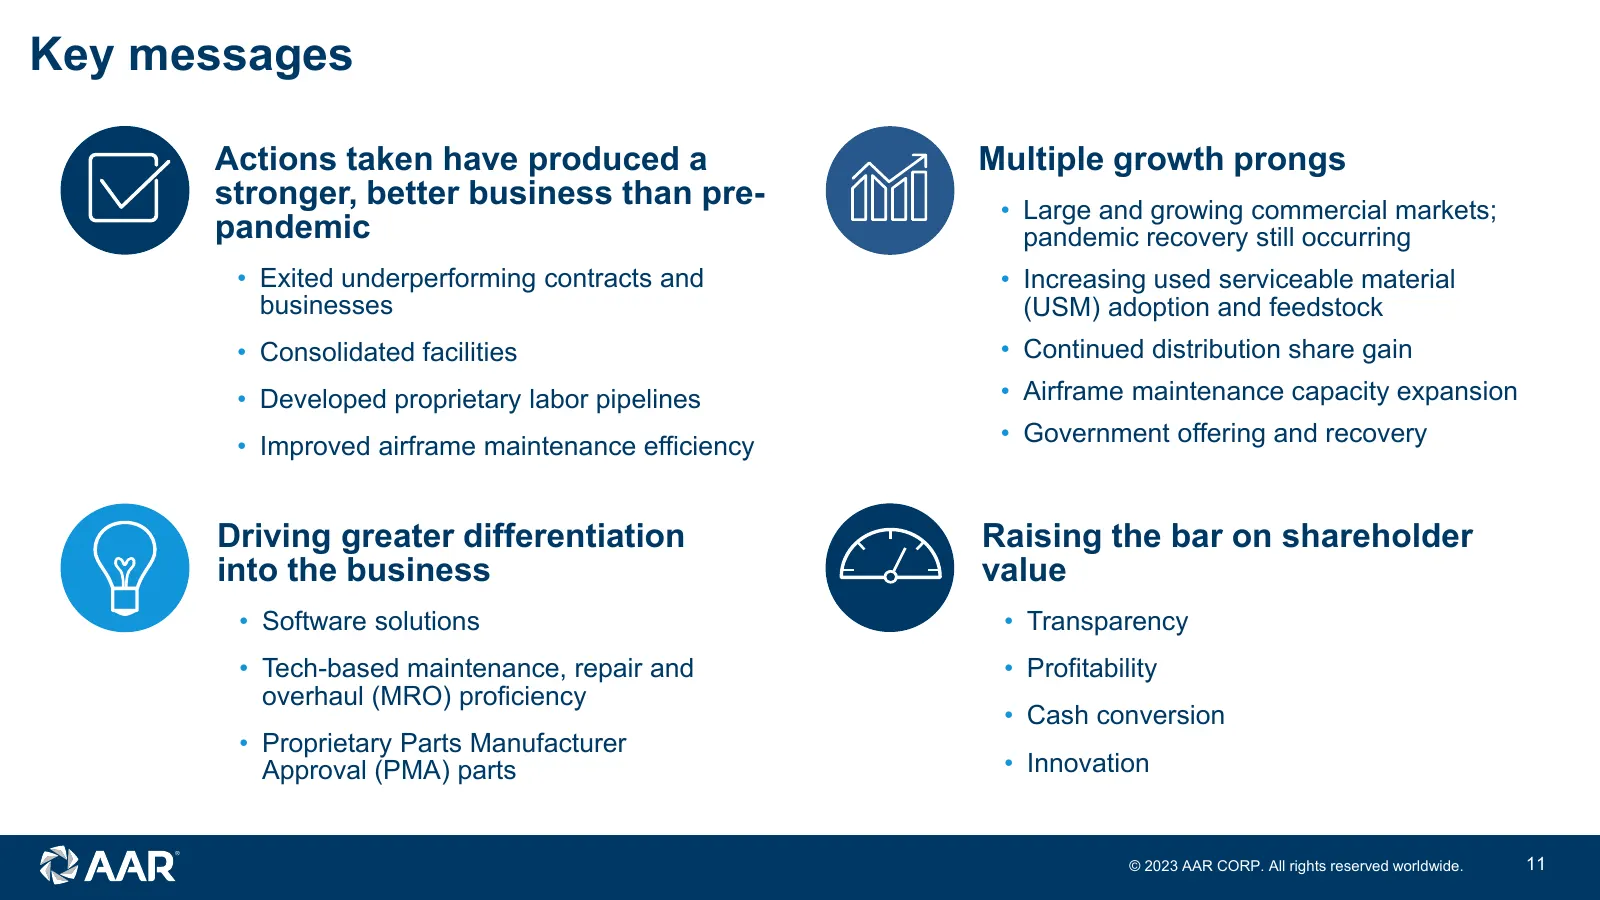
Key messages Actions taken have produced a Multiple growth prongs stronger, better business than pre- • Large and growing commercial markets; pandemic pandemic recovery still occurring • Exited underperforming contracts and • Increasing used serviceable material businesses (USM) adoption and feedsto
Slide 12: Re-segmentation of financial reporting
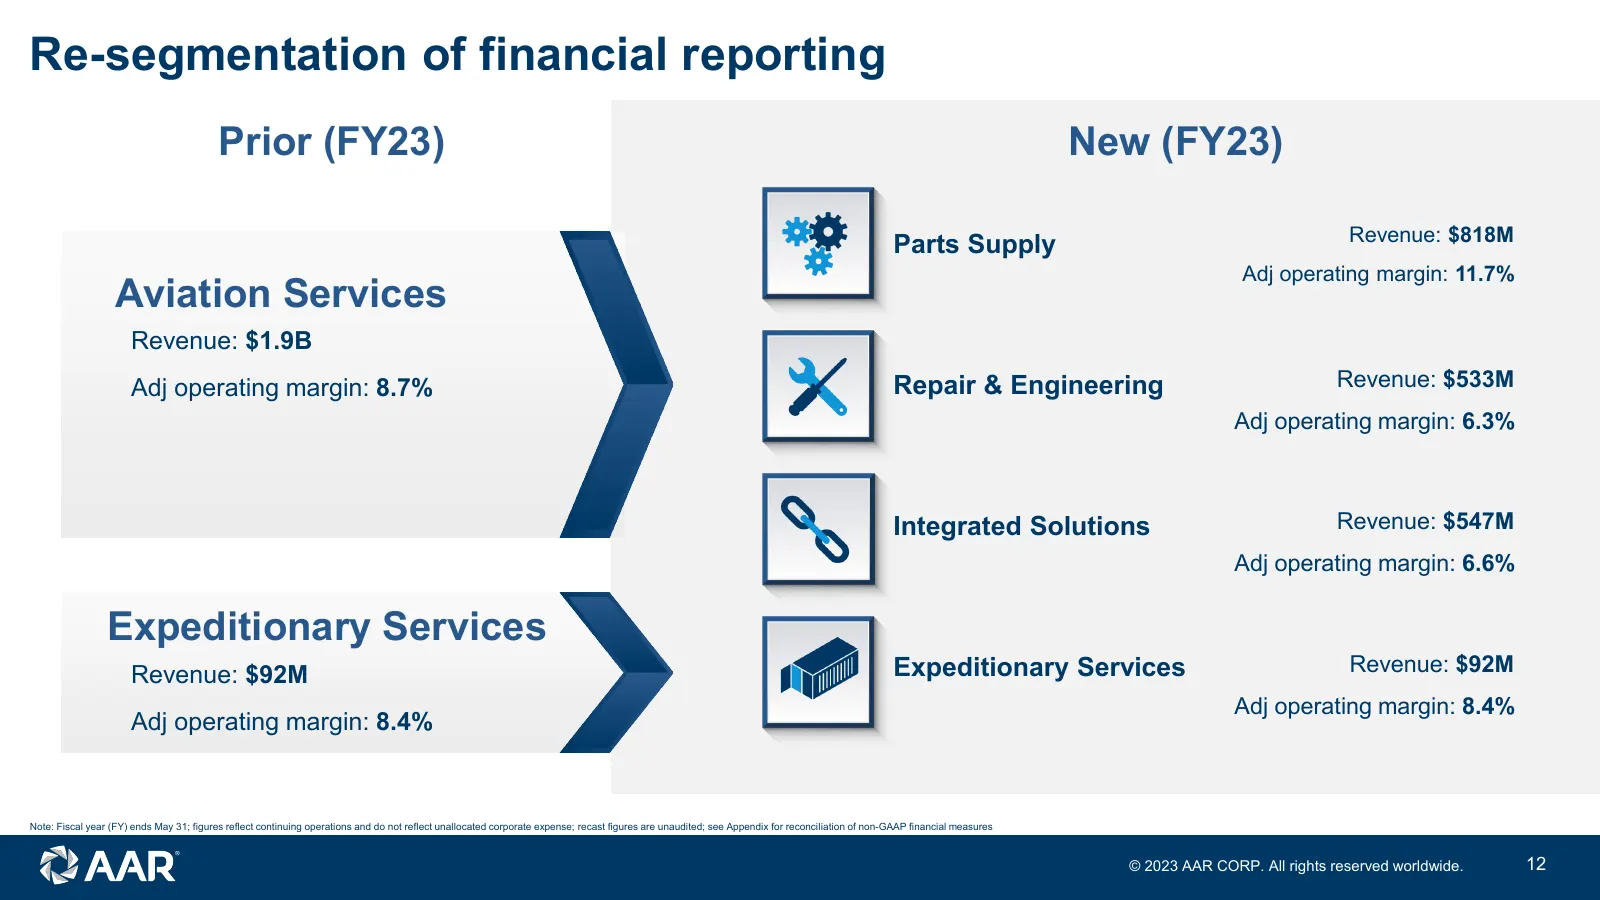
Re-segmentation of financial reporting Prior (FY23) New (FY23) Revenue: $818M Parts Supply Adj operating margin: 11.7% Aviation Services Revenue: $1.9B Adj operating margin: 8.7% Repair & Engineering Revenue: $533M Adj operating margin: 6.3% Integrated Solutions Revenue: $547M Adj operating margin:
Slide 13: Connected businesses model
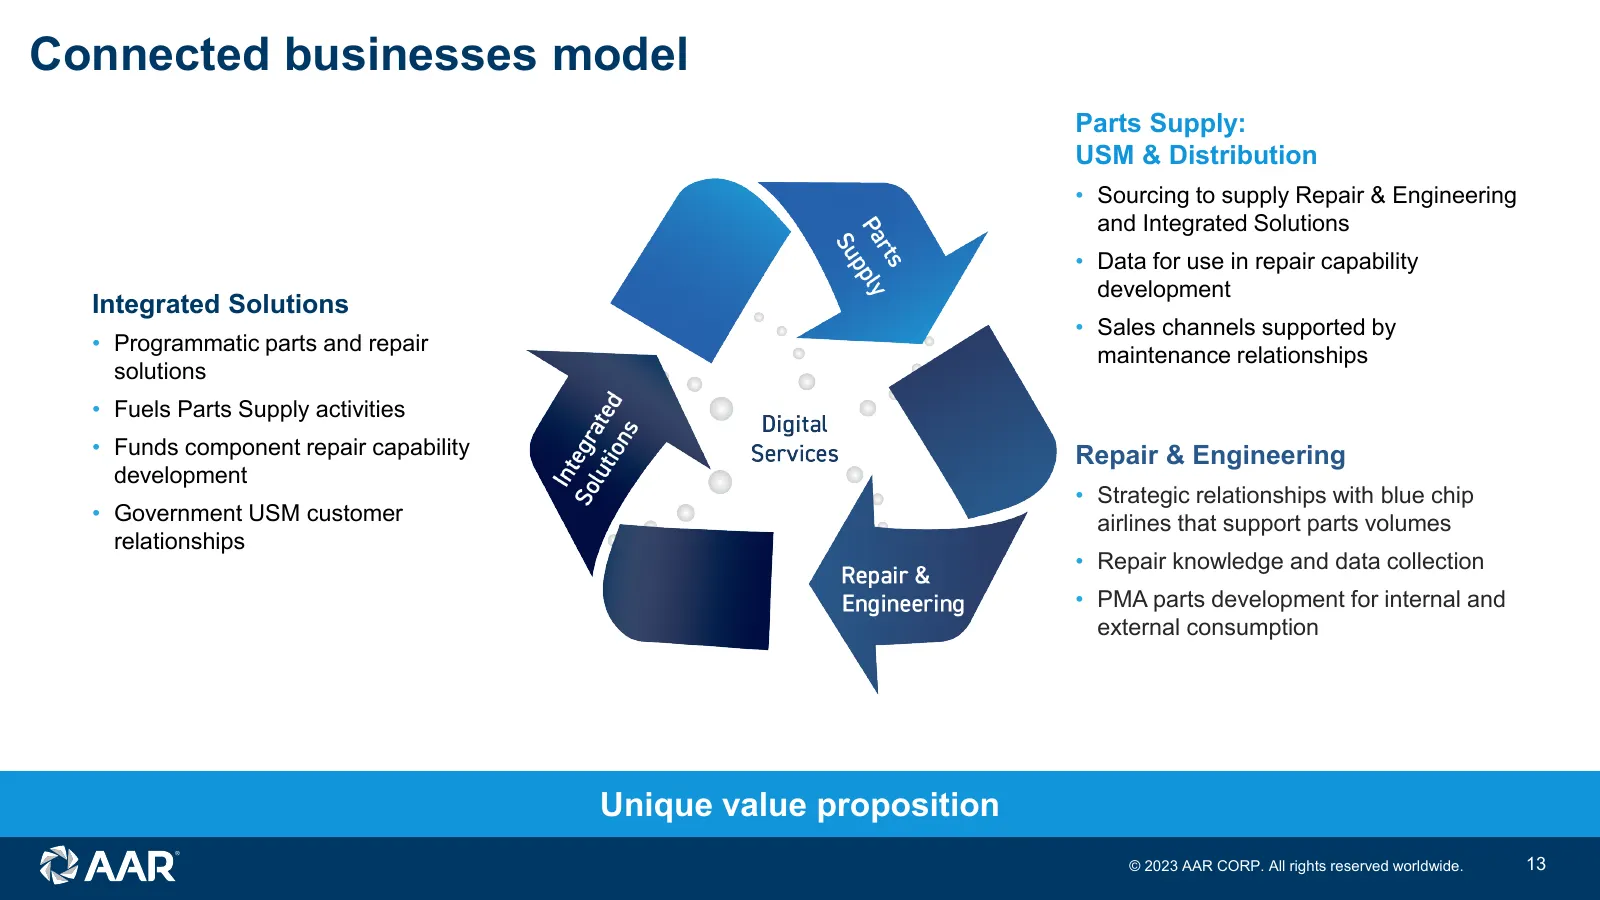
Connected businesses model Parts Supply: USM & Distribution • Sourcing to supply Repair & Engineering and Integrated Solutions • Data for use in repair capability development Integrated Solutions • Sales channels supported by • Programmatic parts and repair maintenance relationships solutions • Fuel
Slide 14: What's changed since 2019 Investor Day
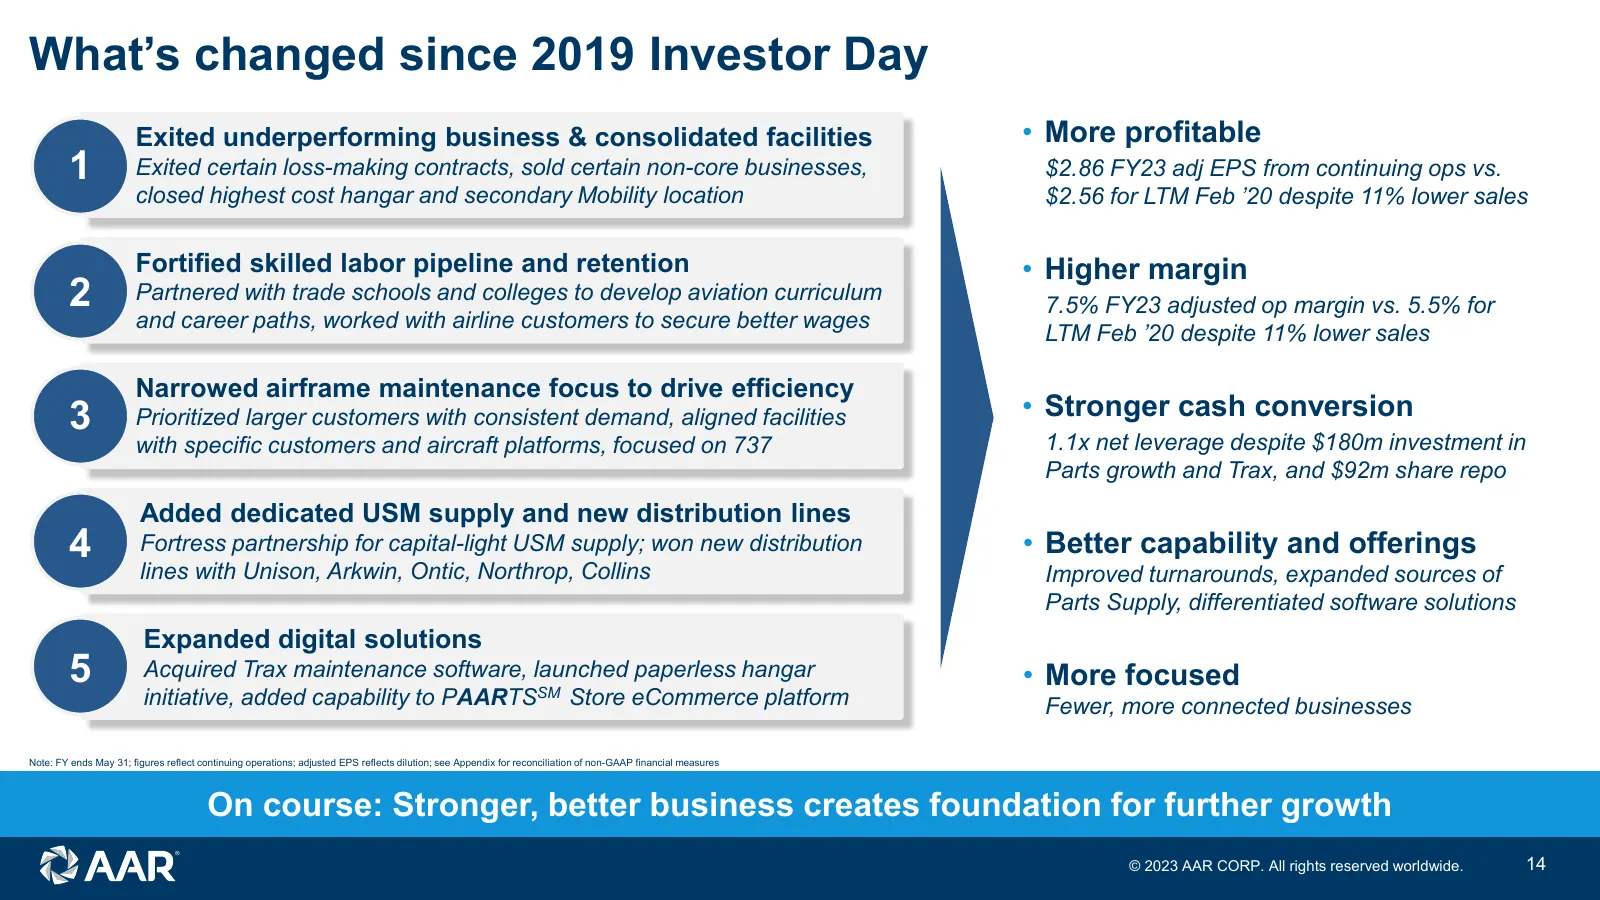
What’s changed since 2019 Investor Day Exited underperforming business & consolidated facilities • More profitable 1 Exited certain loss-making contracts, sold certain non-core businesses, $2.86 FY23 adj EPS from continuing ops vs. closed highest cost hangar and secondary Mobility location $2.56 for
Slide 15: Growth drivers
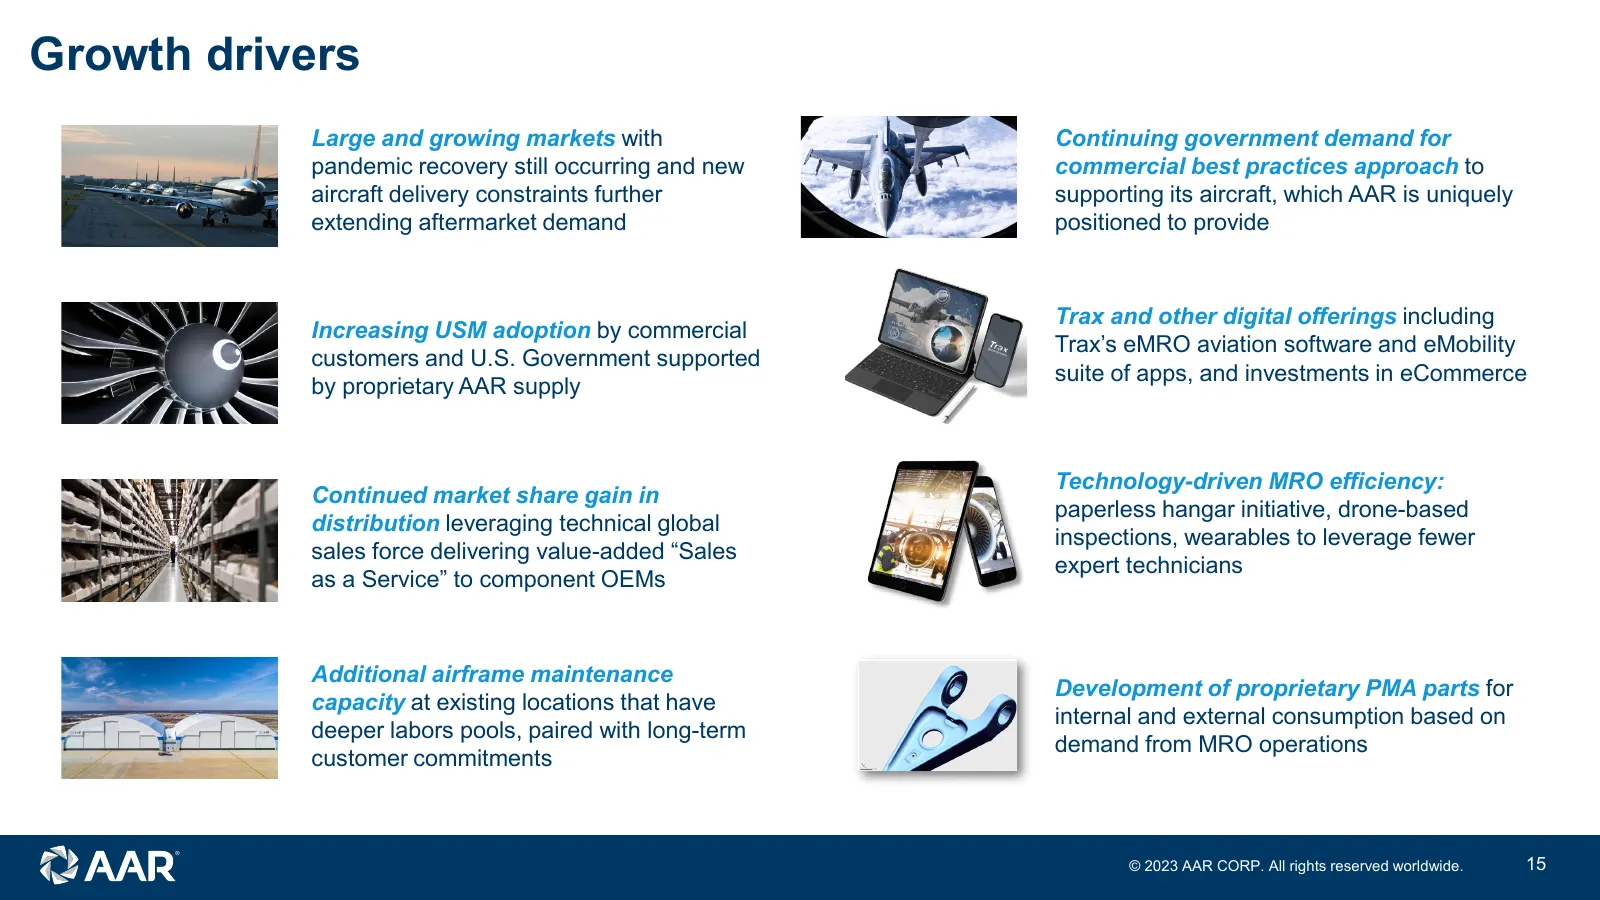
Growth drivers Large and growing markets with Continuing government demand for pandemic recovery still occurring and new commercial best practices approach to aircraft delivery constraints further supporting its aircraft, which AAR is uniquely extending aftermarket demand positioned to provide Trax
Slide 16: 3-5 year organic financial targets
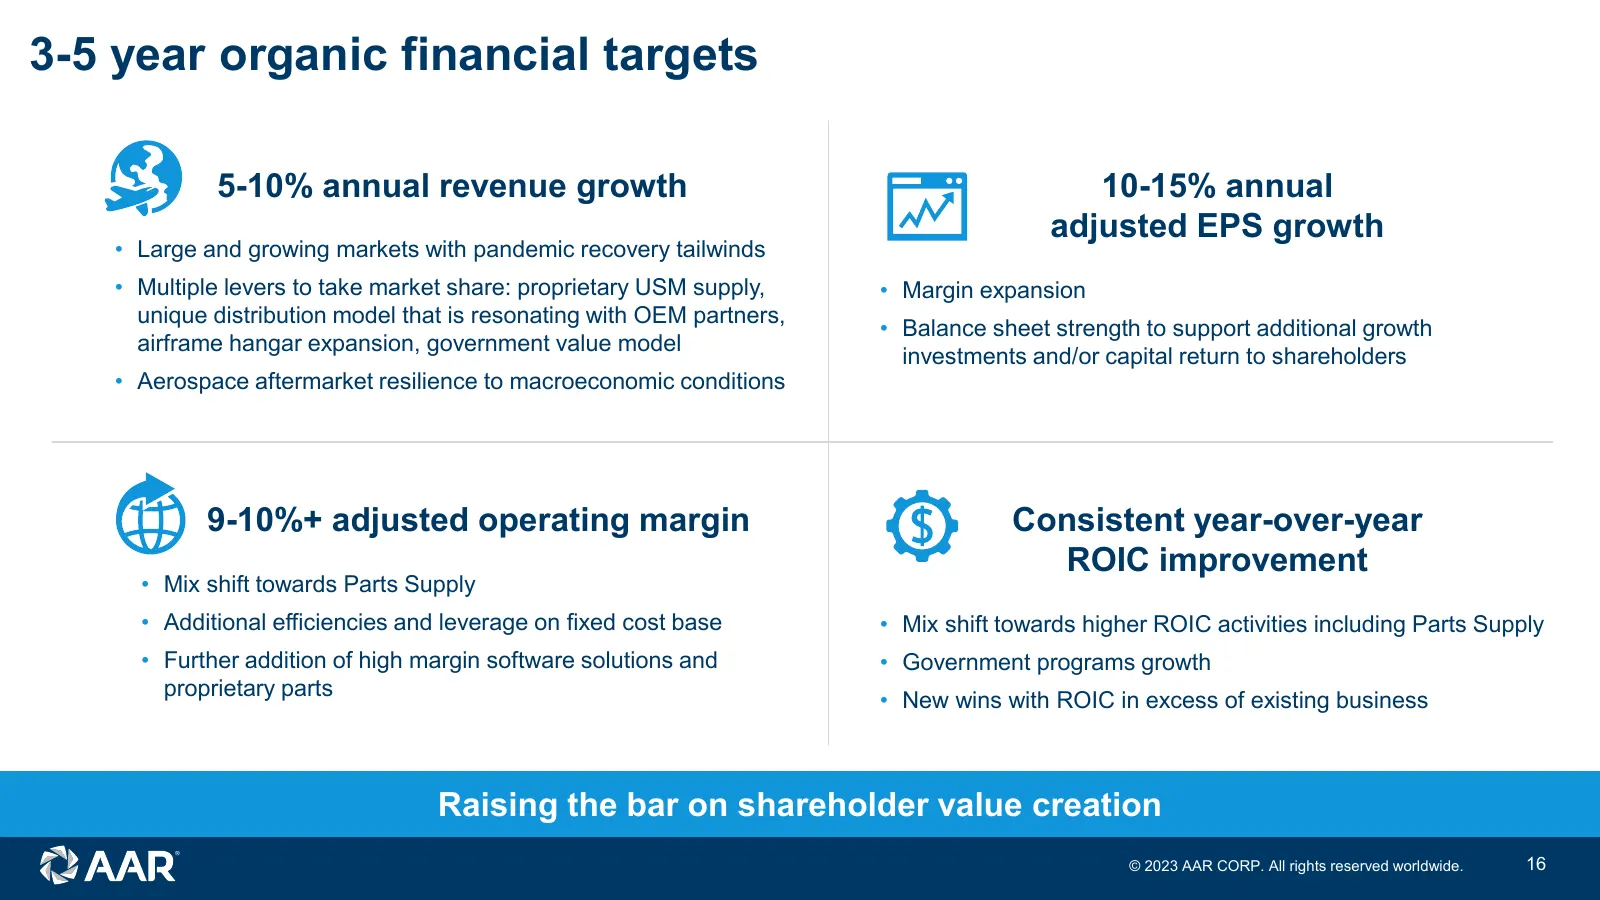
3-5 year organic financial targets 5-10% annual revenue growth 10-15% annual adjusted EPS growth • Large and growing markets with pandemic recovery tailwinds • Multiple levers to take market share: proprietary USM supply, • Margin expansion unique distribution model that is resonating with OEM partn
Slide 17: What's next
What’s next… • Our large and growing markets • Used Serviceable Material leadership • Distribution model that is resonating with OEMs • Significantly more efficient Repair & Engineering business • Integration Solutions offerings that bring the best of AAR together • Power of the AAR-Trax combination

Slide 18: Market overview and positioning
Market overview and positioning Chris Jessup Chief Commercial Officer © 2023 AAR CORP. All rights reserved worldwide. 18
Slide 19: Chris Jessup
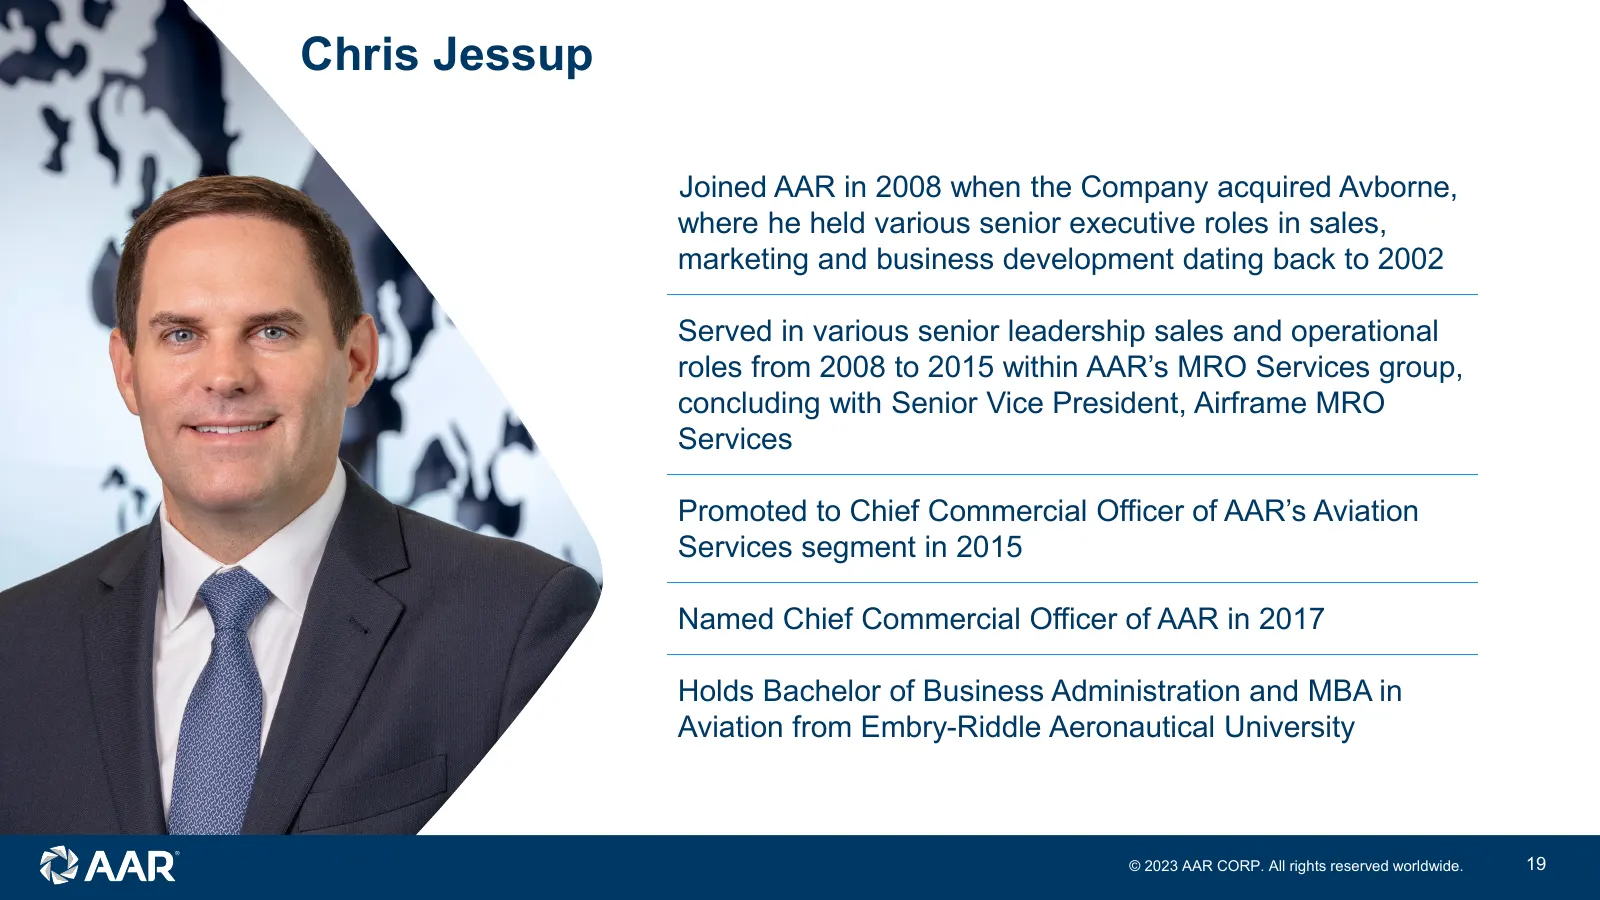
Chris Jessup Joined AAR in 2008 when the Company acquired Avborne, where he held various senior executive roles in sales, marketing and business development dating back to 2002 Served in various senior leadership sales and operational roles from 2008 to 2015 within AAR’s MRO Services group, concludi
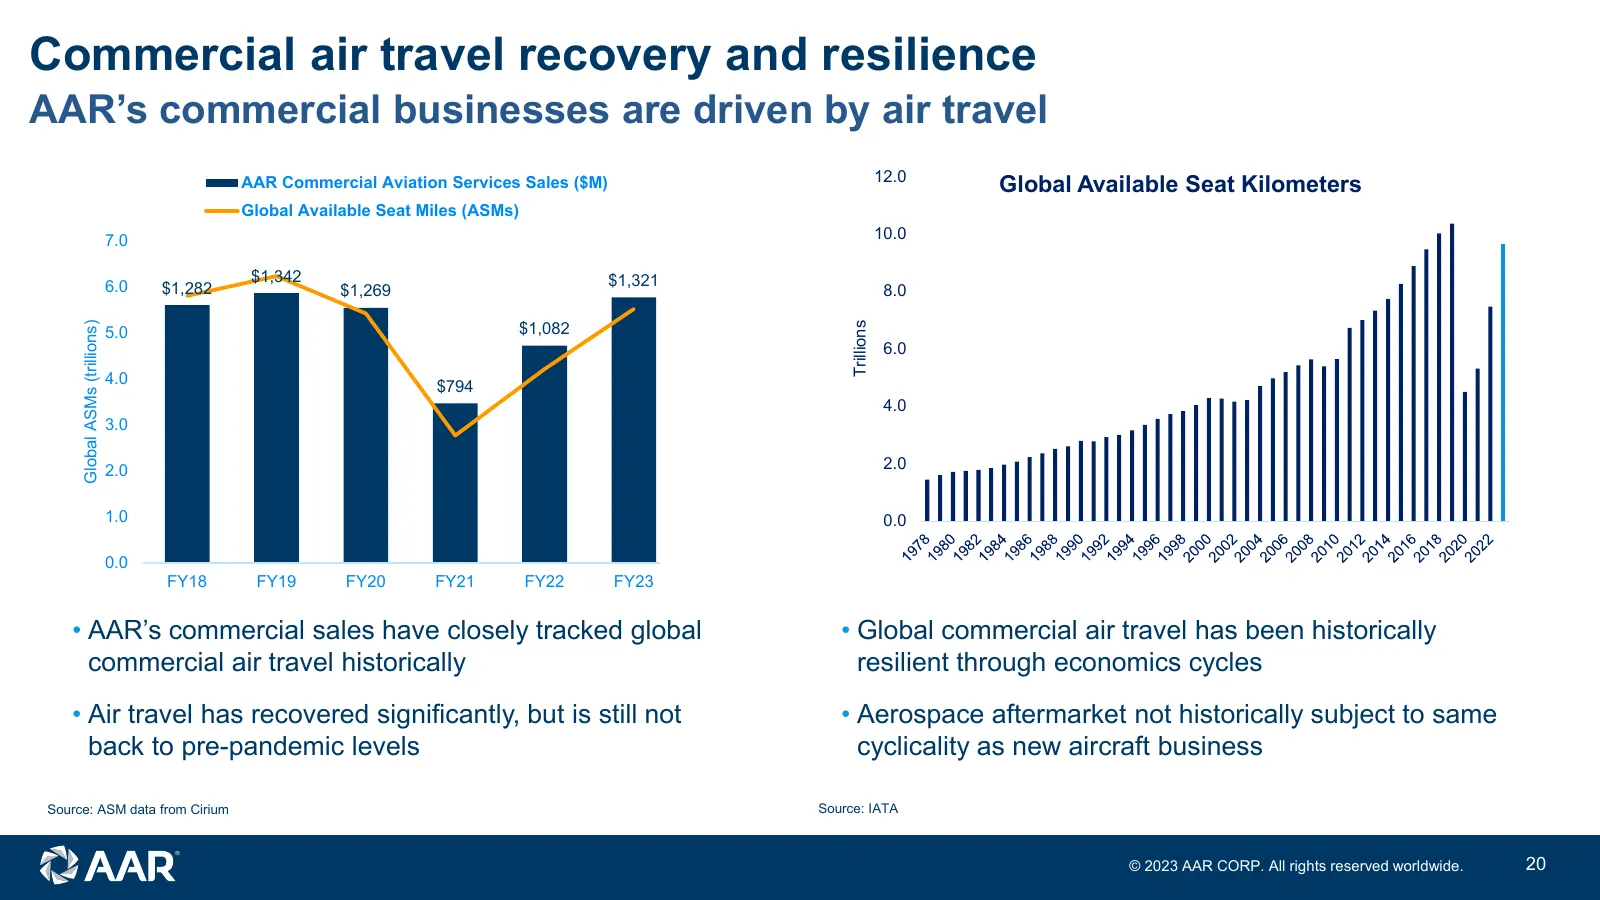
Slide 20: Commercial air travel recovery and resilience
Commercial air travel recovery and resilience AAR’s commercial businesses are driven by air travel 12.0 AAR Commercial Aviation Services Sales ($M) Global Available Seat Kilometers Global Available Seat Miles (ASMs) 7.0 $1,600 10.0 $1,342 $1,321 $1,400 6.0 $1,282 $1,269 8.0 $1,200 $1,082 Global ASMs
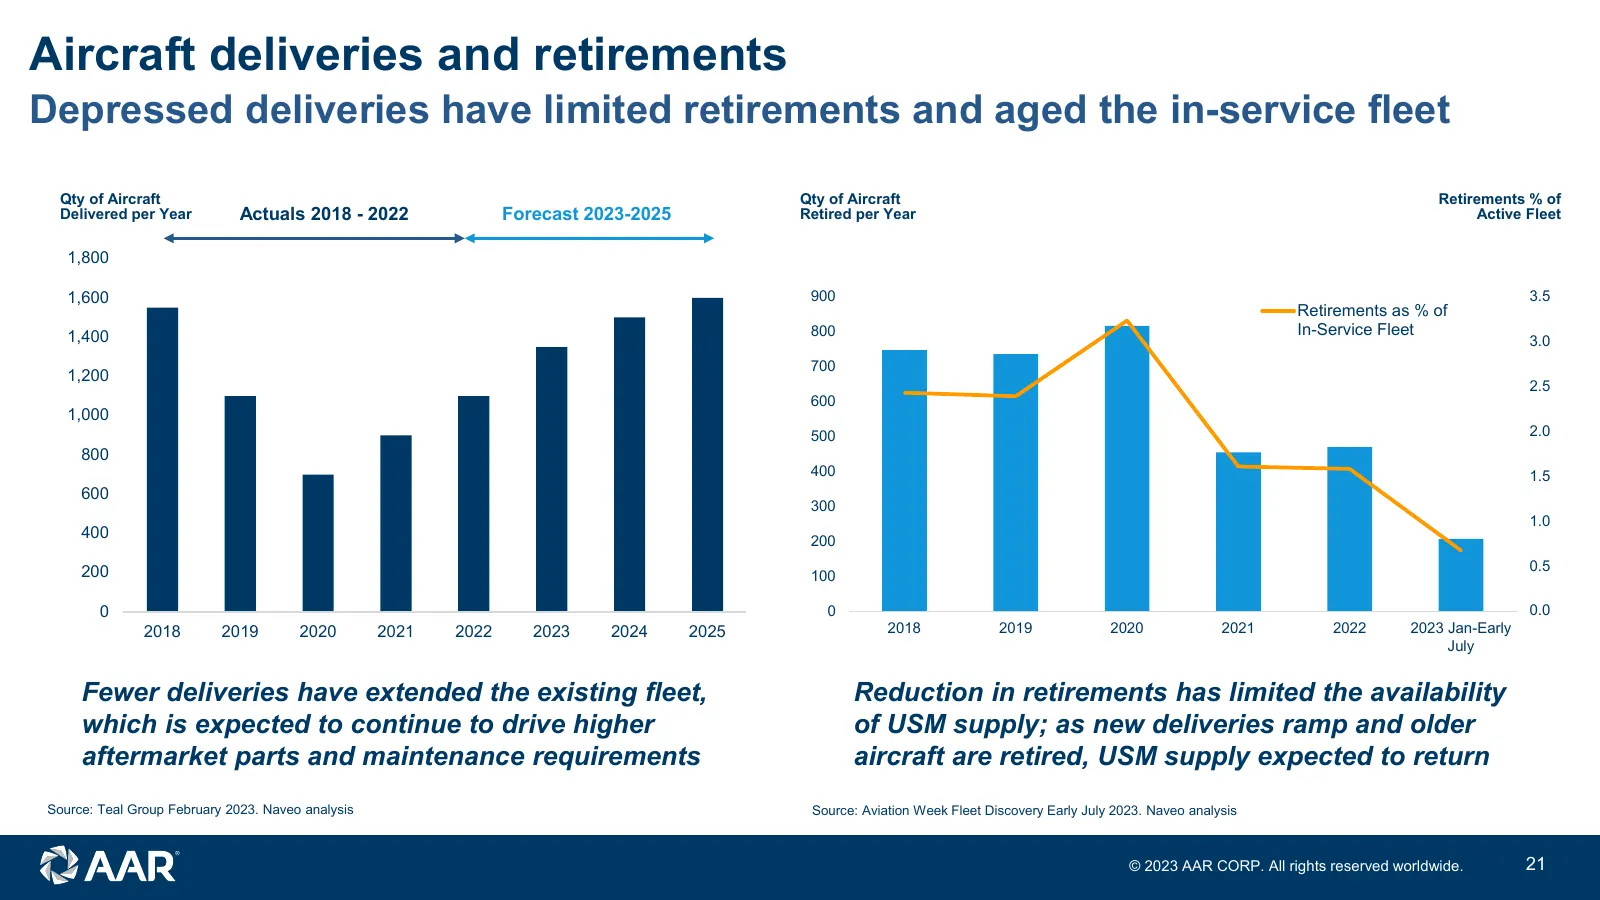
Slide 21: Aircraft deliveries and retirements
Aircraft deliveries and retirements Depressed deliveries have limited retirements and aged the in-service fleet Qty of Aircraft Qty of Aircraft Retirements % of Delivered per Year Actuals 2018 - 2022 Forecast 2023-2025 Retired per Year Active Fleet 1,800 1,600 900 3.5 Retirements as % of 1,400 800 I
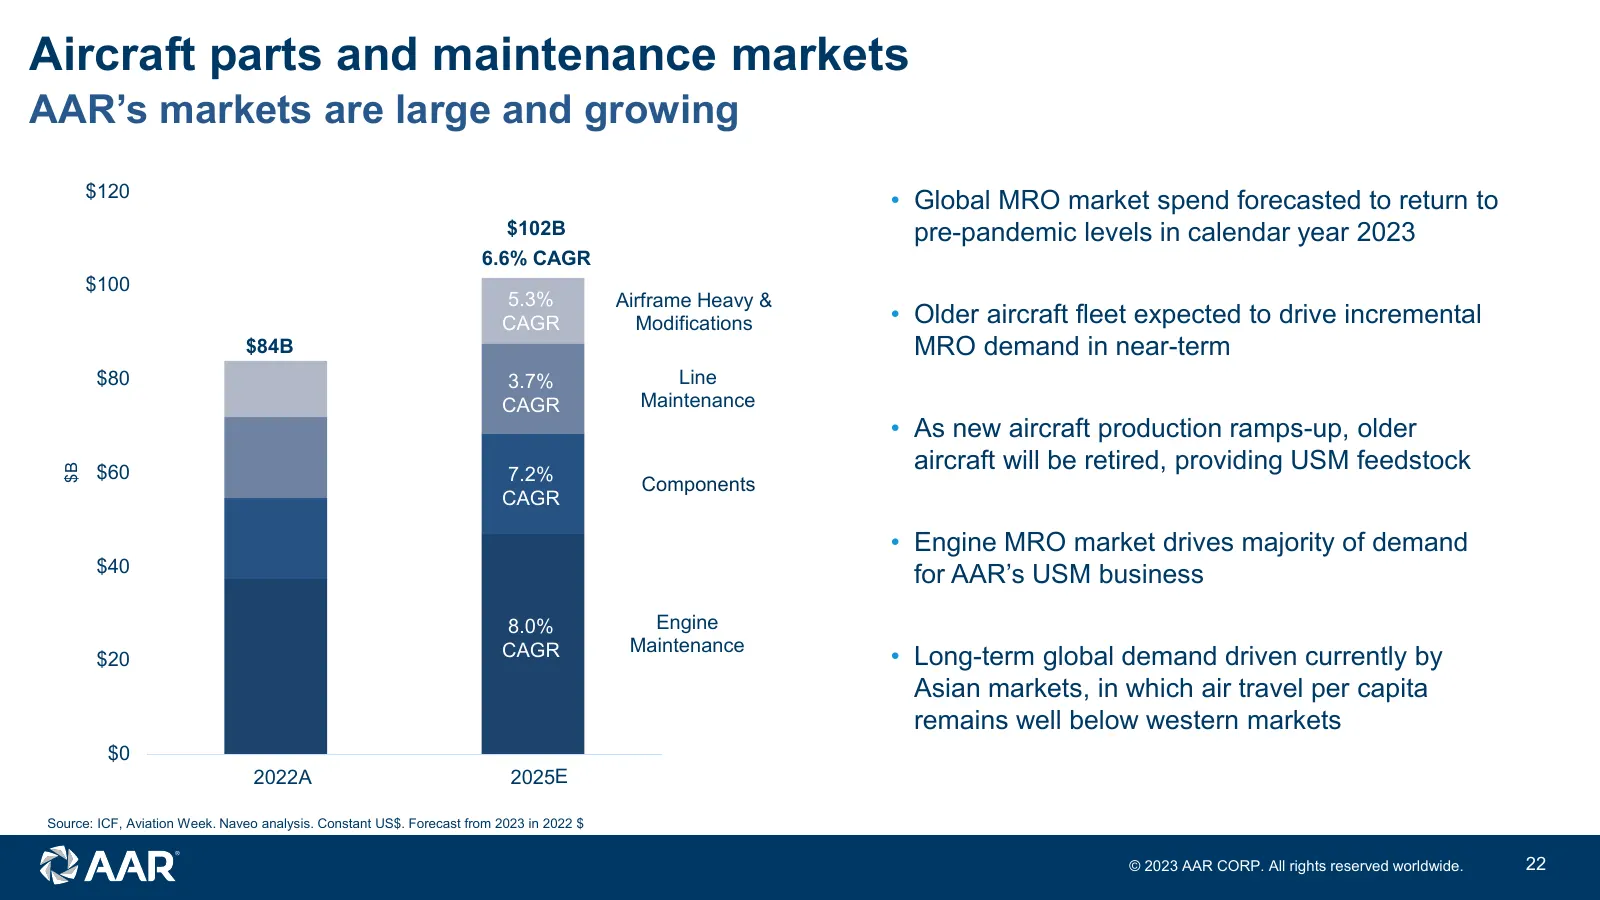
Slide 22: Aircraft parts and maintenance markets
Aircraft parts and maintenance markets AAR’s markets are large and growing $120 • Global MRO market spend forecasted to return to $102B pre-pandemic levels in calendar year 2023 6.6% CAGR $100 5.3% Airframe Heavy & CAGR Modifications • Older aircraft fleet expected to drive incremental $84B MRO dema
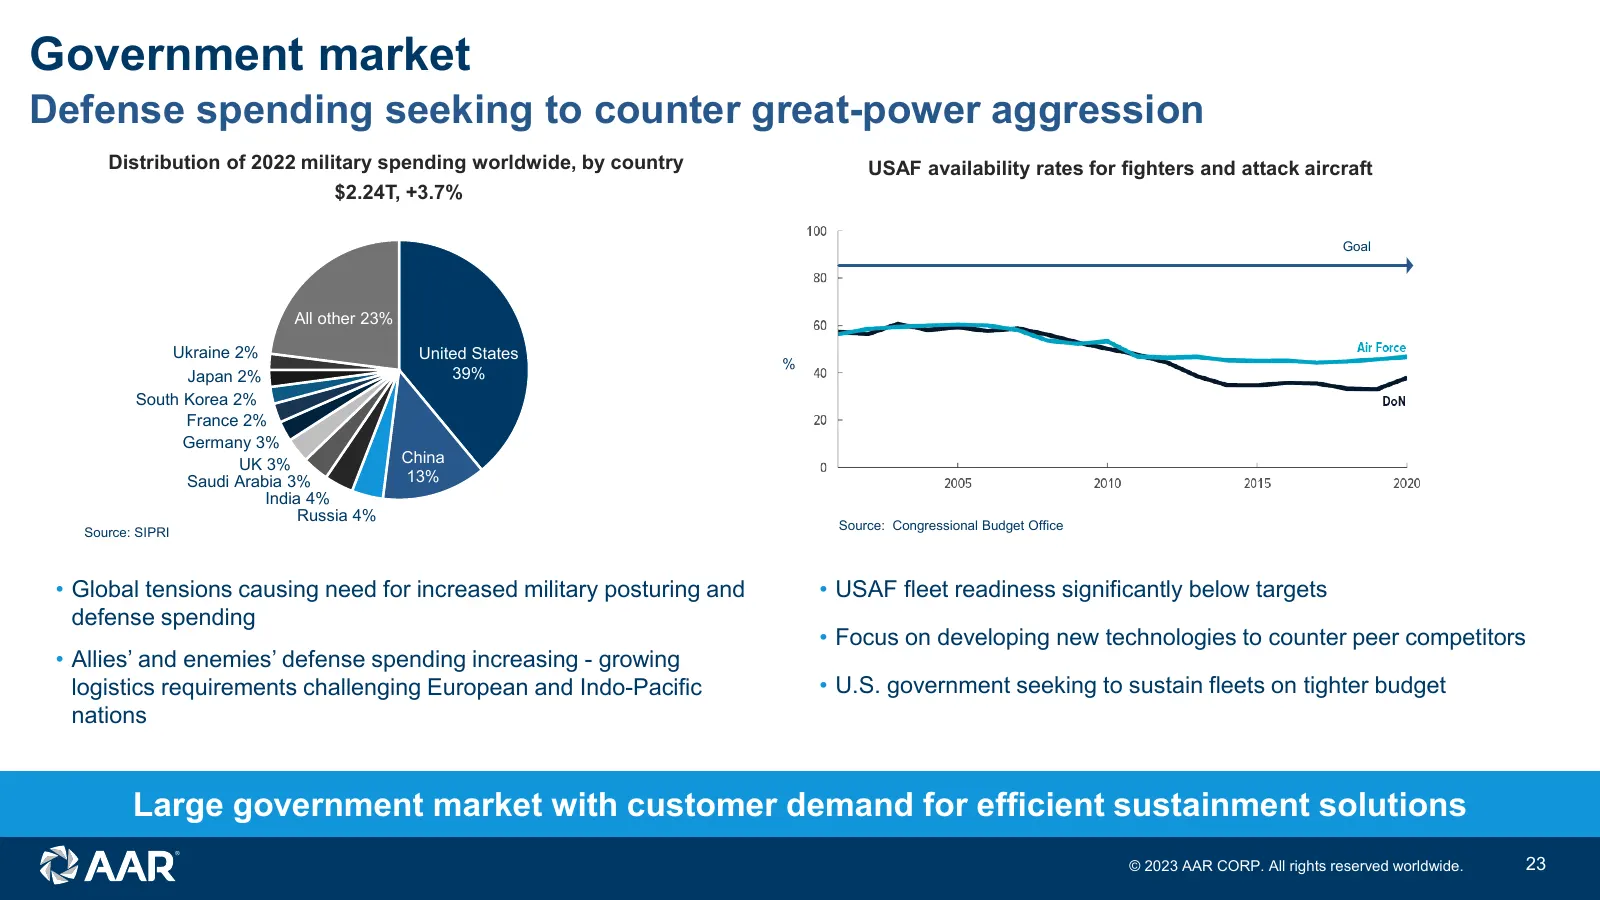
Slide 23: Government market
Government market Defense spending seeking to counter great-power aggression Distribution of 2022 military spending worldwide, by country USAF availability rates for fighters and attack aircraft $2.24T, +3.7% Goal All other 23% Ukraine 2% United States % Japan 2% 39% South Korea 2% France 2% Germany
Slide 24: Government market
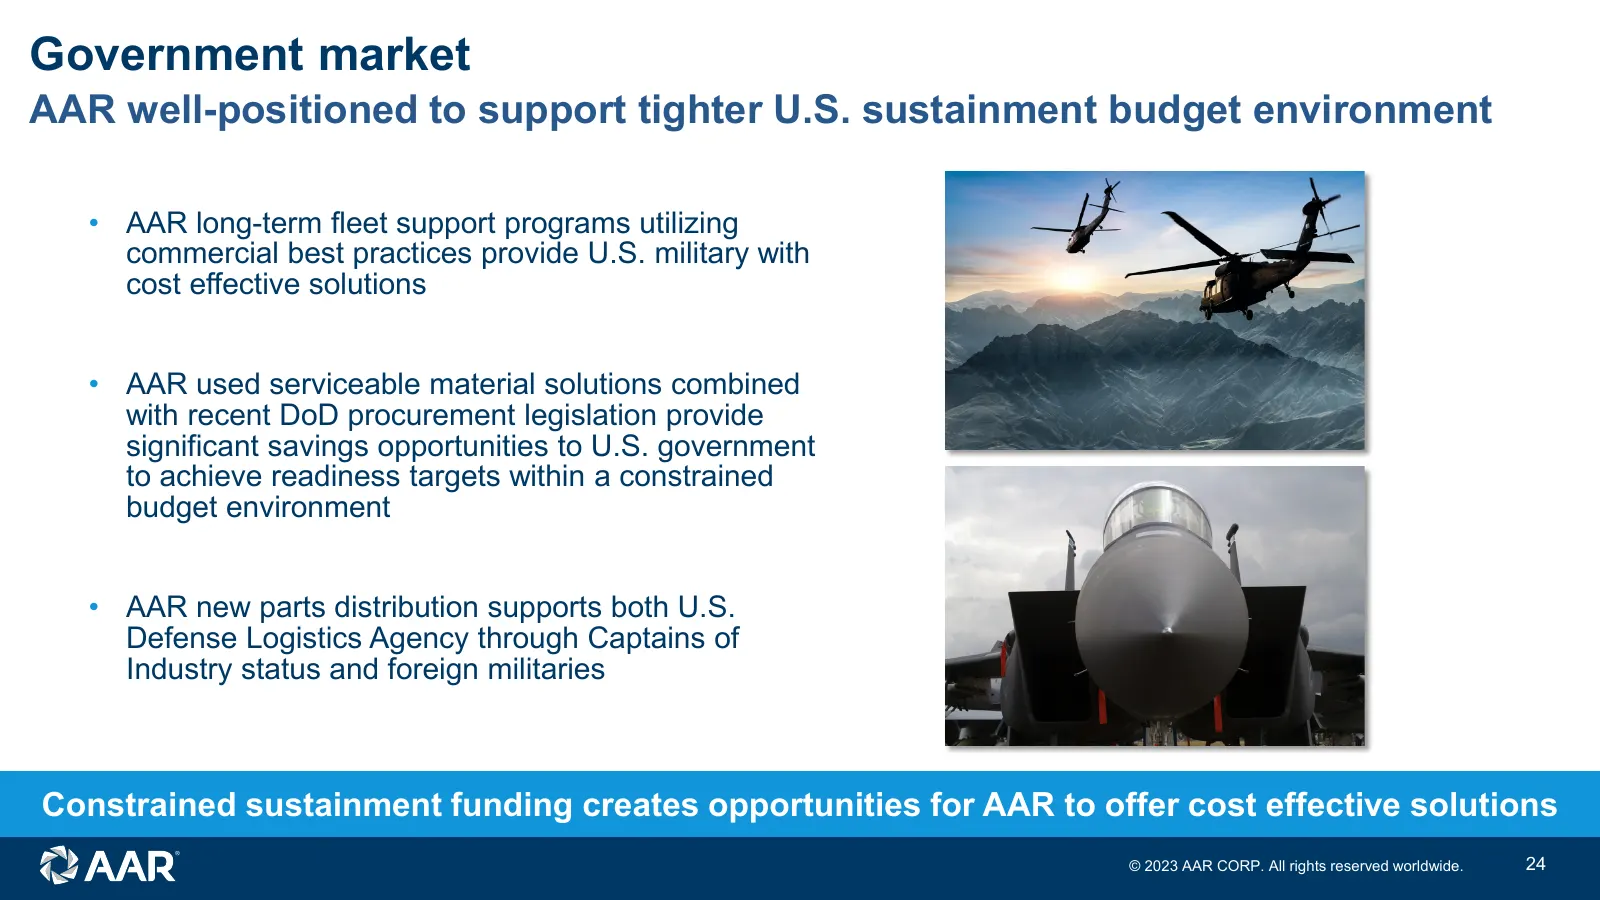
Government market AAR well-positioned to support tighter U.S. sustainment budget environment • AAR long-term fleet support programs utilizing commercial best practices provide U.S. military with cost effective solutions • AAR used serviceable material solutions combined with recent DoD procurement l
Slide 25: Global expertise and reach
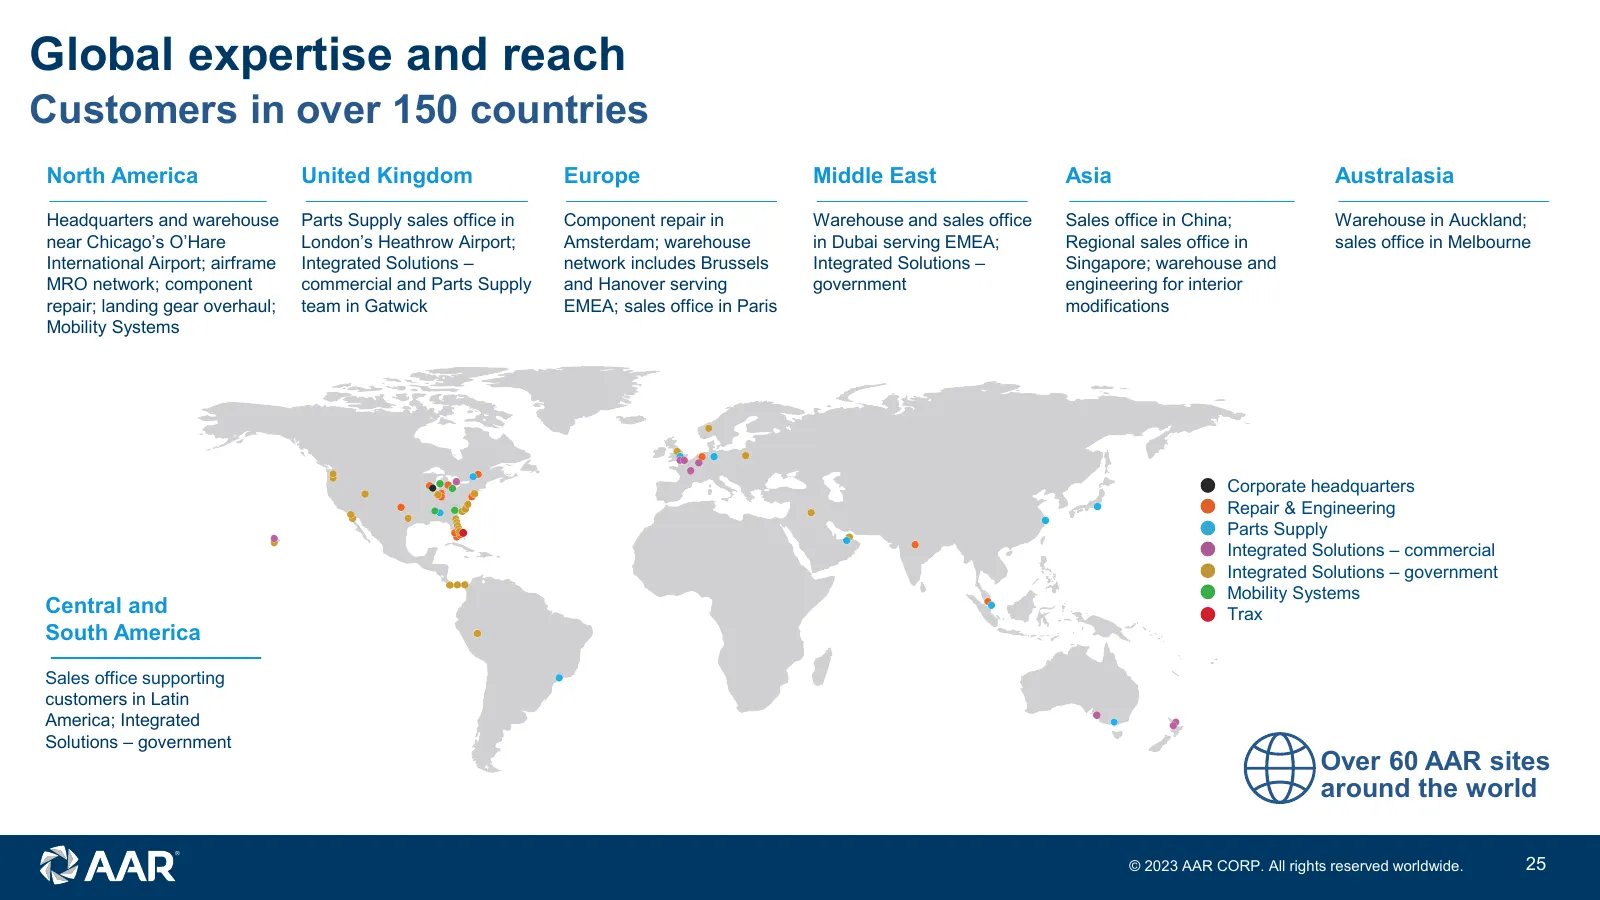
Global expertise and reach Customers in over 150 countries North America United Kingdom Europe Middle East Asia Australasia Headquarters and warehouse Parts Supply sales office in Component repair in Warehouse and sales office Sales office in China; Warehouse in Auckland; near Chicago’s O’Hare Londo
Slide 26: Highly-diversified customer base with longstanding relationships
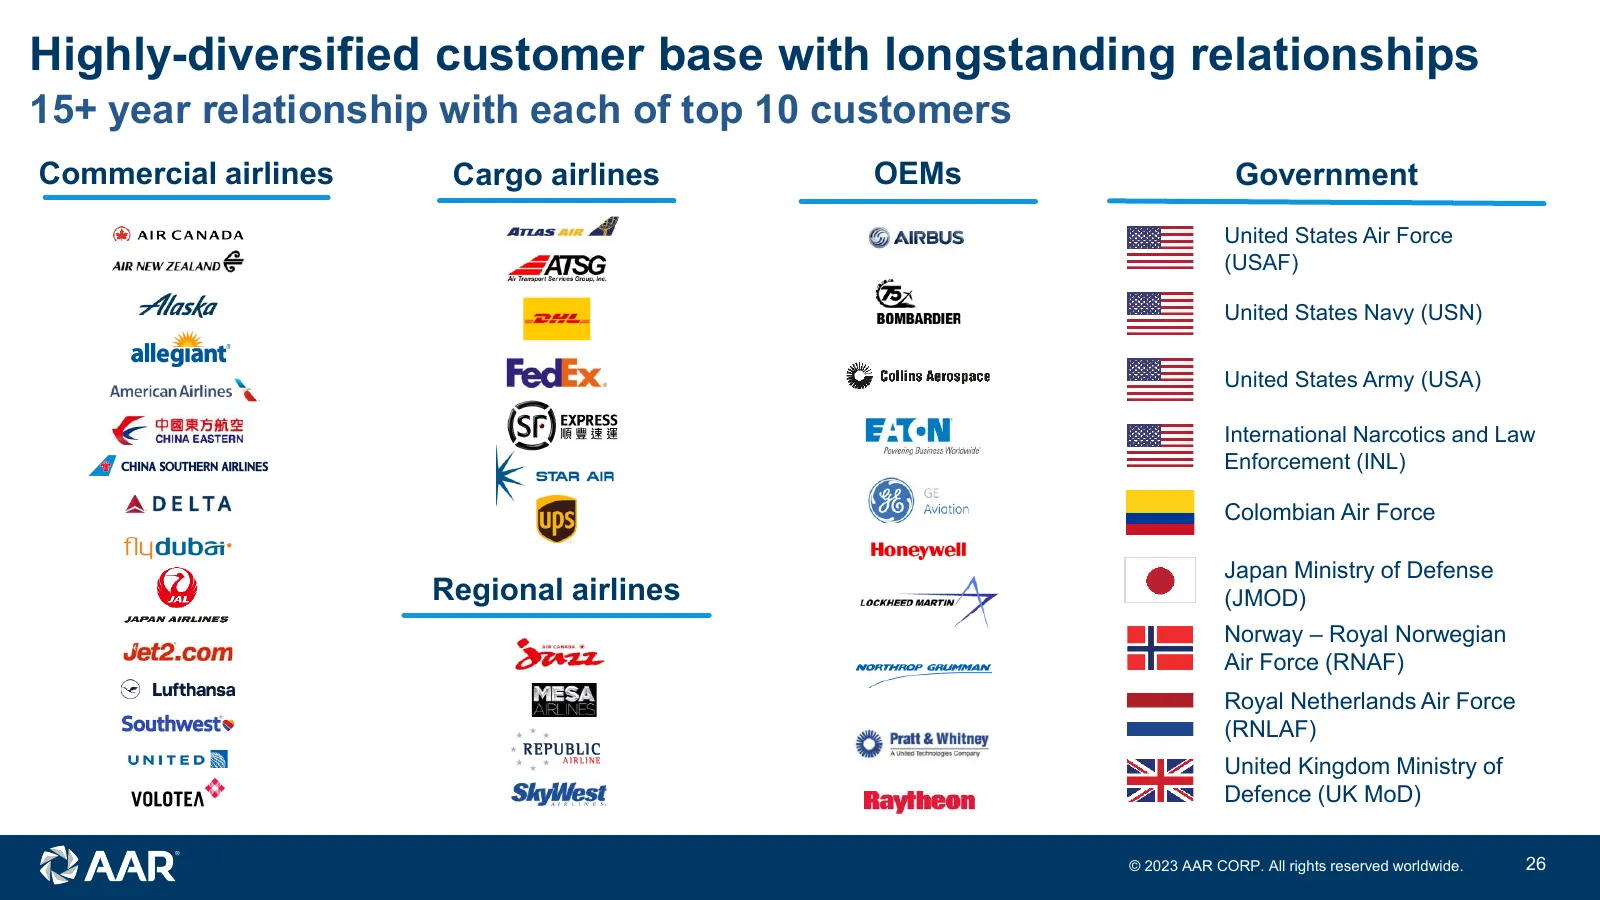
Highly-diversified customer base with longstanding relationships 15+ year relationship with each of top 10 customers Commercial airlines Cargo airlines OEMs Government United States Air Force (USAF) United States Navy (USN) United States Army (USA) International Narcotics and Law Enforcement (INL) C
Slide 27: Parts Supply: Used Serviceable Material
Parts Supply: Used Serviceable Material Sal Marino Senior Vice President, Used Serviceable Material © 2023 AAR CORP. All rights reserved worldwide. 27
Slide 28: Sal Marino
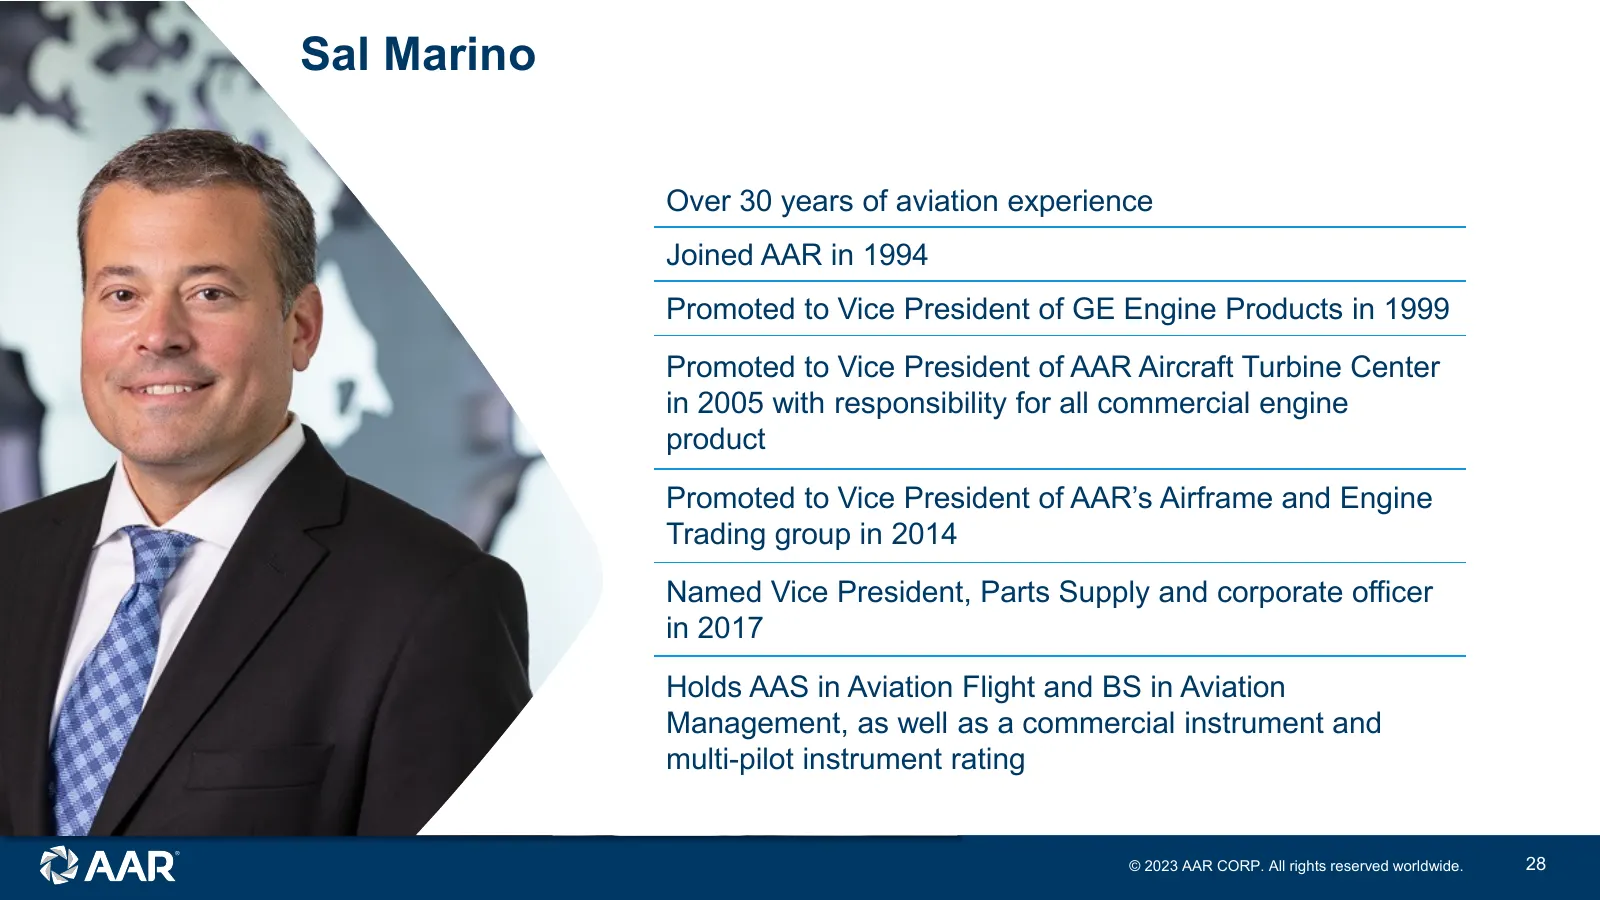
Sal Marino Over 30 years of aviation experience Joined AAR in 1994 Promoted to Vice President of GE Engine Products in 1999 Promoted to Vice President of AAR Aircraft Turbine Center in 2005 with responsibility for all commercial engine product Promoted to Vice President of AAR’s Airframe and Engine
Slide 29: Parts Supply: Used Serviceable Material
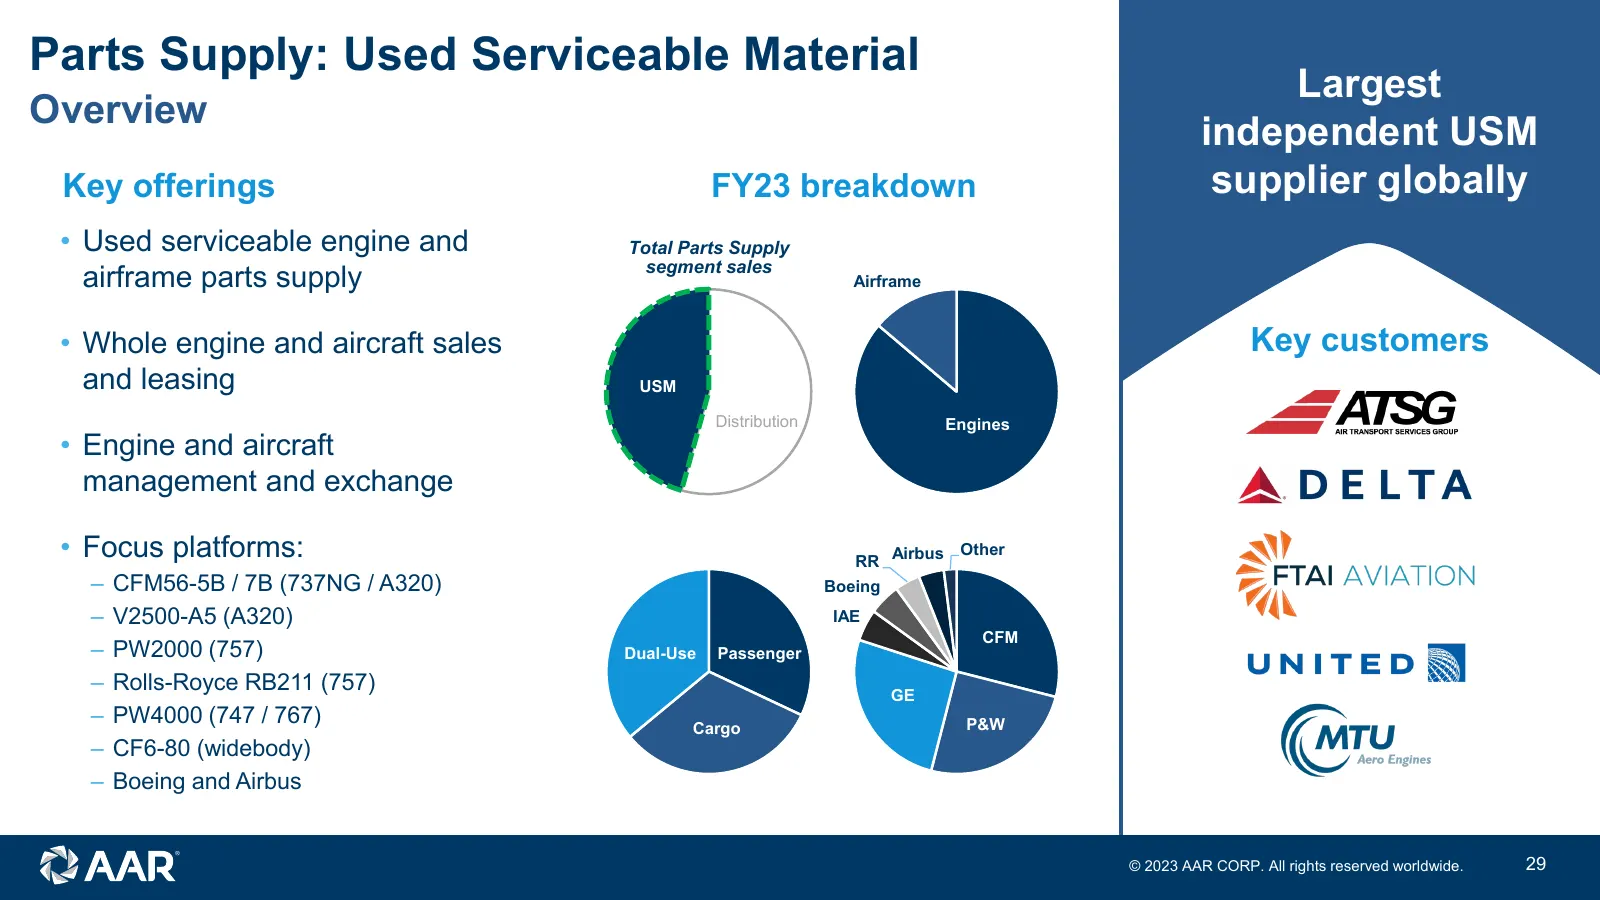
Parts Supply: Used Serviceable Material Largest Overview independent USM Key offerings FY23 breakdown supplier globally • Used serviceable engine and Total Parts Supply segment sales airframe parts supply Airframe • Whole engine and aircraft sales Key customers and leasing USM Distribution Engines •
Slide 30: Parts Supply: Used Serviceable Material
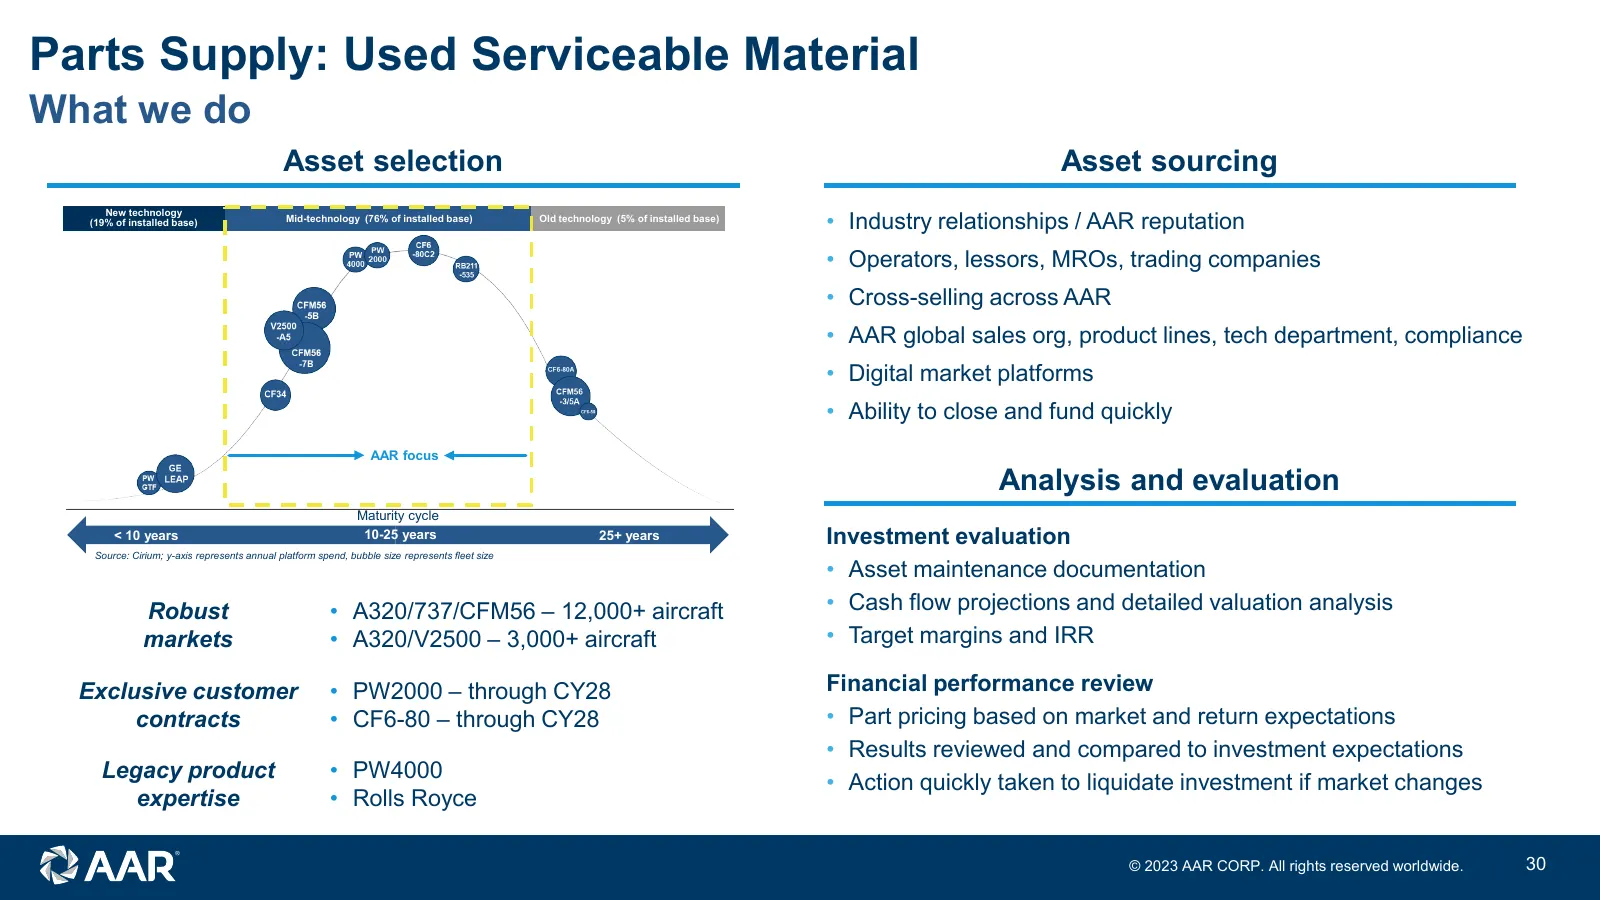
Parts Supply: Used Serviceable Material What we do Asset selection Asset sourcing • Industry relationships / AAR reputation New technology (19% of installed base) Mid-technology (76% of installed base) Old technology (5% of installed base) • Operators, lessors, MROs, trading companies • Cross-sellin
Slide 31: Parts Supply: Used Serviceable Material
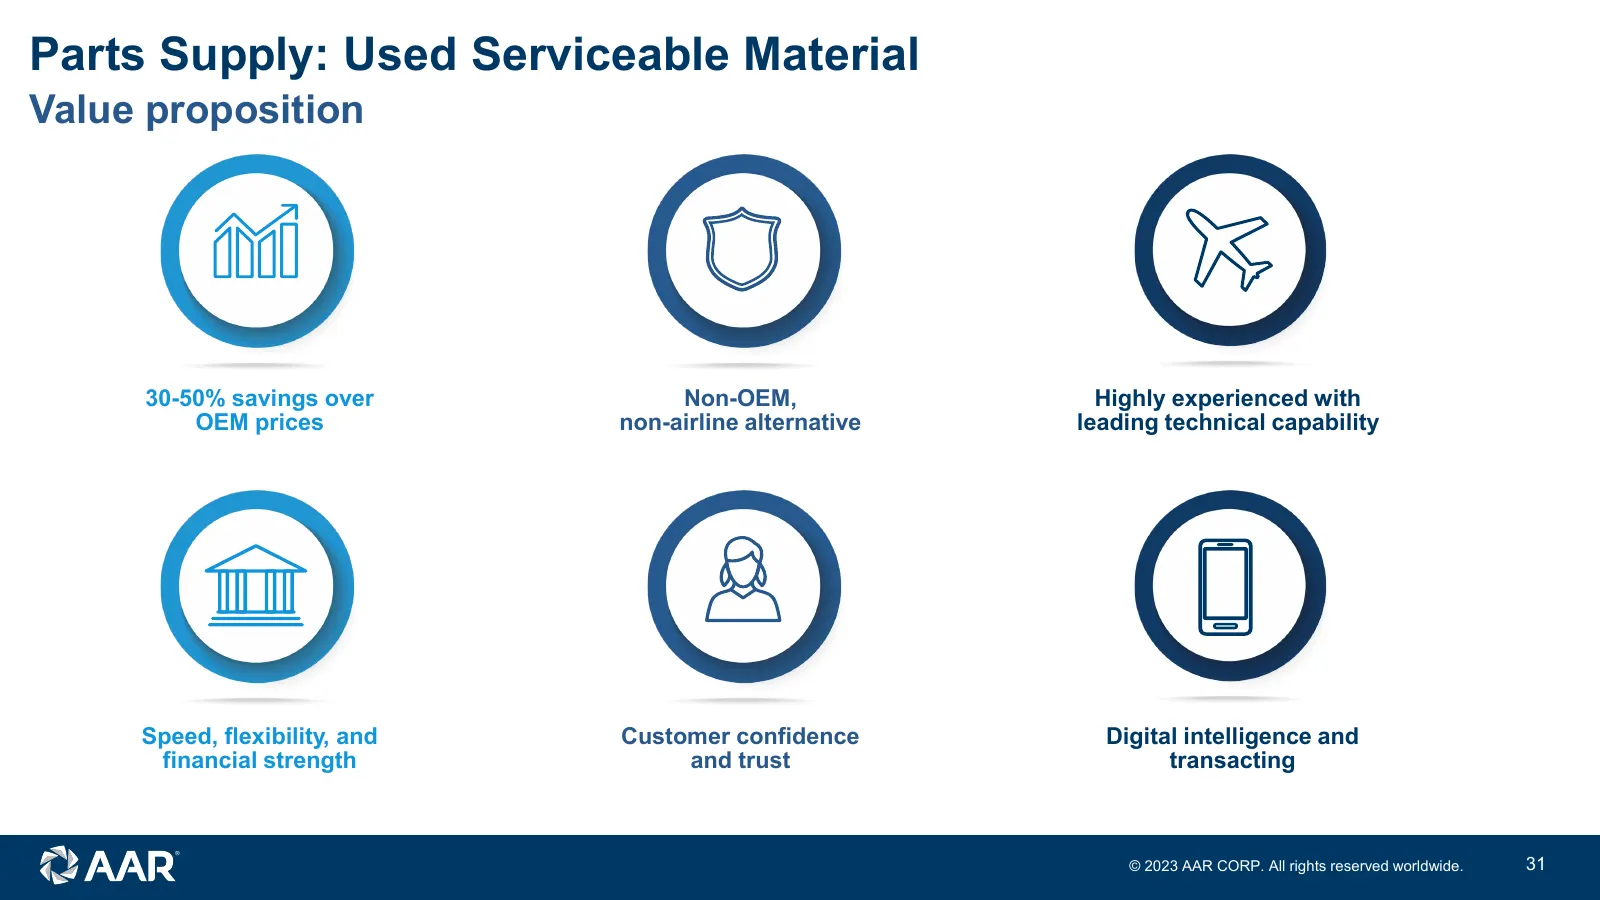
Parts Supply: Used Serviceable Material Value proposition 30-50% savings over Non-OEM, Highly experienced with OEM prices non-airline alternative leading technical capability Speed, flexibility, and Customer confidence Digital intelligence and financial strength and trust transacting © 2023 AAR CORP
Slide 32: Key achievements since 2019 Investor Day
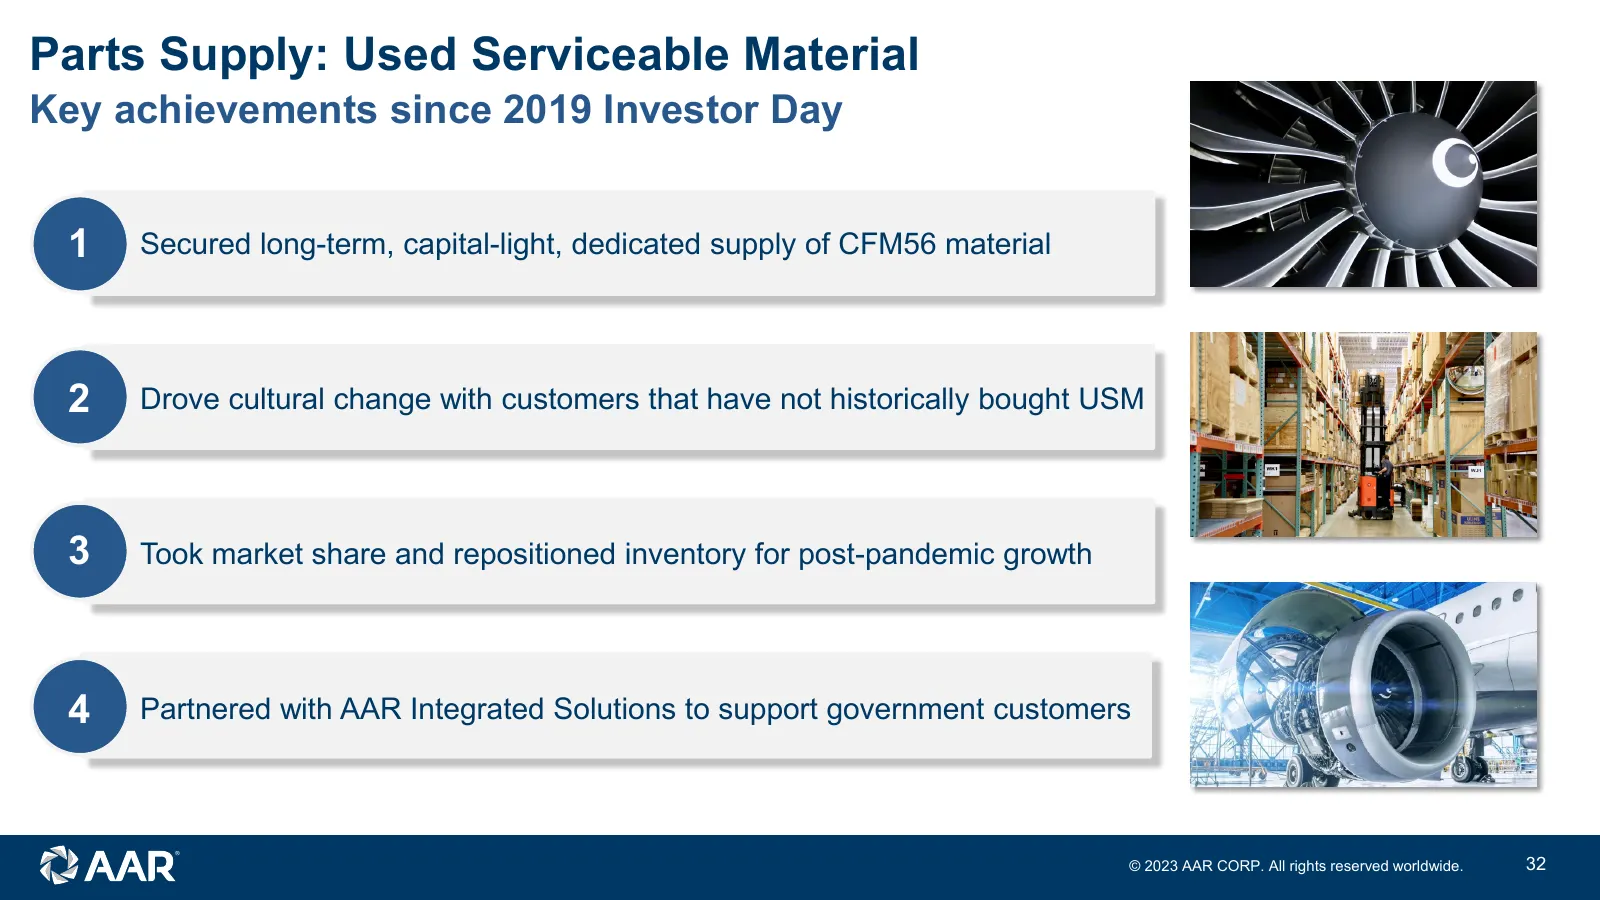
Parts Supply: Used Serviceable Material Key achievements since 2019 Investor Day 1 Secured long-term, capital-light, dedicated supply of CFM56 material 2 Drove cultural change with customers that have not historically bought USM 3 Took market share and repositioned inventory for post-pandemic growth
Slide 33: Case study: CFM56 partnership with FTAI Aviation
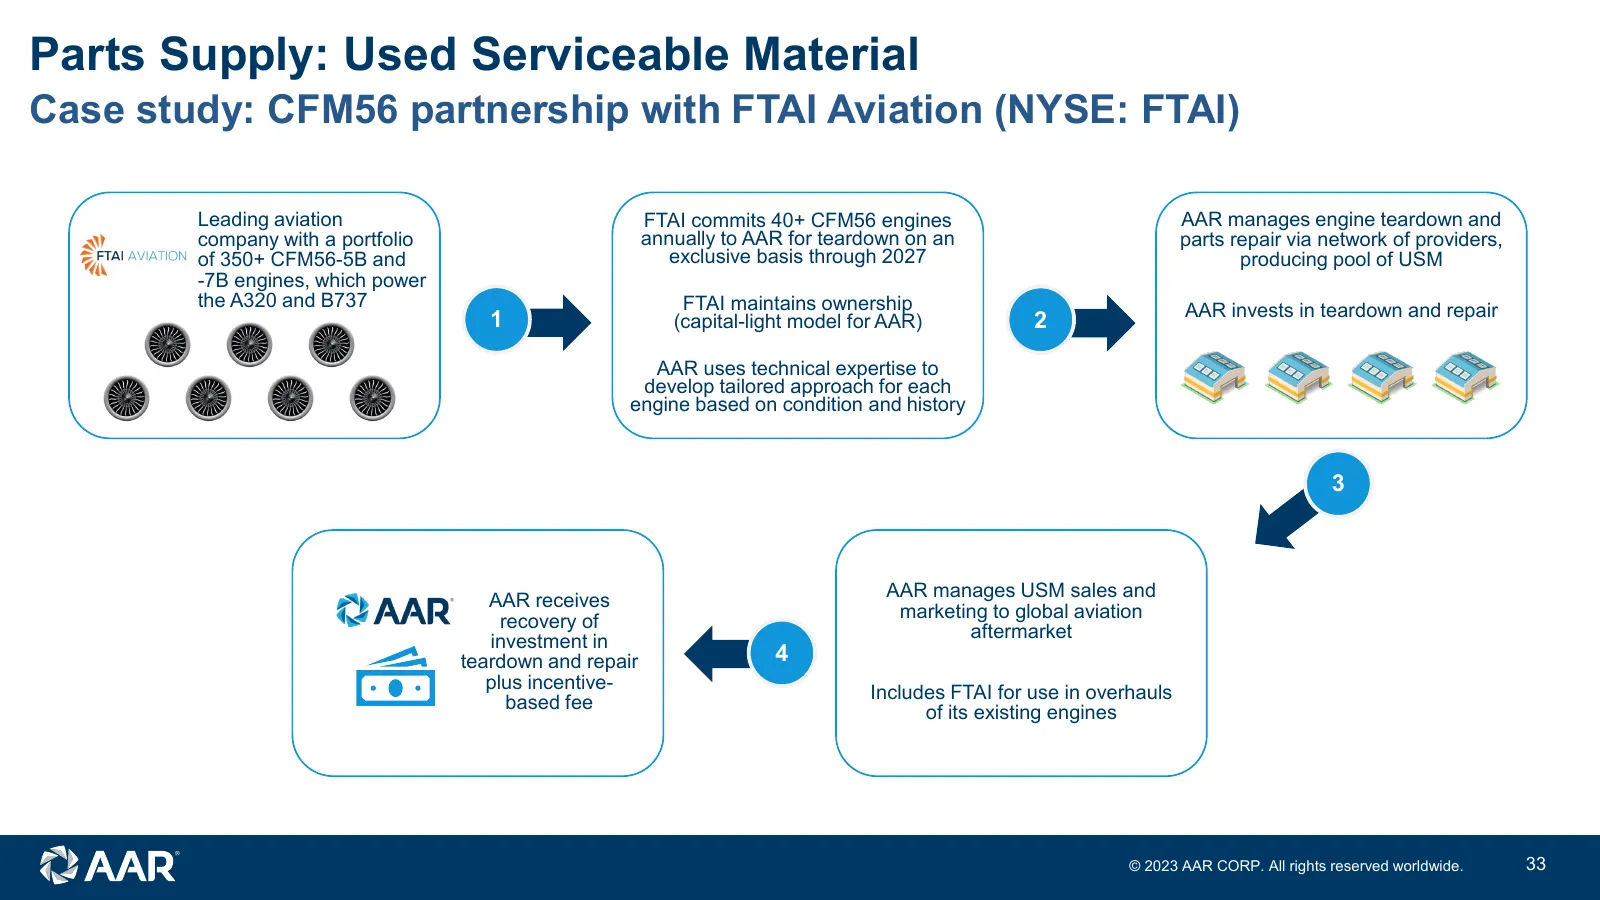
Parts Supply: Used Serviceable Material Case study: CFM56 partnership with FTAI Aviation (NYSE: FTAI) Leading aviation FTAI commits 40+ CFM56 engines AAR manages engine teardown and company with a portfolio annually to AAR for teardown on an parts repair via network of providers, of 350+ CFM56-5B an
Slide 34: Growth initiatives
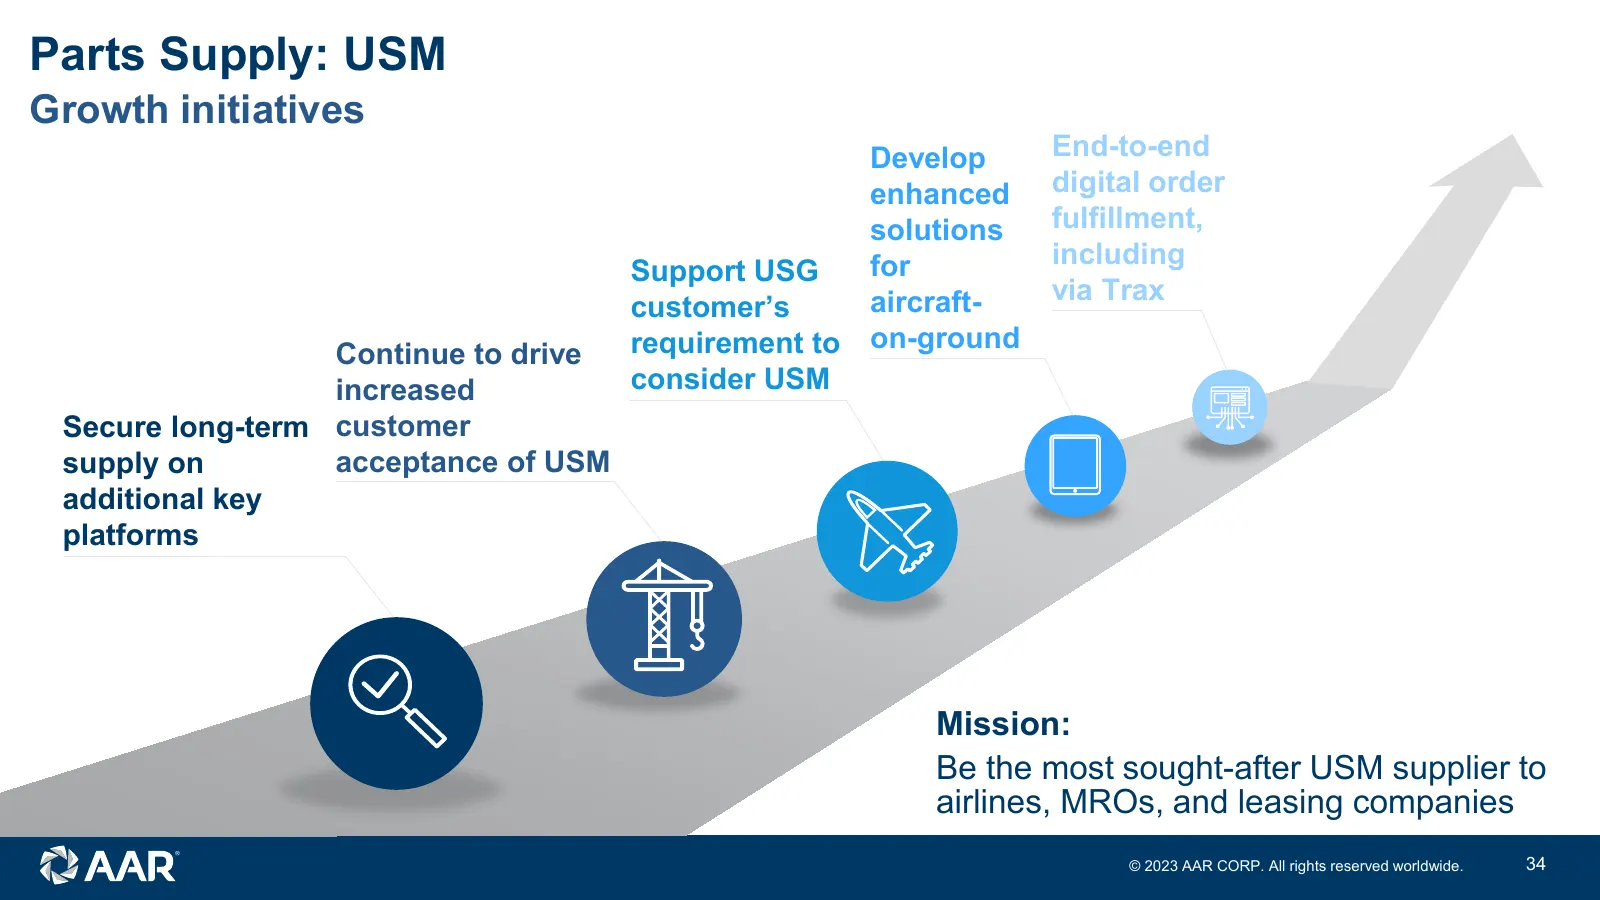
Parts Supply: USM Growth initiatives Develop End-to-end enhanced digital order solutions fulfillment, for including Support USG aircraft- via Trax customer’s Continue to drive requirement to on-ground increased consider USM Secure long-term customer supply on acceptance of USM additional key platfor
Slide 35: Parts Supply: Distribution
Parts Supply: Distribution Frank Landrio Senior Vice President, Distribution (Interim) © 2023 AAR CORP. All rights reserved worldwide. 35
Slide 36: Frank Landrio
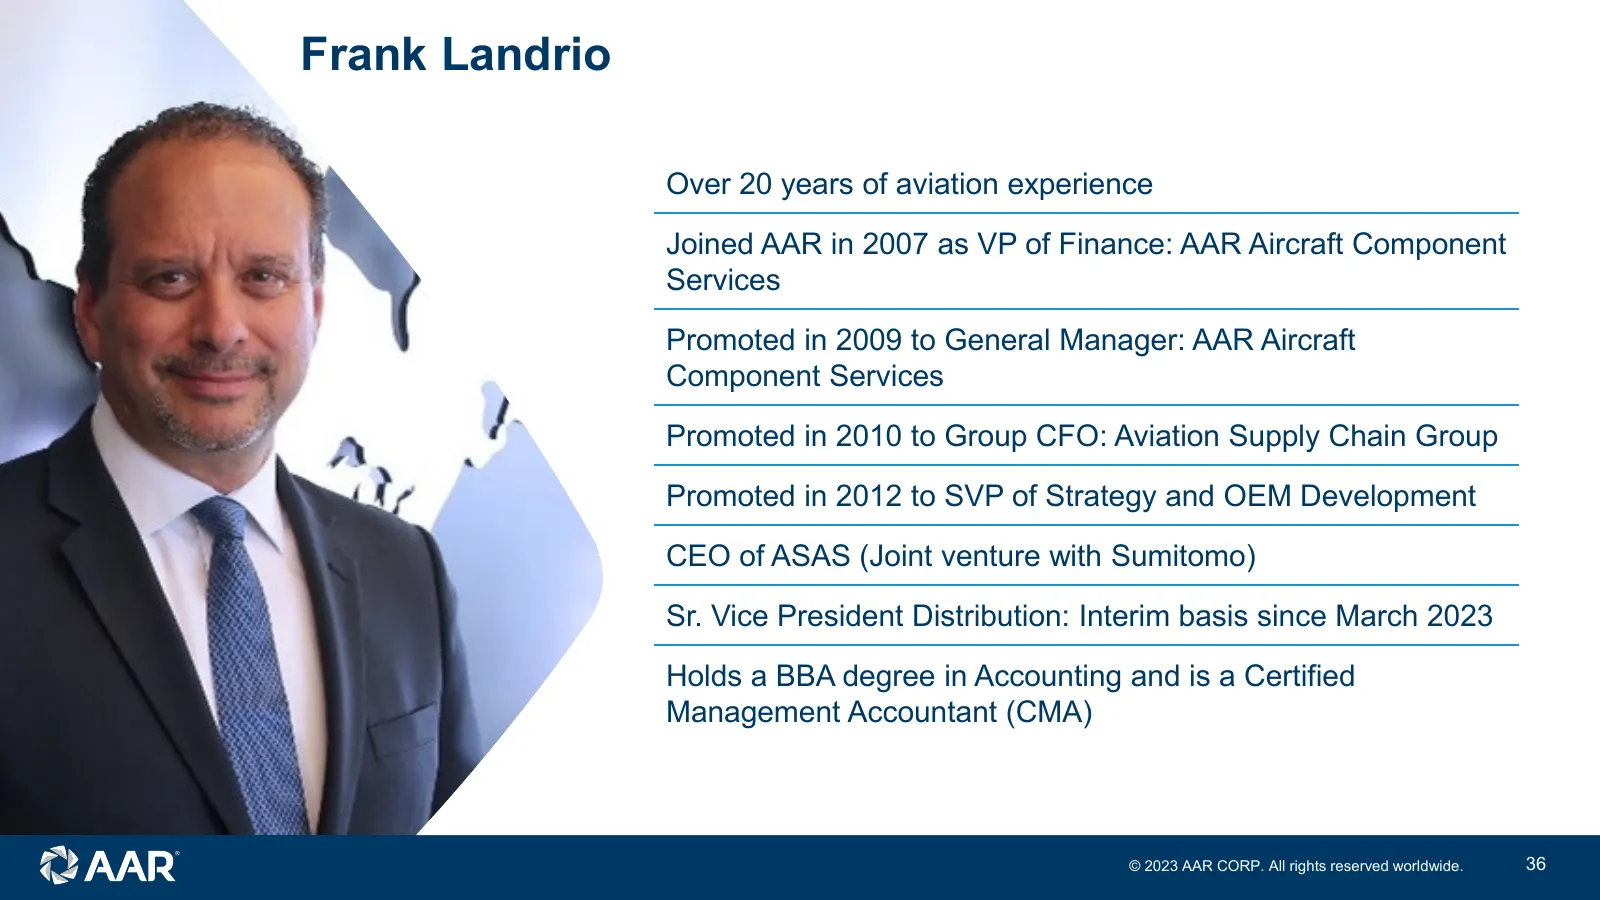
Frank Landrio Over 20 years of aviation experience Joined AAR in 2007 as VP of Finance: AAR Aircraft Component Services Promoted in 2009 to General Manager: AAR Aircraft Component Services Promoted in 2010 to Group CFO: Aviation Supply Chain Group Promoted in 2012 to SVP of Strategy and OEM Developm
Slide 37: Parts Supply: Distribution
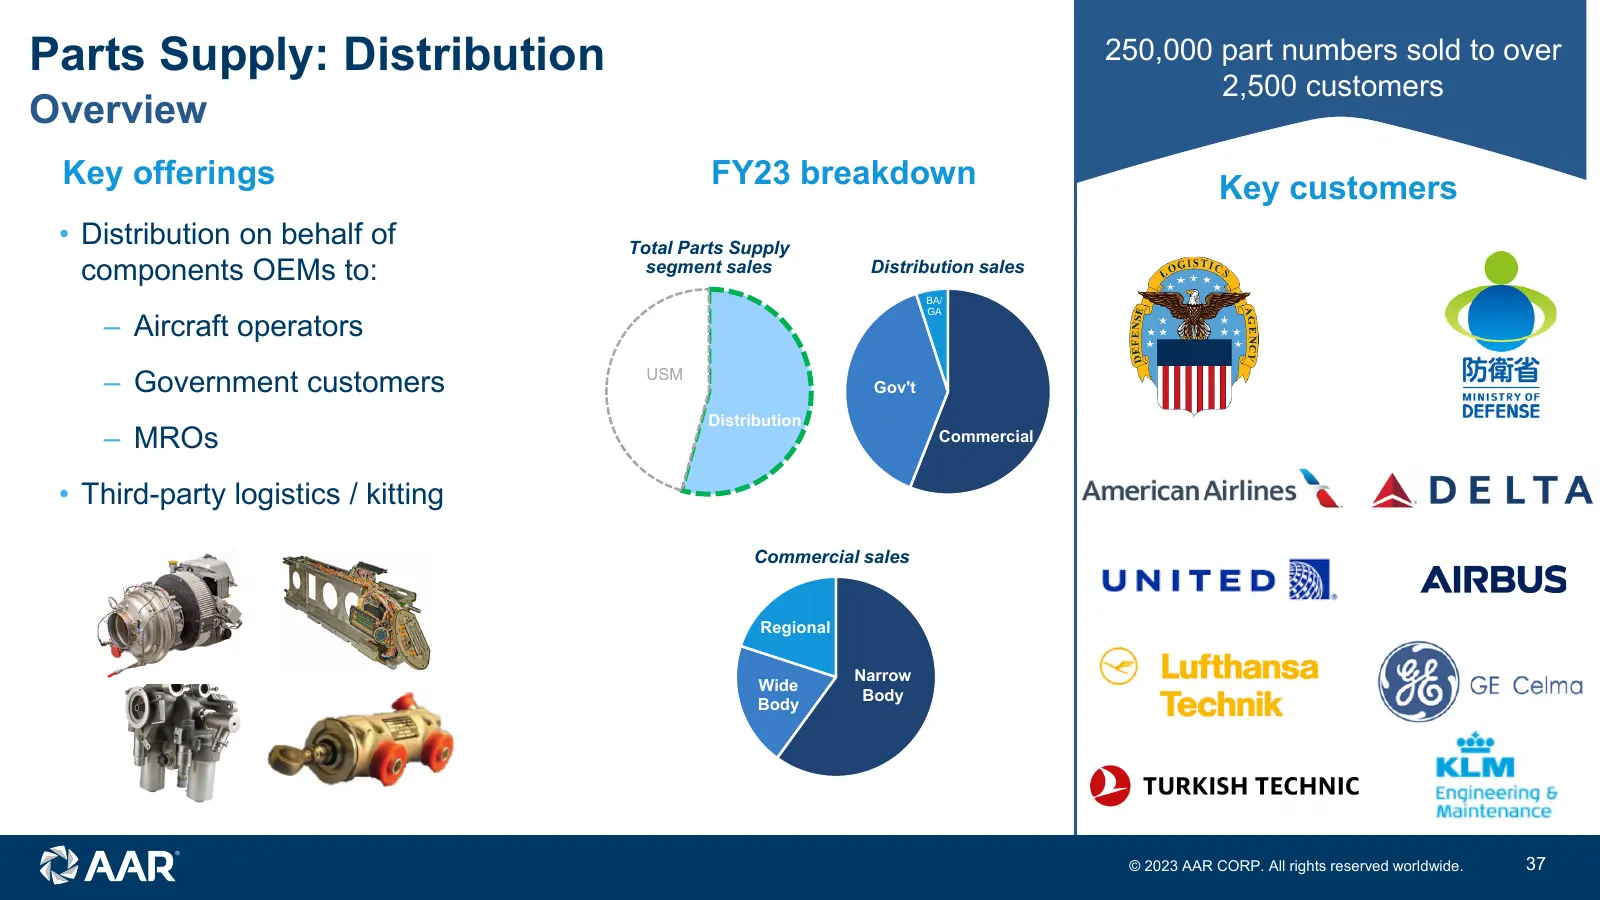
Parts Supply: Distribution 250,000 part numbers sold to over 2,500 customers Overview Key offerings FY23 breakdown Key customers • Distribution on behalf of Total Parts Supply components OEMs to: segment sales Distribution sales BA/ ‒ Aircraft operators GA ‒ Government customers USM Gov't Distributi
Slide 38: Parts Supply: Distribution - What we do
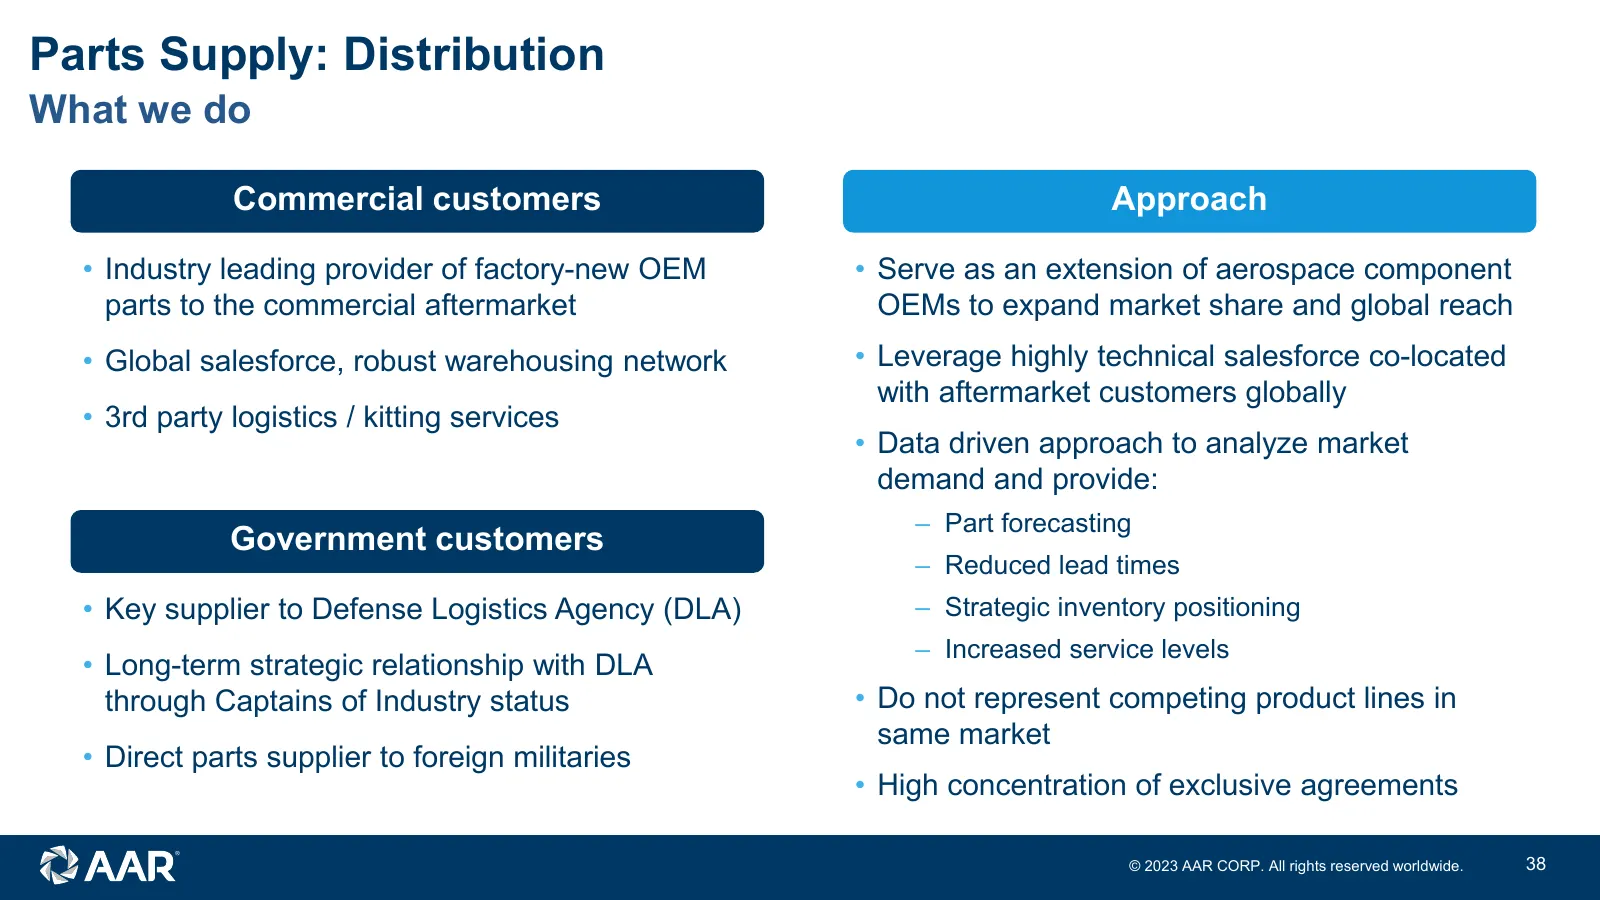
Parts Supply: Distribution What we do Commercial customers Approach • Industry leading provider of factory-new OEM • Serve as an extension of aerospace component parts to the commercial aftermarket OEMs to expand market share and global reach • Global salesforce, robust warehousing network • Leverag
Slide 39: Parts Supply: Distribution value proposition
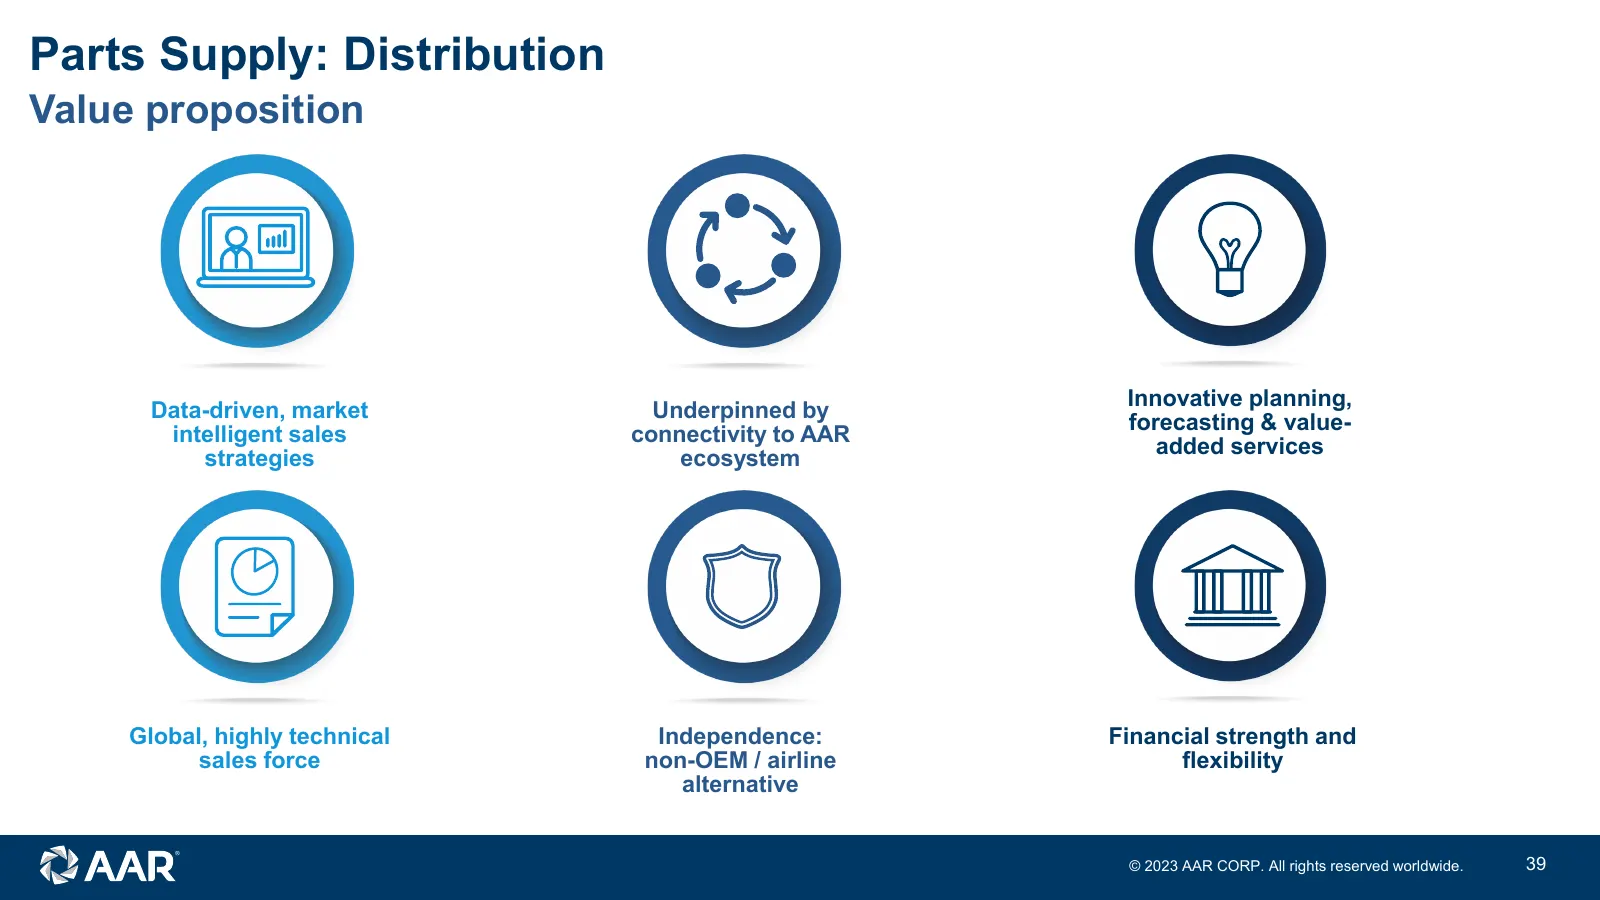
Parts Supply: Distribution Value proposition Innovative planning, Data-driven, market Underpinned by forecasting & value- intelligent sales connectivity to AAR added services strategies ecosystem Global, highly technical Independence: Financial strength and sales force non-OEM / airline flexibility
Slide 40: Government value proposition
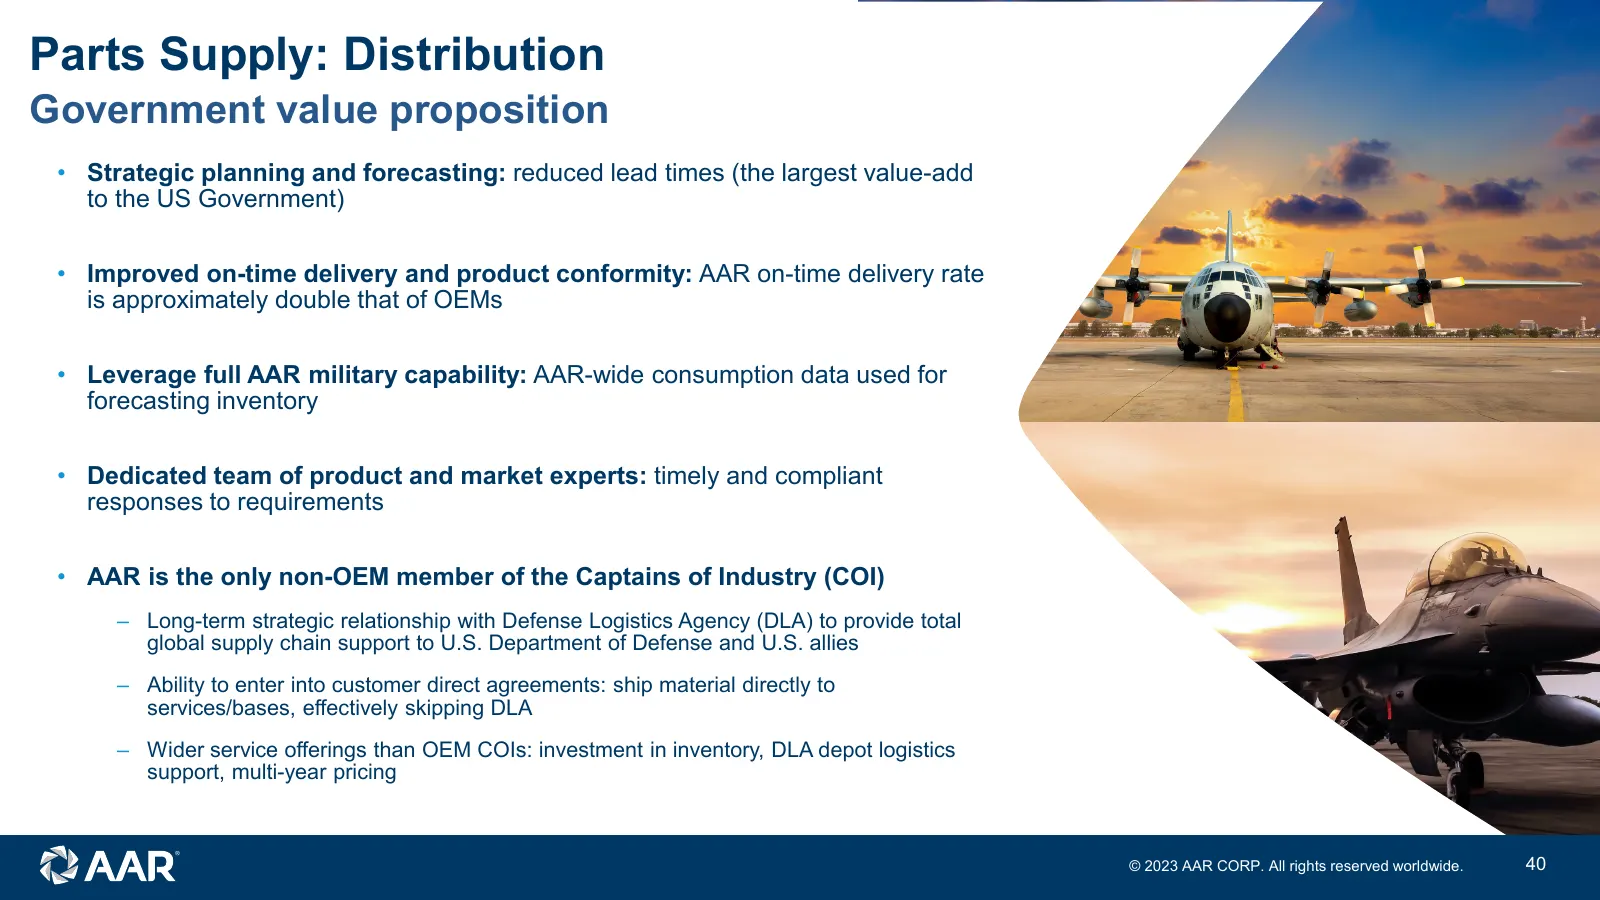
Parts Supply: Distribution Government value proposition • Strategic planning and forecasting: reduced lead times (the largest value-add to the US Government) • Improved on-time delivery and product conformity: AAR on-time delivery rate is approximately double that of OEMs • Leverage full AAR militar
Slide 41: Key growth markets
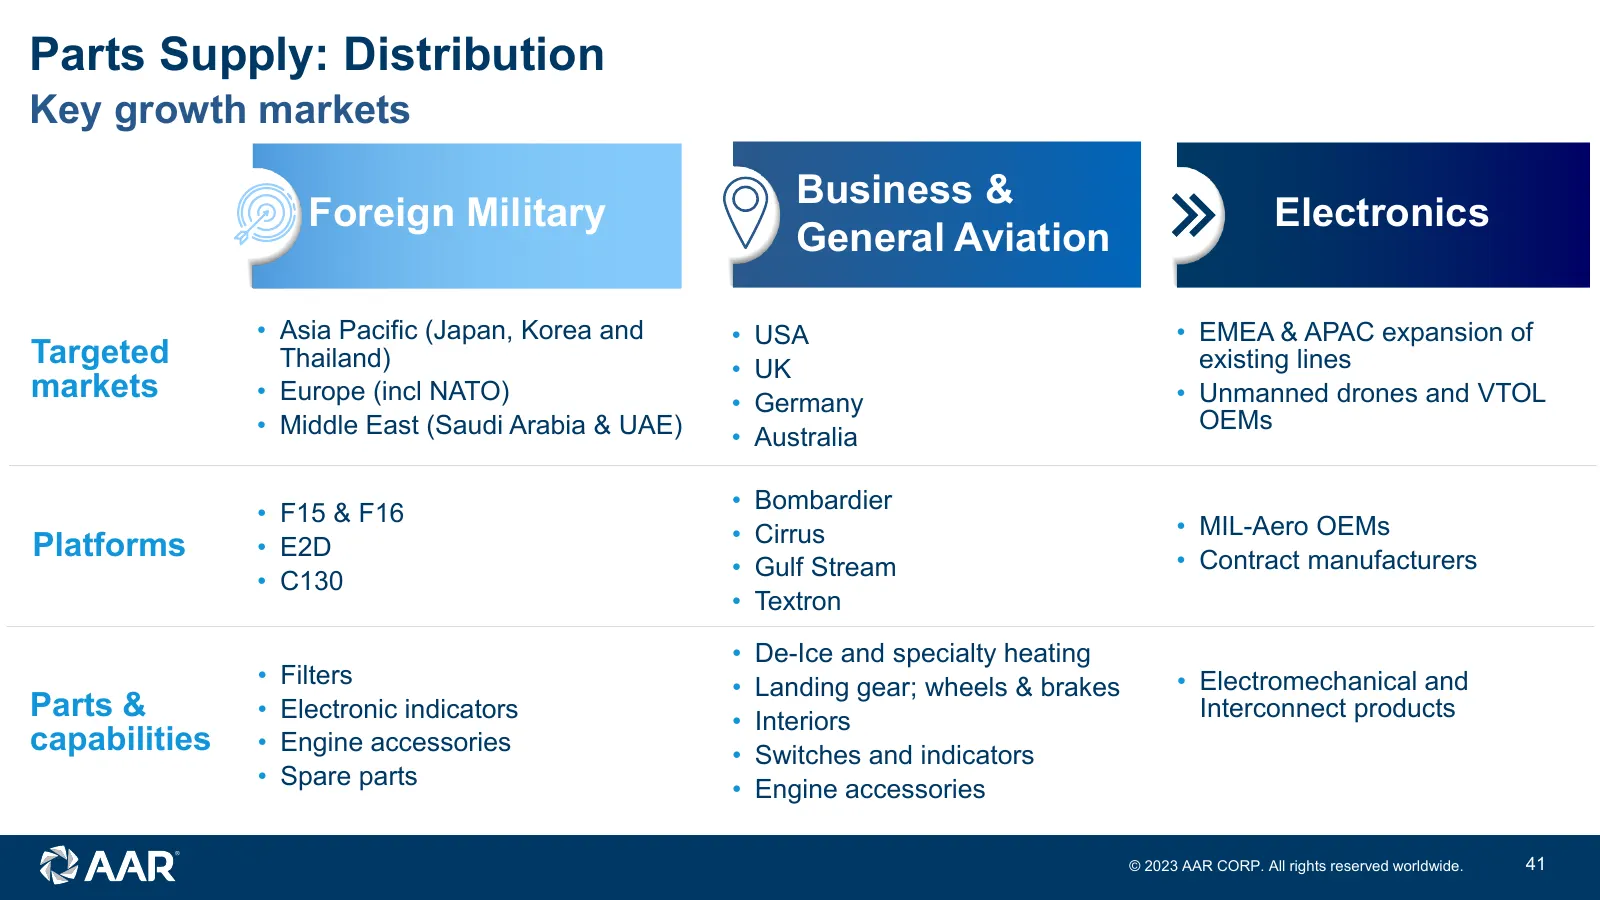
Parts Supply: Distribution Key growth markets Business & Foreign Military Electronics General Aviation • Asia Pacific (Japan, Korea and • USA • EMEA & APAC expansion of Targeted Thailand) • UK existing lines markets • Europe (incl NATO) • Germany • Unmanned drones and VTOL • Middle East (Saudi Arabi
Slide 42: Key achievements since 2019 Investor Day
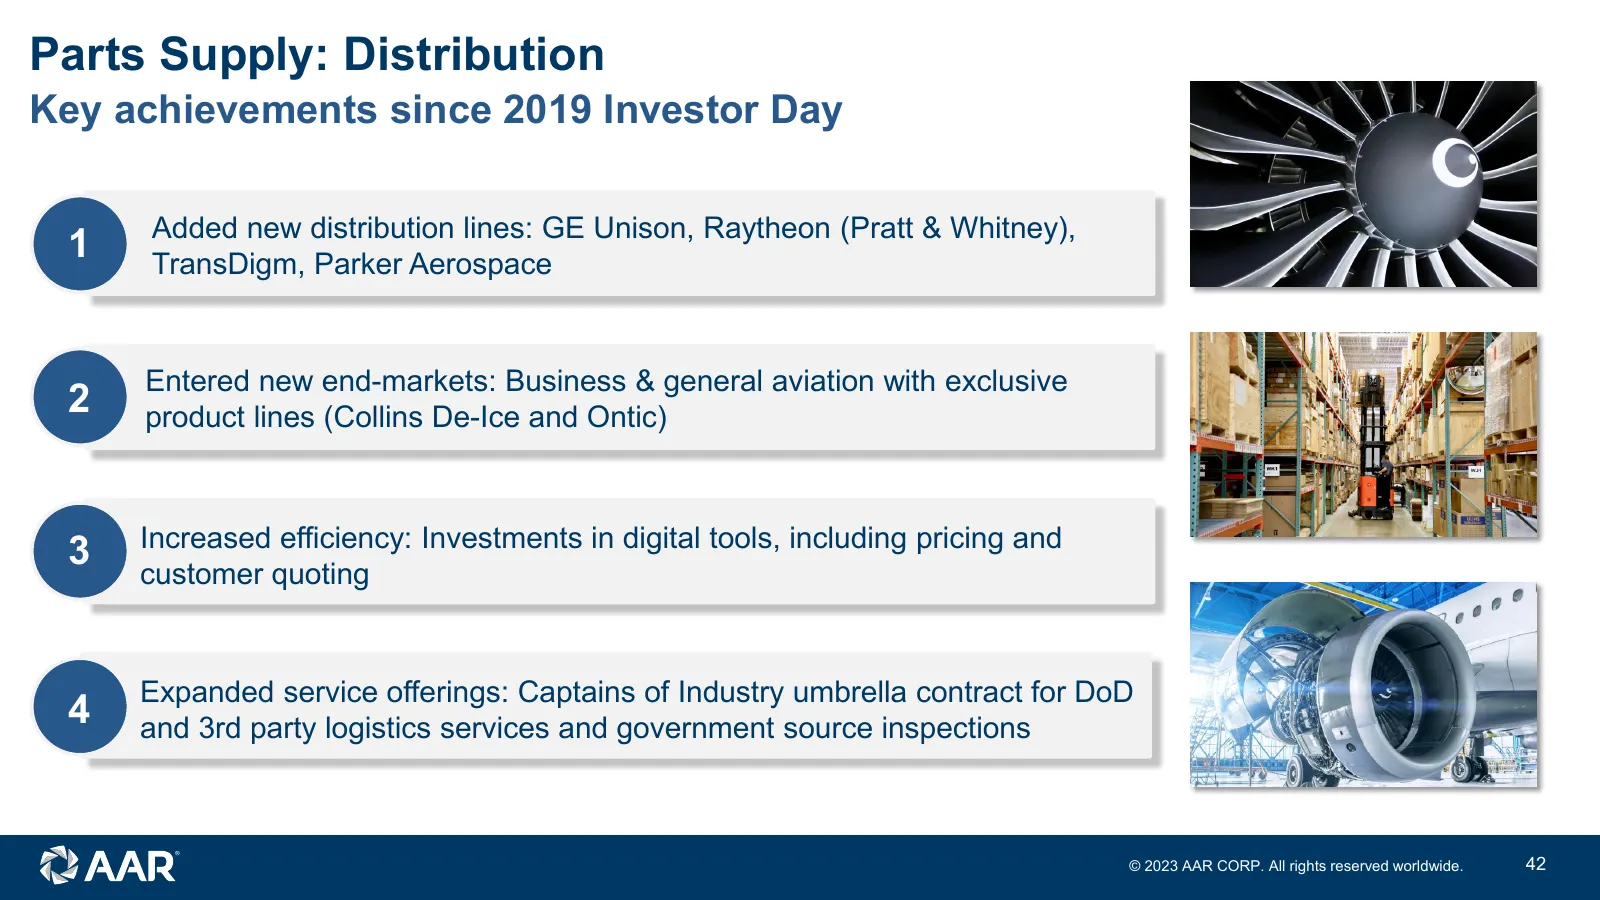
Parts Supply: Distribution Key achievements since 2019 Investor Day Added new distribution lines: GE Unison, Raytheon (Pratt & Whitney), 1 TransDigm, Parker Aerospace Entered new end-markets: Business & general aviation with exclusive 2 product lines (Collins De-Ice and Ontic) Increased efficiency:
Slide 43: Investments in eCommerce
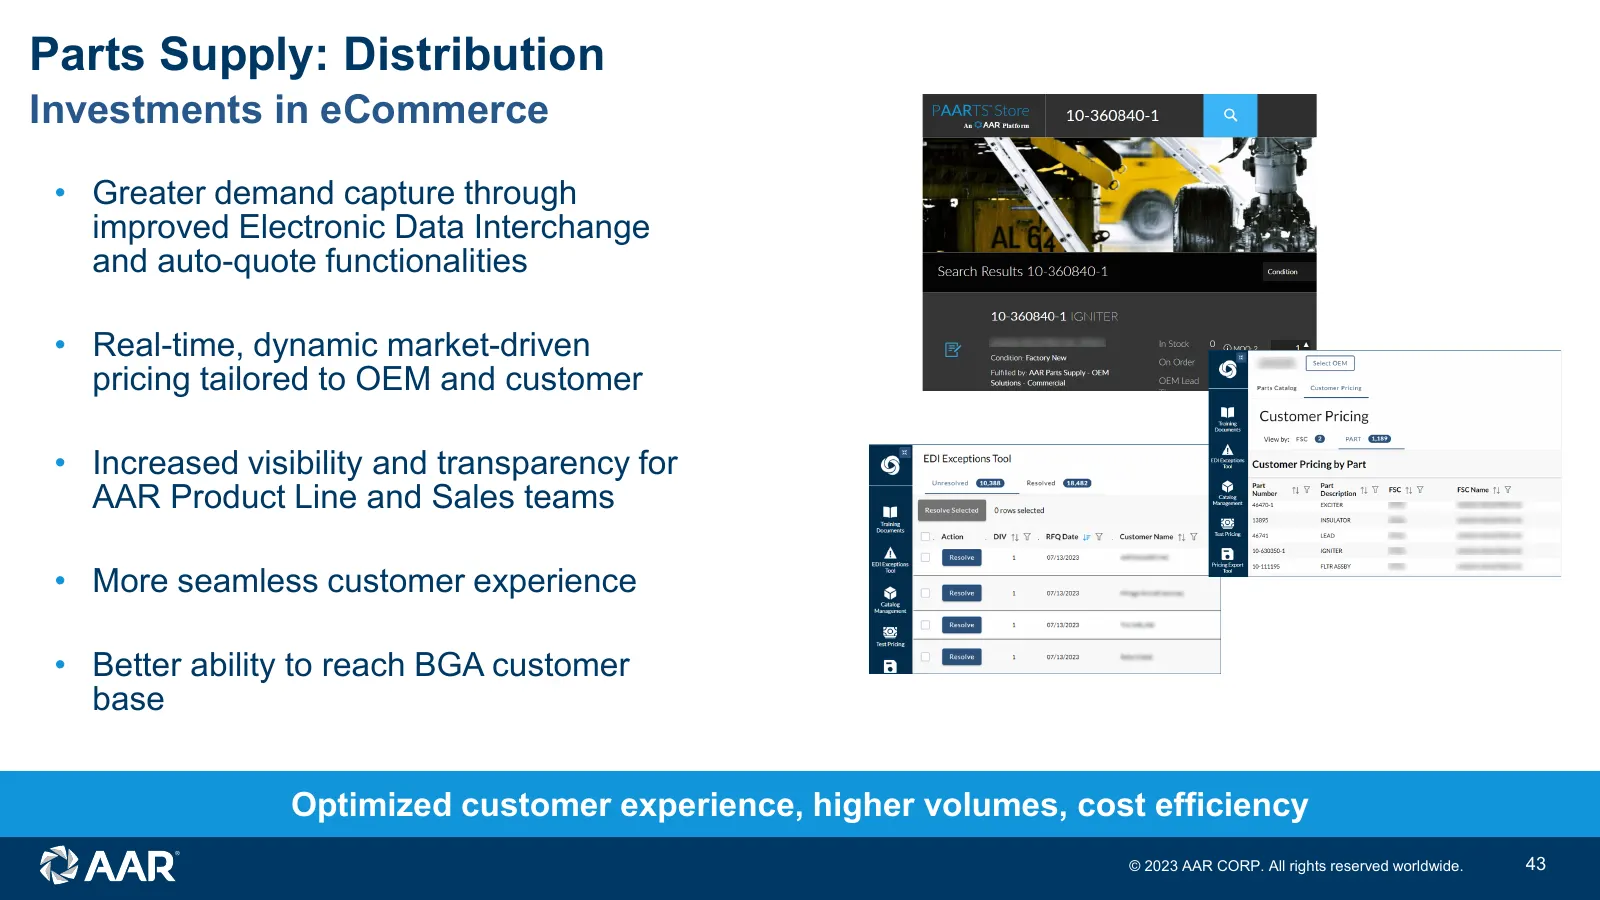
Parts Supply: Distribution Investments in eCommerce • Greater demand capture through improved Electronic Data Interchange and auto-quote functionalities • Real-time, dynamic market-driven pricing tailored to OEM and customer • Increased visibility and transparency for AAR Product Line and Sales team
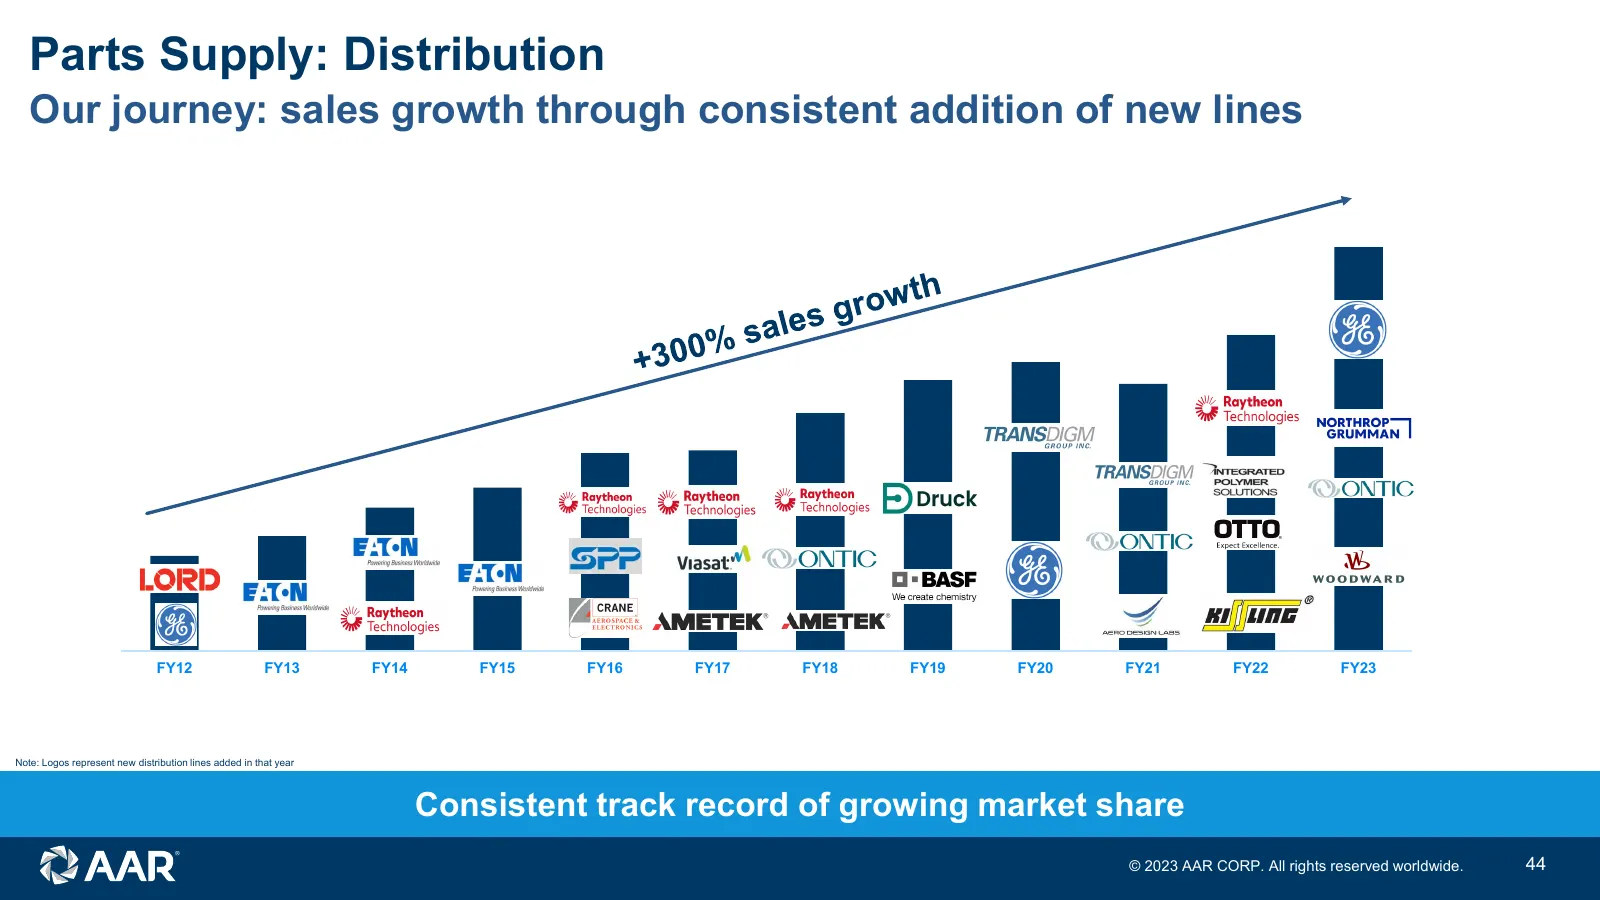
Slide 44: Our journey: sales growth through consistent addition of new lines
Parts Supply: Distribution Our journey: sales growth through consistent addition of new lines FY12 FY13 FY14 FY15 FY16 FY17 FY18 FY19 FY20 FY21 FY22 FY23 Note: Logos represent new distribution lines added in that year Consistent track record of growing market share © 2023 AAR CORP. All rights reserv
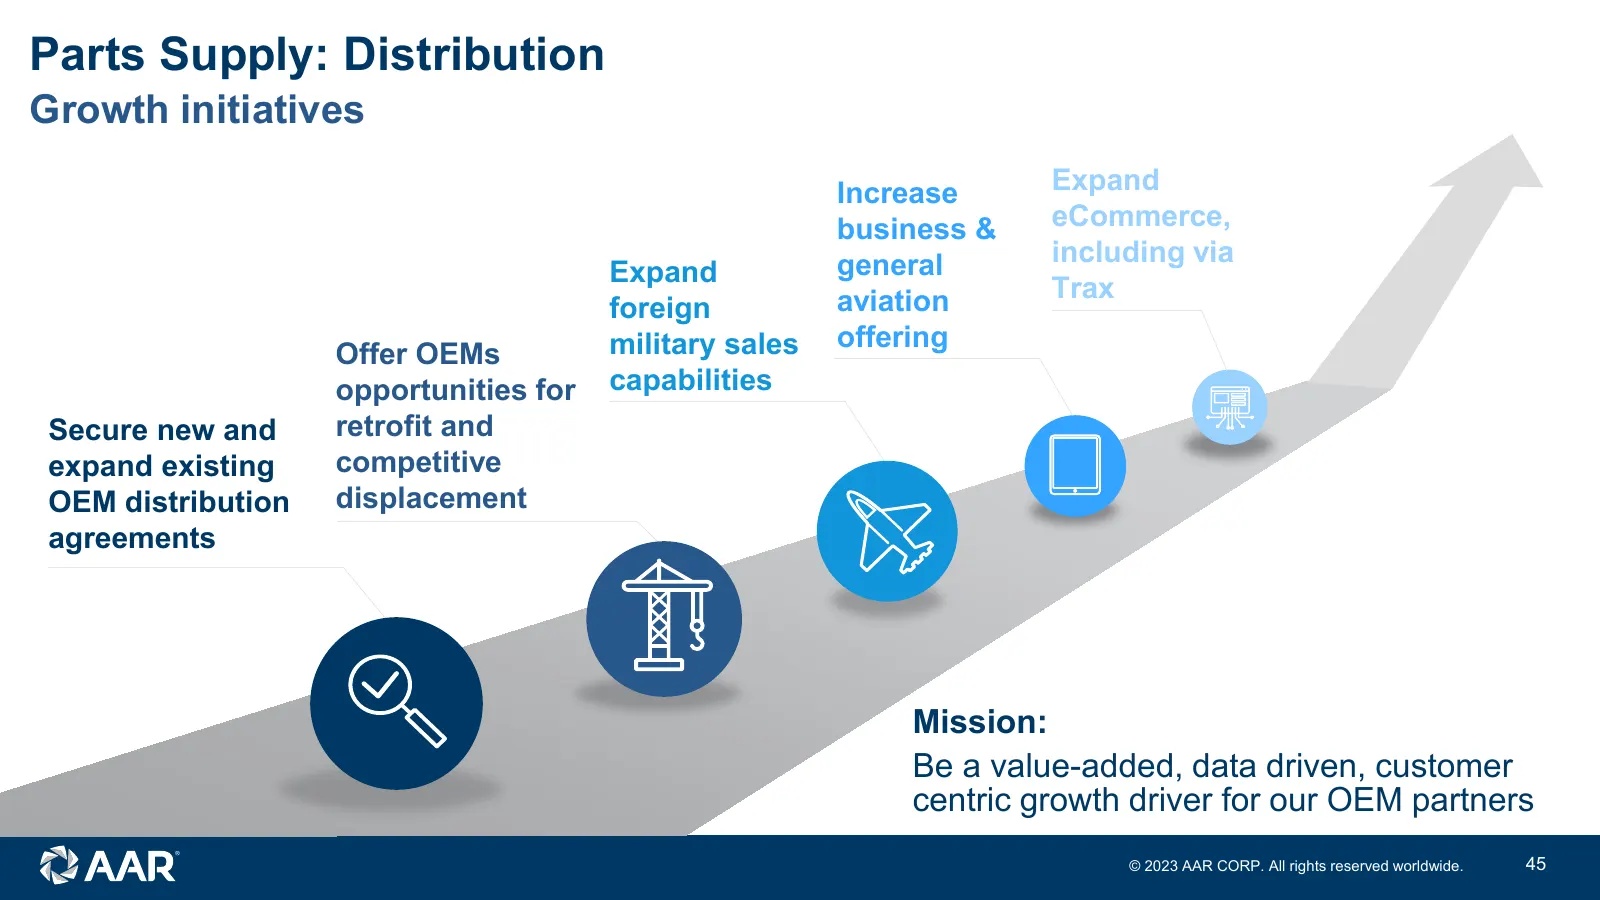
Slide 45: Growth initiatives
Parts Supply: Distribution Growth initiatives Increase Expand business & eCommerce, general including via Expand aviation Trax foreign military sales offering Offer OEMs opportunities for capabilities Secure new and retrofit and expand existing competitive OEM distribution displacement agreements Mi
Slide 46: Repair & Engineering
Repair & Engineering Tom Hoferer Senior Vice President, Repair & Engineering © 2023 AAR CORP. All rights reserved worldwide. 46
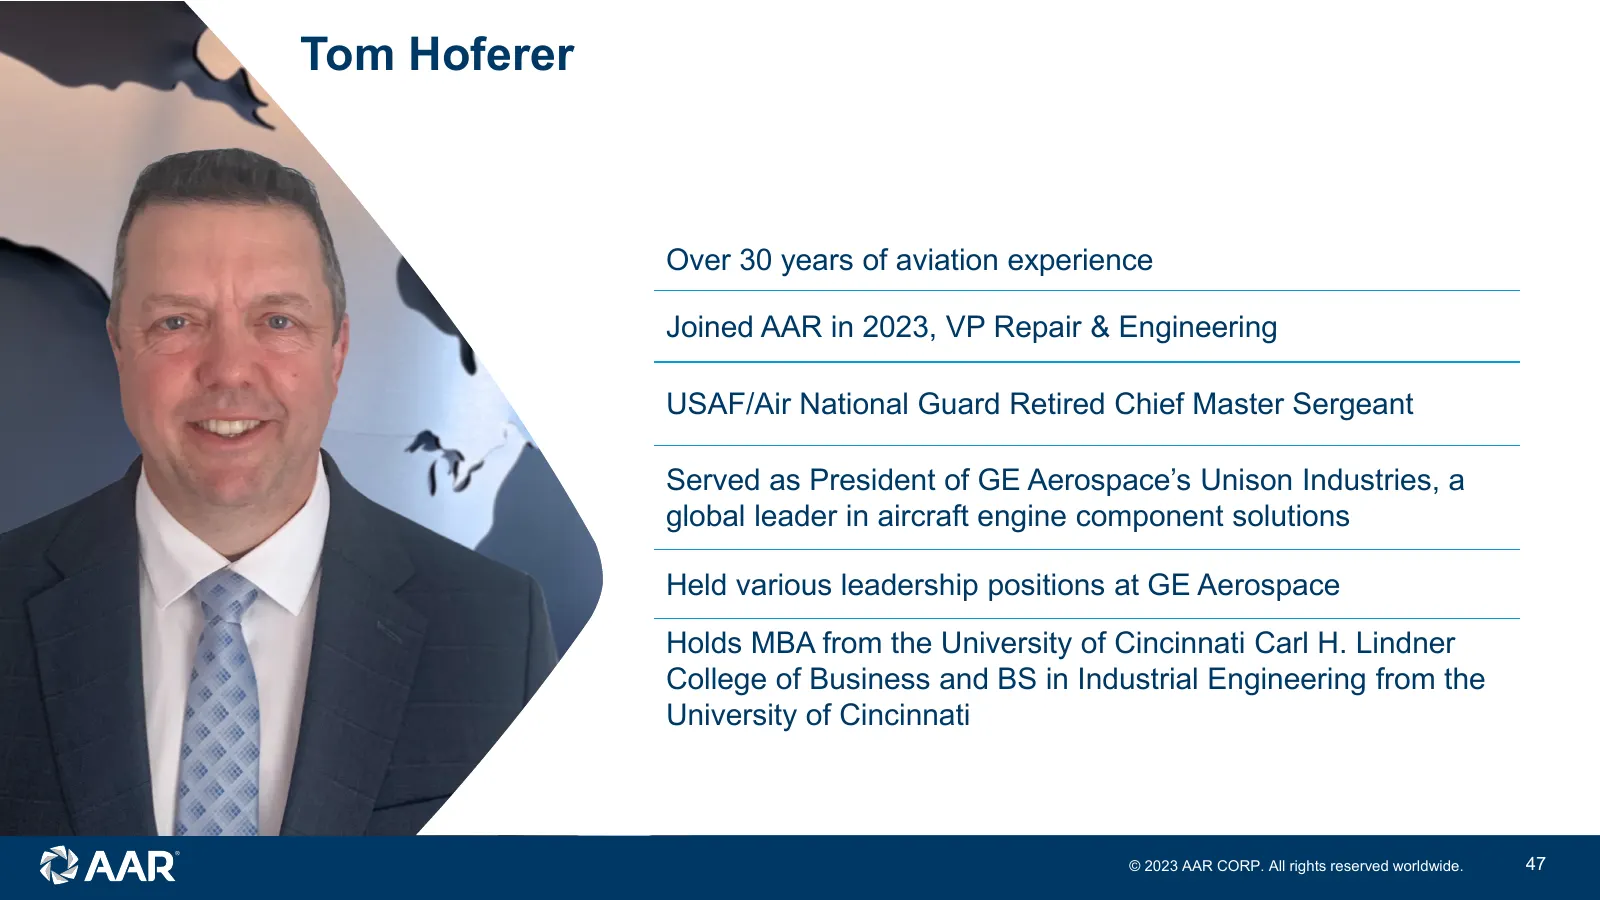
Slide 47: Tom Hoferer
Tom Hoferer Over 30 years of aviation experience Joined AAR in 2023, VP Repair & Engineering USAF/Air National Guard Retired Chief Master Sergeant Served as President of GE Aerospace’s Unison Industries, a global leader in aircraft engine component solutions Held various leadership positions at GE A
Slide 48: Repair & Engineering overview
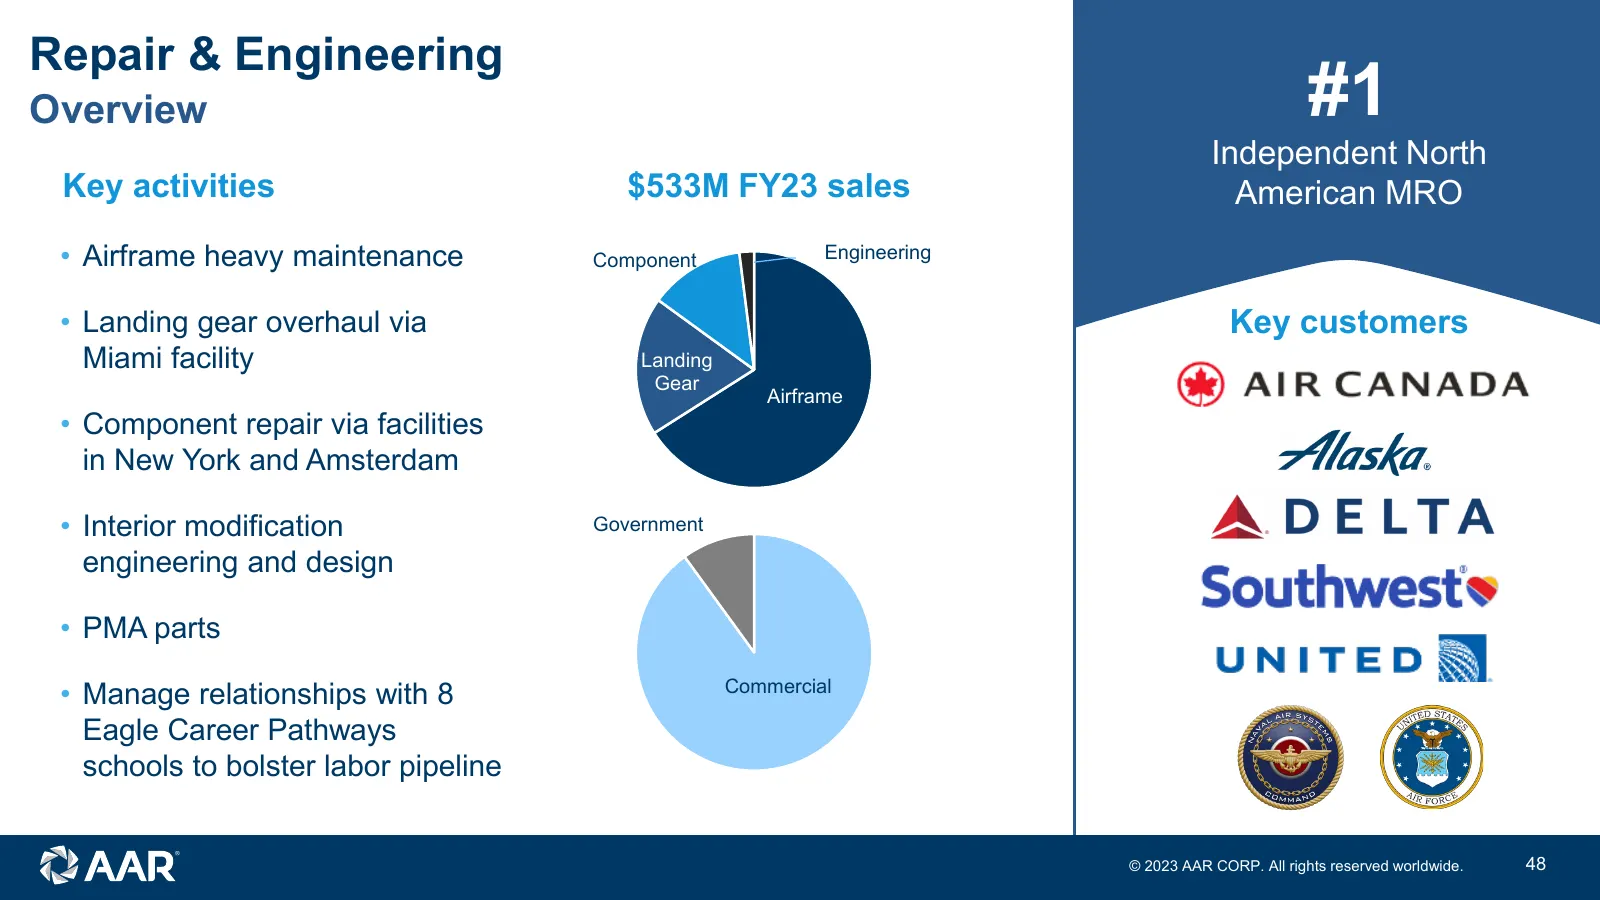
Repair & Engineering Overview #1 Independent North Key activities $533M FY23 sales American MRO • Airframe heavy maintenance Component Engineering • Landing gear overhaul via Key customers Miami facility Landing Gear Airframe • Component repair via facilities in New York and Amsterdam • Interior mod
Slide 49: Repair & Engineering - What we do
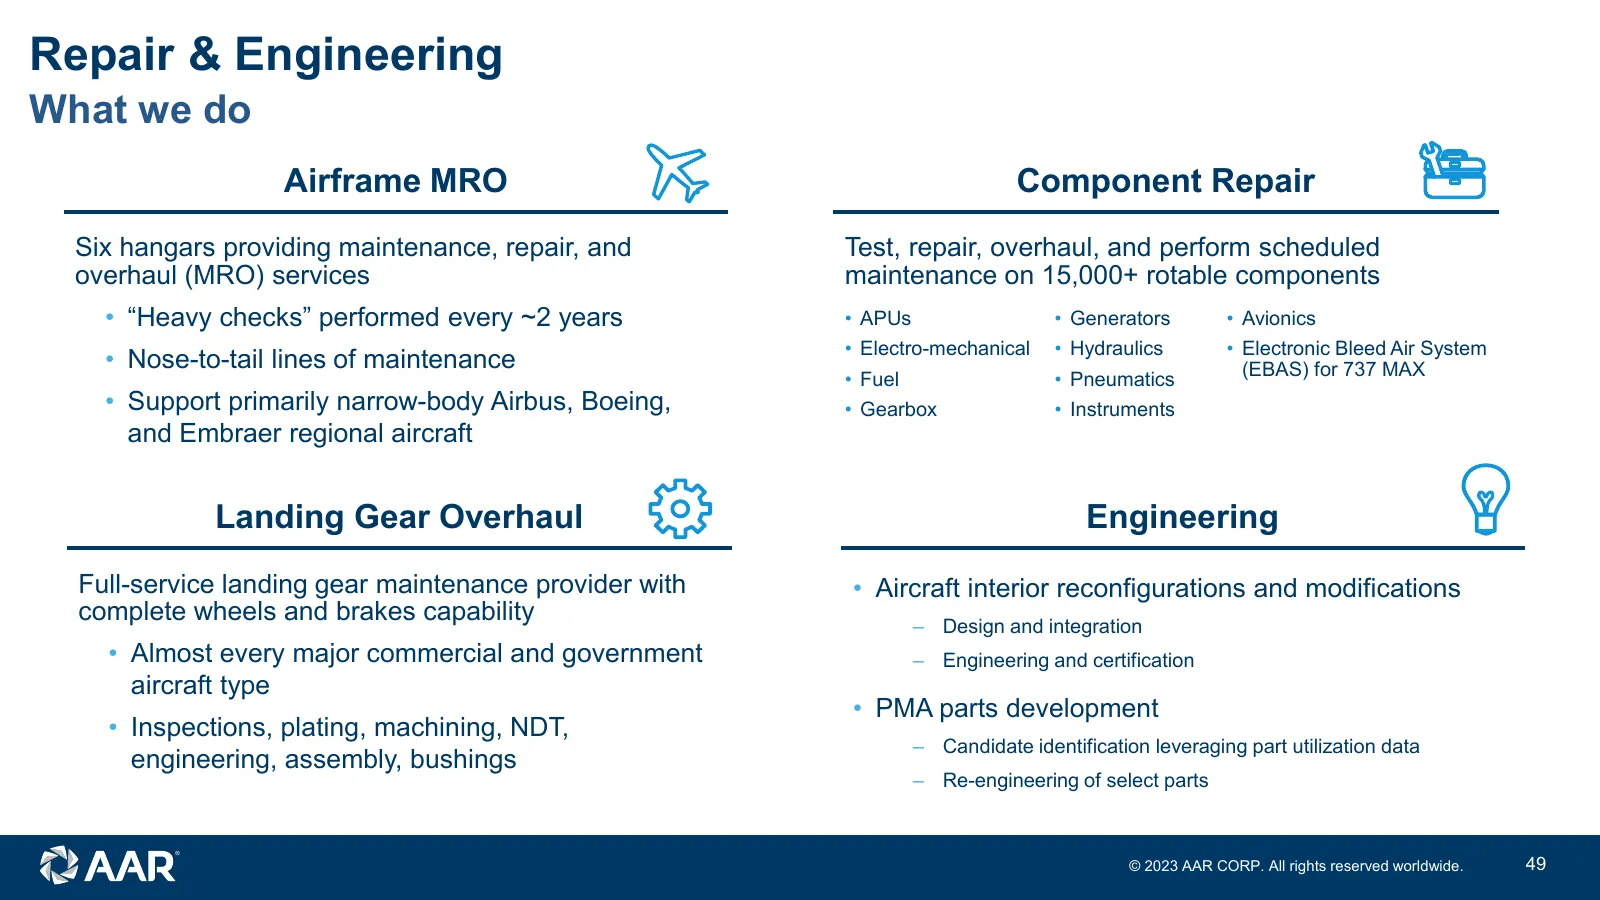
Repair & Engineering LARGEST What we do INDEPENDENT USM Airframe MRO Component SUPPLIER Repair GLOBALLY Six hangars providing maintenance, repair, and Test, repair, overhaul, and perform scheduled overhaul (MRO) services maintenance on 15,000+ rotable components • “Heavy checks” performed every ~2 y
Slide 50: Facility overview
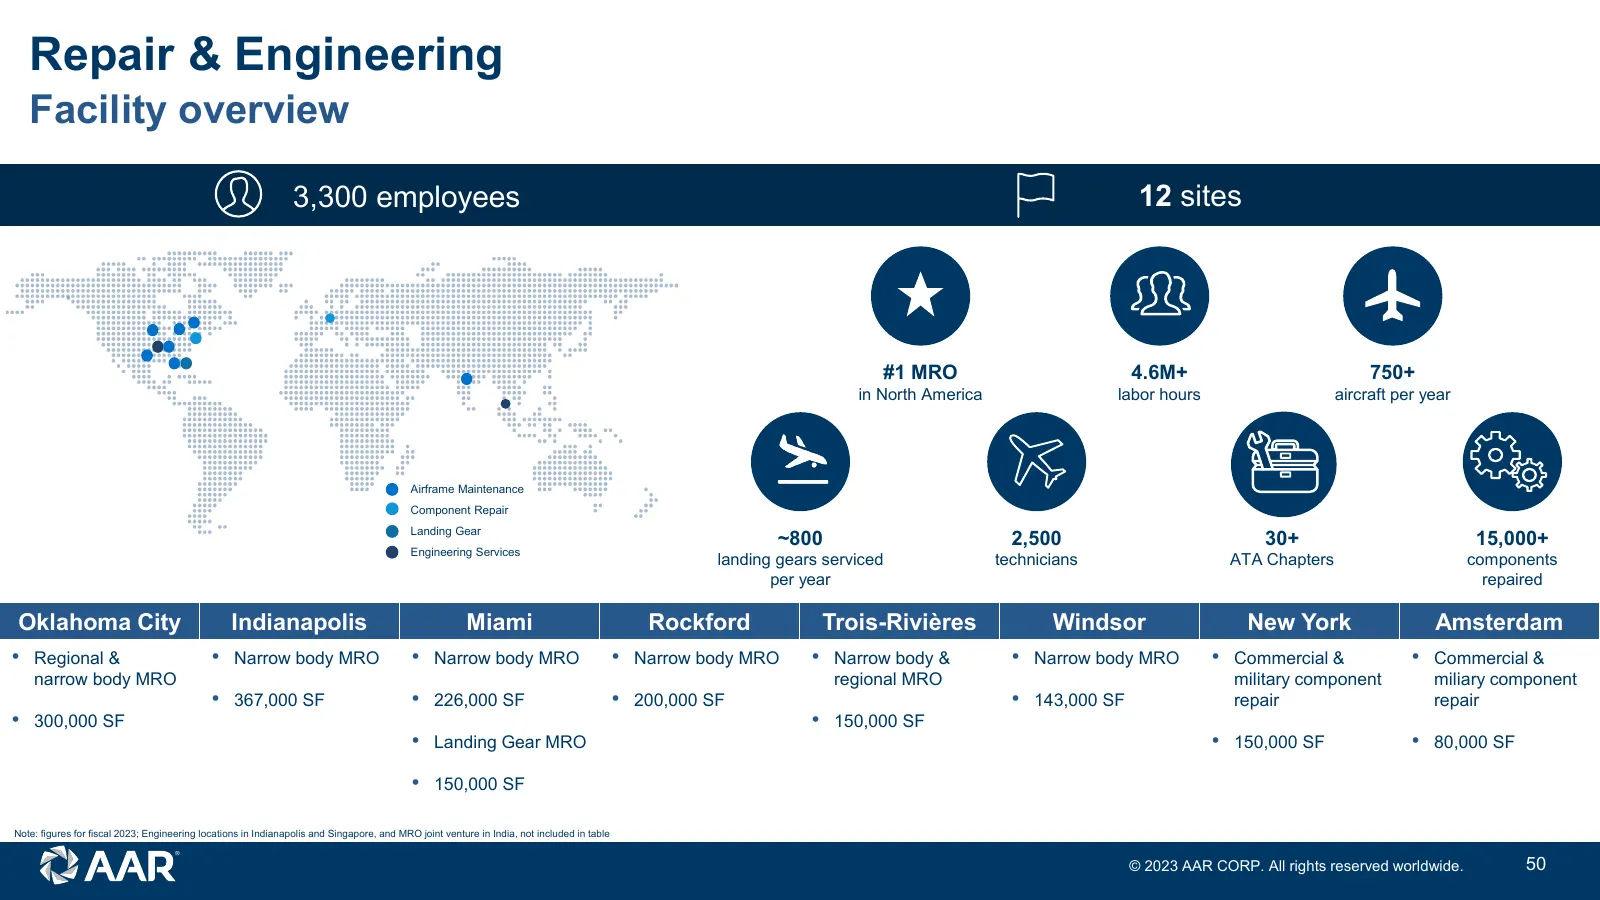
Repair & Engineering Facility overview 3,300 employees 12 sites #1 MRO 4.6M+ 750+ in North America labor hours aircraft per year Airframe Maintenance Component Repair Landing Gear ~800 2,500 30+ 15,000+ Engineering Services landing gears serviced technicians ATA Chapters components per year repaired
Slide 51: Repair & Engineering value proposition
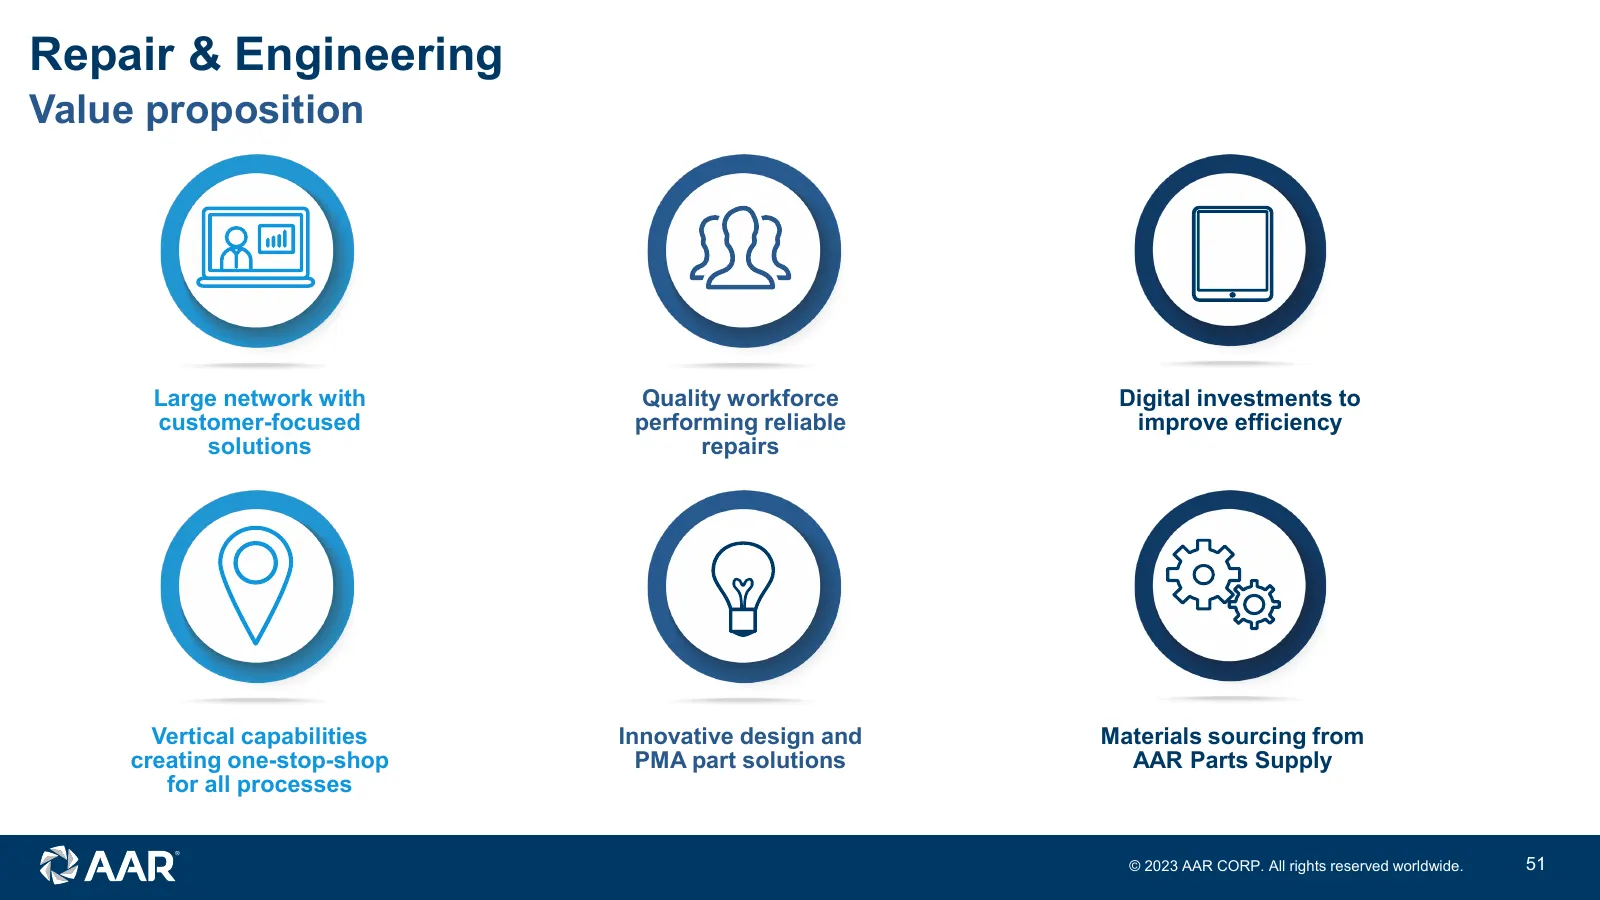
Repair & Engineering Value proposition Large network with Quality workforce Digital investments to customer-focused performing reliable improve efficiency solutions repairs Vertical capabilities Innovative design and Materials sourcing from creating one-stop-shop PMA part solutions AAR Parts Supply
Slide 52: Key achievements since 2019 Investor Day
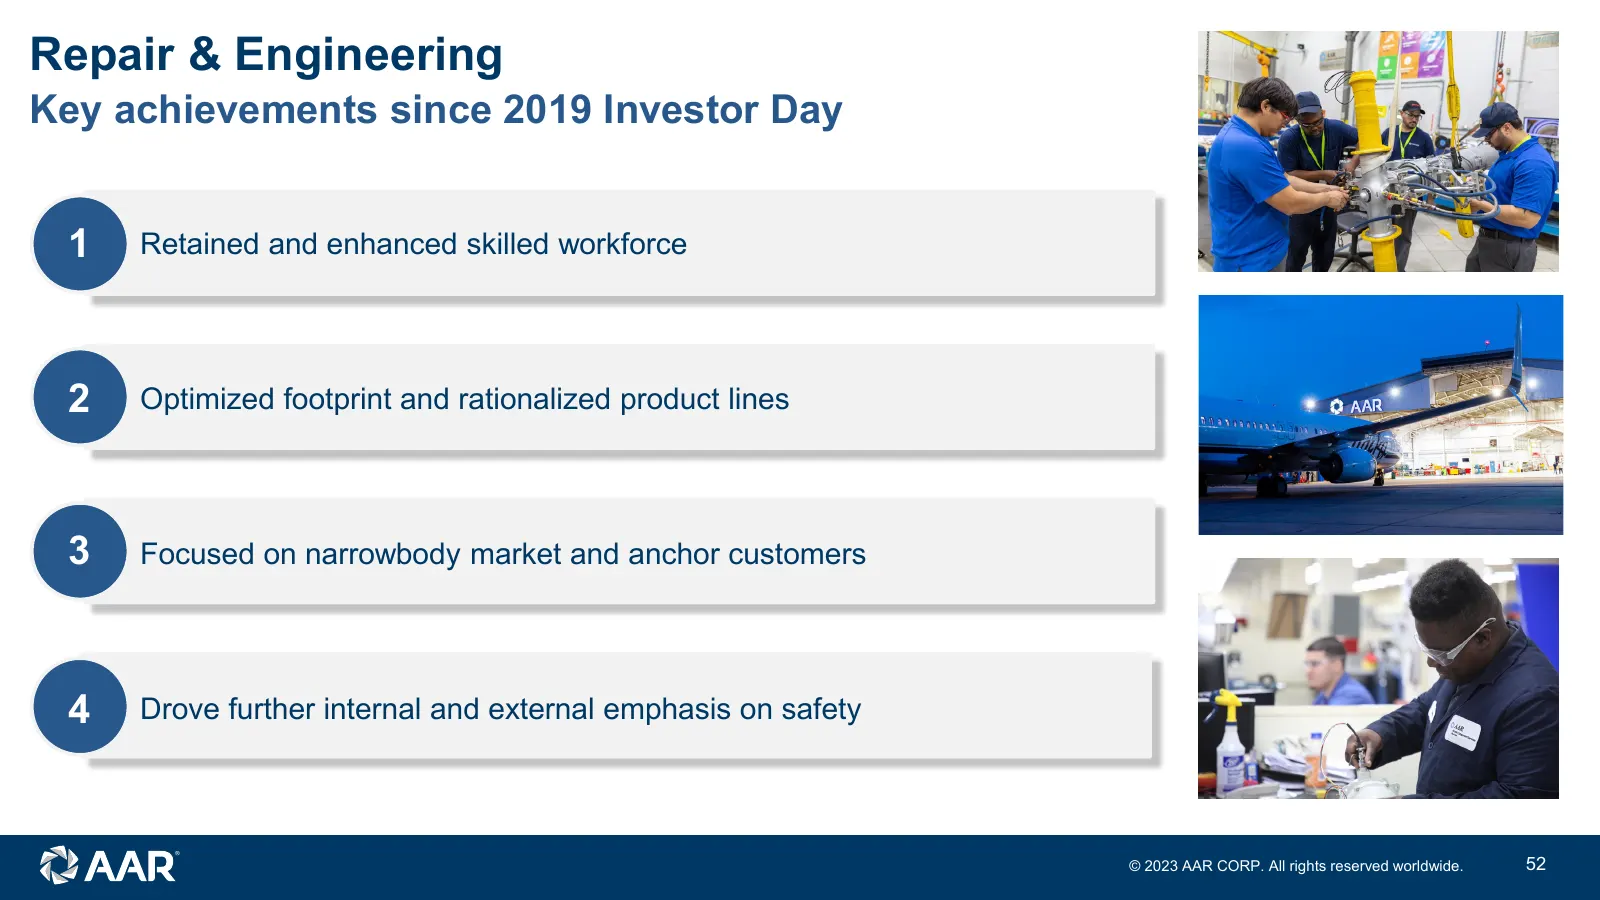
Repair & Engineering Key achievements since 2019 Investor Day 1 Retained and enhanced skilled workforce 2 Optimized footprint and rationalized product lines 3 Focused on narrowbody market and anchor customers 4 Drove further internal and external emphasis on safety © 2023 AAR CORP. All rights reserv
Slide 53: Workforce development through Eagle Career Pathway Program
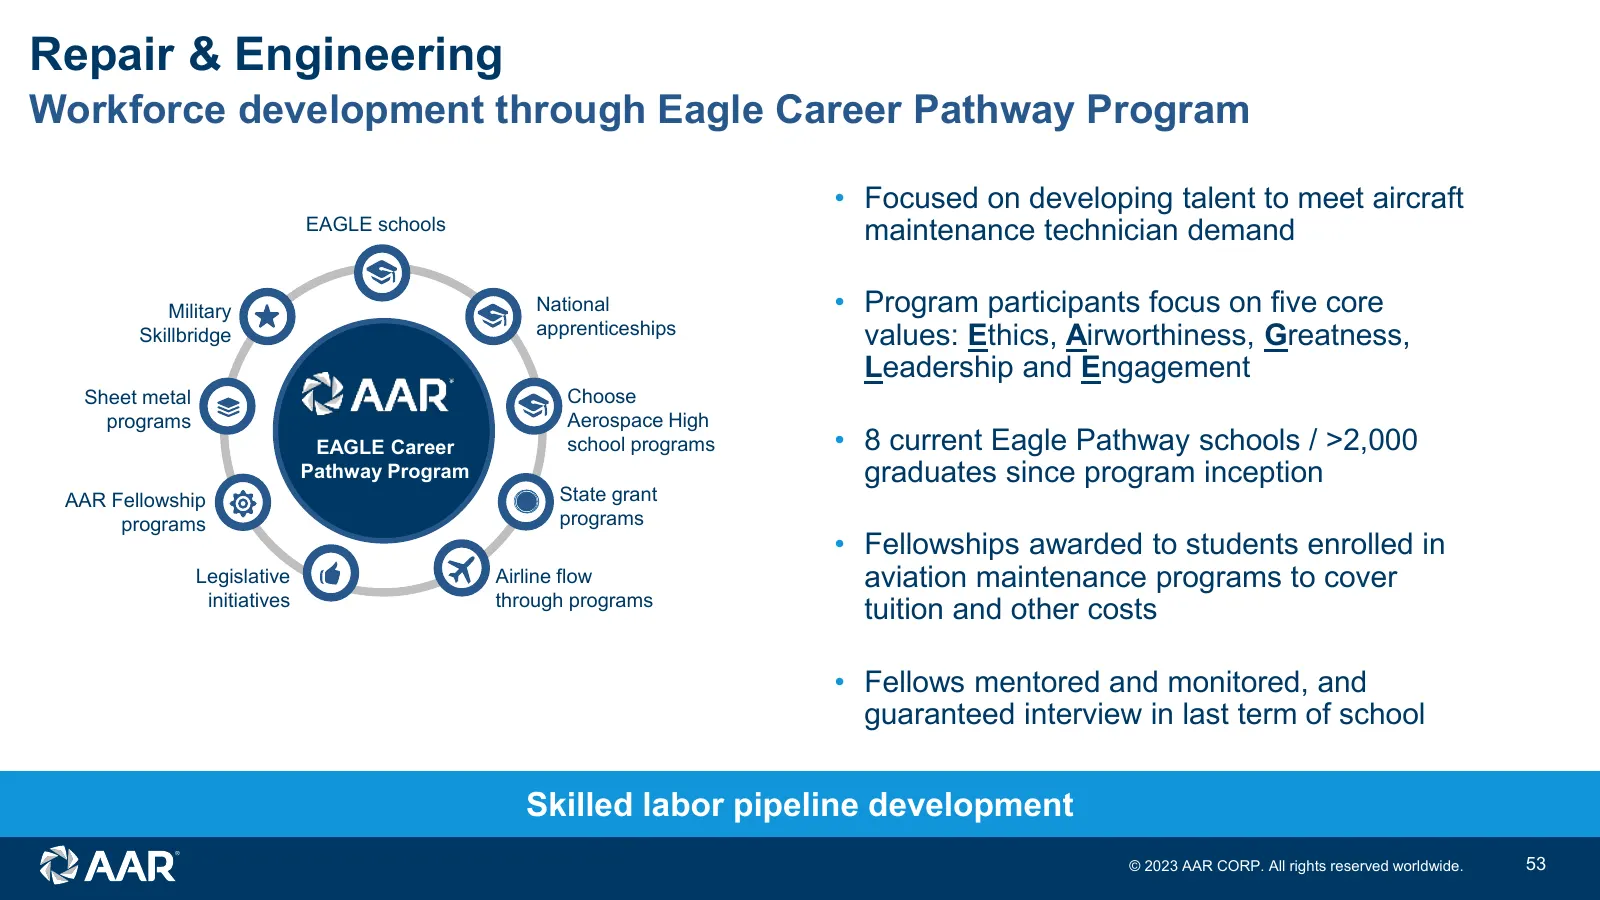
Repair & Engineering Workforce development through Eagle Career Pathway Program • Focused on developing talent to meet aircraft EAGLE schools maintenance technician demand Military National • Program participants focus on five core Skillbridge apprenticeships values: Ethics, Airworthiness, Greatness
Slide 54: Miami airframe MRO facility expansion
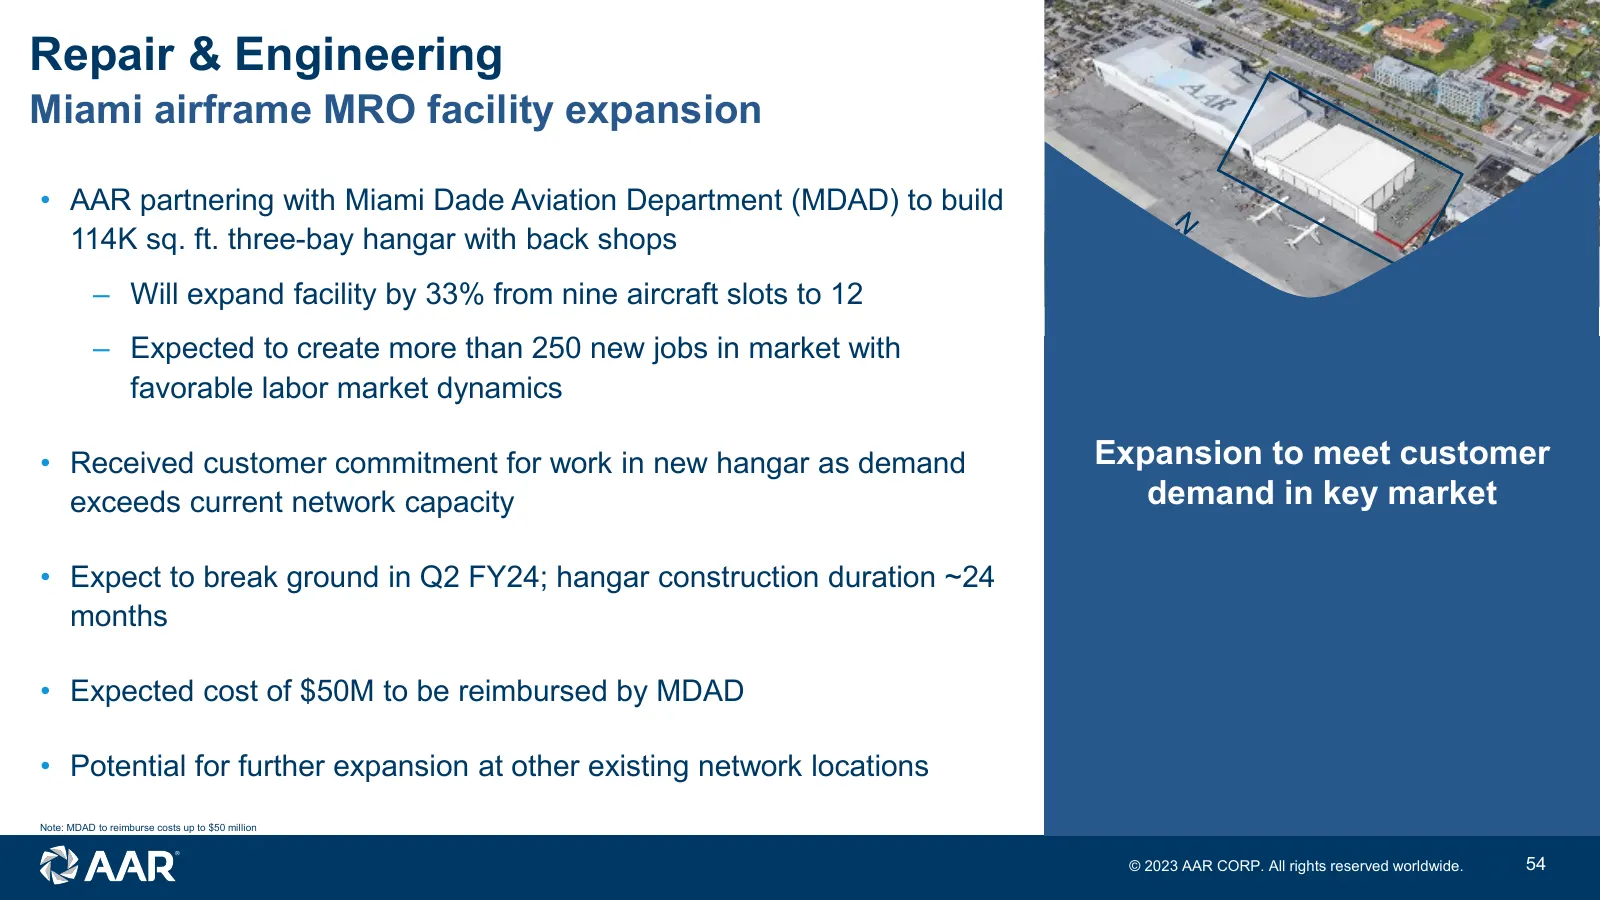
Repair & Engineering Miami airframe MRO facility expansion • AAR partnering with Miami Dade Aviation Department (MDAD) to build 114K sq. ft. three-bay hangar with back shops ‒ Will expand facility by 33% from nine aircraft slots to 12 ‒ Expected to create more than 250 new jobs in market with favora
Slide 55: "Paperless" airframe maintenance
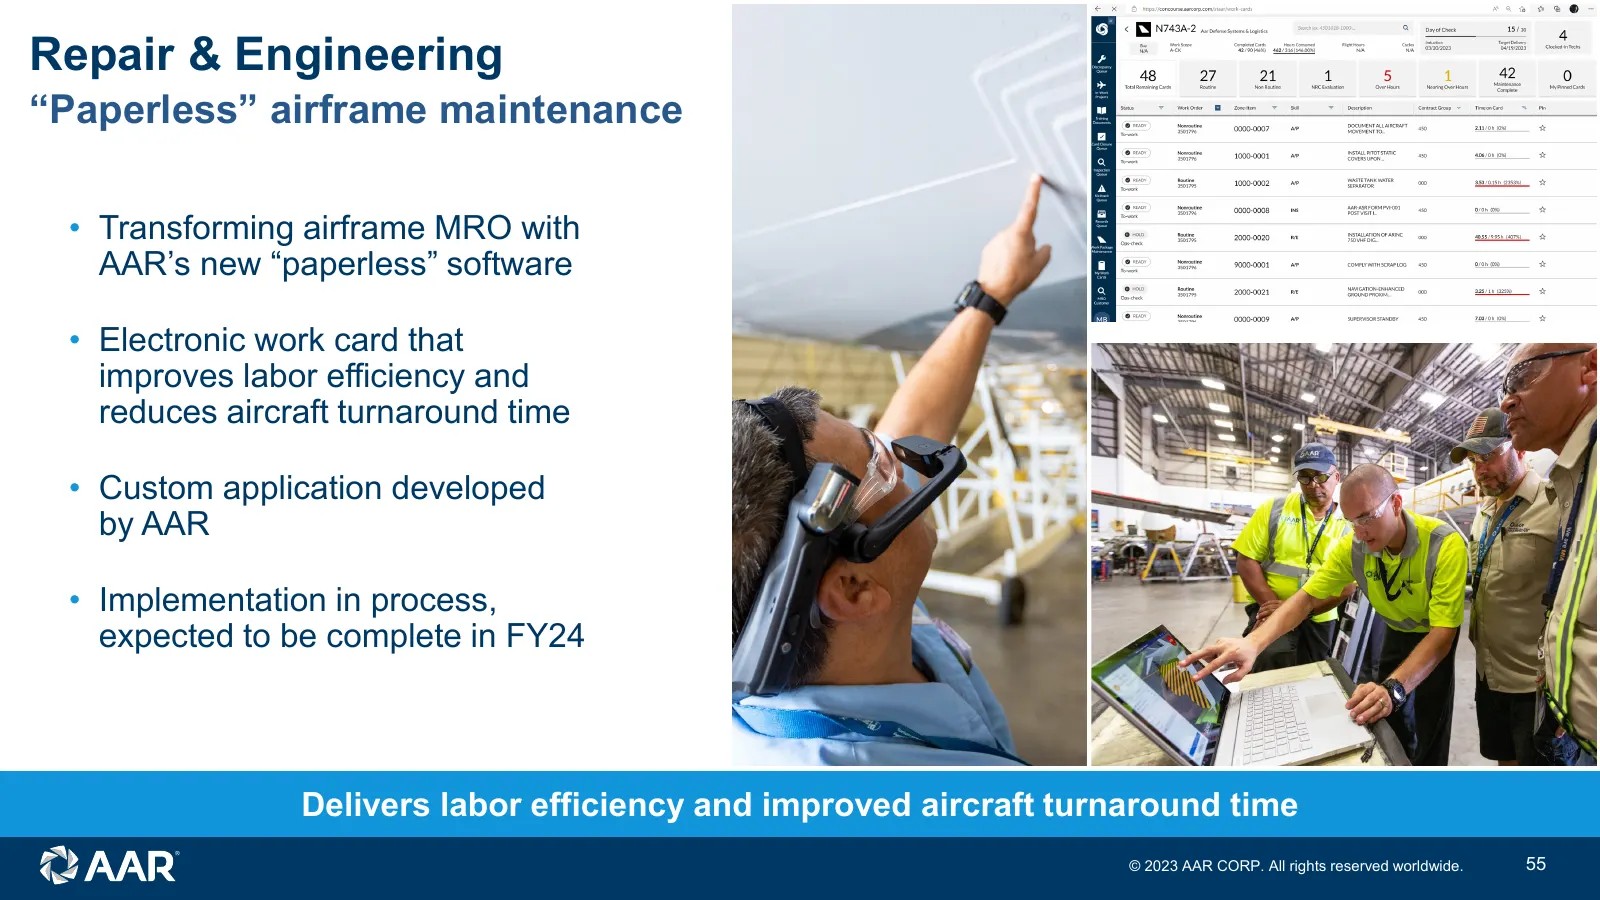
Repair & Engineering “Paperless” airframe maintenance • Transforming airframe MRO with AAR’s new “paperless” software • Electronic work card that improves labor efficiency and reduces aircraft turnaround time • Custom application developed by AAR • Implementation in process, expected to be complete
Slide 56: PMA parts initiative
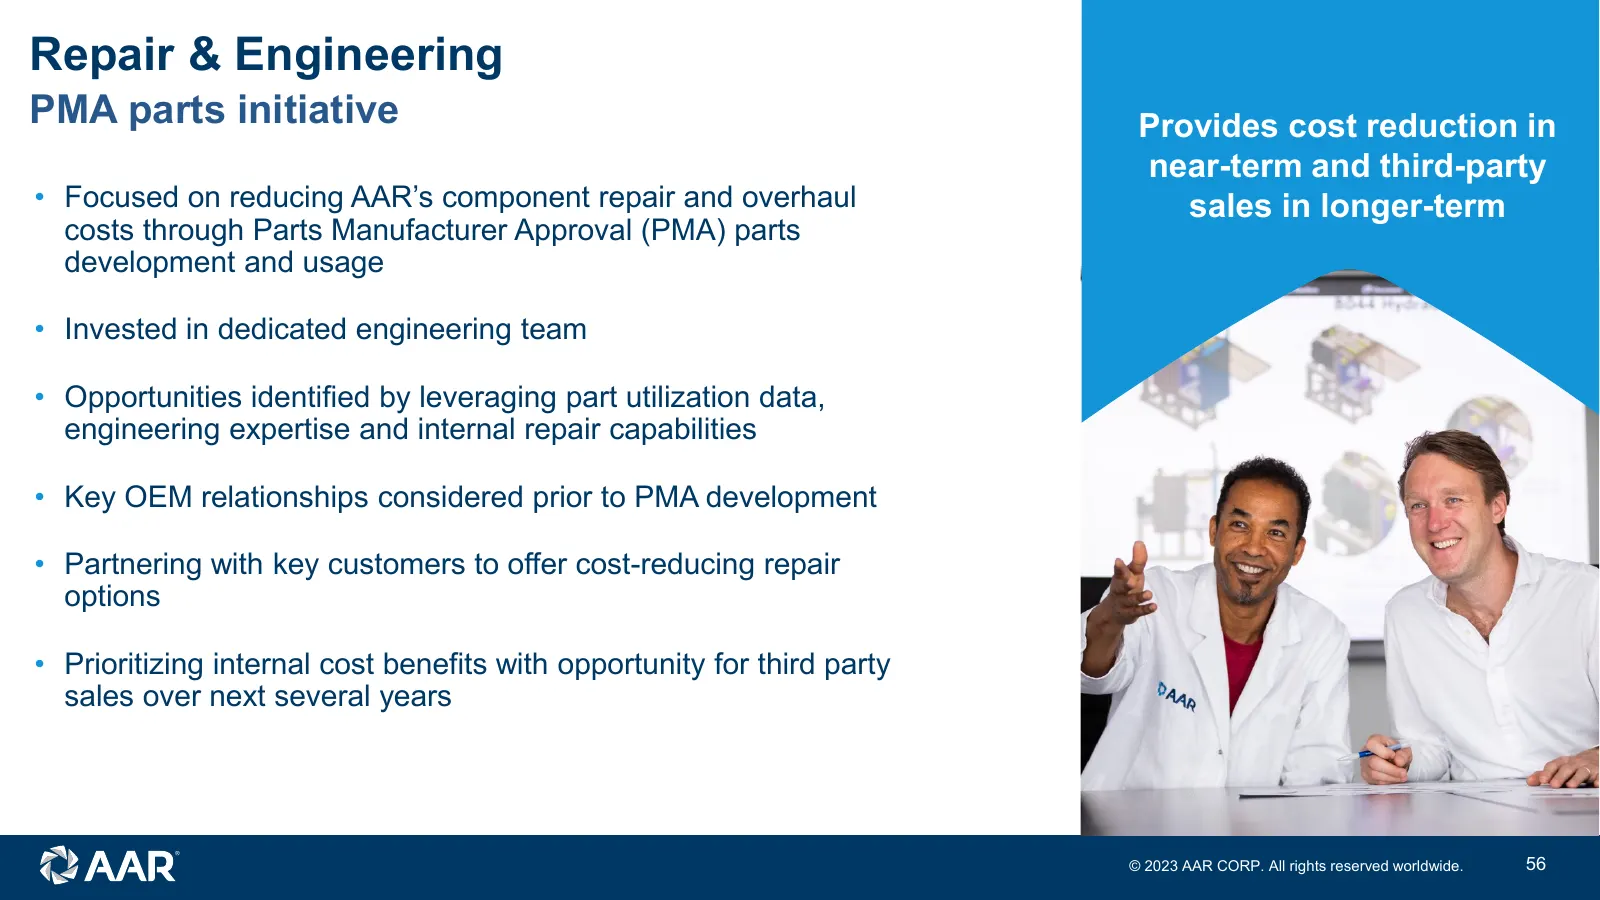
Repair & Engineering PMA parts initiative Provides cost reduction in near-term and third-party • Focused on reducing AAR’s component repair and overhaul sales in longer-term costs through Parts Manufacturer Approval (PMA) parts development and usage • Invested in dedicated engineering team • Opportu
Slide 57: Growth initiatives
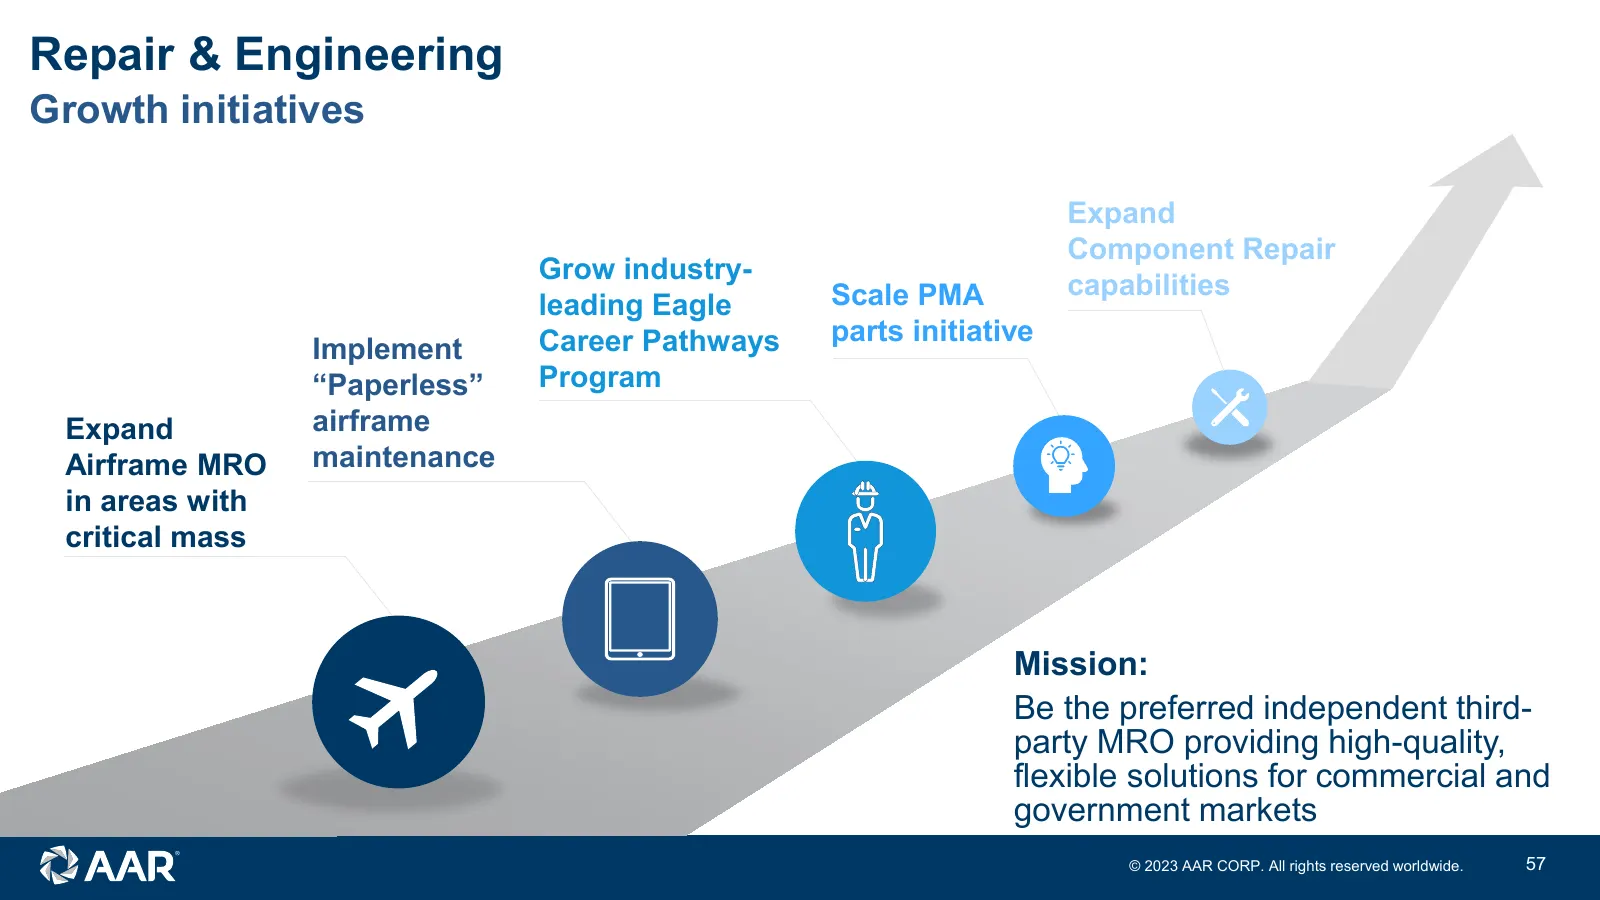
Repair & Engineering Growth initiatives Expand Component Repair Grow industry- Scale PMA capabilities leading Eagle Career Pathways parts initiative Implement “Paperless” Program Expand airframe Airframe MRO maintenance in areas with critical mass Mission: Be the preferred independent third- party M

Slide 58: Integrated Solutions
Integrated Solutions Nicholas Gross Senior Vice President, Integrated Solutions © 2023 AAR CORP. All rights reserved worldwide. 58
Slide 59: Nicholas Gross
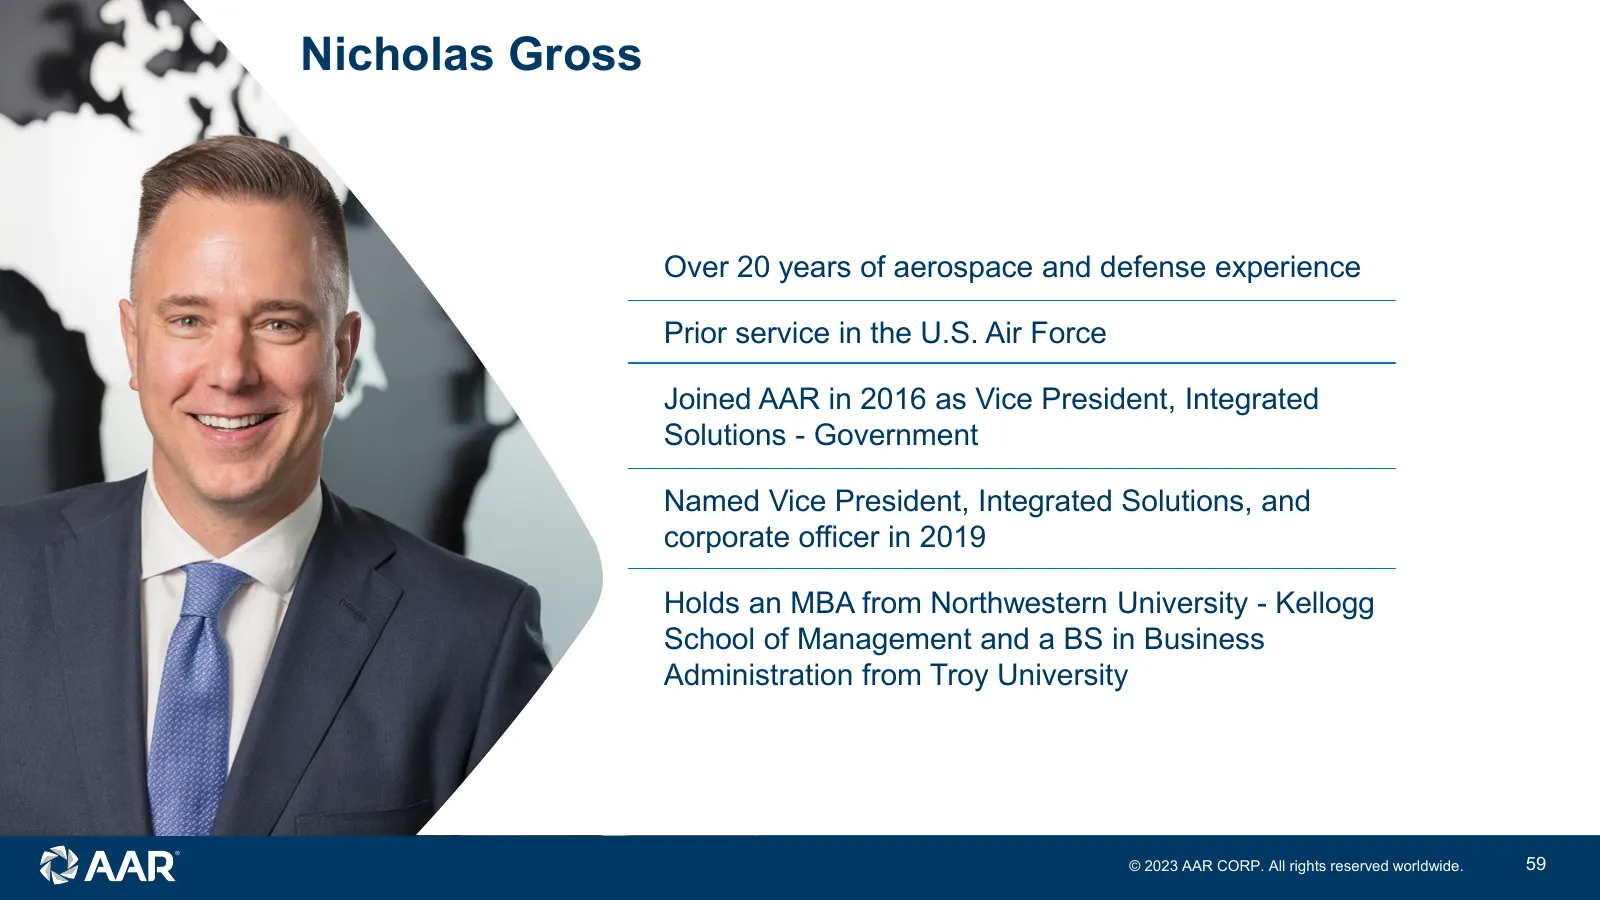
Nicholas Gross Over 20 years of aerospace and defense experience Prior service in the U.S. Air Force Joined AAR in 2016 as Vice President, Integrated Solutions - Government Named Vice President, Integrated Solutions, and corporate officer in 2019 Holds an MBA from Northwestern University - Kellogg S
Slide 60: Integrated Solutions overview
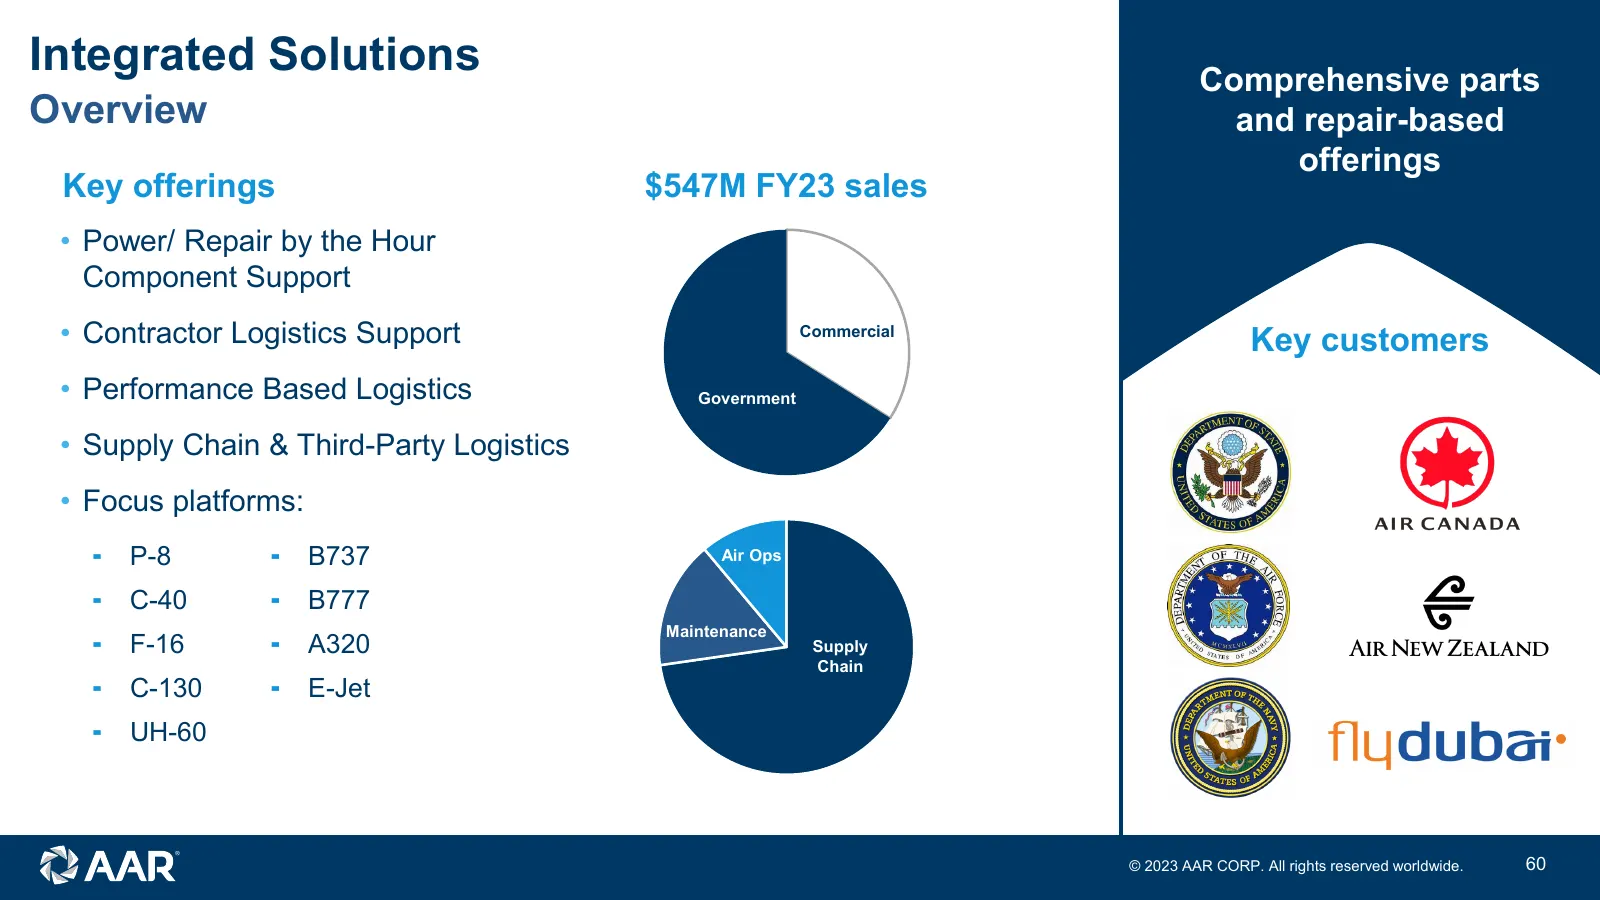
Integrated Solutions Comprehensive parts Overview and repair-based offerings Key offerings $547M FY23 sales • Power/ Repair by the Hour Component Support • Contractor Logistics Support Commercial Key customers • Performance Based Logistics Government • Supply Chain & Third-Party Logistics • Focus pl
Slide 61: Integrated Solutions - What we do
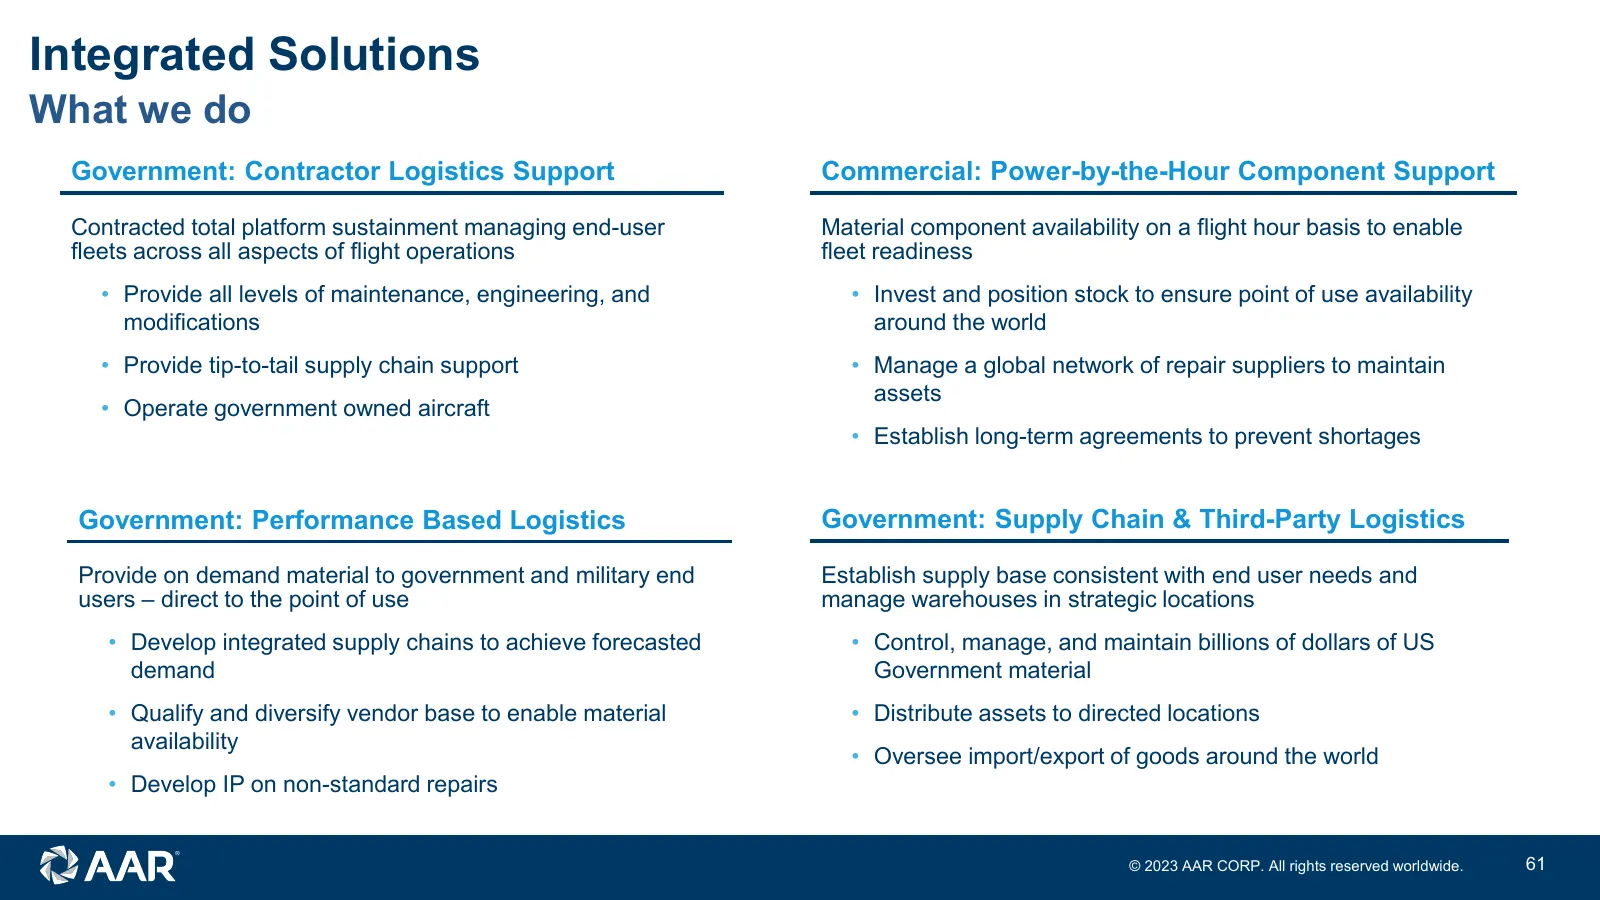
Integrated Solutions What we do Government: Contractor Logistics Support Commercial: Power-by-the-Hour Component Support Contracted total platform sustainment managing end-user Material component availability on a flight hour basis to enable fleets across all aspects of flight operations fleet readi
Slide 62: Integrated Solutions value proposition
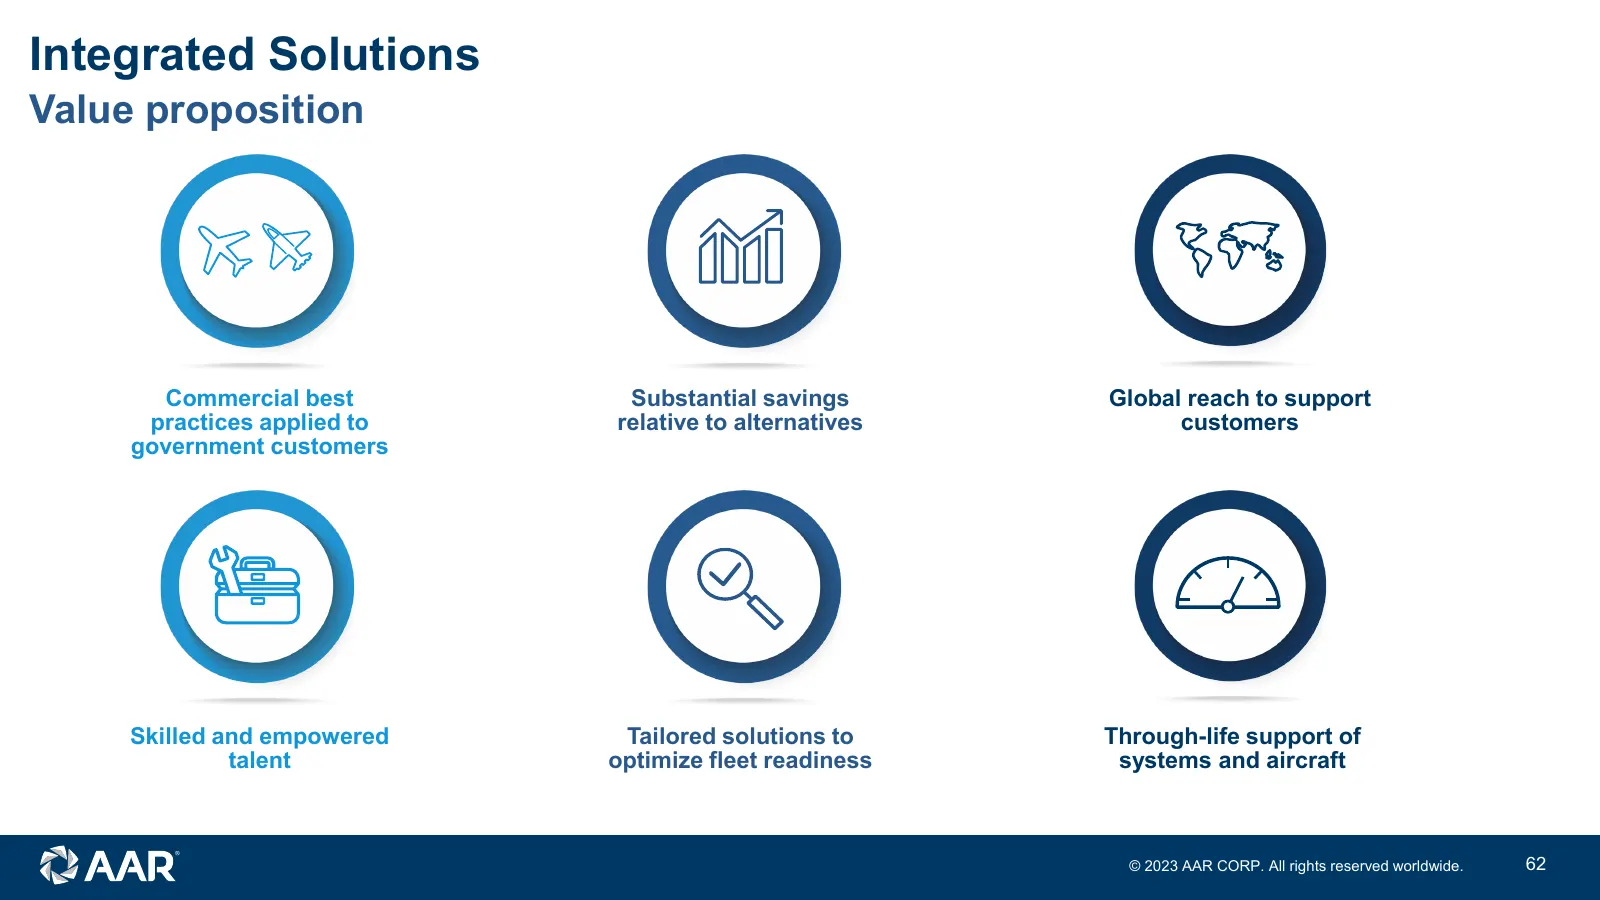
Integrated Solutions Value proposition Commercial best Substantial savings Global reach to support practices applied to relative to alternatives customers government customers Skilled and empowered Tailored solutions to Through-life support of talent optimize fleet readiness systems and aircraft © 2
Slide 63: Key achievements since 2019 Investor Day
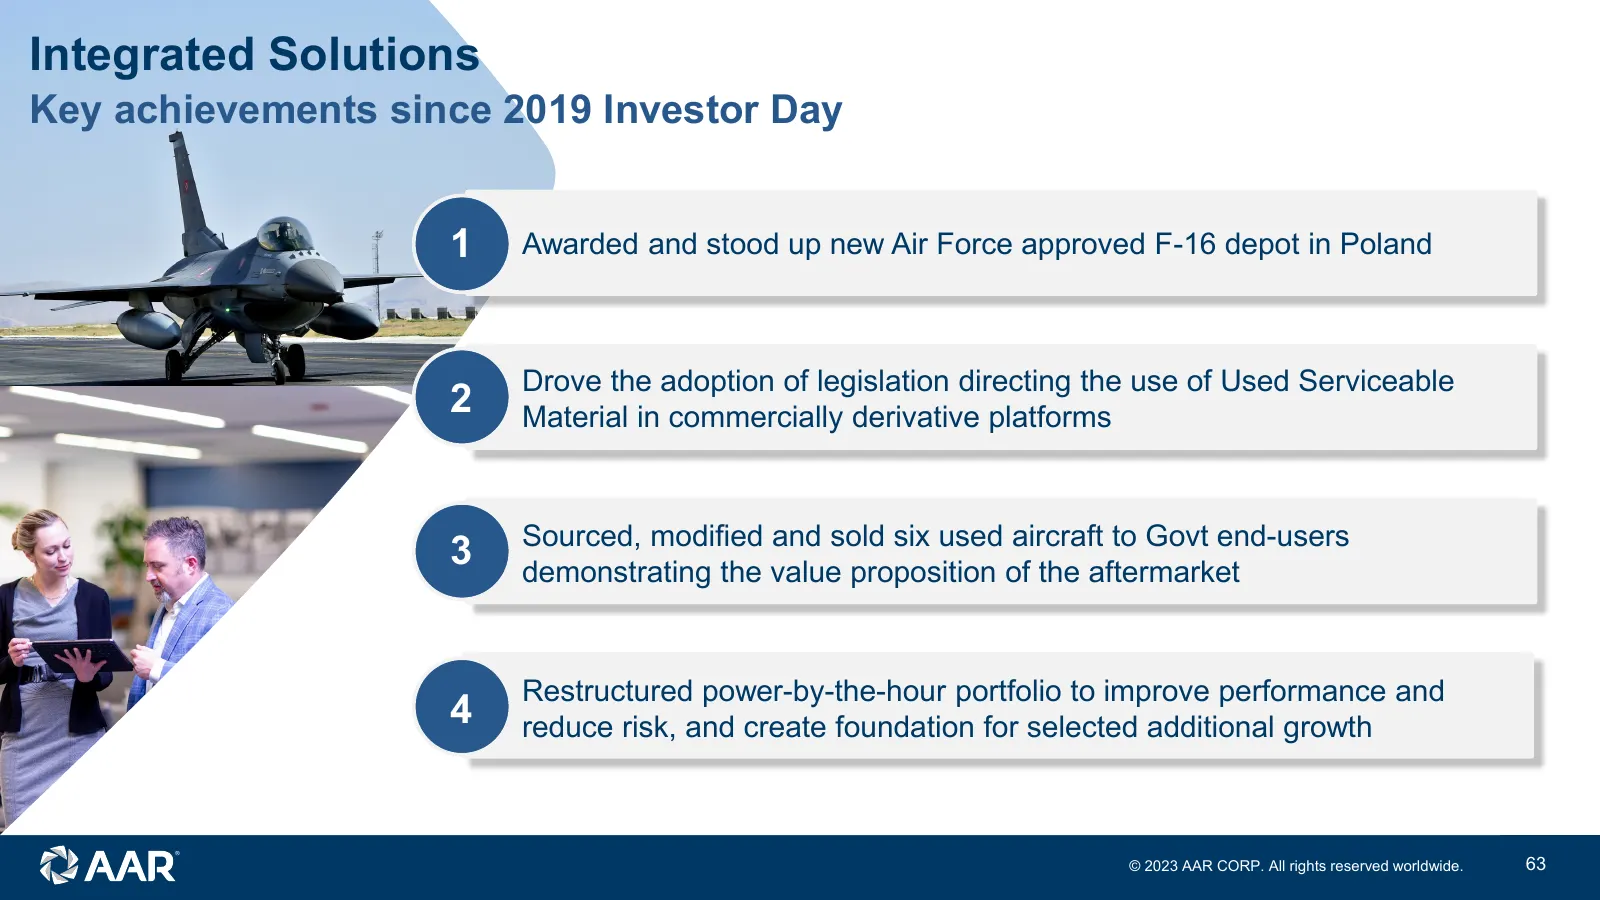
Integrated Solutions Key achievements since 2019 Investor Day 1 Awarded and stood up new Air Force approved F-16 depot in Poland Drove the adoption of legislation directing the use of Used Serviceable 2 Material in commercially derivative platforms Sourced, modified and sold six used aircraft to Gov
Slide 64: F-16 maintenance, modifications and upgrades for U.S. Air Force in Europe
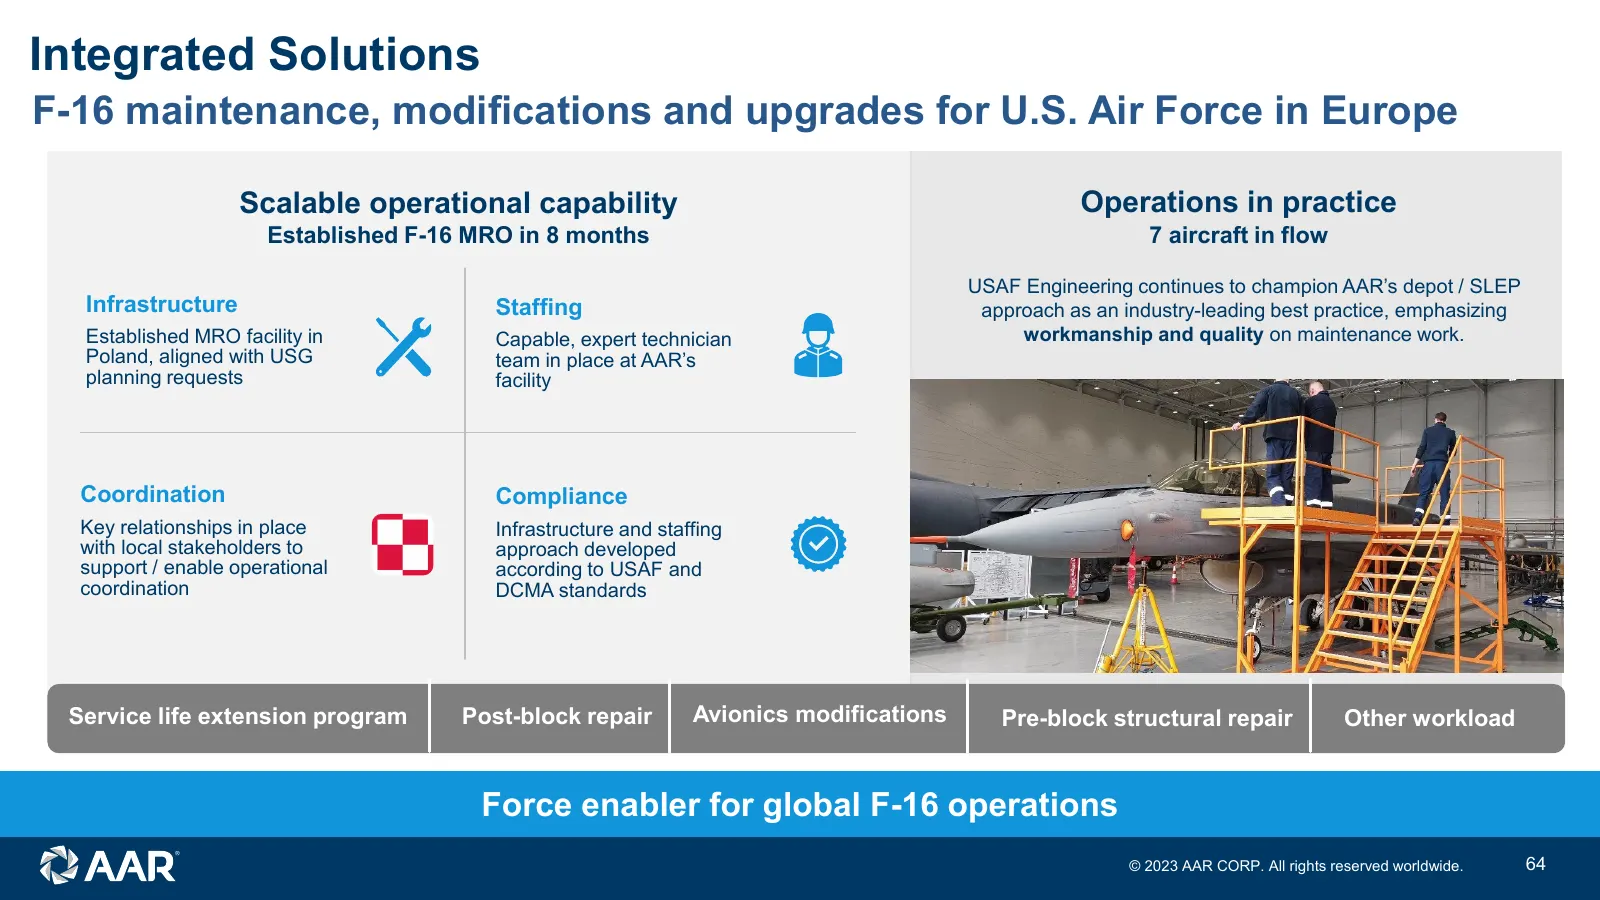
Integrated Solutions F-16 maintenance, modifications and upgrades for U.S. Air Force in Europe Scalable operational capability Operations in practice Established F-16 MRO in 8 months 7 aircraft in flow USAF Engineering continues to champion AAR’s depot / SLEP Infrastructure Staffing approach as an i
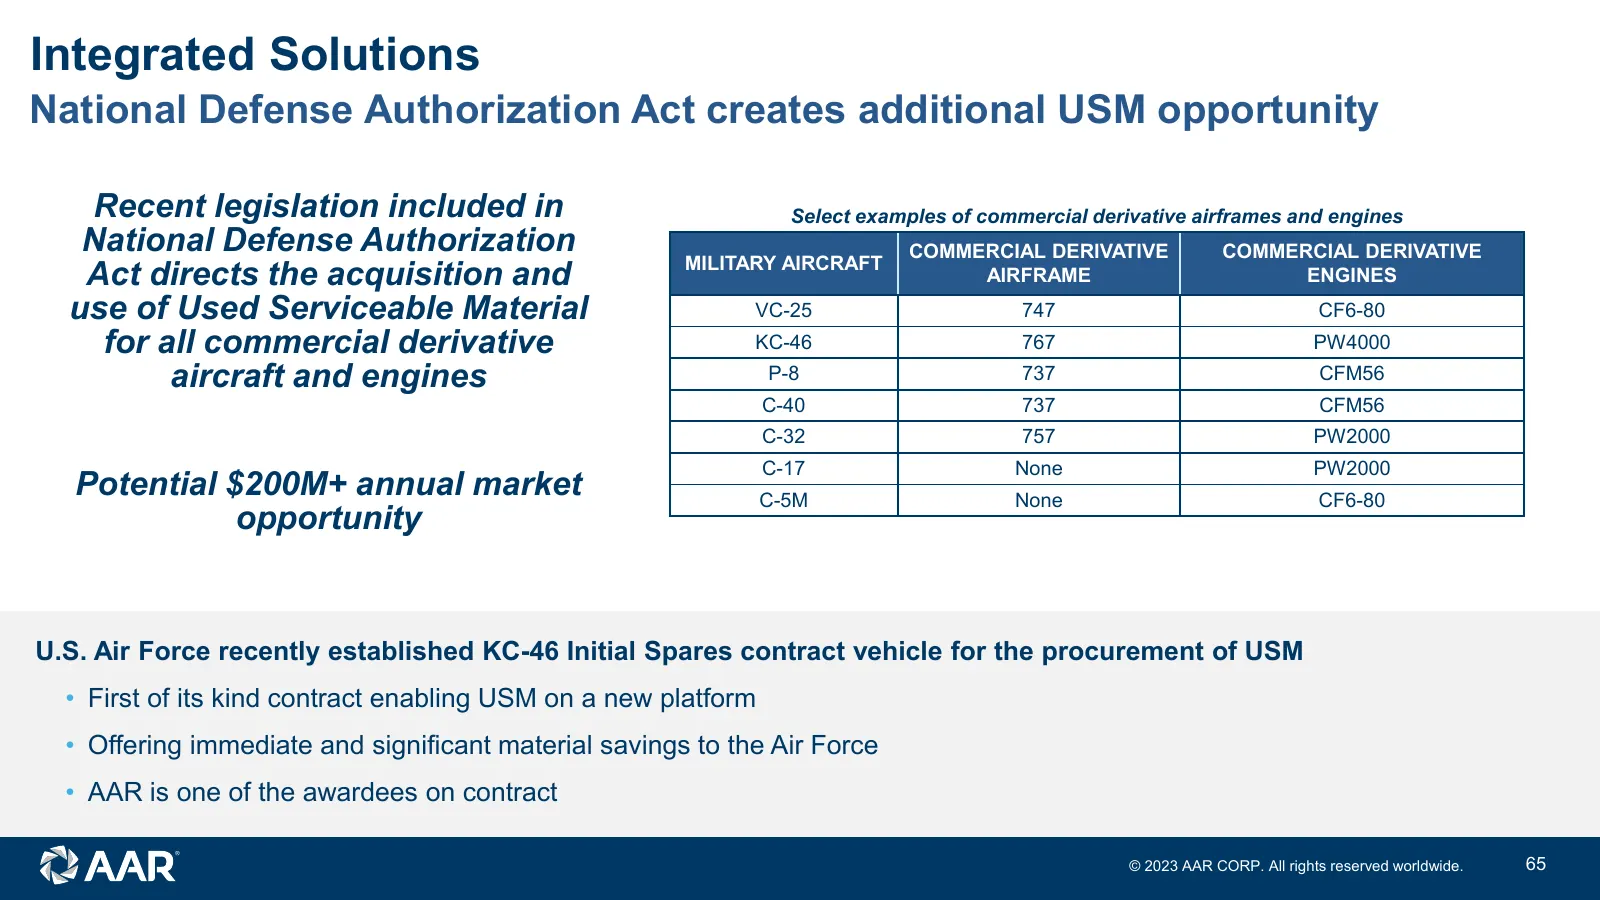
Slide 65: National Defense Authorization Act creates additional USM opportunity
Integrated Solutions National Defense Authorization Act creates additional USM opportunity Recent legislation included in Select examples of commercial derivative airframes and engines National Defense Authorization COMMERCIAL DERIVATIVE COMMERCIAL DERIVATIVE MILITARY AIRCRAFT Act directs the acquis
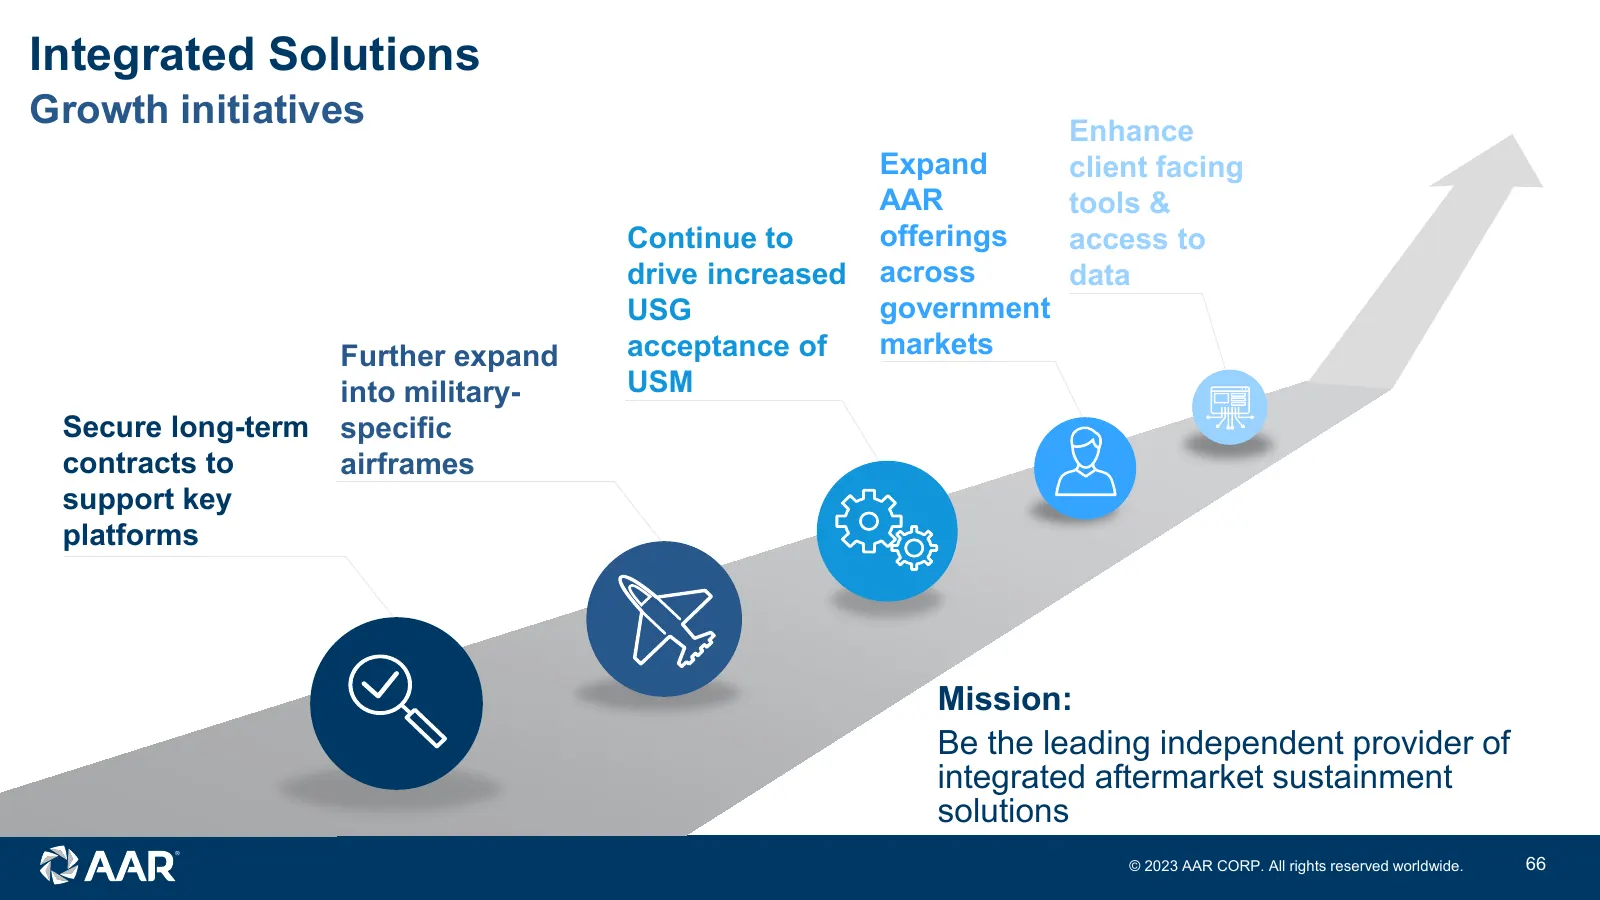
Slide 66: Growth initiatives
Integrated Solutions Growth initiatives Enhance Expand client facing AAR tools & Continue to offerings access to drive increased across data USG government Further expand acceptance of markets into military- USM Secure long-term specific contracts to airframes support key platforms Mission: Be the l

Slide 67: Trax aviation software
Trax aviation software Jose Almeida Andrew Schmidt President, Trax SVP, Digital Services & Trax © 2023 AAR CORP. All rights reserved worldwide. 67
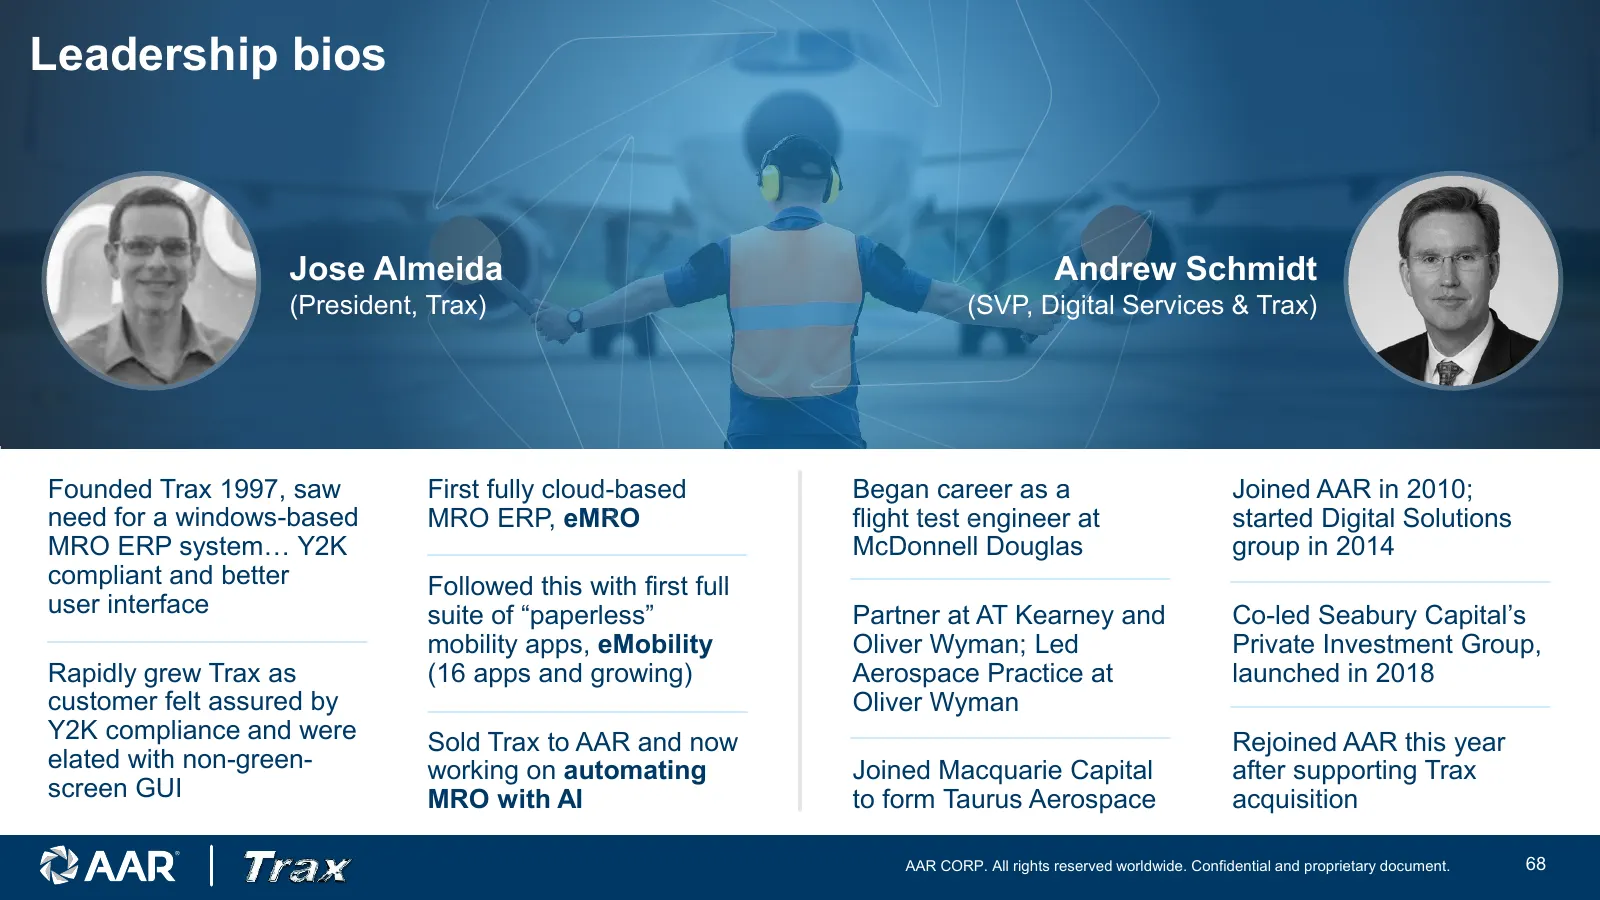
Slide 68: Leadership bios
Leadership bios Jose Almeida Andrew Schmidt (President, Trax) (SVP, Digital Services & Trax) Founded Trax 1997, saw First fully cloud-based Began career as a Joined AAR in 2010; need for a windows-based MRO ERP, eMRO flight test engineer at started Digital Solutions MRO ERP system… Y2K McDonnell Dou
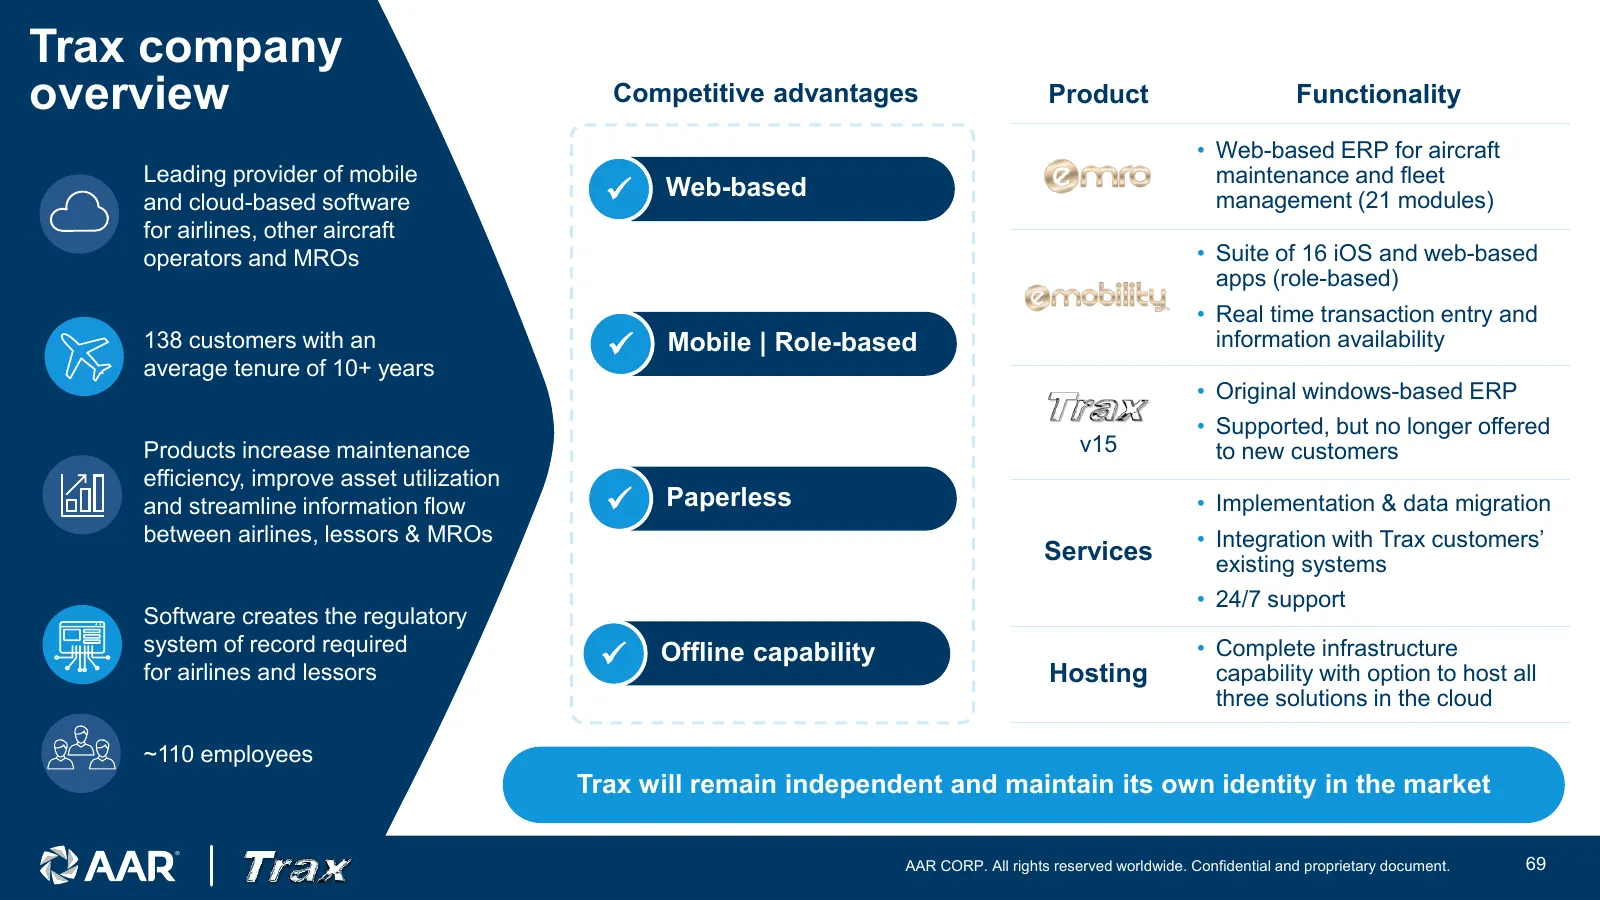
Slide 69: Trax company overview
Trax company overview Competitive advantages Product Functionality • Web-based ERP for aircraft Leading provider of mobile maintenance and fleet Web-based management (21 modules) and cloud-based software for airlines, other aircraft operators and MROs • Suite of 16 iOS and web-based apps (role-bas
Slide 70: What does Trax do for its customers?
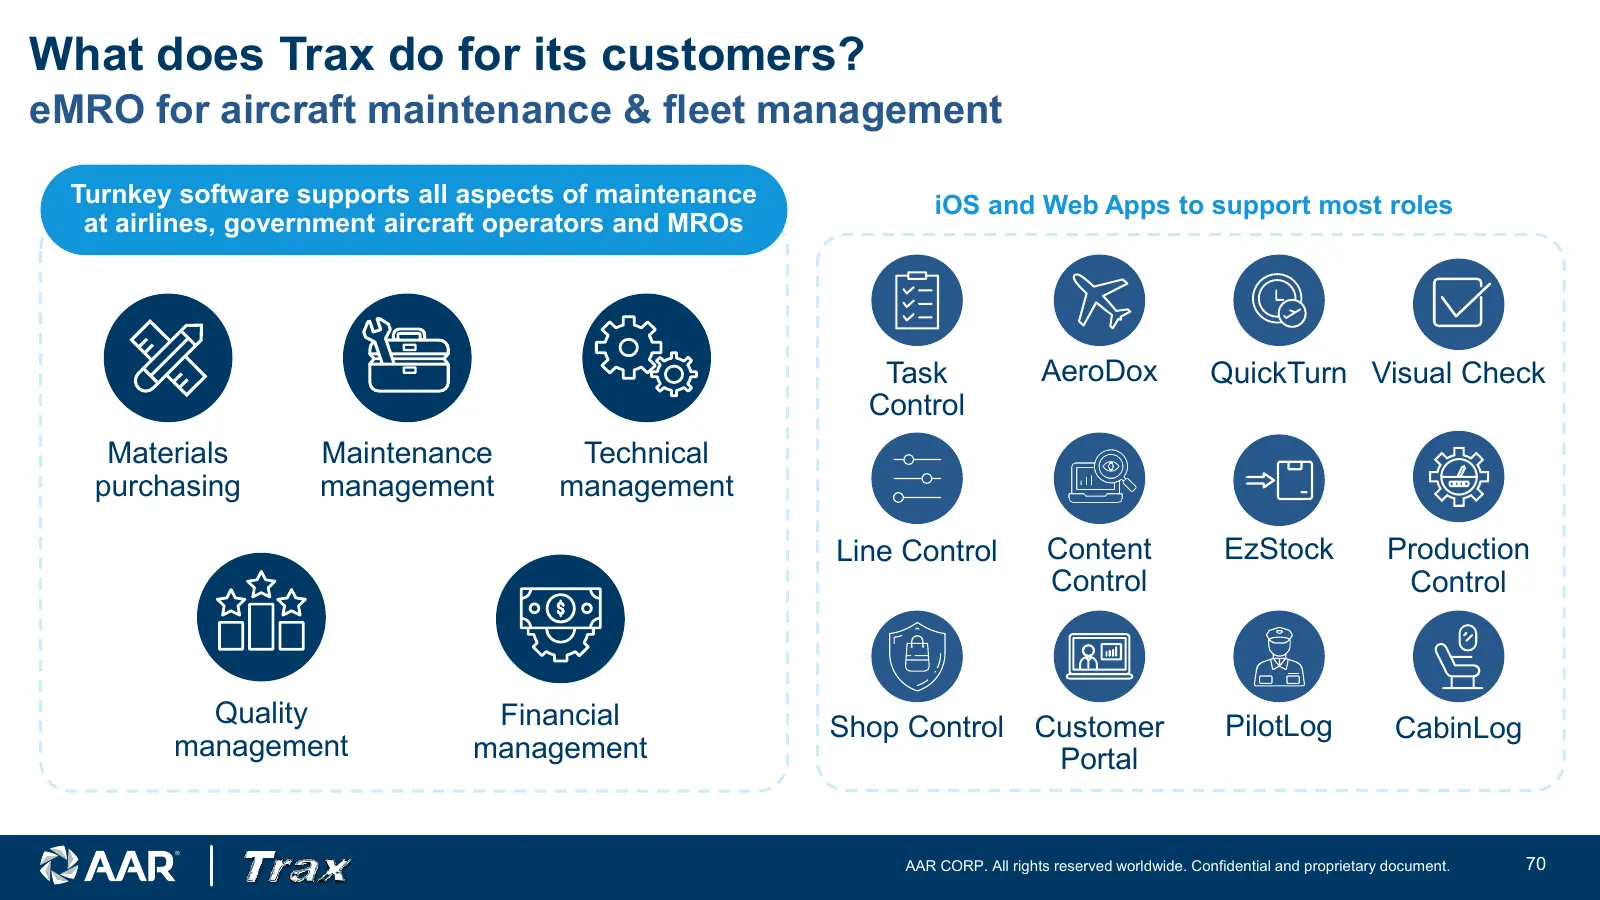
What does Trax do for its customers? eMRO for aircraft maintenance & fleet management Turnkey software supports all aspects of maintenance iOS and Web Apps to support most roles at airlines, government aircraft operators and MROs Task AeroDox QuickTurn Visual Check Control Materials Maintenance Tech
Slide 71: Customers and market
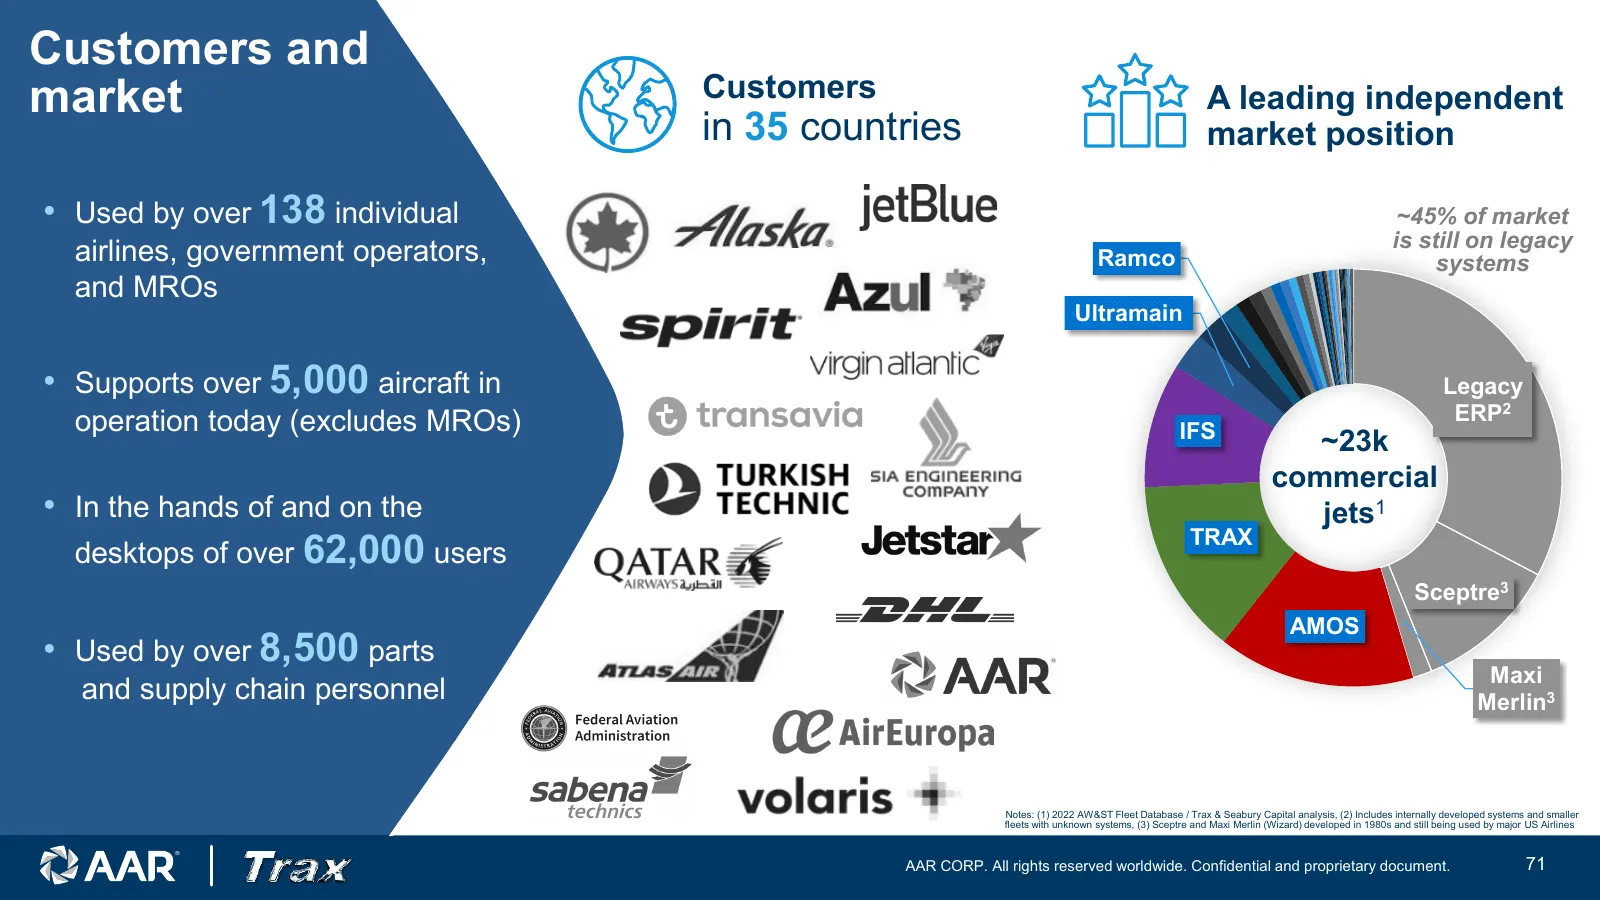
Customers and market Customers A leading independent in 35 countries market position • Used by over 138 individual ~45% of market is still on legacy airlines, government operators, Ramco systems and MROs Ultramain • Supports over 5,000 aircraft in Legacy operation today (excludes MROs) z IFS ERP2 ~2
Slide 72: Strategic vision
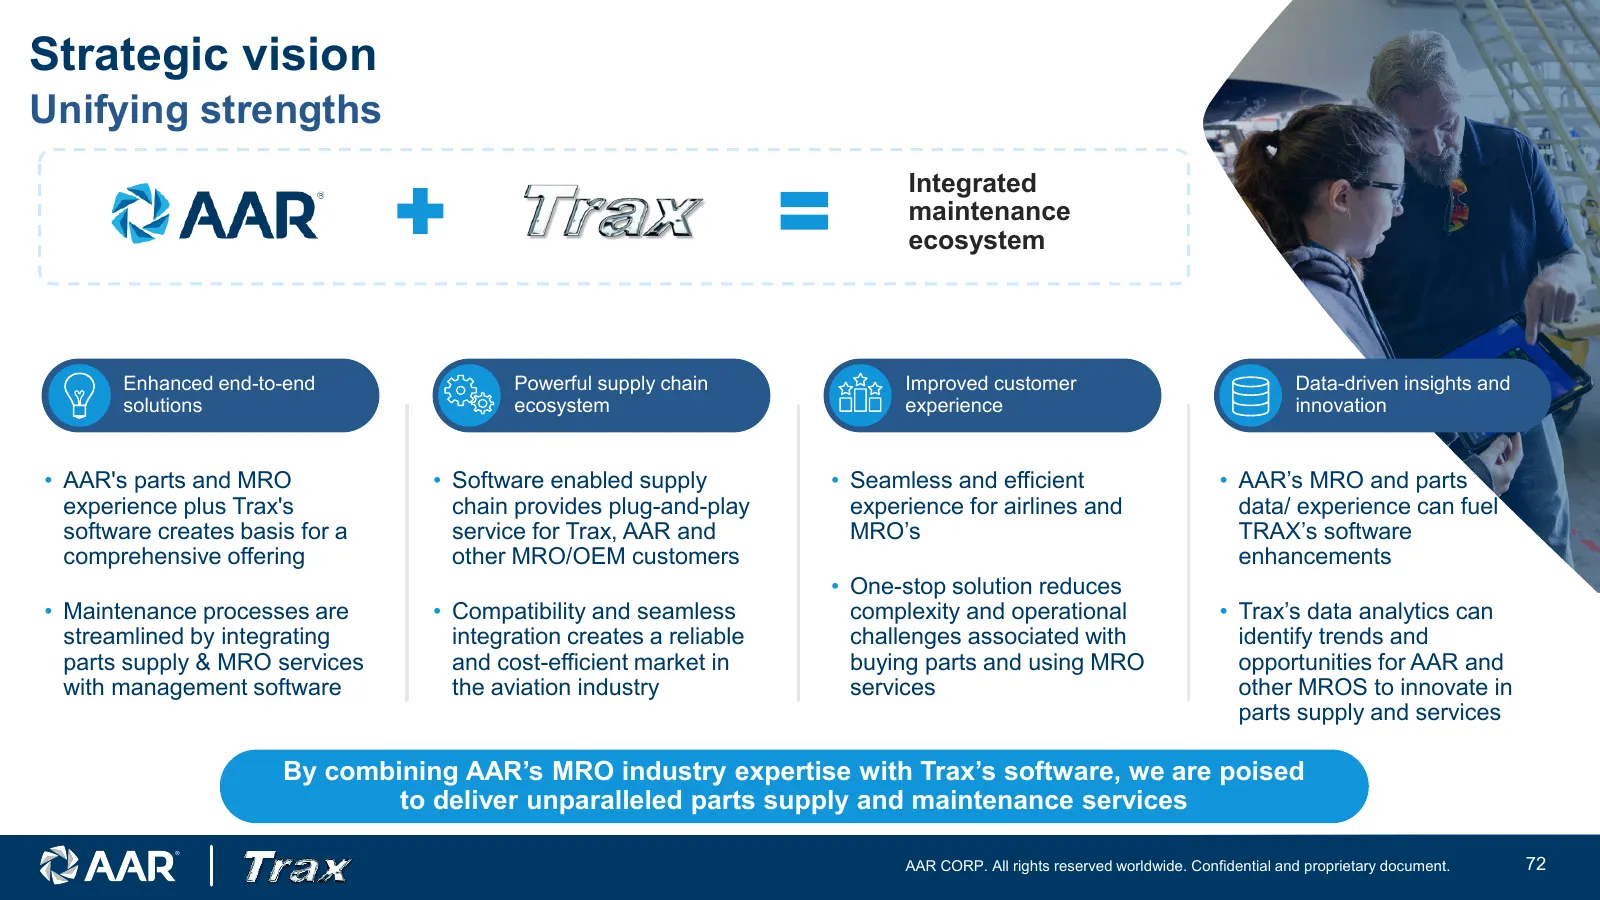
Strategic vision Unifying strengths Integrated maintenance ecosystem Enhanced end-to-end Powerful supply chain Improved customer Data-driven insights and solutions ecosystem experience innovation • AAR's parts and MRO • Software enabled supply • Seamless and efficient • AAR’s MRO and parts experienc
Slide 73: Strategic vision: new parts ecosystem
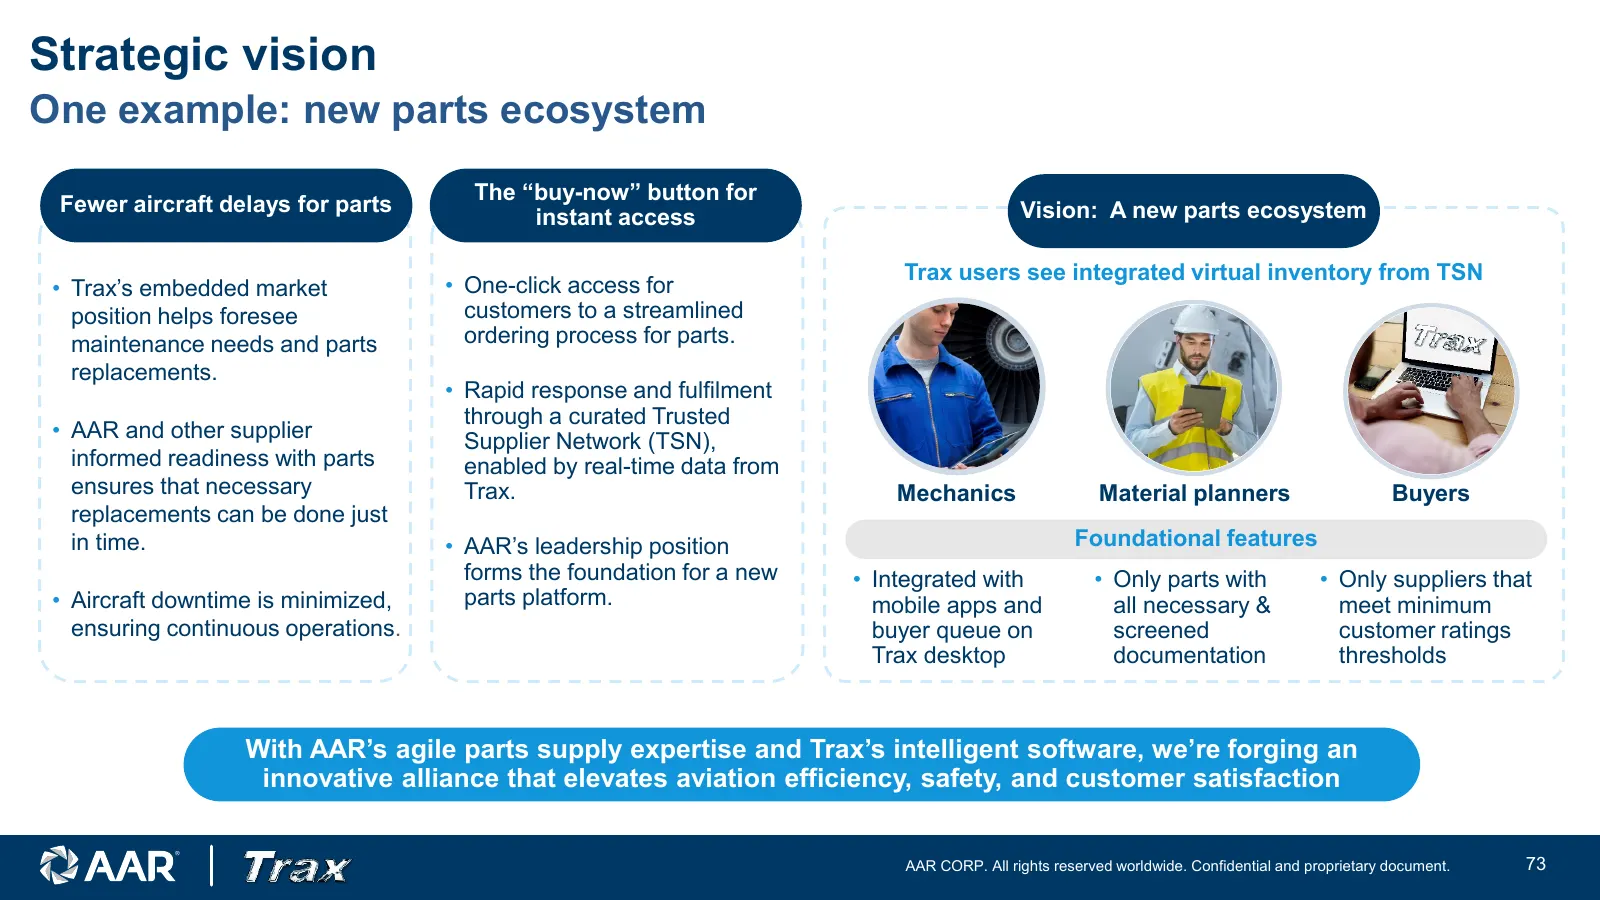
Strategic vision One example: new parts ecosystem The “buy-now” button for Fewer aircraft delays for parts Vision: A new parts ecosystem instant access Trax users see integrated virtual inventory from TSN • Trax’s embedded market • One-click access for position helps foresee customers to a streamlin
Slide 74: Growth initiatives
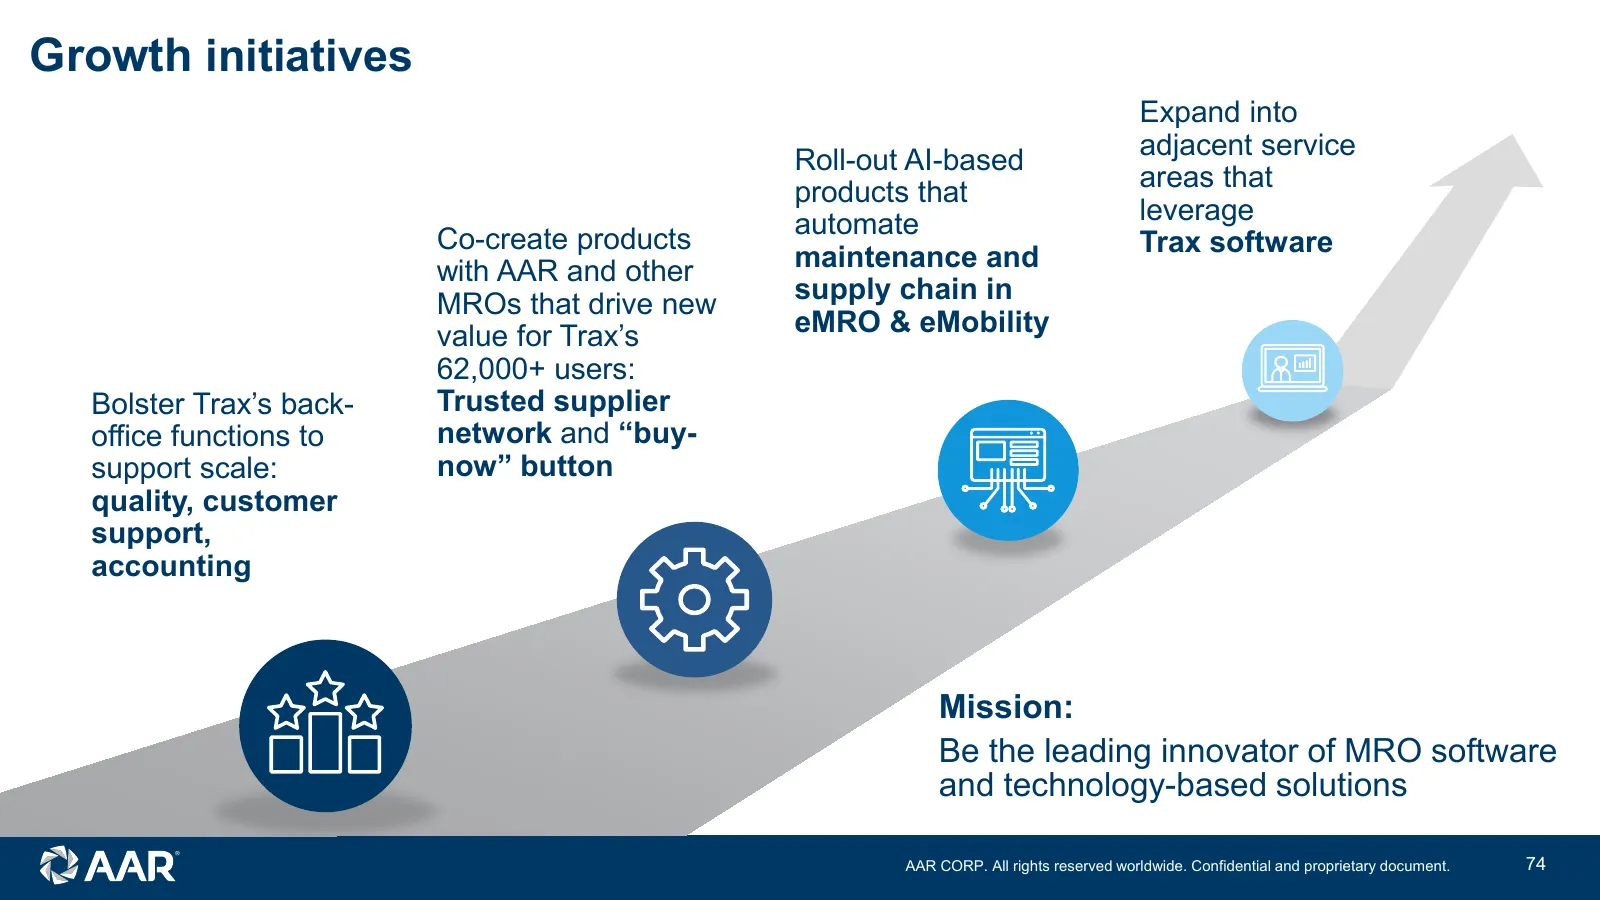
Growth initiatives Expand into Roll-out AI-based adjacent service products that areas that automate leverage Co-create products Trax software with AAR and other maintenance and MROs that drive new supply chain in value for Trax’s eMRO & eMobility 62,000+ users: Bolster Trax’s back- Trusted supplier

Slide 75: Financial overview
Financial overview Sean Gillen Chief Financial Officer © 2023 AAR CORP. All rights reserved worldwide. 75
Slide 76: Sean Gillen
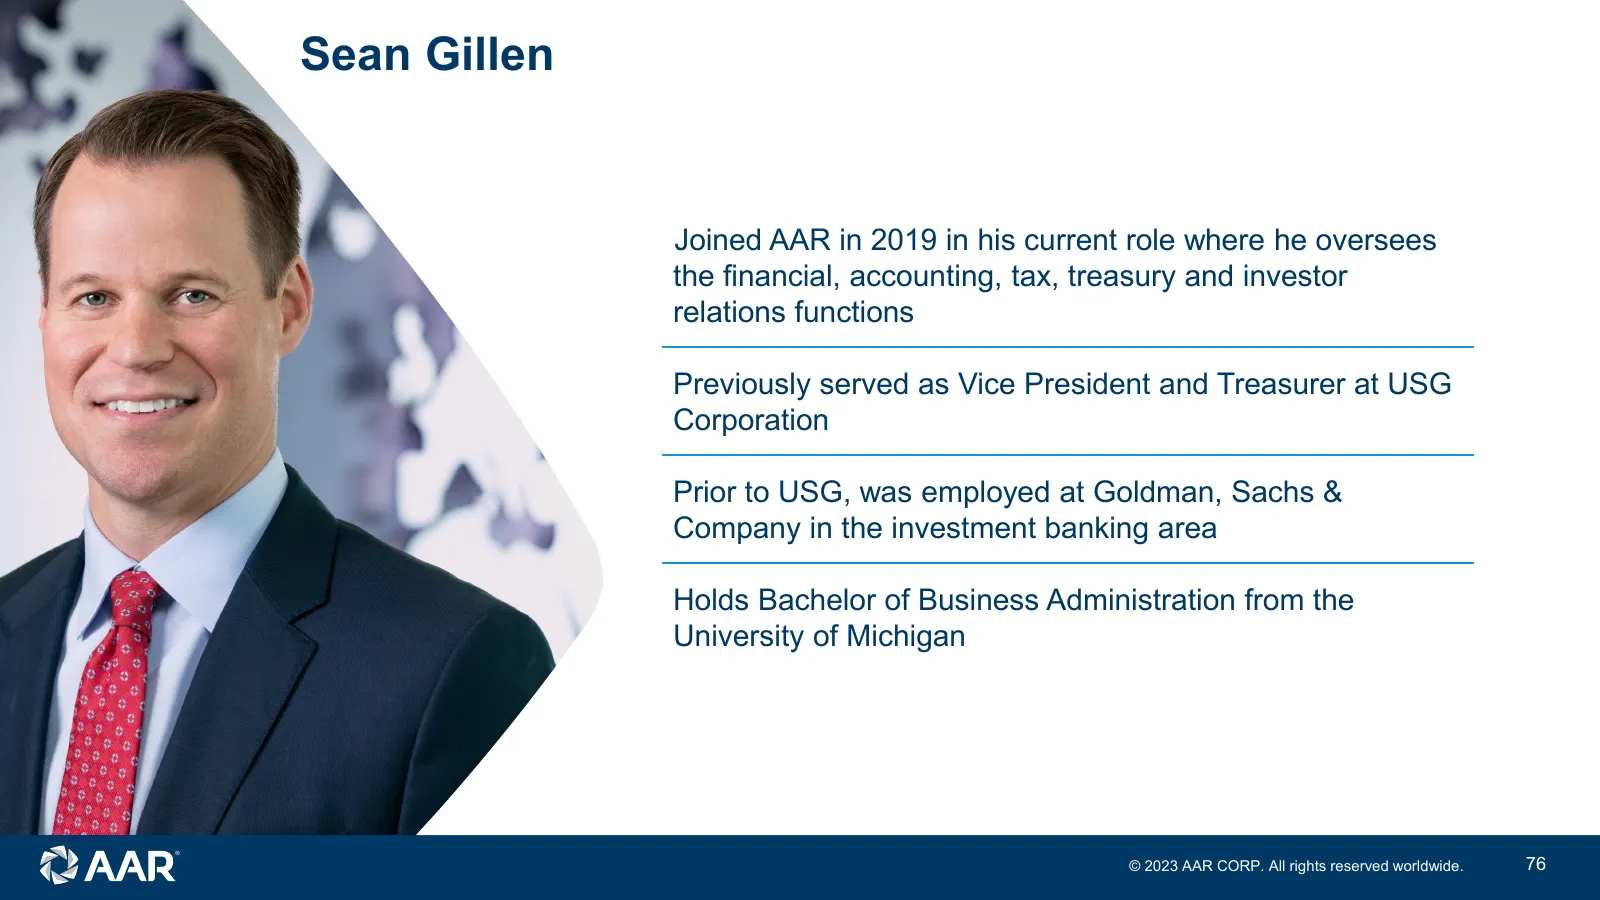
Sean Gillen Joined AAR in 2019 in his current role where he oversees the financial, accounting, tax, treasury and investor relations functions Previously served as Vice President and Treasurer at USG Corporation Prior to USG, was employed at Goldman, Sachs & Company in the investment banking area Ho
Slide 77: Historical financial performance
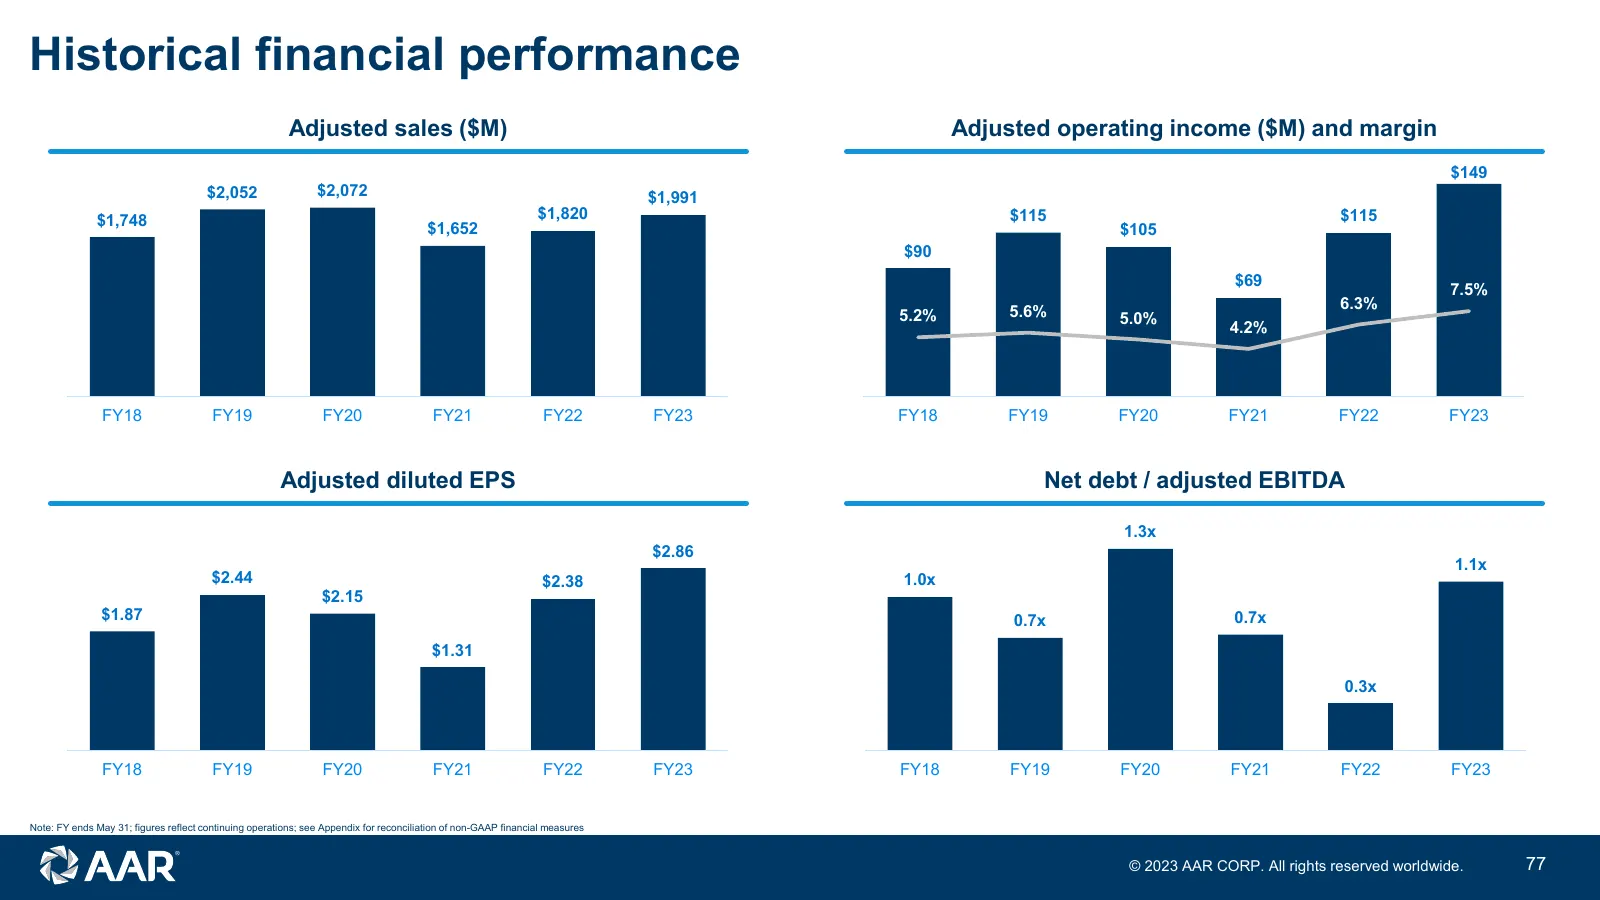
Historical financial performance Adjusted sales ($M) Adjusted operating income ($M) and margin $149 $2,052 $2,072 $1,991 $1,748 $1,820 $115 $115 $1,652 $105 $90 $69 7.5% 5.6% 6.3% 5.2% 5.0% 4.2% FY18 FY19 FY20 FY21 FY22 FY23 FY18 FY19 FY20 FY21 FY22 FY23 Adjusted diluted EPS Net debt / adjusted EBIT
Slide 78: Actions taken have yielded consistent financial improvement
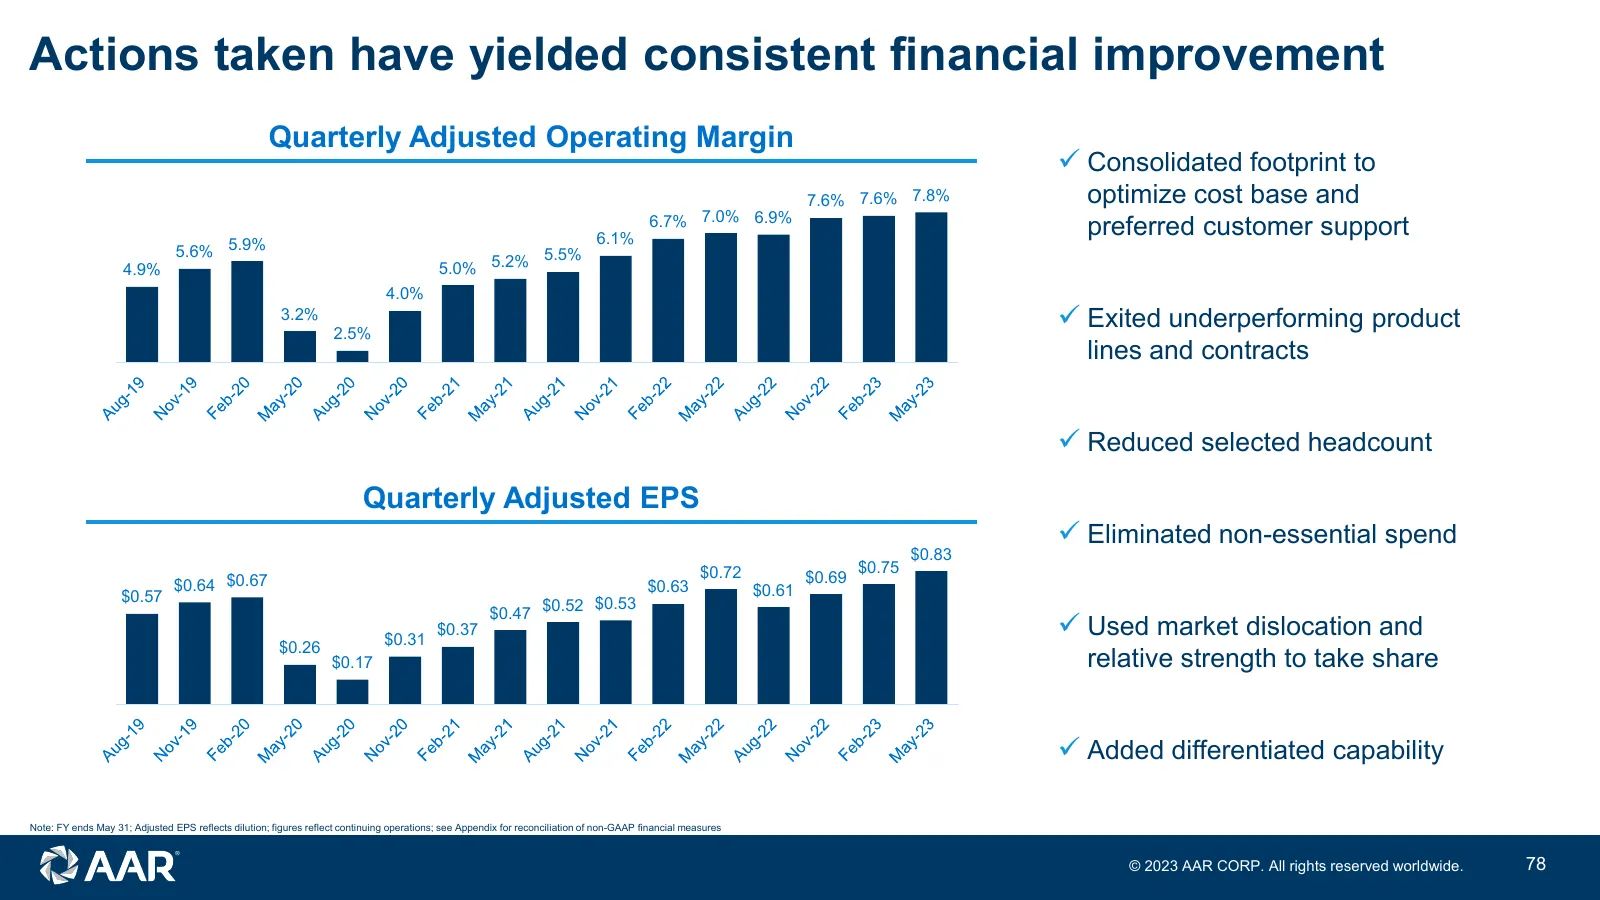
Actions taken have yielded consistent financial improvement Quarterly Adjusted Operating Margin Consolidated footprint to 7.6% 7.6% 7.8% optimize cost base and 6.7% 7.0% 6.9% preferred customer support 6.1% 5.6% 5.9% 5.5% 4.9% 5.0% 5.2% 4.0% 3.2% 2.5% Exited underperforming product lines and con
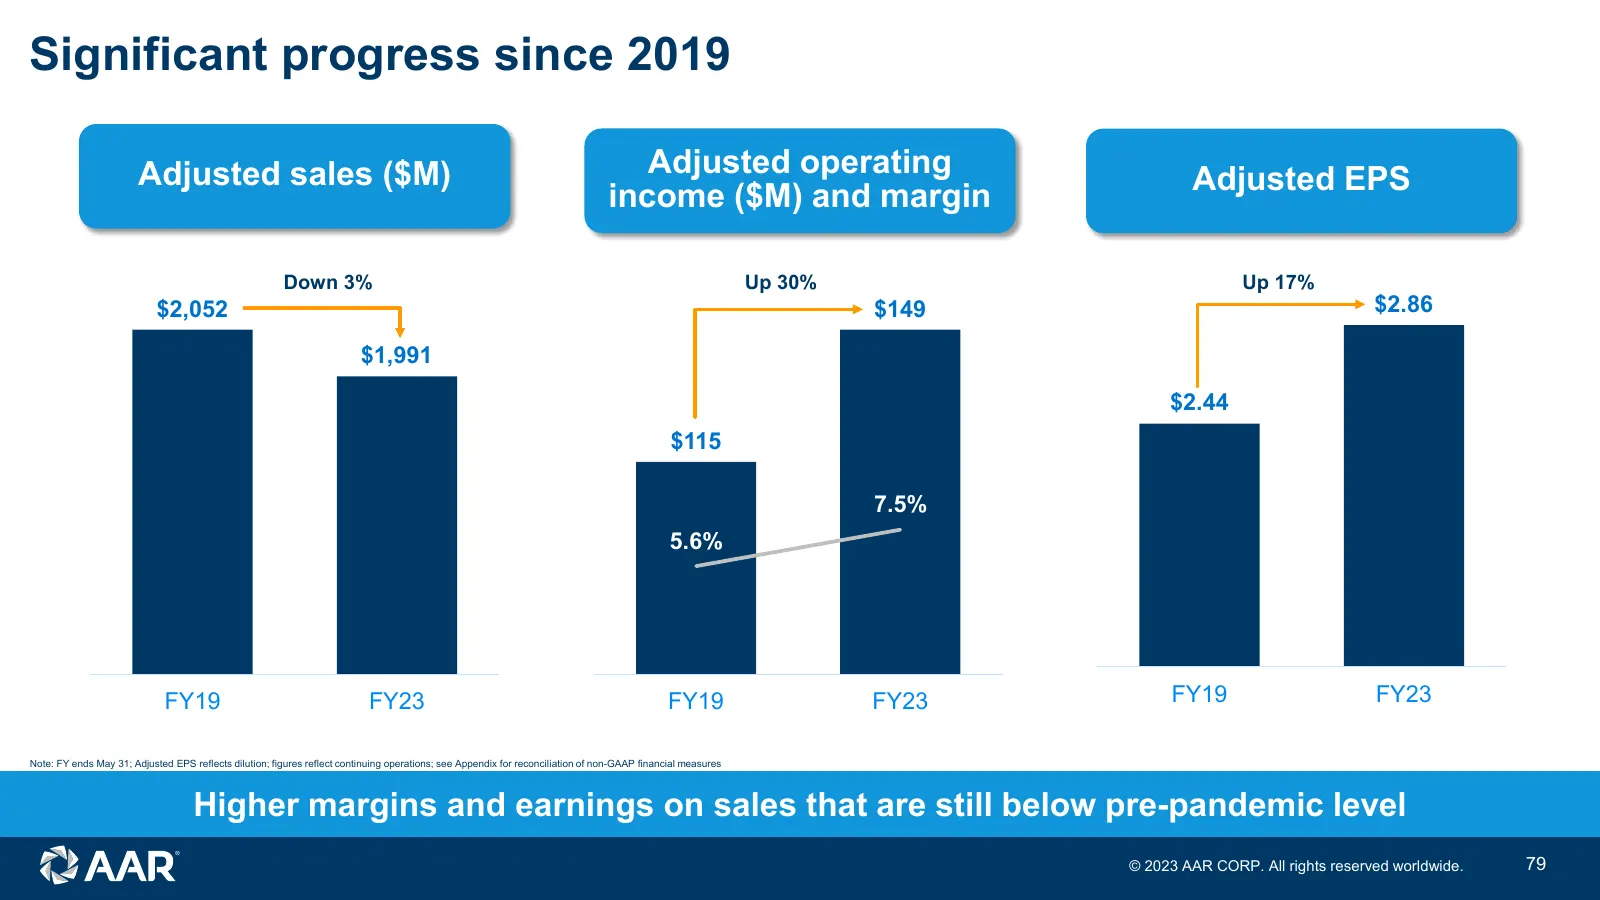
Slide 79: Significant progress since 2019
Significant progress since 2019 Adjusted sales ($M) Adjusted operating Adjusted EPS income ($M) and margin Down 3% Up 30% Up 17% $2,052 $149 $2.86 $1,991 $2.44 $115 7.5% 5.6% FY19 FY23 FY19 FY23 FY19 FY23 Note: FY ends May 31; Adjusted EPS reflects dilution; figures reflect continuing operations; se
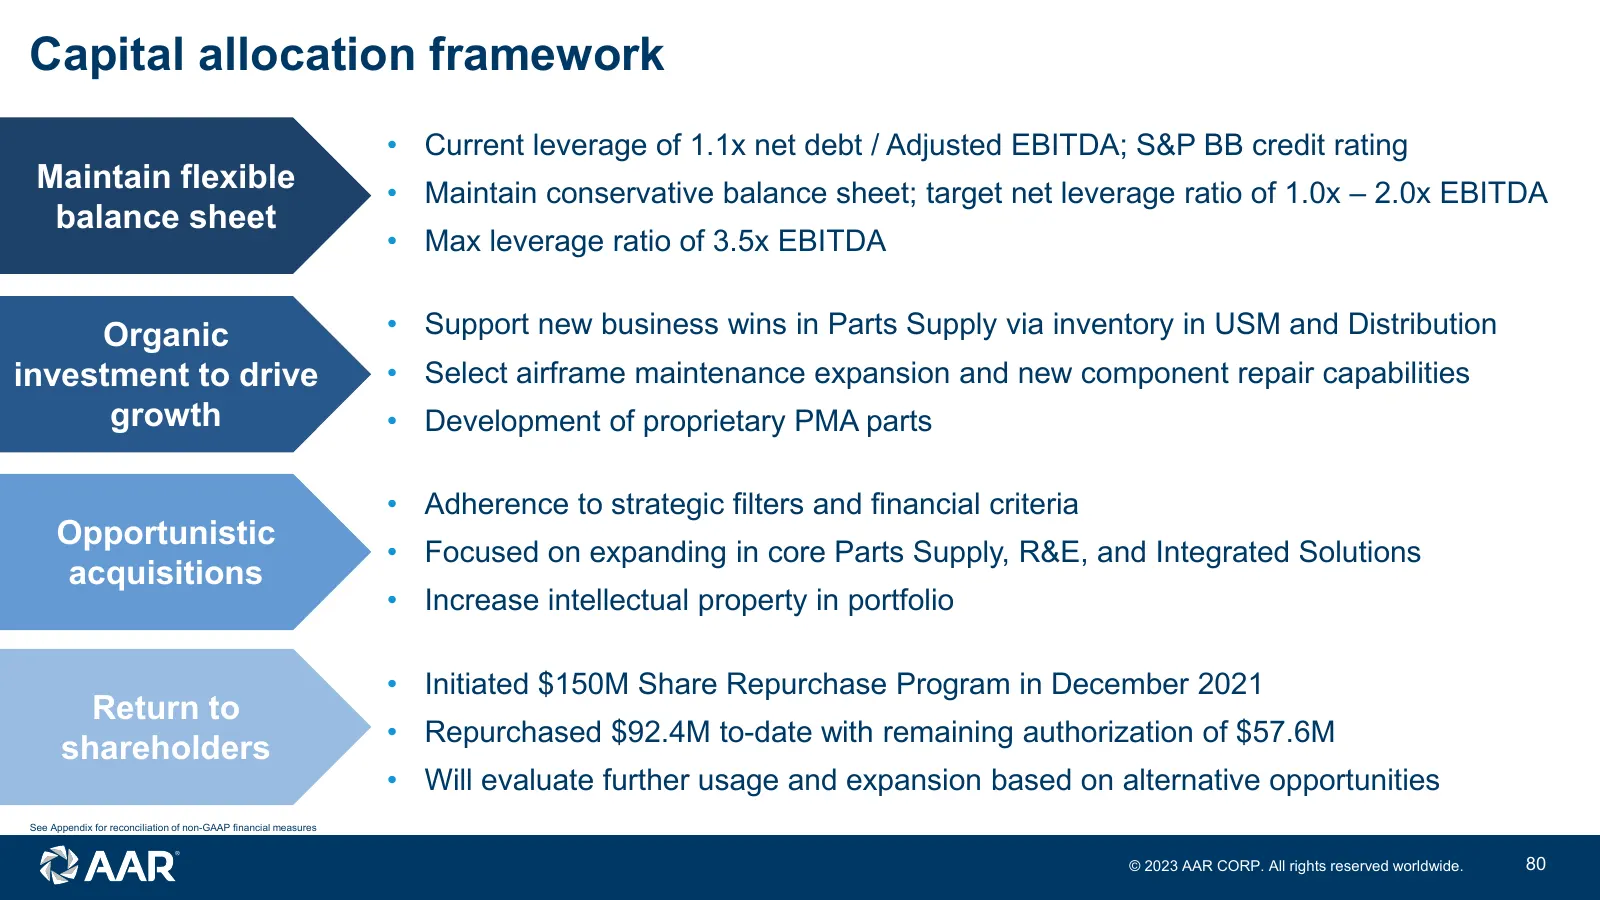
Slide 80: Capital allocation framework
Capital allocation framework • Current leverage of 1.1x net debt / Adjusted EBITDA; S&P BB credit rating Maintain flexible • Maintain conservative balance sheet; target net leverage ratio of 1.0x – 2.0x EBITDA balance sheet • Max leverage ratio of 3.5x EBITDA Organic • Support new business wins in P
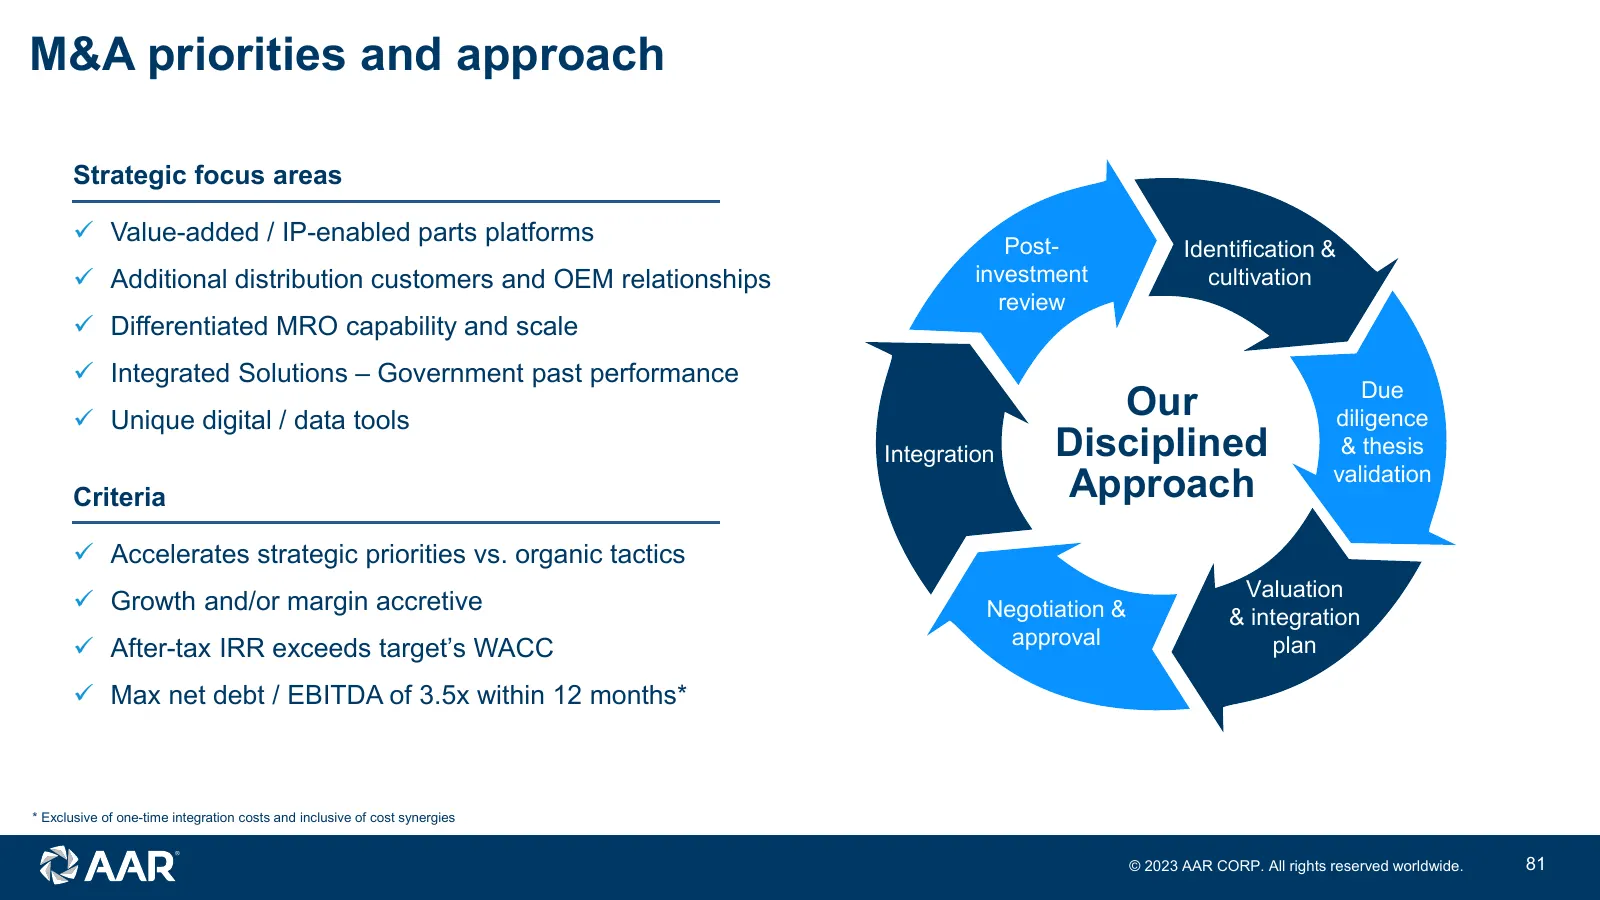
Slide 81: M&A priorities and approach
M&A priorities and approach Strategic focus areas Value-added / IP-enabled parts platforms Post- Identification & Additional distribution customers and OEM relationships investment cultivation review Differentiated MRO capability and scale Integrated Solutions – Government past performance
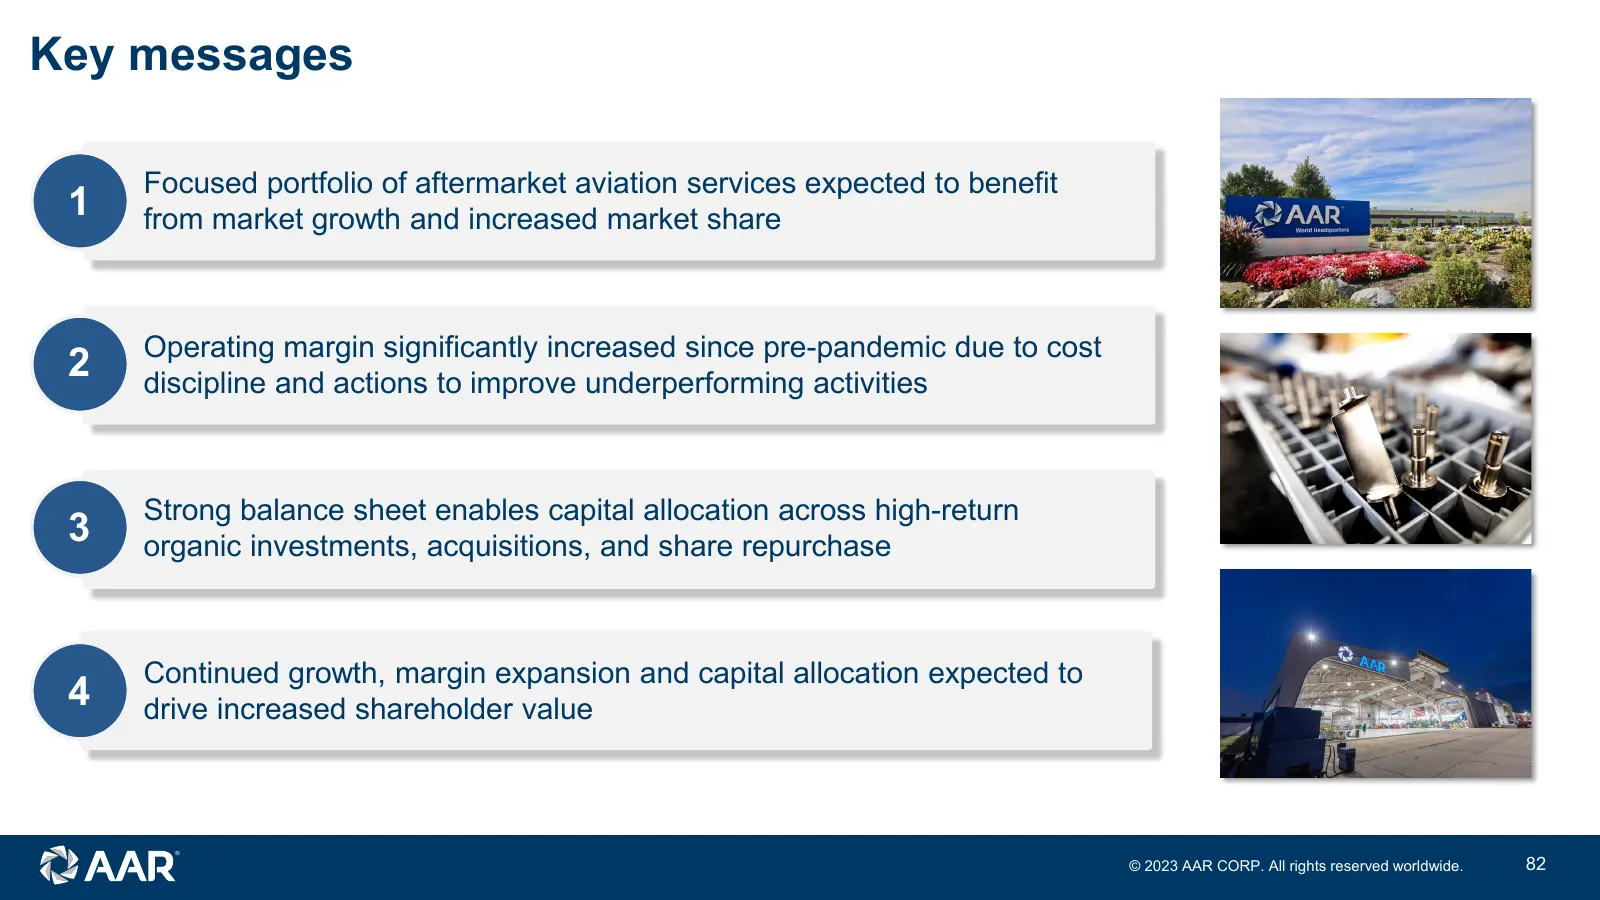
Slide 82: Key messages
Key messages Focused portfolio of aftermarket aviation services expected to benefit 1 from market growth and increased market share Operating margin significantly increased since pre-pandemic due to cost 2 discipline and actions to improve underperforming activities Strong balance sheet enables capi
Slide 83: Closing comments
Closing comments John M. Holmes Chairman, President and Chief Executive Officer © 2023 AAR CORP. All rights reserved worldwide. 83
Slide 84: Key takeaways
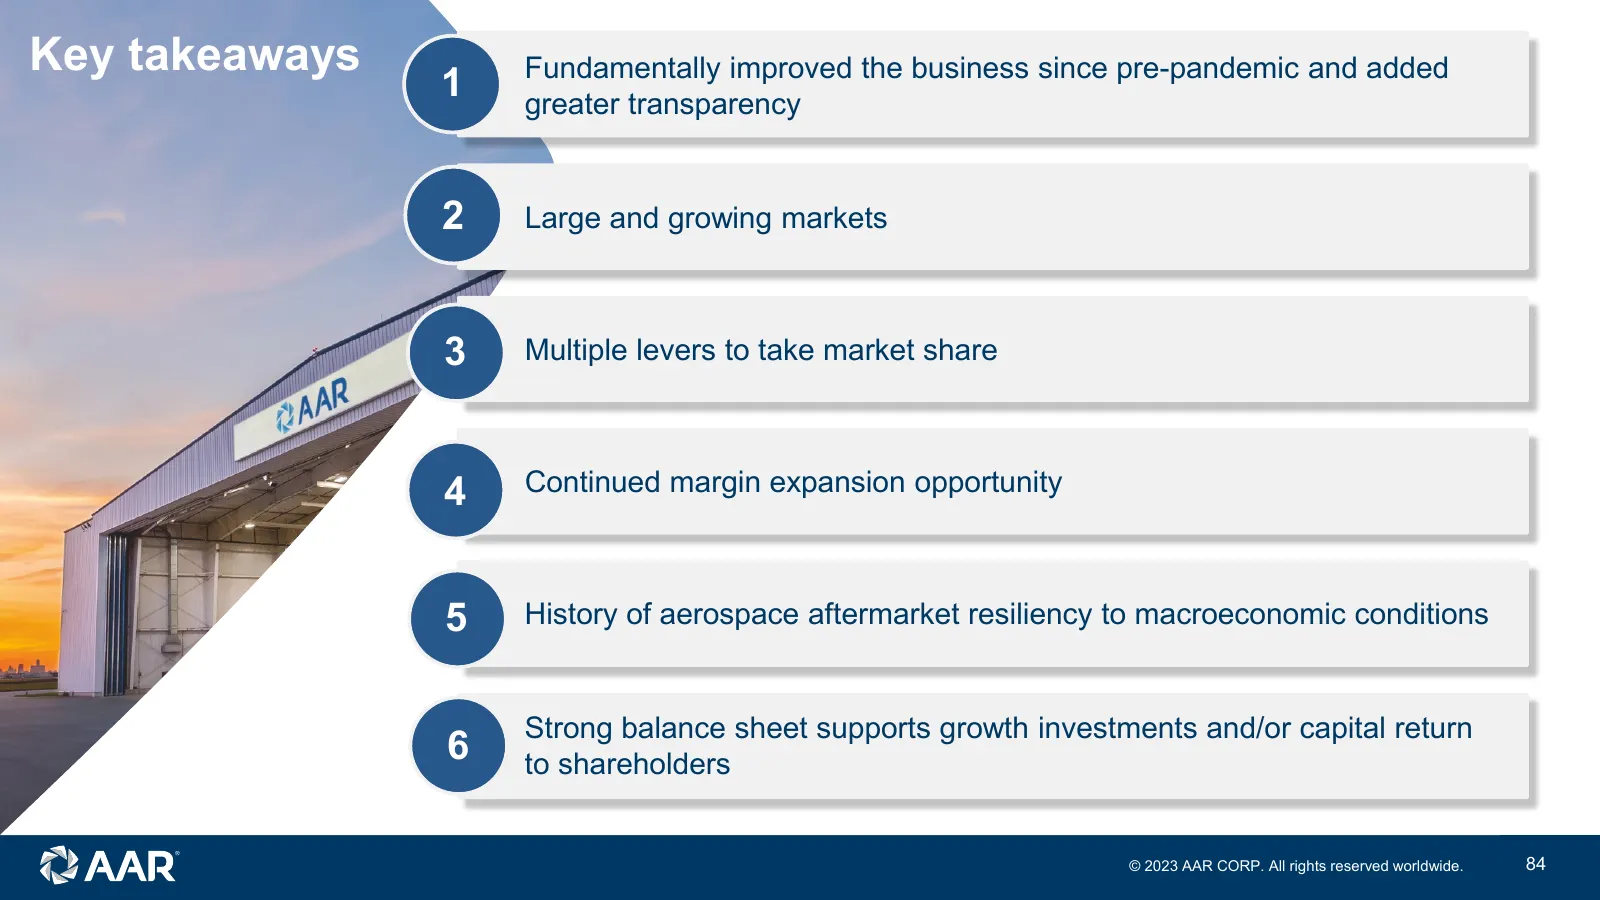
Key takeaways Fundamentally improved the business since pre-pandemic and added 1 greater transparency 2 Large and growing markets 3 Multiple levers to take market share 4 Continued margin expansion opportunity 5 History of aerospace aftermarket resiliency to macroeconomic conditions Strong balance s

Slide 85: Q&A
Q&A © 2023 AAR CORP. All rights reserved worldwide. 85

Slide 86: Appendix
Appendix © 2023 AAR CORP. All rights reserved worldwide. 86
Slide 87: Non-GAAP financial measures
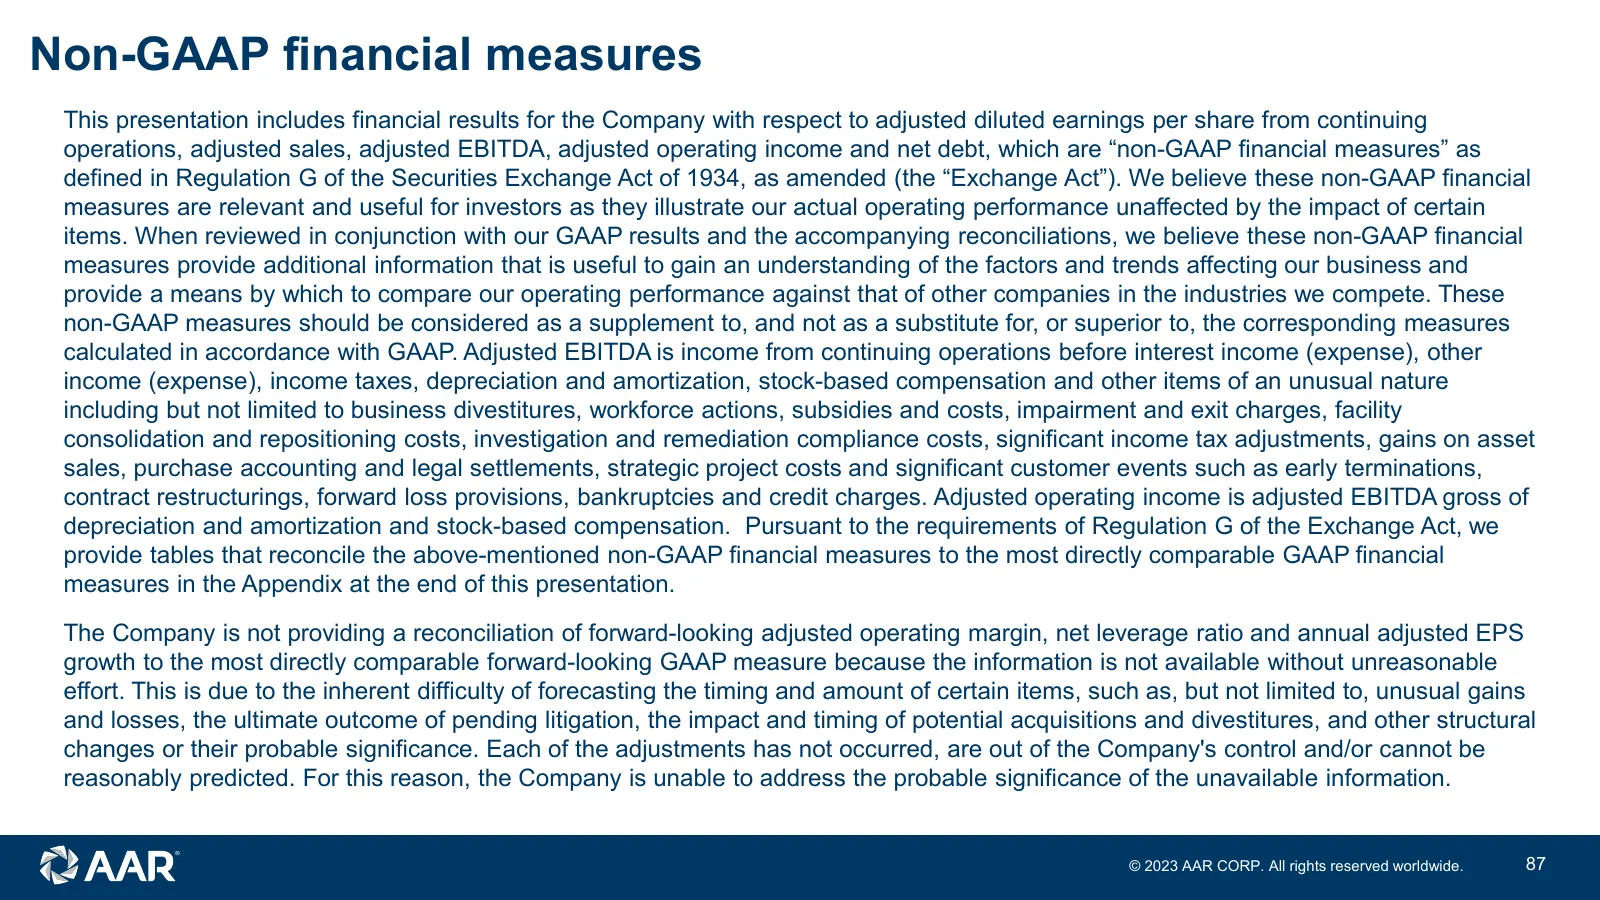
Non-GAAP financial measures This presentation includes financial results for the Company with respect to adjusted diluted earnings per share from continuing operations, adjusted sales, adjusted EBITDA, adjusted operating income and net debt, which are “non-GAAP financial measures” as defined in Regu
Slide 88: Non-GAAP financial measures
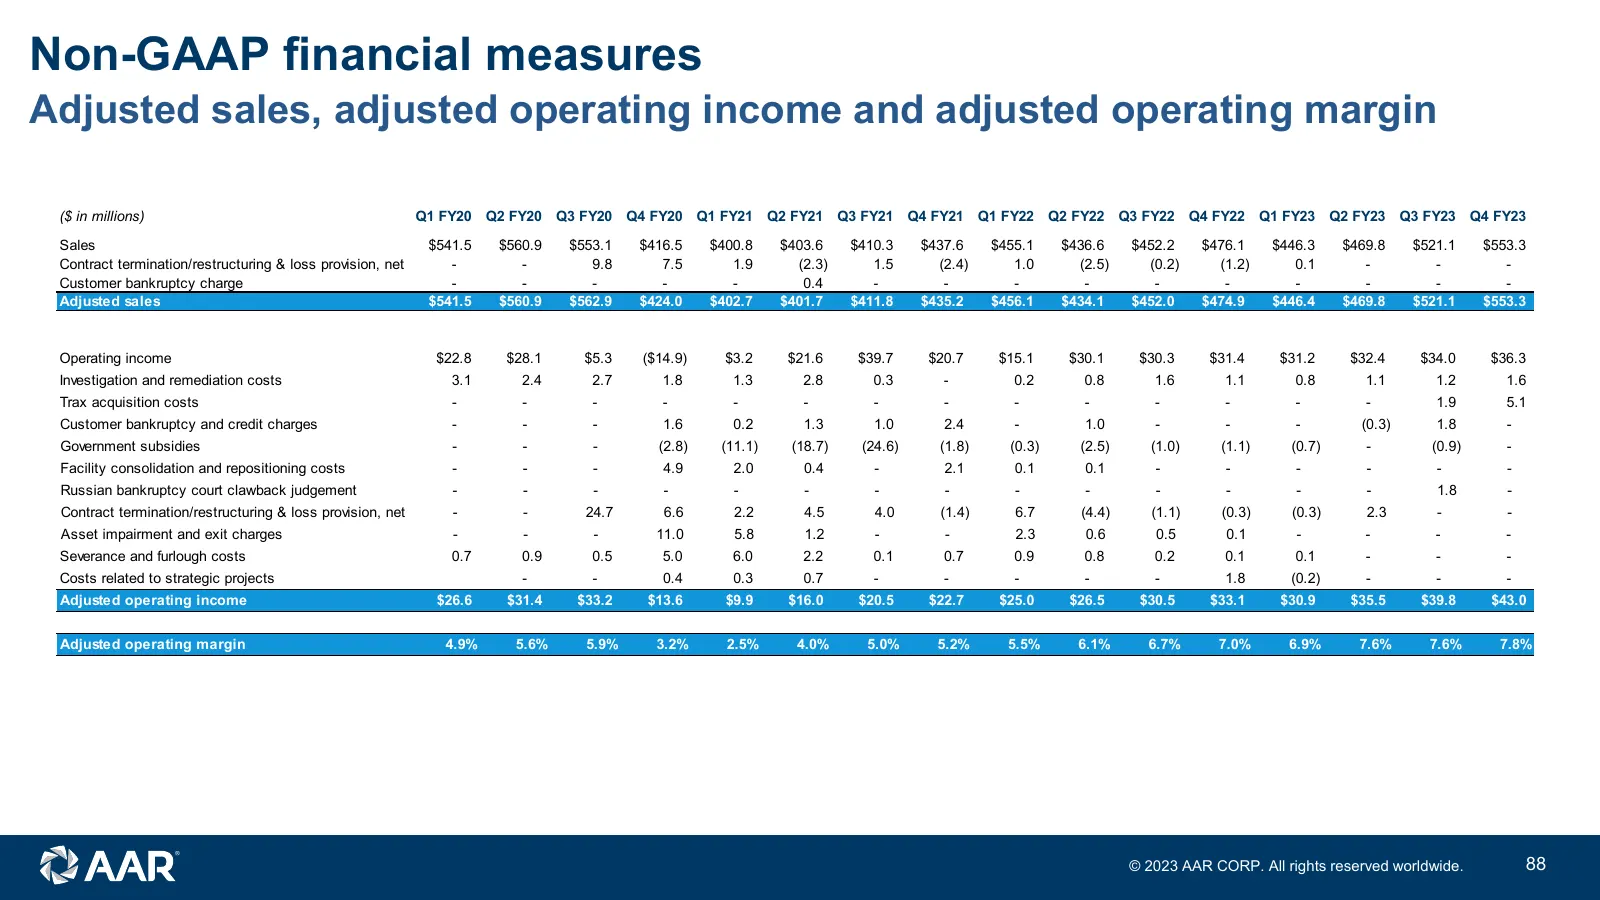
Non-GAAP financial measures Adjusted sales, adjusted operating income and adjusted operating margin ($ in millions) Q1 FY20 Q2 FY20 Q3 FY20 Q4 FY20 Q1 FY21 Q2 FY21 Q3 FY21 Q4 FY21 Q1 FY22 Q2 FY22 Q3 FY22 Q4 FY22 Q1 FY23 Q2 FY23 Q3 FY23 Q4 FY23 Sales $541.5 $560.9 $553.1 $416.5 $400.8 $403.6 $410.3 $
Slide 89: Non-GAAP financial measures
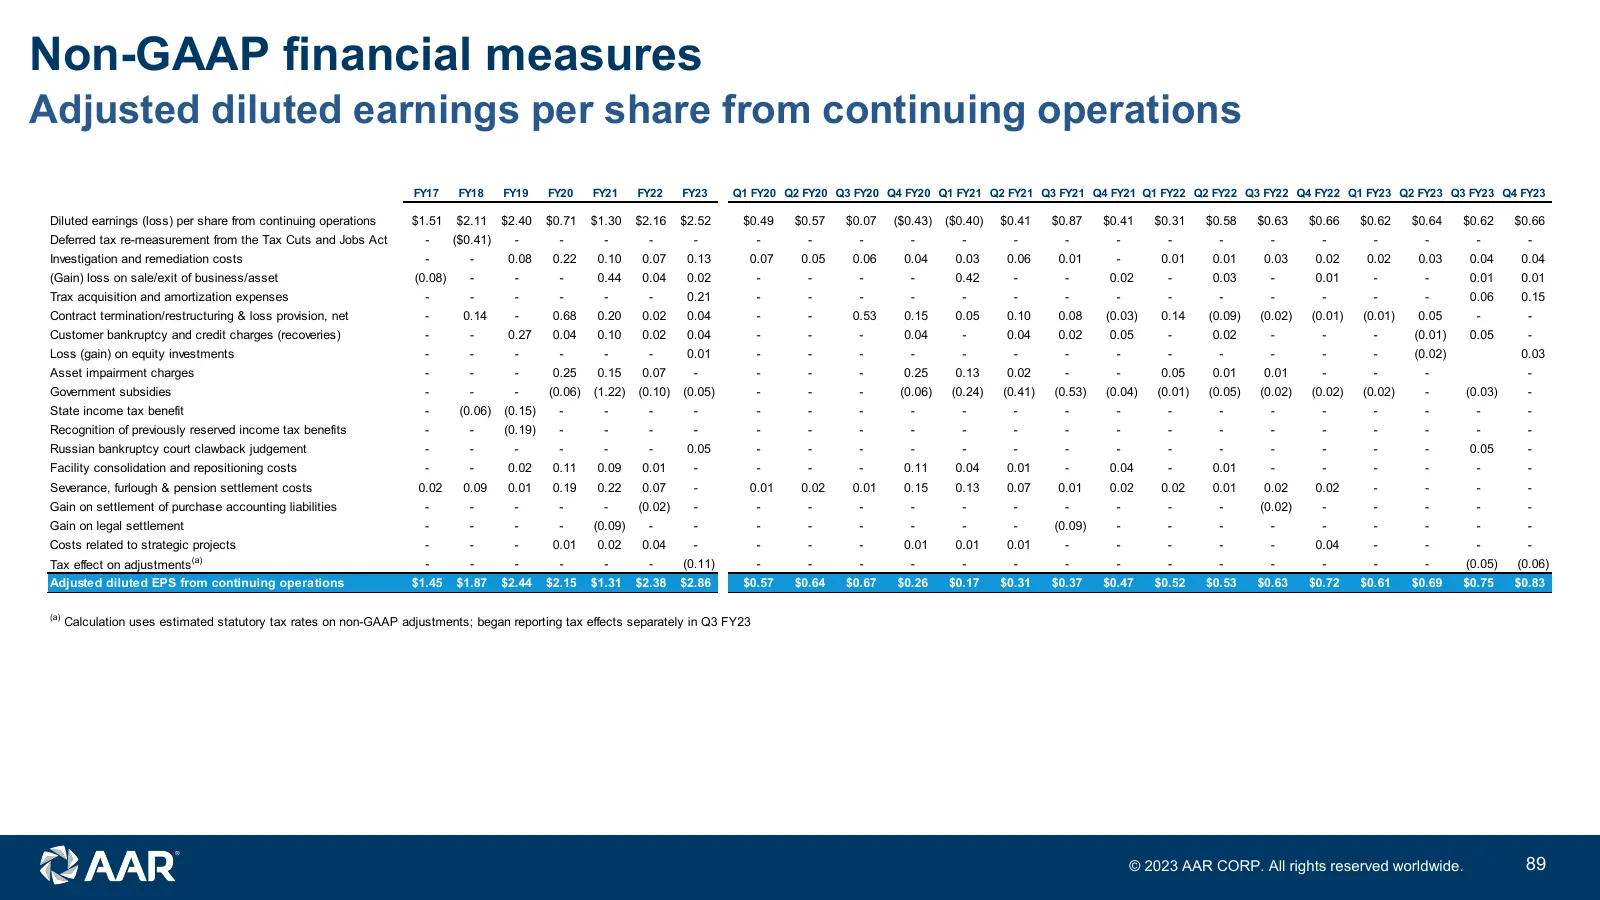
Non-GAAP financial measures Adjusted diluted earnings per share from continuing operations FY17 FY18 FY19 FY20 FY21 FY22 FY23 Q1 FY20 Q2 FY20 Q3 FY20 Q4 FY20 Q1 FY21 Q2 FY21 Q3 FY21 Q4 FY21 Q1 FY22 Q2 FY22 Q3 FY22 Q4 FY22 Q1 FY23 Q2 FY23 Q3 FY23 Q4 FY23 Diluted earnings (loss) per share from continu
Slide 90: Non-GAAP financial measures
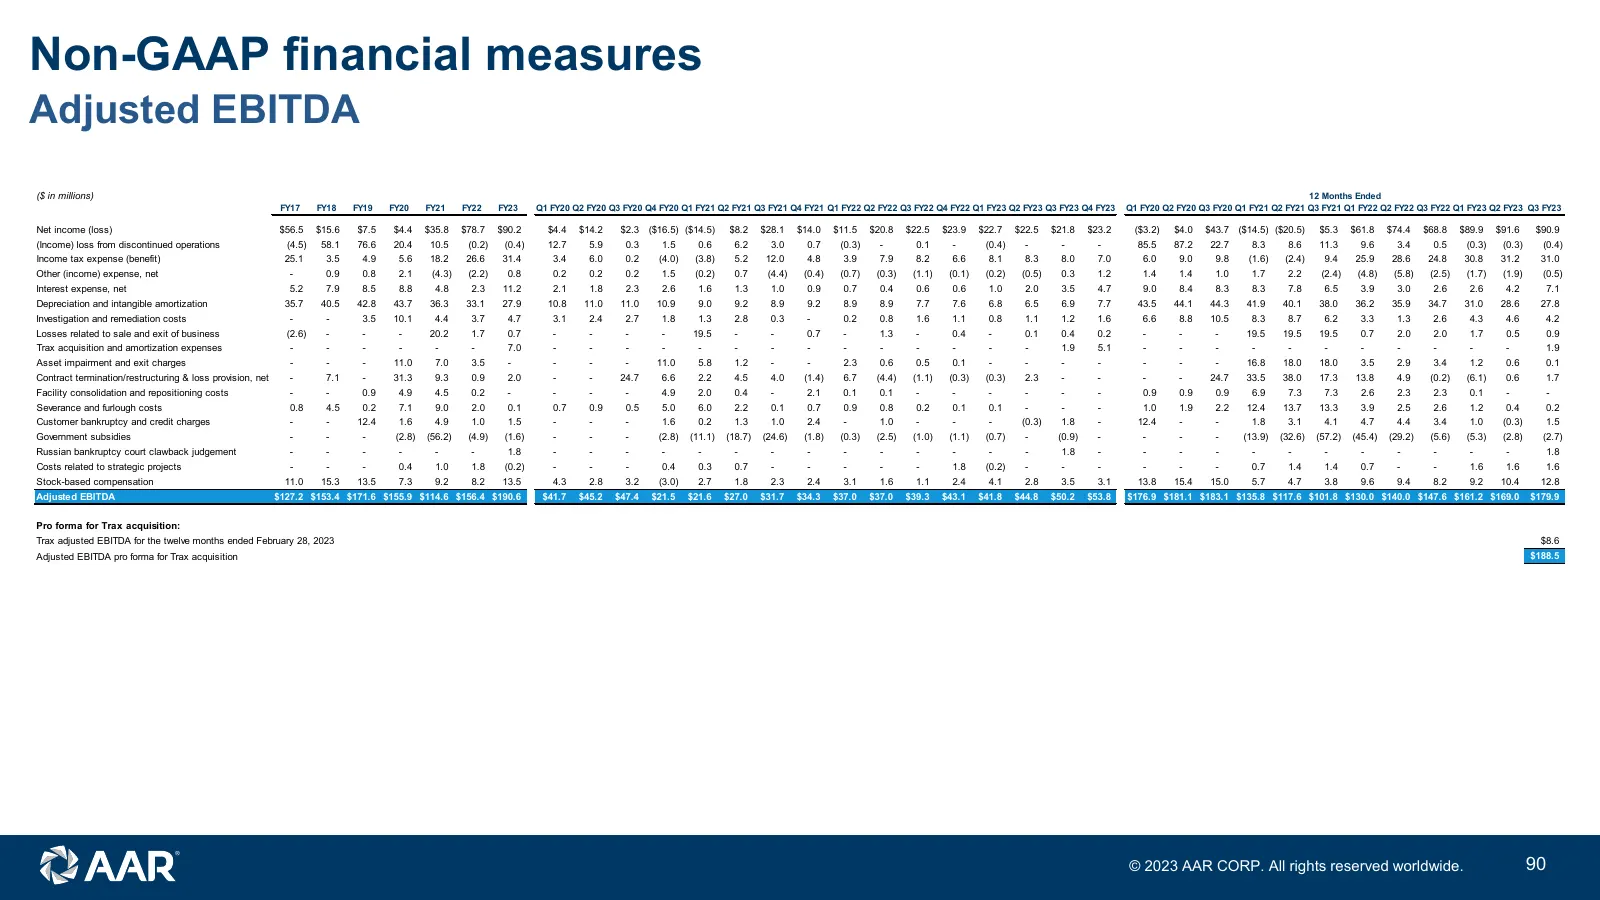
Non-GAAP financial measures Adjusted EBITDA ($ in millions) 12 Months Ended FY17 FY18 FY19 FY20 FY21 FY22 FY23 Q1 FY20 Q2 FY20 Q3 FY20 Q4 FY20 Q1 FY21 Q2 FY21 Q3 FY21 Q4 FY21 Q1 FY22 Q2 FY22 Q3 FY22 Q4 FY22 Q1 FY23 Q2 FY23 Q3 FY23 Q4 FY23 Q1 FY20 Q2 FY20 Q3 FY20 Q1 FY21 Q2 FY21 Q3 FY21 Q1 FY22 Q2 FY
Slide 91: Non-GAAP financial measures
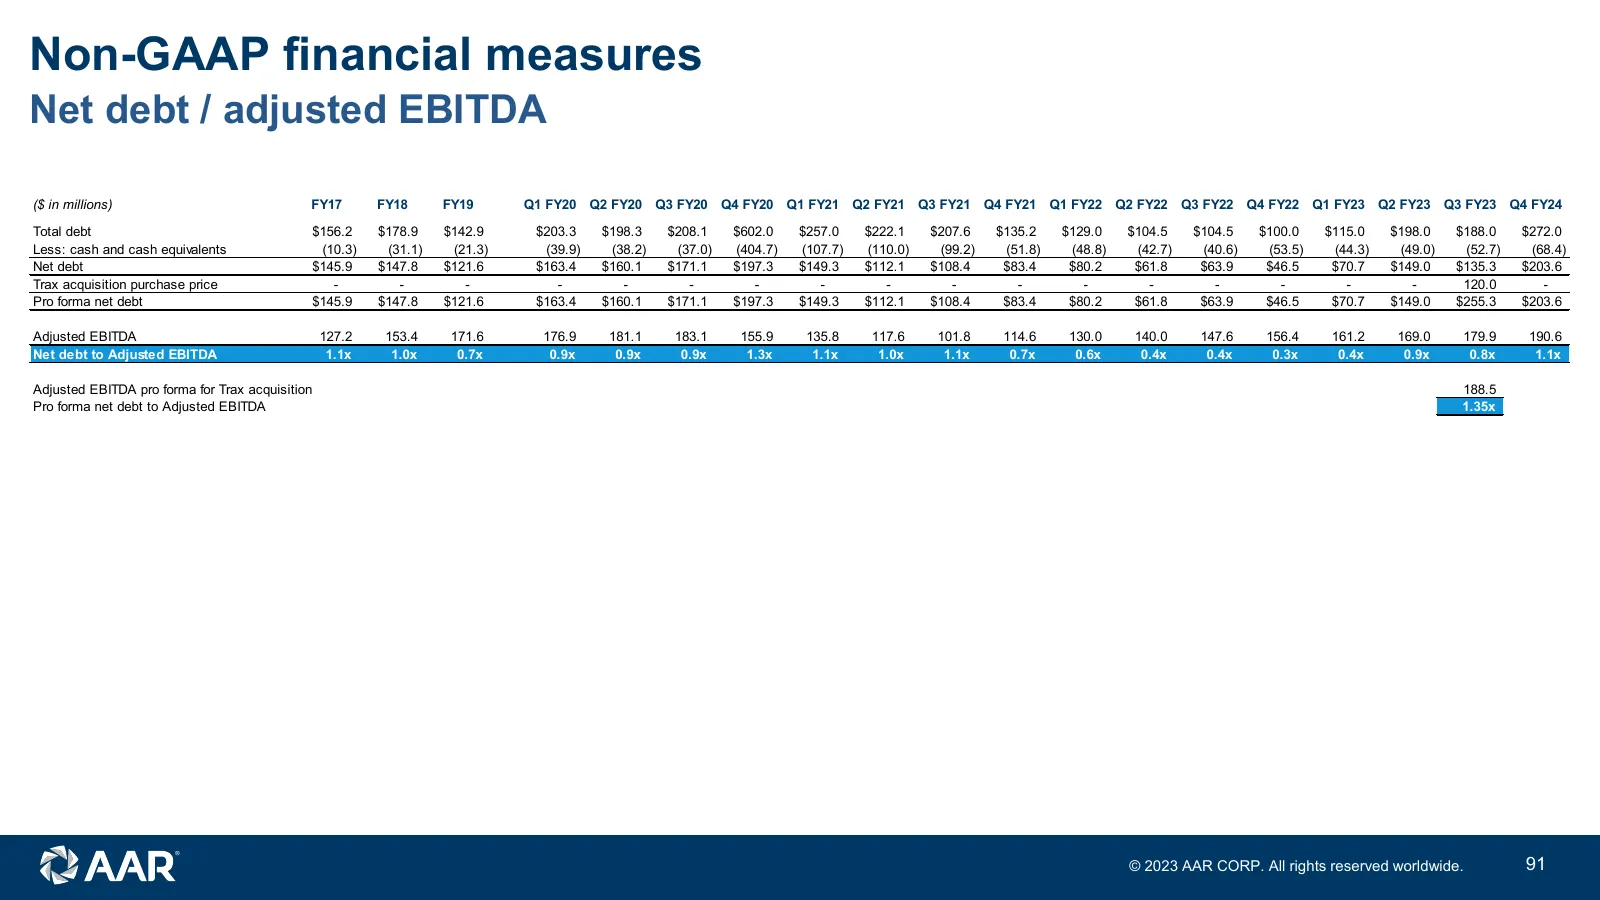
Non-GAAP financial measures Net debt / adjusted EBITDA ($ in millions) FY17 FY18 FY19 Q1 FY20 Q2 FY20 Q3 FY20 Q4 FY20 Q1 FY21 Q2 FY21 Q3 FY21 Q4 FY21 Q1 FY22 Q2 FY22 Q3 FY22 Q4 FY22 Q1 FY23 Q2 FY23 Q3 FY23 Q4 FY24 Total debt $156.2 $178.9 $142.9 $203.3 $198.3 $208.1 $602.0 $257.0 $222.1 $207.6 $135.
Slide 92: Non-GAAP financial measures
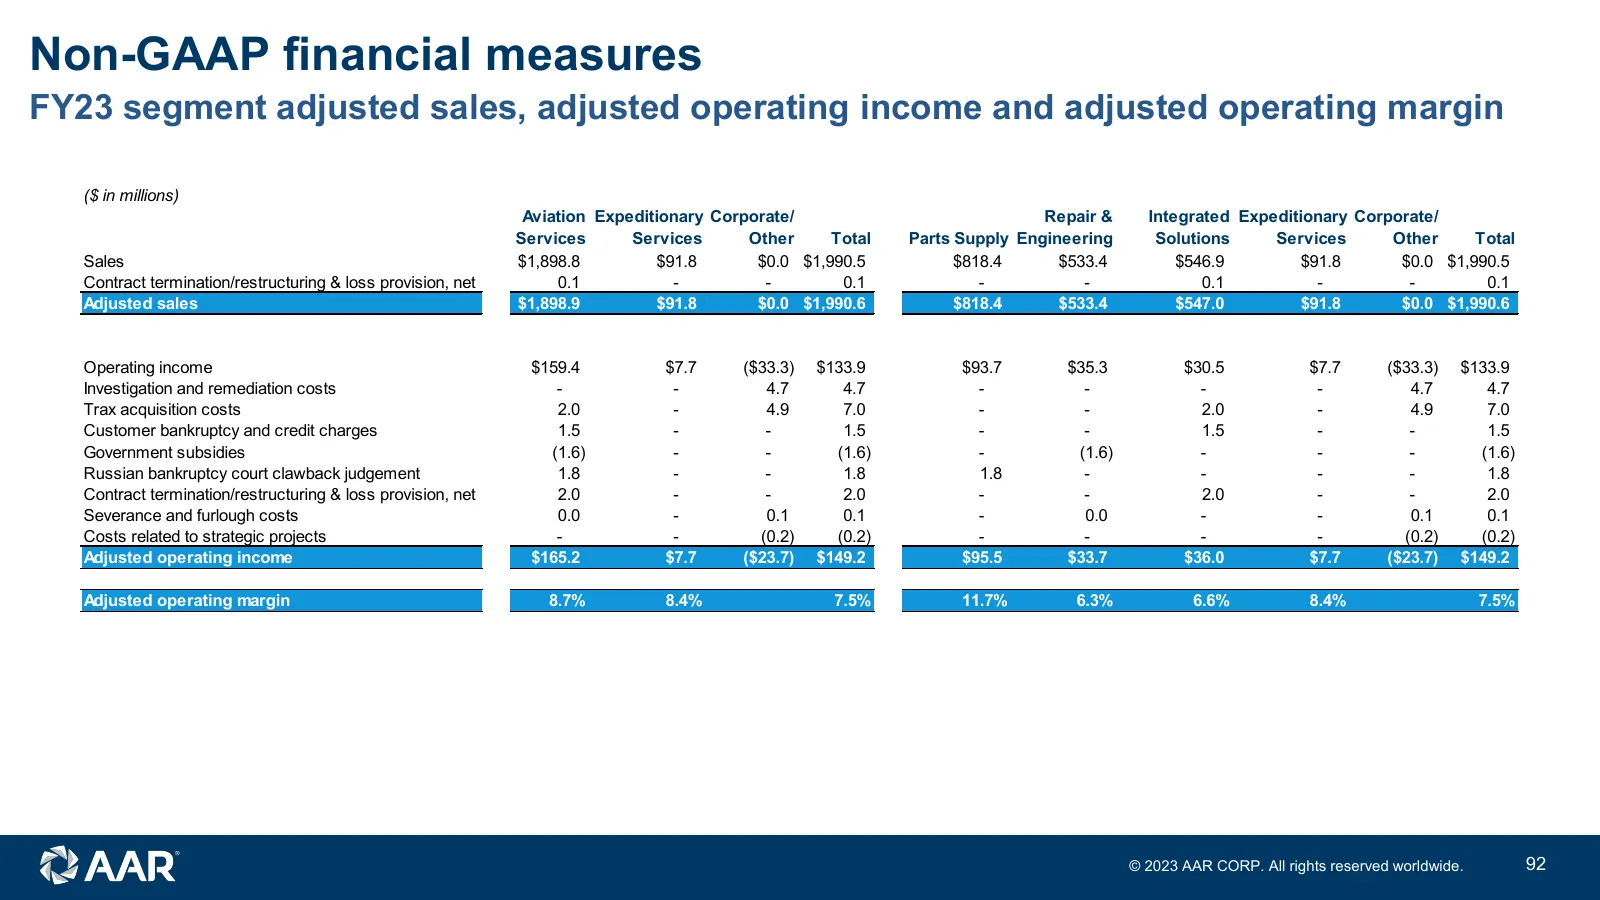
Non-GAAP financial measures FY23 segment adjusted sales, adjusted operating income and adjusted operating margin ($ in millions) Aviation Expeditionary Corporate/ Repair & Integrated Expeditionary Corporate/ Services Services Other Total Parts Supply Engineering Solutions Services Other Total Sales
Source: Internet Archive copy of aarcorp.com
More decks from AAR Corp.
 Merger or Acquisition (October 2026)48 slides · October 2026
 Q1 2027 Earnings Presentation22 slides · Sep 29, 2026
 Proxy Contest (August 2026)18 slides · Aug 10, 2026
 Q4 FY2026 Earnings Presentation21 slides · Jul 21, 2026
 Investor Day (May 2026)119 slides · May 12, 2026
 Investor Presentation (May 2026)17 slides · May 6, 2026