Capstar Financial Holdings Inc
Capstar Financial — Investor Presentation (November 2017)
35 slides from Capstar Financial's investor presentation, Nov 17, 2017

Slide 1: Investor Presentation November 2017
Nasdaq: CSTR Investor Presentation November 2017 Claire W. Tucker, President and Chief Executive Officer Rob Anderson, Chief Financial Officer and Chief Administrative Officer Exhibit 99.1
Slide 2: Terminology, Market Data and Non-GAAP Disclaimer
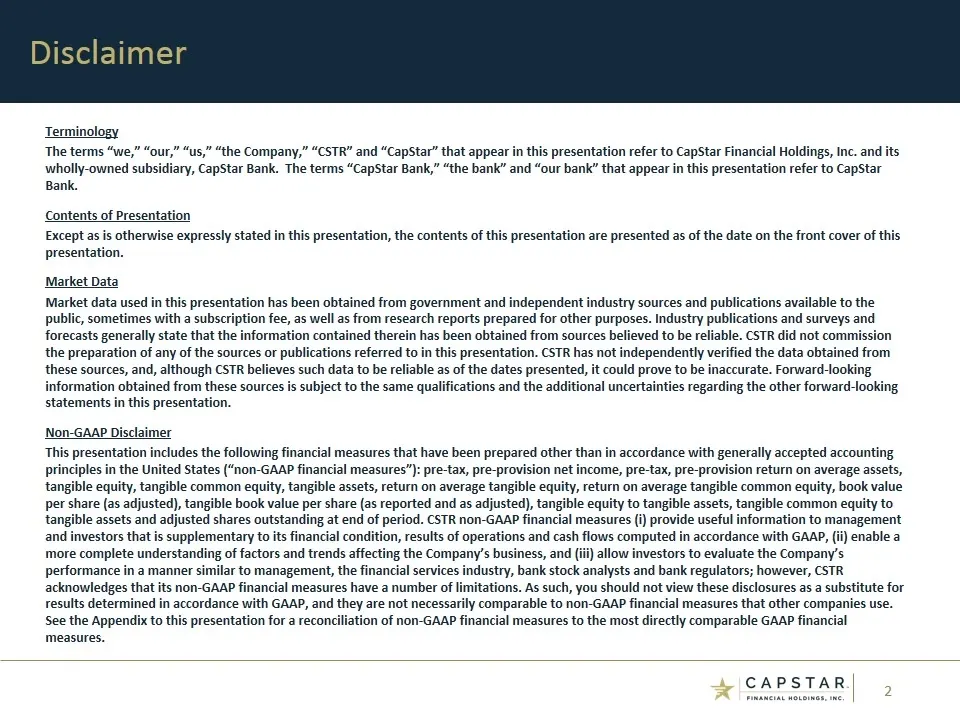
Terminology The terms “we,” “our,” “us,” “the Company,” “CSTR” and “CapStar” that appear in this presentation refer to CapStar Financial Holdings, Inc. and its wholly-owned subsidiary, CapStar Bank. The terms “CapStar Bank,” “the bank” and “our bank” that appear in this presentation refer to CapStar
Slide 3: Forward-Looking Statements
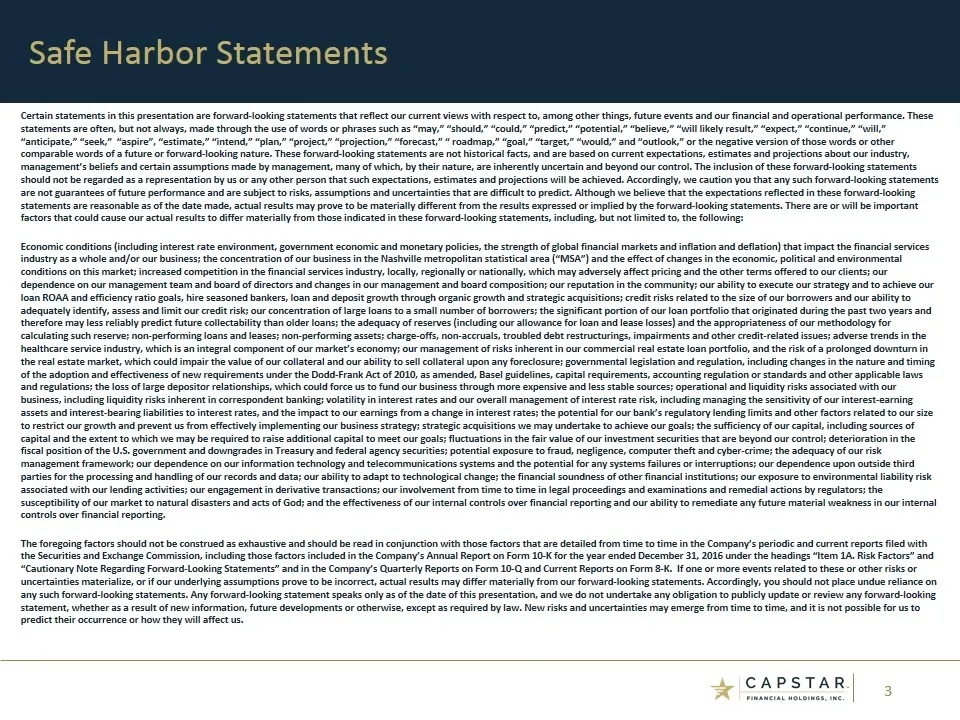
Certain statements in this presentation are forward-looking statements that reflect our current views with respect to, among other things, future events and our financial and operational performance. These statements are often, but not always, made through the use of words or phrases such as “may,”
Slide 4: Overview of CapStar Financial Holdings, Inc.
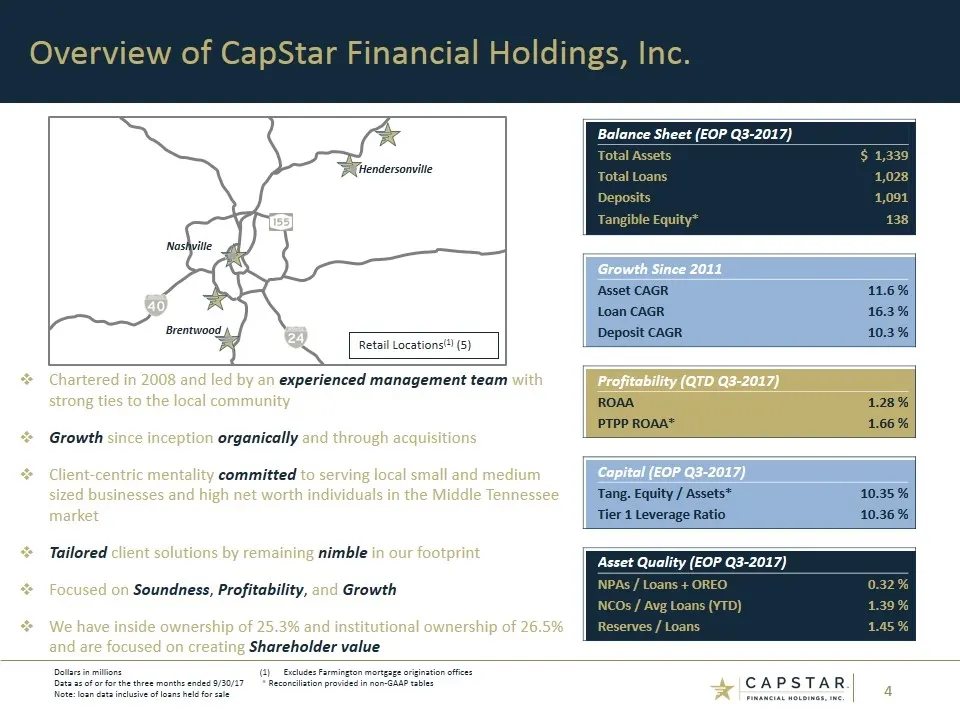
Overview of CapStar Financial Holdings, Inc. Chartered in 2008 and led by an experienced management team with strong ties to the local community Growth since inception organically and through acquisitions Client-centric mentality committed to serving local small and medium sized businesses and high
Slide 5: Our Growth has Predominantly Been Organic
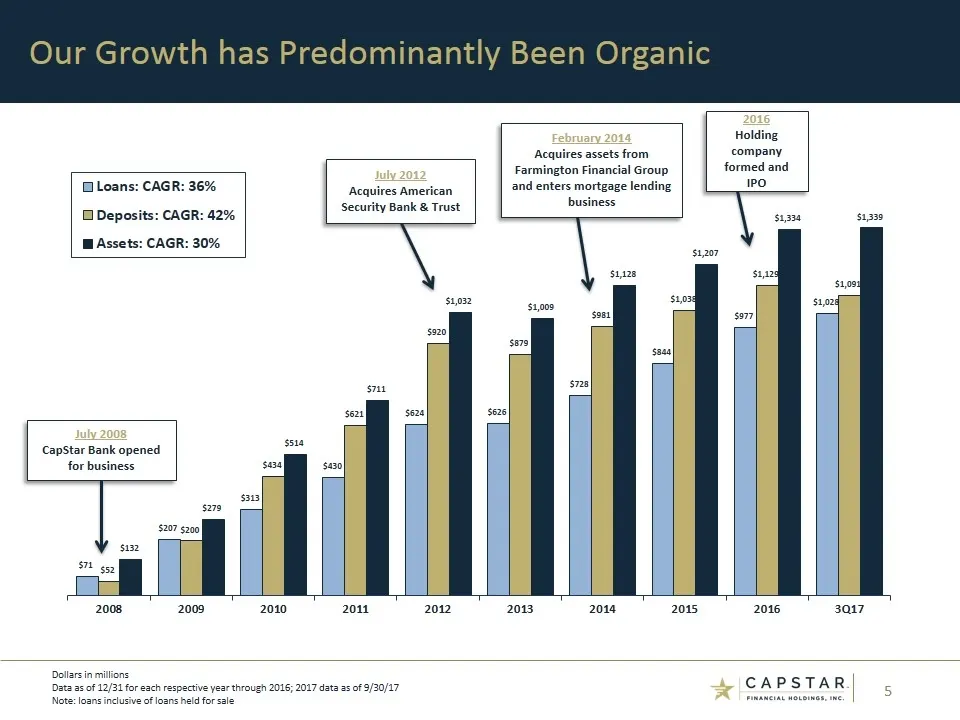
Our Growth has Predominantly Been Organic Dollars in millions Data as of 12/31 for each respective year through 2016; 2017 data as of 9/30/17 Note: loans inclusive of loans held for sale July 2008 CapStar Bank opened for business July 2012 Acquires American Security Bank & Trust February 2014 Acquir
Slide 6: Nashville Deposit Market Share
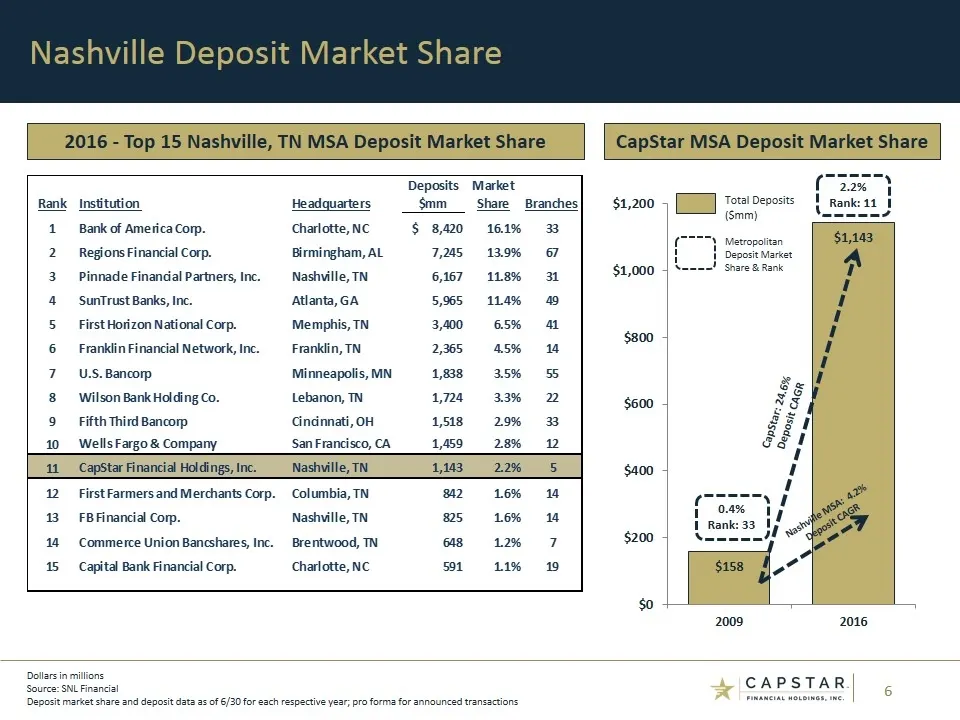
Nashville Deposit Market Share Dollars in millions Source: SNL Financial Deposit market share and deposit data as of 6/30 for each respective year; pro forma for announced transactions 2016 - Top 15 Nashville, TN MSA Deposit Market Share CapStar MSA Deposit Market Share 2.2% Rank: 11 CapStar: 24.6%
Slide 7: Franchise Highlights
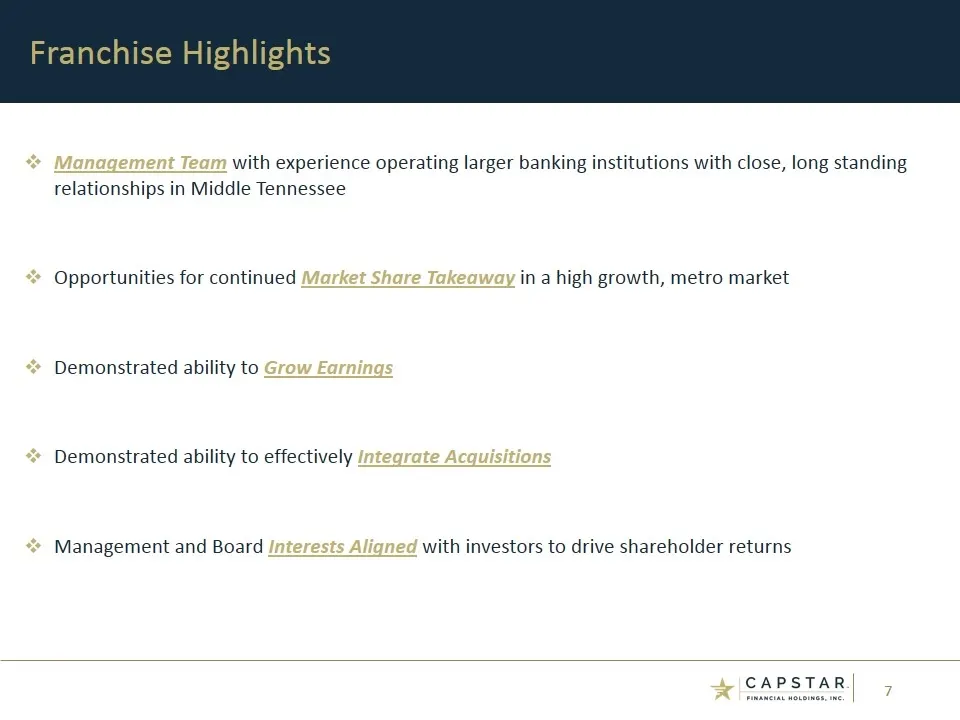
Franchise Highlights Management Team with experience operating larger banking institutions with close, long standing relationships in Middle Tennessee Opportunities for continued Market Share Takeaway in a high growth, metro market Demonstrated ability to Grow Earnings Demonstrated ability to effect
Slide 8: Our Culture
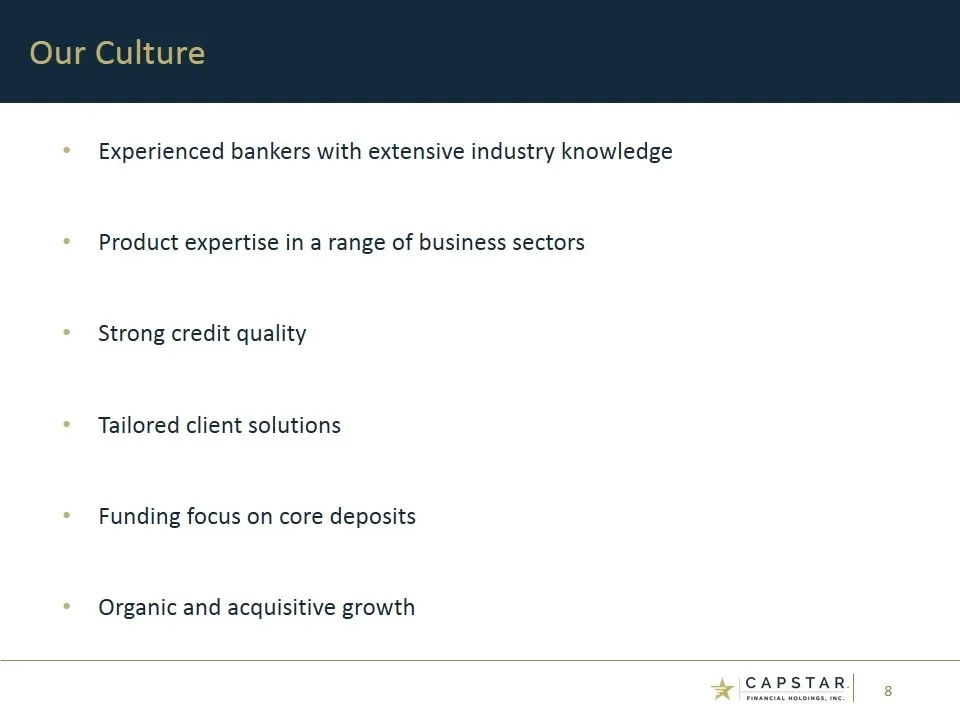
Experienced bankers with extensive industry knowledge Product expertise in a range of business sectors Strong credit quality Tailored client solutions Funding focus on core deposits Organic and acquisitive growth Our Culture
Slide 9: Experienced Management Team
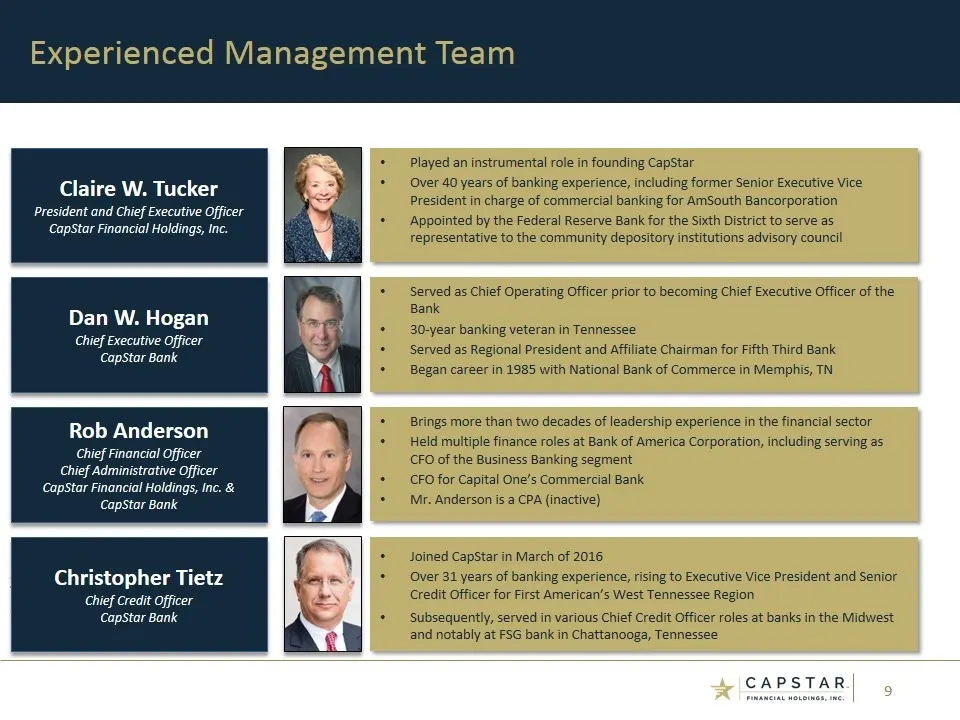
Joined CapStar in March of 2016 Over 31 years of banking experience, rising to Executive Vice President and Senior Credit Officer for First American’s West Tennessee Region Subsequently, served in various Chief Credit Officer roles at banks in the Midwest and notably at FSG bank in Chattanooga, Tenn
Slide 10: Our Board of Directors
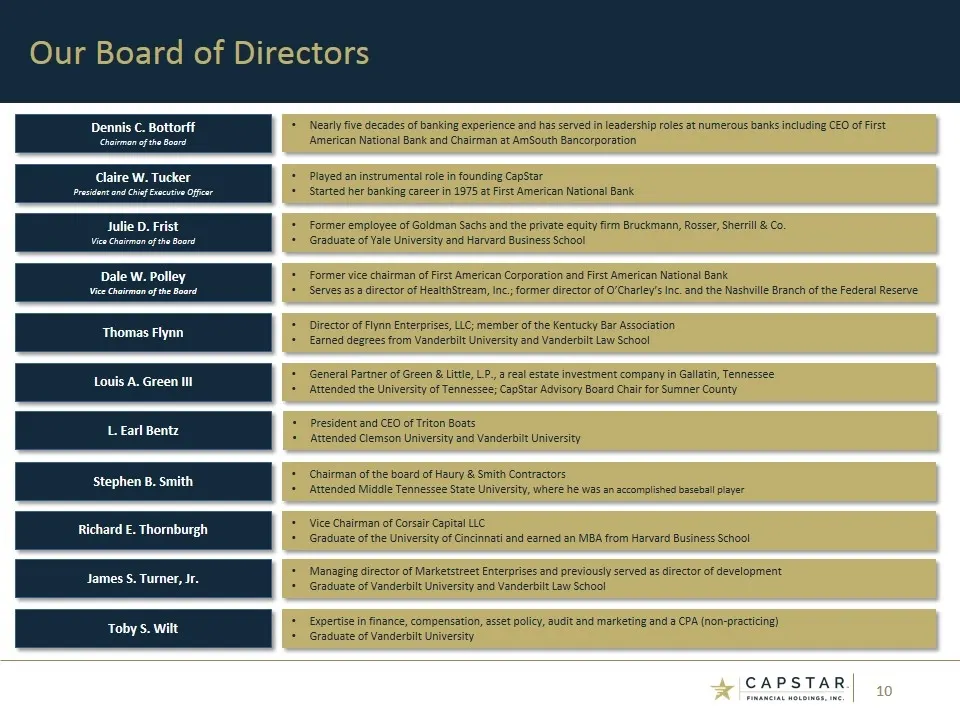
Our Board of Directors Claire W. Tucker President and Chief Executive Officer Played an instrumental role in founding CapStar Started her banking career in 1975 at First American National Bank Dennis C. Bottorff Chairman of the Board Nearly five decades of banking experience and has served in leader
Slide 11: Attractive Market of Operation: Nashville MSA
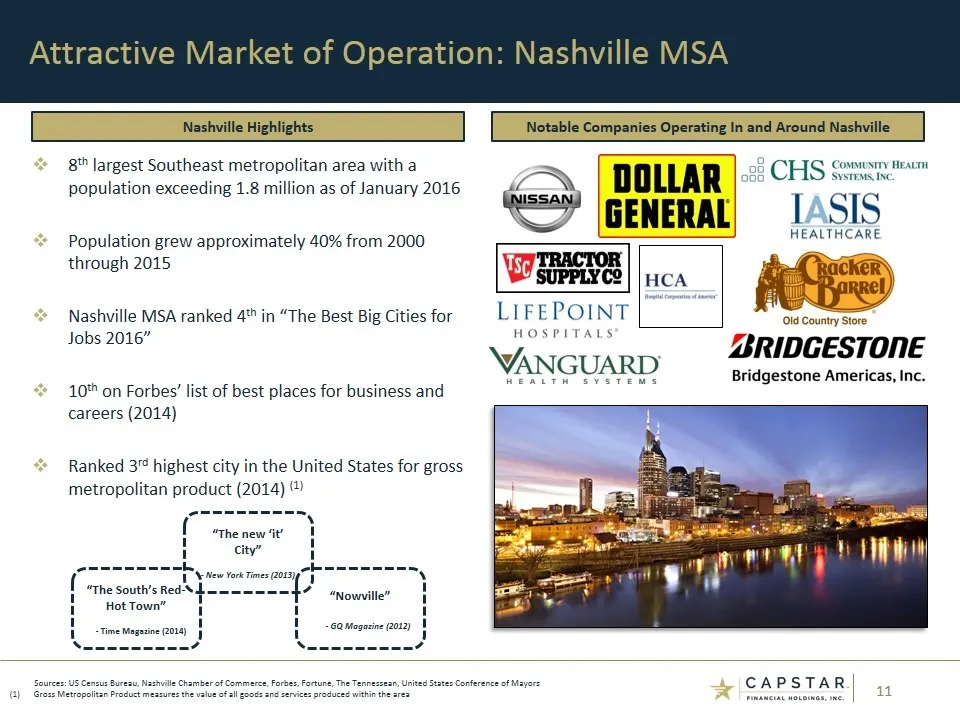
8th largest Southeast metropolitan area with a population exceeding 1.8 million as of January 2016 Population grew approximately 40% from 2000 through 2015 Nashville MSA ranked 4th in “The Best Big Cities for Jobs 2016” 10th on Forbes’ list of best places for business and careers (2014) Ranked 3rd h
Slide 12: Nashville: One of the Southeast's Fastest Growing Markets
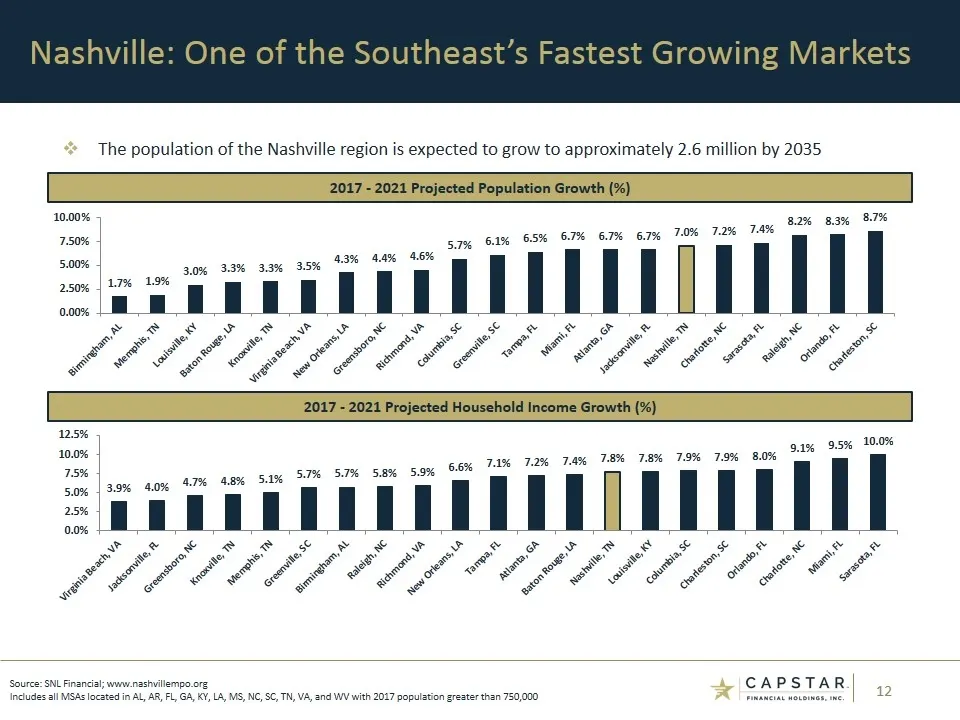
The population of the Nashville region is expected to grow to approximately 2.6 million by 2035 Nashville: One of the Southeast’s Fastest Growing Markets Source: SNL Financial; www.nashvillempo.org Includes all MSAs located in AL, AR, FL, GA, KY, LA, MS, NC, SC, TN, VA, and WV with 2017 population g
Slide 13: Nashville: Regional, National, and Global Business Hub
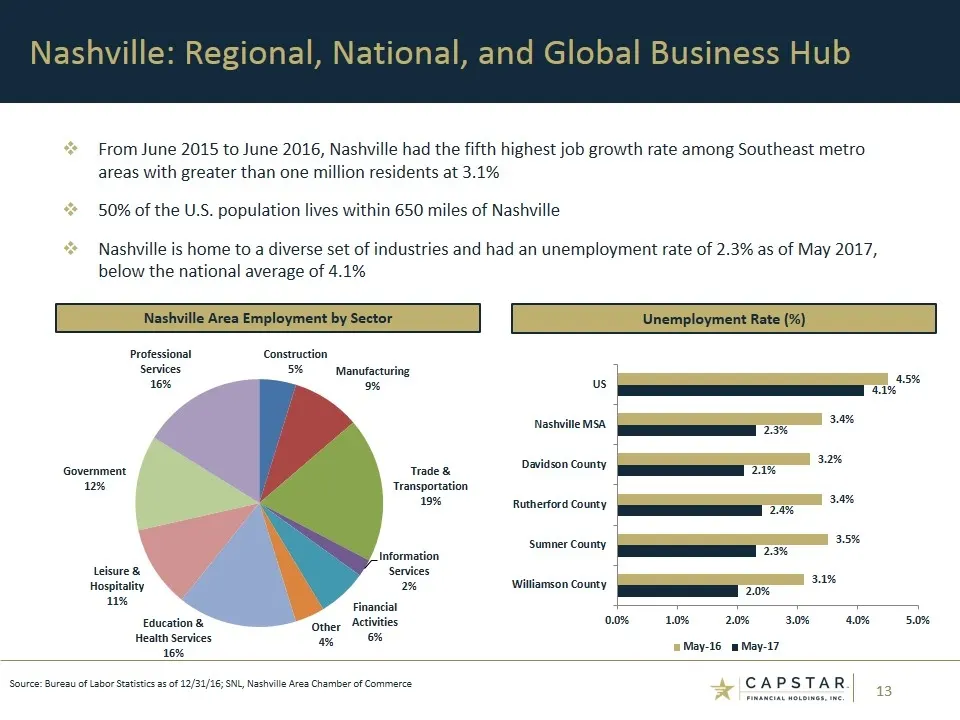
From June 2015 to June 2016, Nashville had the fifth highest job growth rate among Southeast metro areas with greater than one million residents at 3.1% 50% of the U.S. population lives within 650 miles of Nashville Nashville is home to a diverse set of industries and had an unemployment rate of 2.3
Slide 14: Potential Future Nashville Opportunities
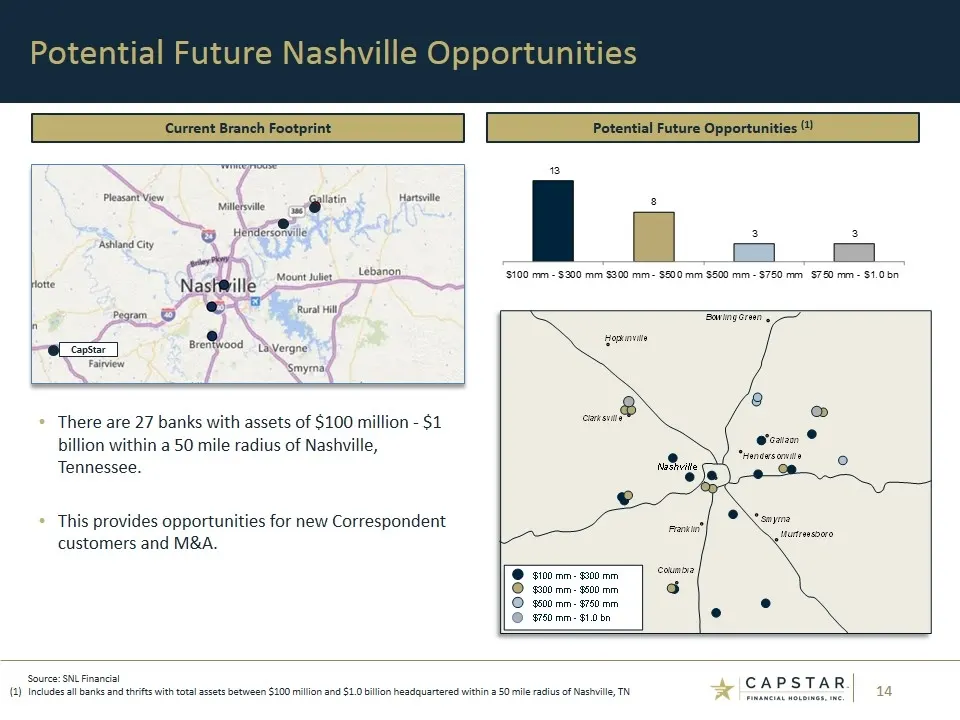
Potential Future Nashville Opportunities Current Branch Footprint Potential Future Opportunities (1) Source: SNL Financial (1)Includes all banks and thrifts with total assets between $100 million and $1.0 billion headquartered within a 50 mile radius of Nashville, TN CapStar There are 27 banks with
Slide 15: Summary Financials 3Q17
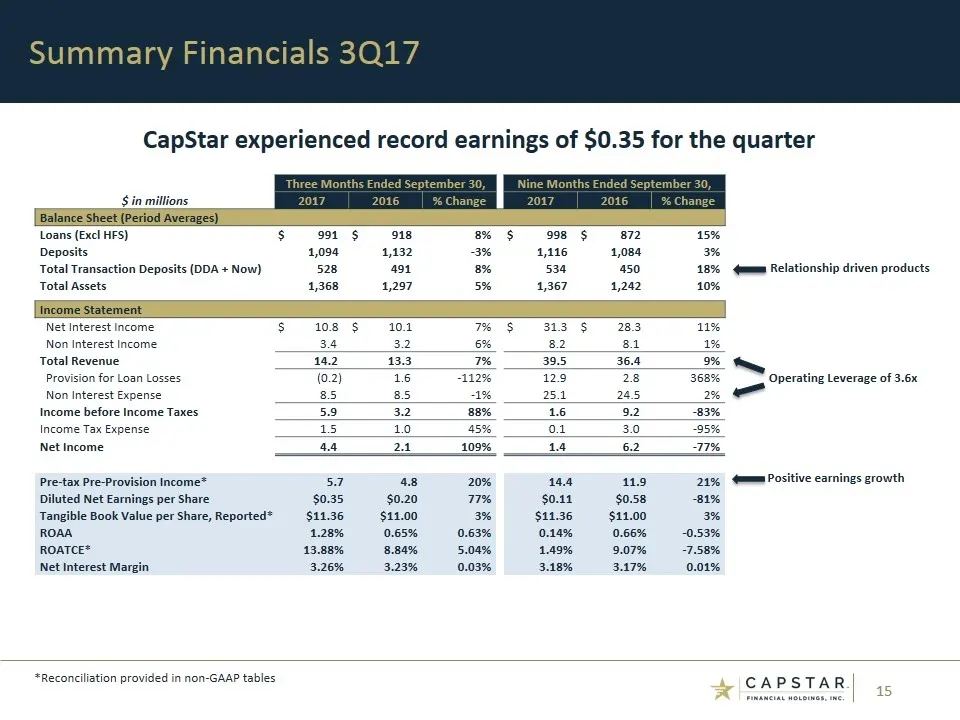
Summary Financials 3Q17 CapStar experienced record earnings of $0.35 for the quarter *Reconciliation provided in non-GAAP tables Relationship driven products Positive earnings growth Operating Leverage of 3.6x Three Months Ended September 30, Nine Months Ended September 30, $ in millions 2017 2016 %
Slide 16: Profitability roadmap: expanding client relationships
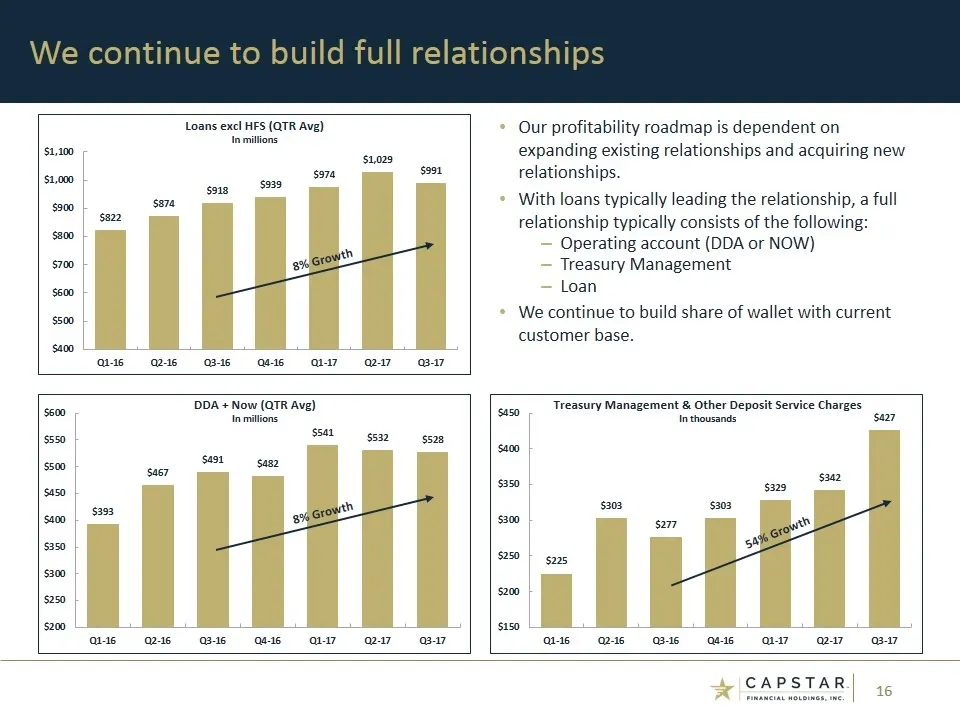
Our profitability roadmap is dependent on expanding existing relationships and acquiring new relationships. With loans typically leading the relationship, a full relationship typically consists of the following: Operating account (DDA or NOW) Treasury Management Loan We continue to build share of wa
Slide 17: Loan Growth
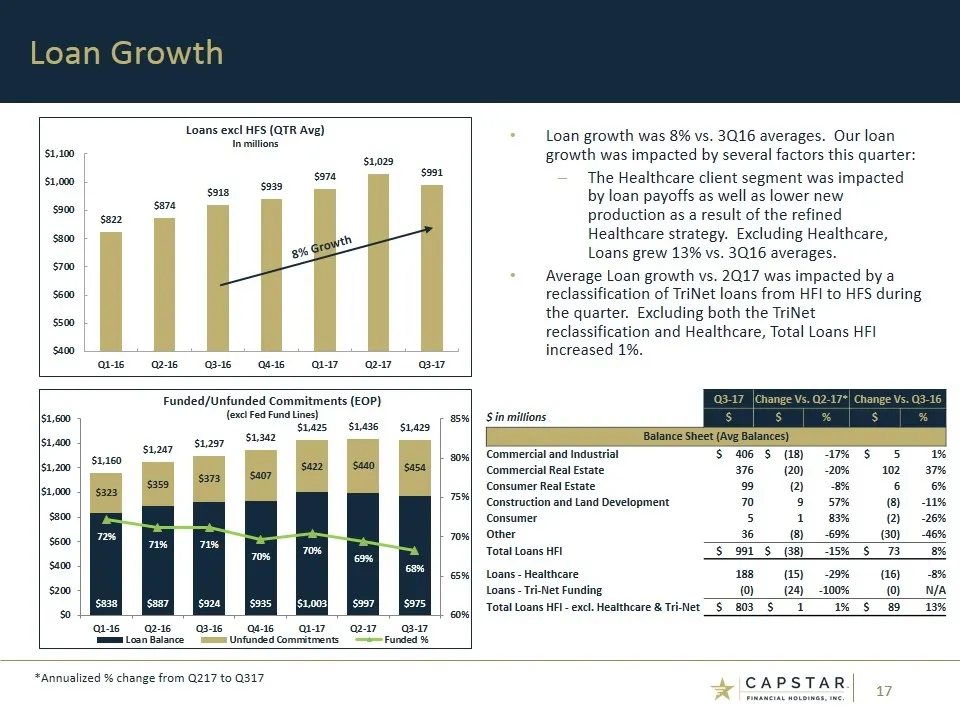
Loan Growth *Annualized % change from Q217 to Q317 Loan growth was 8% vs. 3Q16 averages. Our loan growth was impacted by several factors this quarter: The Healthcare client segment was impacted by loan payoffs as well as lower new production as a result of the refined Healthcare strategy. Excluding
Slide 18: Loan Yields
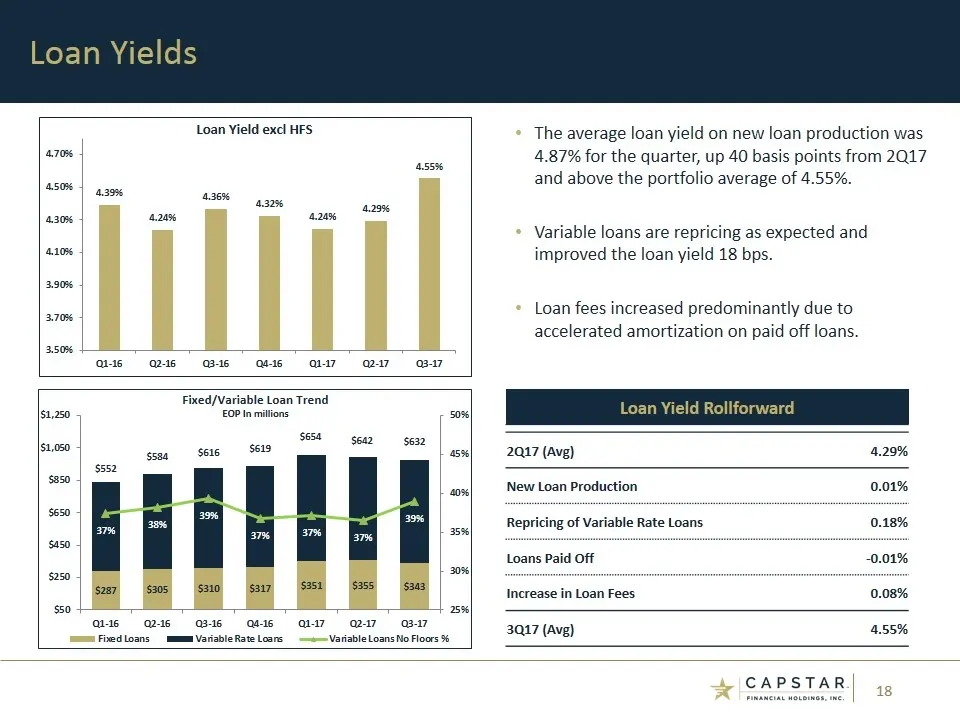
Loan Yields The average loan yield on new loan production was 4.87% for the quarter, up 40 basis points from 2Q17 and above the portfolio average of 4.55%. Variable loans are repricing as expected and improved the loan yield 18 bps. Loan fees increased predominantly due to accelerated amortization o
Slide 19: Deposit Growth and Costs
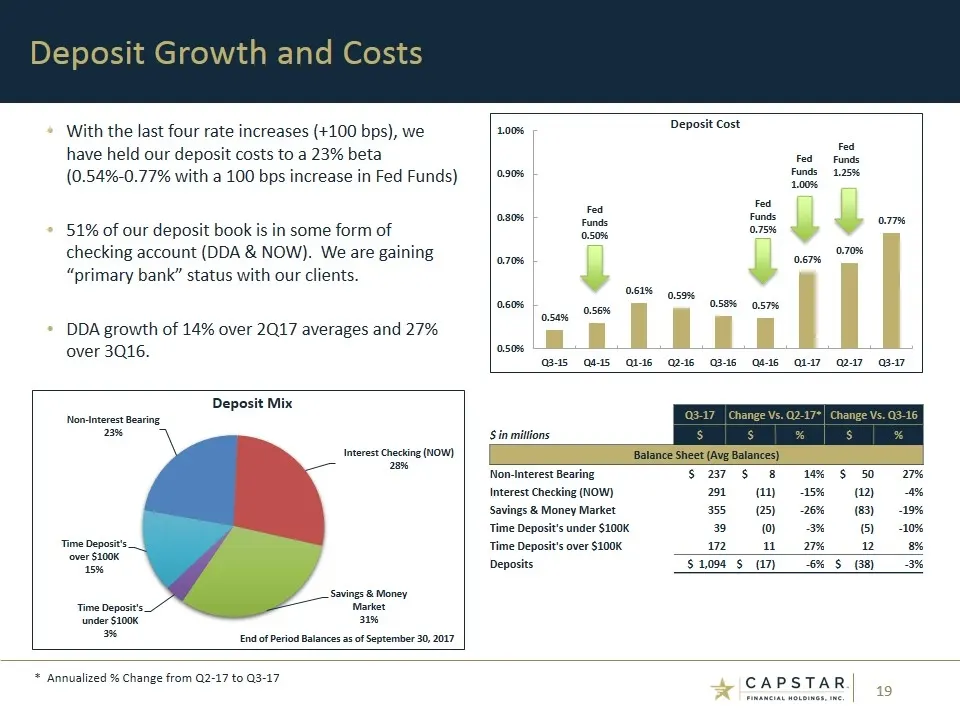
Deposit Growth and Costs * * Annualized % Change from Q2-17 to Q3-17 Fed Funds 0.50% Fed Funds 0.75% Fed Funds 1.00% With the last four rate increases (+100 bps), we have held our deposit costs to a 23% beta (0.54%-0.77% with a 100 bps increase in Fed Funds) 51% of our deposit book is in some form o
Slide 20: Deposit Composition
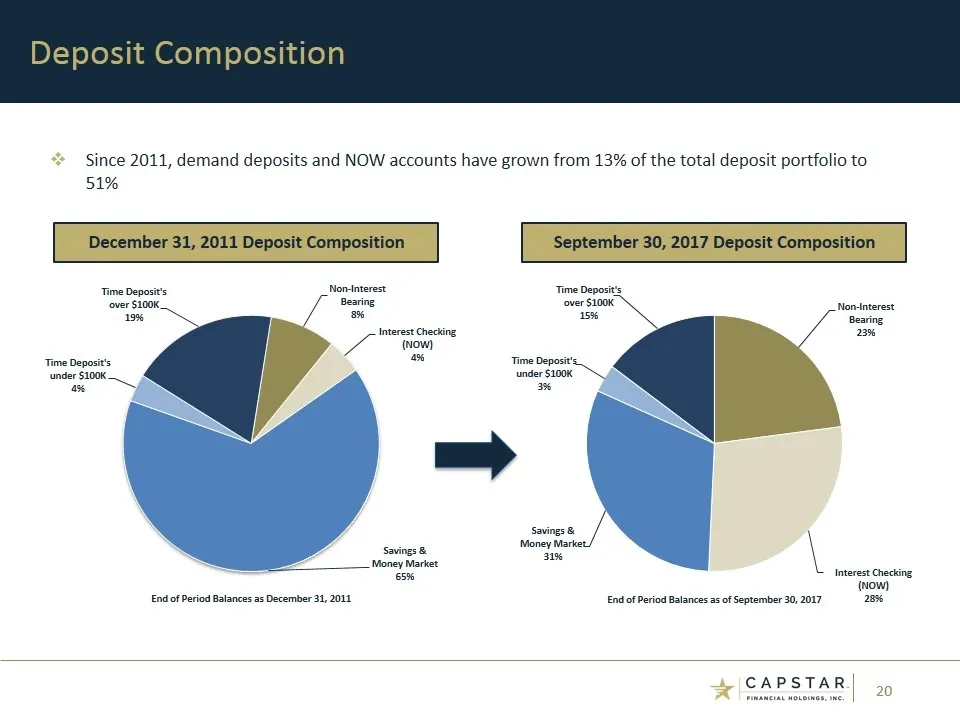
December 31, 2011 Deposit Composition Deposit Composition September 30, 2017 Deposit Composition Since 2011, demand deposits and NOW accounts have grown from 13% of the total deposit portfolio to 51% End of Period Balances as of September 30, 2017 End of Period Balances as December 31, 2011
Slide 21: Net Interest Margin
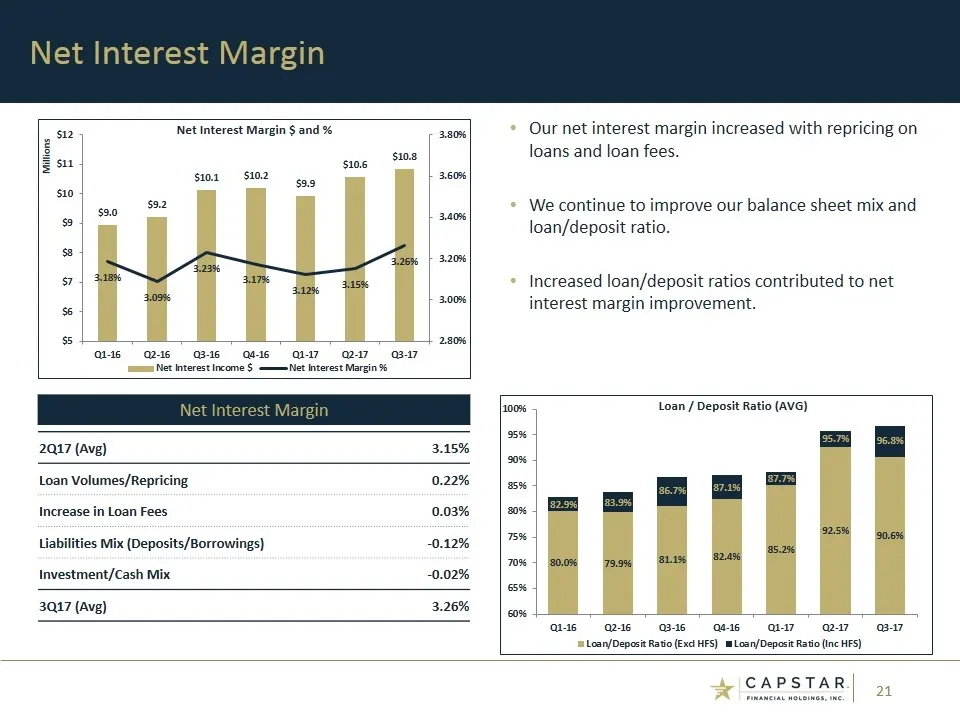
Net Interest Margin Our net interest margin increased with repricing on loans and loan fees. We continue to improve our balance sheet mix and loan/deposit ratio. Increased loan/deposit ratios contributed to net interest margin improvement. Net Interest Margin 2Q17 (Avg) 3.15% Loan Volumes/Repricing
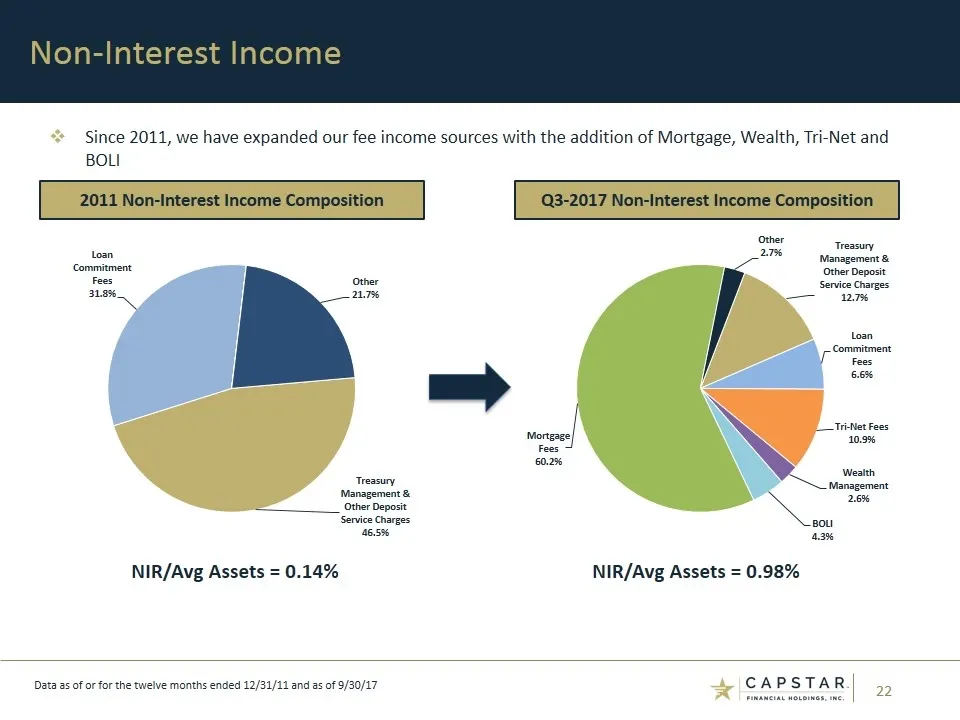
Slide 22: Non-Interest Income
Non-Interest Income 2011 Non-Interest Income Composition Q3-2017 Non-Interest Income Composition Since 2011, we have expanded our fee income sources with the addition of Mortgage, Wealth, Tri-Net and BOLI Data as of or for the twelve months ended 12/31/11 and as of 9/30/17 NIR/Avg Assets = 0.14% NIR
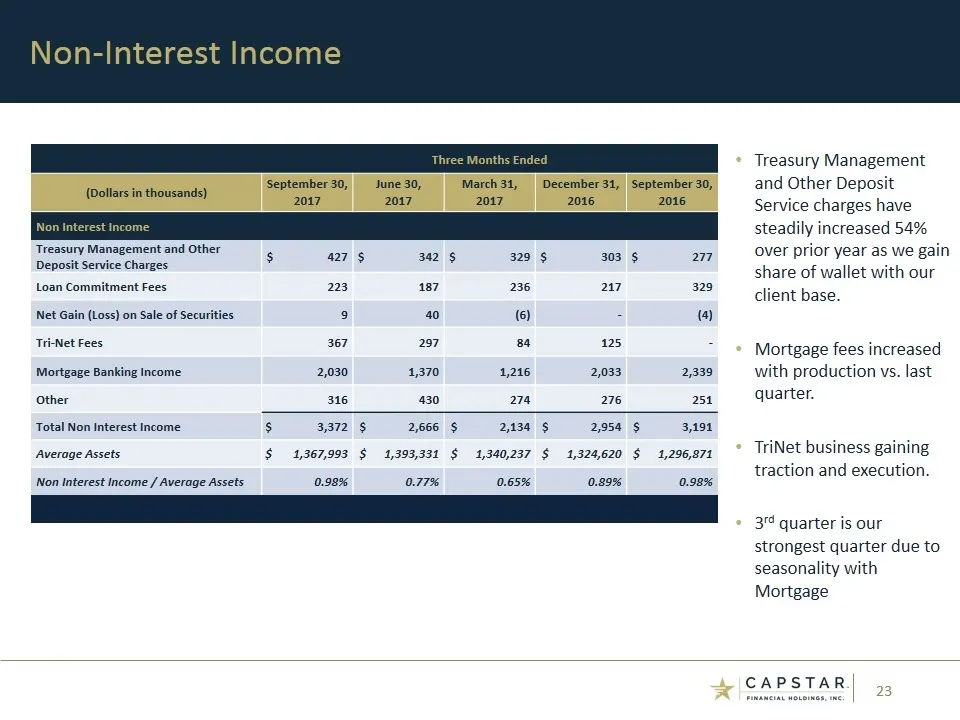
Slide 23: Treasury Management and Other Deposit Service Charges
Treasury Management and Other Deposit Service charges have steadily increased 54% over prior year as we gain share of wallet with our client base. Mortgage fees increased with production vs. last quarter. TriNet business gaining traction and execution. 3rd quarter is our strongest quarter due to sea
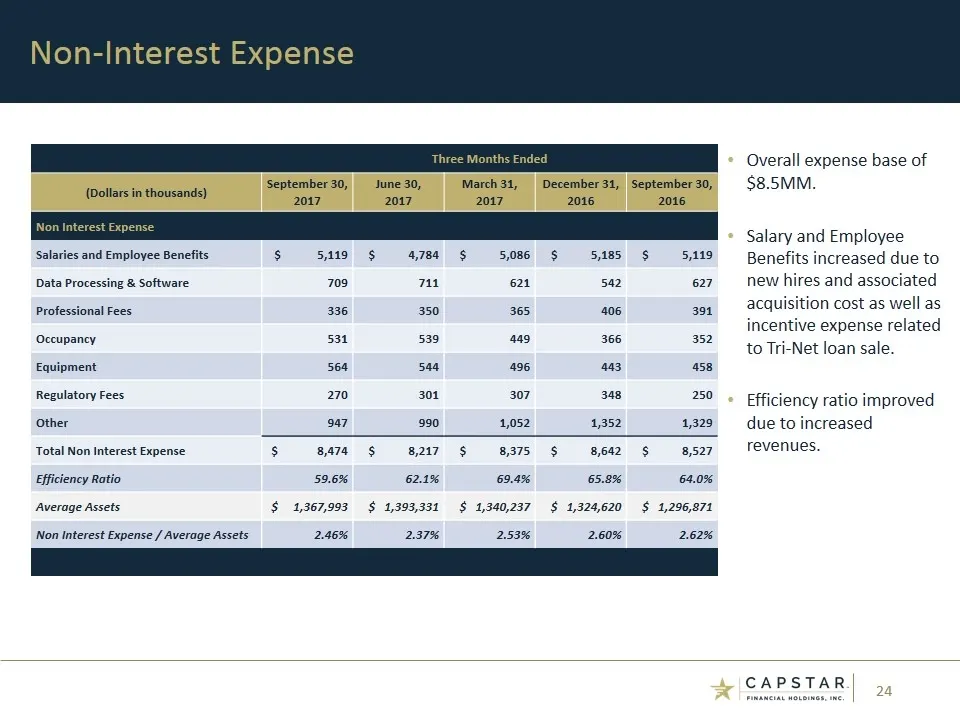
Slide 24: Non-Interest Expense
Non-Interest Expense Overall expense base of $8.5MM. Salary and Employee Benefits increased due to new hires and associated acquisition cost as well as incentive expense related to Tri-Net loan sale. Efficiency ratio improved due to increased revenues. Three Months Ended (Dollars in thousands) Septe
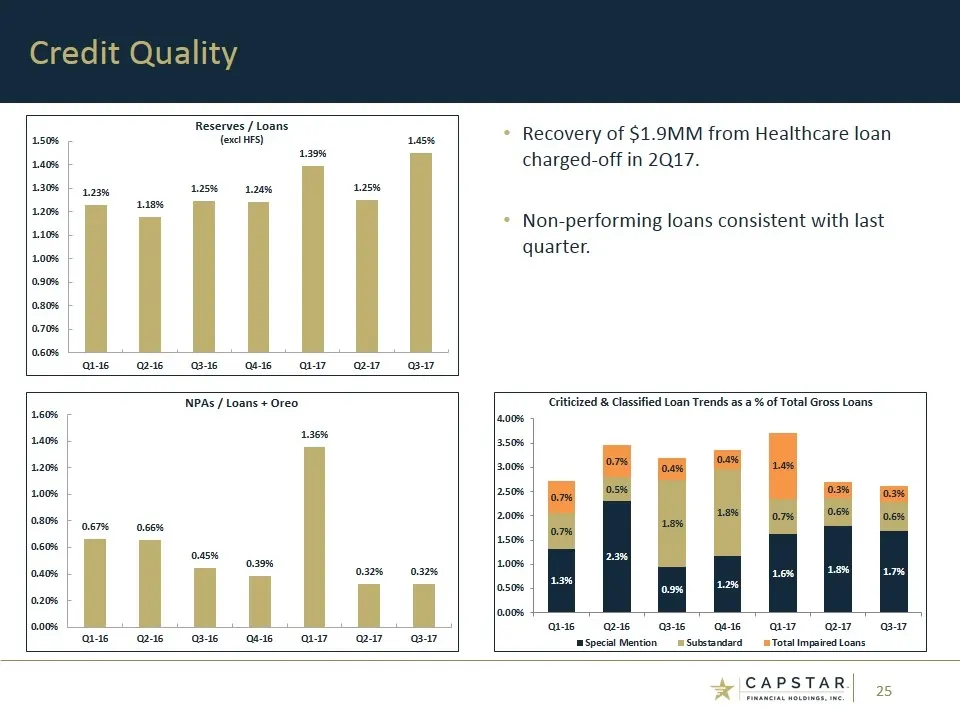
Slide 25: Credit Quality
Credit Quality Recovery of $1.9MM from Healthcare loan charged-off in 2Q17. Non-performing loans consistent with last quarter.
Slide 26: Capital
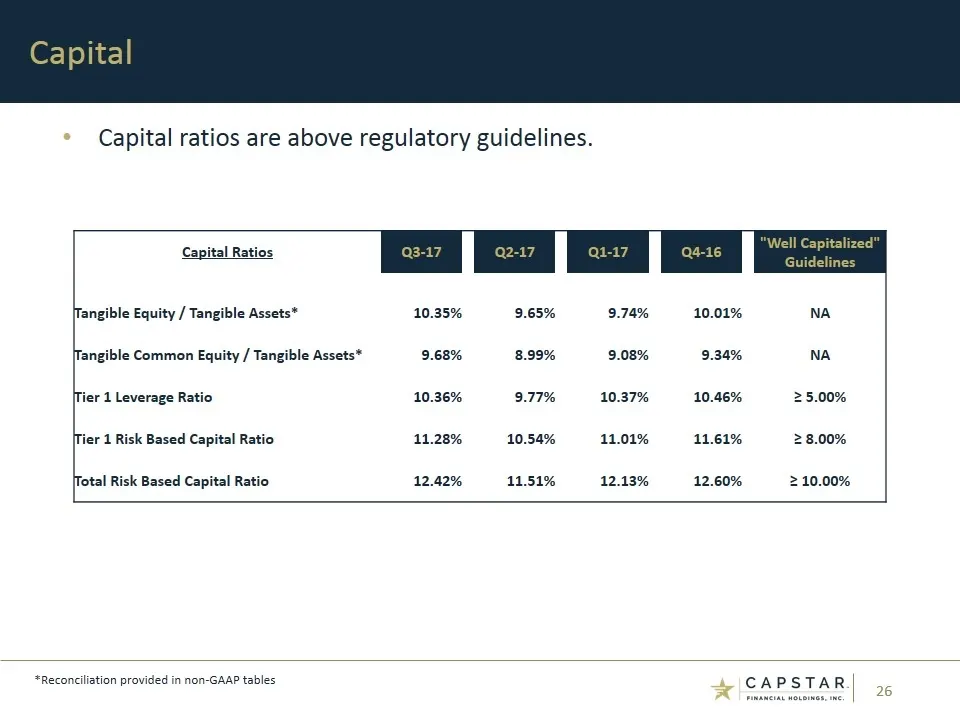
Capital ratios are above regulatory guidelines. Capital *Reconciliation provided in non-GAAP tables Capital Ratios Q3-17 Q2-17 Q1-17 Q4-16 "Well Capitalized" Guidelines Tangible Equity / Tangible Assets* 10.35% 9.65% 9.74% 10.01% NA Tangible Common Equity / Tangible Assets* 9.68% 8.99% 9.08% 9.34% N
Slide 27: Roadmap to 1.00% ROAA
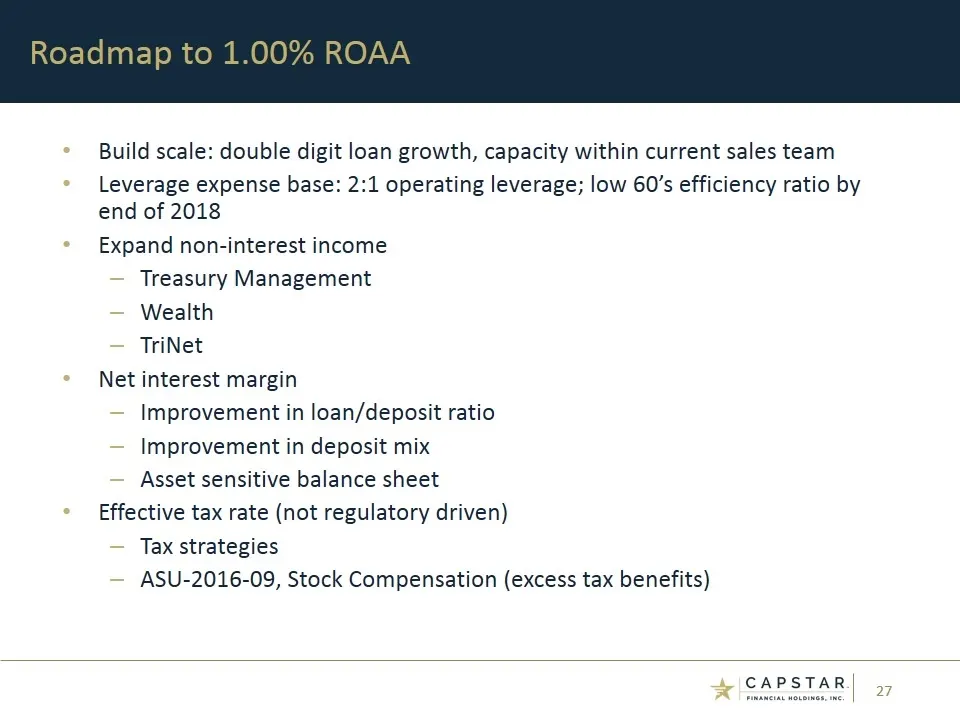
Build scale: double digit loan growth, capacity within current sales team Leverage expense base: 2:1 operating leverage; low 60’s efficiency ratio by end of 2018 Expand non-interest income Treasury Management Wealth TriNet Net interest margin Improvement in loan/deposit ratio Improvement in deposit
Slide 28: Franchise Value
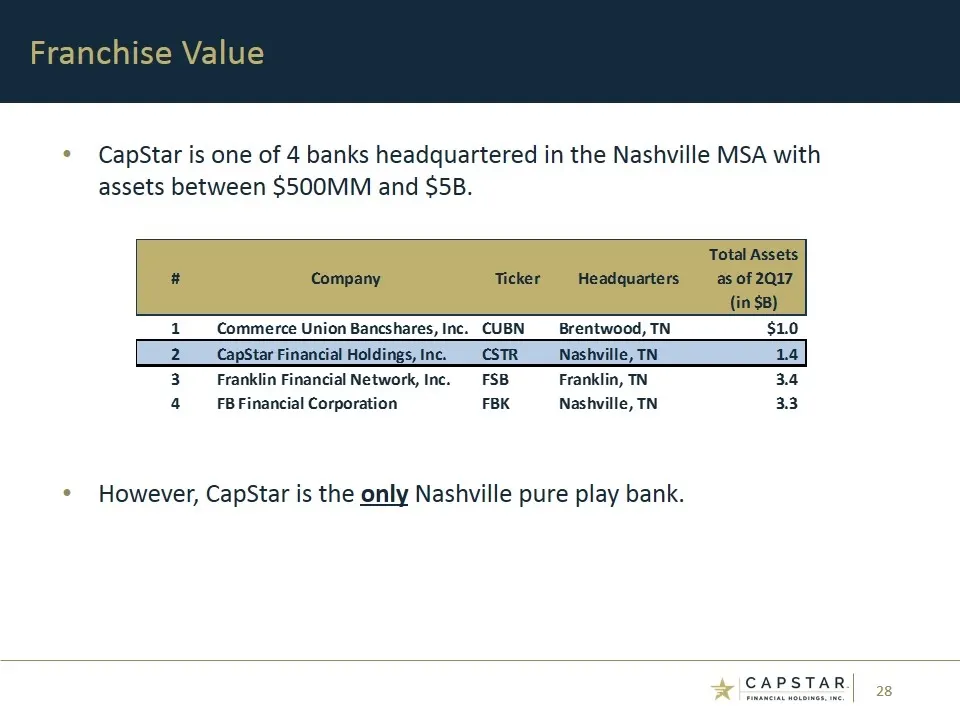
CapStar is one of 4 banks headquartered in the Nashville MSA with assets between $500MM and $5B. However, CapStar is the only Nashville pure play bank. Franchise Value
Slide 29: Contact Information
CapStar Financial Holdings, Inc. 1201 Demonbreun Street, Suite 700 Nashville, TN 37203 Mail: P.O. Box 305065 Nashville, TN 37230-5065 (615) 732-6400 Telephone www.capstarbank.com (615) 732-6455 Email: ir@capstarbank.com Contact Information Investor Relations Executive Leadership Claire W. Tucker Pre
Slide 30: Appendix: Non-GAAP Tables
Appendix: Non-GAAP Tables * CAPSTAR
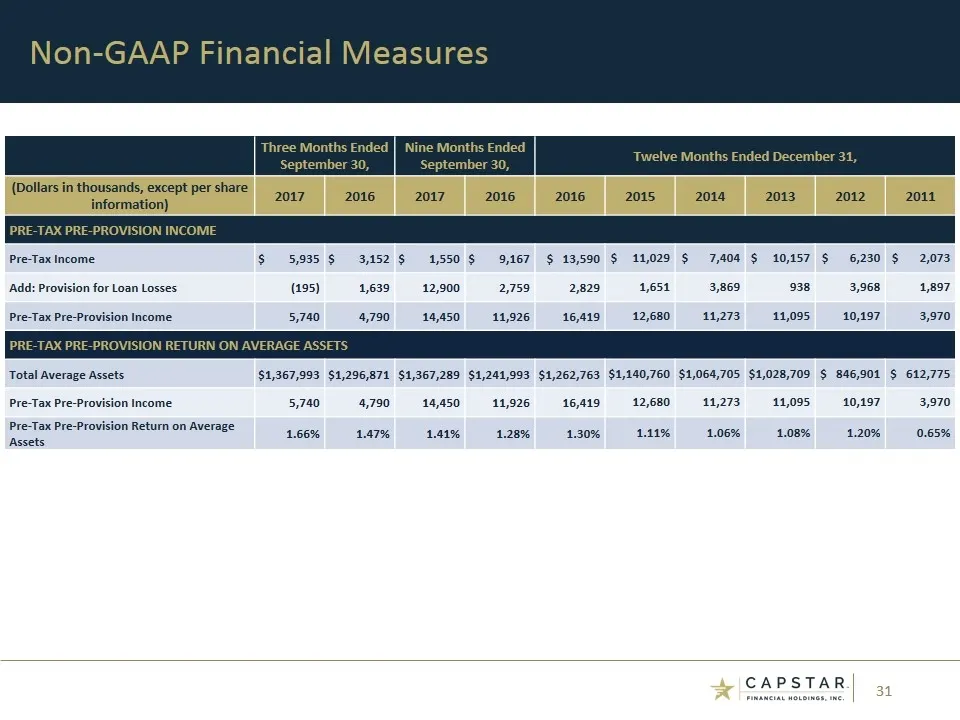
Slide 31: Pre-Tax Pre-Provision Income Reconciliation
Three Months Ended September 30, Nine Months Ended September 30, Twelve Months Ended December 31, (Dollars in thousands, except per share information) 2017 2016 2017 2016 2016 2015 2014 2013 2012 2011 PRE-TAX PRE-PROVISION INCOME Pre-Tax Income $ 5,935 $ 3,152 $ 1,550 $ 9,167 $ 13,590 $ 11,029 $ 7,4
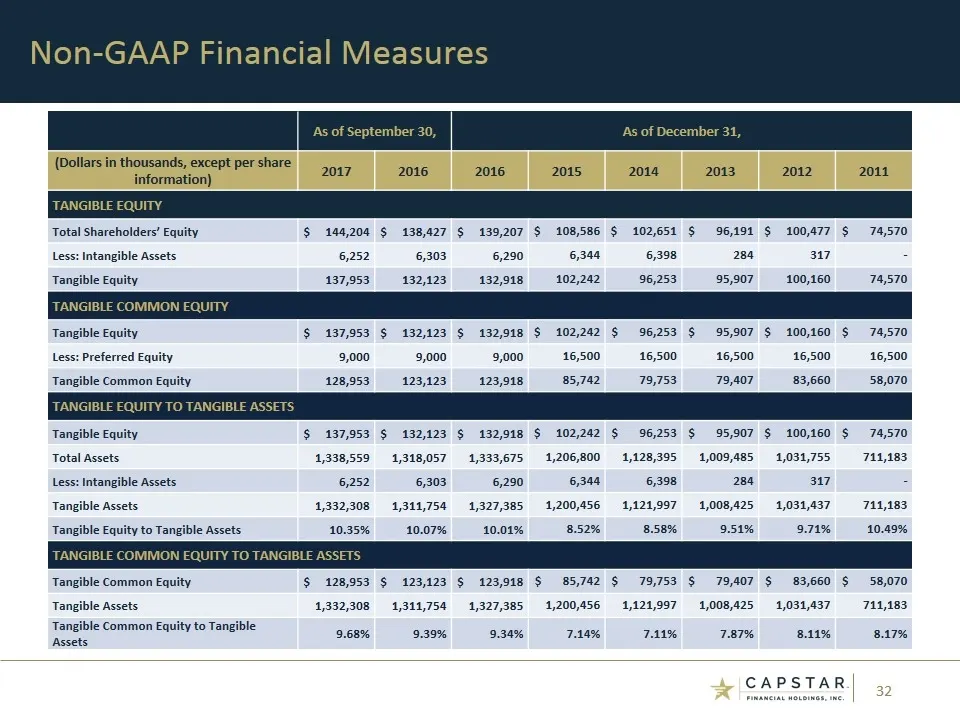
Slide 32: Tangible Equity Reconciliation
As of September 30, As of December 31, (Dollars in thousands, except per share information) 2017 2016 2016 2015 2014 2013 2012 2011 TANGIBLE EQUITY Total Shareholders’ Equity $ 144,204 $ 138,427 $ 139,207 $ 108,586 $ 102,651 $ 96,191 $ 100,477 $ 74,570 Less: Intangible Assets 6,252 6,303 6,290 6,344
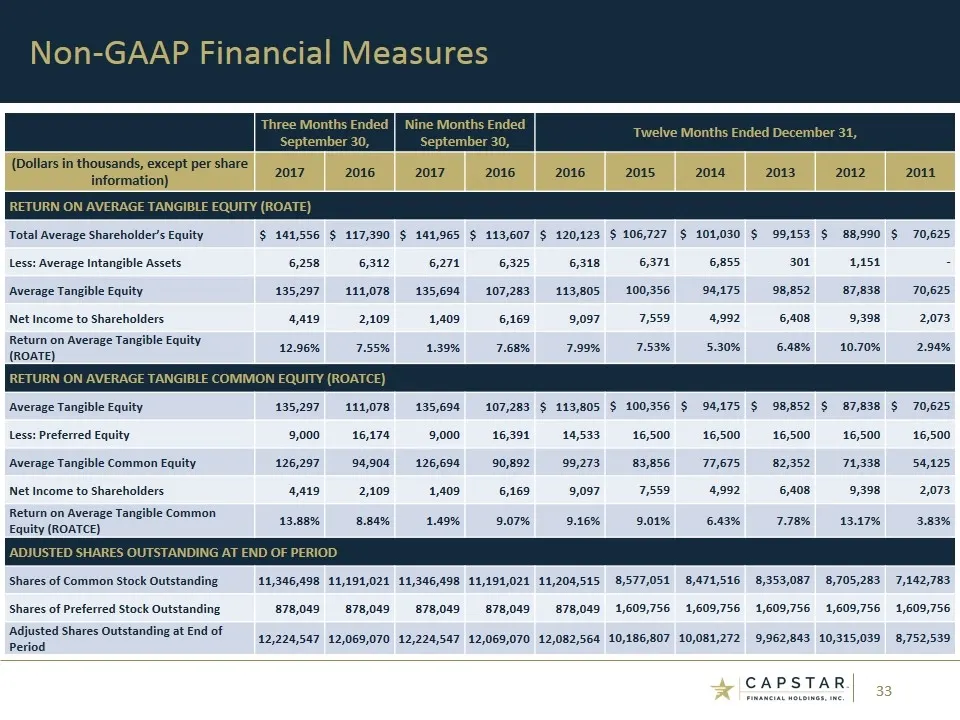
Slide 33: Return on Average Tangible Equity Reconciliation
Three Months Ended September 30, Nine Months Ended September 30, Twelve Months Ended December 31, (Dollars in thousands, except per share information) 2017 2016 2017 2016 2016 2015 2014 2013 2012 2011 RETURN ON AVERAGE TANGIBLE EQUITY (ROATE) Total Average Shareholder’s Equity $ 141,556 $ 117,390 $
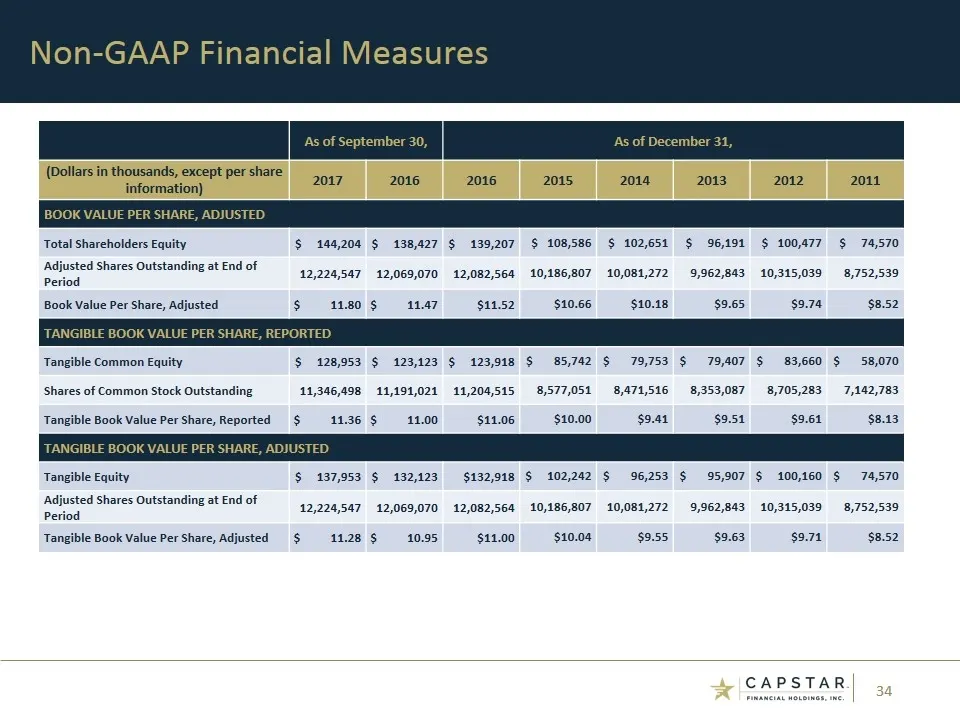
Slide 34: Book Value and Tangible Book Value Per Share
As of September 30, As of December 31, (Dollars in thousands, except per share information) 2017 2016 2016 2015 2014 2013 2012 2011 BOOK VALUE PER SHARE, ADJUSTED Total Shareholders Equity $ 144,204 $ 138,427 $ 139,207 $ 108,586 $ 102,651 $ 96,191 $ 100,477 $ 74,570 Adjusted Shares Outstanding at En

Slide 35: CapStar Financial Holdings, Inc. closing logo
+ CAPSTAR. | FINANCIAL HOLDINGS, INC.
Source: SEC EDGAR · 8-K filed Nov 17, 2017
More decks from Capstar Financial Holdings Inc
 Q4 2023 Earnings Presentation6 slides · Jan 23, 2024
 Merger or Acquisition (October 2023)16 slides · Oct 26, 2023
 Q2 2023 Earnings Presentation22 slides · Jul 21, 2023
 Q1 2023 Earnings Presentation32 slides · Apr 21, 2023
 Q4 2022 Earnings Presentation27 slides · Jan 20, 2023
 Investor Presentation (December 2022)31 slides · Dec 13, 2022