Capstar Financial Holdings Inc
Capstar Financial — Merger or Acquisition (October 2023)
16 slides from Capstar Financial's merger presentation, Oct 26, 2023

Slide 1: To Partner With Expanding Nashville Presence; Positioned for Growth in Attractive Markets
OCTOBER 26, 2023 To Partner With Expanding Nashville Presence; Positioned for Growth in Attractive Markets
Slide 2: Forward Looking Statements
Forward Looking Statements 2 This communication contains “forward-looking statements” within the meaning of the safe harbor provisions of the U.S. Private Securities Litigation Reform Act of 1995, Section 27A of the Securities Act of 1933, as amended, and Section 21E of the Securities Exchange Act o
Slide 3: Transaction Highlights
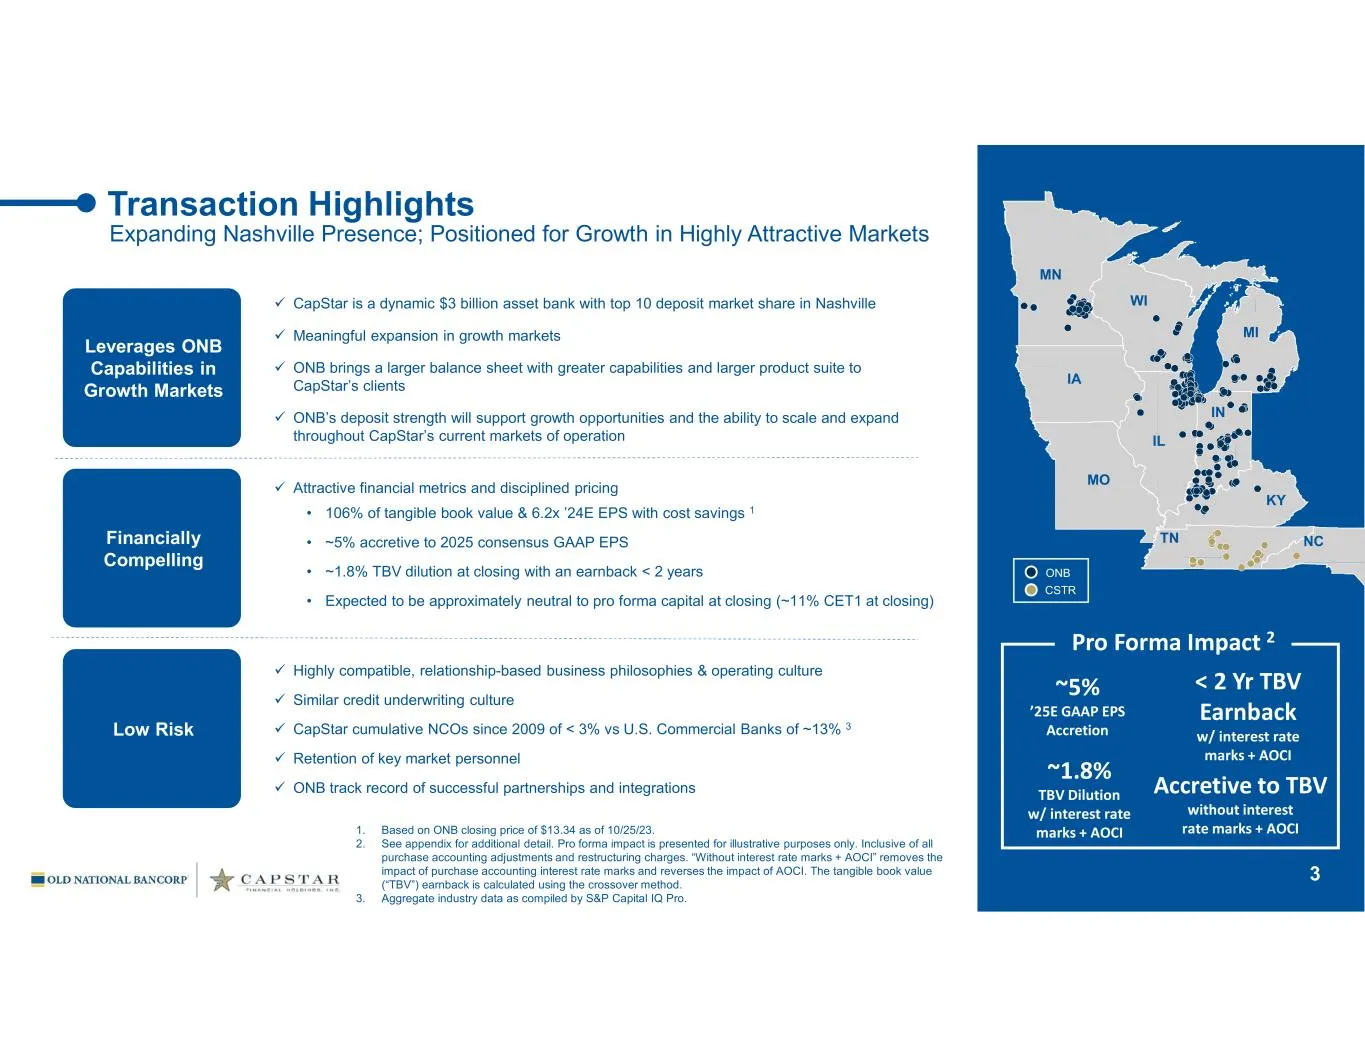
Transaction Highlights CapStar is a dynamic $3 billion asset bank with top 10 deposit market share in Nashville Meaningful expansion in growth markets ONB brings a larger balance sheet with greater capabilities and larger product suite to CapStar’s clients ONB’s deposit strength will support
Slide 4: Overview of CapStar Financial Holdings, Inc.
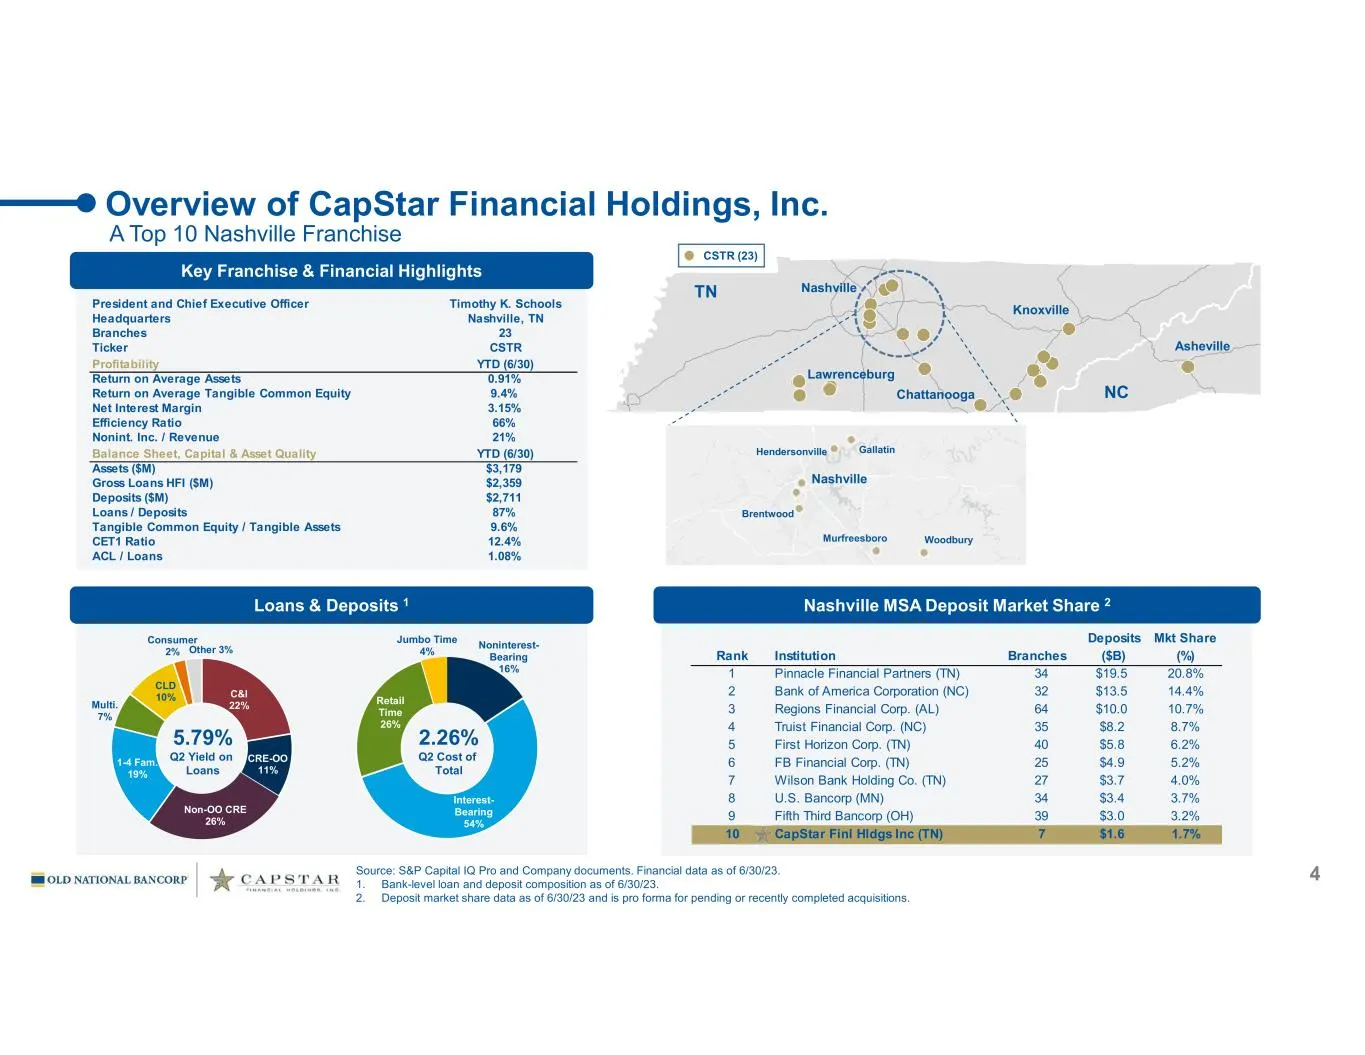
Overview of CapStar Financial Holdings, Inc. Source: S&P Capital IQ Pro and Company documents. Financial data as of 6/30/23. 1. Bank-level loan and deposit composition as of 6/30/23. 2. Deposit market share data as of 6/30/23 and is pro forma for pending or recently completed acquisitions. Key Franc
Slide 5: A Platform for Growth in Highly Attractive Markets
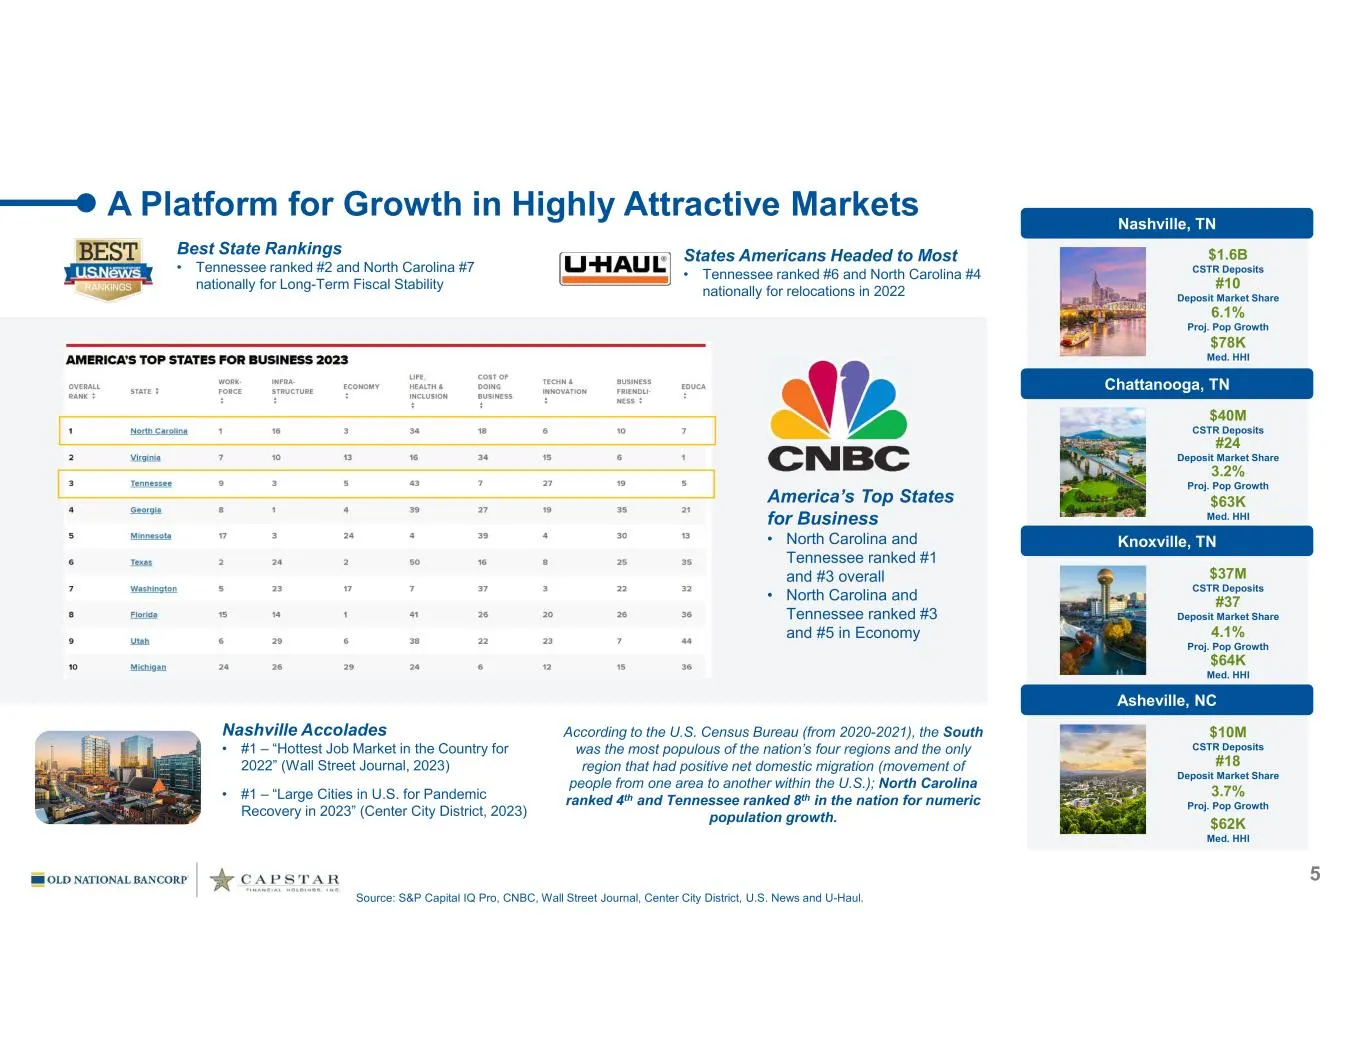
A Platform for Growth in Highly Attractive Markets 5 According to the U.S. Census Bureau (from 2020-2021), the South was the most populous of the nation’s four regions and the only region that had positive net domestic migration (movement of people from one area to another within the U.S.); North Ca
Slide 6: Appendix
6 Appendix
Slide 7: Demographically Accretive Markets
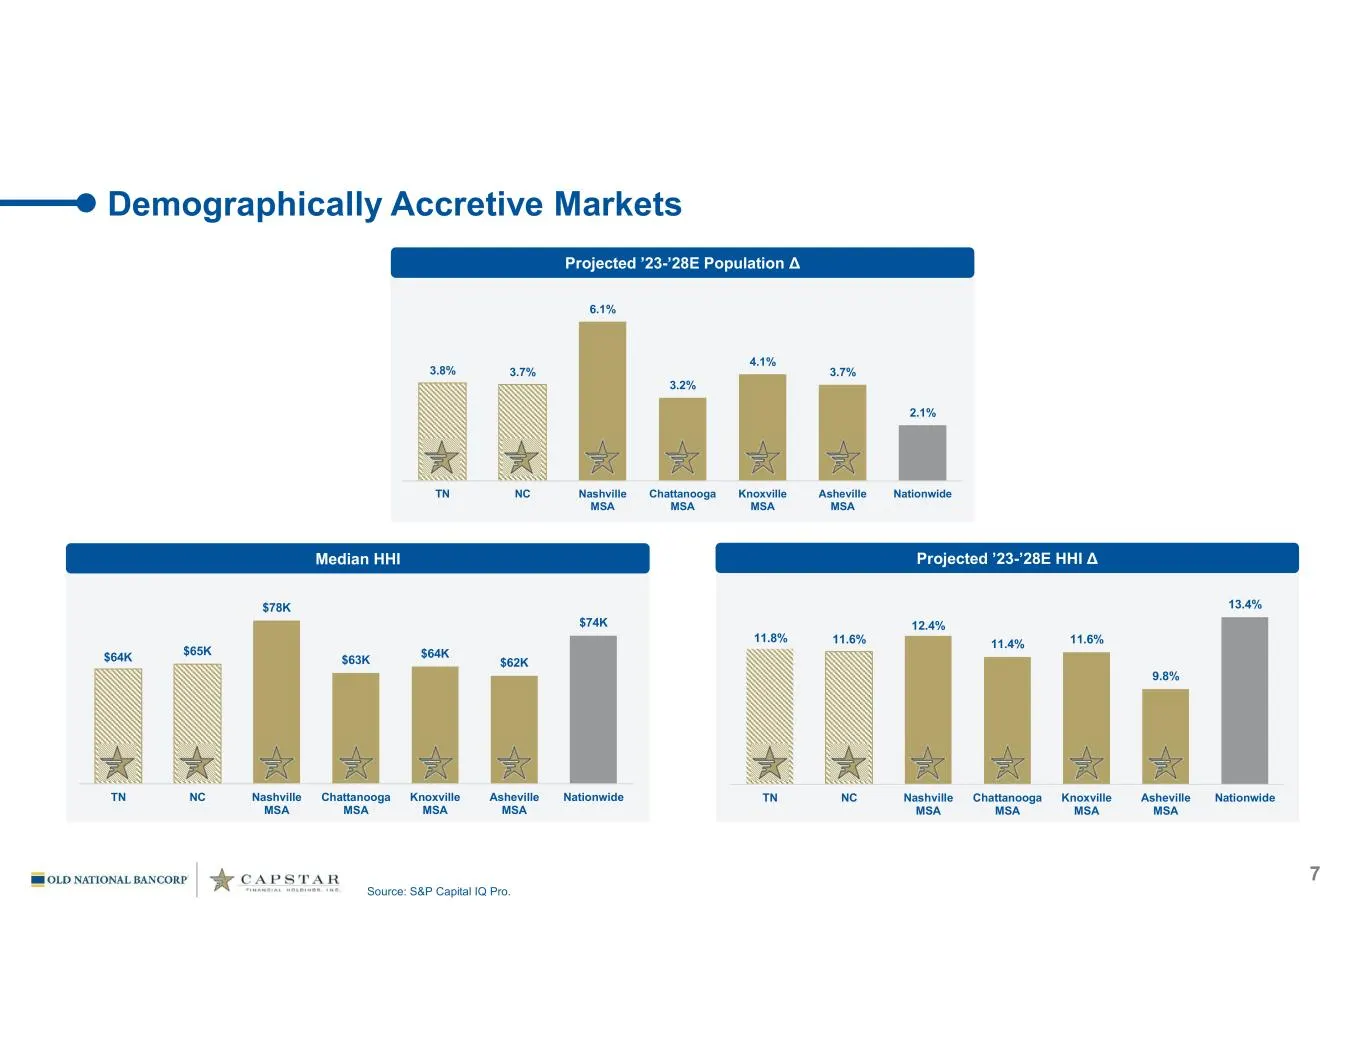
7 Demographically Accretive Markets Source: S&P Capital IQ Pro. Projected ’23-’28E Population Δ 3.8% 3.7% 6.1% 3.2% 4.1% 3.7% 2.1% TN NC Nashville MSA Chattanooga MSA Knoxville MSA Asheville MSA Nationwide 11.8% 11.6% 12.4% 11.4% 11.6% 9.8% 13.4% TN NC Nashville MSA Chattanooga MSA Knoxville MSA Ash
Slide 8: Deposits by Market
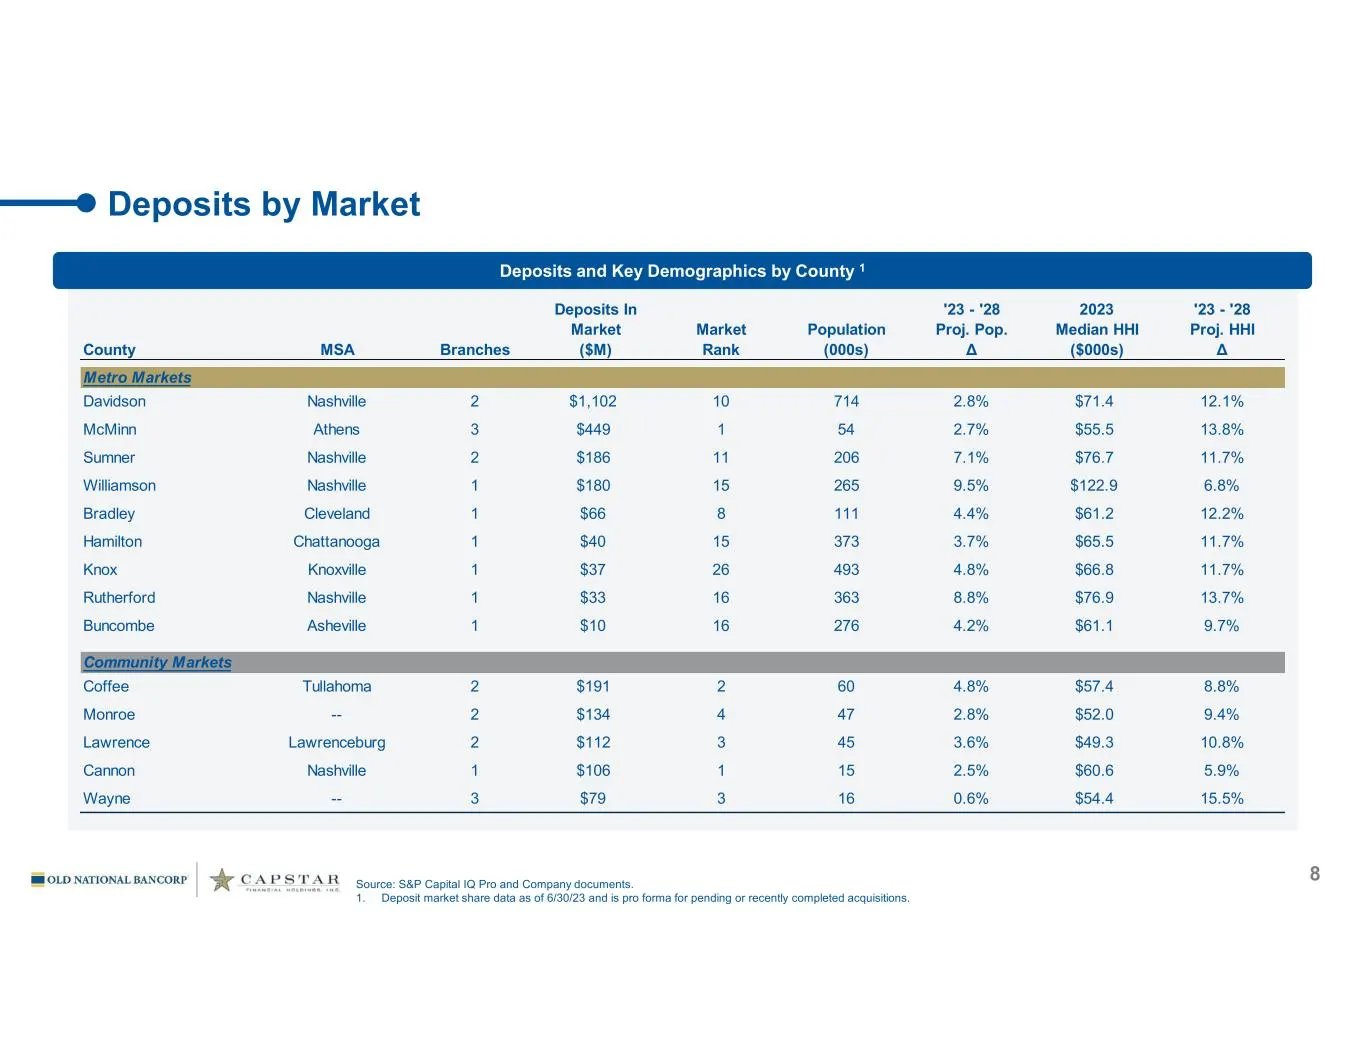
Deposits by Market Source: S&P Capital IQ Pro and Company documents. 1. Deposit market share data as of 6/30/23 and is pro forma for pending or recently completed acquisitions. 8 Deposits In '23 - '28 2023 '23 - '28 Market Market Population Proj. Pop. Median HHI Proj. HHI County MSA Branches ($M) Ra
Slide 9: Pro Forma Bank-Level Deposit Composition
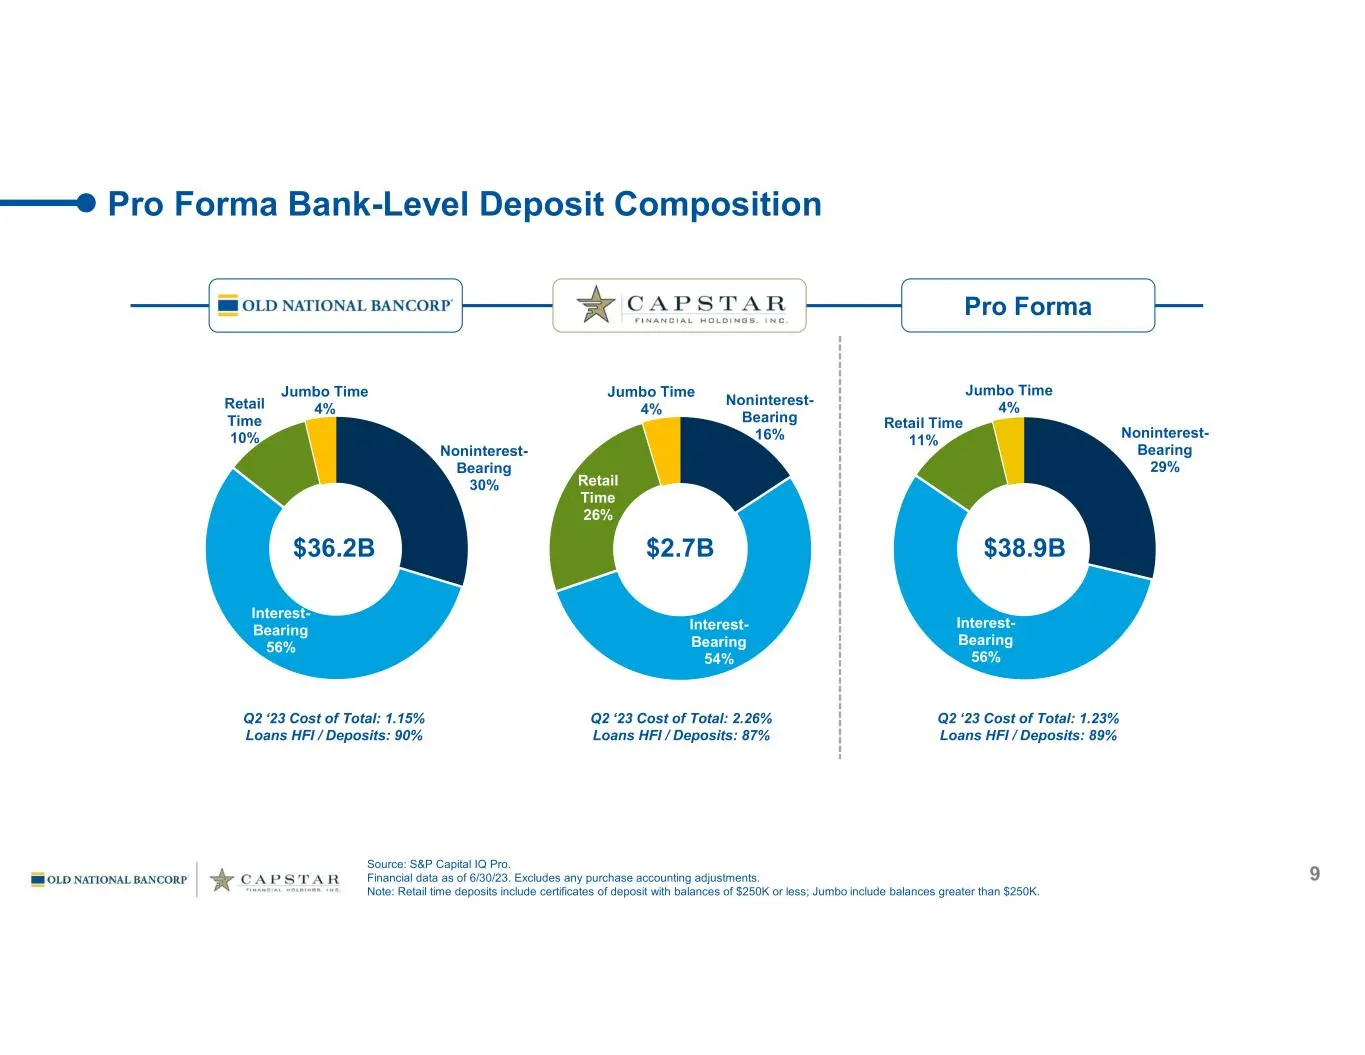
Noninterest- Bearing 29% Interest- Bearing 56% Retail Time 11% Jumbo Time 4% 9 Pro Forma Bank-Level Deposit Composition Noninterest- Bearing 16% Interest- Bearing 54% Retail Time 26% Jumbo Time 4% Noninterest- Bearing 30% Interest- Bearing 56% Retail Time 10% Jumbo Time 4% $36.2B $2.7B $38.9B Source
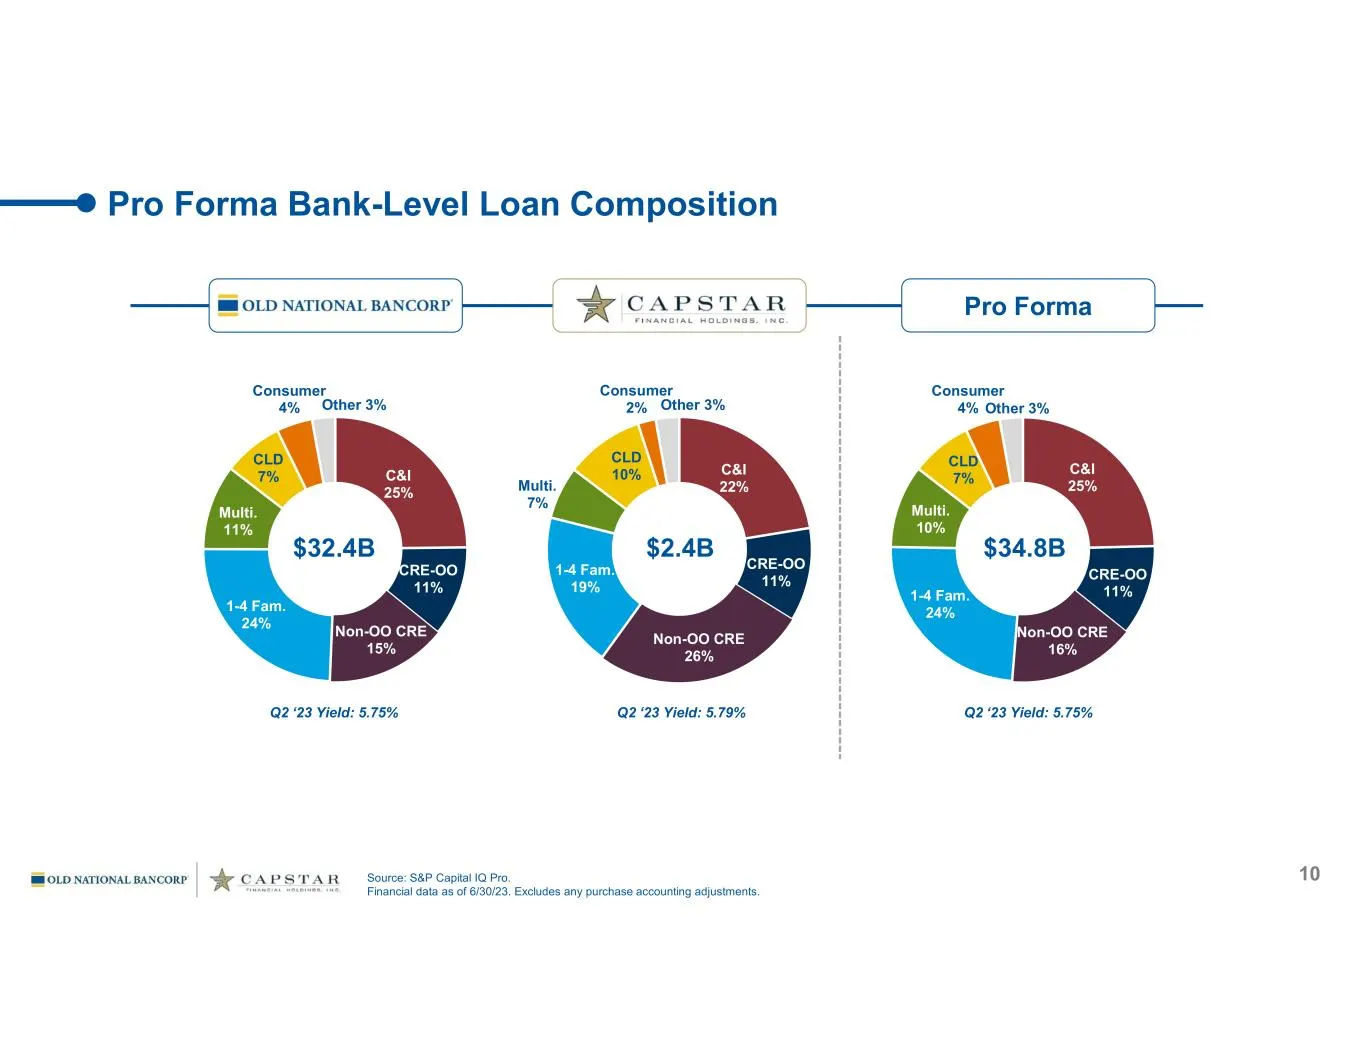
Slide 10: Pro Forma Bank-Level Loan Composition
C&I 25% CRE-OO 11% Non-OO CRE 16% 1-4 Fam. 24% Multi. 10% CLD 7% Consumer 4% Other 3% 10 Pro Forma Bank-Level Loan Composition C&I 22% CRE-OO 11% Non-OO CRE 26% 1-4 Fam. 19% Multi. 7% CLD 10% Consumer 2% Other 3% $32.4B Q2 ‘23 Yield: 5.75% Q2 ‘23 Yield: 5.79% $2.4B $34.8B Q2 ‘23 Yield: 5.75% Source:
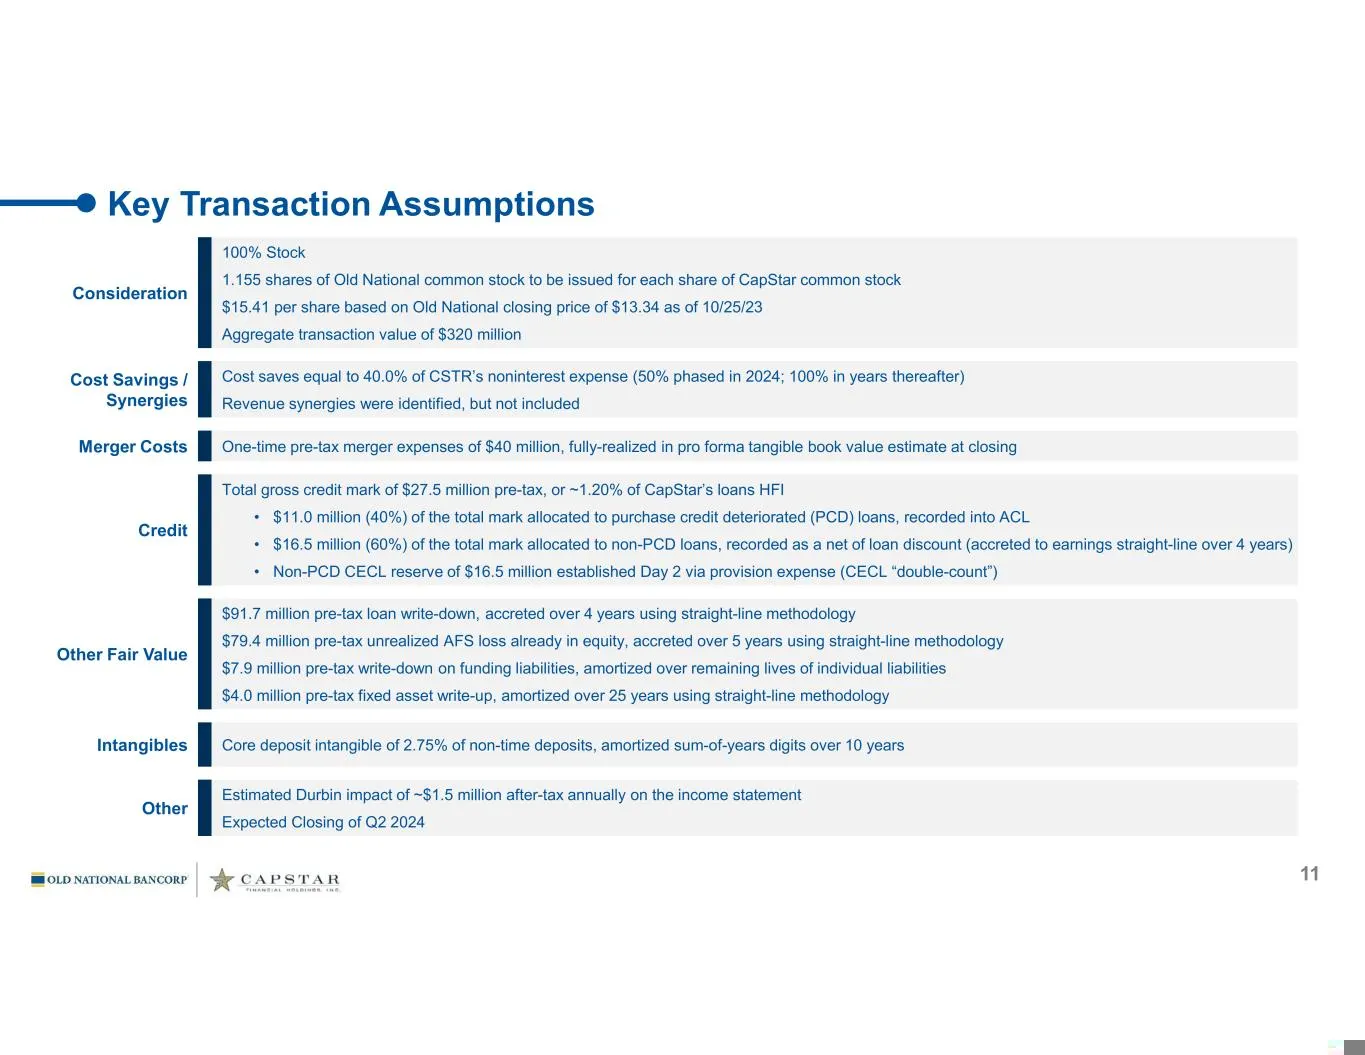
Slide 11: Key Transaction Assumptions
11 Key Transaction Assumptions 100% Stock 1.155 shares of Old National common stock to be issued for each share of CapStar common stock $15.41 per share based on Old National closing price of $13.34 as of 10/25/23 Aggregate transaction value of $320 million Consideration Cost saves equal to 40.0% of
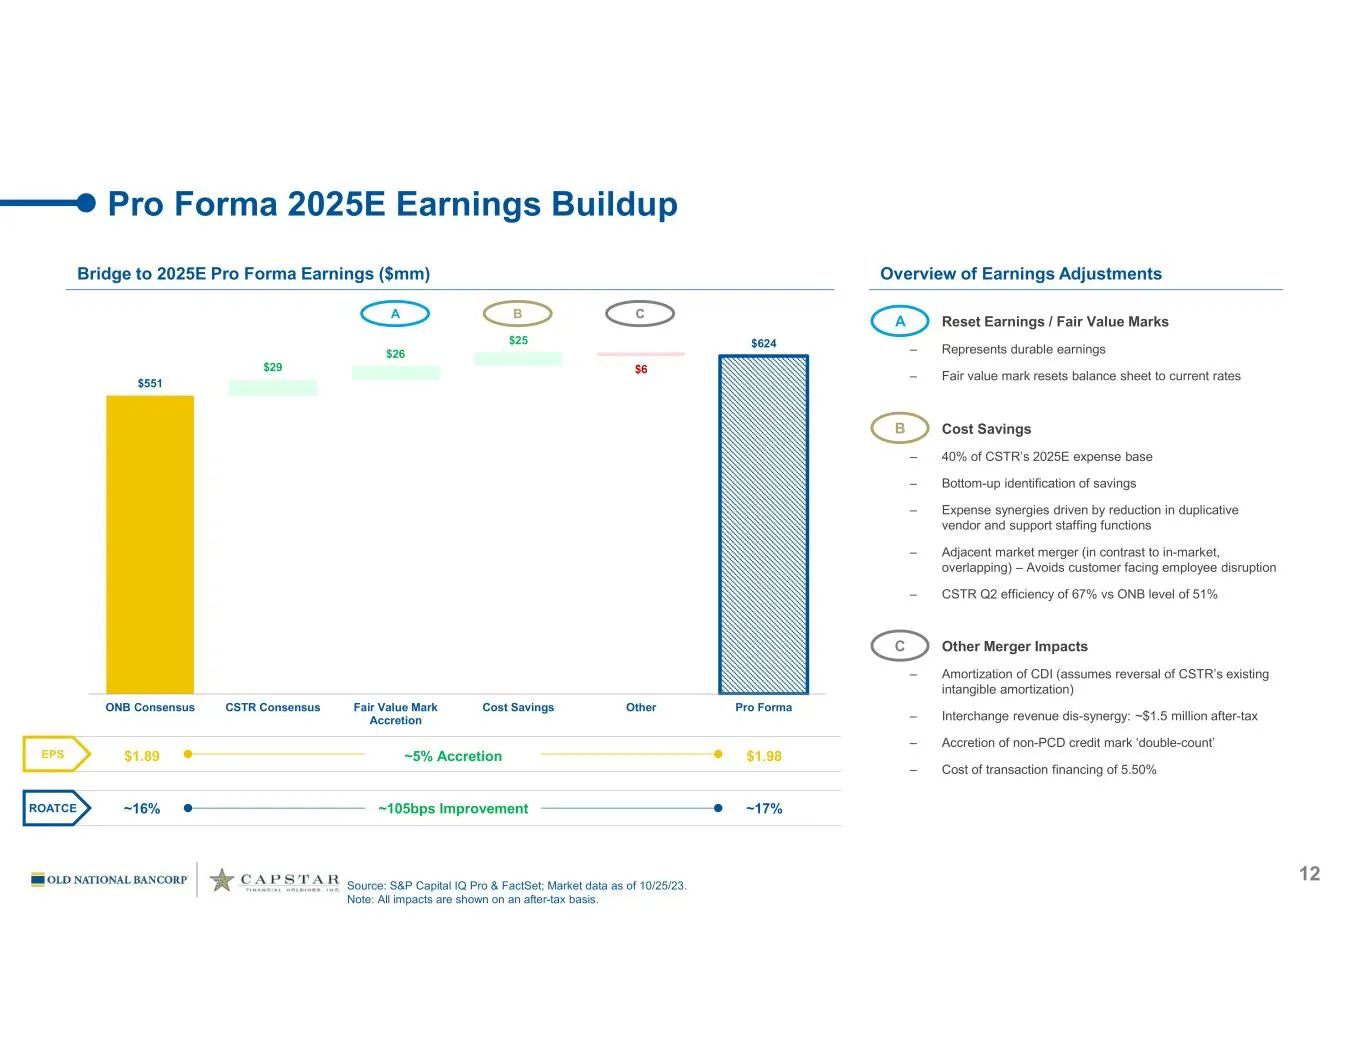
Slide 12: Pro Forma 2025E Earnings Buildup
$29 $26 $25 $6 $551 $624 ONB Consensus CSTR Consensus Fair Value Mark Accretion Cost Savings Other Pro Forma Other Merger Impacts ‒ Amortization of CDI (assumes reversal of CSTR’s existing intangible amortization) ‒ Interchange revenue dis-synergy: ~$1.5 million after-tax ‒ Accretion of non-PCD cr
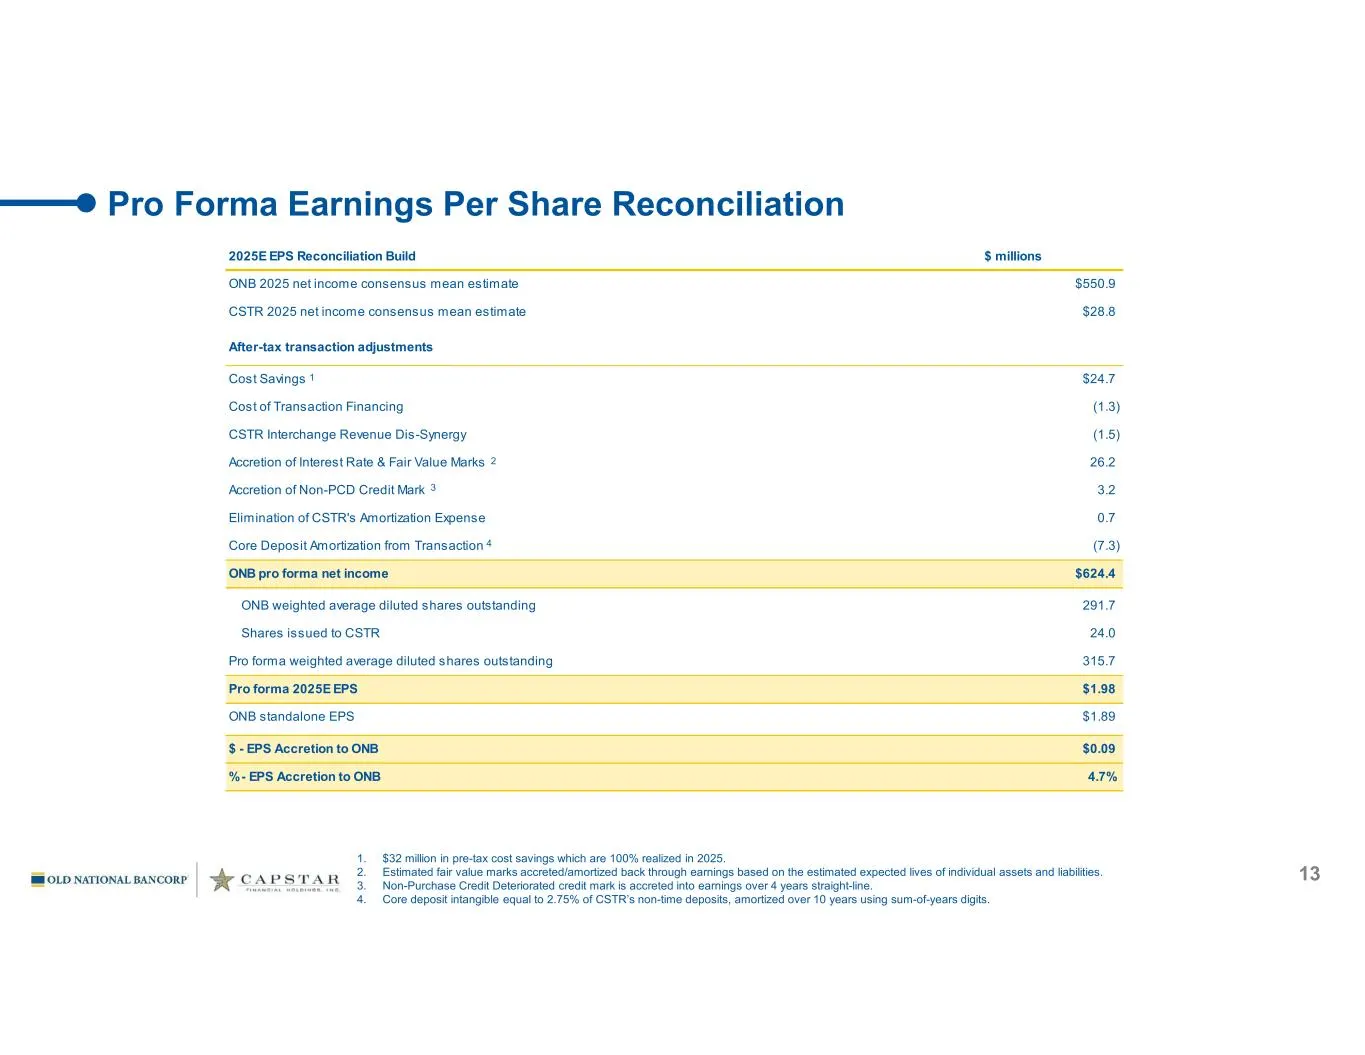
Slide 13: Pro Forma Earnings Per Share Reconciliation
13 Pro Forma Earnings Per Share Reconciliation 1. $32 million in pre-tax cost savings which are 100% realized in 2025. 2. Estimated fair value marks accreted/amortized back through earnings based on the estimated expected lives of individual assets and liabilities. 3. Non-Purchase Credit Deteriorate
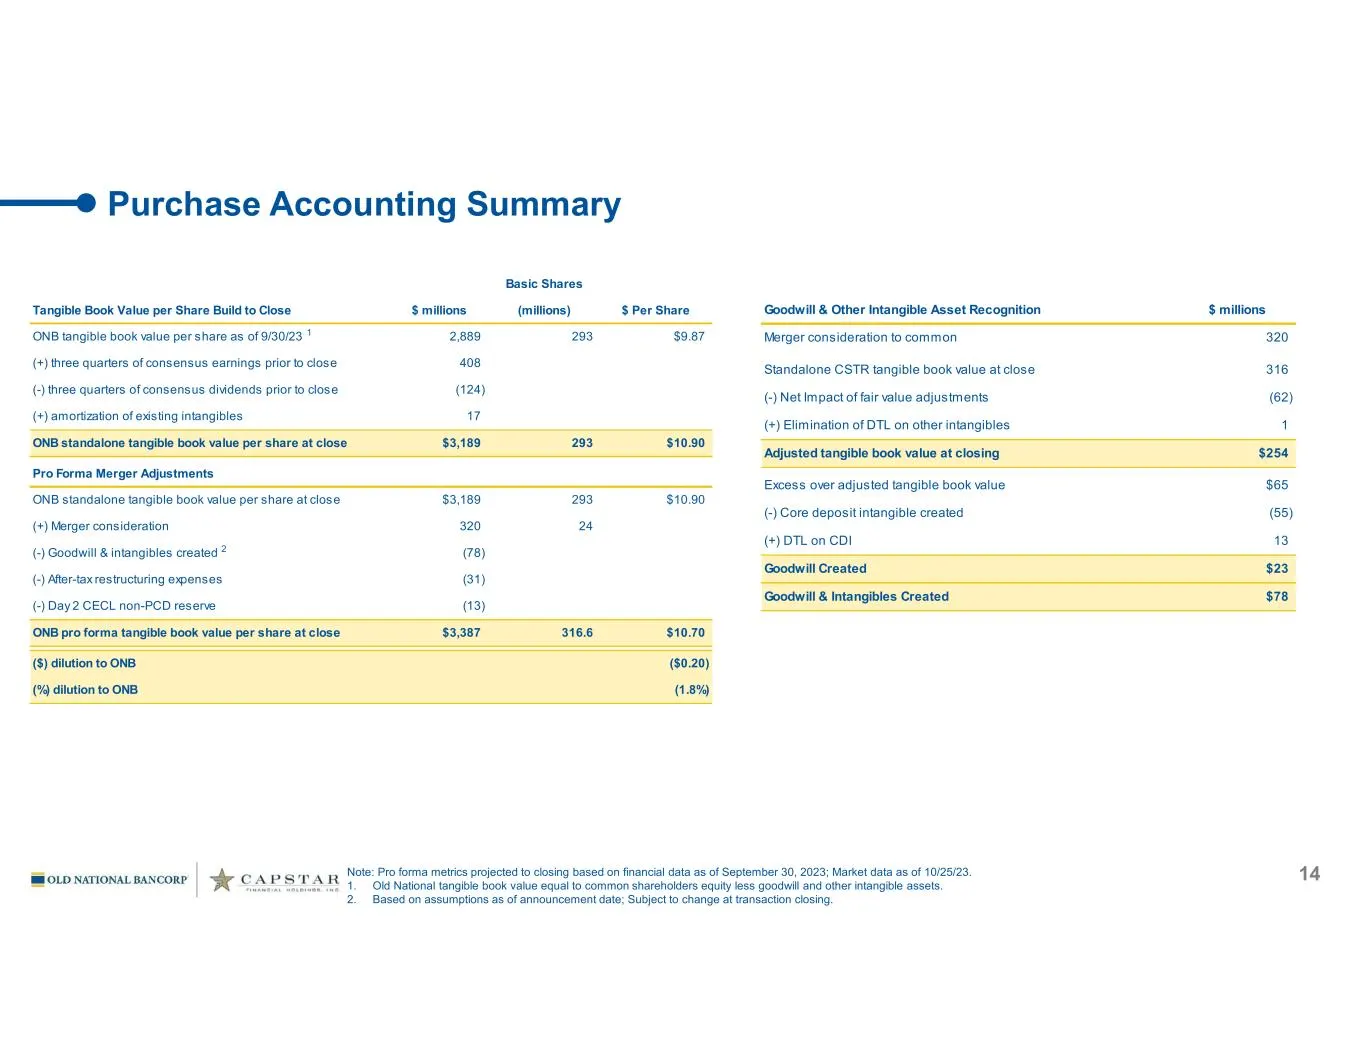
Slide 14: Purchase Accounting Summary
14 Purchase Accounting Summary Note: Pro forma metrics projected to closing based on financial data as of September 30, 2023; Market data as of 10/25/23. 1. Old National tangible book value equal to common shareholders equity less goodwill and other intangible assets. 2. Based on assumptions as of a
Slide 15: Important Information And Where You Can Find It
Important Information And Where You Can Find It 15 In connection with the proposed Merger, Old National will file with the SEC a Registration Statement on Form S-4 that will include a Proxy Statement of CapStar and a Prospectus of Old National, as well as other relevant documents concerning the prop

Slide 16: Old National Bancorp and CapStar Financial Holdings, Inc.
= OLD NATIONAL BANCORP’ CAPSTAR FINANCIAL HOLDINGS, ING.
Source: SEC EDGAR · 425 filed Oct 26, 2023
More decks from Capstar Financial Holdings Inc
 Q4 2023 Earnings Presentation6 slides · Jan 23, 2024
 Q2 2023 Earnings Presentation22 slides · Jul 21, 2023
 Q1 2023 Earnings Presentation32 slides · Apr 21, 2023
 Q4 2022 Earnings Presentation27 slides · Jan 20, 2023
 Investor Presentation (December 2022)31 slides · Dec 13, 2022
 Investor Presentation (November 2022)32 slides · Nov 3, 2022