AP Memory Technology Corp. · TWSE:6531
AP Memory Technology — Q1 2023 Earnings Presentation
17 slides from AP Memory Technology's earnings presentation, May 4, 2023
Slide 1: AP Memory Technology Corporation 2023 Q1 Investor Conference
AP Memory Technology Corporation 2023 Q1 Investor Conference 2023 May 4th
Slide 2: Disclaimer
Disclaimer The forward-looking statements contained in the presentation are subject to risks and uncertainties and actual results may differ materially from those expressed or implied in these forward-looking statements. AP Memory makes no representation or warranty as to the accuracy or completenes
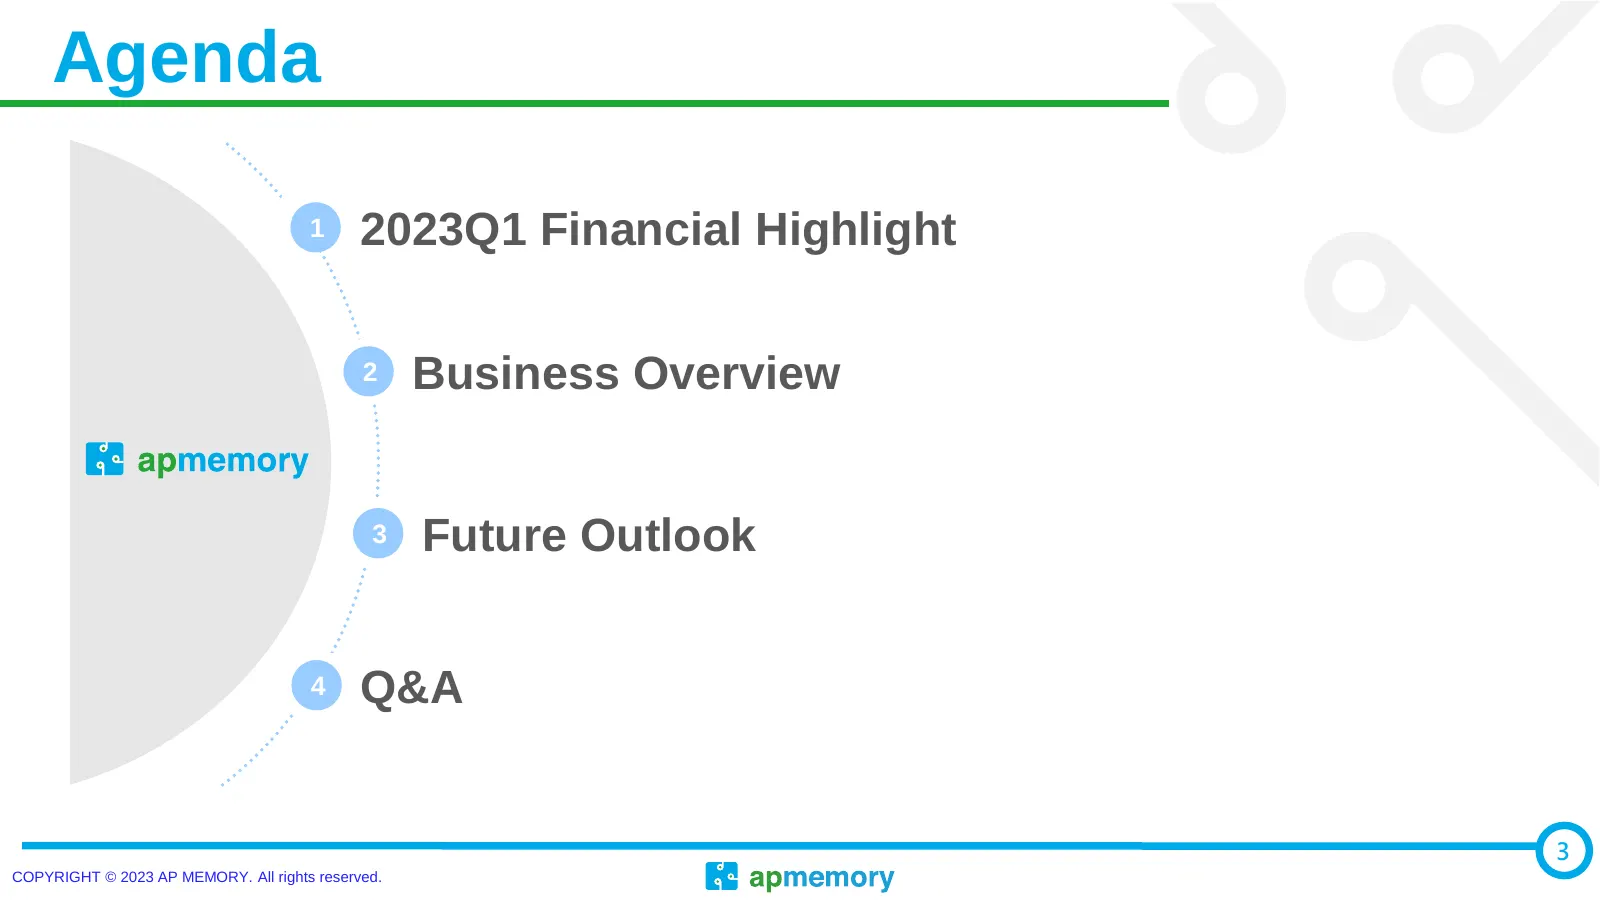
Slide 3: Agenda
Agenda World’s leading IoT and AI customized memory 1 2023Q1 Financial Highlight provider 2 Business Overview 3 Future Outlook 4 Q&A 3 COPYRIGHT © 2023 AP MEMORY. All rights reserved.
Slide 4: 2023Q1 Financial Highlight
01 2023Q1 Financial Highlight COPYRIGHT © 2023 AP MEMORY. All rights reserved.
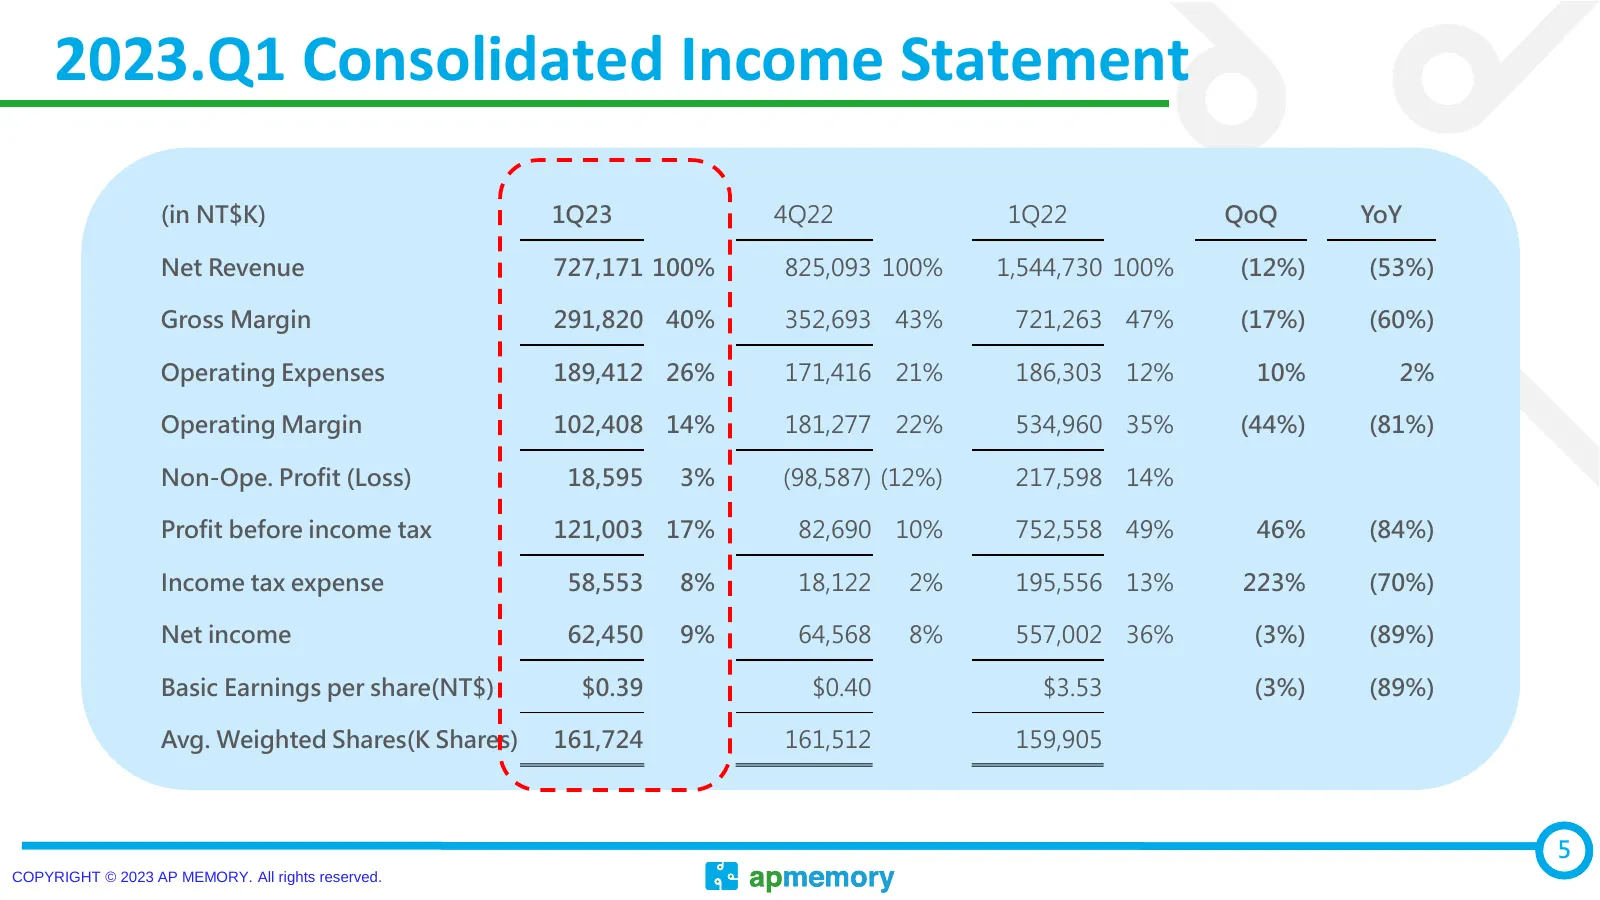
Slide 5: 2023.Q1 Consolidated Income Statement
2023.Q1 Consolidated Income Statement (in NT$K) 1Q23 4Q22 1Q22 QoQ YoY Net Revenue 727,171 100% 825,093 100% 1,544,730 100% (12%) (53%) Gross Margin 291,820 40% 352,693 43% 721,263 47% (17%) (60%) Operating Expenses 189,412 26% 171,416 21% 186,303 12% 10% 2% Operating Margin 102,408 14% 181,277 22%
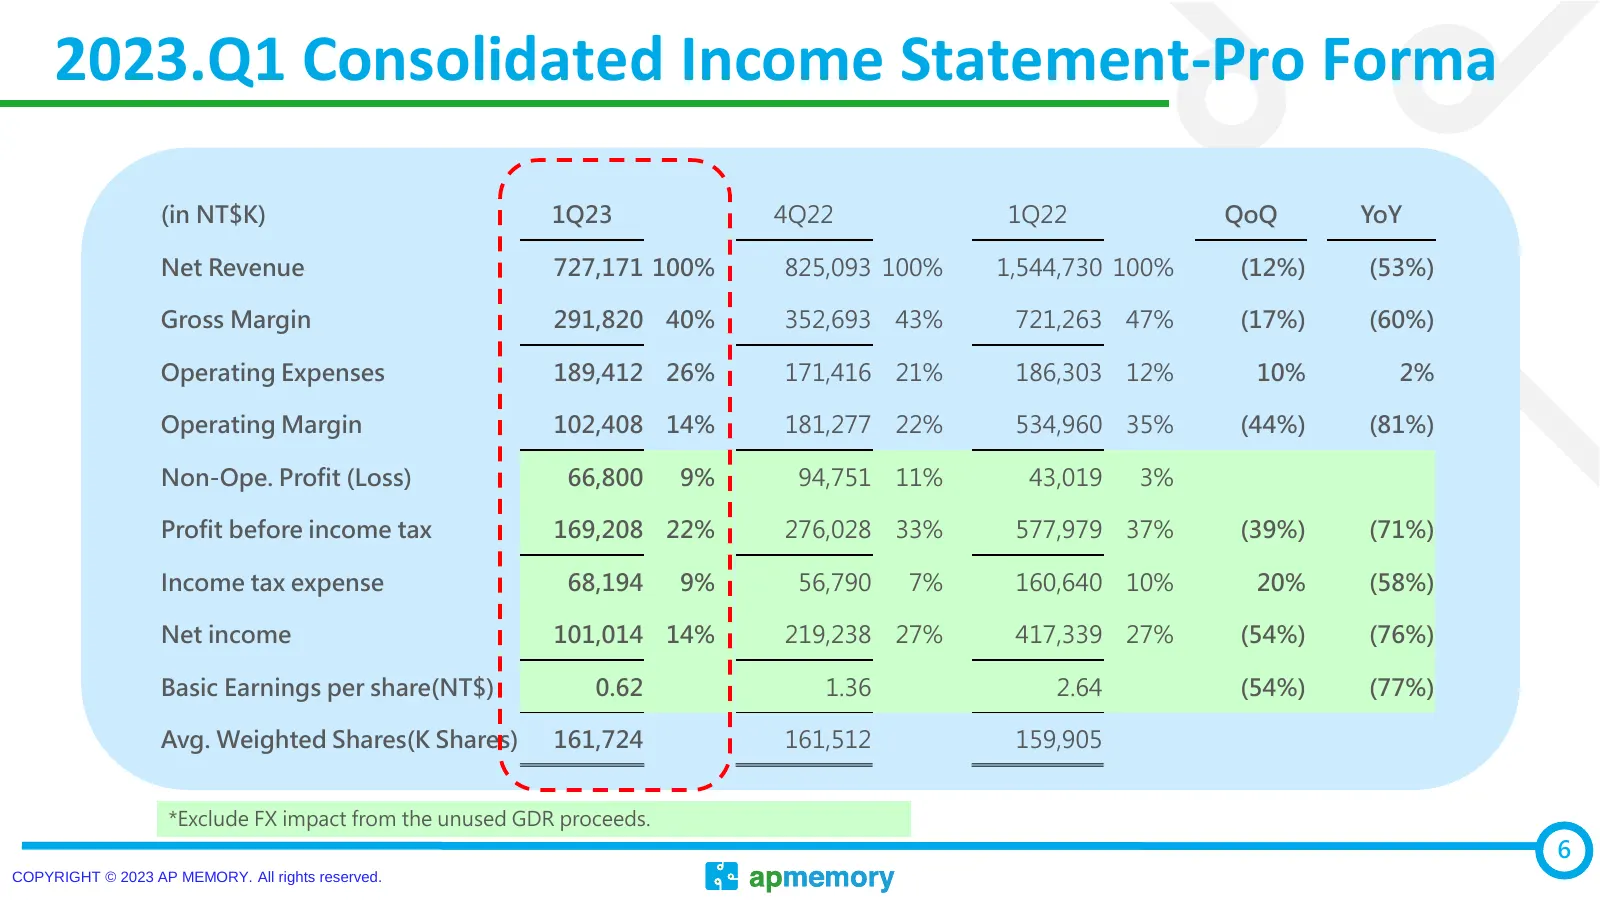
Slide 6: 2023.Q1 Consolidated Income Statement-Pro Forma
2023.Q1 Consolidated Income Statement-Pro Forma (in NT$K) 1Q23 4Q22 1Q22 QoQ YoY Net Revenue 727,171 100% 825,093 100% 1,544,730 100% (12%) (53%) Gross Margin 291,820 40% 352,693 43% 721,263 47% (17%) (60%) Operating Expenses 189,412 26% 171,416 21% 186,303 12% 10% 2% Operating Margin 102,408 14% 18
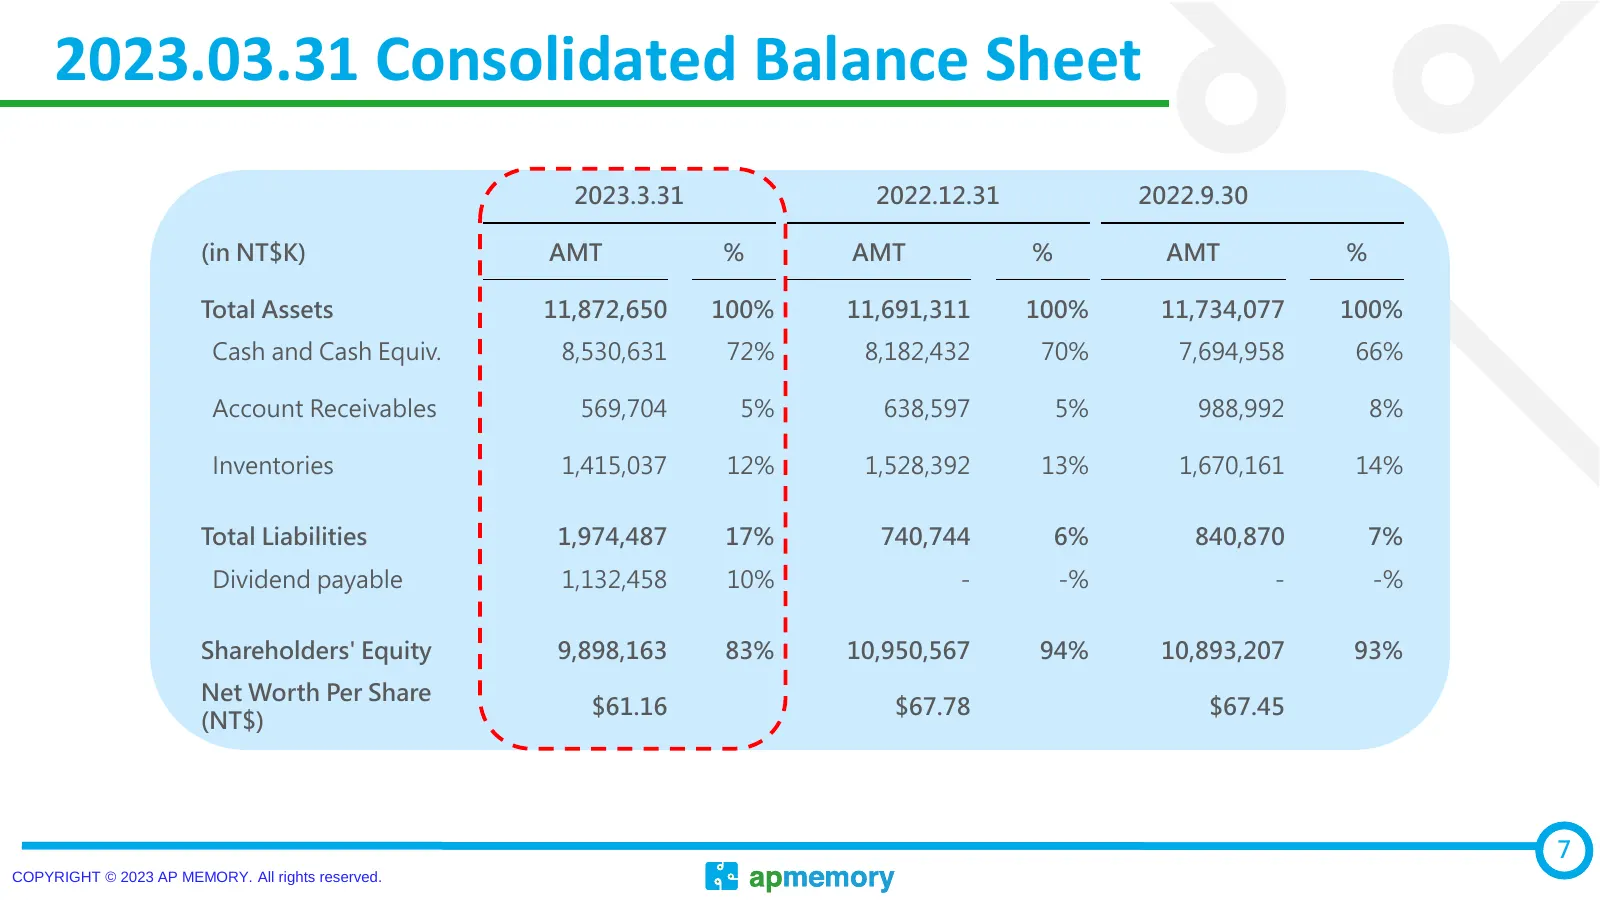
Slide 7: 2023.03.31 Consolidated Balance Sheet
2023.03.31 Consolidated Balance Sheet 2023.3.31 2022.12.31 2022.9.30 (in NT$K) AMT % AMT % AMT % Total Assets 11,872,650 100% 11,691,311 100% 11,734,077 100% Cash and Cash Equiv. 8,530,631 72% 8,182,432 70% 7,694,958 66% Account Receivables 569,704 5% 638,597 5% 988,992 8% Inventories 1,415,037 12%
Slide 8: Business Overview
02 Business Overview COPYRIGHT © 2023 AP MEMORY. All rights reserved.
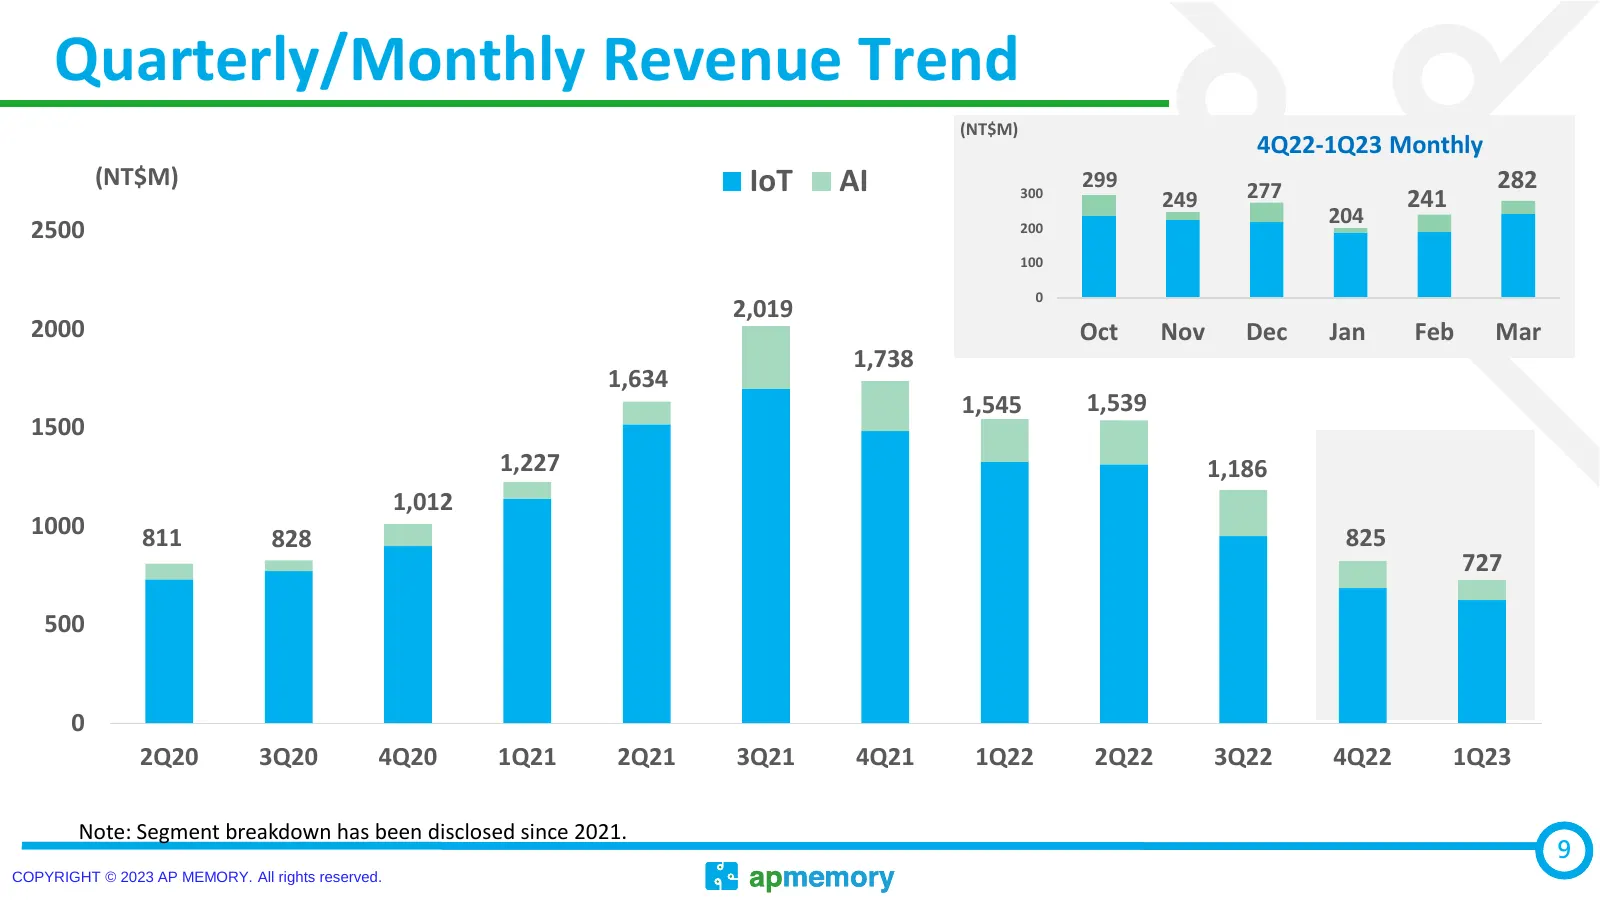
Slide 9: Quarterly/Monthly Revenue Trend
Quarterly/Monthly Revenue Trend (NT$M) 4Q22-1Q23 Monthly (NT$M) IoT AI 299 277 282 300 249 241 204 2500 200 100 0 2,019 2000 Oct Nov Dec Jan Feb Mar 1,738 1,634 1,545 1,539 1500 1,227 1,186 1,012 1000 811 828 825 727 500 0 2Q20 3Q20 4Q20 1Q21 2Q21 3Q21 4Q21 1Q22 2Q22 3Q22 4Q22 1Q23 Note: Segment bre
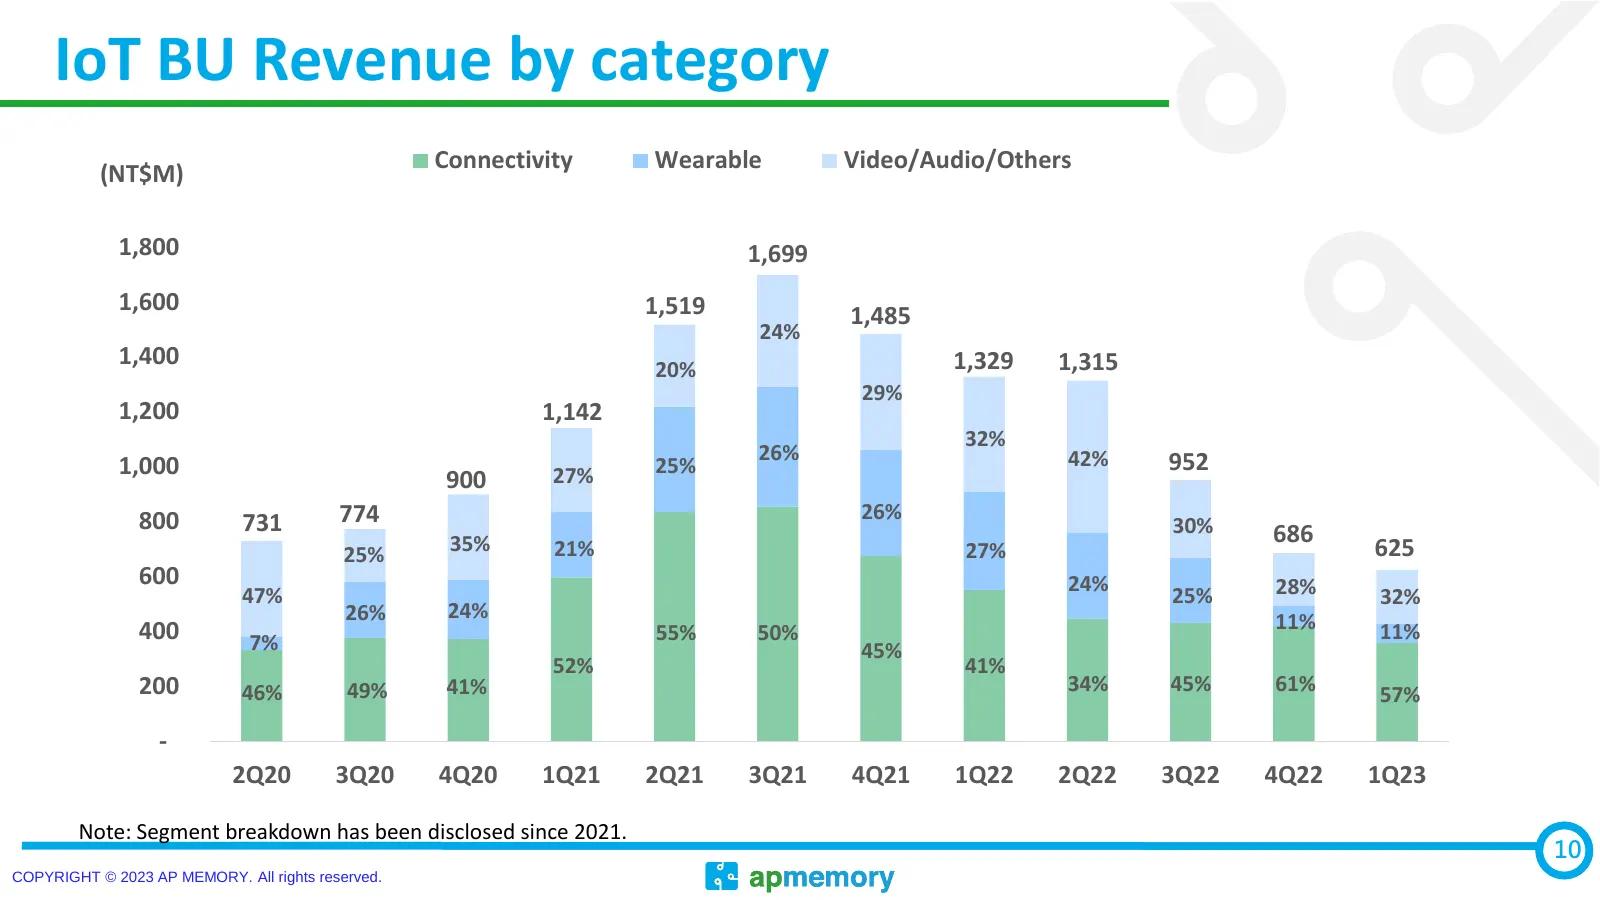
Slide 10: IoT BU Revenue by category
IoT BU Revenue by category Connectivity Wearable Video/Audio/Others (NT$M) 1,800 1,699 1,600 1,519 1,485 24% 1,400 20% 1,329 1,315 29% 1,200 1,142 32% 26% 42% 952 1,000 27% 25% 900 800 774 26% 731 30% 686 25% 35% 21% 27% 625 600 24% 28% 47% 25% 32% 26% 24% 11% 400 7% 55% 50% 11% 45% 52% 41% 200 46%
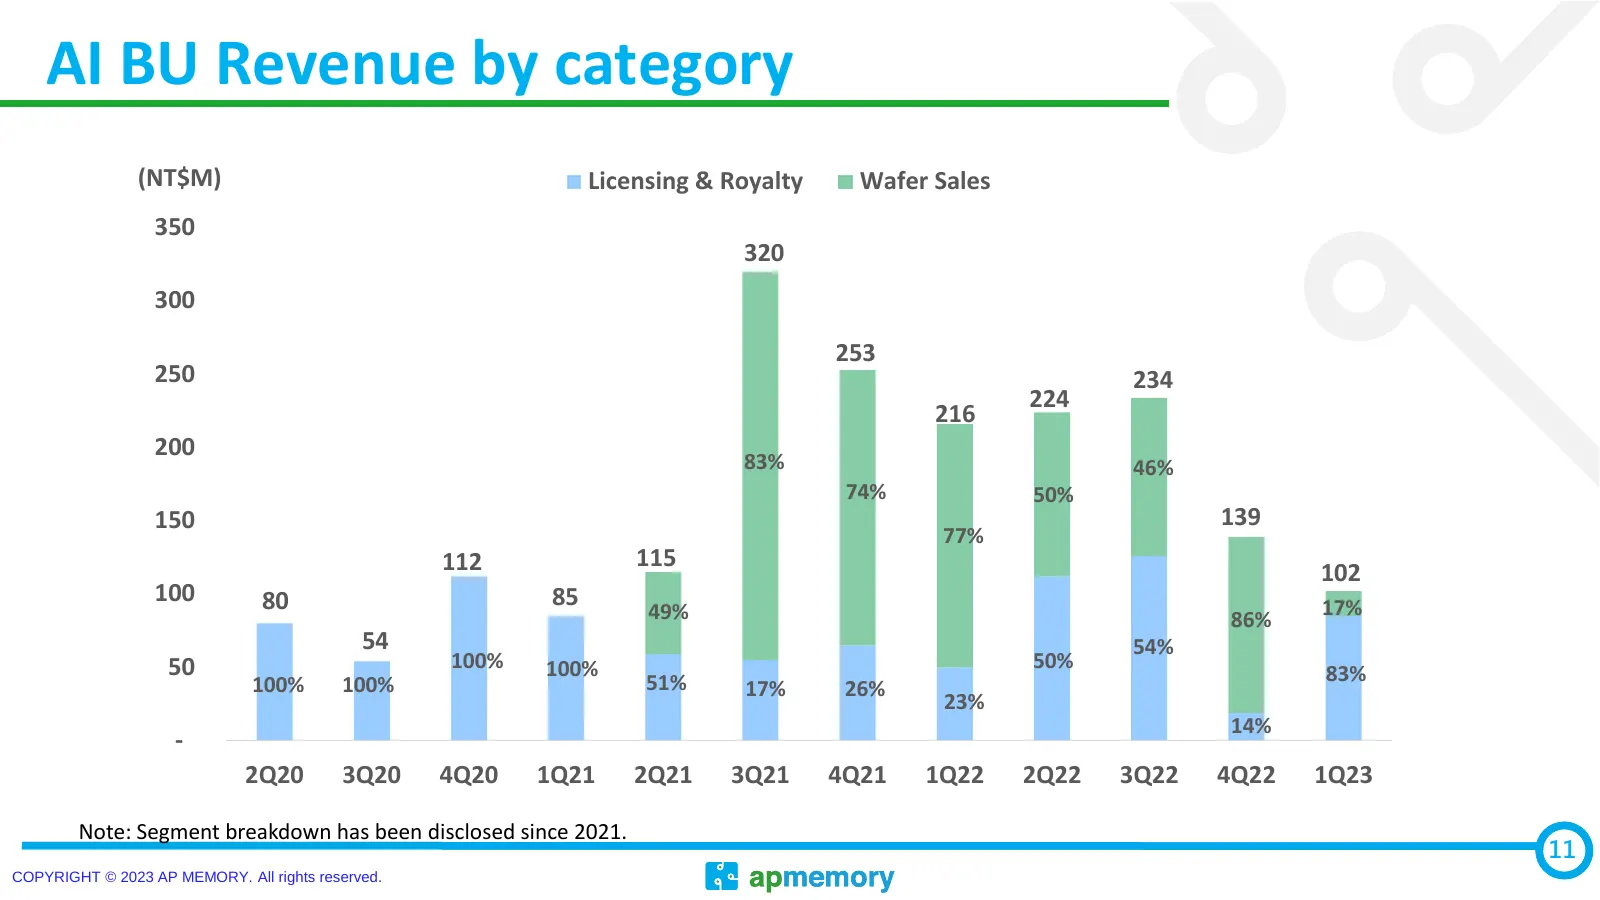
Slide 11: AI BU Revenue by category
AI BU Revenue by category (NT$M) Licensing & Royalty Wafer Sales 350 320 300 253 250 234 224 216 200 83% 46% 74% 50% 150 139 77% 112 115 102 100 80 85 49% 17% 86% 54 54% 50 100% 100% 50% 100% 100% 51% 83% 17% 26% 23% 14% - 2Q20 3Q20 4Q20 1Q21 2Q21 3Q21 4Q21 1Q22 2Q22 3Q22 4Q22 1Q23 Note: Segment bre
Slide 12: Future Outlook
03 Future Outlook COPYRIGHT © 2023 AP MEMORY. All rights reserved.
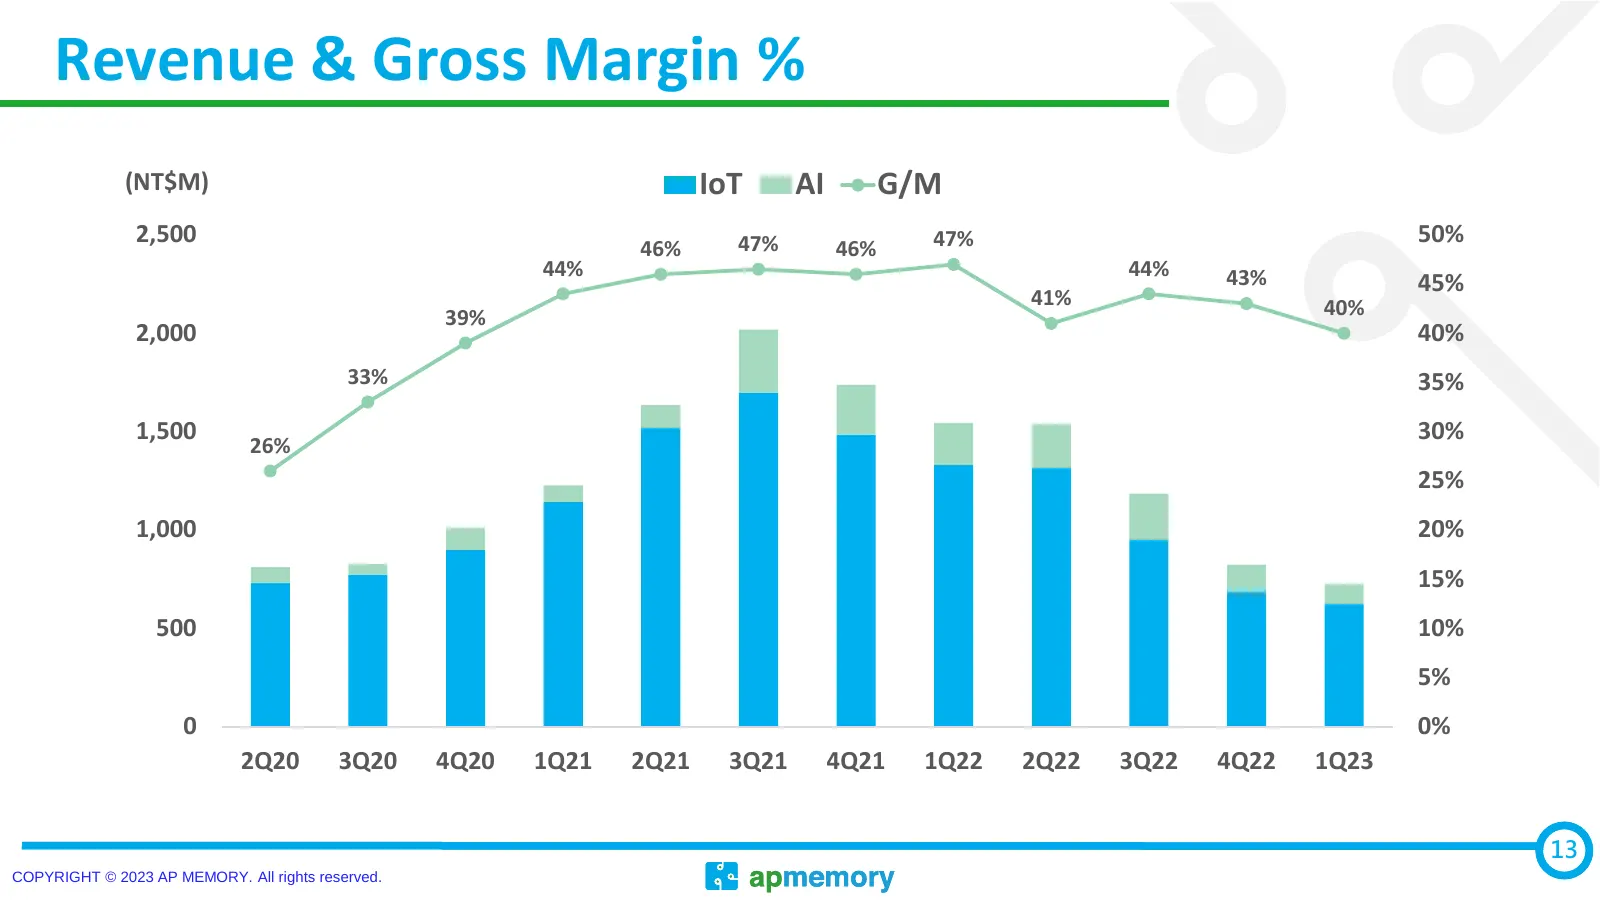
Slide 13: Revenue & Gross Margin %
Revenue & Gross Margin % (NT$M) IoT AI G/M 2,500 47% 47% 50% 46% 46% 44% 44% 43% 45% 41% 40% 39% 2,000 40% 33% 35% 1,500 30% 26% 25% 1,000 20% 15% 500 10% 5% 0 0% 2Q20 3Q20 4Q20 1Q21 2Q21 3Q21 4Q21 1Q22 2Q22 3Q22 4Q22 1Q23 13 COPYRIGHT © 2023 AP MEMORY. All rights reserved.
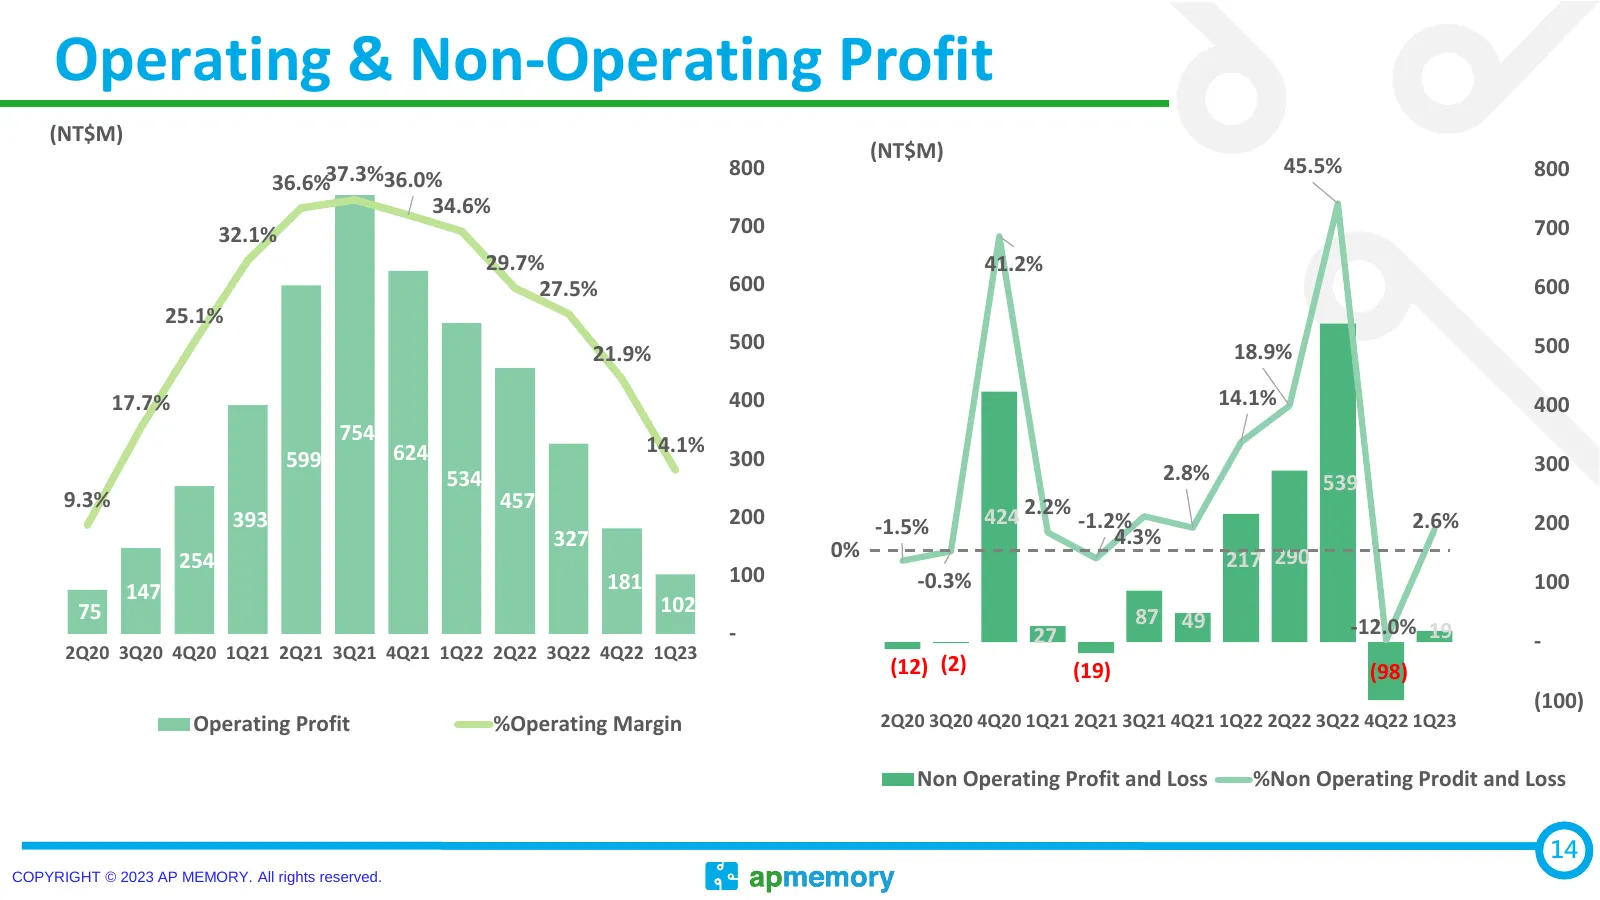
Slide 14: Operating & Non-Operating Profit
Operating & Non-Operating Profit (NT$M) (NT$M) 800 45.5% 800 36.6%37.3%36.0% 34.6% 32.1% 700 700 29.7% 41.2% 27.5% 600 87 600 25.1% 21.9% 500 18.9% 500 217 290 17.7% 400 428 14.1% 400 754 14.1% 599 624 300 300 534 2.8% 539 9.3% 457 393 200 -1.5% 424 2.2% -1.2% 2.6% 200 327 4.3% 254 0% 217 290 181 10
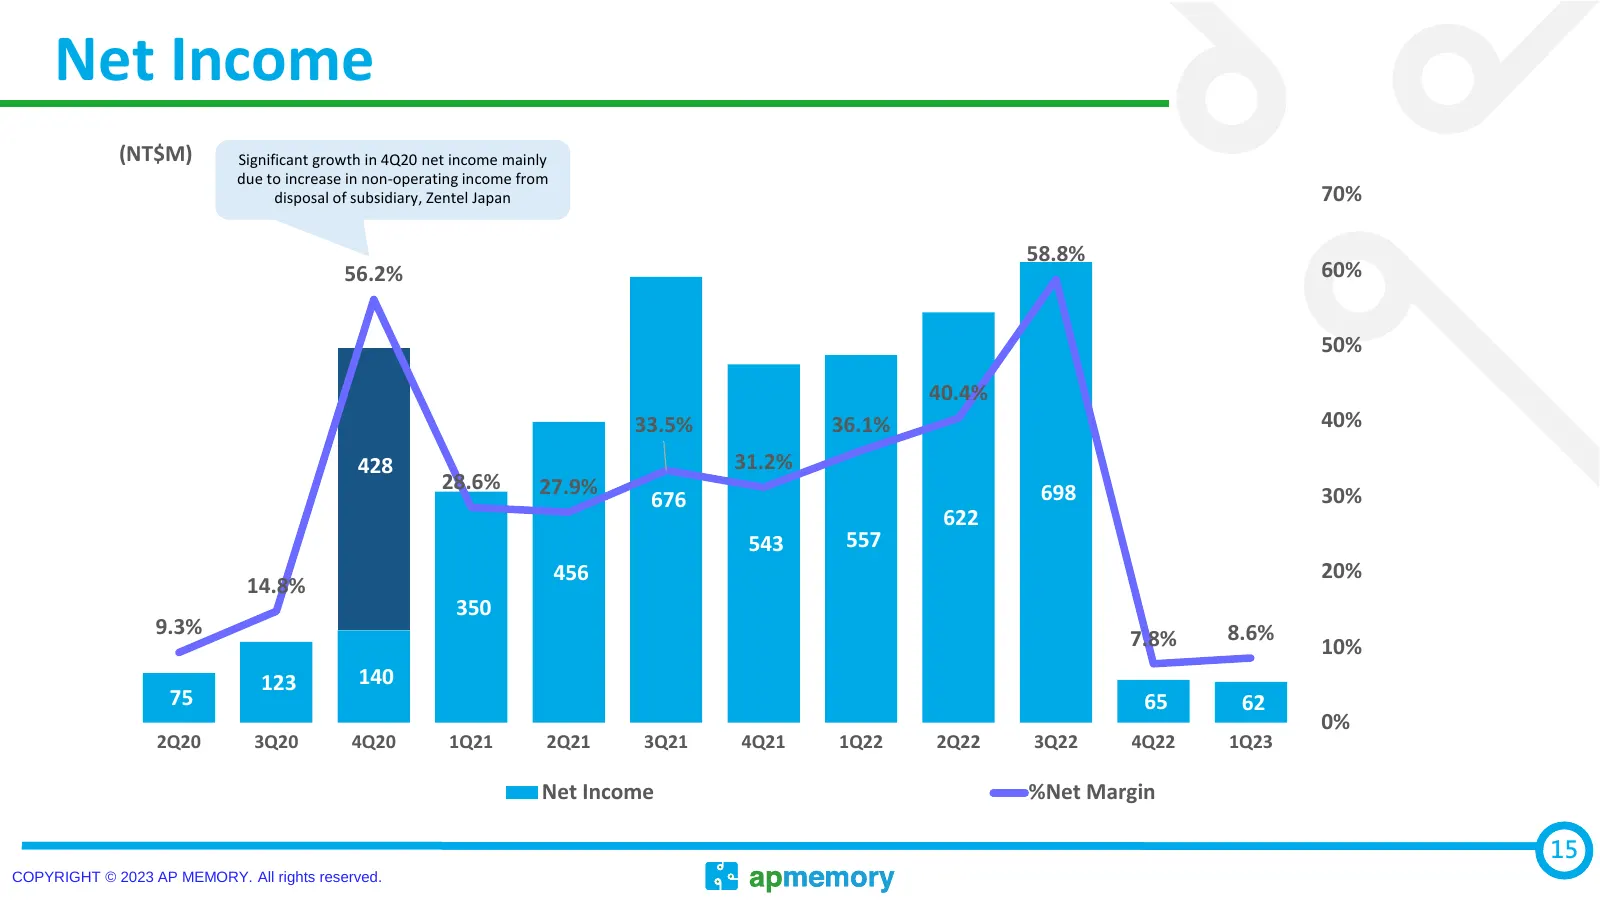
Slide 15: Net Income
Net Income (NT$M) Significant growth in 4Q20 net income mainly due to increase in non-operating income from disposal of subsidiary, Zentel Japan 70% 58.8% 56.2% 60% 50% 40.4% 33.5% 36.1% 40% 428 31.2% 28.6% 27.9% 698 676 30% 622 543 557 456 20% 14.8% 350 9.3% 7.8% 8.6% 10% 123 140 75 65 62 0% 2Q20 3
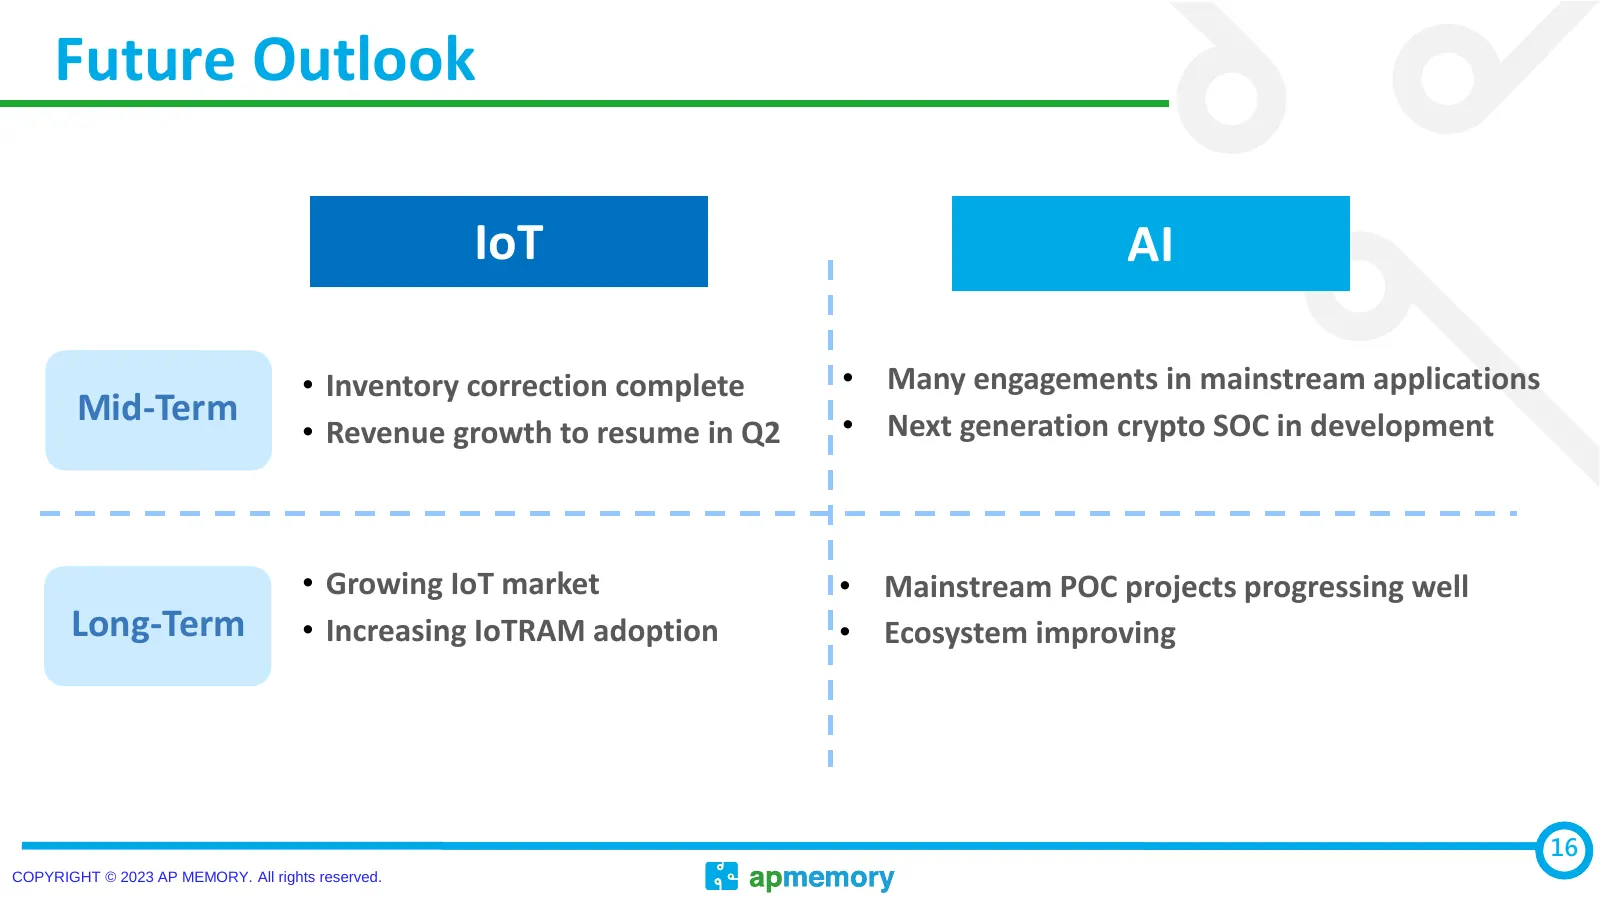
Slide 16: Future Outlook
Future Outlook IoT AI • Inventory correction complete • Many engagements in mainstream applications Mid-Term • Next generation crypto SOC in development • Revenue growth to resume in Q2 • Growing IoT market • Mainstream POC projects progressing well Long-Term • Increasing IoTRAM adoption • Ecosystem
Slide 17: Q&A
Q&A IR mail:ir@apmemory.com IR Tel:+886-3-5601651 COPYRIGHT © 2023 AP MEMORY. All rights reserved.
Source: Internet Archive copy of apmemory.com
More decks from AP Memory Technology Corp.
 Q3 2022 Earnings Presentation15 slides · Nov 1, 2022
 Q4 2021 Earnings Presentation24 slides · Mar 1, 2022
 1H20 Earnings Presentation19 slides · Aug 10, 2020
 Non-Deal Roadshow (April 2017)22 slides · Apr 20, 2017
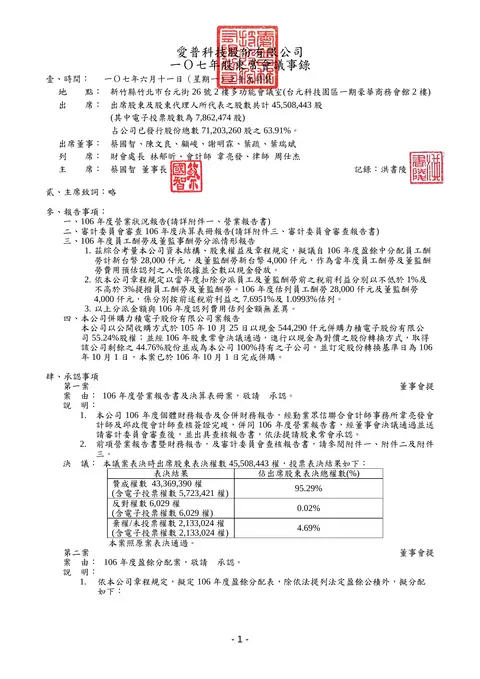 ey Jpdi I6Im9hbz JWTUloc Ext WUY1T1lzd Hhl Ync9PSIs In Zhb HVl Ijoi Wm Ir T2RVb Tljd0RQNFRKYVB0aj JEdz09Iiwib WFj Ijoi Zj Rk NWRm Yj Mz ZWU1YWI5Y2Rh Nj Ey OTk1N28 slides