McBride plc · LSE:MCB
McBride — H1 2013-14 Earnings Presentation
34 slides from McBride's earnings presentation, Feb 11, 2014

Slide 1: McBride plc Interim Results Presentation
McBride plc Interim Results Presentation 11 February 2014 Passionate about Private Label
Slide 2: Summary
Summary Chris Bull – Chief Executive Officer Passionate about Private Label 2
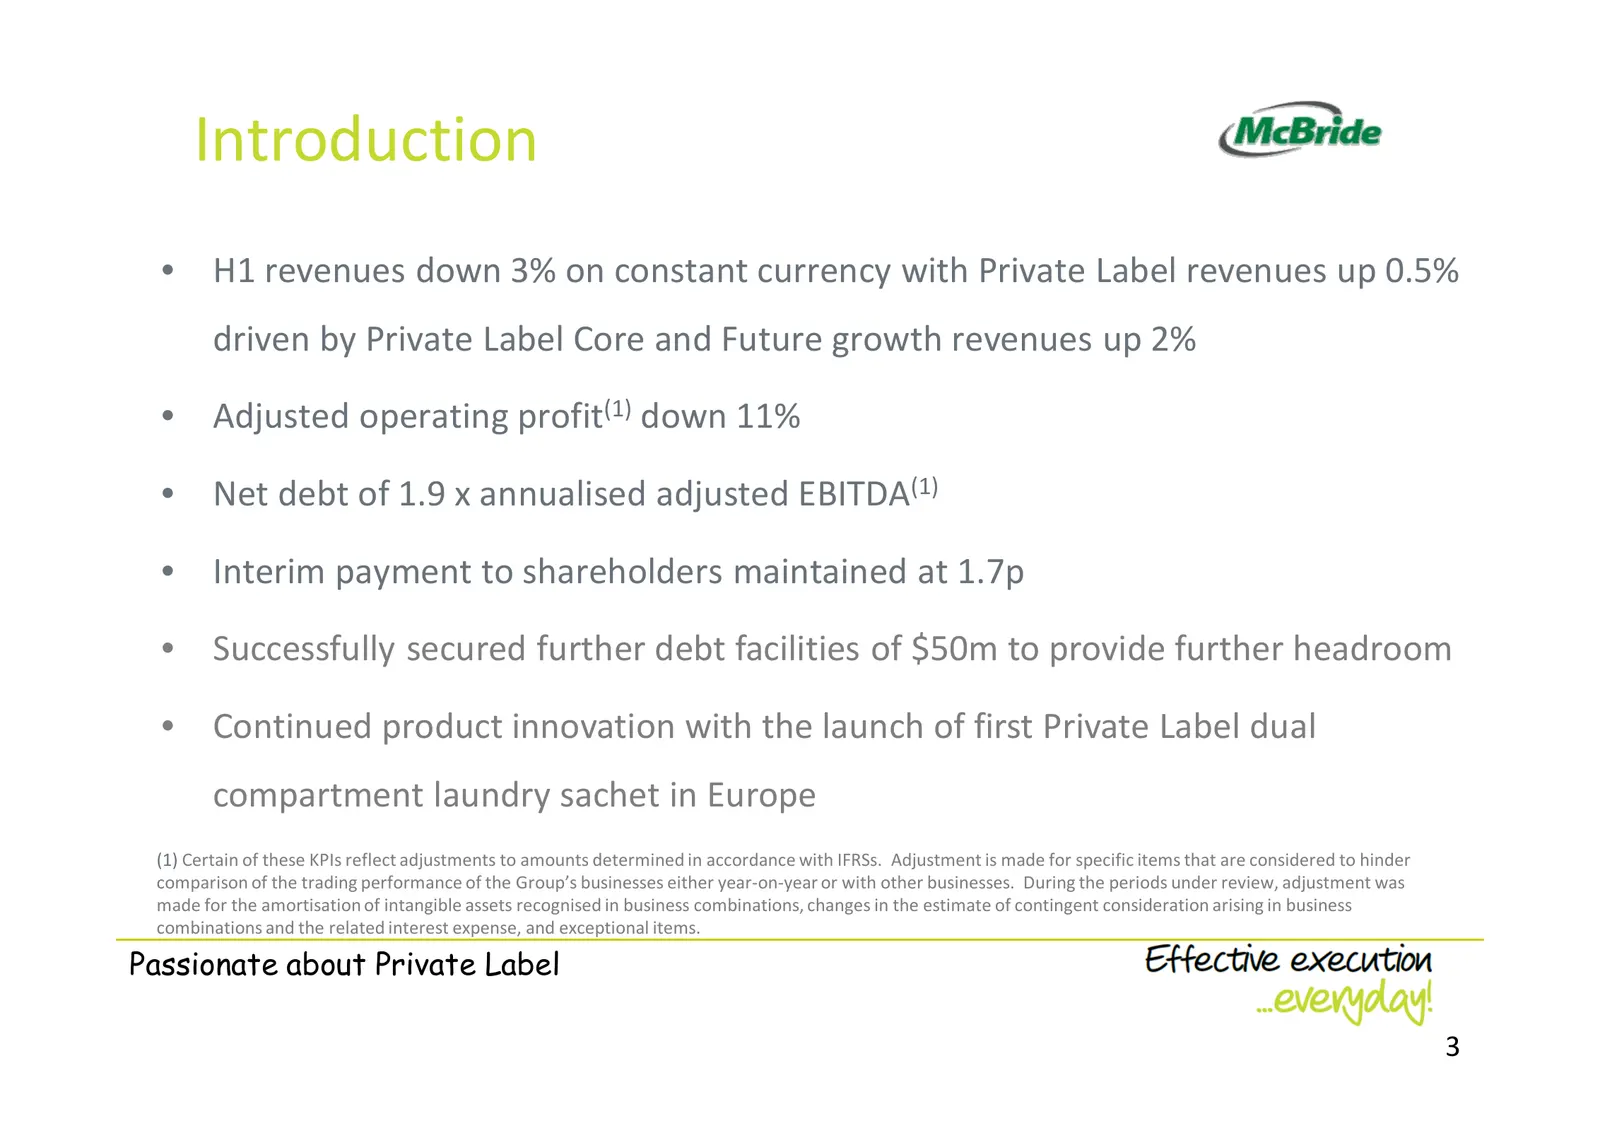
Slide 3: Introduction
Introduction • H1 revenues down 3% on constant currency with Private Label revenues up 0.5% driven by Private Label Core and Future growth revenues up 2% • Adjusted operating profit(1) down 11% • Net debt of 1.9 x annualised adjusted EBITDA(1) • Interim payment to shareholders maintained at 1.7p • S
Slide 4: Financial review
Financial review Richard Armitage ‐ Chief Finance Officer Passionate about Private Label 4
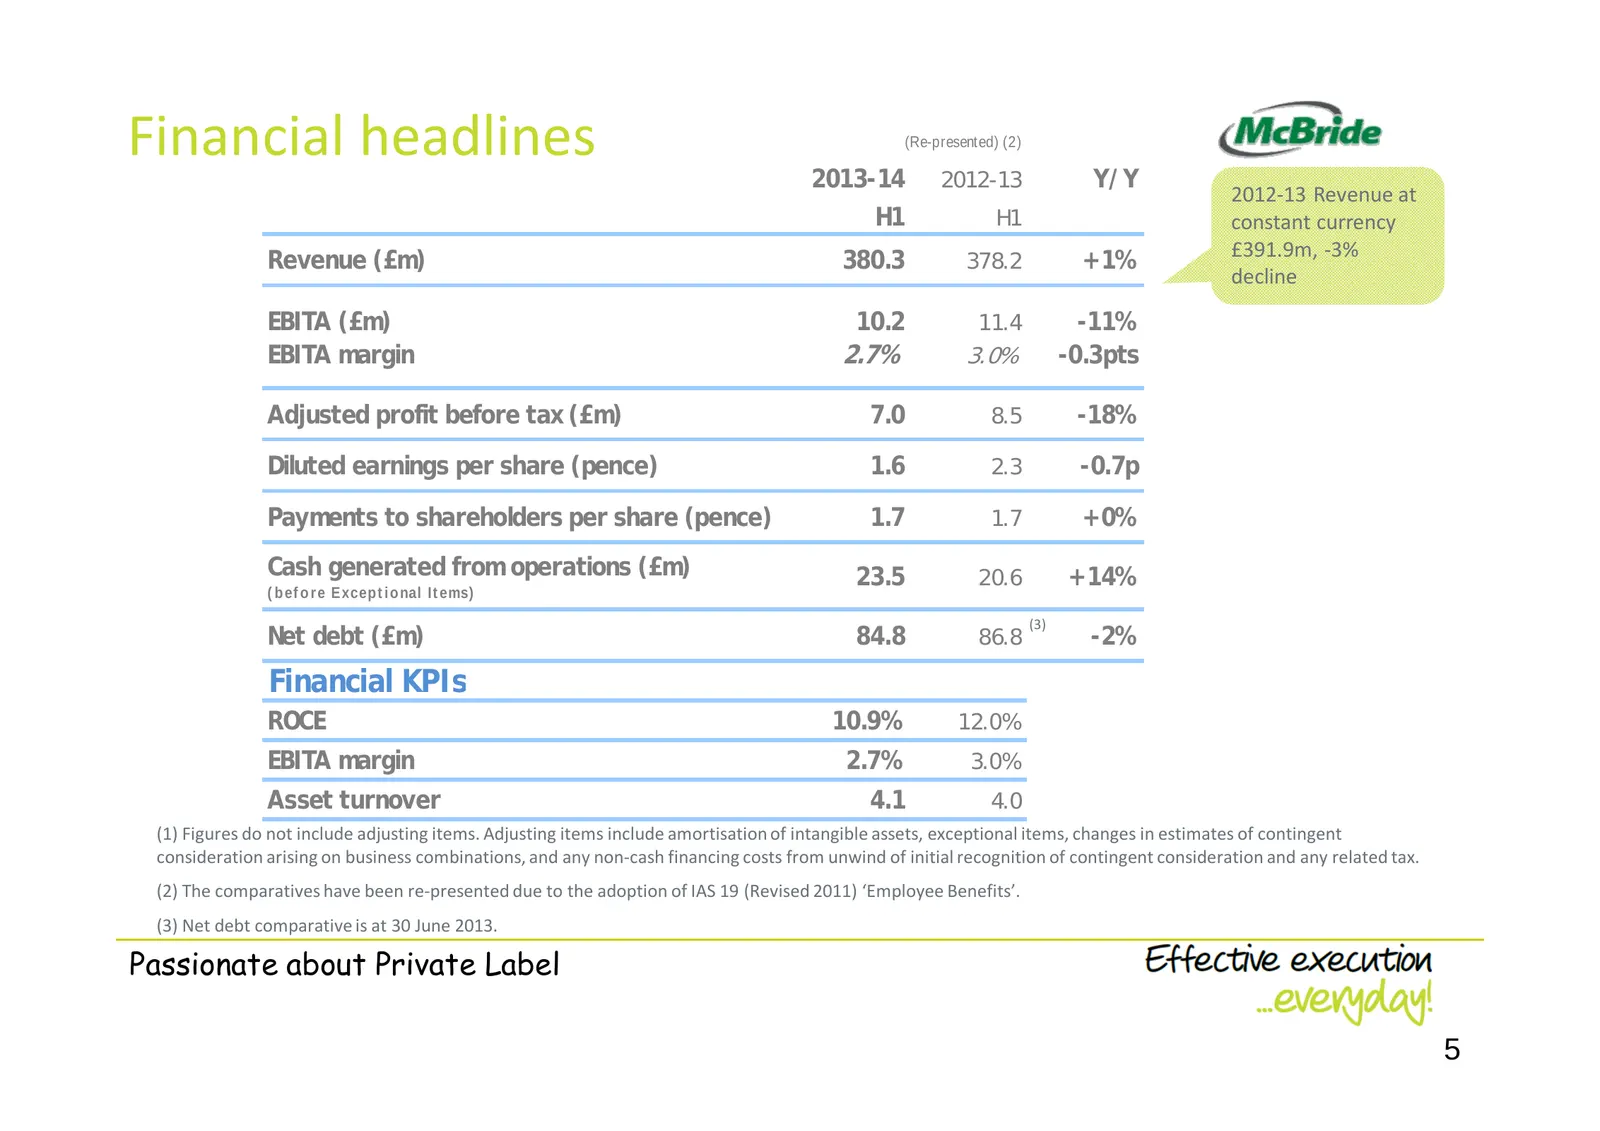
Slide 5: Financial headlines
Financial headlines (Re-presented) (2) 2013-14 2012-13 Y/Y 2012‐13 Revenue at H1 H1 constant currency £391.9m, ‐3% Revenue (£m) 380.3 378.2 +1% decline EBITA (£m) 10.2 11.4 -11% EBITA margin 2.7% 3.0% -0.3pts Adjusted profit before tax (£m) 7.0 8.5 -18% Diluted earnings per share (pence) 1.6 2.3 -0.
Slide 6: Income statement
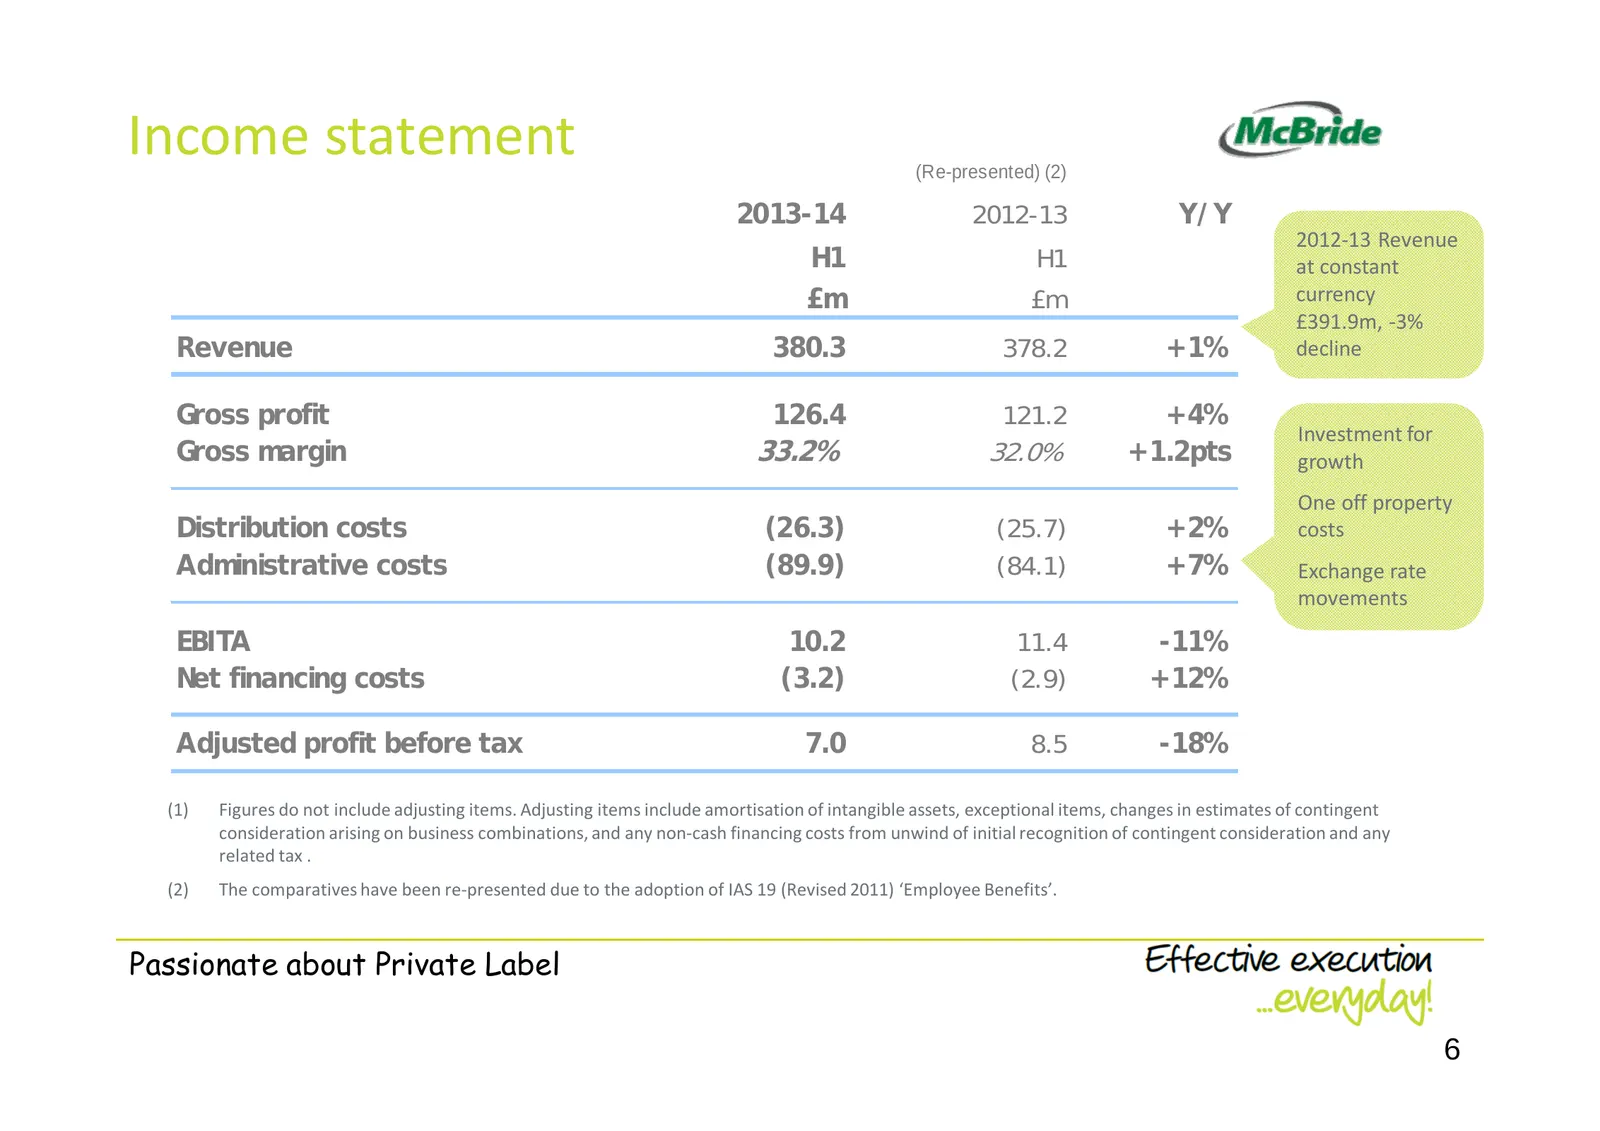
Income statement (Re-presented) (2) 2013-14 2012-13 Y/Y 2012‐13 Revenue H1 H1 at constant £m £m currency £391.9m, ‐3% Revenue 380.3 378.2 +1% decline Gross profit 126.4 121.2 +4% Investment for Gross margin 33.2% 32.0% +1.2pts growth One off property Distribution costs (26.3) (25.7) +2% costs Admini
Slide 7: Regional performance – Revenue
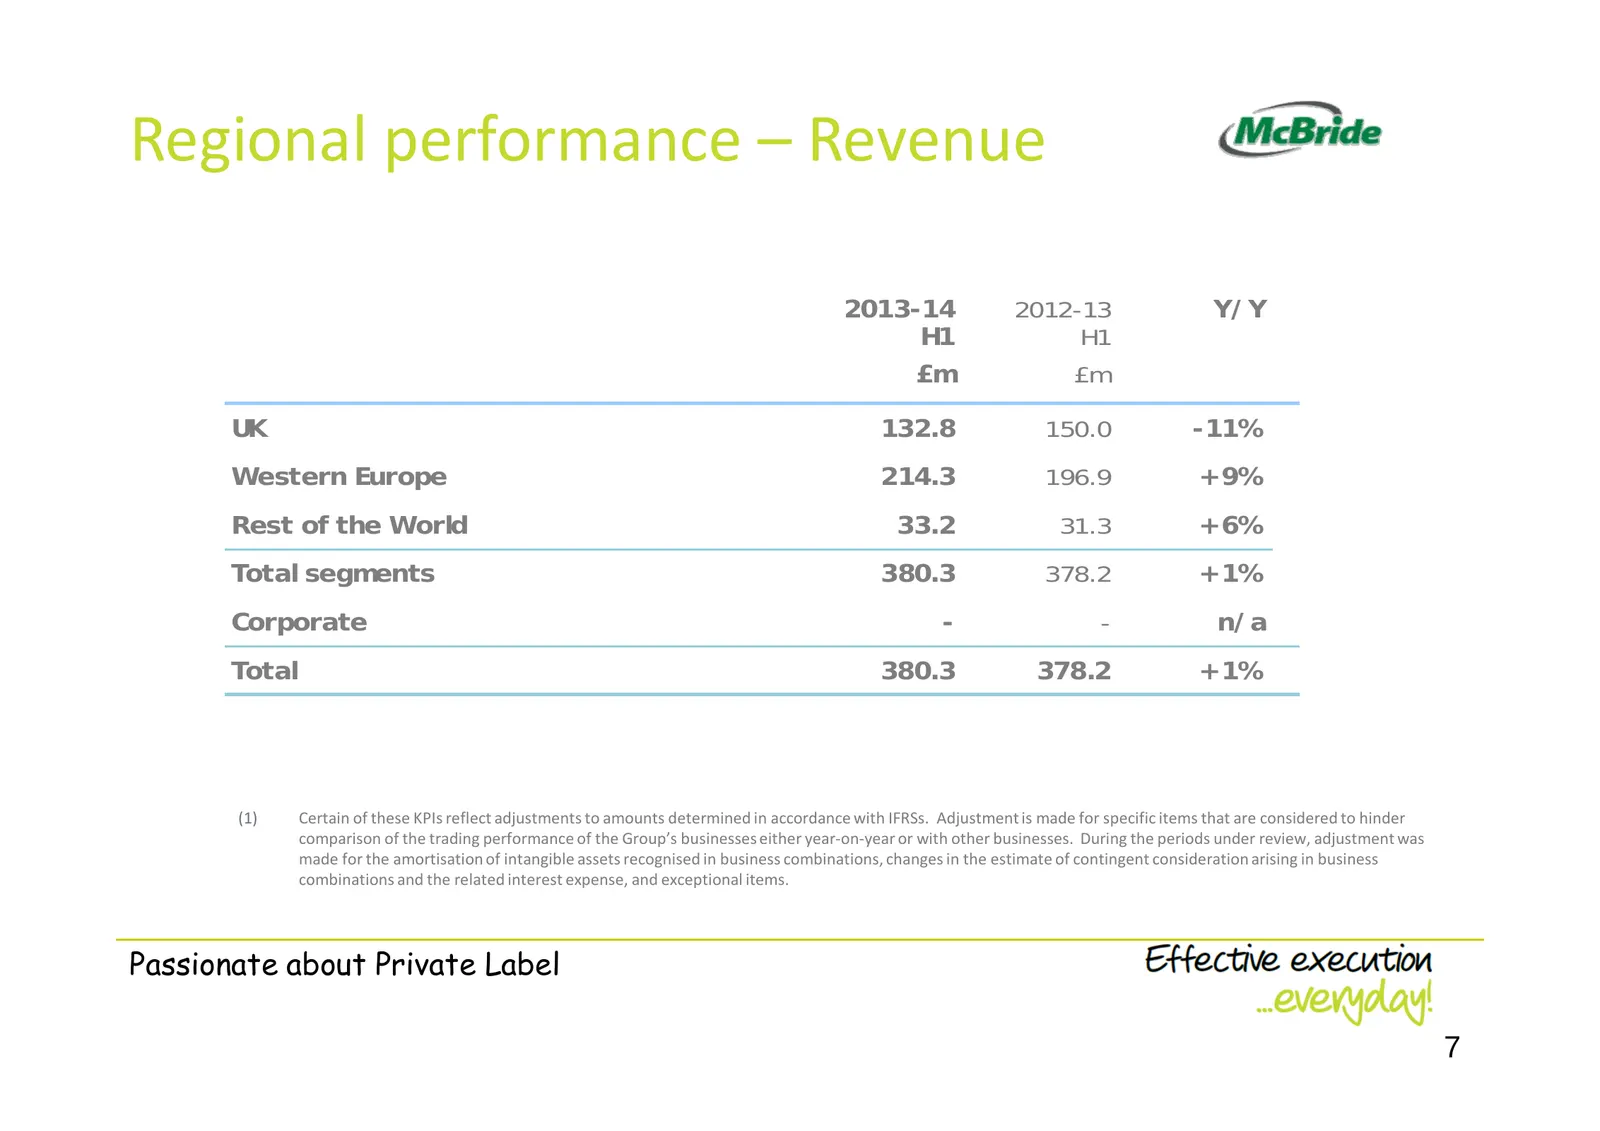
Regional performance – Revenue 2013-14 2012-13 Y/Y H1 H1 £m £m UK 132.8 150.0 -11% Western Europe 214.3 196.9 +9% Rest of the World 33.2 31.3 +6% Total segments 380.3 378.2 +1% Corporate - - n/a Total 380.3 378.2 +1% (1) Certain of these KPIs reflect adjustments to amounts determined in accordance w
Slide 8: Regional performance – Operating profit
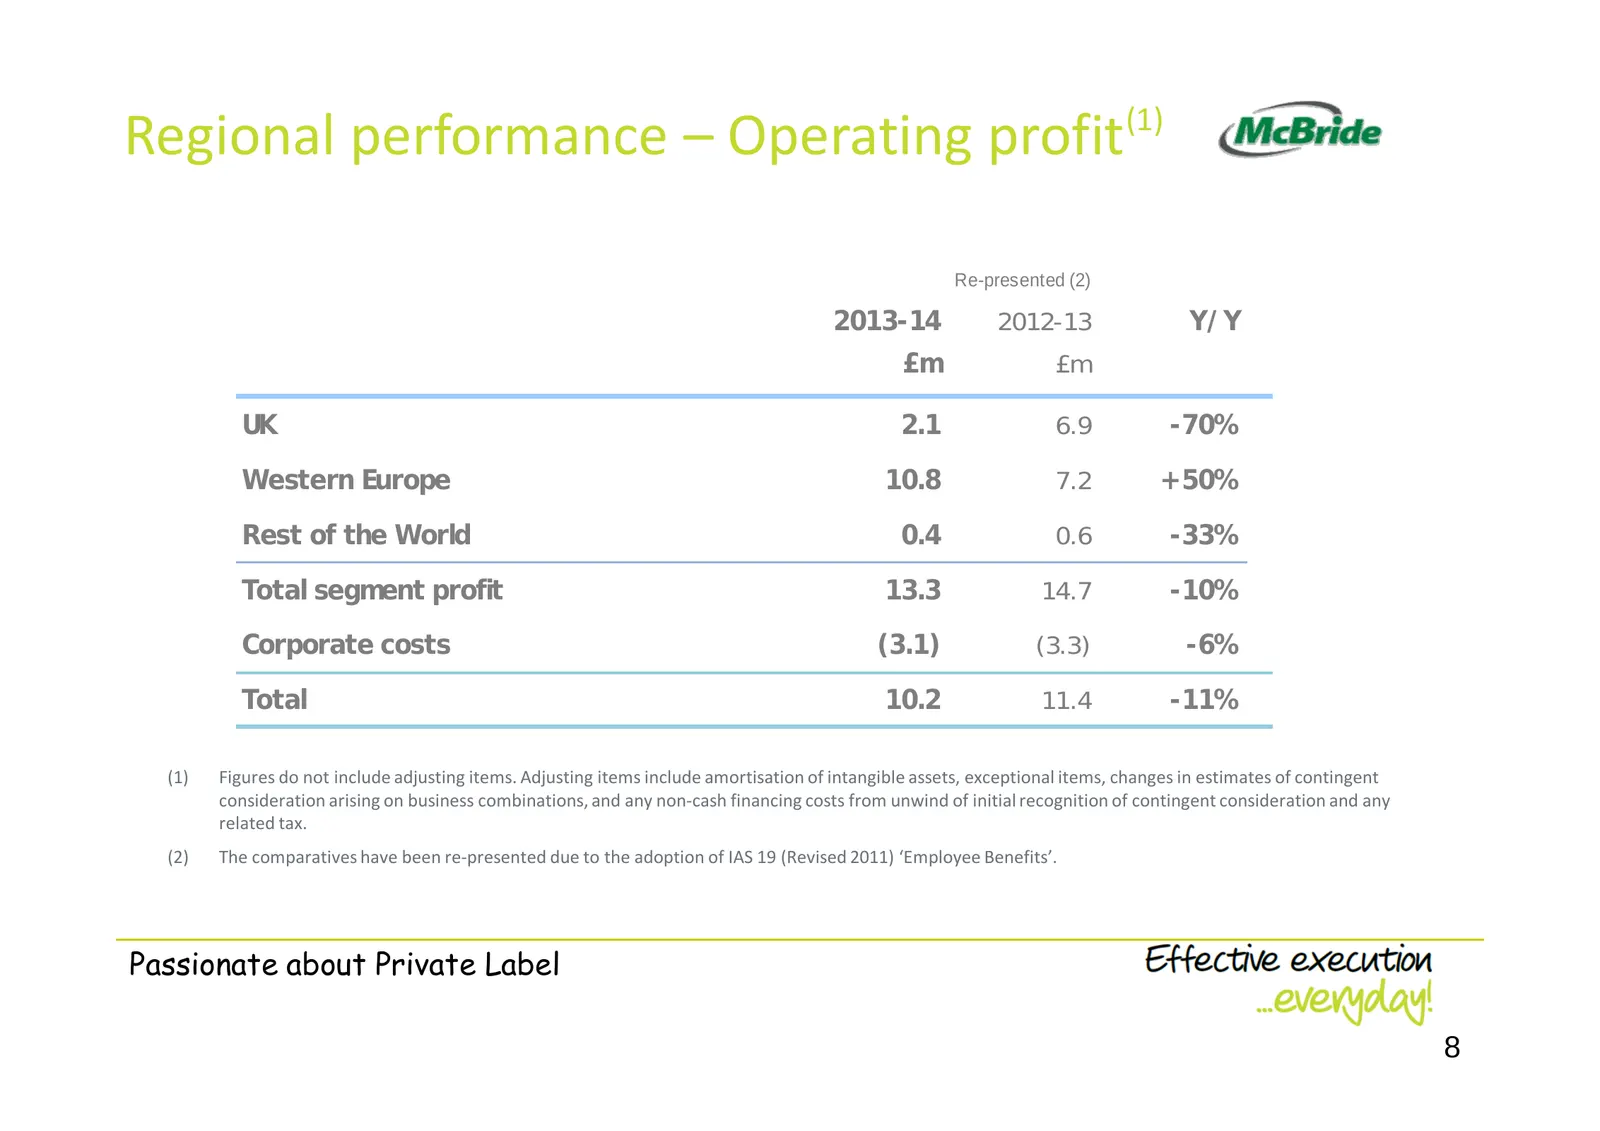
Regional performance – Operating profit(1) Re-presented (2) 2013-14 2012-13 Y/Y £m £m UK 2.1 6.9 -70% Western Europe 10.8 7.2 +50% Rest of the World 0.4 0.6 -33% Total segment profit 13.3 14.7 -10% Corporate costs (3.1) (3.3) -6% Total 10.2 11.4 -11% (1) Figures do not include adjusting items. Adjus
Slide 9: Movement in net debt June 2013 to December 2013
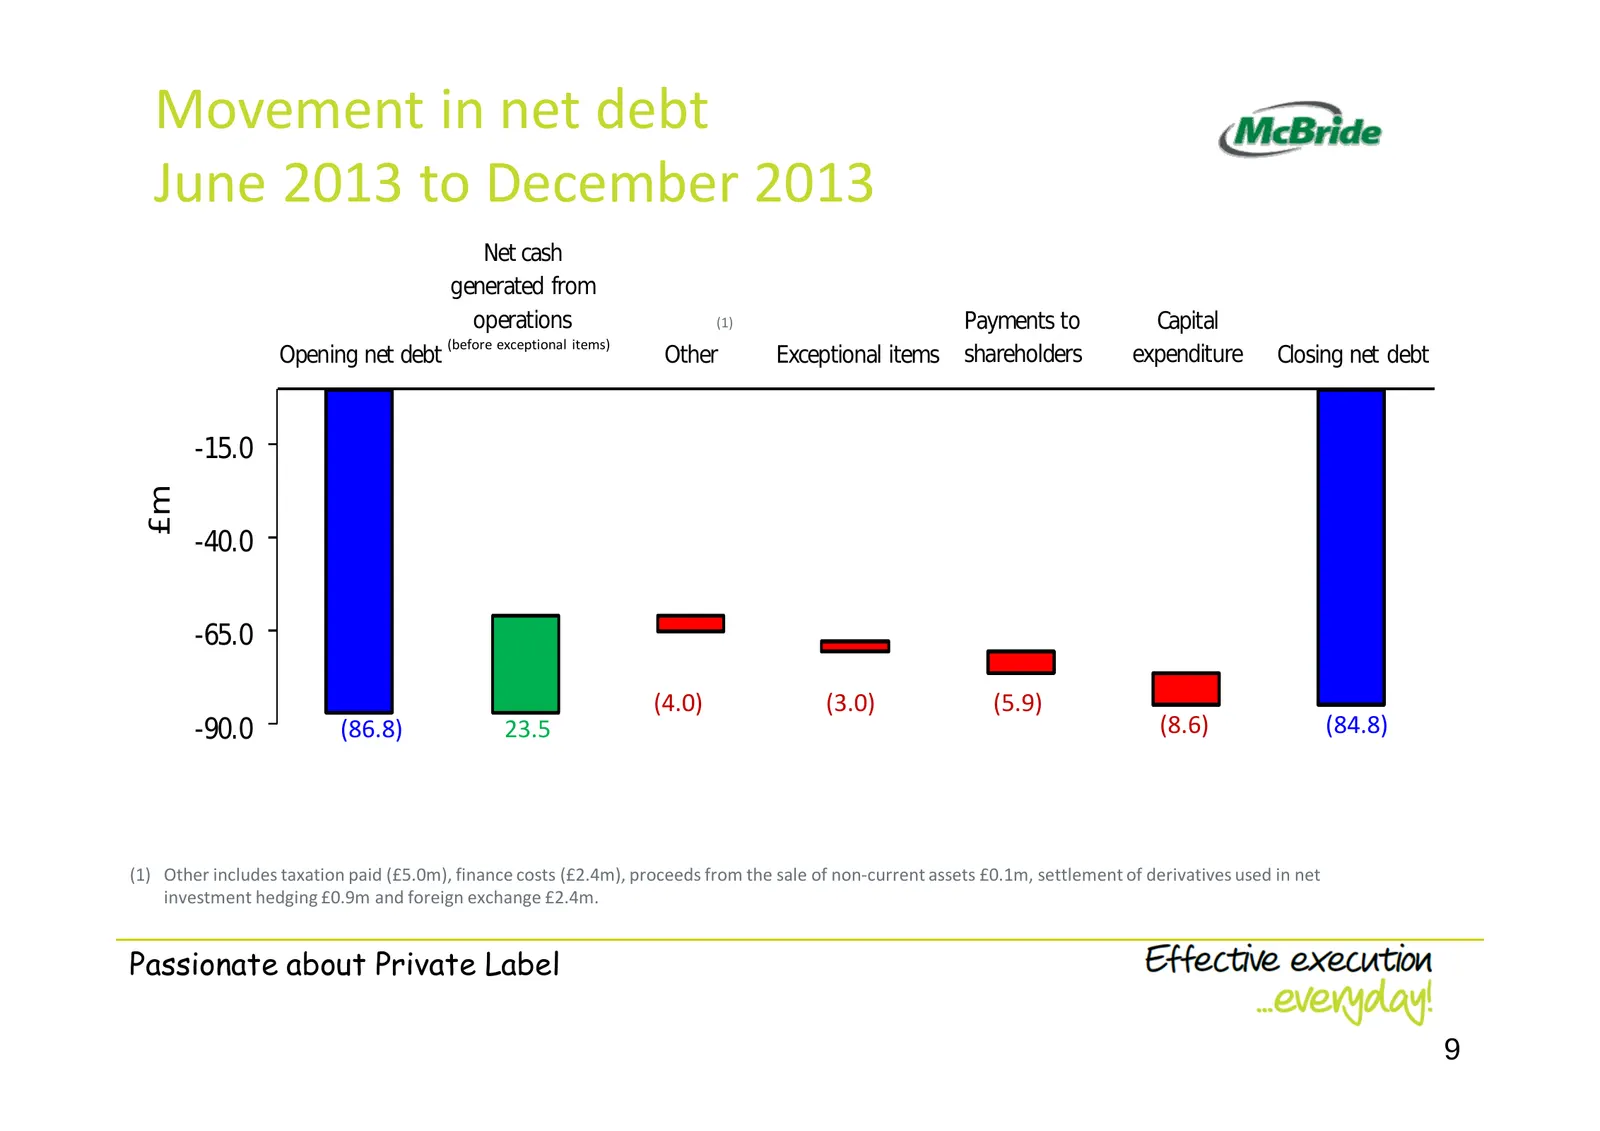
Movement in net debt June 2013 to December 2013 Net cash generated from operations (1) Payments to Capital Opening net debt (before exceptional items) Other Exceptional items shareholders expenditure Closing net debt -15.0 £m -40.0 -65.0 (4.0) (3.0) (5.9) -90.0 (86.8) 23.5 (8.6) (84.8) (1) Other inc
Slide 10: Oil and oil derivatives
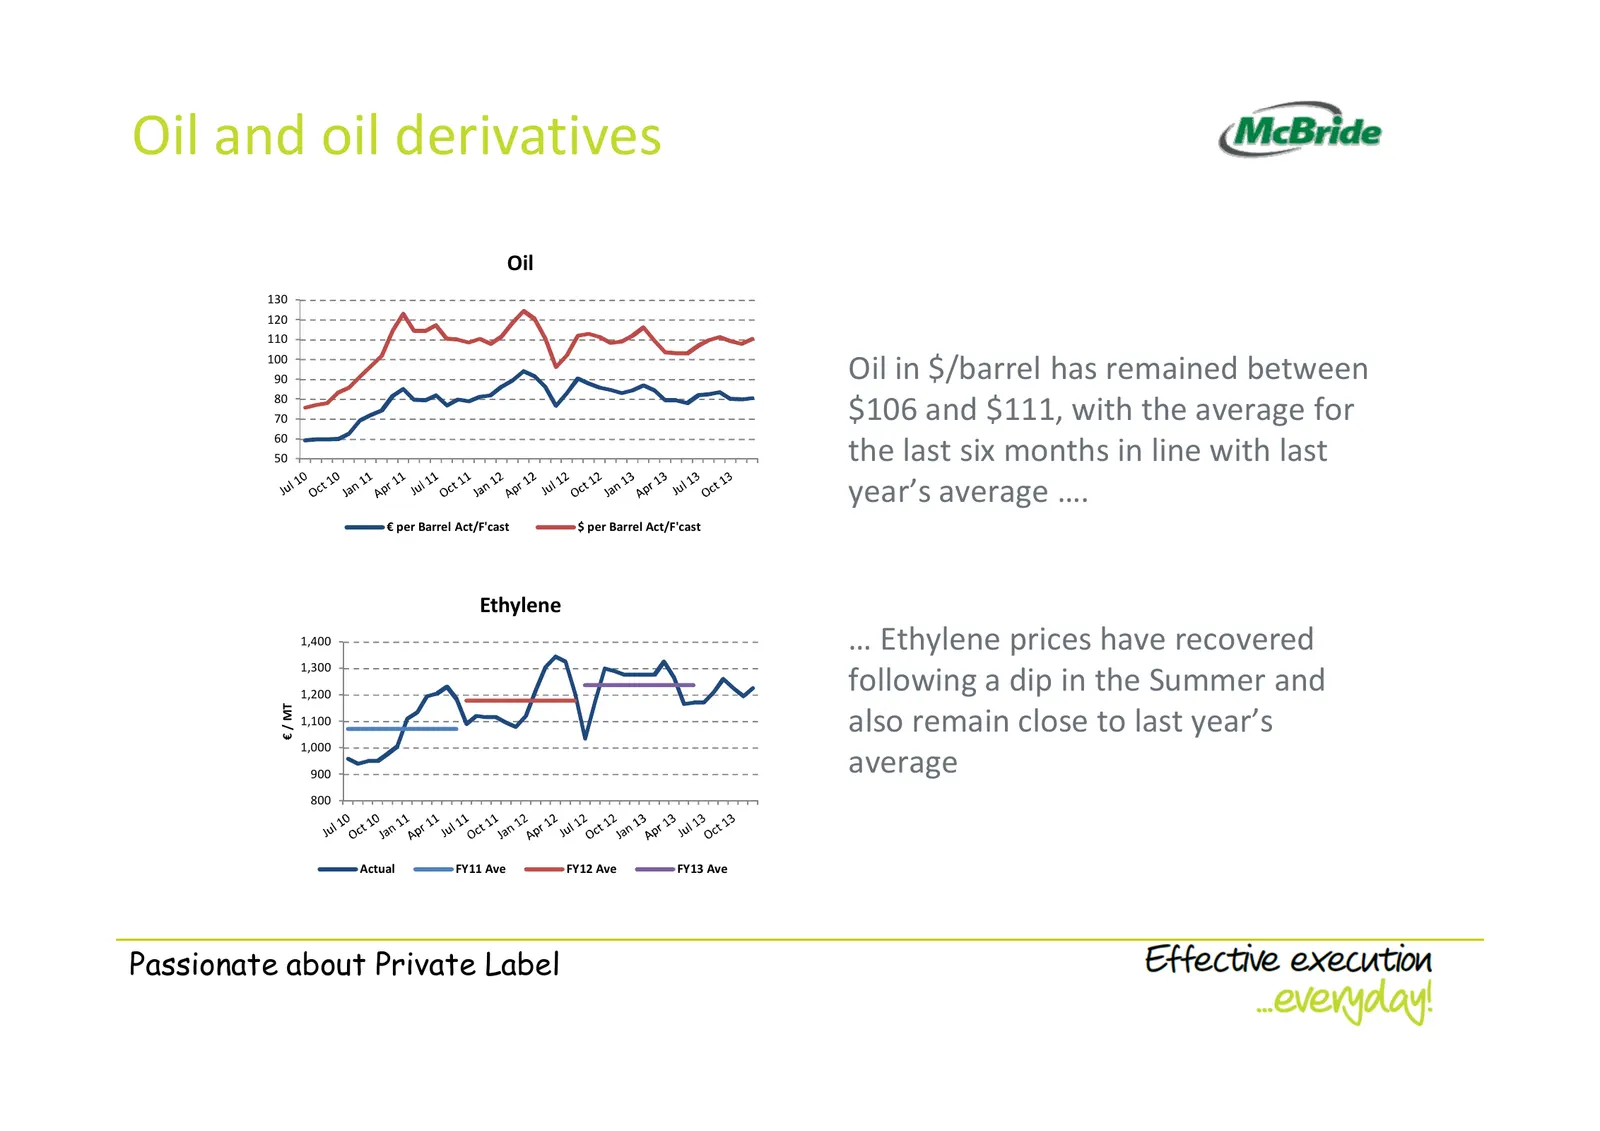
Oil and oil derivatives Oil 130 120 110 100 90 Oil in $/barrel has remained between 80 70 $106 and $111, with the average for 60 50 the last six months in line with last year’s average …. € per Barrel Act/F'cast $ per Barrel Act/F'cast Ethylene 1,400 … Ethylene prices have recovered 1,300 1,200 foll
Slide 11: Key feed-stocks
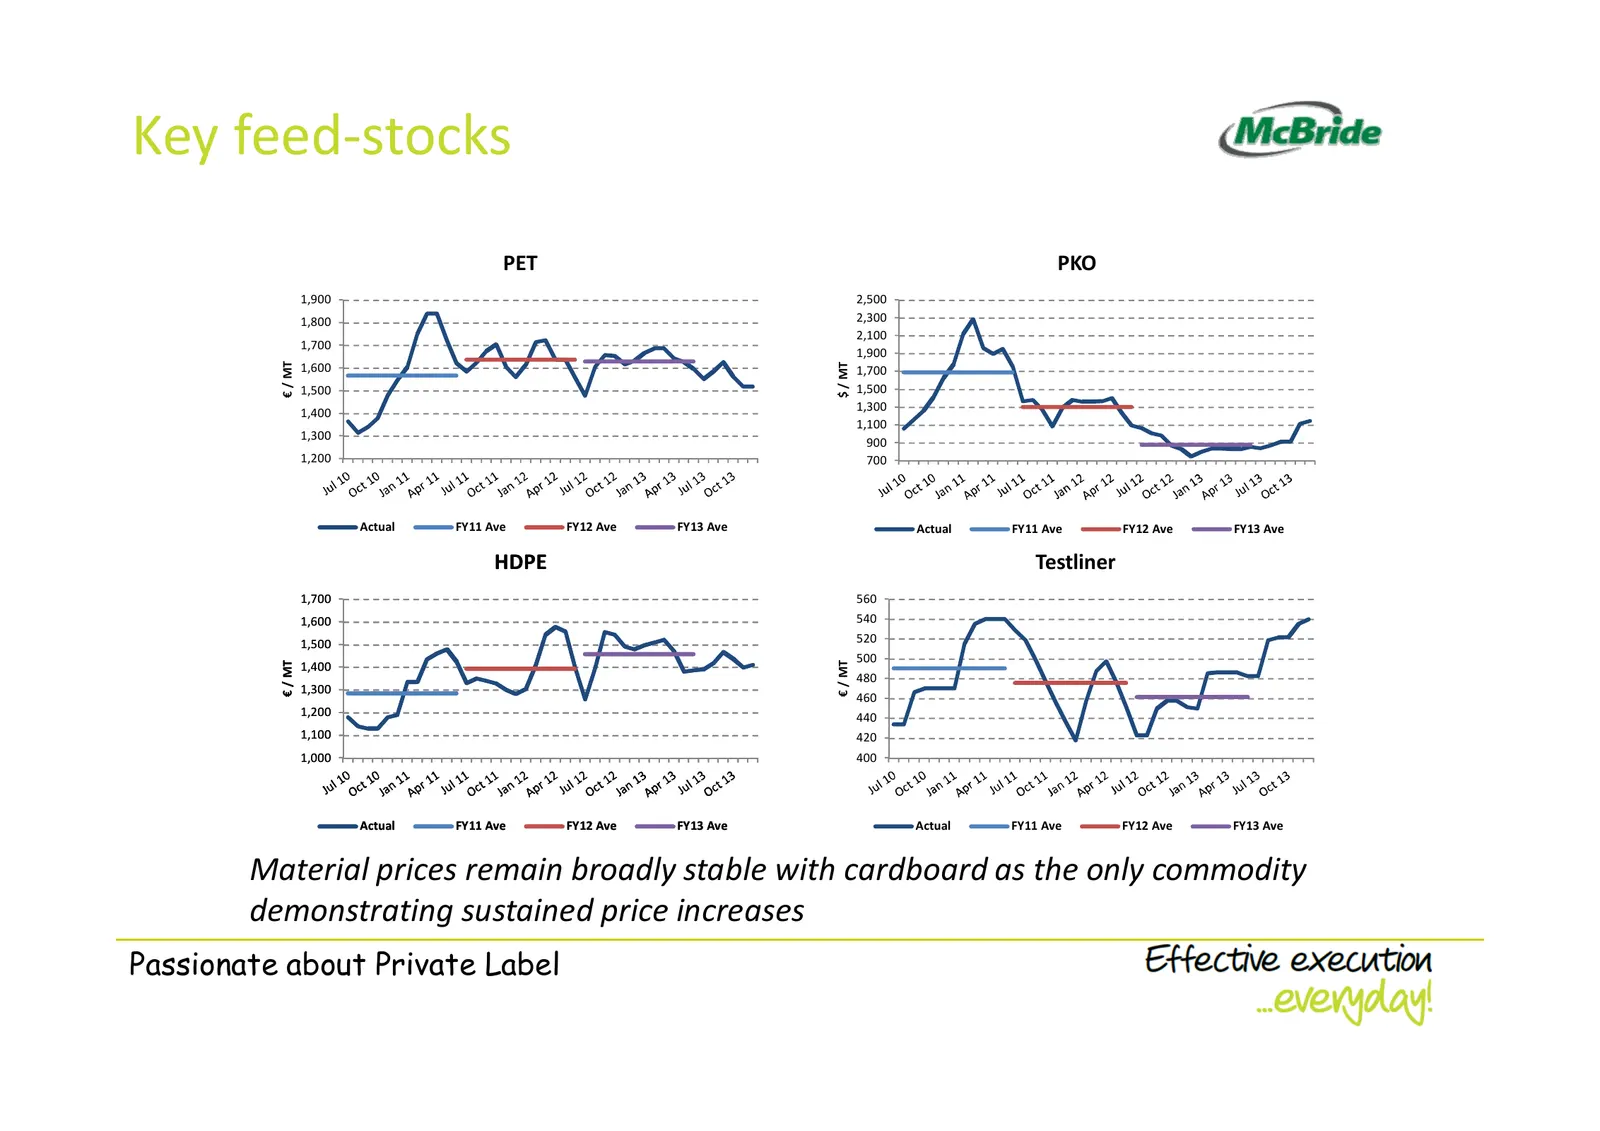
Key feed‐stocks PET PKO 1,900 2,500 1,800 2,300 2,100 1,700 1,900 € / MT $ / MT 1,600 1,700 1,500 1,500 1,400 1,300 1,100 1,300 900 1,200 700 Actual FY11 Ave FY12 Ave FY13 Ave Actual FY11 Ave FY12 Ave FY13 Ave HDPE Testliner 1,700 560 1,600 540 1,500 520 500 € / MT € / MT 1,400 480 1,300 460 1,200 4
Slide 12: Cost management
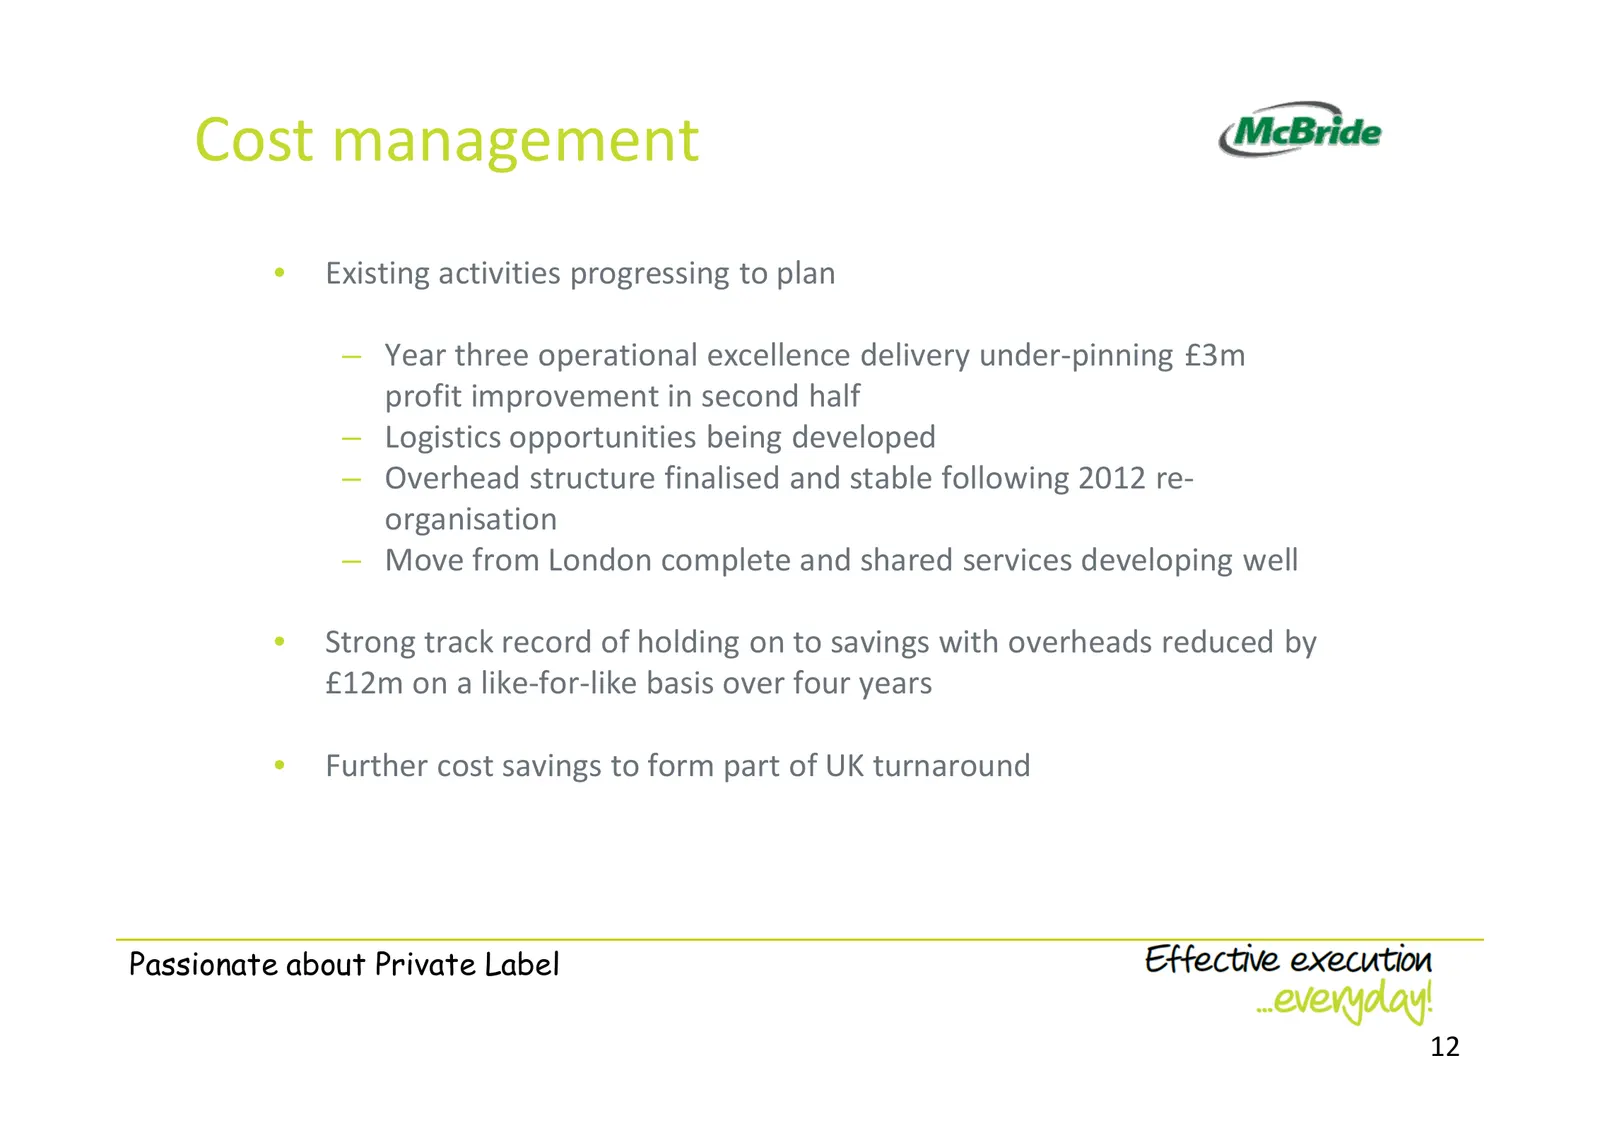
Cost management • Existing activities progressing to plan – Year three operational excellence delivery under‐pinning £3m profit improvement in second half – Logistics opportunities being developed – Overhead structure finalised and stable following 2012 re‐ organisation – Move from London complete a
Slide 13: Strategy update
Strategy update Chris Bull – Chief Executive Officer Passionate about Private Label 13
Slide 14: What we have achieved so far
What we have achieved so far • Core and Future Growth revenues up 2% and now account for over 50% of Private Label sales at period end (2012: 49%); • Strong growth in Germany and Poland and return to growth in France; • Continued progress in Asia Pacific; • Group‐led R&D function supporting delivery
Slide 15: Where we are achieving growth
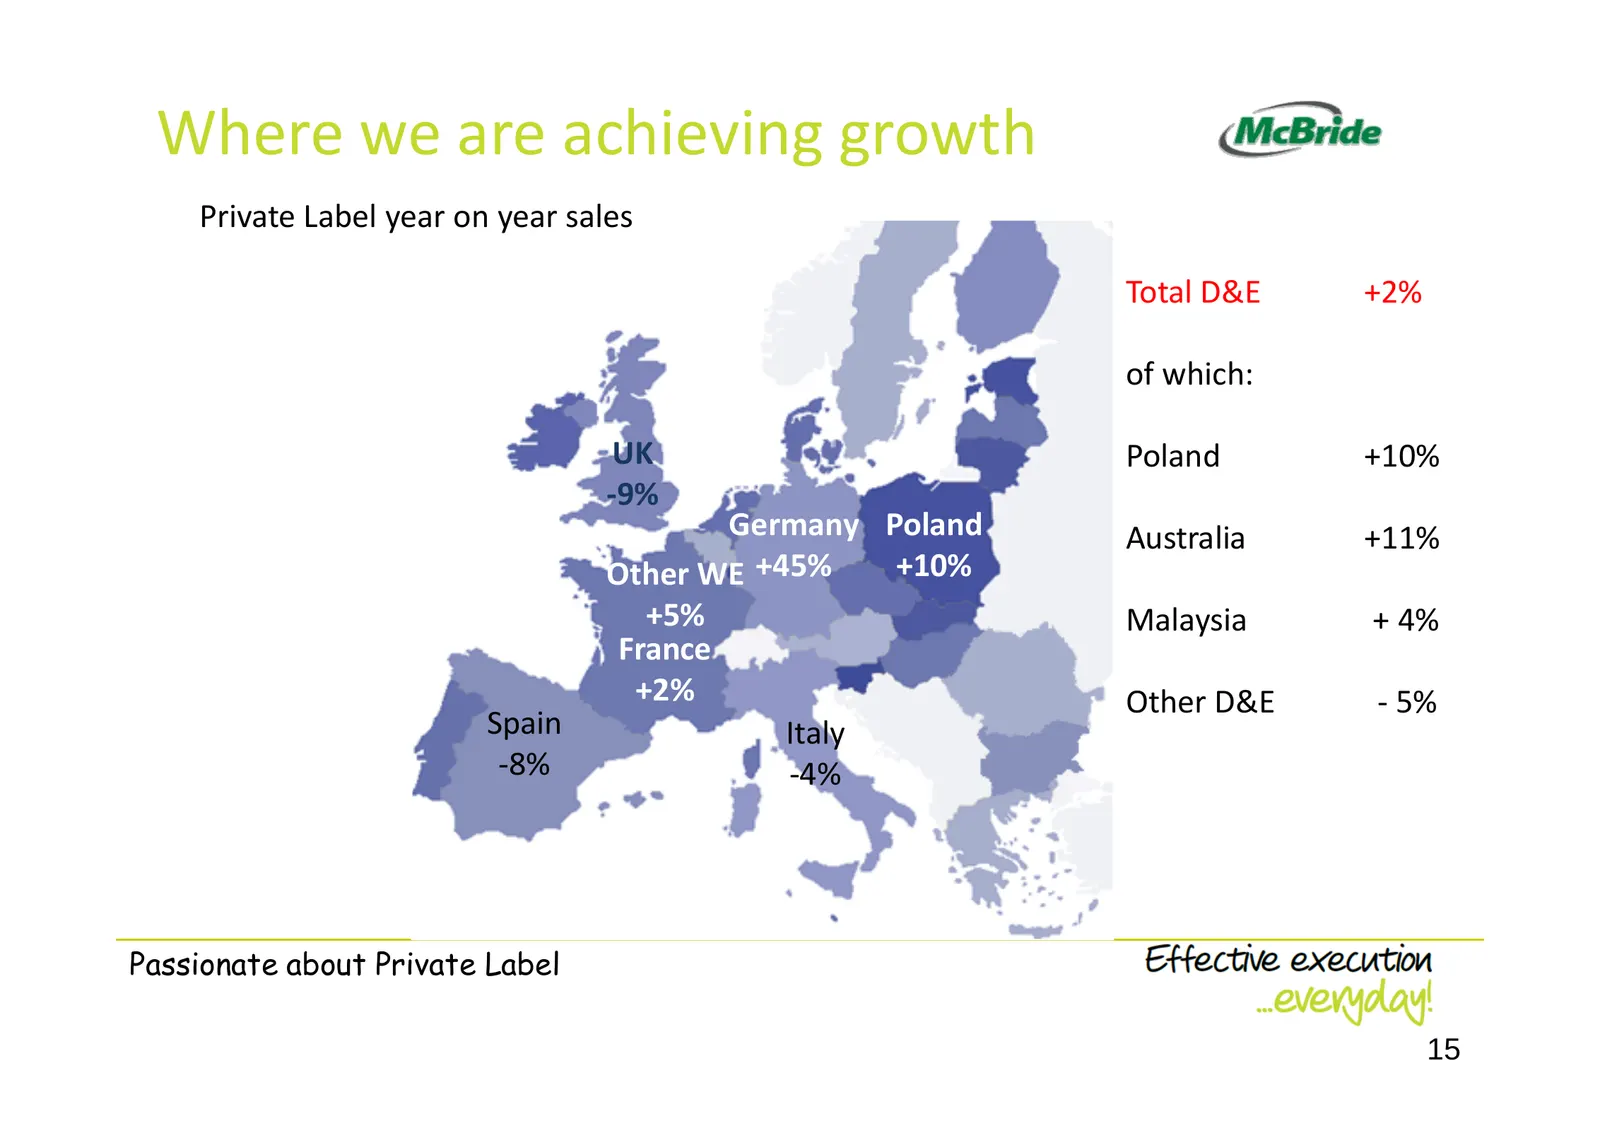
Where we are achieving growth Private Label year on year sales Total D&E +2% of which: UK Poland +10% ‐9% Germany Poland Australia +11% Other WE +45% +10% +5% Malaysia + 4% France +2% Other D&E ‐ 5% Spain Italy ‐8% ‐4% Passionate about Private Label 15
Slide 16: Tough trading conditions continue across Europe in the Household sector
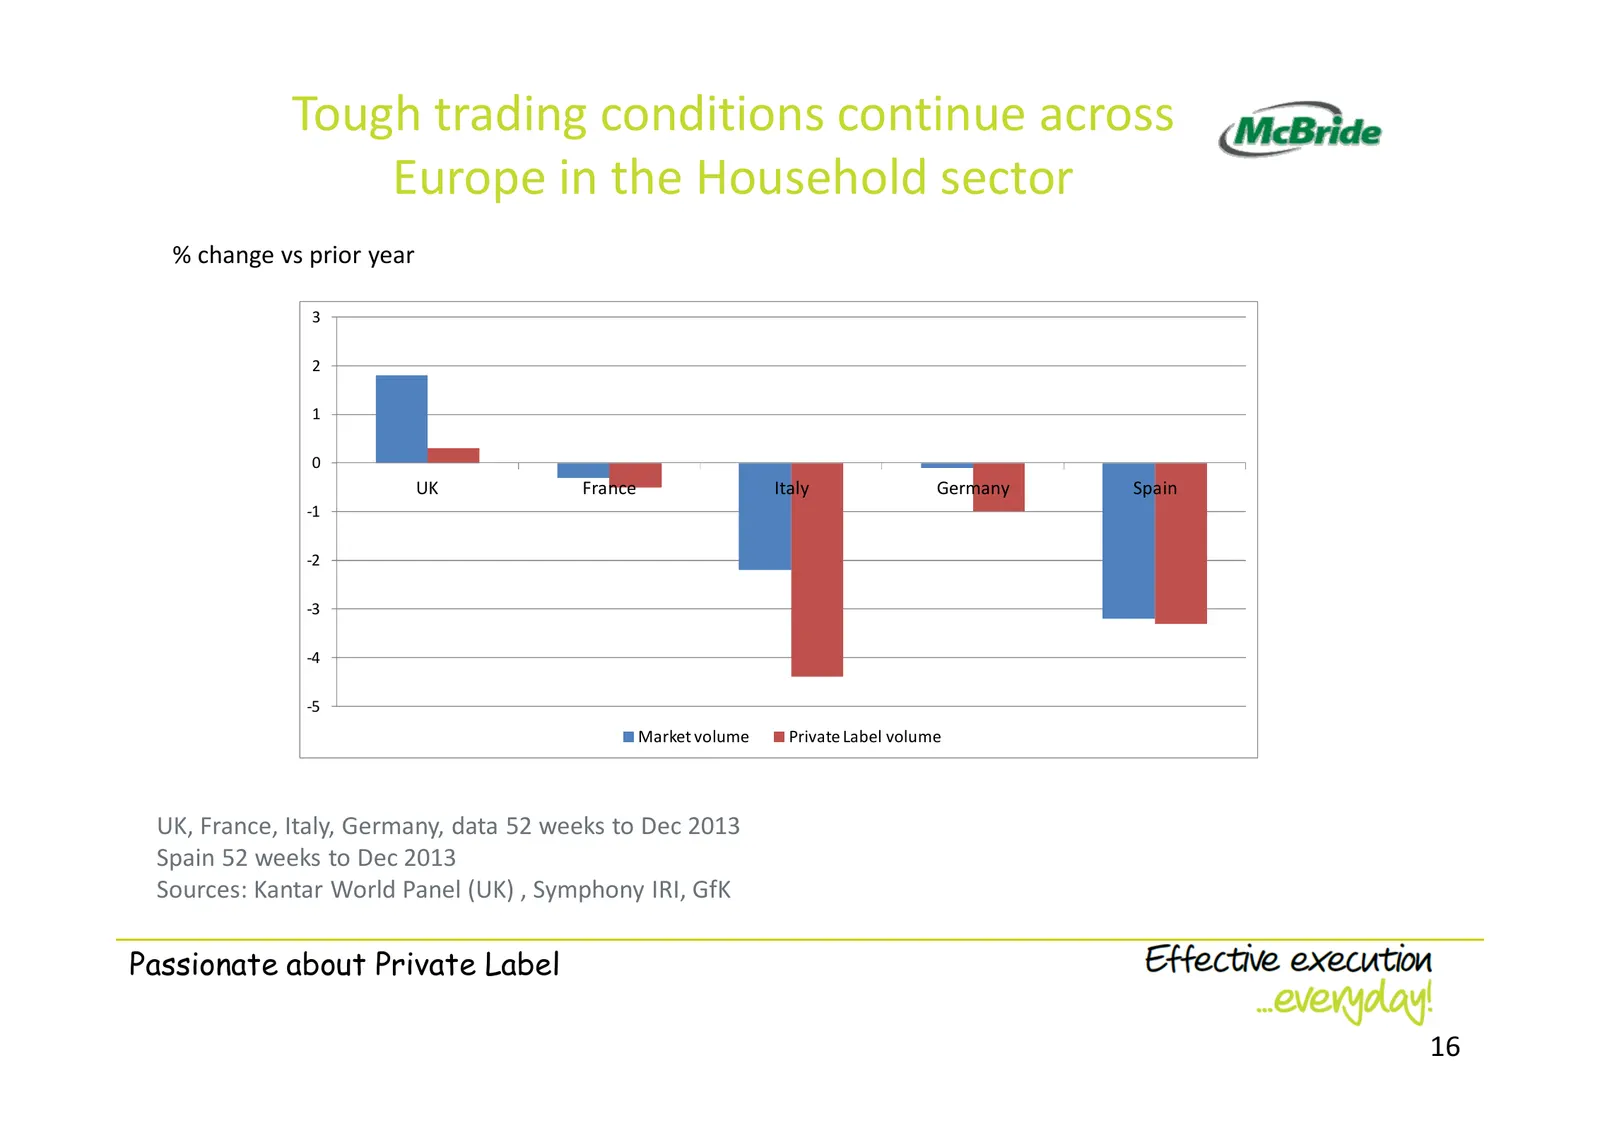
Tough trading conditions continue across Europe in the Household sector % change vs prior year 3 2 1 0 UK France Italy Germany Spain ‐1 ‐2 ‐3 ‐4 ‐5 Market volume Private Label volume UK, France, Italy, Germany, data 52 weeks to Dec 2013 Spain 52 weeks to Dec 2013 Sources: Kantar World Panel (UK) , S
Slide 17: Private Label Household volume shares 2013 vs 2012
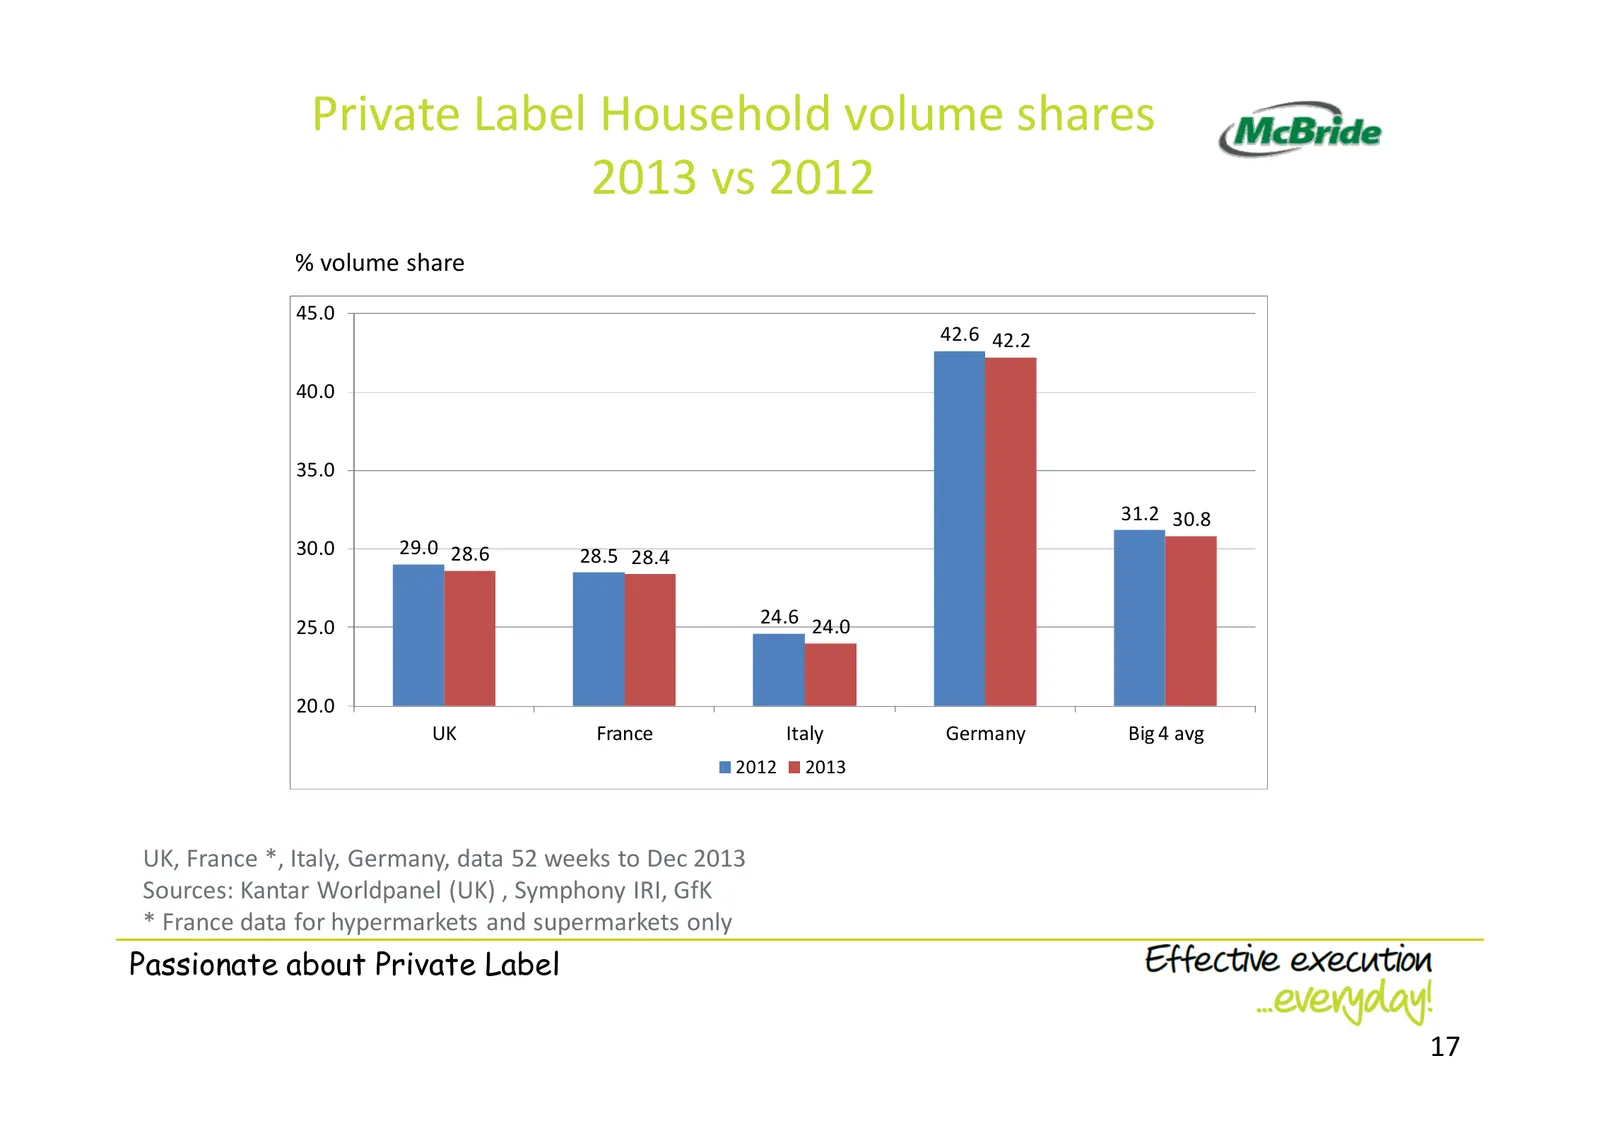
Private Label Household volume shares 2013 vs 2012 % volume share 45.0 42.6 42.2 40.0 35.0 31.2 30.8 30.0 29.0 28.6 28.5 28.4 25.0 24.6 24.0 20.0 UK France Italy Germany Big 4 avg 2012 2013 UK, France *, Italy, Germany, data 52 weeks to Dec 2013 Sources: Kantar Worldpanel (UK) , Symphony IRI, GfK *
Slide 18: Household and Personal Care products on promotion
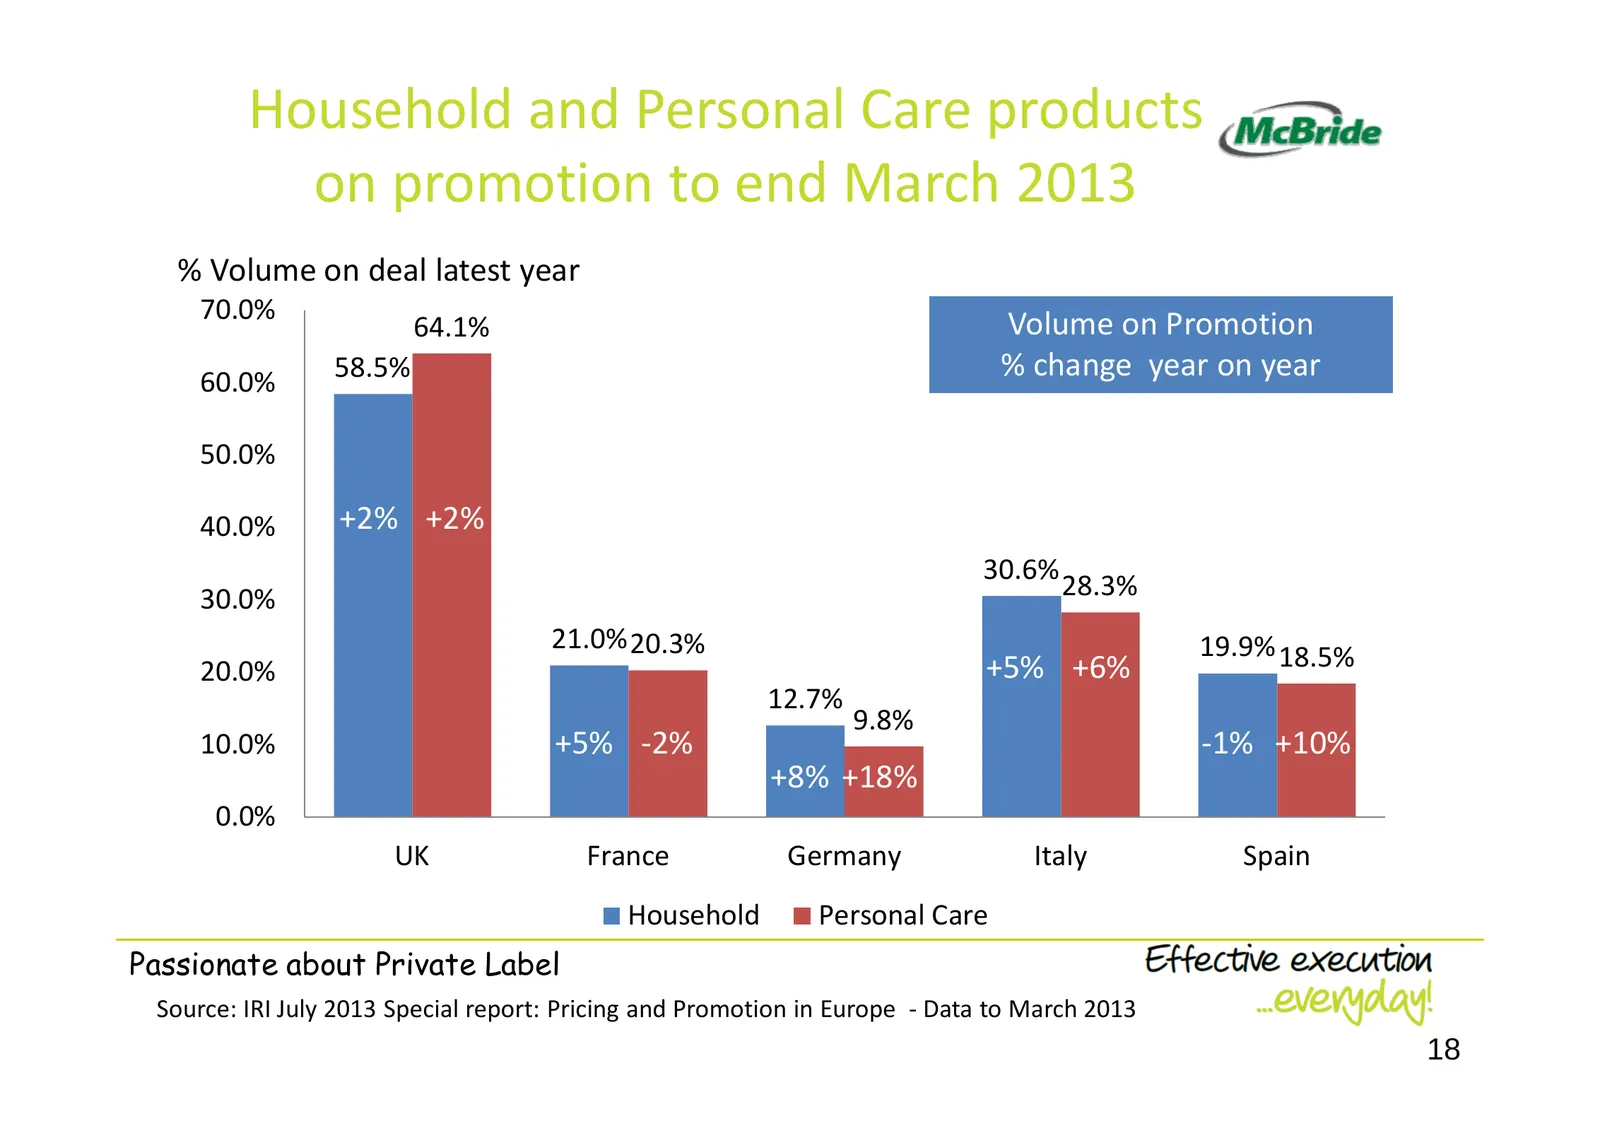
Household and Personal Care products on promotion to end March 2013 % Volume on deal latest year 70.0% 64.1% Volume on Promotion 60.0% 58.5% % change year on year 50.0% 40.0% +2% +2% 30.6% 30.0% 28.3% 21.0% 20.3% 19.9% 18.5% 20.0% +5% +6% 12.7% 9.8% 10.0% +5% ‐2% ‐1% +10% +8% +18% 0.0% UK France Ger
Slide 19: Continuing UK Promotional activity Big Multiples
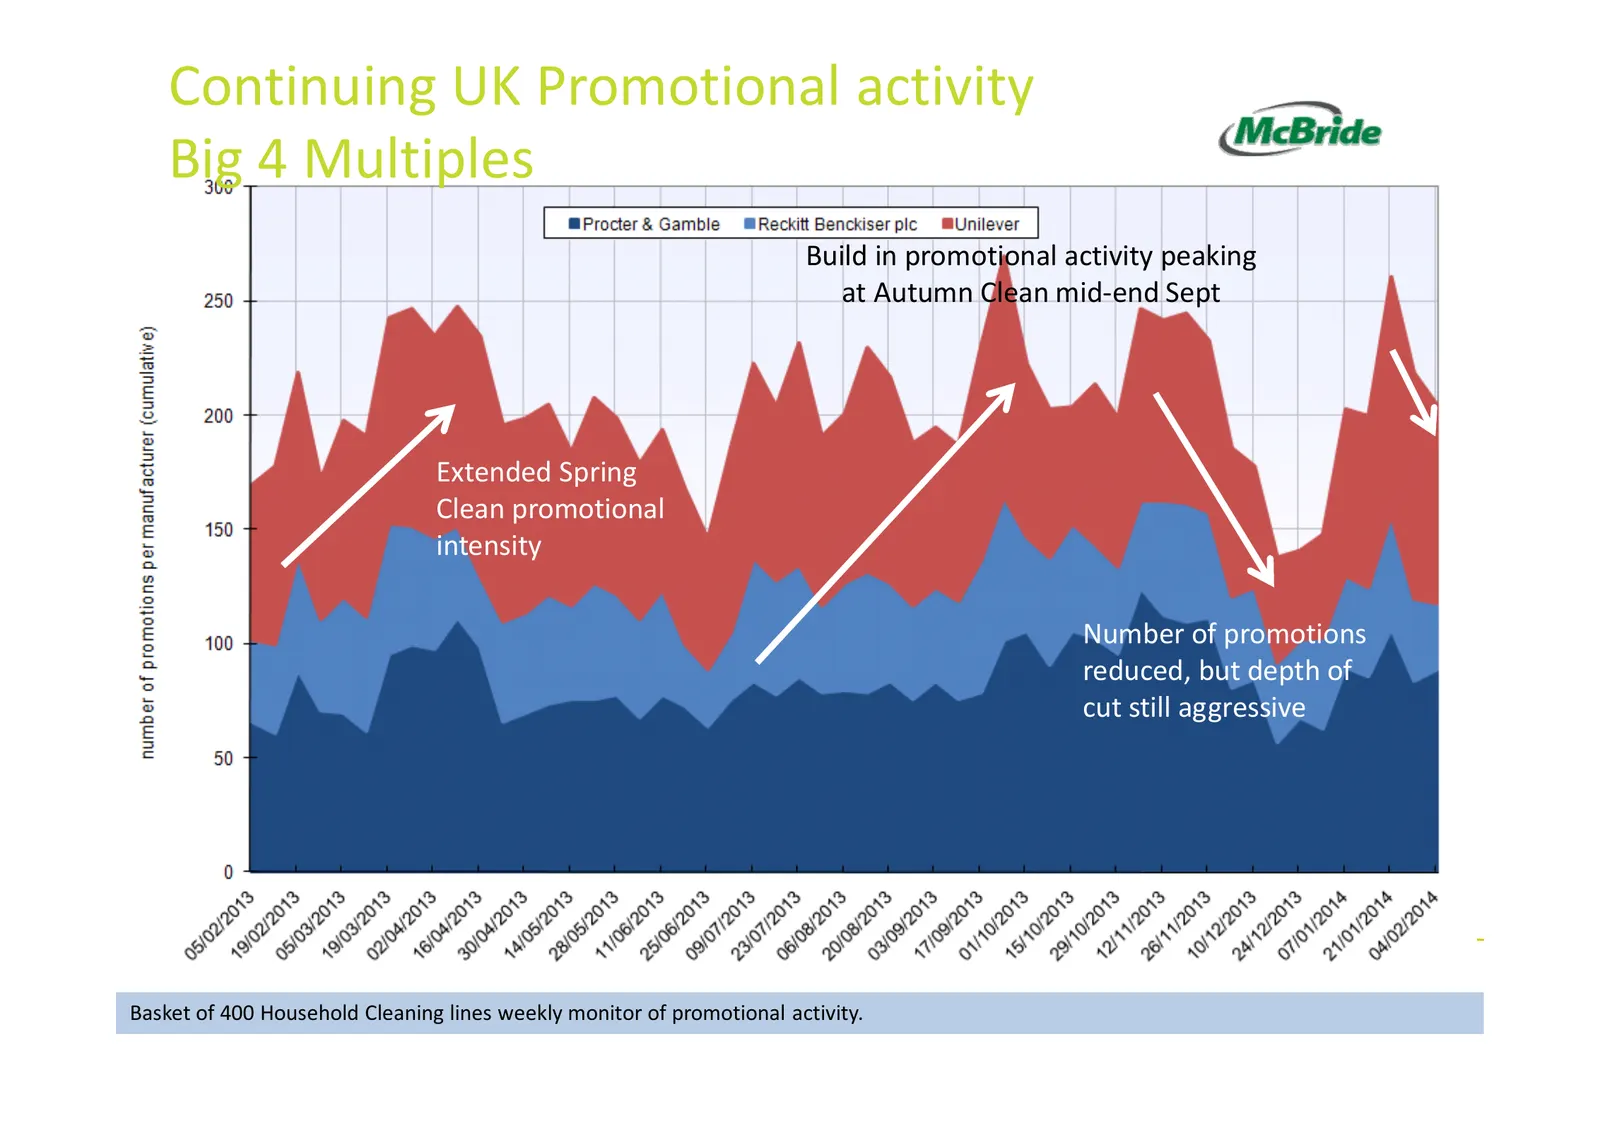
Continuing UK Promotional activity Big 4 Multiples Build in promotional activity peaking at Autumn Clean mid‐end Sept Extended Spring Clean promotional intensity Number of promotions reduced, but depth of cut still aggressive Passionate about Private Label Basket of 400 Household Cleaning lines week
Slide 20: Price Framing plinths support the value proposition of Private Label
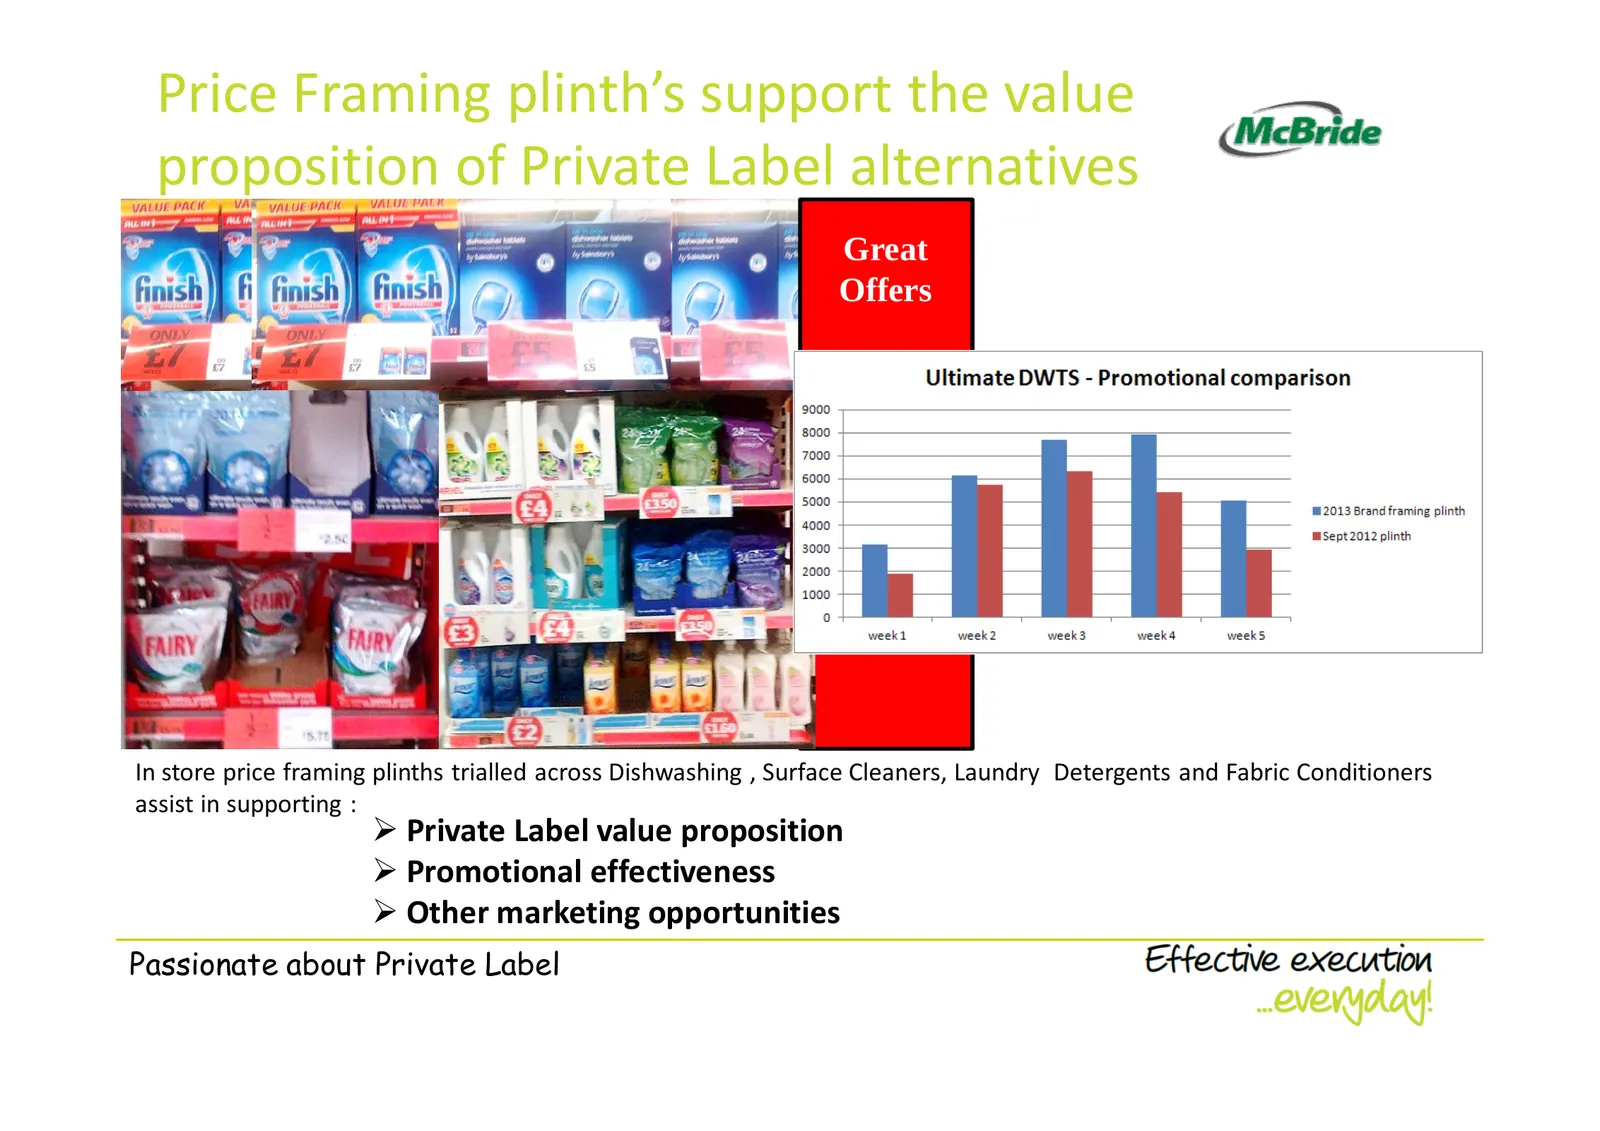
Price Framing plinth’s support the value proposition of Private Label alternatives Great Offers In store price framing plinths trialled across Dishwashing , Surface Cleaners, Laundry Detergents and Fabric Conditioners assist in supporting : Private Label value proposition Promotional effectivene
Slide 21: Growth through NPL
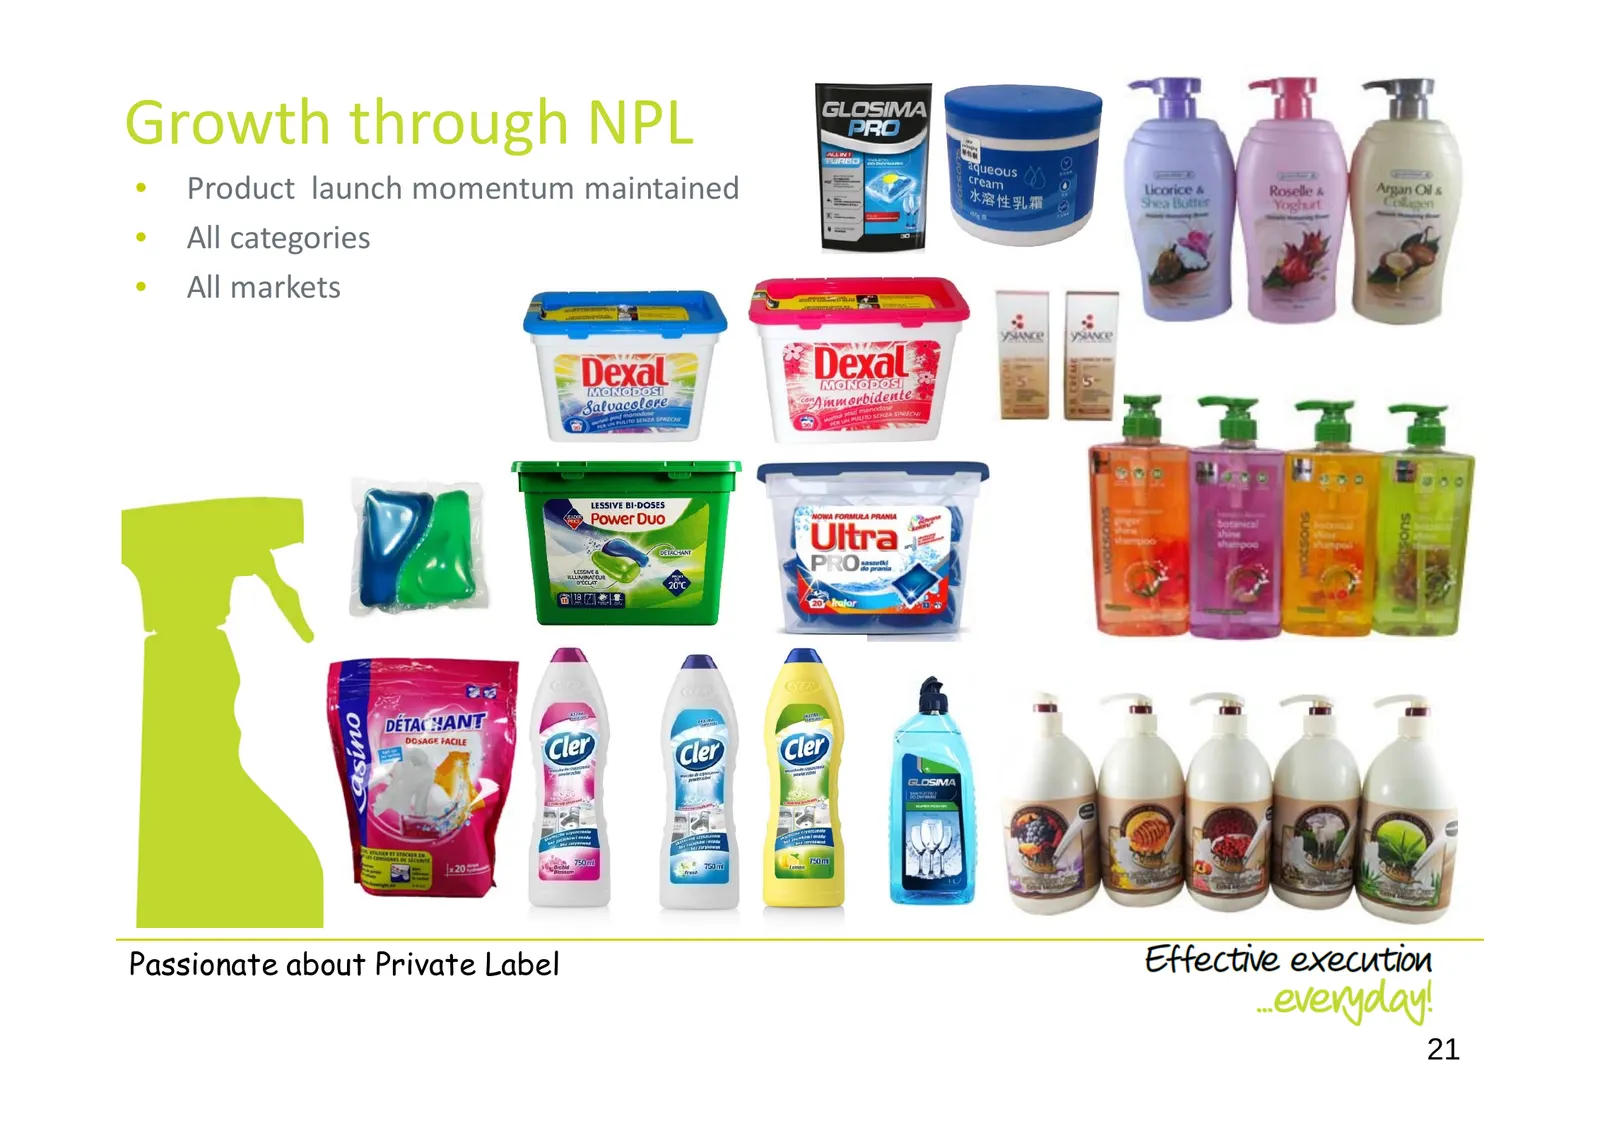
Growth through NPL • Product launch momentum maintained • All categories • All markets Passionate about Private Label 21
Slide 22: Growth through NPD
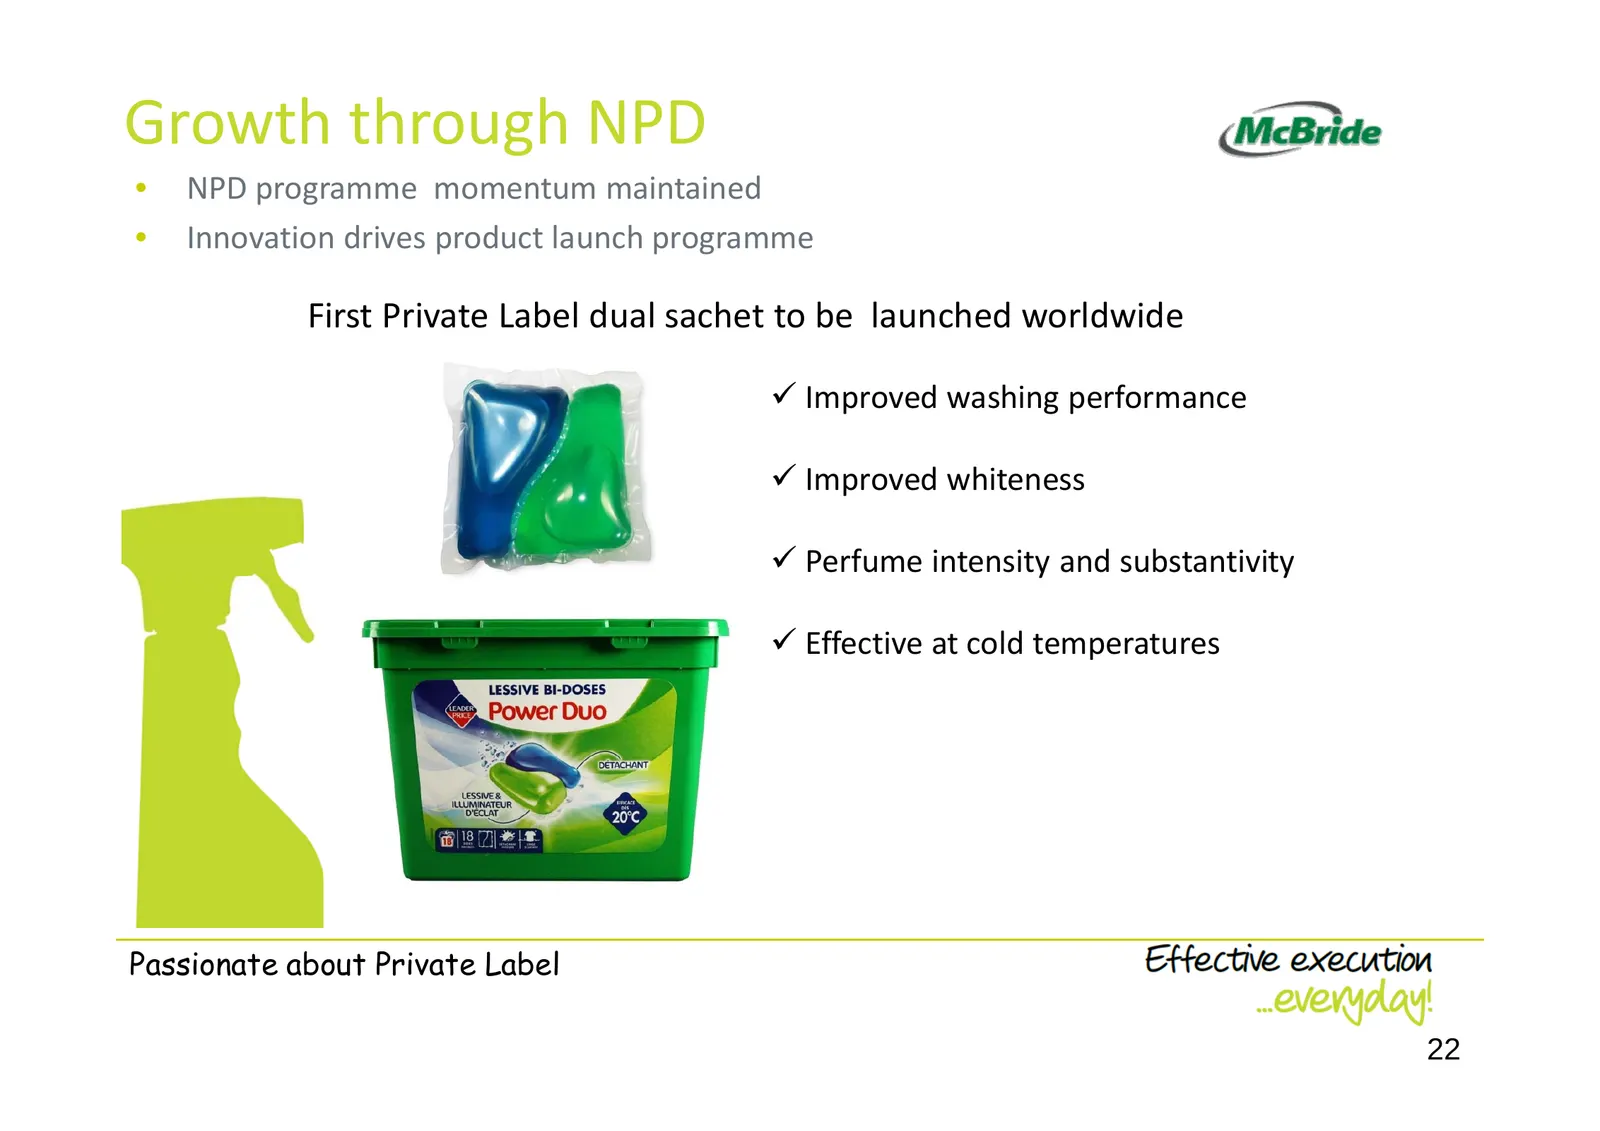
Growth through NPD • NPD programme momentum maintained • Innovation drives product launch programme First Private Label dual sachet to be launched worldwide Improved washing performance Improved whiteness Perfume intensity and substantivity Effective at cold temperatures Passionate about Pri
Slide 23: Increasing legislation and responsibility
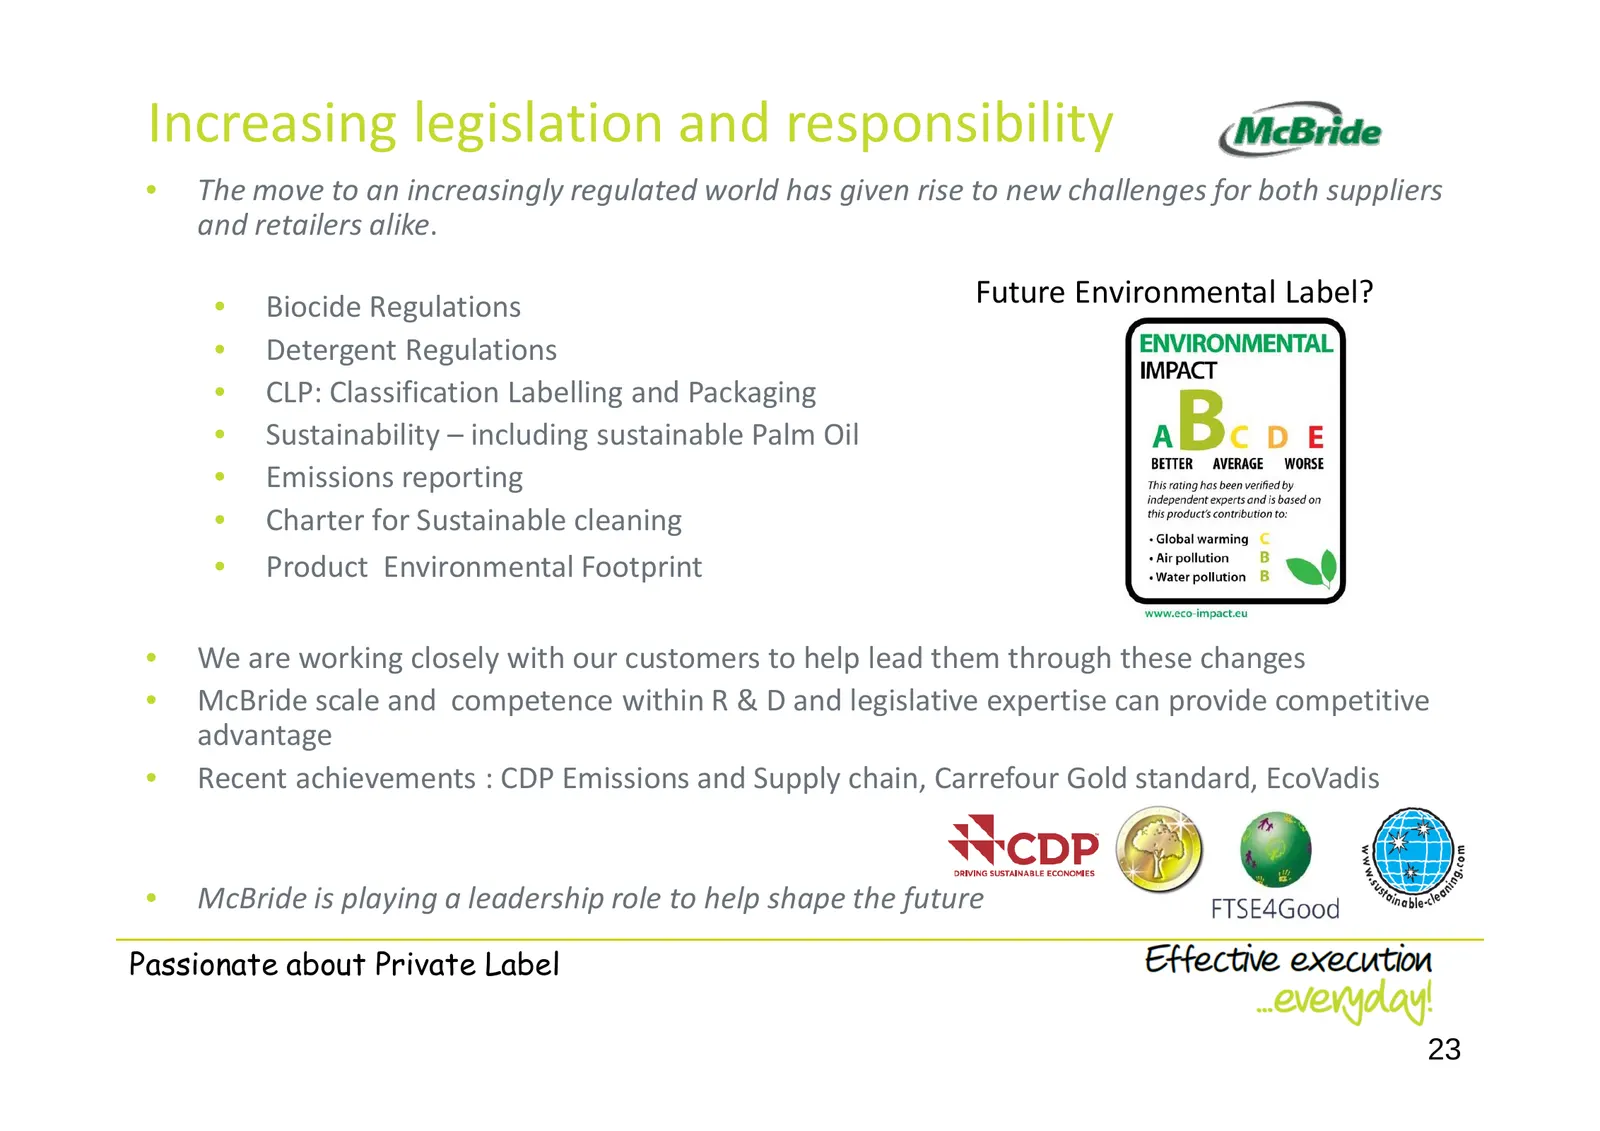
Increasing legislation and responsibility • The move to an increasingly regulated world has given rise to new challenges for both suppliers and retailers alike. • Biocide Regulations Future Environmental Label? • Detergent Regulations • CLP: Classification Labelling and Packaging • Sustainability –
Slide 24: Key Priorities for 2014
Key Priorities for 2014 • Drive Group revenue by building our new product launch pipeline • Leverage our unique capabilities to grow substantially in the mass markets of Central and Eastern Europe; and build for the future in Asia Pacific • Build on progress in Western Europe • Restore profitability
Slide 25: Passionate about Private Label
Passionate about Private Label 25
Slide 26: Q&A
Q&A Passionate about Private Label 26
Slide 27: Appendix
Appendix Passionate about Private Label 27
Slide 28: UK Household Private label Value and Volume share July - Dec 2013
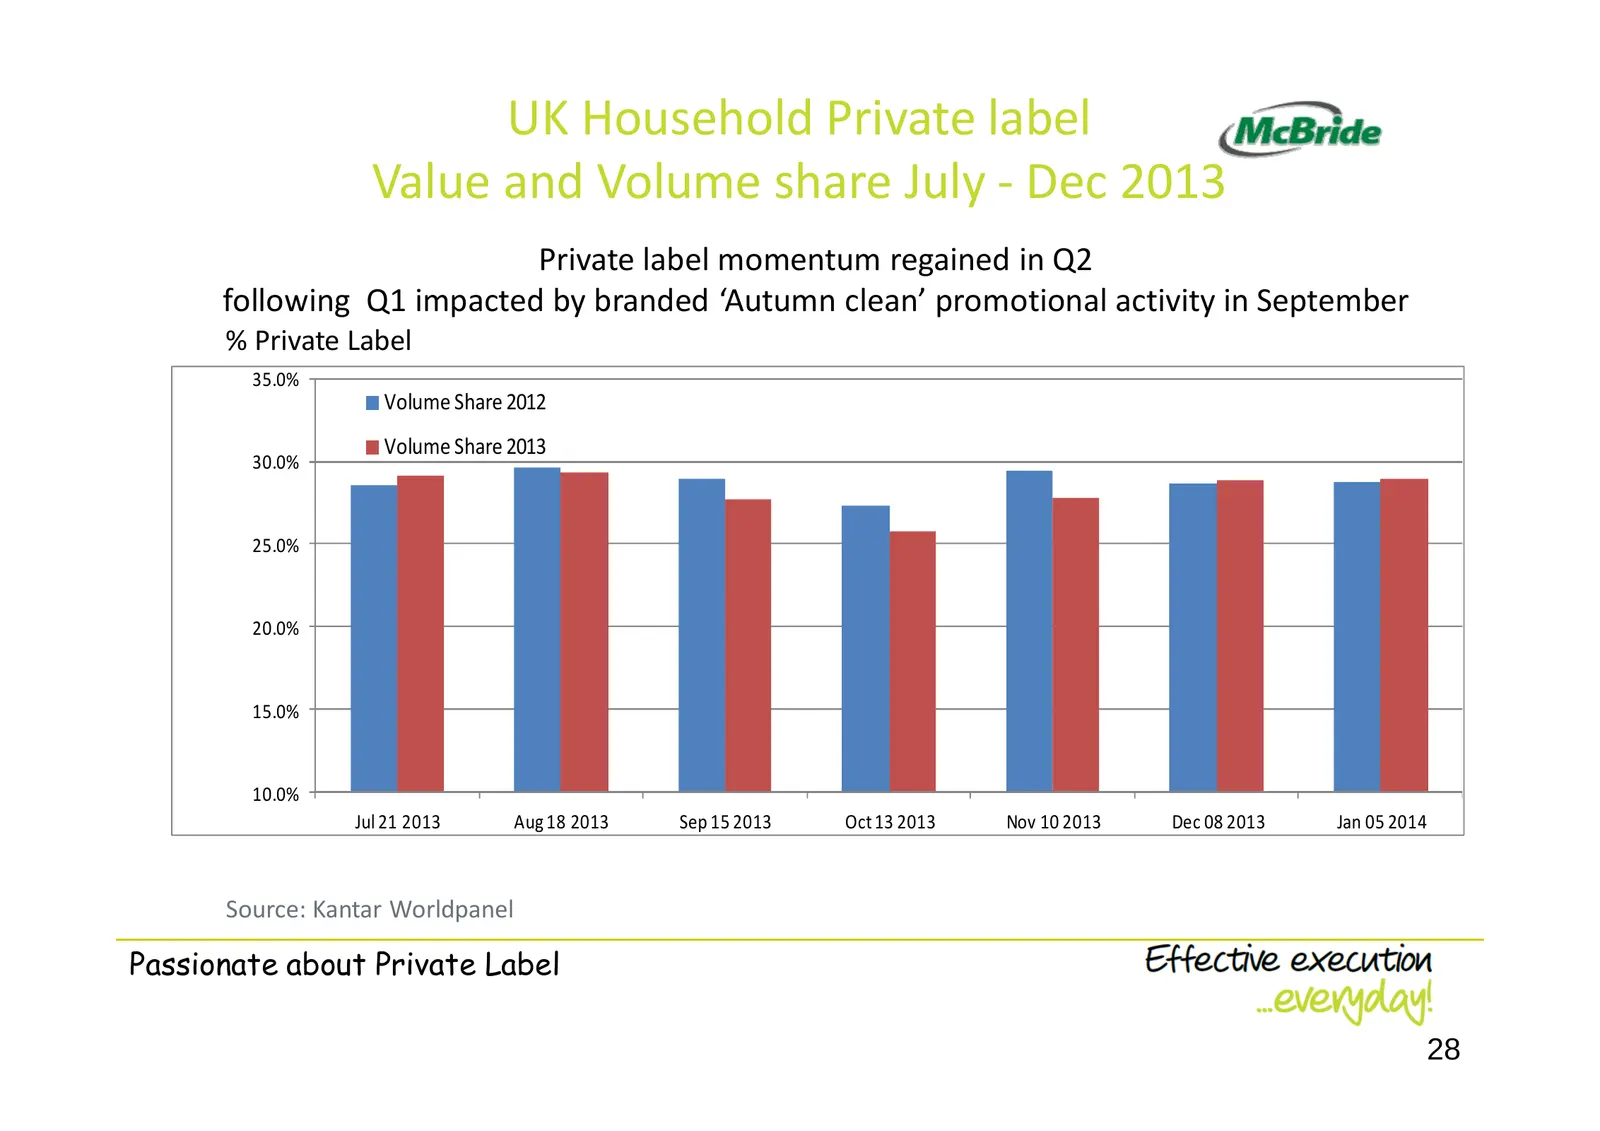
UK Household Private label Value and Volume share July ‐ Dec 2013 Private label momentum regained in Q2 following Q1 impacted by branded ‘Autumn clean’ promotional activity in September % Private Label 35.0% Volume Share 2012 Volume Share 2013 30.0% 25.0% 20.0% 15.0% 10.0% Jul 21 2013 Aug 18 2013 Se
Slide 29: Our planned business
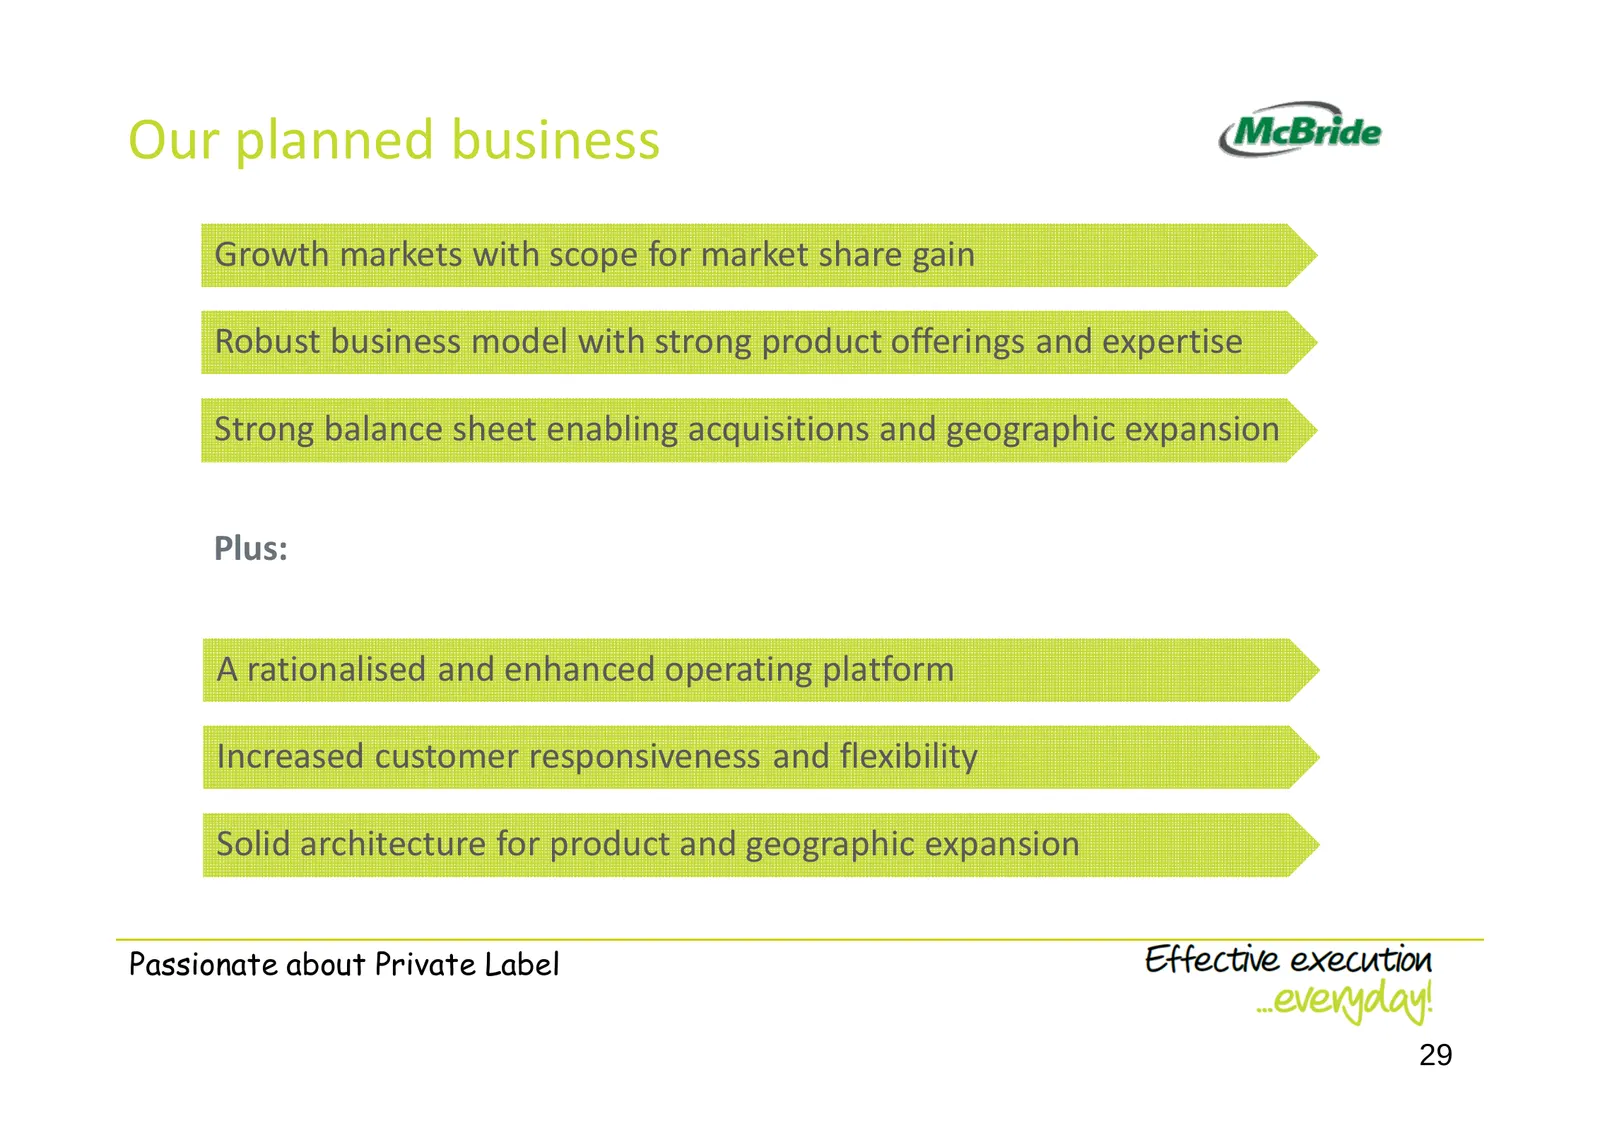
Our planned business Growth markets with scope for market share gain Robust business model with strong product offerings and expertise Strong balance sheet enabling acquisitions and geographic expansion Plus: A rationalised and enhanced operating platform Increased customer responsiveness and flexib
Slide 30: Business model
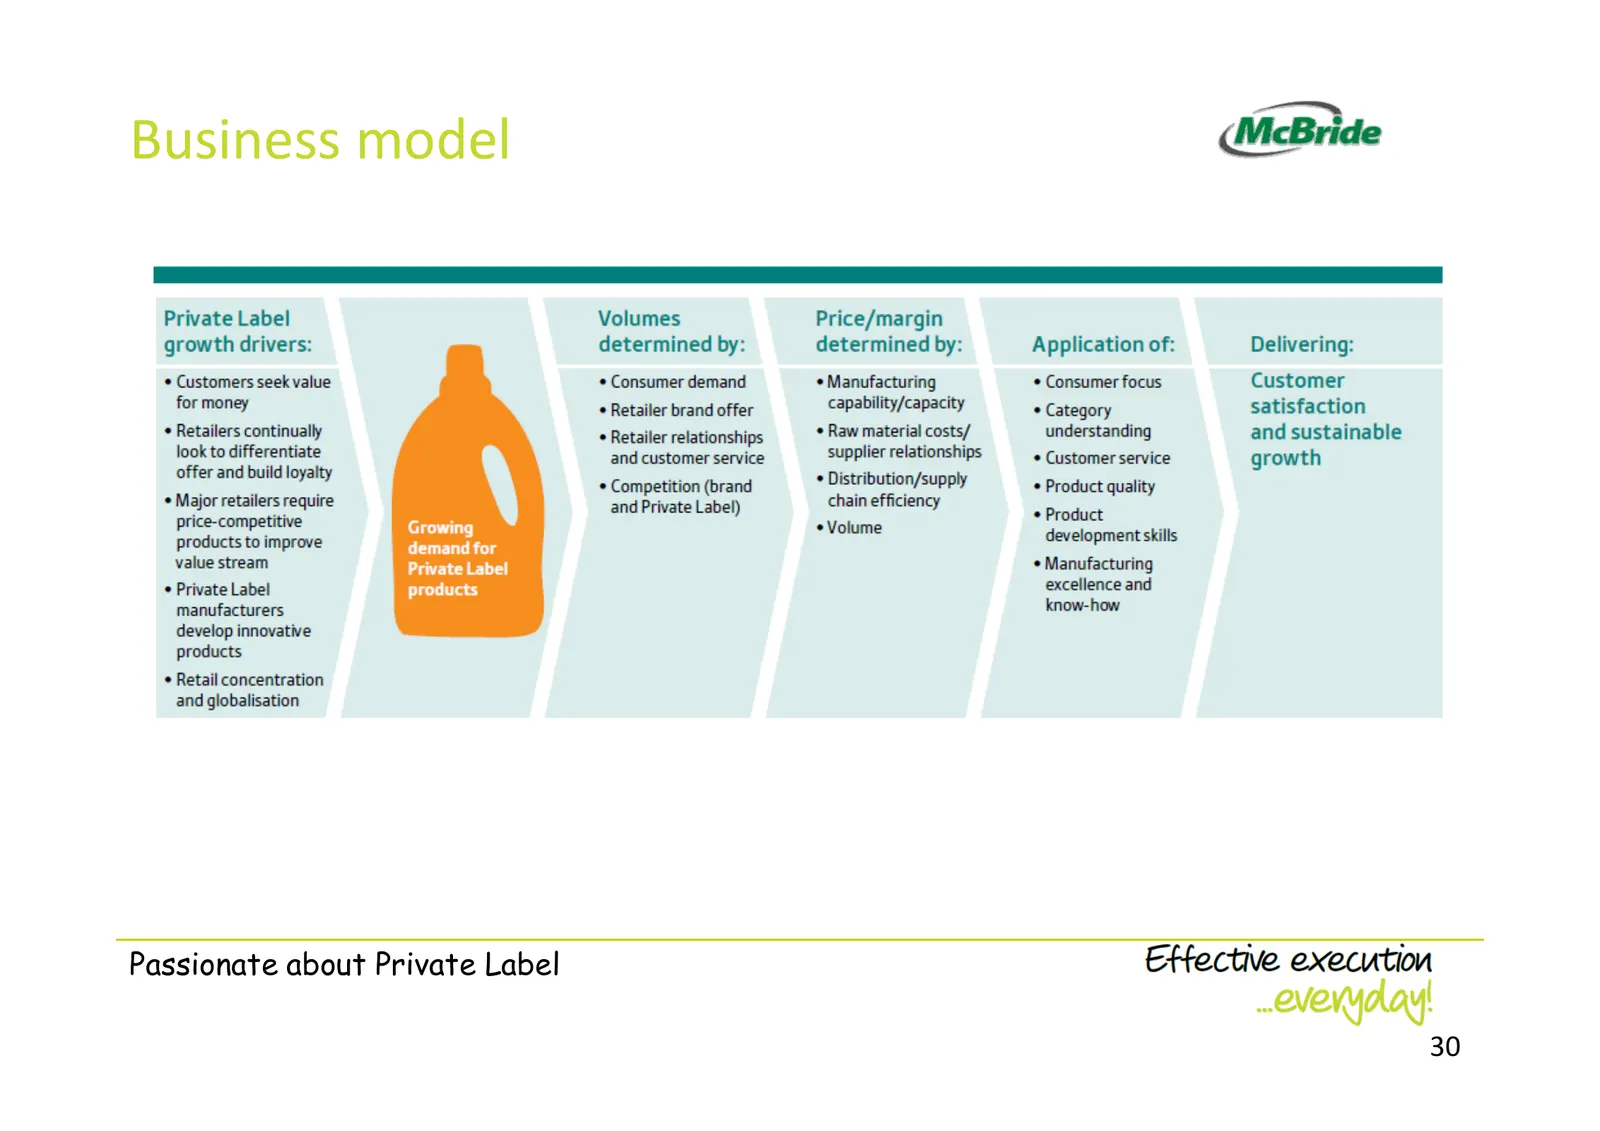
Business model Passionate about Private Label 30
Slide 31: Private Label forecast to grow in all markets
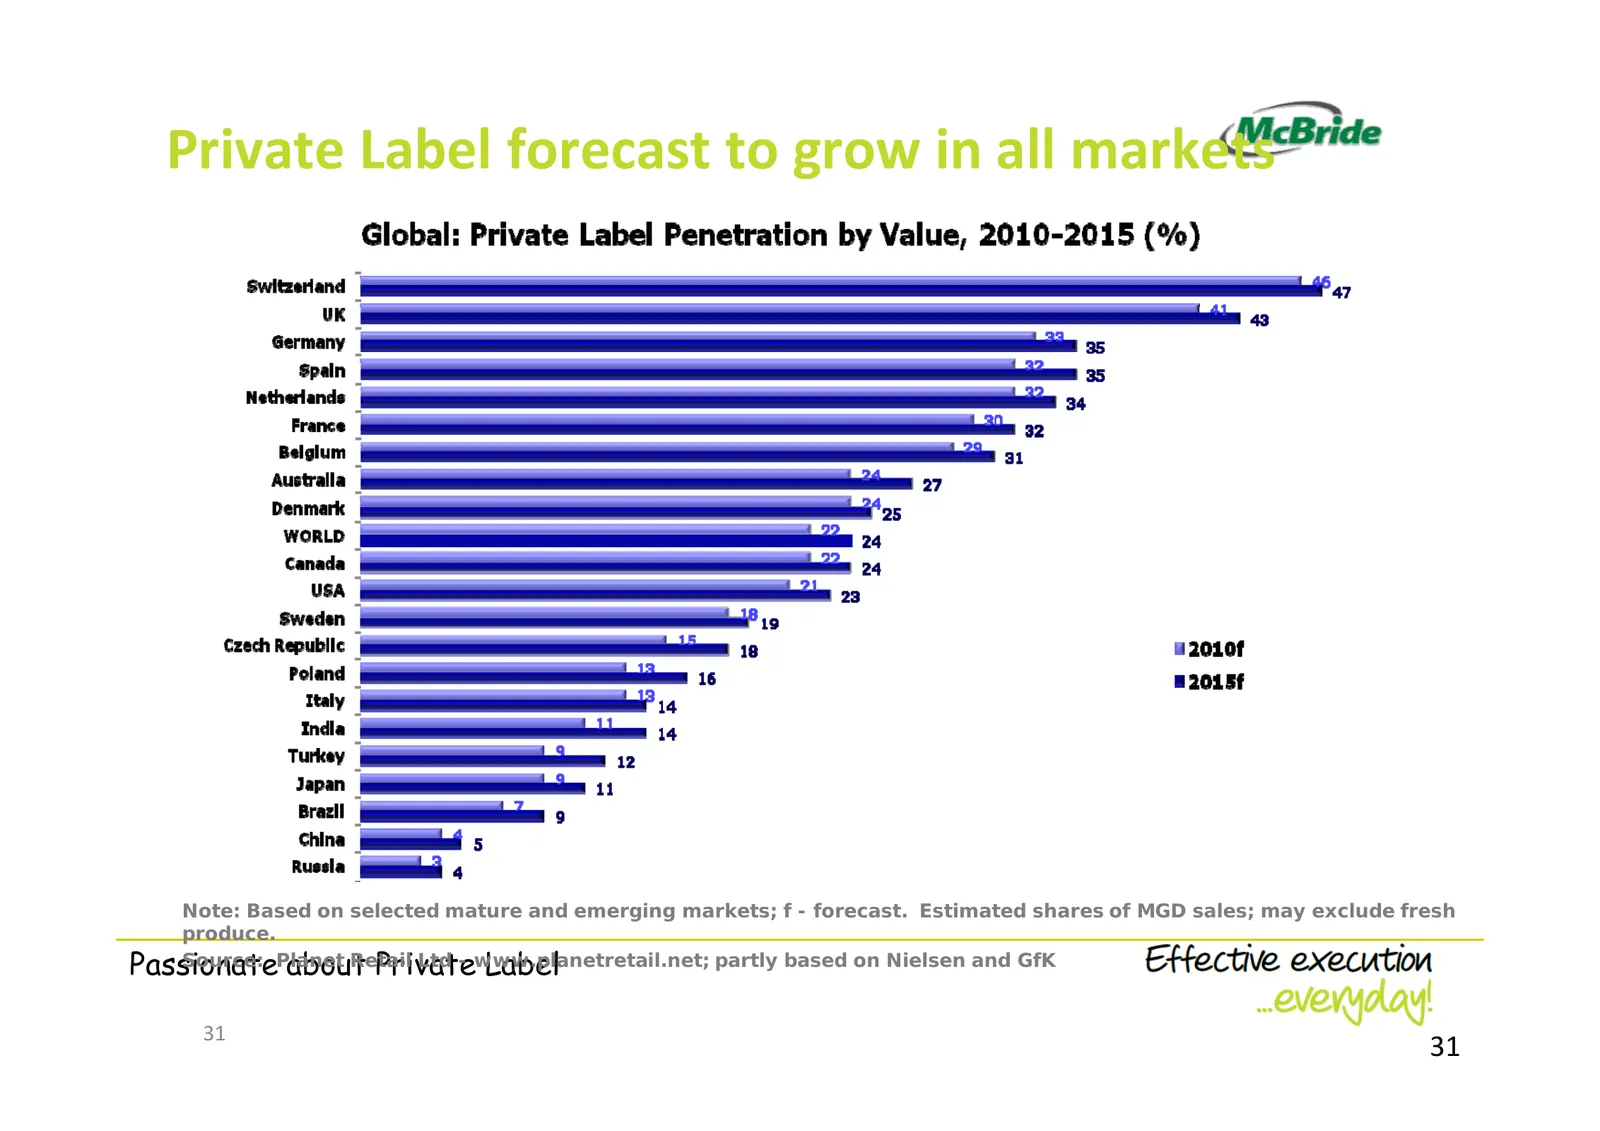
Private Label forecast to grow in all markets Note: Based on selected mature and emerging markets; f - forecast. Estimated shares of MGD sales; may exclude fresh produce. Passionate about Source: Planet Private Retail Label Ltd - www.planetretail.net; partly based on Nielsen and GfK 31 31
Slide 32: Private Labels benefit in times of recession
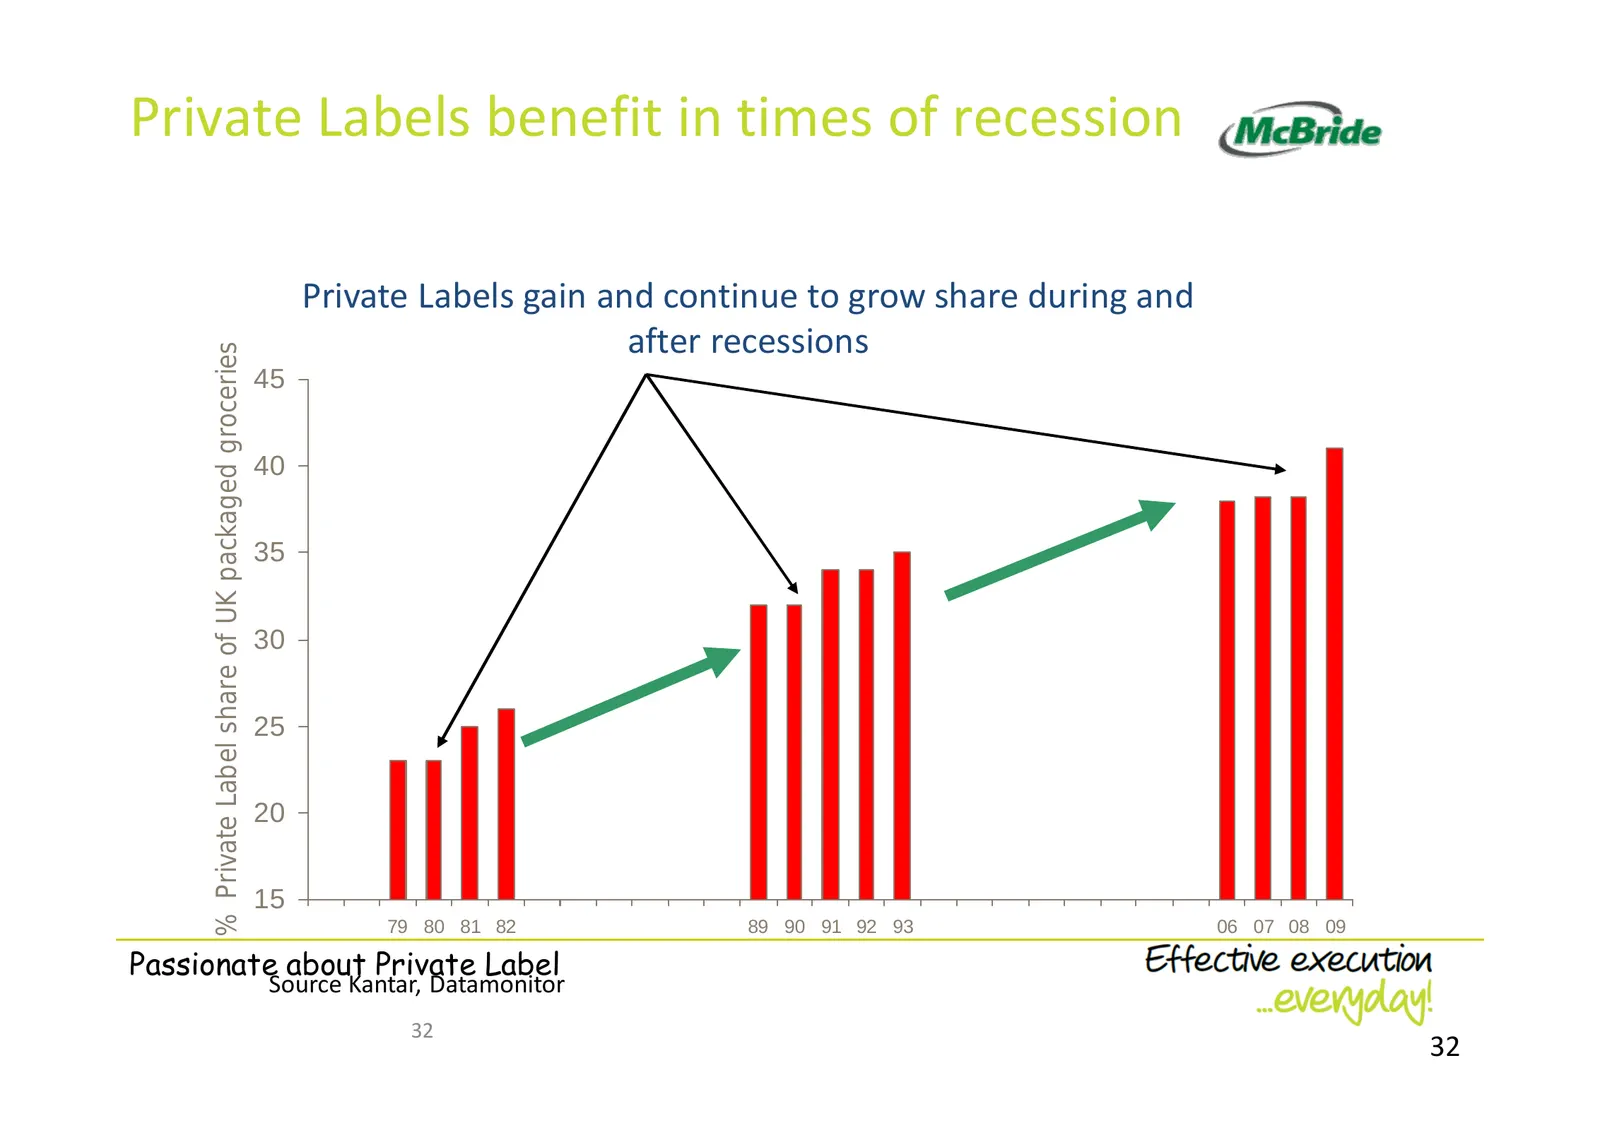
Private Labels benefit in times of recession Private Labels gain and continue to grow share during and after recessions % Private Label share of UK packaged groceries 45 40 35 30 25 20 15 79 80 81 82 89 90 91 92 93 06 07 08 09 Passionate about Private Label Source Kantar, Datamonitor 32 32
Slide 33: Personal care Private Label share
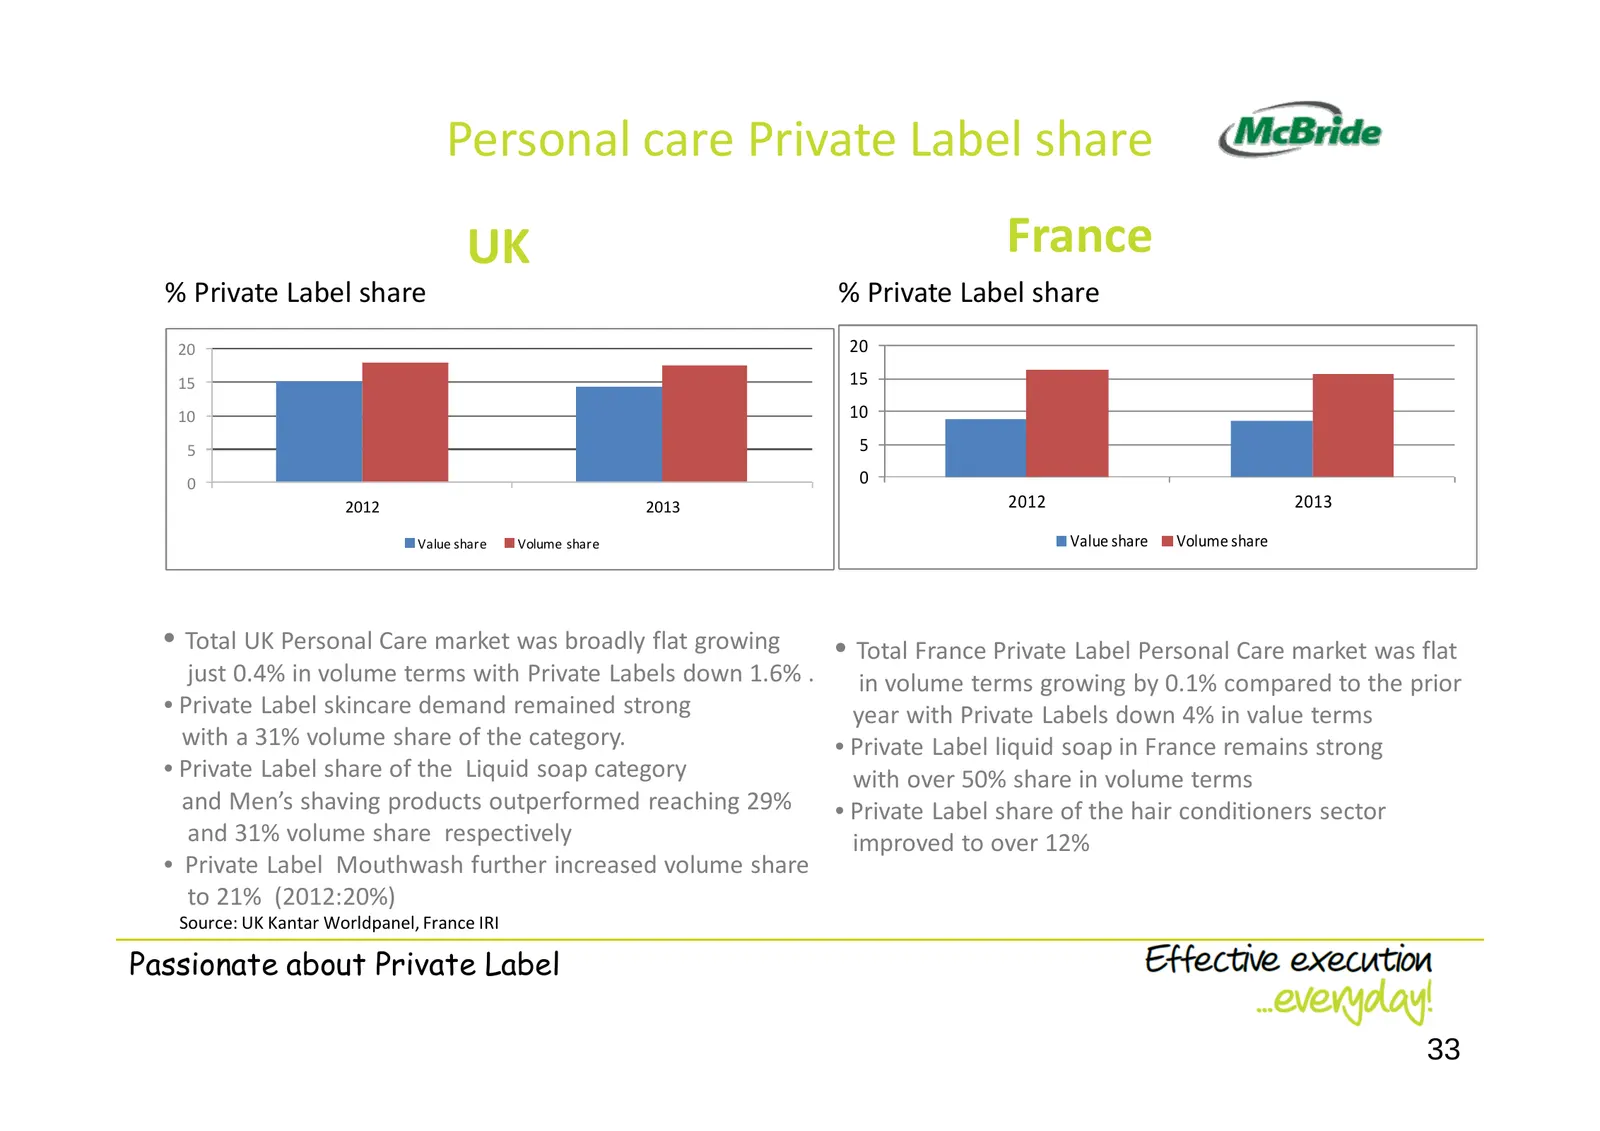
Personal care Private Label share UK France % Private Label share % Private Label share 20 20 15 15 10 10 5 5 0 0 2012 2013 2012 2013 Value share Volume share Value share Volume share • Total UK Personal Care market was broadly flat growing • Total France Private Label Personal Care market was flat
Slide 34: The Private Label opportunity
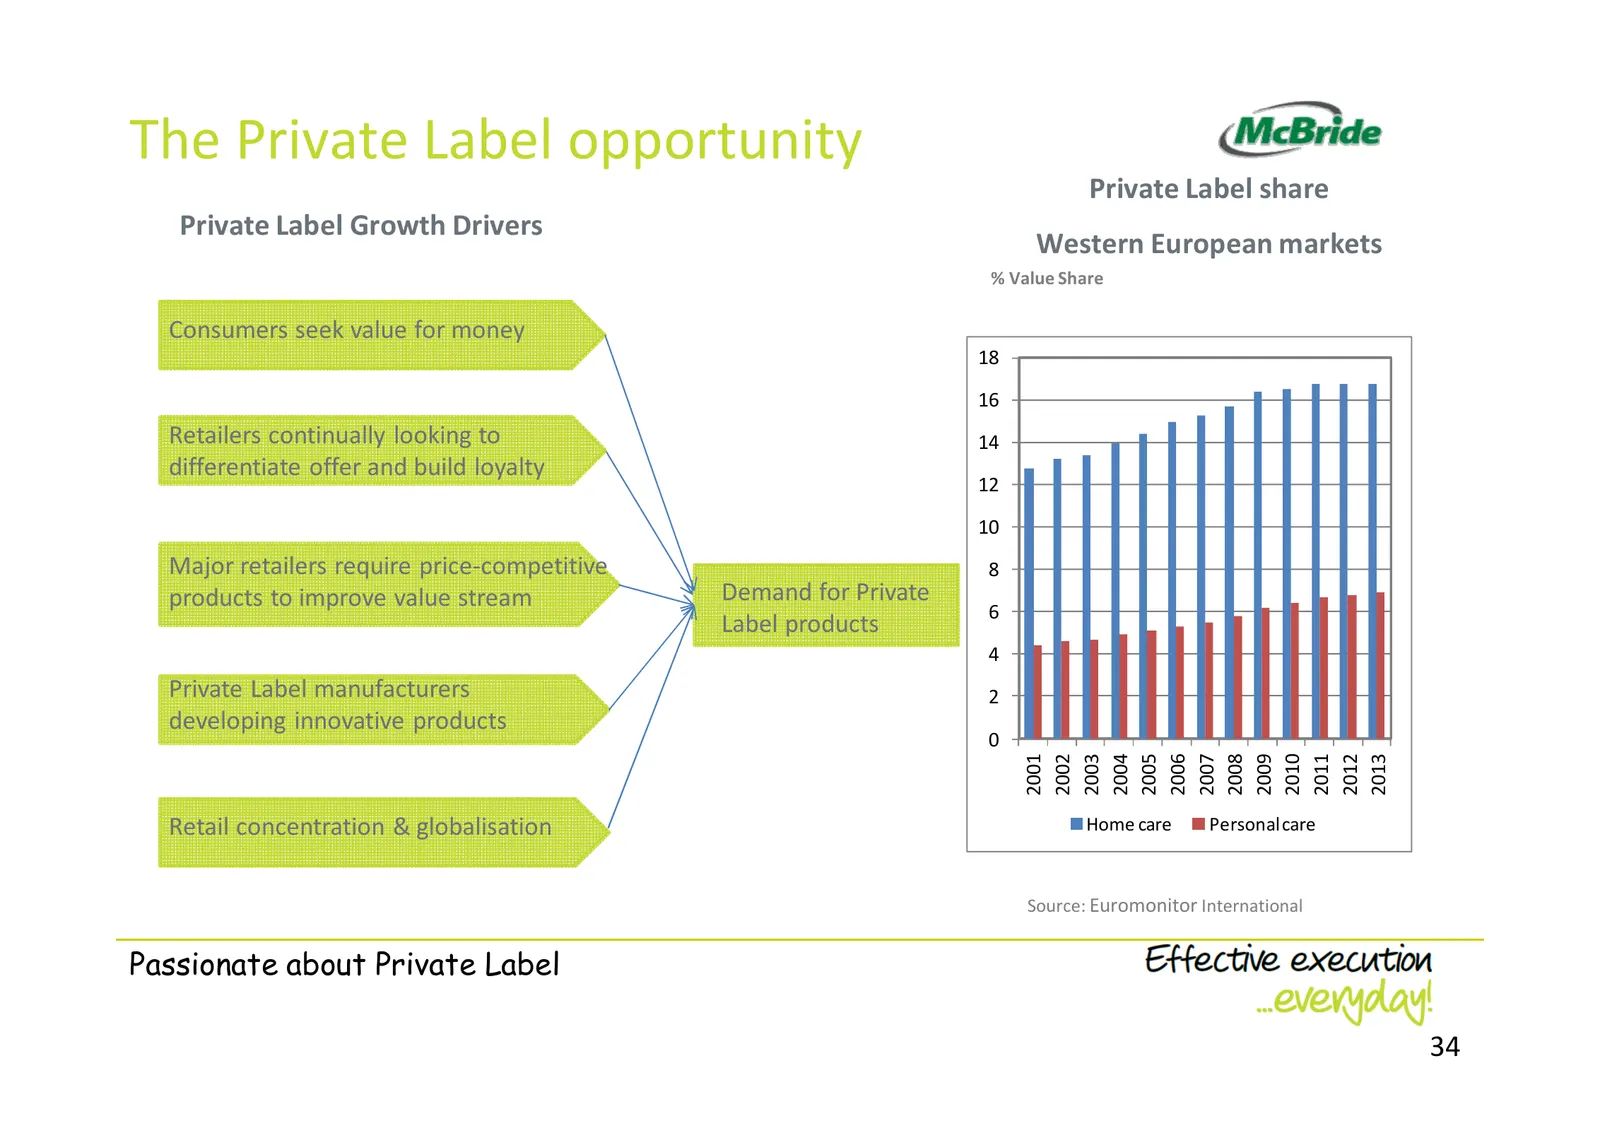
The Private Label opportunity Private Label share Private Label Growth Drivers Western European markets % Value Share Consumers seek value for money 18 16 Retailers continually looking to 14 differentiate offer and build loyalty 12 10 Major retailers require price‐competitive 8 products to improve v
Source: Internet Archive copy of mcbride.co.uk
More decks from McBride plc
 FY2026 Earnings Presentation28 slides · Sep 15, 2026
 H1 FY26 Earnings Presentation22 slides · Feb 26, 2026
 FY2025 Earnings Presentation23 slides · Sep 18, 2025
 H1 FY2025 Earnings Presentation30 slides · Feb 25, 2025
 FY2024 Earnings Presentation30 slides · Sep 17, 2024
 Investor Day (March 2024)65 slides · Mar 13, 2024