Perion Network Ltd · NASDAQ:PERI
Perion Network — Investor Presentation (October 2021)
39 slides from Perion Network's investor presentation, October 2021
Slide 1: the capture & convince company
the capture & convince company Investor Presentation | October 2021
Slide 2: Forward Looking Statements
FORWARD LOOKING STATEMENTS This presentation and our remarks contain forward-looking statements (within the meaning of The Private Securities Litigation Reform Act of 1995) that involve substantial risks and uncertainties, including statements regarding our expectations and beliefs about our busines

Slide 3: Introduction
Introduction Doron Gerstel Maoz Sigron CEO CFO 3
Slide 4: Sources of growth
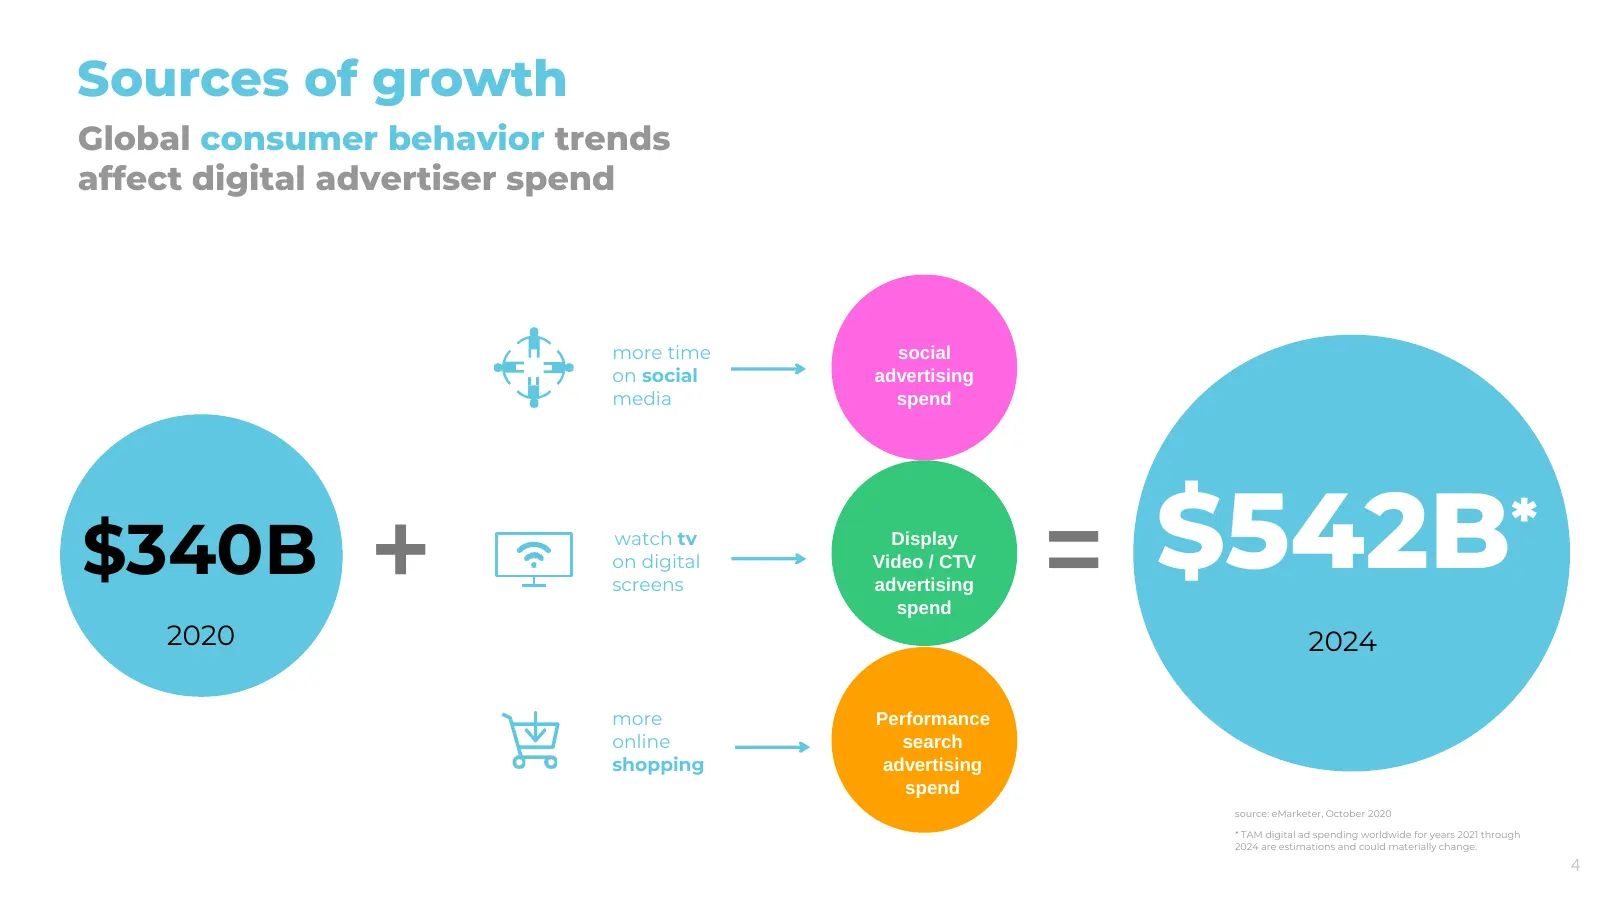
Sources of growth Global consumer behavior trends affect digital advertiser spend more time social on social advertising media spend $340B + watch tv on digital screens Display Video / CTV advertising spend = $542B * 2020 2024 more Performance online search shopping advertising spend source: eMarket
Slide 5: 2021 momentum driven by key 2020 revenue drivers
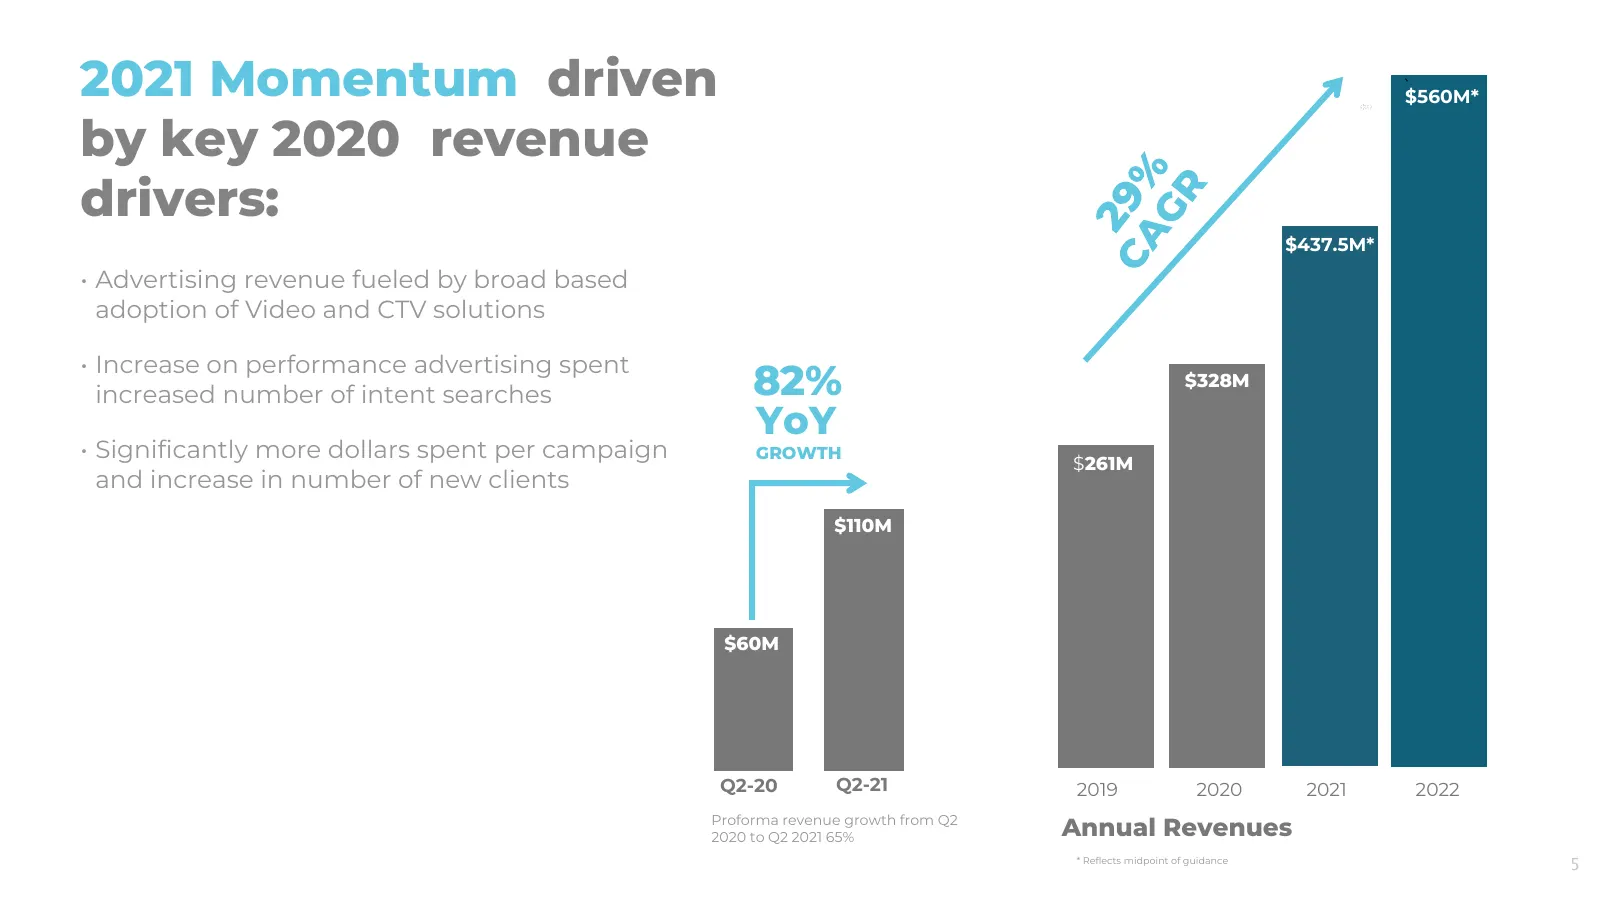
2021 Momentum driven ` $560M* by key 2020 revenue drivers: $437.5M* • Advertising revenue fueled by broad based adoption of Video and CTV solutions • Increase on performance advertising spent increased number of intent searches 82% $328M YoY • Significantly more dollars spent per campaign GROWTH $26
Slide 6: 2020 momentum continues into 2021: EBITDA
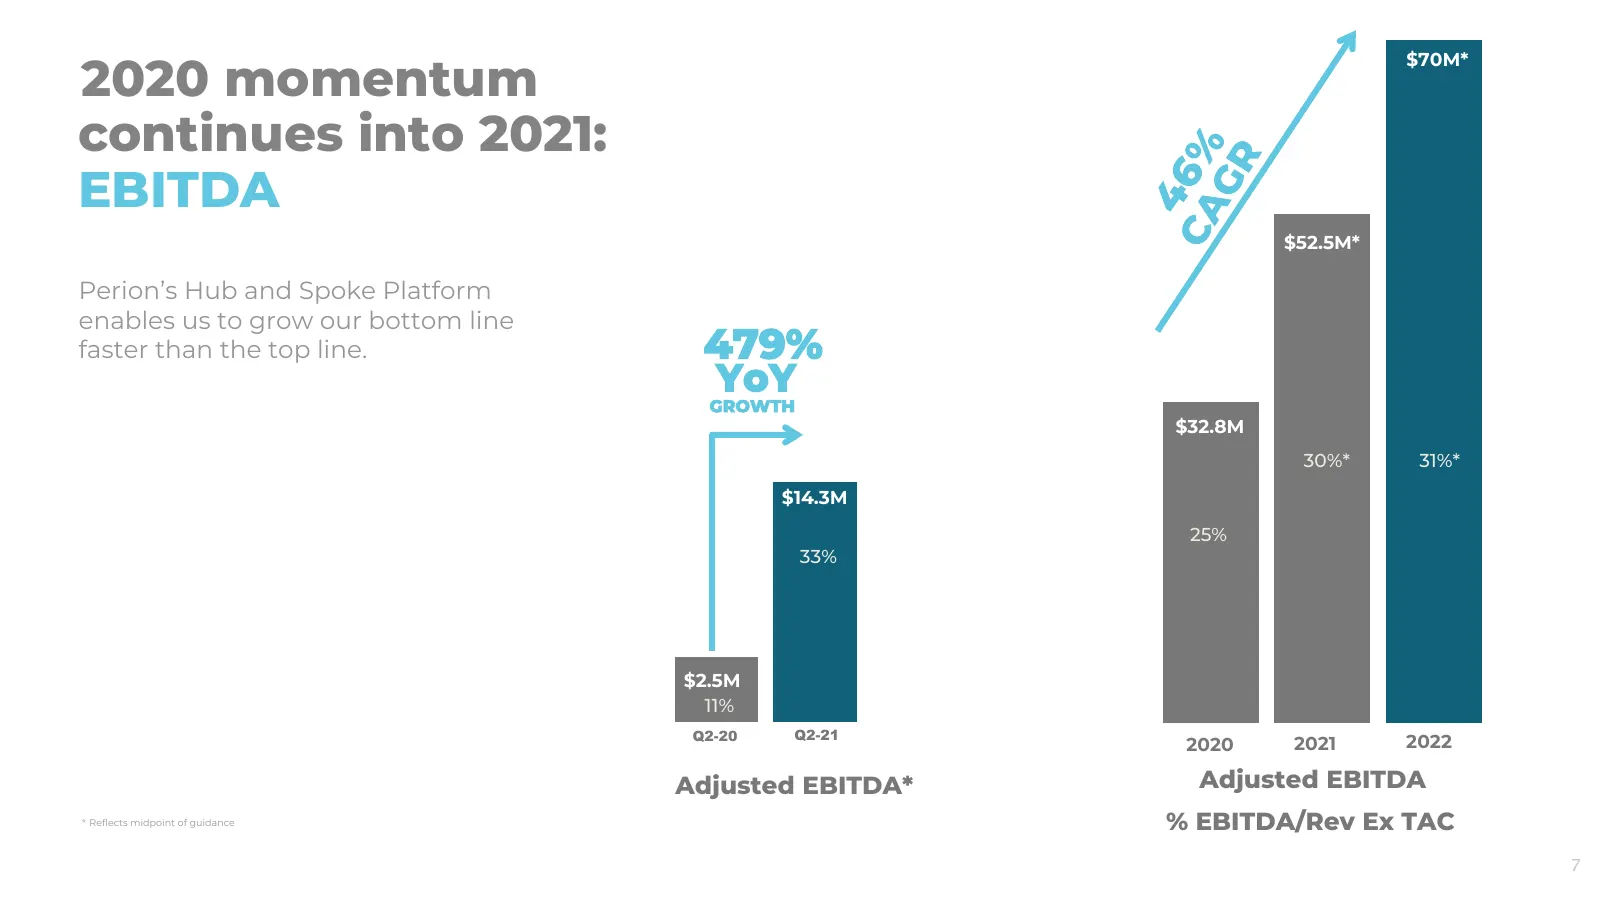
$70M* 2020 momentum continues into 2021: EBITDA $52.5M* Perion’s Hub and Spoke Platform enables us to grow our bottom line faster than the top line. 479% YoY GROWTH $32.8M 30%* 31%* $14.3M 25% 33% $66M $2.5M 11% Q2-20 Q2-21 2020 2021 2022 Adjusted EBITDA* Adjusted EBITDA * Reflects midpoint of guida
Slide 7: Adj EBITDA expected to grow significantly
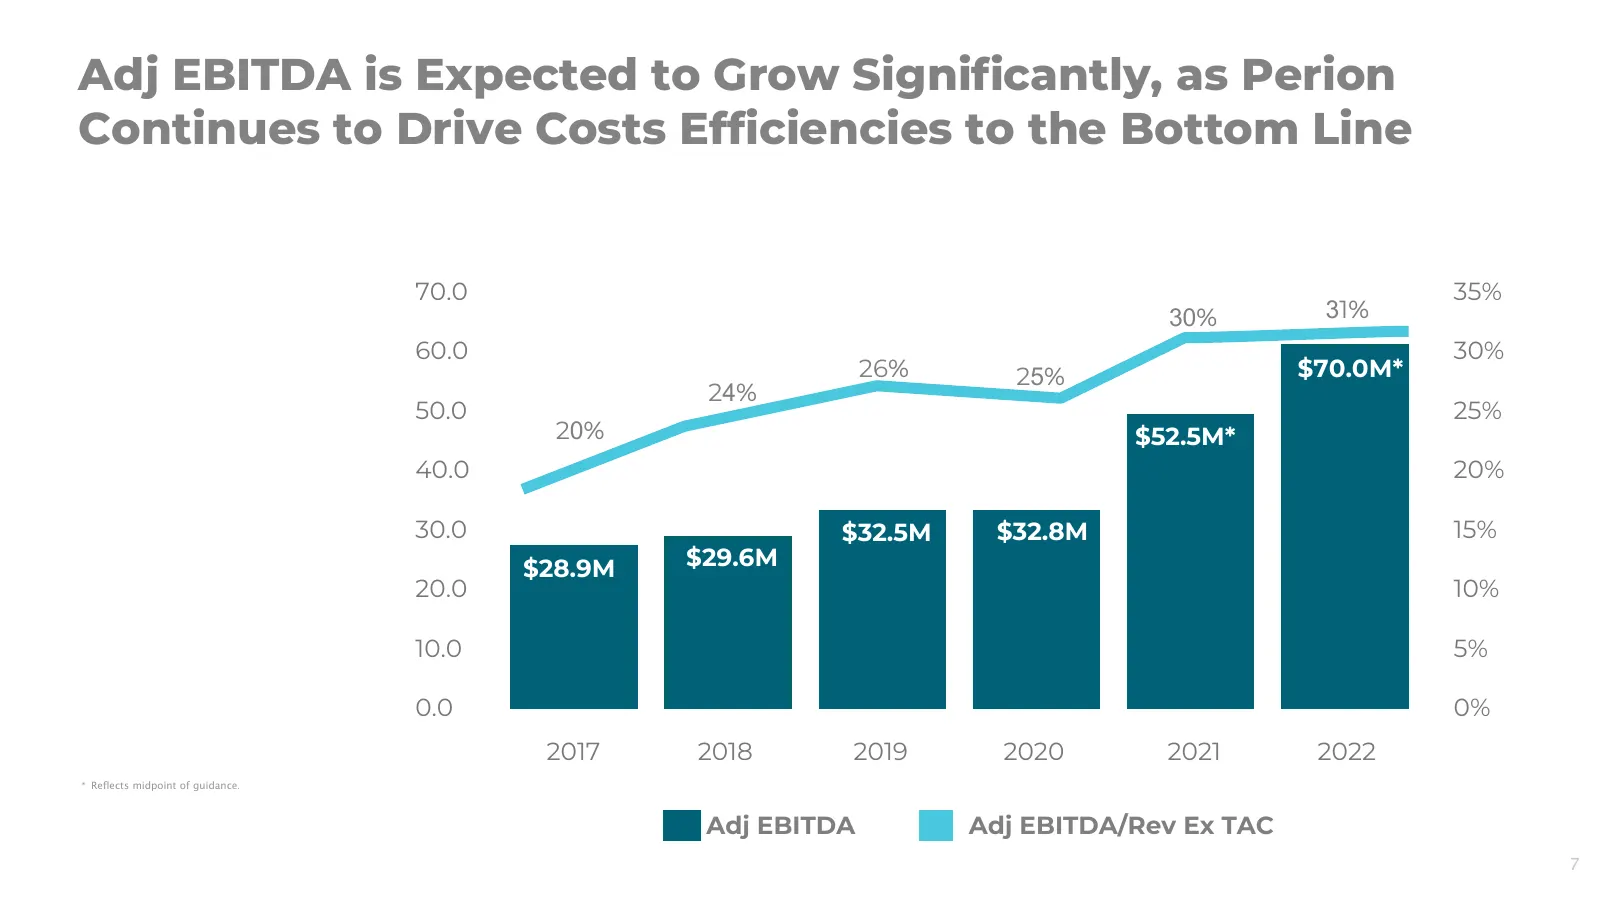
Adj EBITDA is Expected to Grow Significantly, as Perion Continues to Drive Costs Efficiencies to the Bottom Line 70.0 35% 30% 31% 60.0 30% 26% 25% $70.0M* 24% 50.0 25% 20% $52.5M* 40.0 20% 30.0 $32.5M $32.8M 15% $28.9M $29.6M 20.0 10% 10.0 5% 0.0 0% 2017 2018 2019 2020 2021 2022 * Reflects midpoint
Slide 8: SG&A % to Revenue continues to decrease
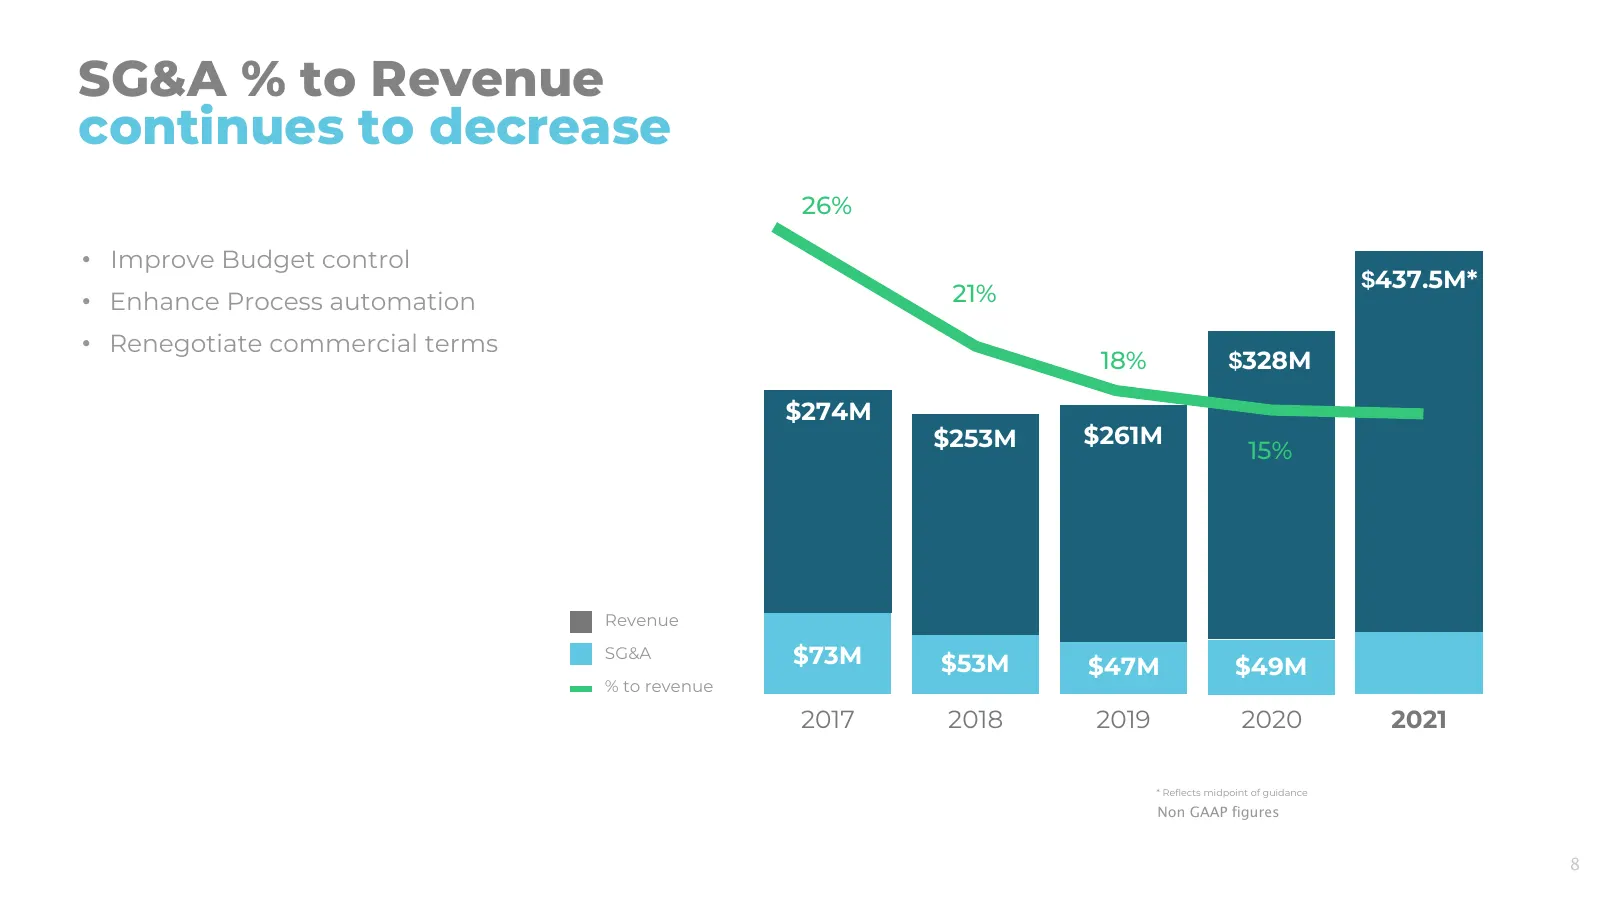
SG&A % to Revenue continues to decrease 26% • Improve Budget control $437.5M* • Enhance Process automation 21% • Renegotiate commercial terms 18% $328M $274M $253M $261M 15% Revenue SG&A $73M $53M $47M $49M % to revenue 2017 2018 2019 2020 2021 * Reflects midpoint of guidance Non GAAP figures 8
Slide 9: Non-GAAP R&D – Investing in Growth
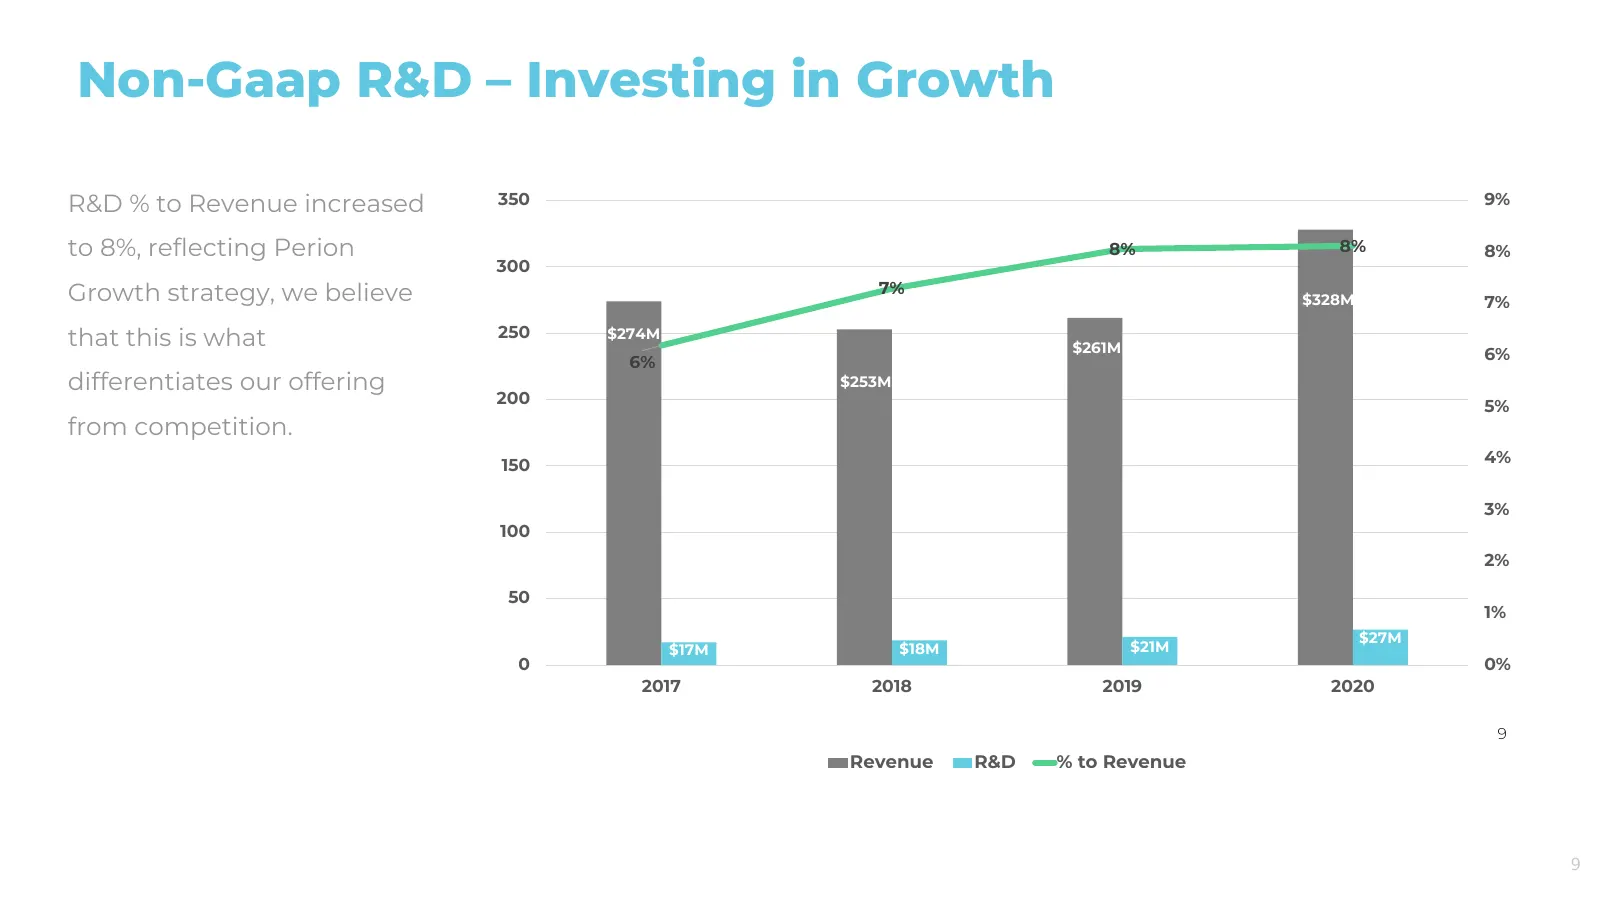
Non-Gaap R&D – Investing in Growth R&D % to Revenue increased 350 9% to 8%, reflecting Perion 8% 8% 8% 300 Growth strategy, we believe 7% $328M 7% that this is what 250 $274M $261M 6% 6% differentiates our offering $253M 200 5% from competition. 150 4% 3% 100 2% 50 1% $27M $17M $18M $21M 0 0% 2017 2
Slide 10: Improved & Strong Balance Sheet
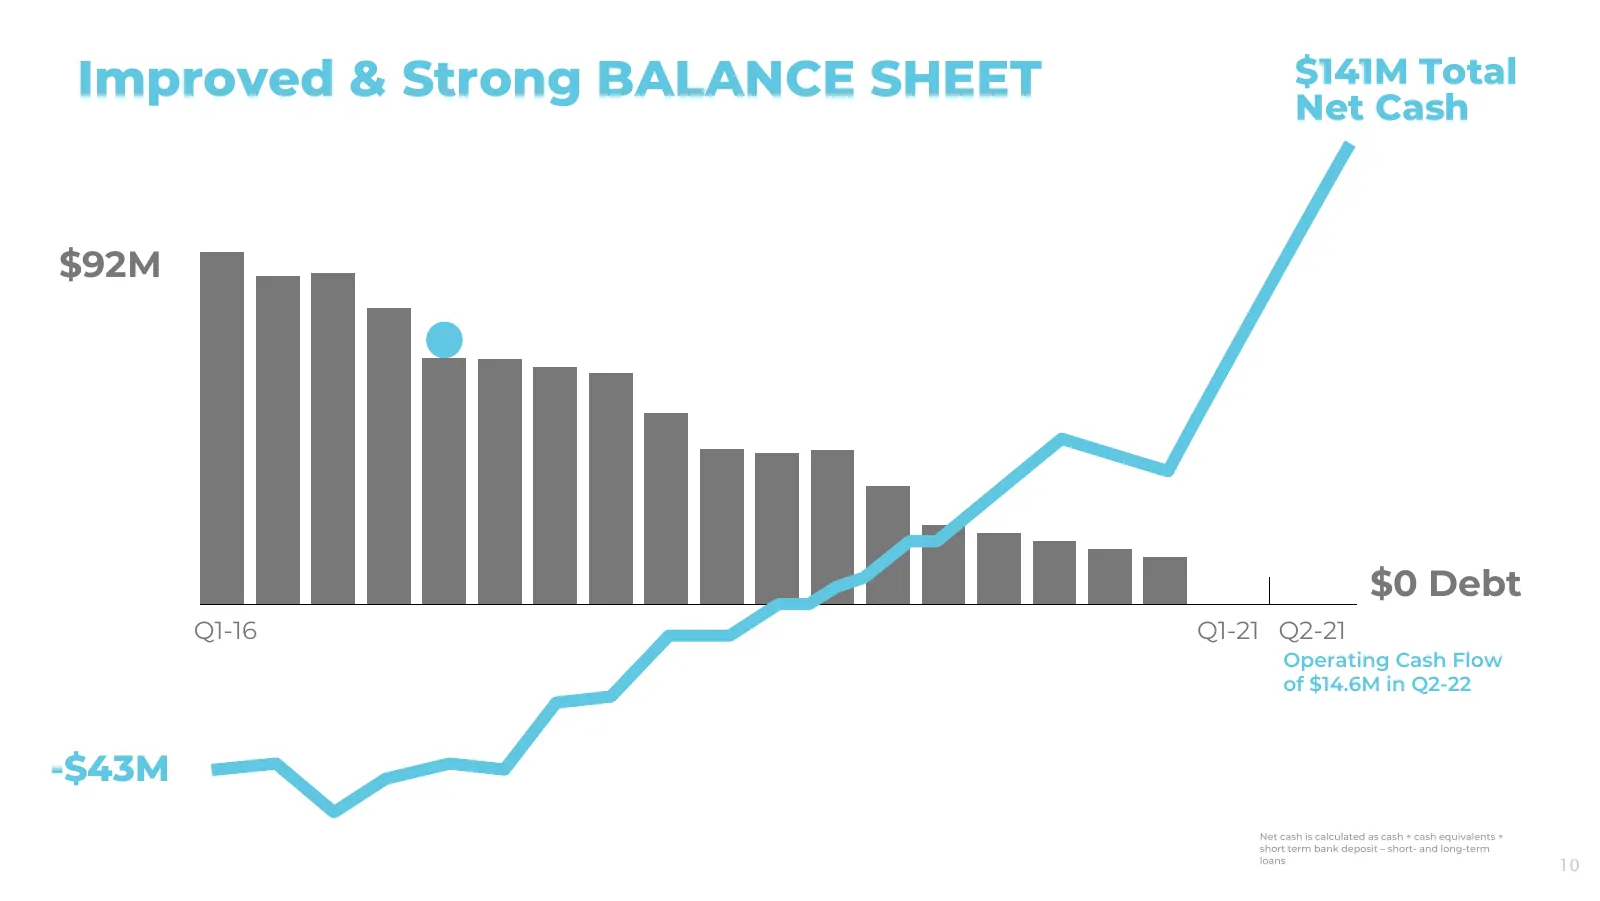
Improved & Strong BALANCE SHEET $141M Total Net Cash $92M $0 Debt Q1-16 Q1-21 Q2-21 Operating Cash Flow of $14.6M in Q2-22 -$43M Net cash is calculated as cash + cash equivalents + short term bank deposit – short- and long-term loans 10
Slide 11: Diversification
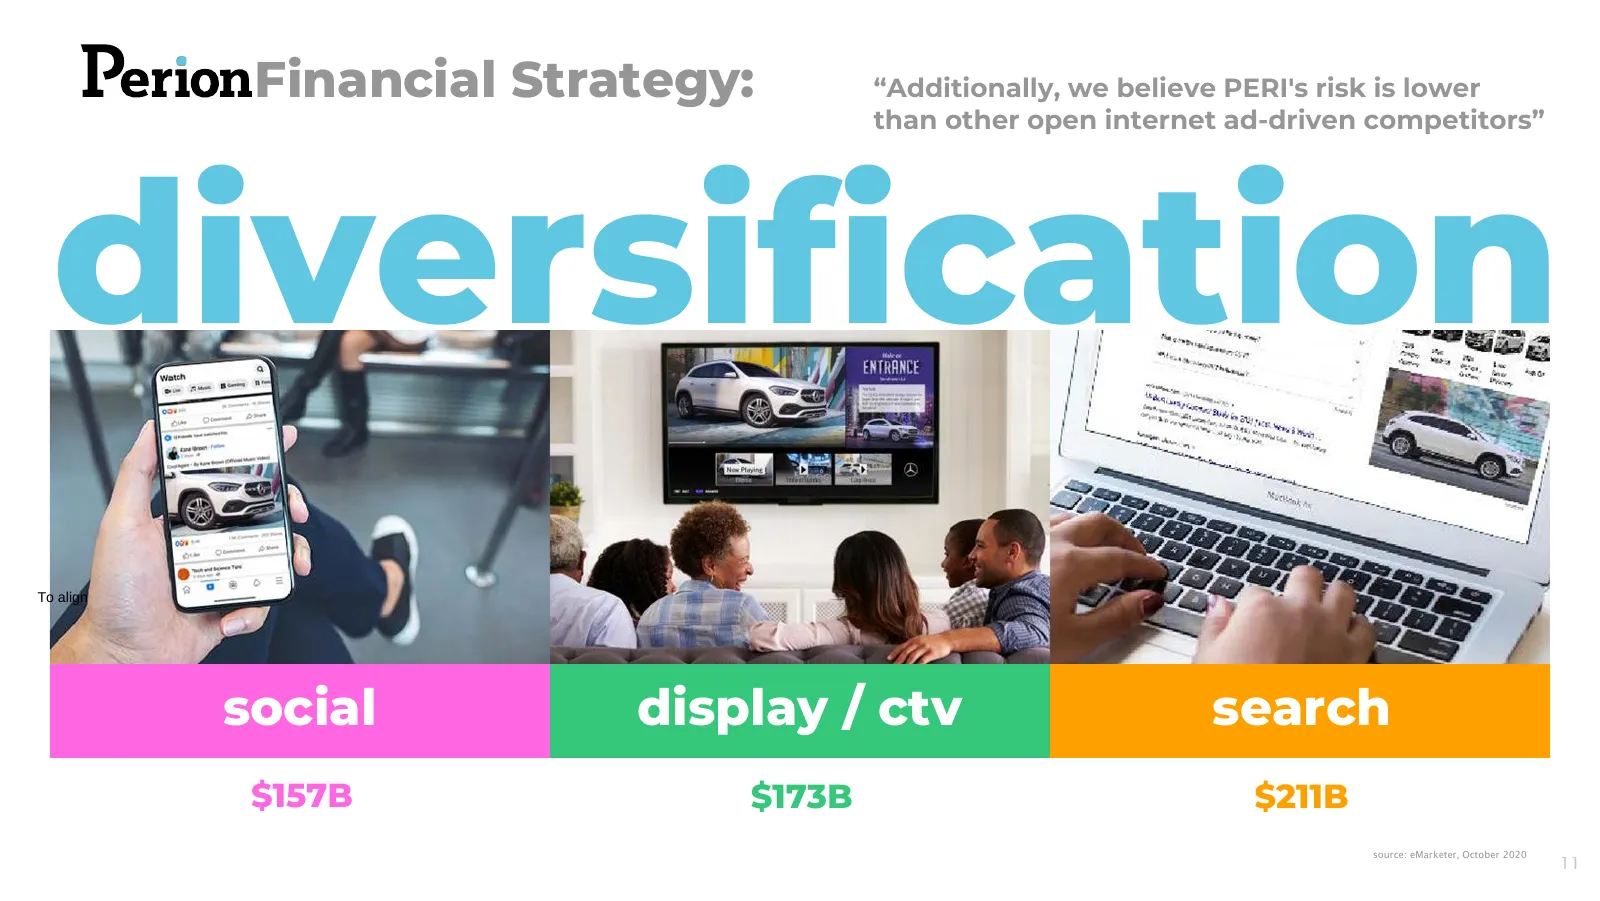
Financial Strategy: “Additionally, we believe PERI's risk is lower than other open internet ad-driven competitors” diversification To align social display / ctv search $157B $173B $211B source: eMarketer, October 2020 11
Slide 12: Why video?
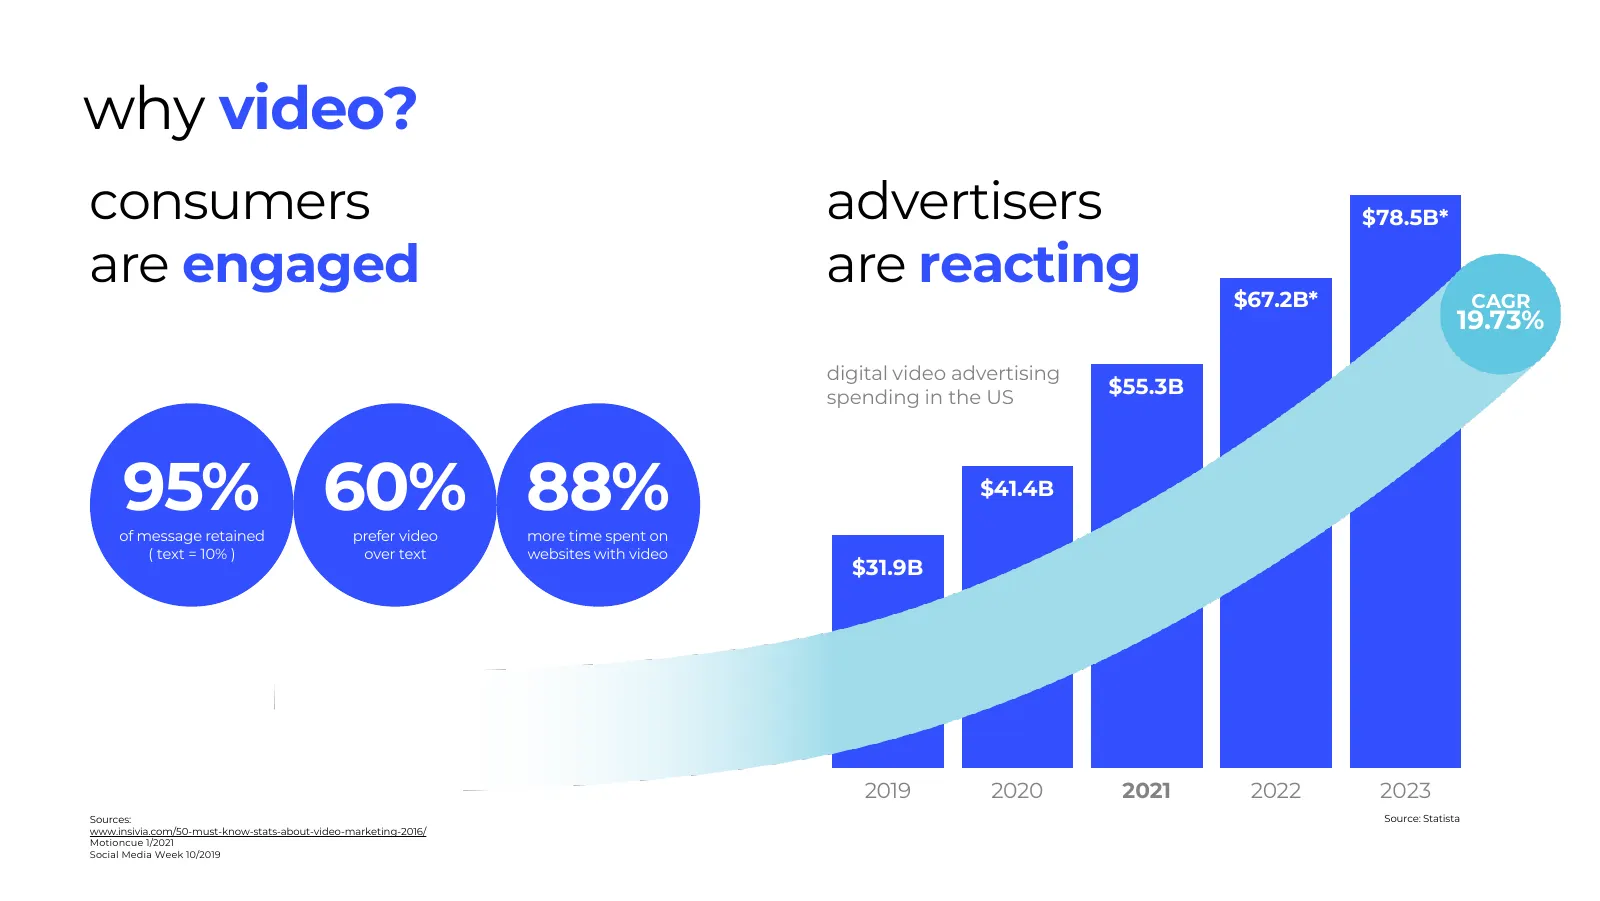
why video? consumers advertisers $78.5B* are engaged are reacting $67.2B* CAGR 19.73% digital video advertising spending in the US $55.3B 95% 60% 88% of message retained prefer video more time spent on $41.4B ( text = 10% ) over text websites with video $31.9B 2019 2020 2021 2022 2023 Sources: Sourc
Slide 13: Hub & Spoke model
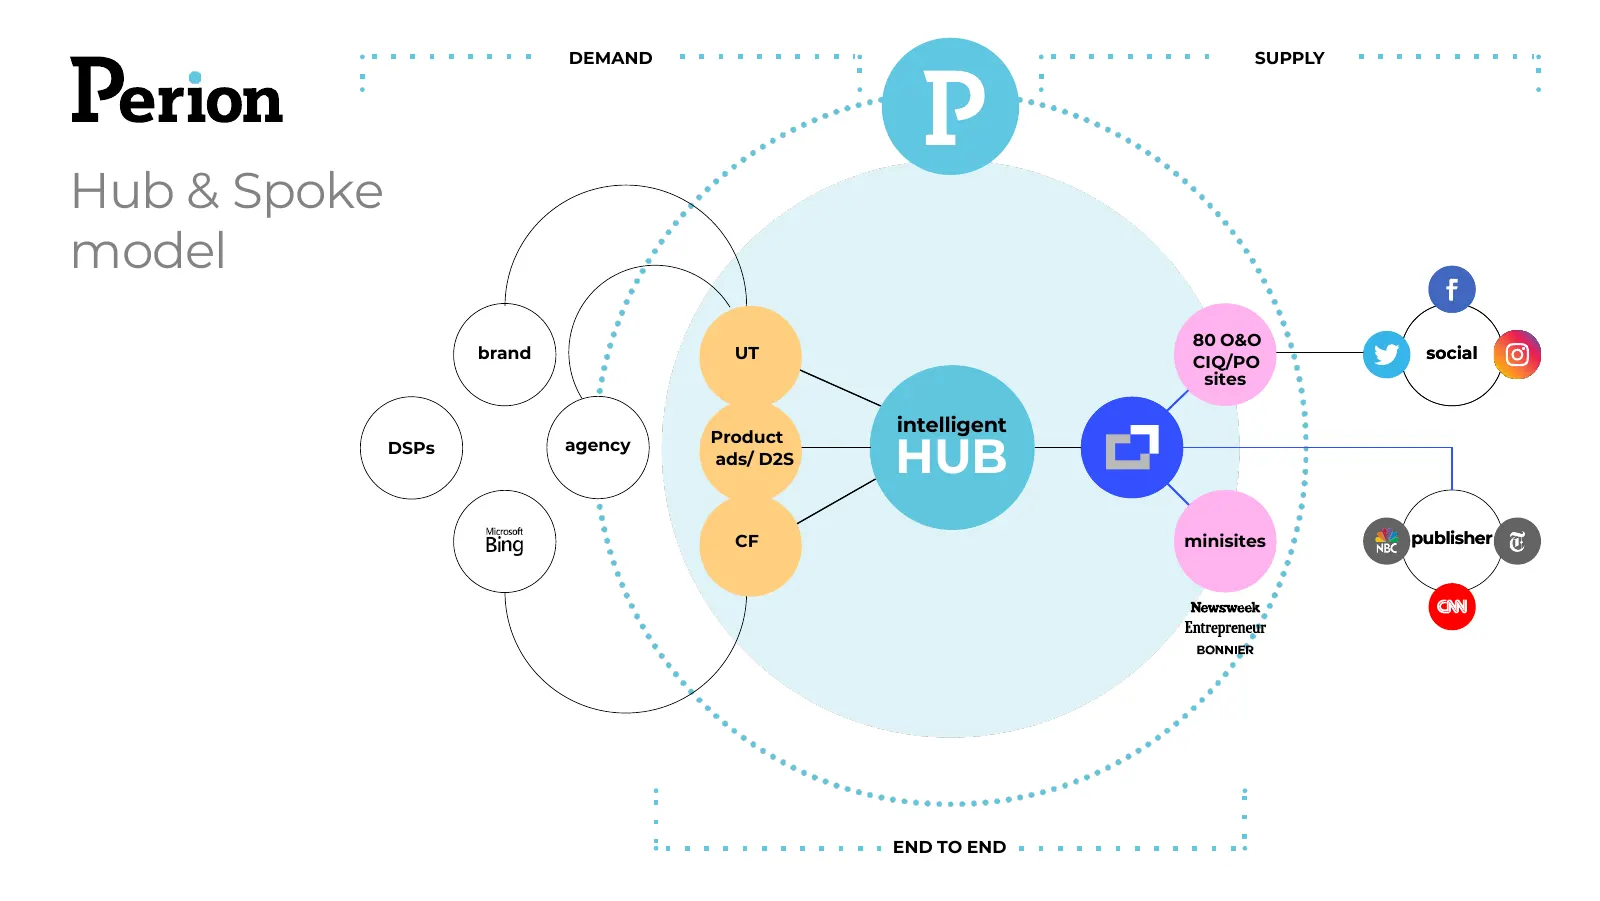
DEMAND SUPPLY Hub & Spoke model 80 O&O brand UT social CIQ/PO sites intelligent HUB agency Product DSPs ads/ D2S CF minisites publisher END TO END
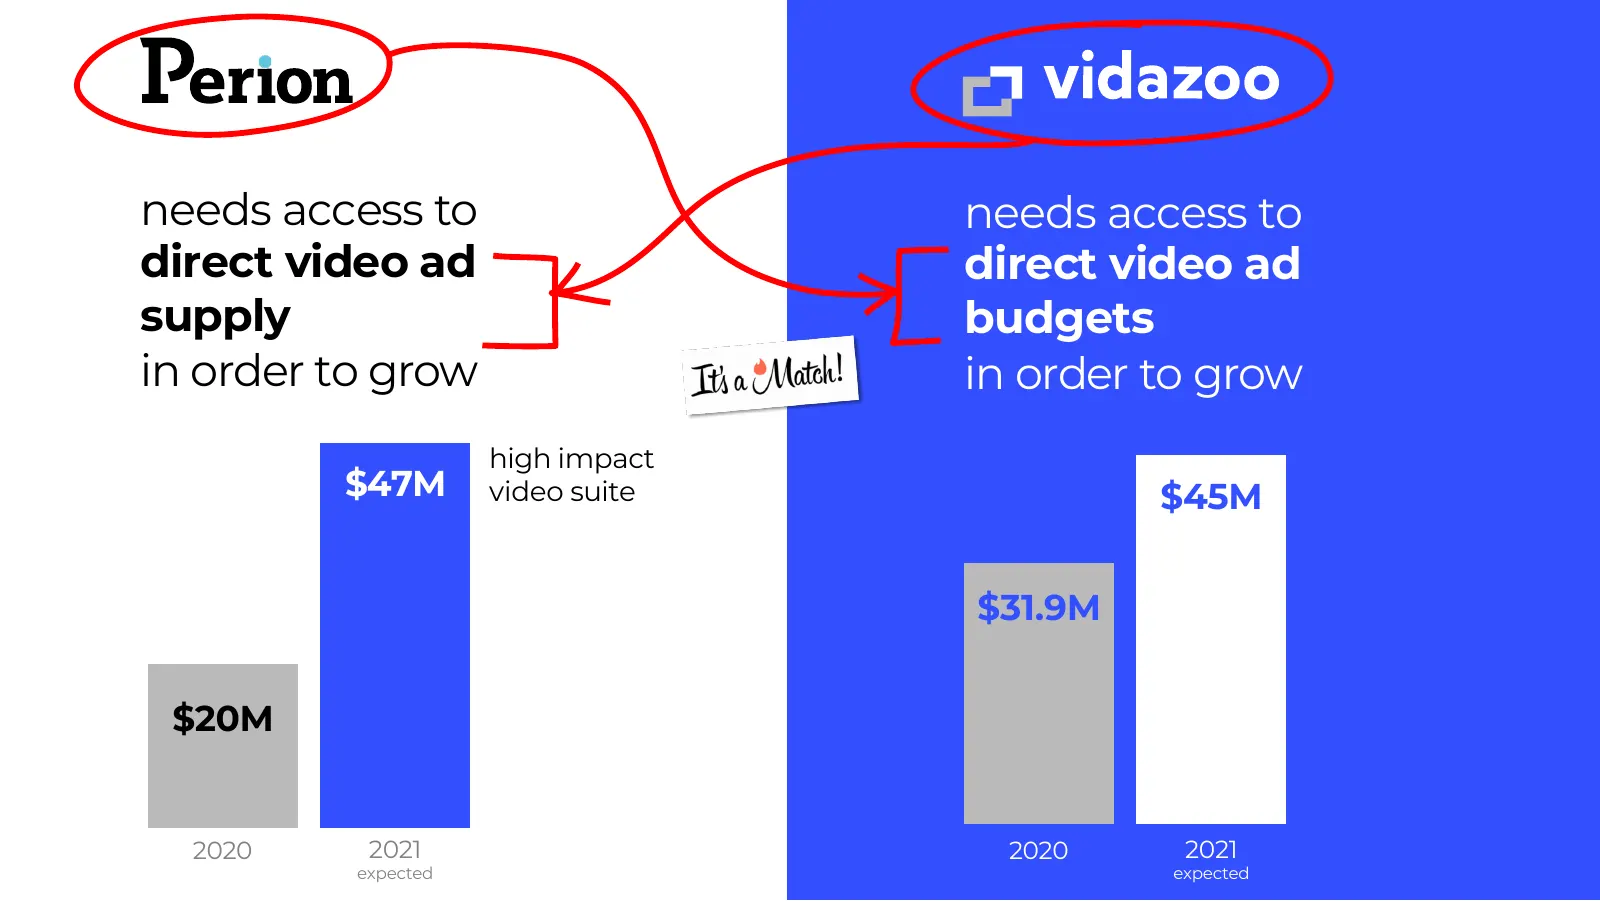
Slide 14: Needs access to direct video ad supply
needs access to needs access to direct video ad direct video ad supply budgets in order to grow in order to grow high impact $47M video suite $45M $31.9M $20M 2020 2021 2020 2021 expected expected
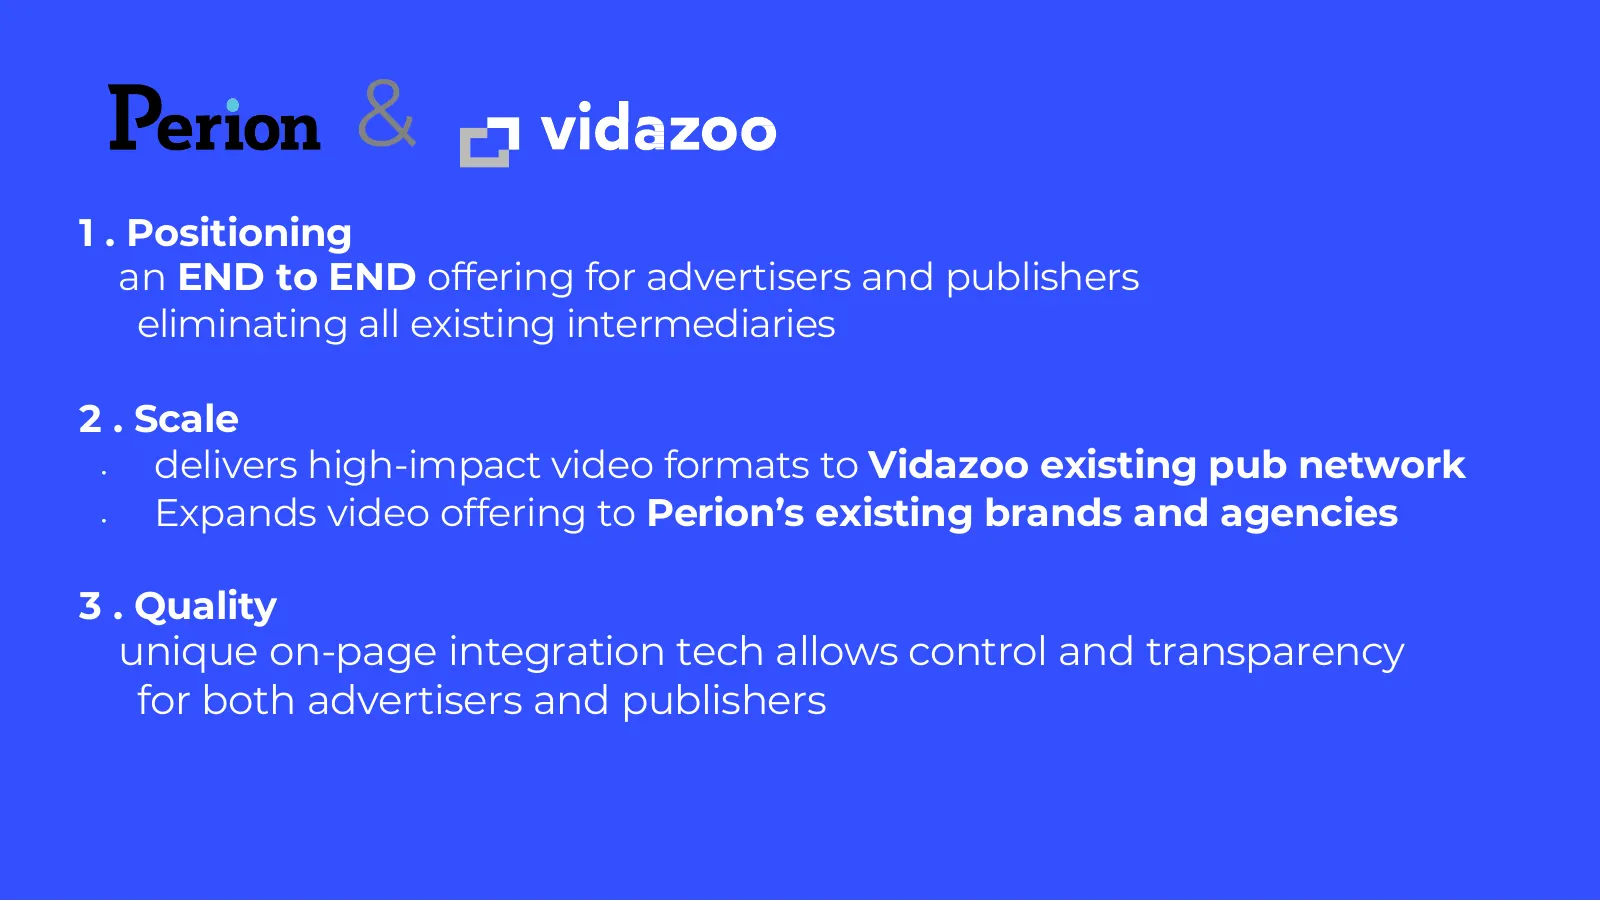
Slide 15: End to end offering for advertisers and publishers
& 1 . Positioning an END to END offering for advertisers and publishers eliminating all existing intermediaries 2 . Scale • delivers high-impact video formats to Vidazoo existing pub network • Expands video offering to Perion’s existing brands and agencies 3 . Quality unique on-page integration tech
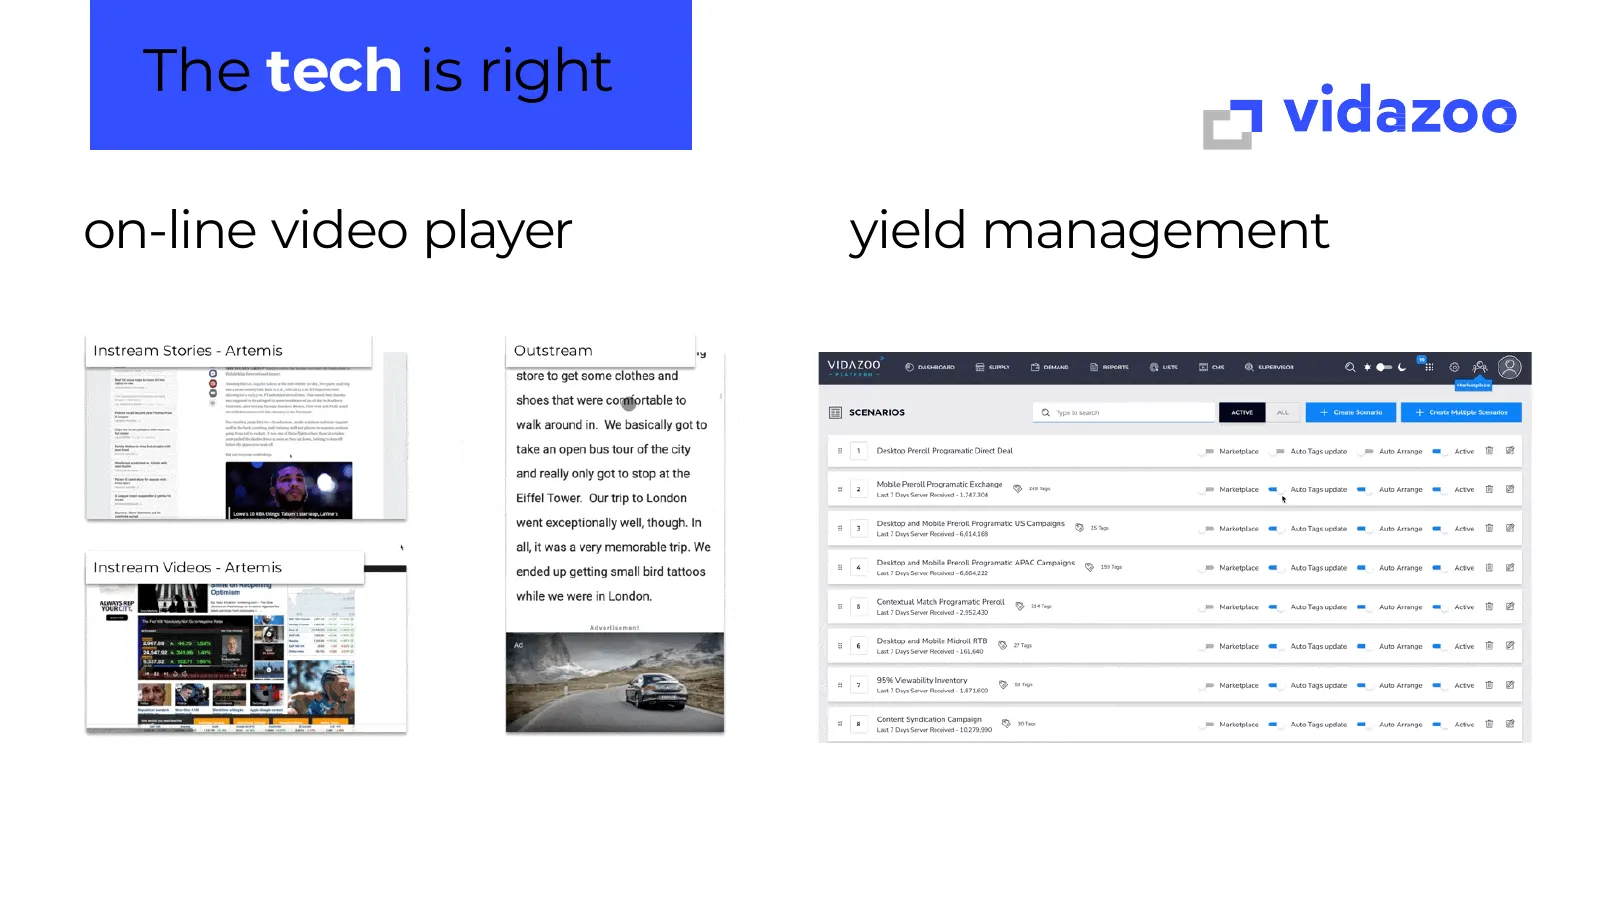
Slide 16: The tech is right
The tech is right on-line video player yield management
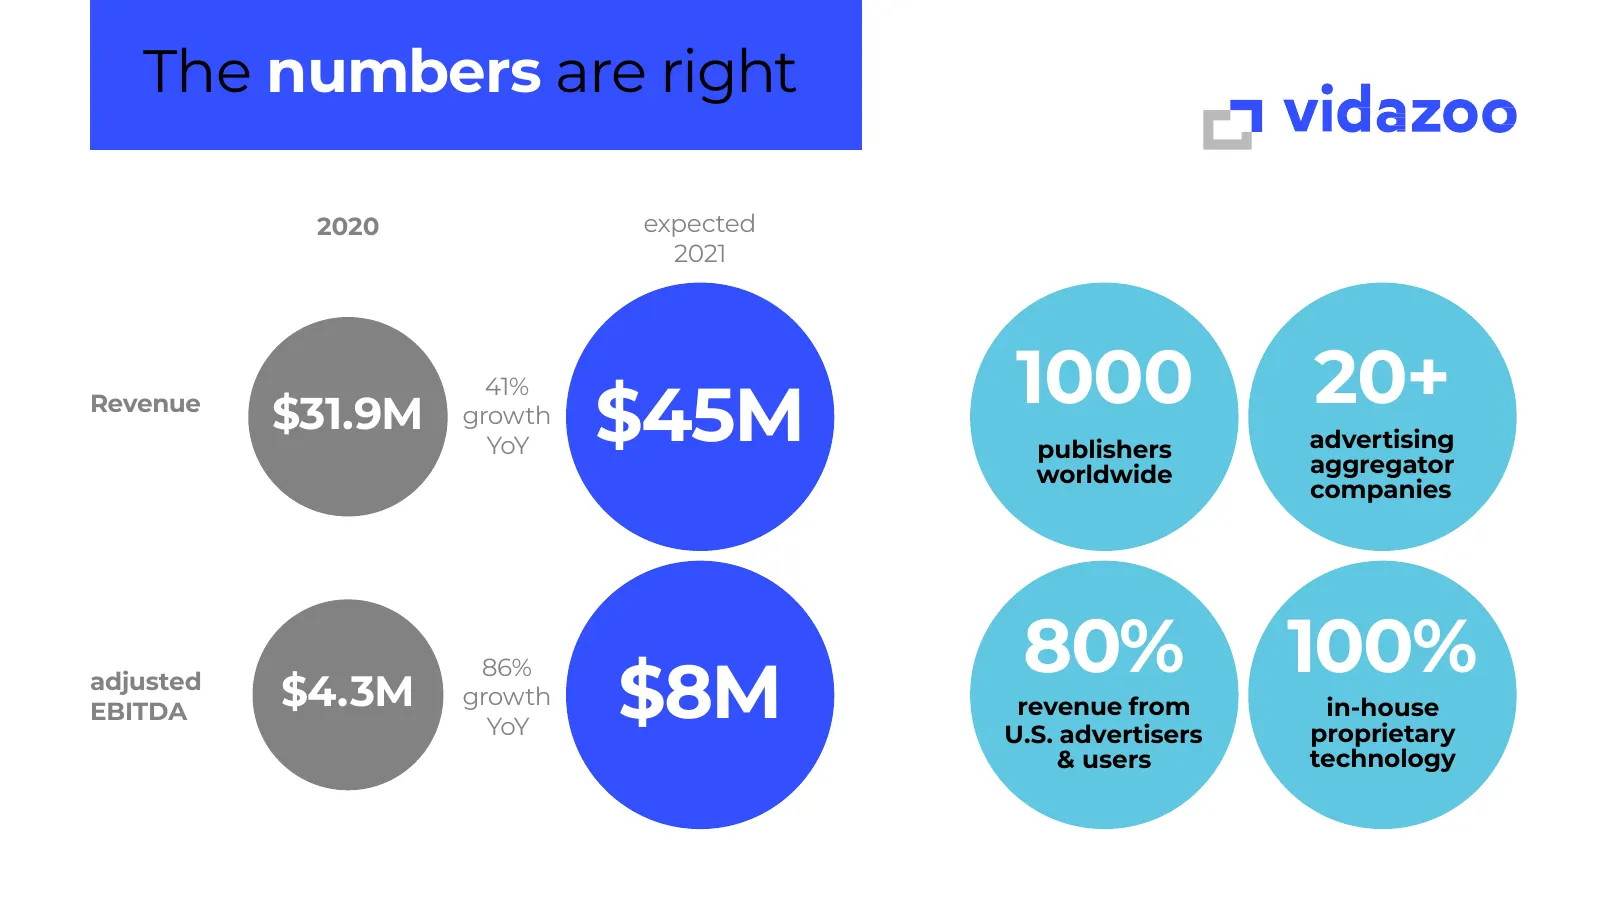
Slide 17: The numbers are right
The numbers are right 2020 expected 2021 Revenue $31.9M 41% growth $45M 1000 20+ YoY publishers advertising worldwide aggregator companies 80% 100% $8M 86% adjusted EBITDA $4.3M growth revenue from in-house YoY U.S. advertisers proprietary & users technology
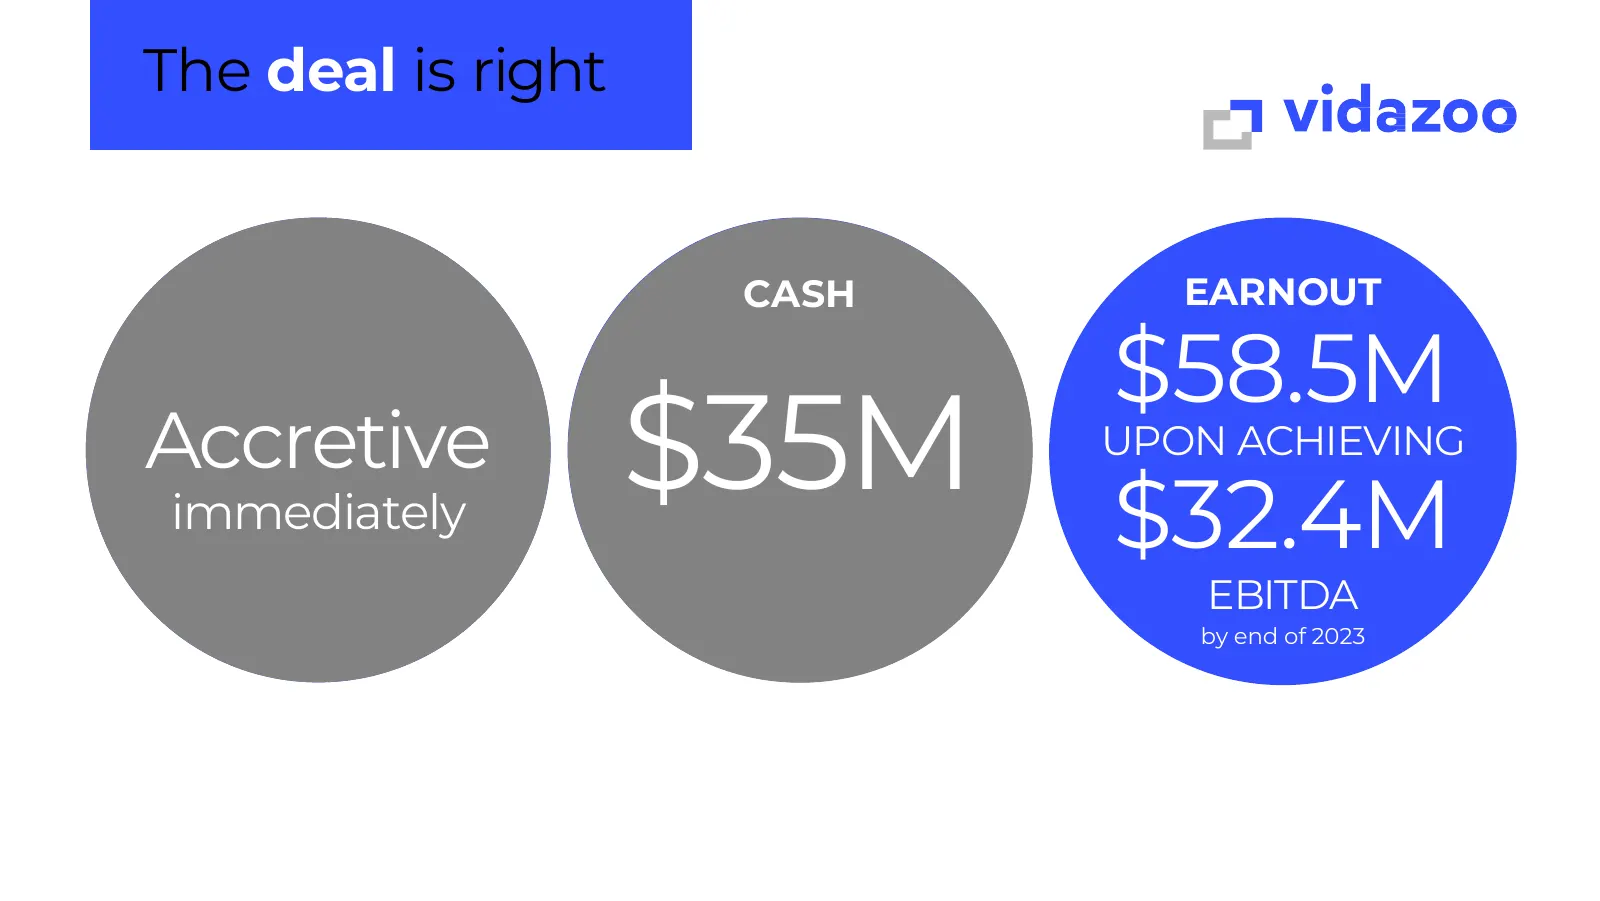
Slide 18: The deal is right
The deal is right CASH EARNOUT $58.5M Accretive immediately $35M UPON ACHIEVING $32.4M EBITDA by end of 2023
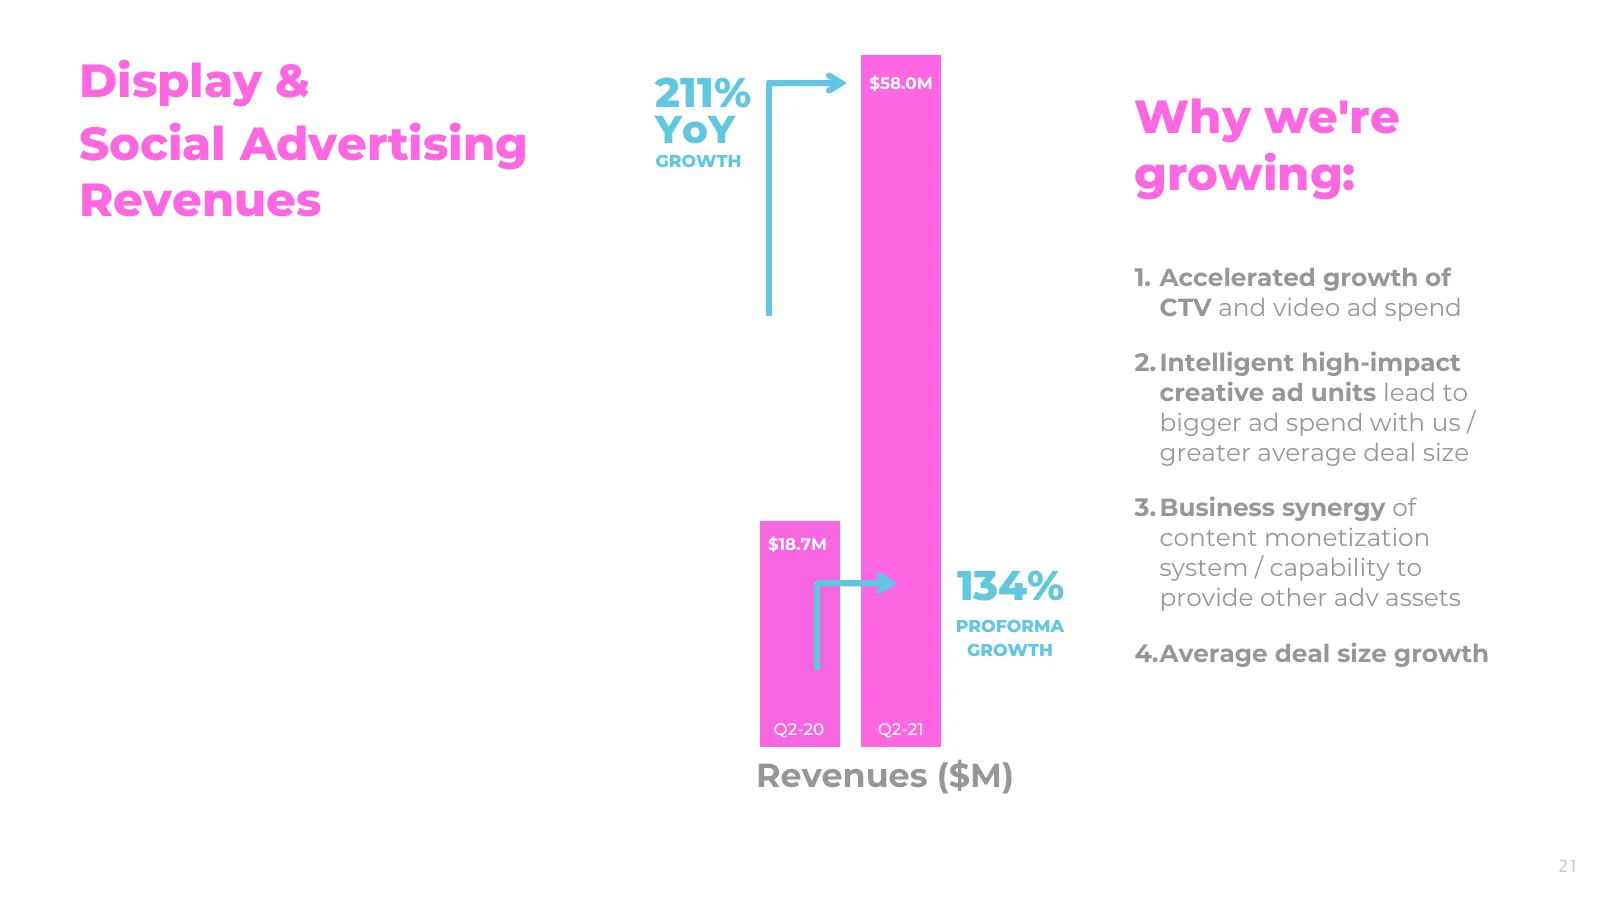
Slide 19: Display & Social Advertising Revenues
Display & 211% $58.0M YoY Why we're Social Advertising GROWTH growing: Revenues 1. Accelerated growth of CTV and video ad spend 2. Intelligent high-impact creative ad units lead to bigger ad spend with us / greater average deal size 3. Business synergy of $18.7M content monetization system / capabil
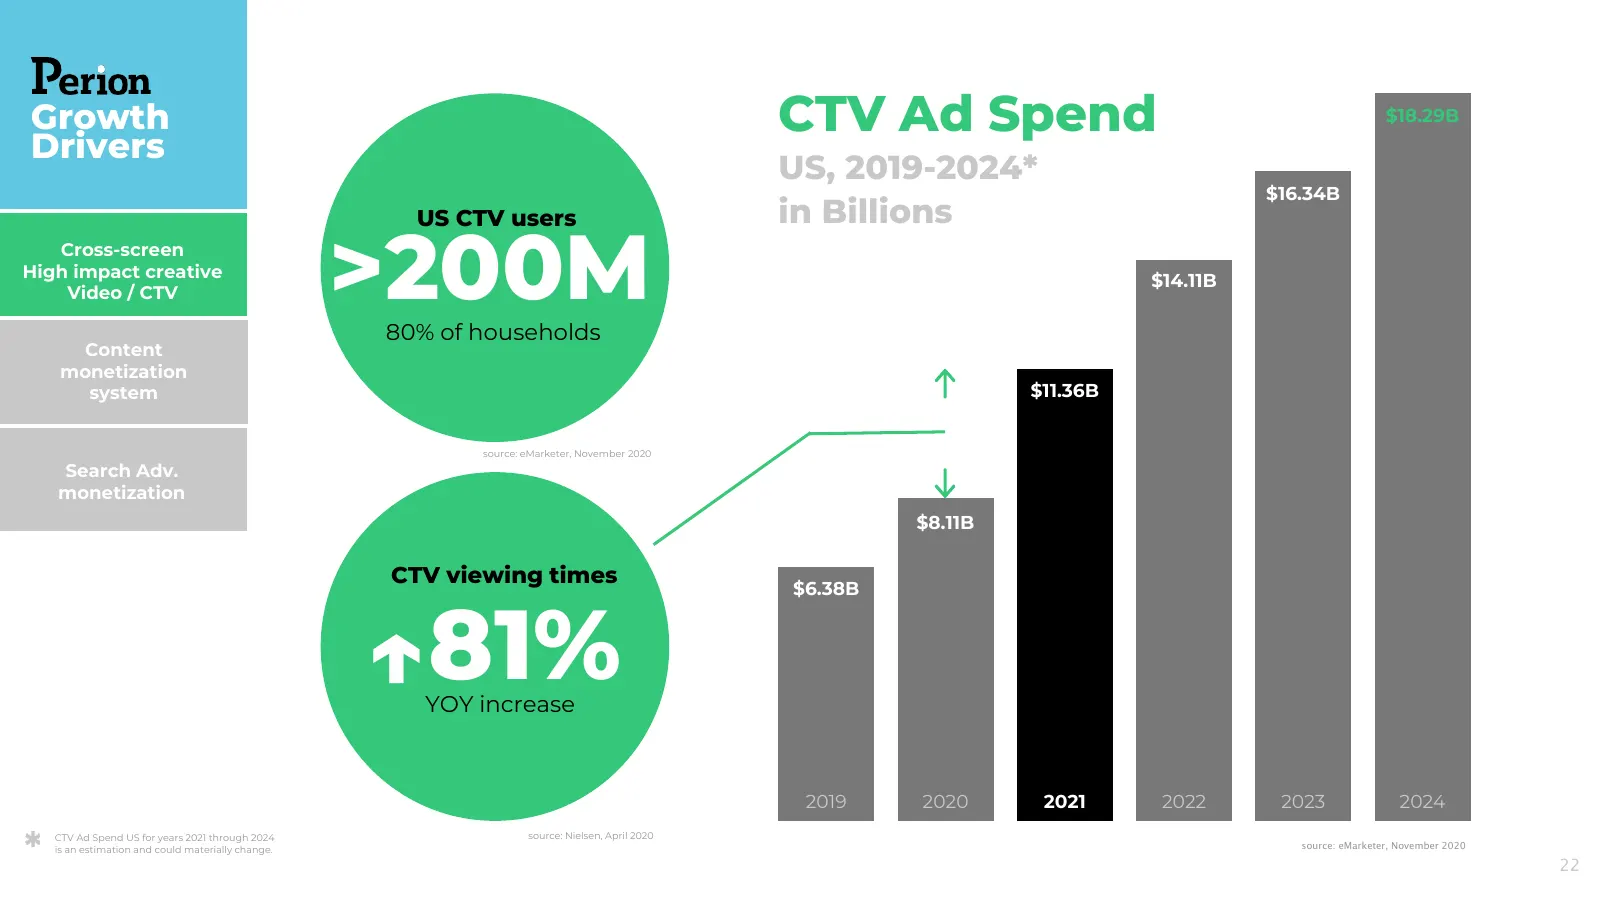
Slide 20: CTV Ad Spend growth driver
Growth CTV Ad Spend $18.29B Drivers US, 2019-2024* $16.34B US CTV users in Billions Cross-screen High impact creative Video / CTV >200M 80% of households $14.11B Content monetization system $11.36B source: eMarketer, November 2020 Search Adv. monetization $8.11B CTV viewing times $6.38B ↑81% YOY inc
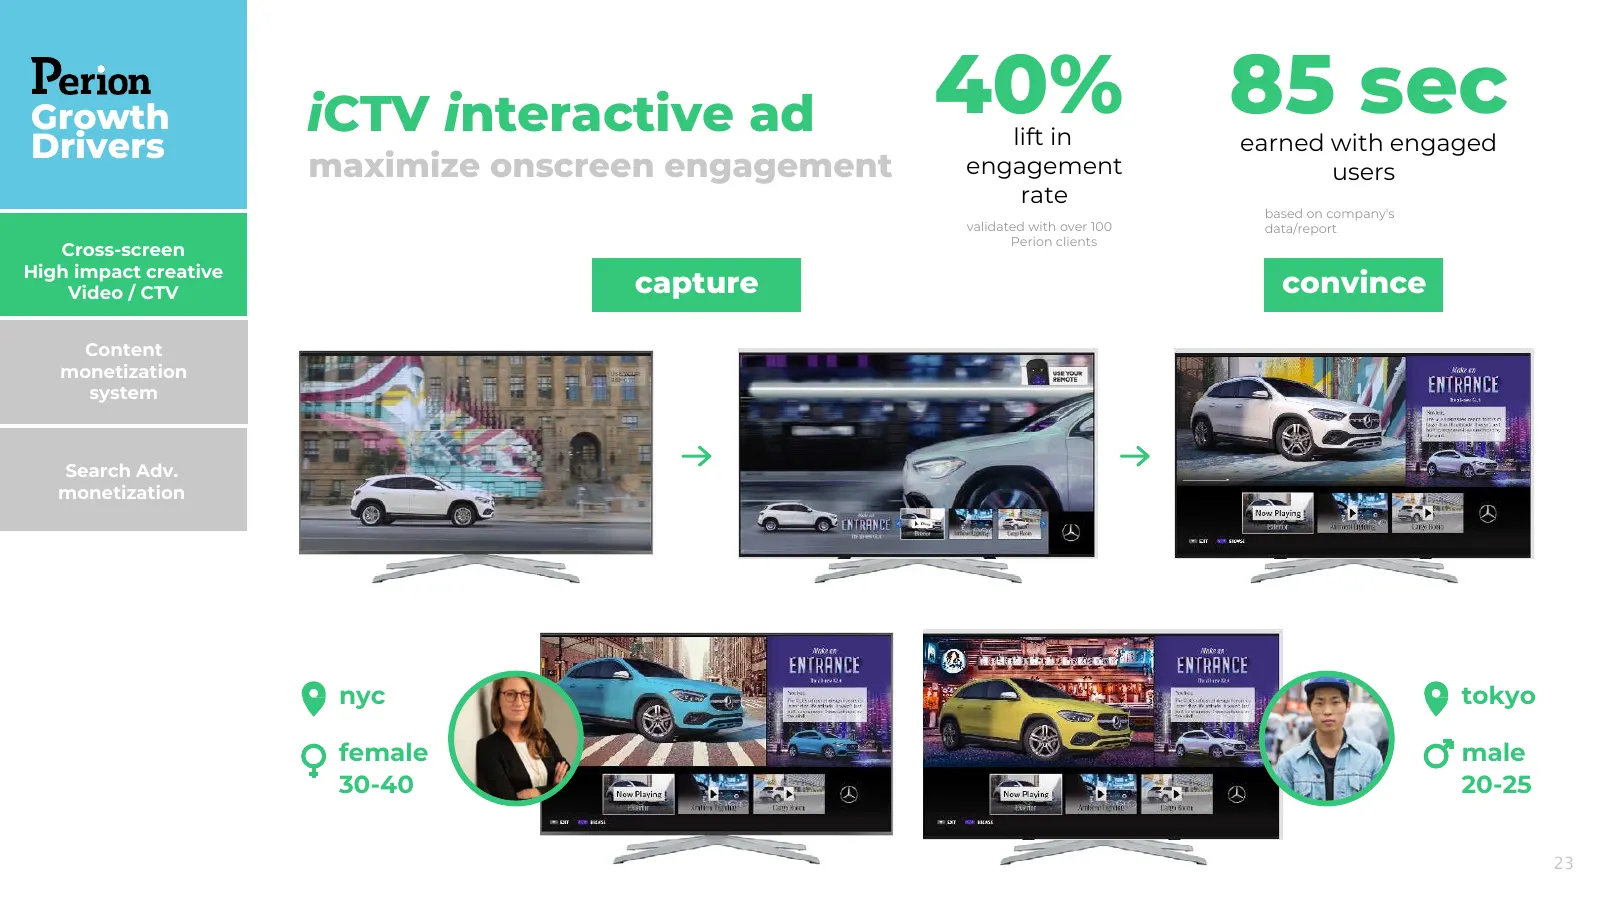
Slide 21: iCTV interactive ad
Growth iCTV interactive ad 40%lift in 85 sec Drivers earned with engaged maximize onscreen engagement engagement users rate based on company's validated with over 100 data/report Perion clients Cross-screen High impact creative Video / CTV capture convince Content monetization system Search Adv. mon

Slide 22: iCTV as part of a multi-screen experience
iCTV Growth Drivers as part of a multi-screen Cross-screen High impact creative Video / CTV experience Content CTV solution served as a monetization system key factor for new customer acquisition and primary contributor to 11% increase Search Adv. monetization in average deal size 24
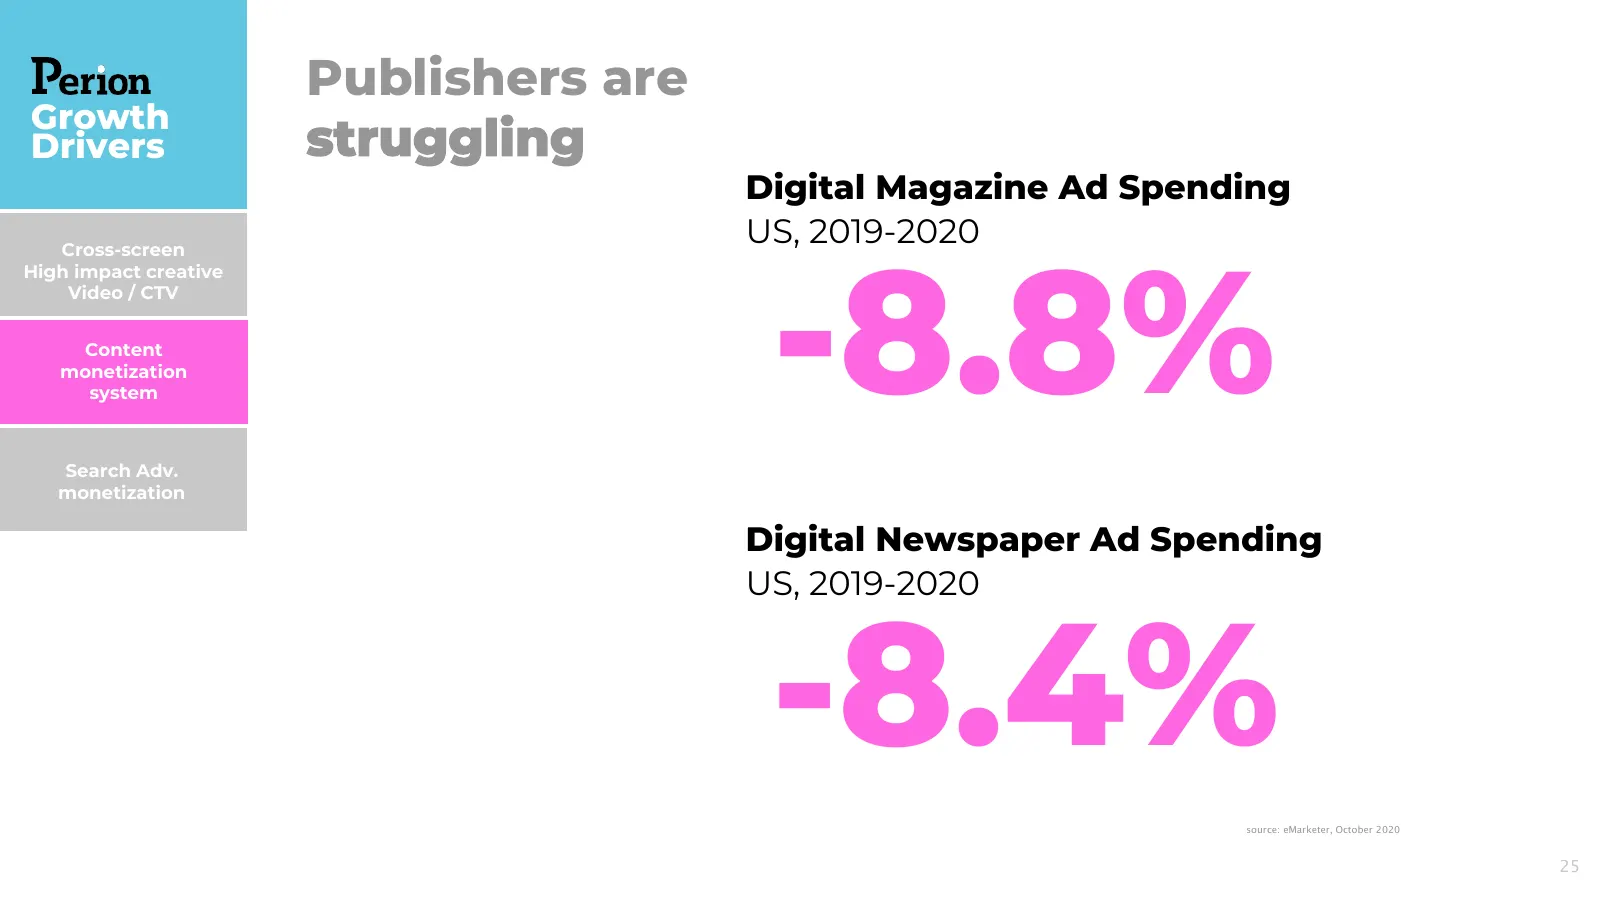
Slide 23: Publishers are struggling
Publishers are Growth Drivers struggling Digital Magazine Ad Spending US, 2019-2020 -8.8% Cross-screen High impact creative Video / CTV Content monetization system Search Adv. monetization Digital Newspaper Ad Spending US, 2019-2020 -8.4% source: eMarketer, October 2020 25
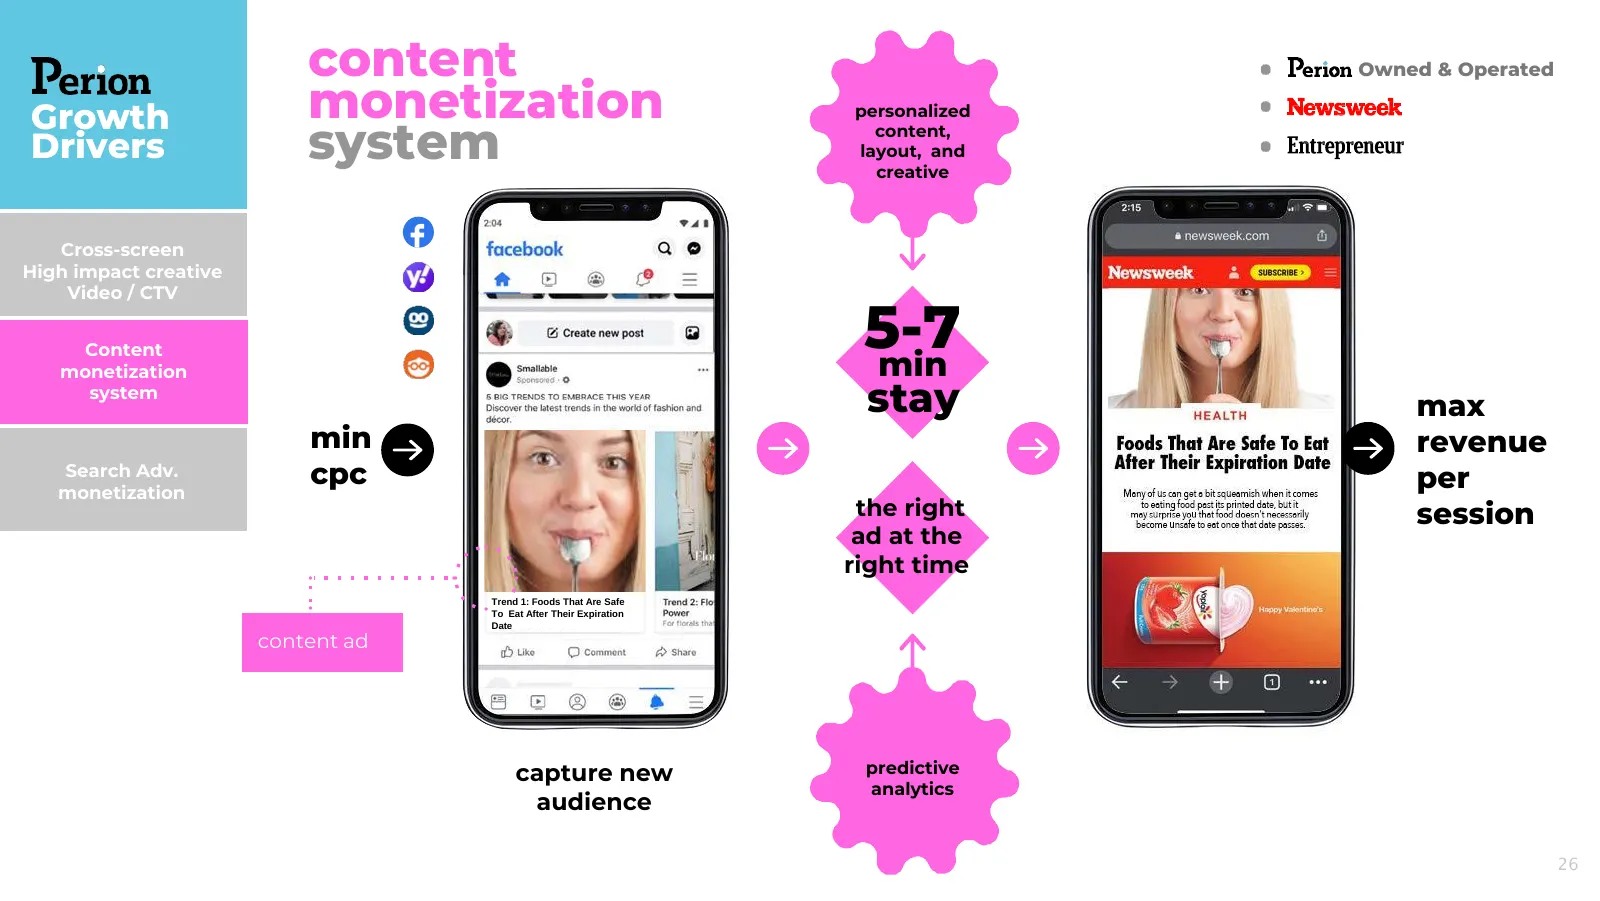
Slide 24: Content monetization system
content Owned & Operated Growth monetization personalized Drivers system content, layout, and creative Cross-screen High impact creative Video / CTV Content 5-7 min monetization system stay max min revenue Search Adv. cpc per monetization the right session ad at the right time Trend 1: Foods That Ar
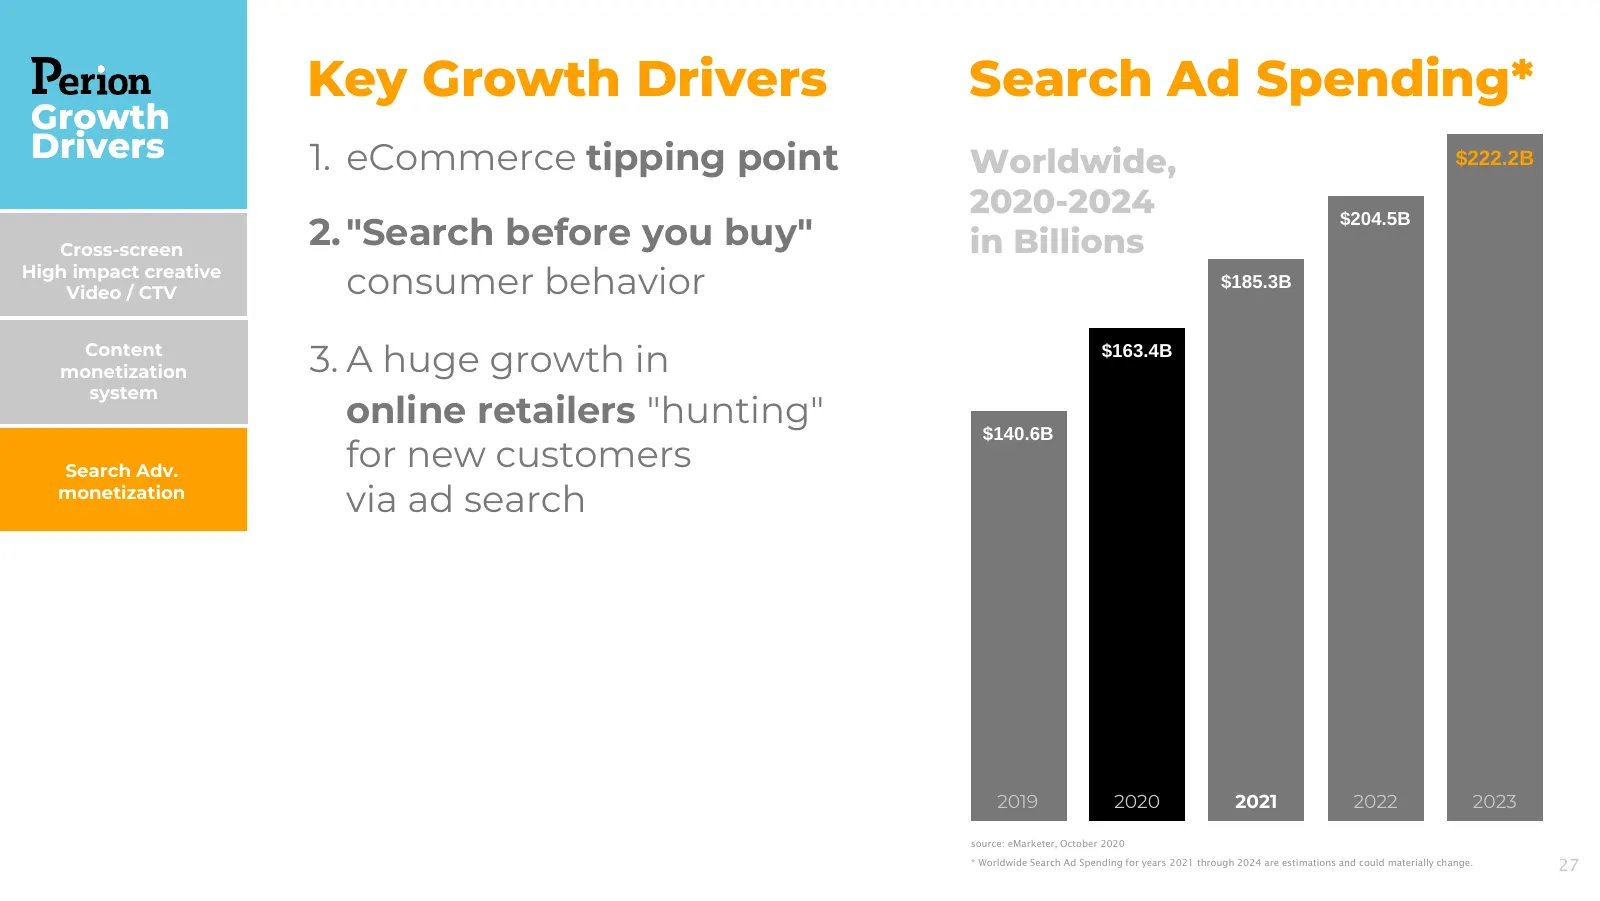
Slide 25: Key Growth Drivers Search Ad Spending
Key Growth Drivers Search Ad Spending* Growth Drivers 1. eCommerce tipping point Worldwide, $222.2B 2020-2024 2. "Search before you buy" $204.5B Cross-screen in Billions High impact creative Video / CTV consumer behavior $185.3B Content monetization 3. A huge growth in $163.4B system online retailer
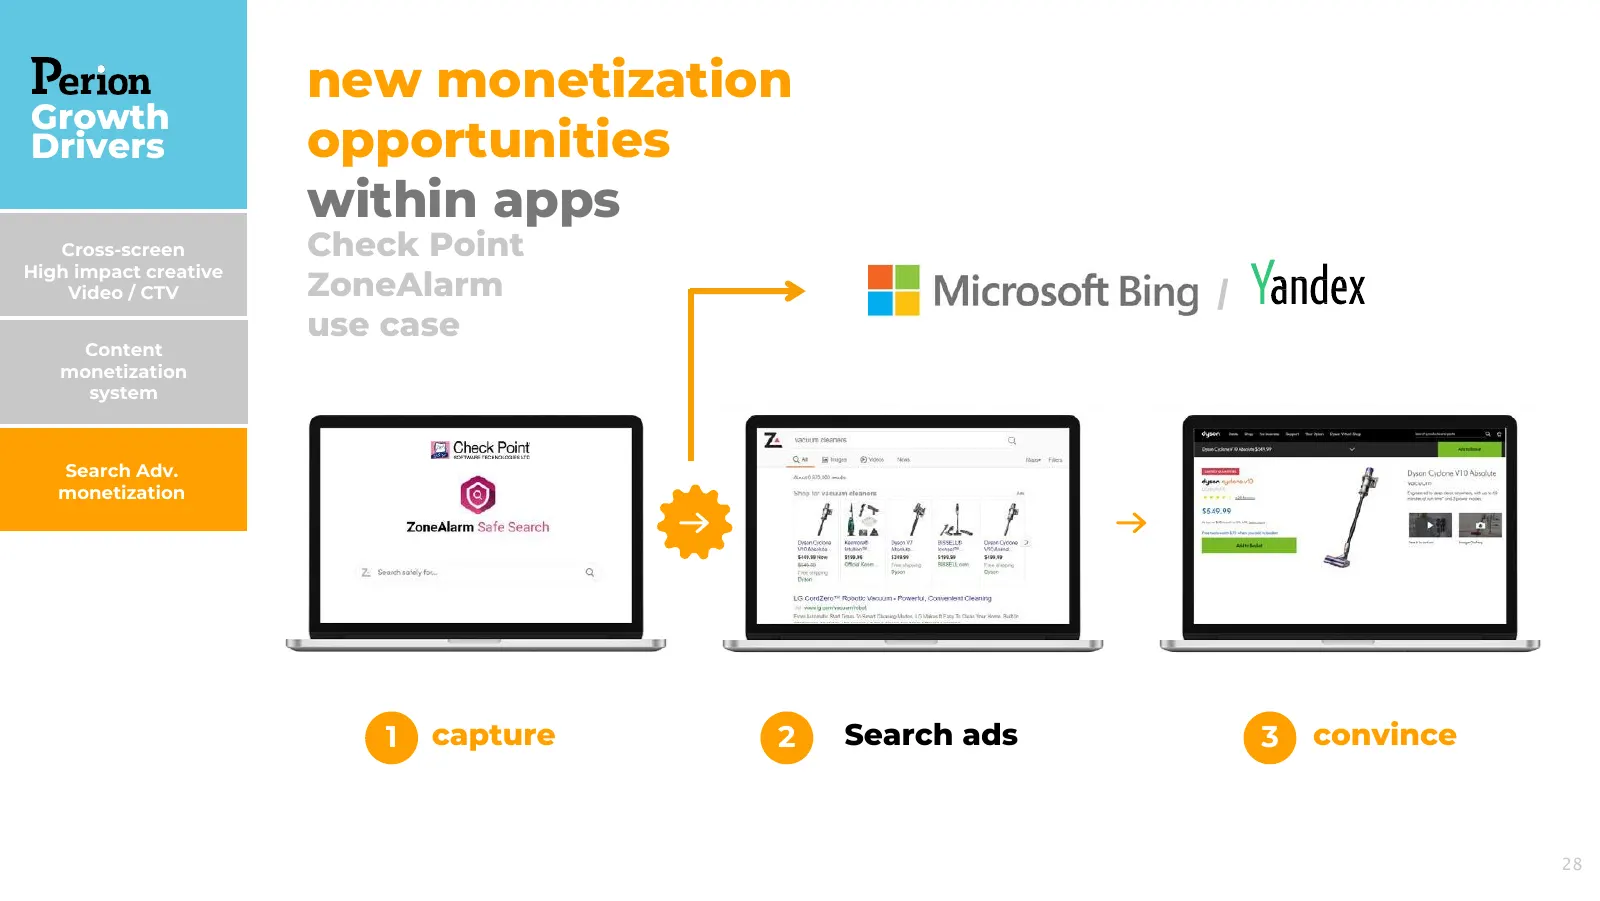
Slide 26: New monetization opportunities within apps
new monetization Growth Drivers opportunities within apps Cross-screen Check Point High impact creative Video / CTV ZoneAlarm / use case Content monetization system Search Adv. monetization 1 capture 2 Search ads 3 convince 28

Slide 27: Search mediation for publishers
Search mediation Growth Drivers for publishers Cross-screen High impact creative Video / CTV Content monetization system Search Adv. monetization channel chosen contextual match of according to best search results to text chances of action 1 2 Display to Search convince 29
Slide 28: $900M new agreement signed Nov. 2020
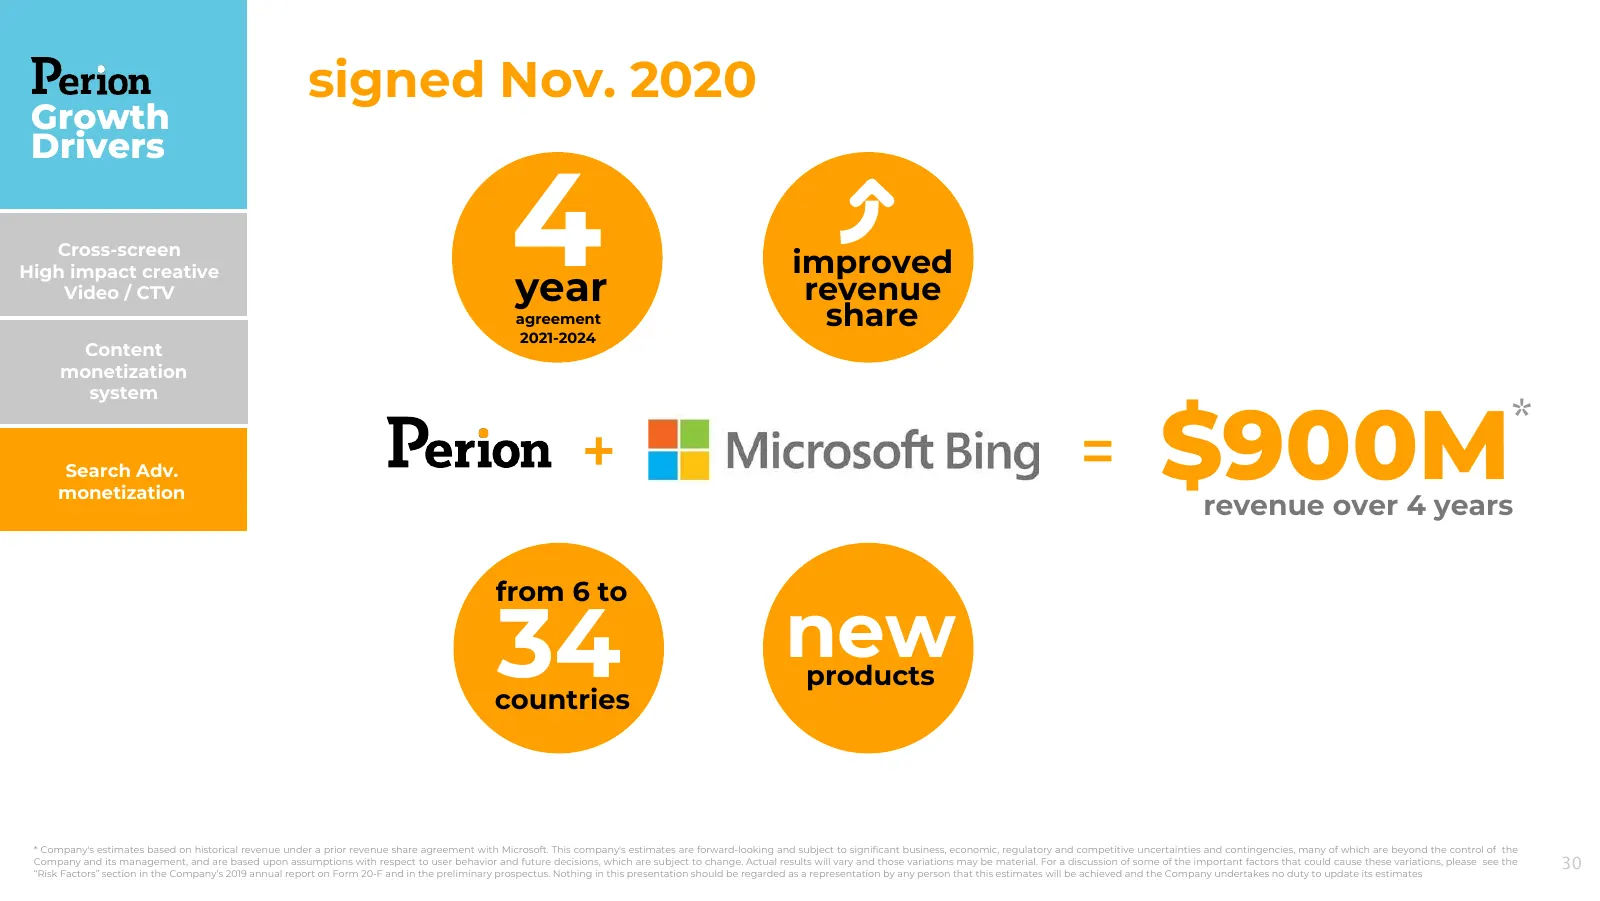
signed Nov. 2020 Growth Drivers Cross-screen High impact creative Video / CTV 4year agreement improved revenue share 2021-2024 Content monetization system Search Adv. monetization + = $900M revenue over 4 years * from 6 to 34 countries new products * Company's estimates based on historical revenue u
Slide 29: We saw years' worth of commerce growth in just a few months
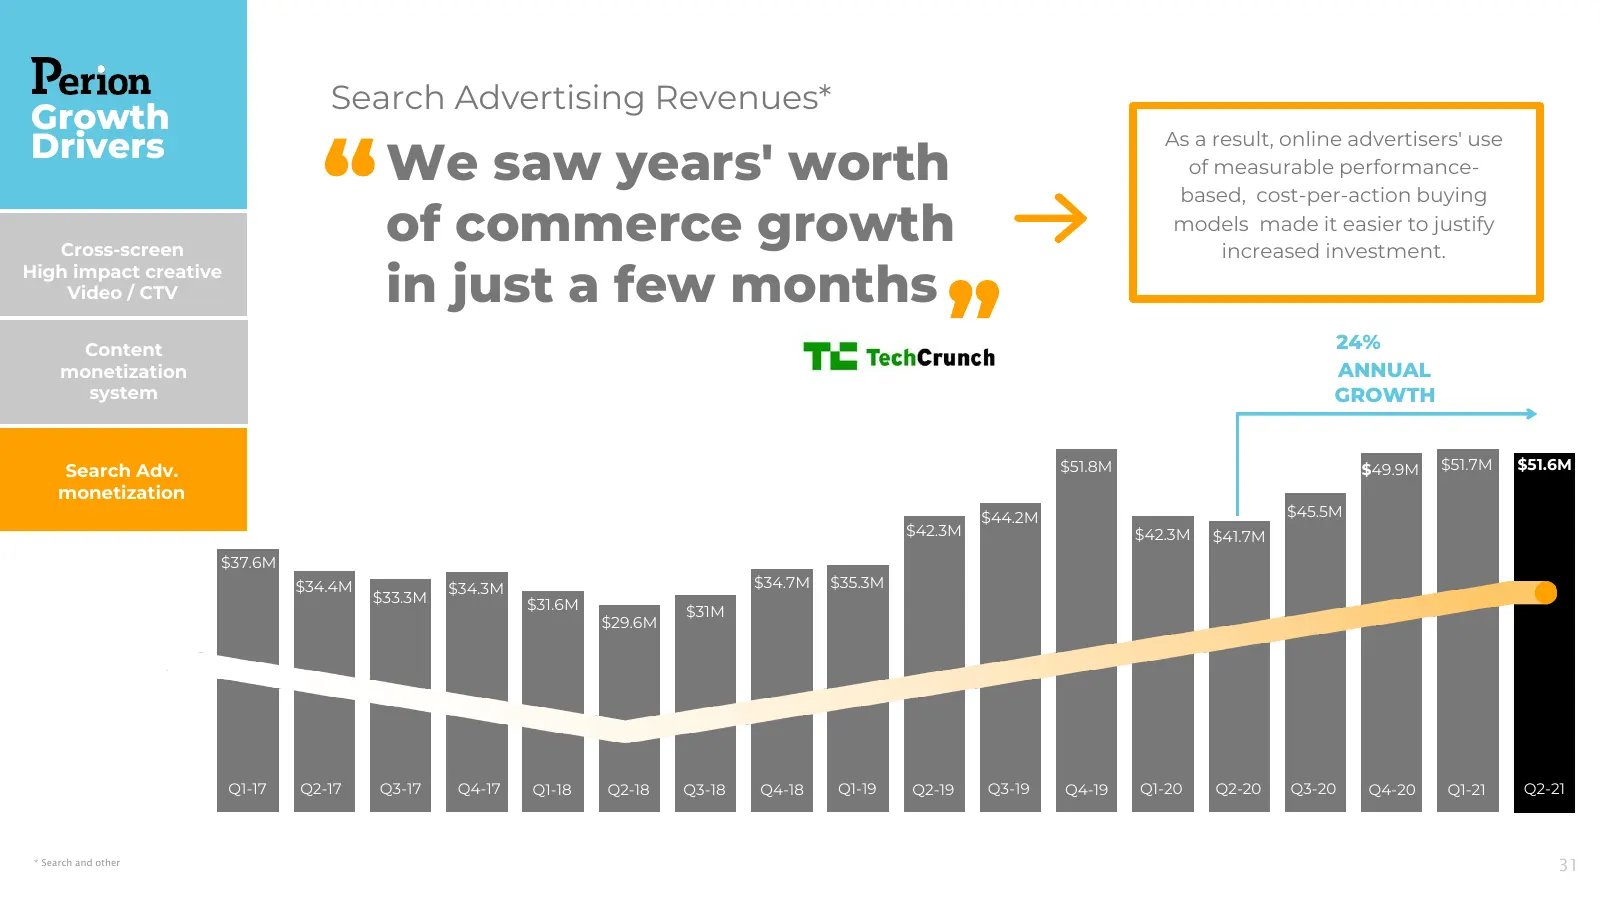
Search Advertising Revenues* Growth Drivers As a result, online advertisers' use We saw years' worth of measurable performance- based, cost-per-action buying Cross-screen of commerce growth models made it easier to justify increased investment. High impact creative Video / CTV in just a few months C
Slide 30: Search Advertising ROI
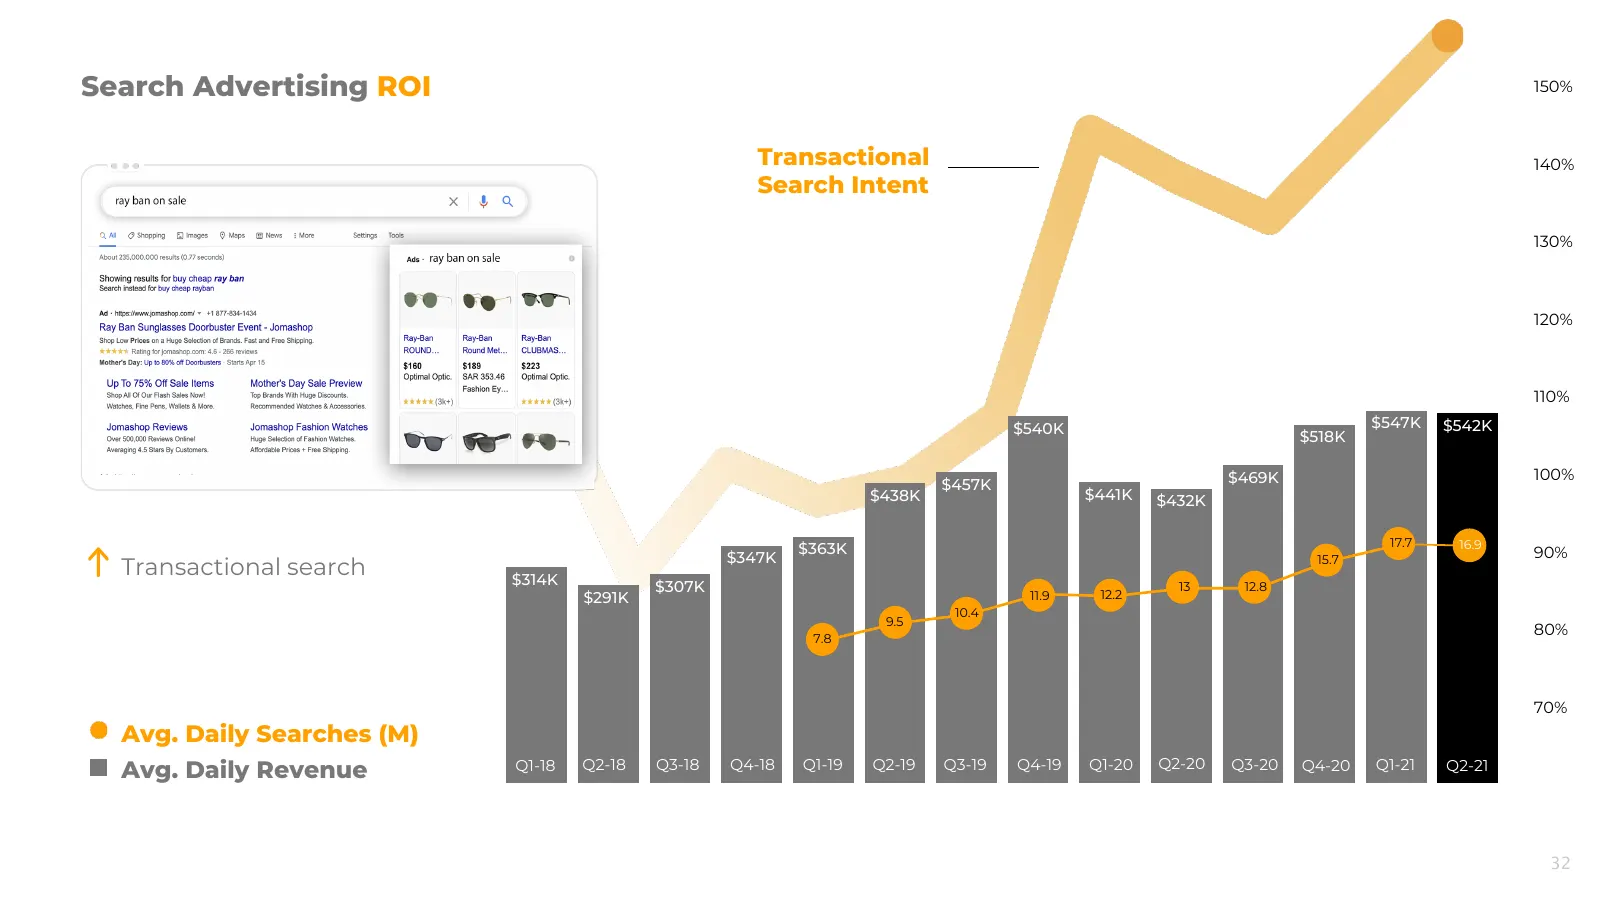
Search Advertising ROI 150% Transactional 140% Search Intent 130% 120% $574K $541K $542K 110% $540K $494K $547K $542K $465k $518K $469K 100% $457K $438K $441K $432K 17.7 16.9 $363K 90% $347K 15.7 Transactional search $314K $307K 12.2 13 12.8 $291K 11.9 10.4 9.5 7.8 80% 70% Avg. Daily Searches (M) Q2
Slide 31: End to end video solution and guidance
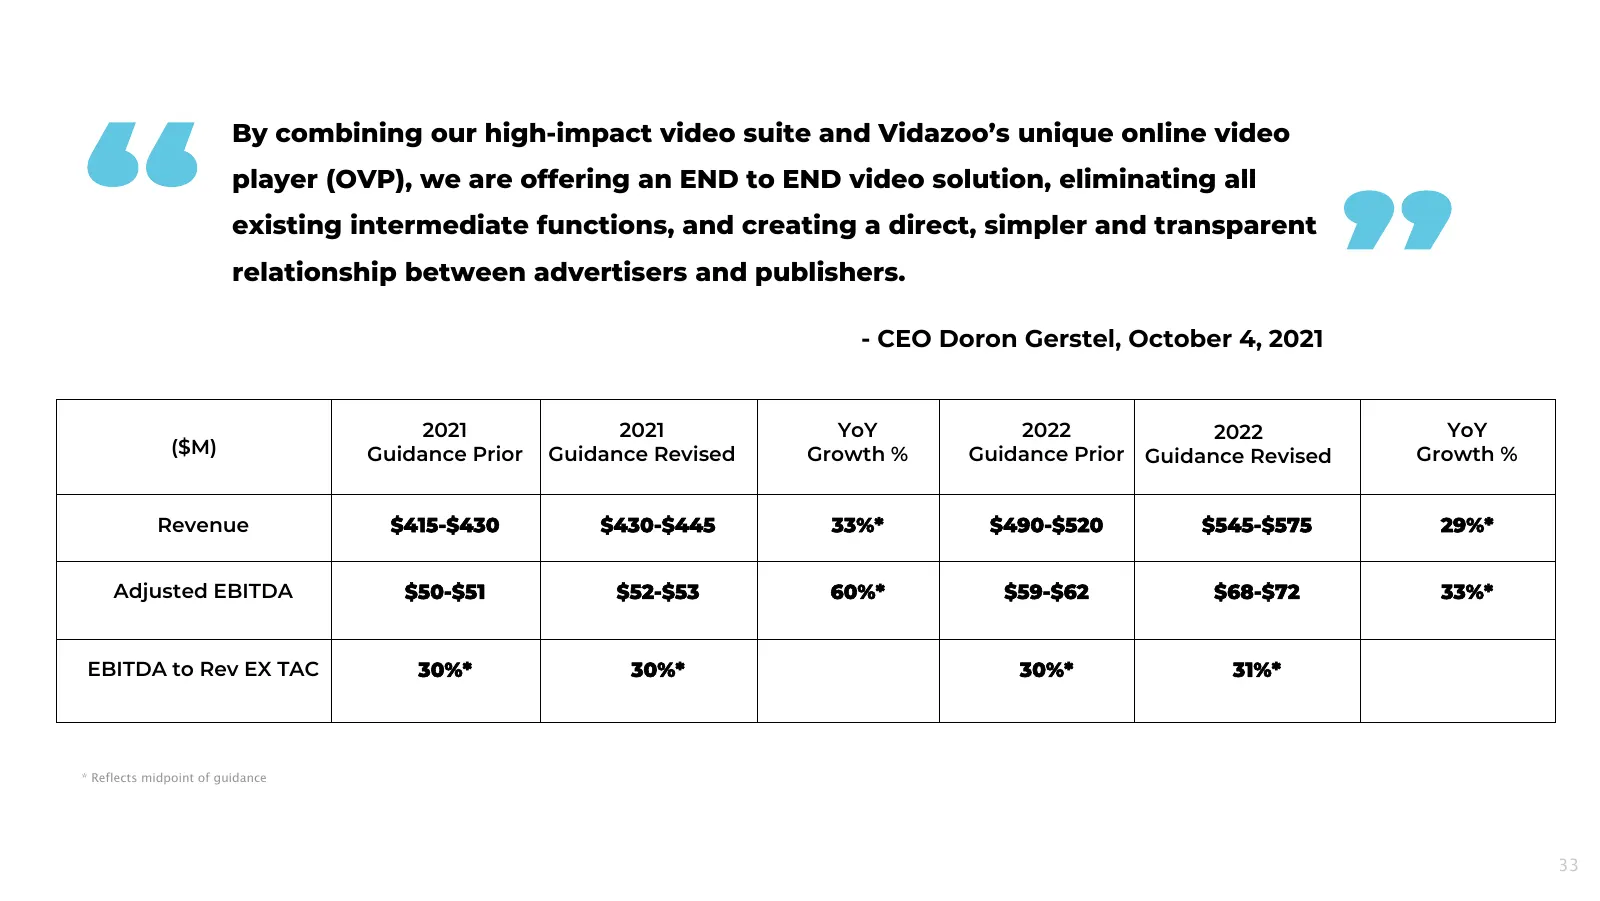
By combining our high-impact video suite and Vidazoo’s unique online video player (OVP), we are offering an END to END video solution, eliminating all existing intermediate functions, and creating a direct, simpler and transparent relationship between advertisers and publishers. - CEO Doron Gerstel,
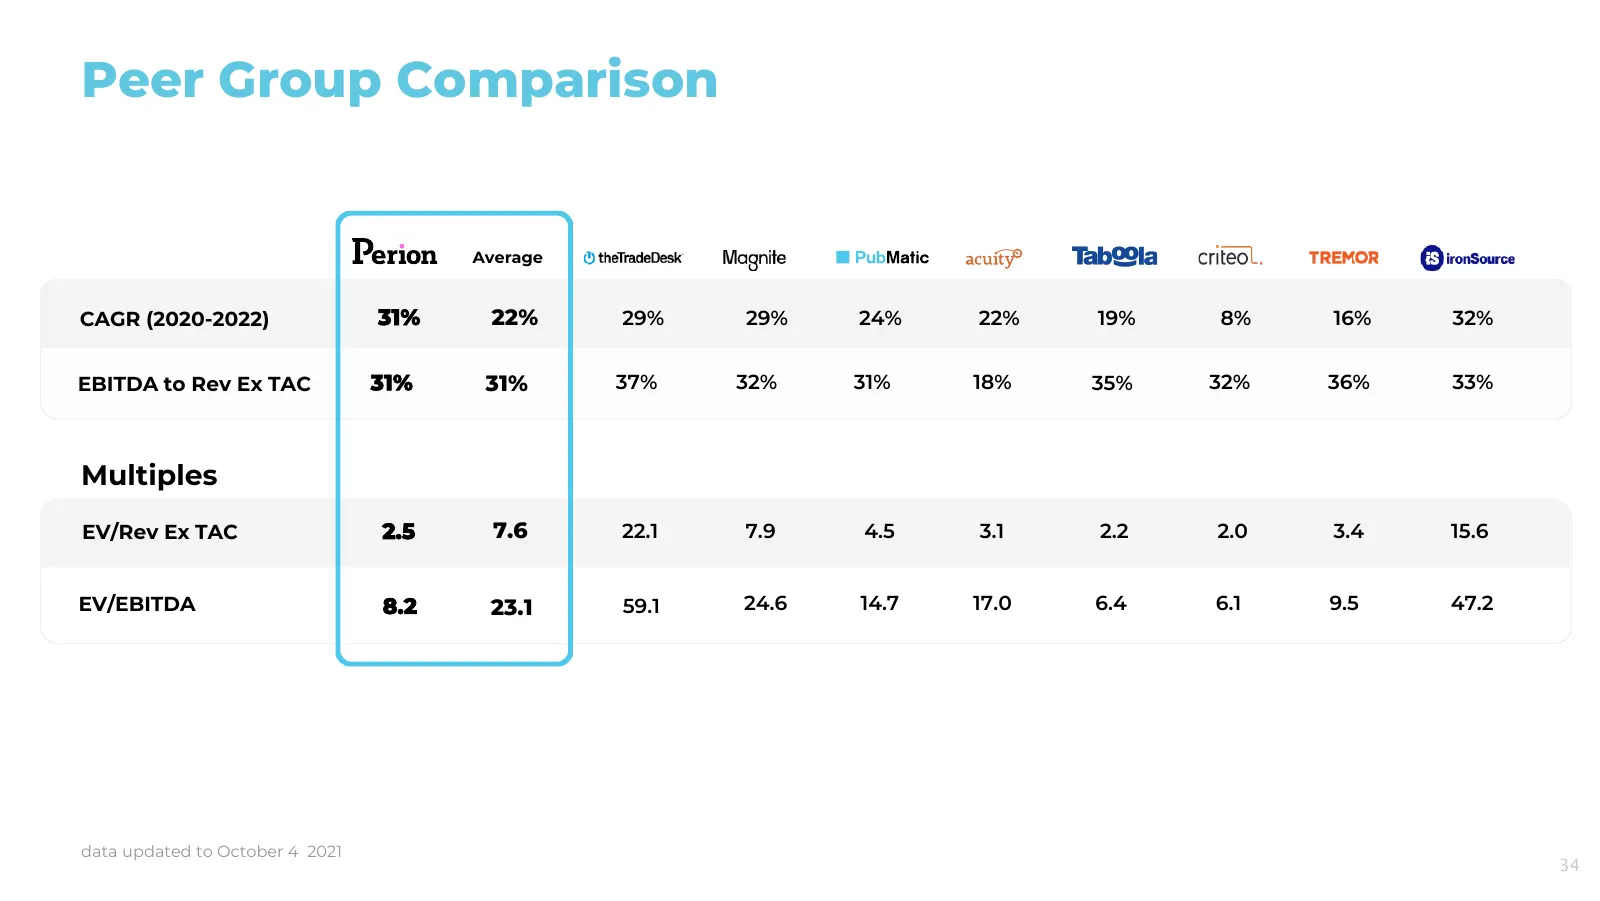
Slide 32: Peer Group Comparison
Peer Group Comparison Average CAGR (2020-2022) 31% 22% 29% 29% 24% 22% 19% 8% 16% 32% EBITDA to Rev Ex TAC 31% 31% 37% 32% 31% 18% 35% 32% 36% 33% Multiples EV/Rev Ex TAC 2.5 7.6 22.1 7.9 4.5 3.1 2.2 2.0 3.4 15.6 EV/EBITDA 8.2 23.1 59.1 24.6 14.7 17.0 6.4 6.1 9.5 47.2 data updated to October 4 2021

Slide 33: Thank you
thank you

Slide 34: Appendix
appendix 37
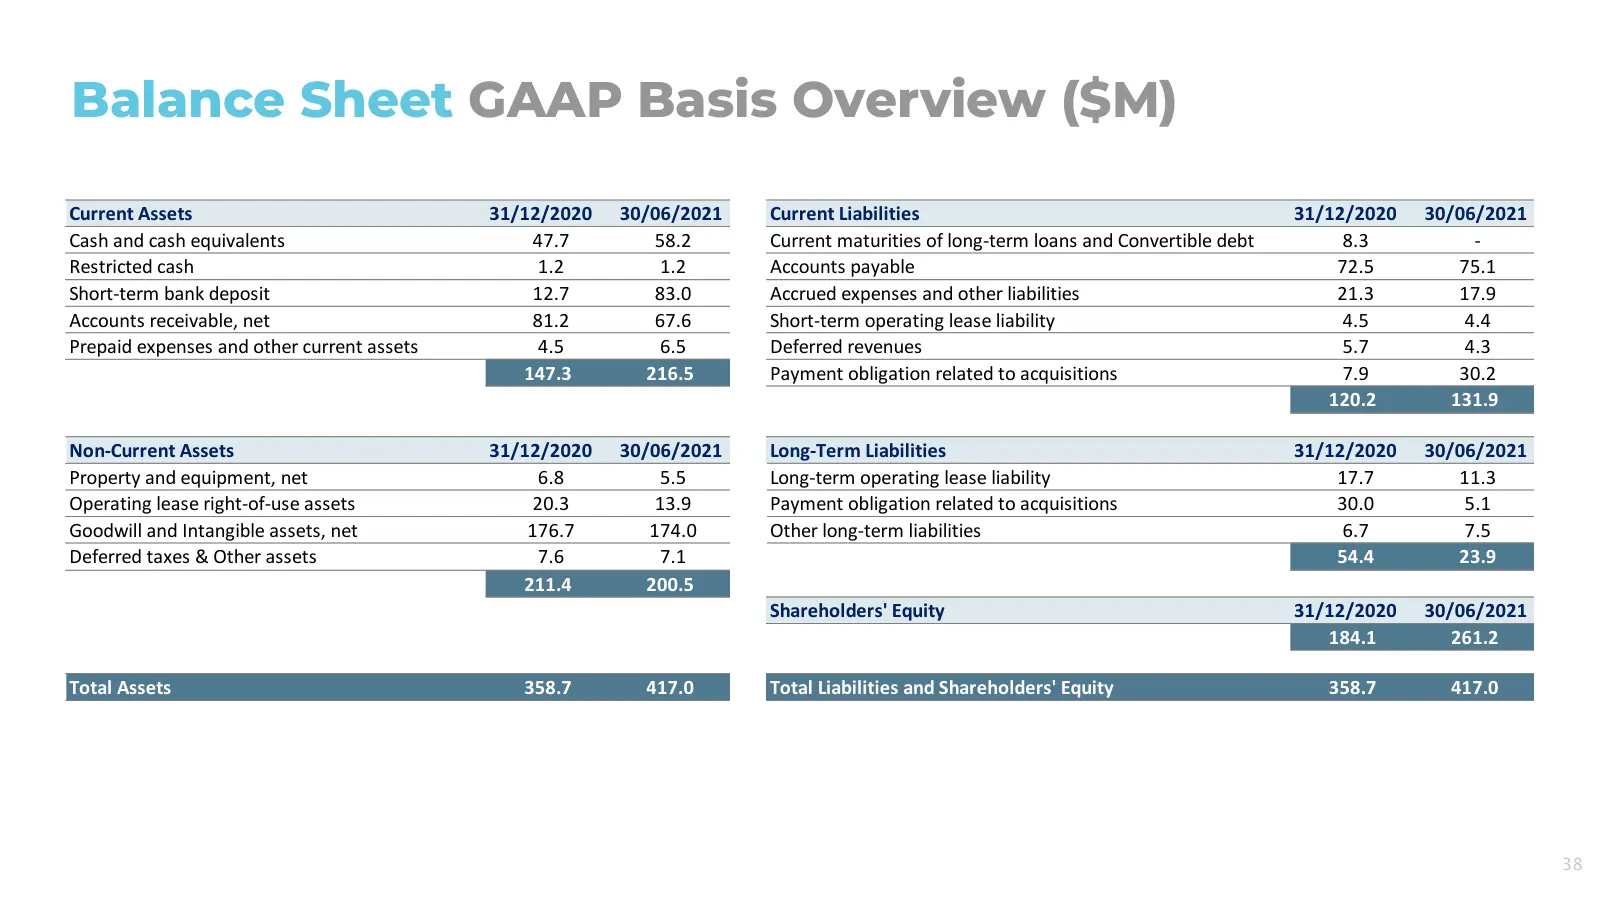
Slide 35: Balance Sheet GAAP Basis Overview ($M)
Balance Sheet GAAP Basis Overview ($M) Current Assets 31/12/2020 30/06/2021 Current Liabilities 31/12/2020 30/06/2021 Cash and cash equivalents 47.7 58.2 Current maturities of long-term loans and Convertible debt 8.3 - Restricted cash 1.2 1.2 Accounts payable 72.5 75.1 Short-term bank deposit 12.7 8
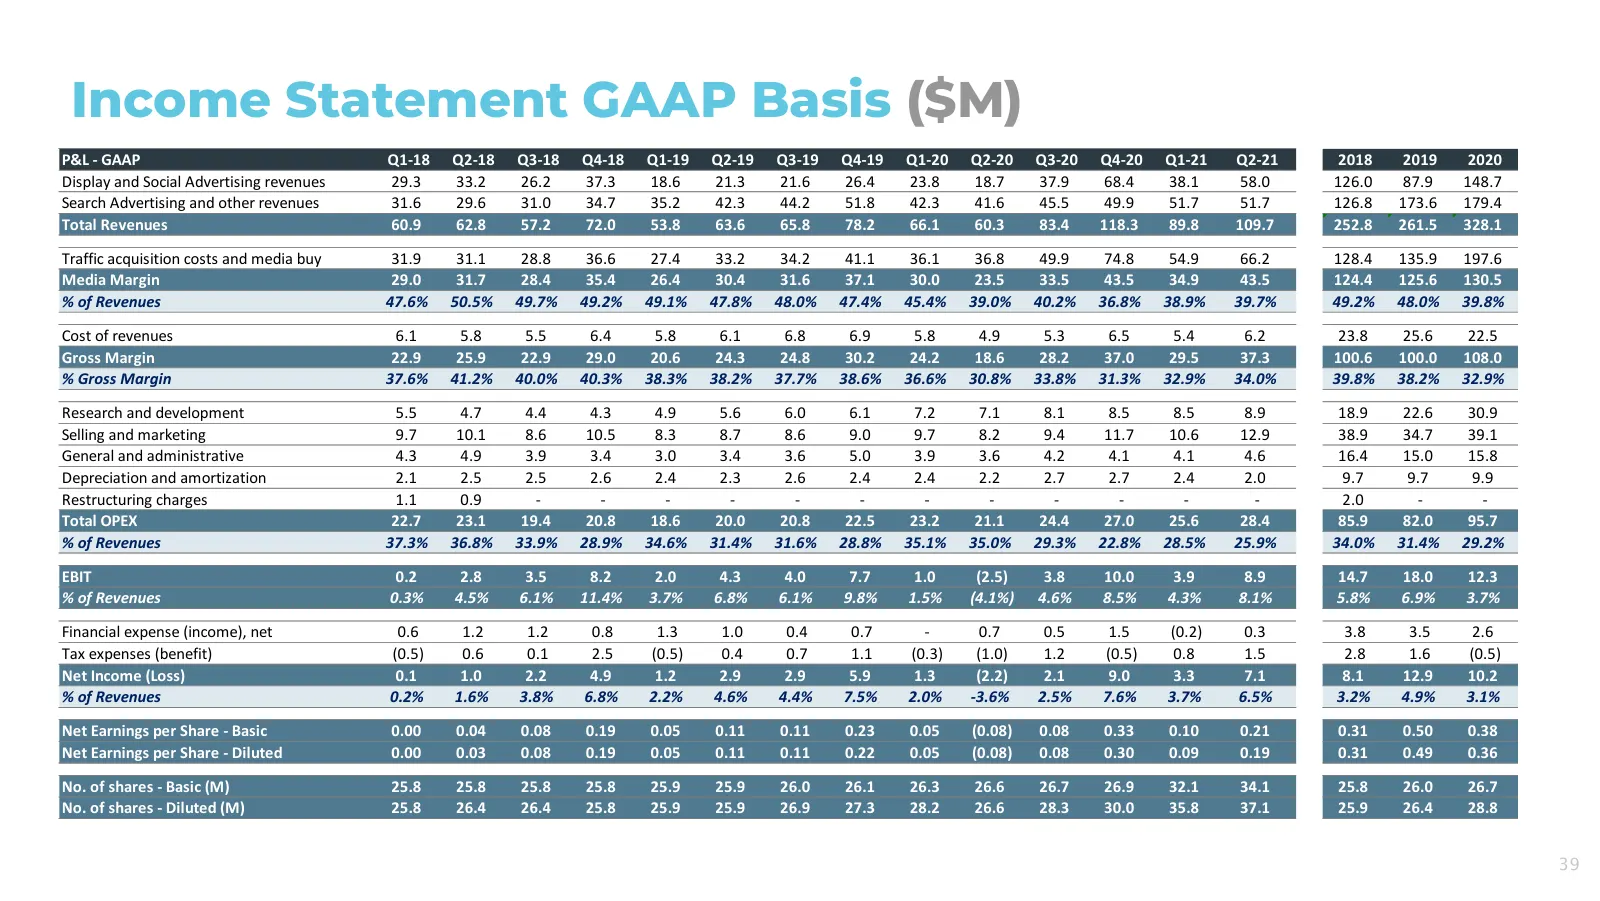
Slide 36: Income Statement GAAP Basis ($M)
Income Statement GAAP Basis ($M) P&L - GAAP Q1-18 Q2-18 Q3-18 Q4-18 Q1-19 Q2-19 Q3-19 Q4-19 Q1-20 Q2-20 Q3-20 Q4-20 Q1-21 Q2-21 2018 2019 2020 Display and Social Advertising revenues 29.3 33.2 26.2 37.3 18.6 21.3 21.6 26.4 23.8 18.7 37.9 68.4 38.1 58.0 126.0 87.9 148.7 Search Advertising and other r
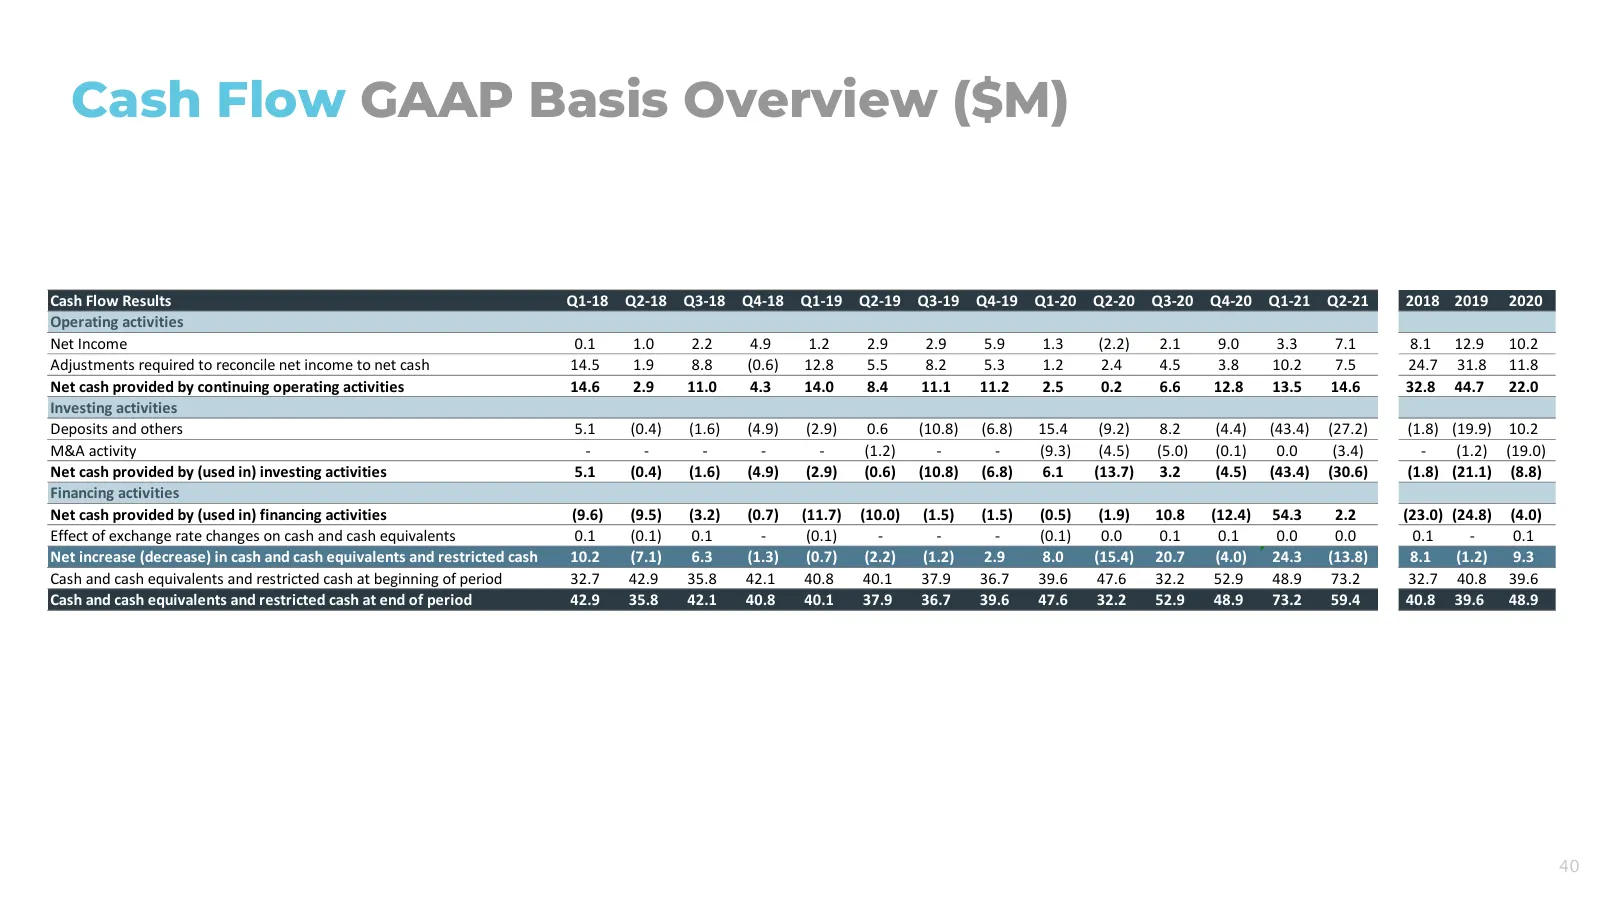
Slide 37: Cash Flow GAAP Basis Overview ($M)
Cash Flow GAAP Basis Overview ($M) Cash Flow Results Q1-18 Q2-18 Q3-18 Q4-18 Q1-19 Q2-19 Q3-19 Q4-19 Q1-20 Q2-20 Q3-20 Q4-20 Q1-21 Q2-21 2018 2019 2020 Operating activities Net Income 0.1 1.0 2.2 4.9 1.2 2.9 2.9 5.9 1.3 (2.2) 2.1 9.0 3.3 7.1 8.1 12.9 10.2 Adjustments required to reconcile net income
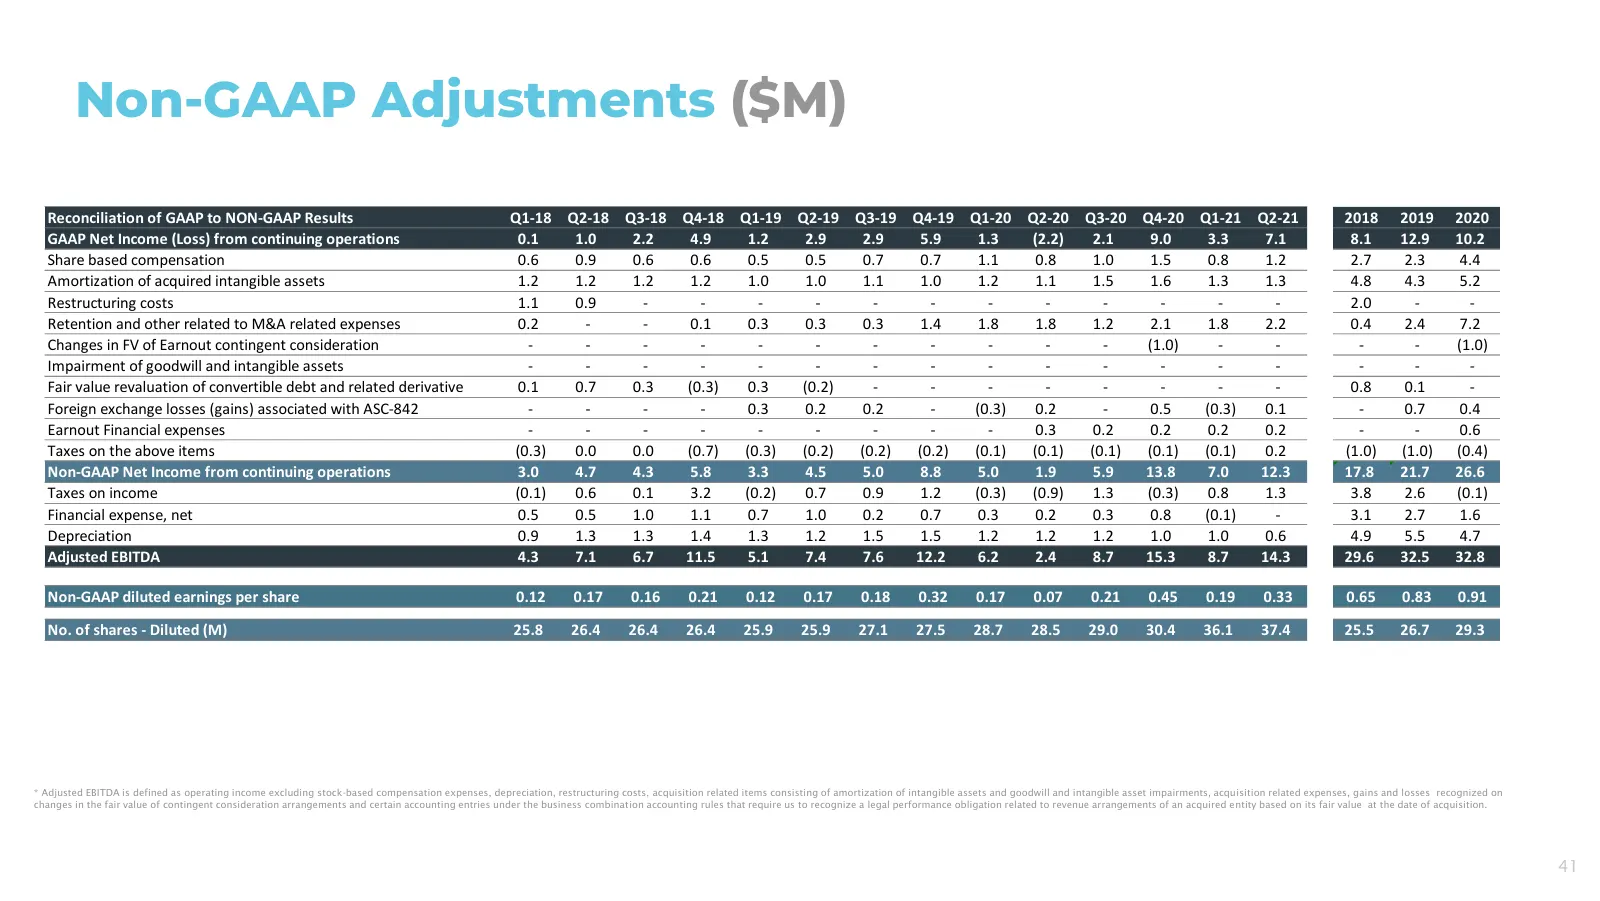
Slide 38: Non-GAAP Adjustments ($M)
Non-GAAP Adjustments ($M) Reconciliation of GAAP to NON-GAAP Results Q1-18 Q2-18 Q3-18 Q4-18 Q1-19 Q2-19 Q3-19 Q4-19 Q1-20 Q2-20 Q3-20 Q4-20 Q1-21 Q2-21 2018 2019 2020 GAAP Net Income (Loss) from continuing operations 0.1 1.0 2.2 4.9 1.2 2.9 2.9 5.9 1.3 (2.2) 2.1 9.0 3.3 7.1 8.1 12.9 10.2 Share base
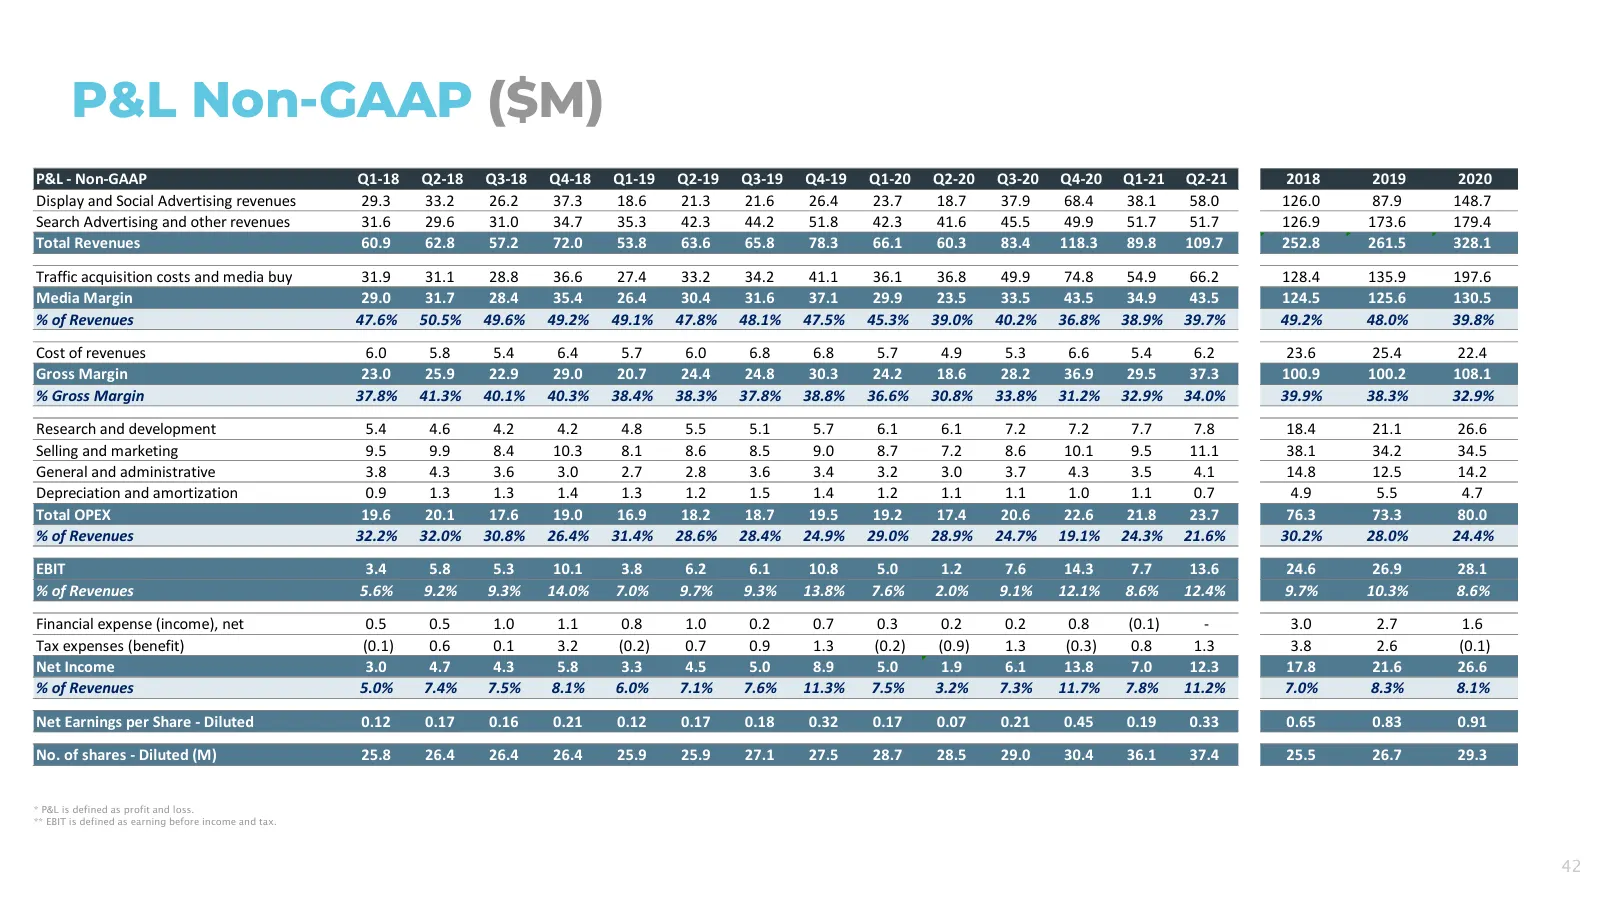
Slide 39: P&L Non-GAAP ($M)
P&L Non-GAAP ($M) P&L - Non-GAAP Q1-18 Q2-18 Q3-18 Q4-18 Q1-19 Q2-19 Q3-19 Q4-19 Q1-20 Q2-20 Q3-20 Q4-20 Q1-21 Q2-21 2018 2019 2020 Display and Social Advertising revenues 29.3 33.2 26.2 37.3 18.6 21.3 21.6 26.4 23.7 18.7 37.9 68.4 38.1 58.0 126.0 87.9 148.7 Search Advertising and other revenues 31.
Source: Internet Archive copy of wp-cdn.perion.com
More decks from Perion Network Ltd
 Q2 2026 Earnings Presentation43 slides · Aug 10, 2026
 Investor Presentation (August 2026)83 slides · August 2026
 Investor Presentation (June 2026)80 slides · Jun 29, 2026
 Q1 2026 Earnings Presentation39 slides · May 20, 2026
 Q4 2025 Earnings Presentation54 slides · Feb 18, 2026
 Q3 2025 Earnings Presentation40 slides · Nov 12, 2025