Cbot — Credit Suisse Financial Services Forum 2007
47 slides from Cbot's conference presentation, Feb 8, 2007
Slide 1: CBOT Holdings, Inc. – Credit Suisse Financial Services Forum
CBOT Holdings, Inc. Credit Suisse Financial Services Forum February 7, 2007 Bernard Dan, President and Chief Executive Officer Exhibit 99.1
Slide 2: Forward Looking Statements
Forward Looking Statements February 7, 2007 Certain statements in this presentation may contain forward-looking statements within the meaning of the Private Securities Litigation Reform Act of 1995 and includes any use of the words “may,” “should,” “could,” “expects,” “plans,” “anticipates,” “believ
Slide 3: CBOT: 2006 Record Year
CBOT: 2006 Record Year Trading volume - 20% Revenues - 35% Net income - 125% Market leader: Futures and options on futures #2 in United States #3 in World % chg
Slide 4: Overview
Overview Industry Trends Growth Strategies Financial Review Merger Update
Slide 5: Intensifying global competition among futures, cash and over-the-counter markets
Intensifying global competition among futures, cash and over-the-counter markets Industry Trends Globalization Rapid international growth Technological advances Increased trading speed Industry consolidation
Slide 6: Industry Growth Drivers
Industry Growth Drivers Technological advances Globalization Emerging economies and urbanization Commodities as asset class Importance of risk management Asset class convergence U.S. government spending Deregulation
Slide 7: Large, Expanding Market
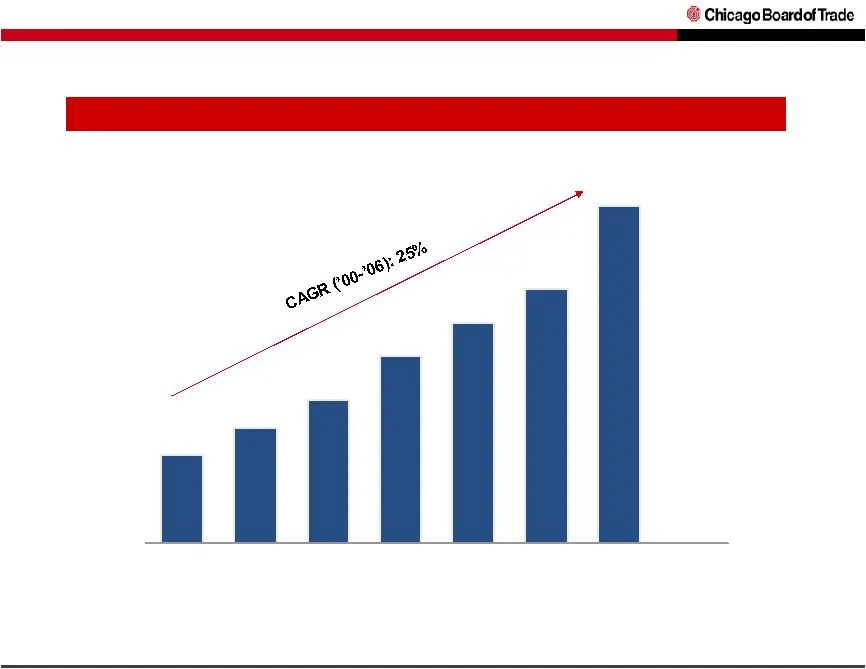
1.6 2.1 2.6 3.4 4.0 4.6 6.1 Global Futures & Options on Futures Contract Volume (billions of contracts) Large, Expanding Market 2000 2001 2002 2003 2004 2005 2006 Source: Futures Industry Association Note: Excludes options on individual equities
Slide 8: Growing Operating Leverage: Record volume and earnings
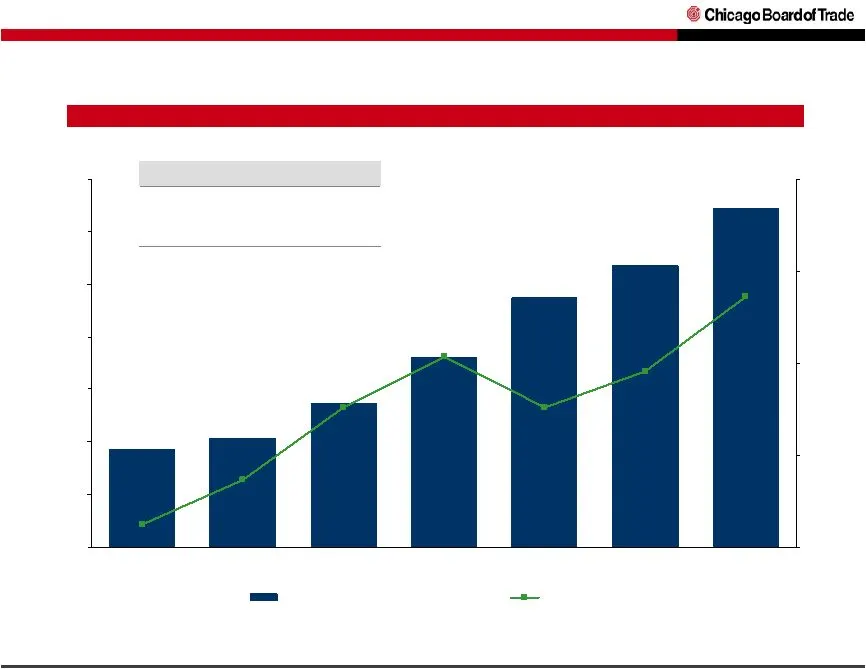
20.4% 4.6% (5.0%) 28.3% 31.4% 20.3% 44.4% Growing Operating Leverage: Record volume and earnings – 1,000 1,500 2,000 2,500 3,000 3,500 2000 2001 2002 2003 2004 2005 2006 (10.0%) 10.0% 30.0% 50.0% 70.0% Average Daily Volume (000's) Operating Margin (%) Item 2000-2006 CAGR Avg. Daily Volume 23% Revenu
Slide 9: CME and CBOT Shareholder Benefits
Well-Positioned in Dynamic Global Industry Stronger Base to Build Core Derivatives Business Accretive Transaction Platform for Product Innovation and Growth Synergy Opportunities Significant User Benefits CME and CBOT Shareholder Benefits Substantial Benefits Transaction expected to create value for
Slide 10: CBOT: Growth Strategies
CBOT: Growth Strategies Product enhancements Product innovation Global expansion Leveraging technology
Slide 11: Growth Strategies: Product Enhancements
Growth Strategies: Product Enhancements Enhancements to Metals Complex Listed options on Full-sized Gold and Silver futures contracts in open-auction markets, side-by-side electronic trading of the contracts in 4Q06 Electronic Warehouse Receipt system for Metals complex targeted for completion in 4Q
Slide 12: Metals ADV increased nearly 10-fold in 2006
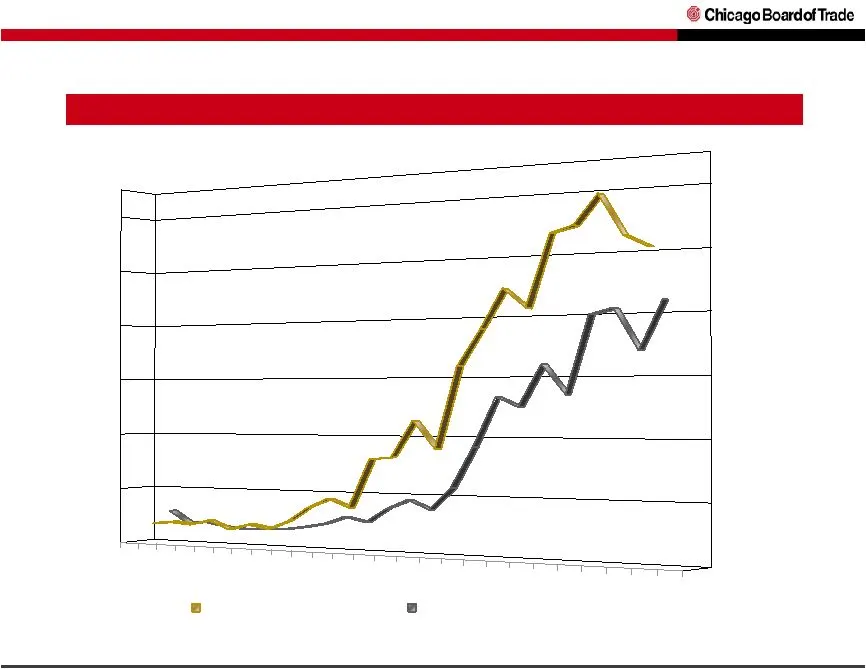
Metals ADV increased nearly 10-fold in 2006 Gold and Silver Futures Market Share (North American Market) CBOT share of all North American listed Gold and Silver futures contracts traded Mar-05 Jun-05 Sep-05 Dec-05 Mar-06 Jun-06 Sep-06 Dec.-06 0.0% 10.0% 20.0% 30.0% 40.0% 50.0% 60.0% CBOT gold share
Slide 13: Growth Strategies: Product Enhancements
Growth Strategies: Product Enhancements Growth in Swap Futures Citigroup and Goldman Sachs began providing liquidity July 3, 2006 Third quarter 2006 trading volume up 44 percent Fourth quarter 2006 trading volume up 63 percent
Slide 14: Growth Strategies: Product Innovation
Growth Strategies: Product Innovation Seven New Products in 2006 Full-Sized Gold Options Silver Options $25 Big Dow Futures Soybean Crush Options Binary Options Ethanol Dow Jones-AIG Excess Return Commodity Index
Slide 15: Dow Jones U.S. Real Estate Index to launch Feb. '07
Dow Jones SM U.S. Real Estate Index SM to launch Feb. ‘07 Growth Strategies: Product Innovation Address customer needs Respond to changing marketplace trends Leverage existing pools of liquidity
Slide 16: Growth Strategies: Global Expansion
Growth Strategies: Global Expansion Offering side-by-side trading of Ag futures Global access to e-cbot ® Ease of access to CBOT for market users Global Developing Markets Program
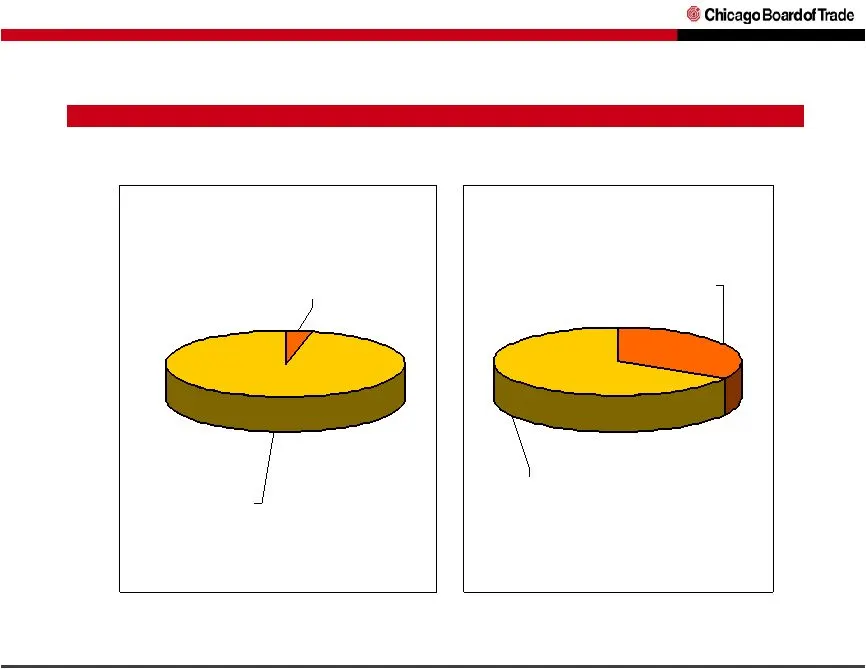
Slide 17: Pre and Post Side-by-Side Trading of Ag Futures
Pre and Post Side-by-Side Trading of Ag Futures Electronic Agriculture Futures Side-by-Side trading of Agricultural Futures started 08/01/06 *Includes off exchange 01/01/06 thru 07/31/06 *Open Auction 96.5% Electronic 3.5% 08/01/06 thru 12/31/06 Electronic 33.0% *Open Auction 67.0% Ag futures volume
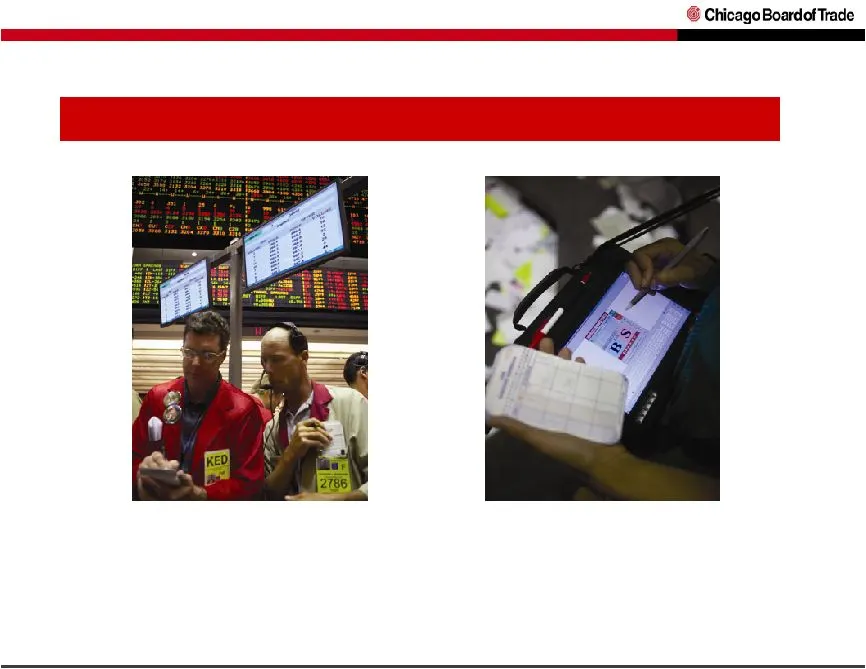
Slide 18: Successful Launch of Side-by-Side Trading of Ags
Greater Global Access to Benchmark Agricultural Products – Single Pool of Liquidity Between Trading Venues Successful Launch of Side-by-Side Trading of Ags On-floor plasma screens display e-cbot market data . Hand-held devices allow simultaneous trading on floor and e-cbot. 33% increase in firms tra
Slide 19: Growth Strategies: Global Expansion
Growth Strategies: Global Expansion Global Developing Markets Program Fee Waivers for traders in nations that have not been market users Eight firms in four countries currently participating Educate potential participants about CBOT products
Slide 20: Growth Strategies: Global Expansion – JADE
Growth Strategies: Global Expansion JADE – Benefits and Strengths Location: Singapore, the Asia-Pacific financial center that has a strong regulatory regime Geography: Asia is the major growth engine for production/consumption of commodities and commodity derivatives JV Partners: Both CBOT and SGX a
Slide 21: Growth Strategies: Leveraging Technology
Growth Strategies: Leveraging Technology Technology upgrades on e-cbot ®
Slide 22: Financial Options Traded Electronically
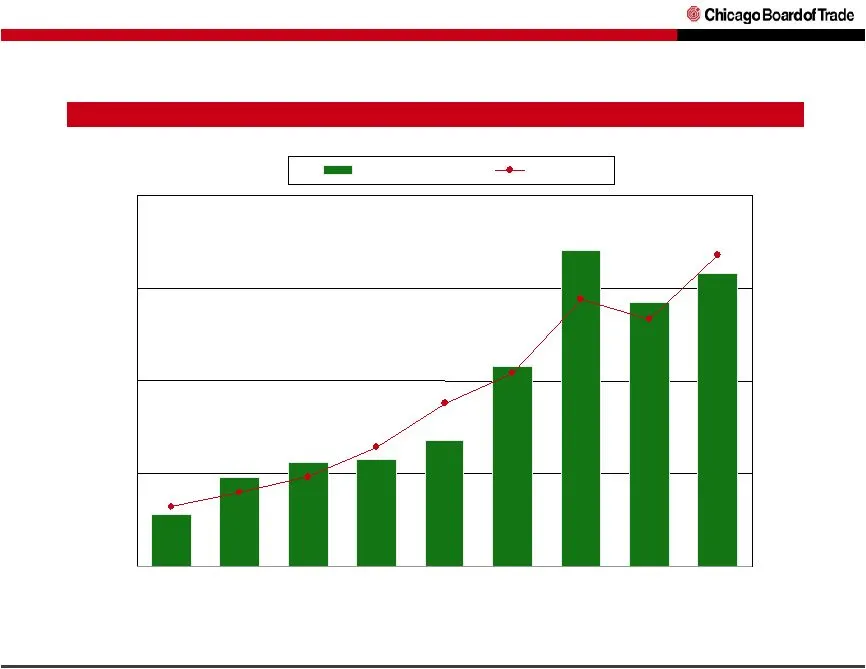
Financial Options Traded Electronically - % Electronic 4Q04 1Q05 2Q05 3Q05 4Q05 1Q06 2Q06 3Q06 4Q06 25% ADV (000s) e-cbot %
Slide 23: Growth Strategies: Leveraging Technology
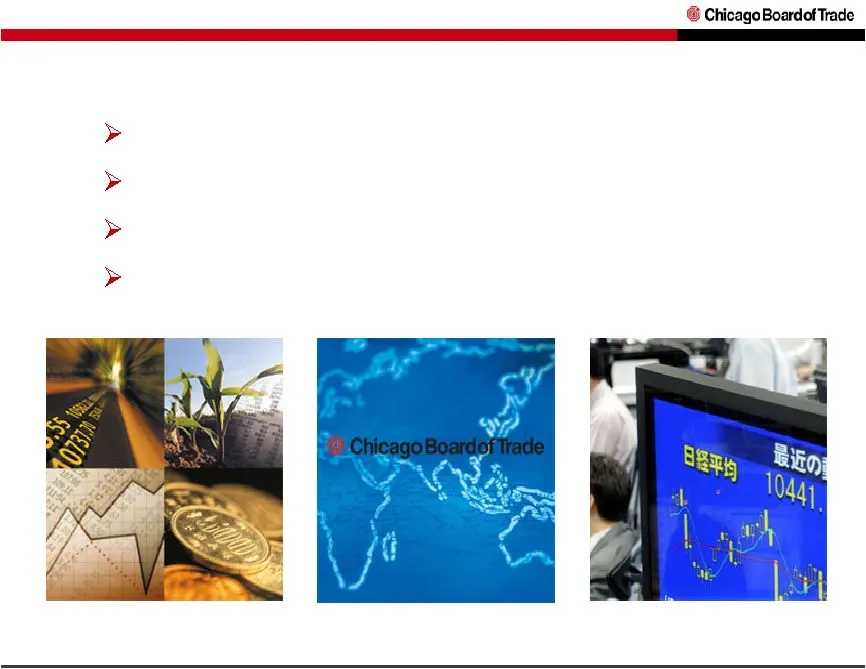
Growth Strategies: Leveraging Technology Technology upgrades on e-cbot ® Expanded distribution of e-cbot 13 points of presence internationally
Slide 24: CBOT: Growth Strategies
CBOT: Growth Strategies Product enhancements Product innovation Global expansion Leveraging technology
Slide 25: Financial Review
Financial Review Glen Johnson Senior Vice President and Chief Financial Officer
Slide 26: EBITDA and Operating Income – Growing Operating Leverage
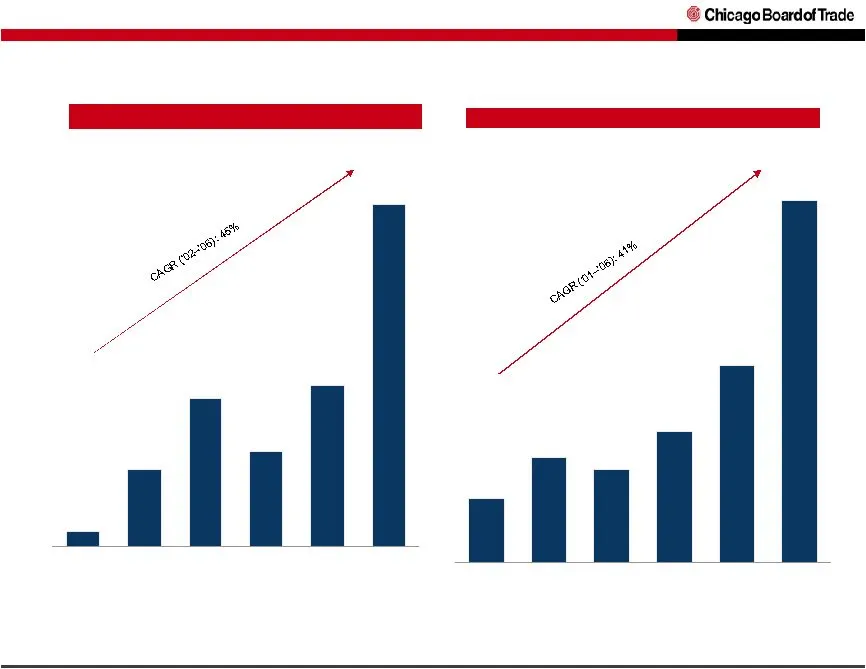
EBITDA ($mm) * Operating Income ($mm) Growing Operating Leverage $62 $101 $90 $126 $190 $349 2001 2002 2003 2004 2005 2006 $12 $62 $119 $77 $130 $276 2001 2002 2003 2004 2005 2006 * EBITDA is a Non-GAAP financial measure. Reconciliation of this to the most comparable GAAP financial measure can be fo
Slide 27: CBOT Average Daily Volume by Trading Platform 4Q06 versus 4Q05
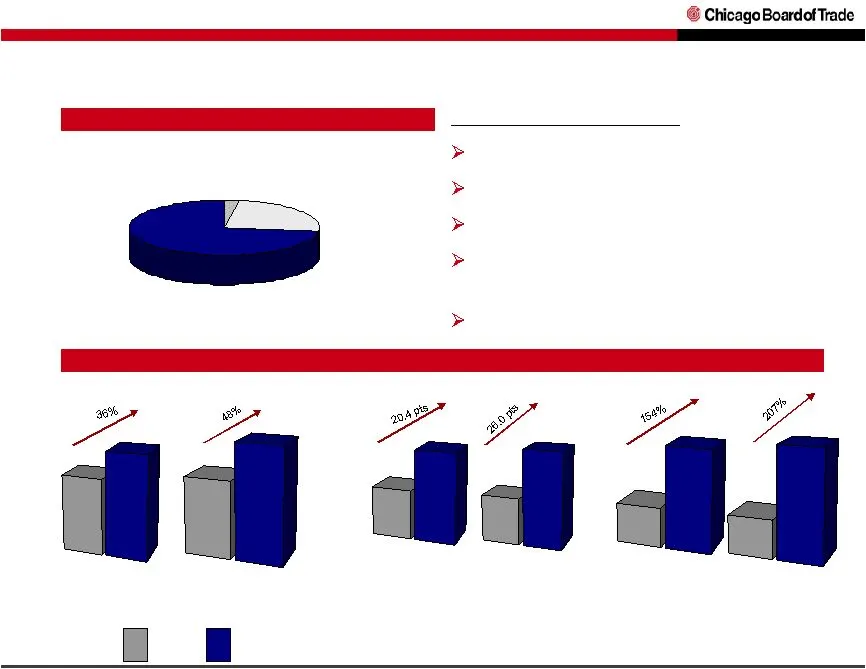
CBOT Average Daily Volume by Trading Platform 4Q06 versus 4Q05 (millions of dollars, thousands of contracts) Fourth Quarter 2006 Open- Auction 25% Electronic 73% Off- Exchange 2% 4Q06 compared to 4Q05: Revenue up 48% Average daily volume up 36% Average rate per contract up 15% Exchange & clearing fe
Slide 28: Overall Rate per Contract (RPC)
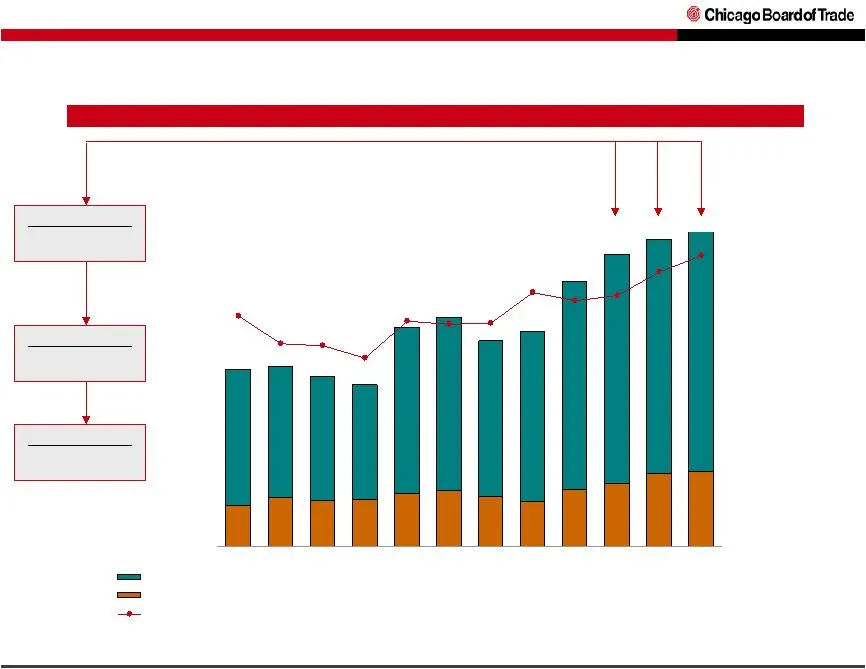
Overall Rate per Contract (RPC) Rate per Contract $0 $25,000 $50,000 $75,000 $100,000 $125,000 $0.000 $0.100 $0.200 $0.300 $0.400 $0.500 $0.600 $0.700 Exchange Rev ($) 54,351 52,529 49,675 46,326 66,518 69,657 62,696 68,086 83,120 91,855 93,901 104,448 Clearing Rev ($) 16,589 19,634 18,609 18,724 21
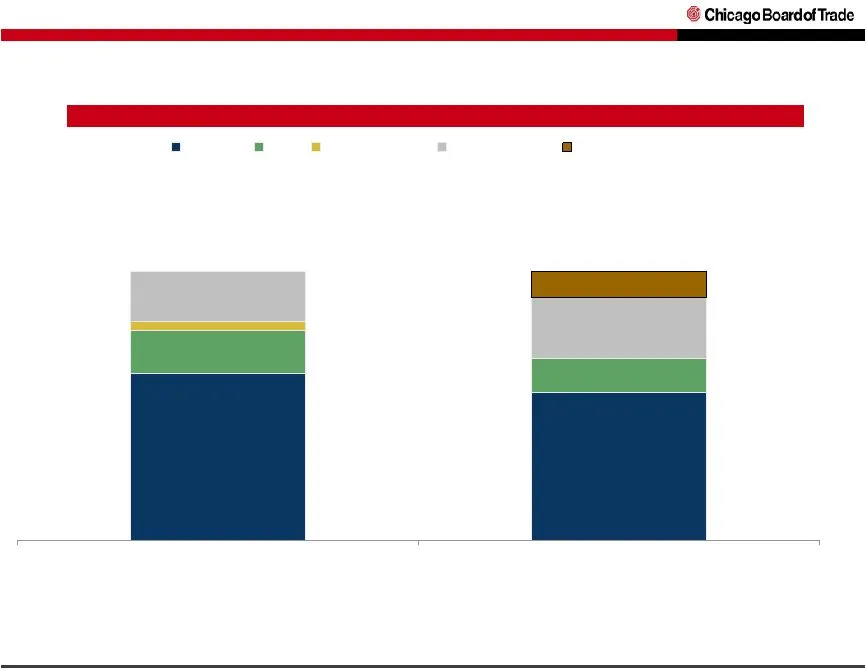
Slide 29: Fourth Quarter Fixed and Volume-Based Expenses
($ in millions) Fourth Quarter Fixed and Volume-Based Expenses $14 $12 $9 $87 $93 $3 $0 $21 $16 4Q05 4Q06 Baseline D&A Special / Other Volume-based Merger-related Note: Special / Other expenses include loss impairment on long-lived assets, litigation settlement and severance costs
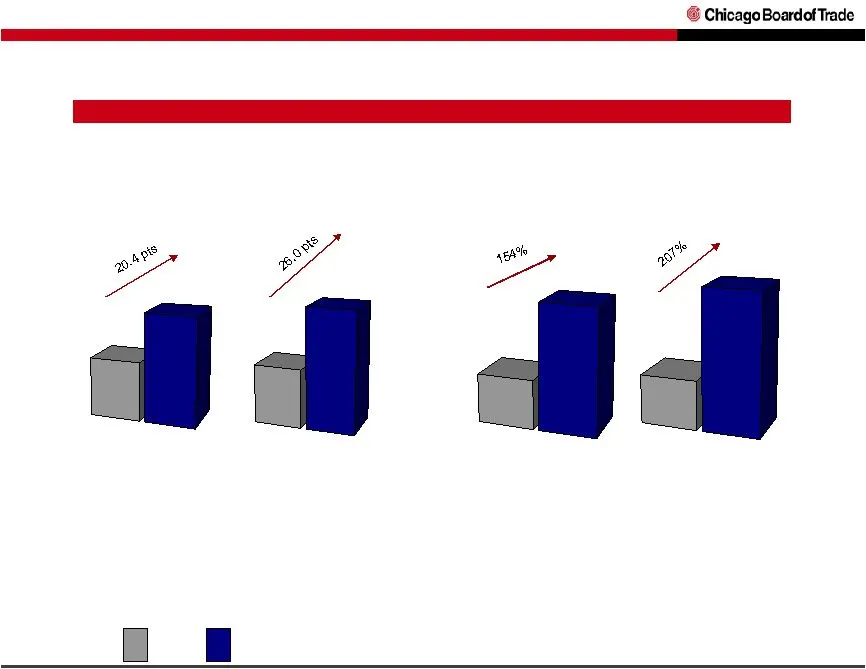
Slide 30: 4Q06 versus 4Q05
4Q06 versus 4Q05 (millions of dollars) Fourth Quarter 2006 24.4% 50.4% $17.7 $54.4 Operating Margin Net Income 4Q05 4Q06 24.4% 44.8% $17.7 $44.9 GAAP Non-GAAP* Non-GAAP* GAAP *Excludes $9.5 million in merger-related expenses
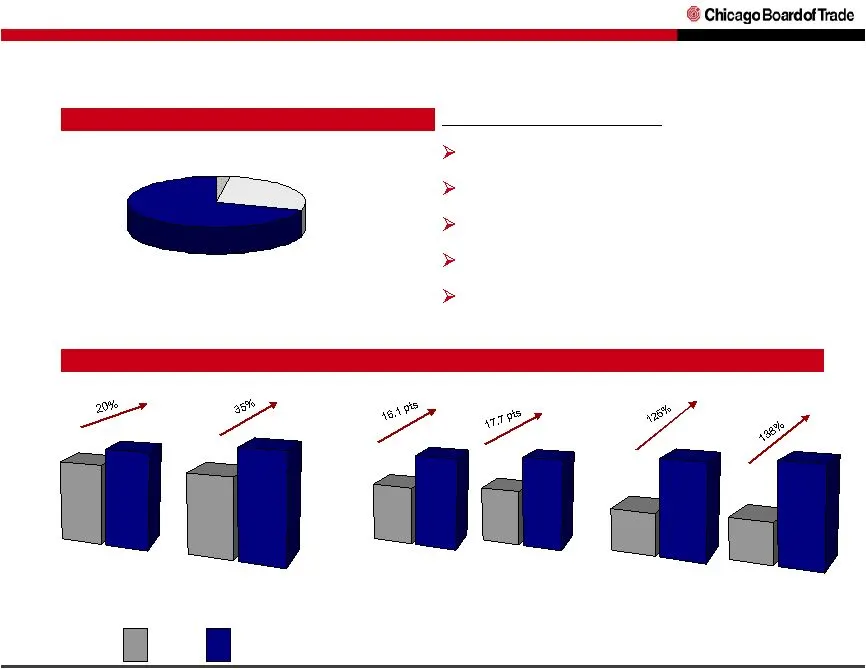
Slide 31: CBOT Average Daily Volume by Trading Platform 2006 versus 2005
CBOT Average Daily Volume by Trading Platform 2006 versus 2005 (millions of dollars, thousands of contracts) Year 2006 Open-Auction 28% Electronic 70% Off-Exchange 2% 2006 compared to 2005: Revenue up 35% Average daily volume up 20% Average rate per contract up 15% Exchange & clearing fee revenue up
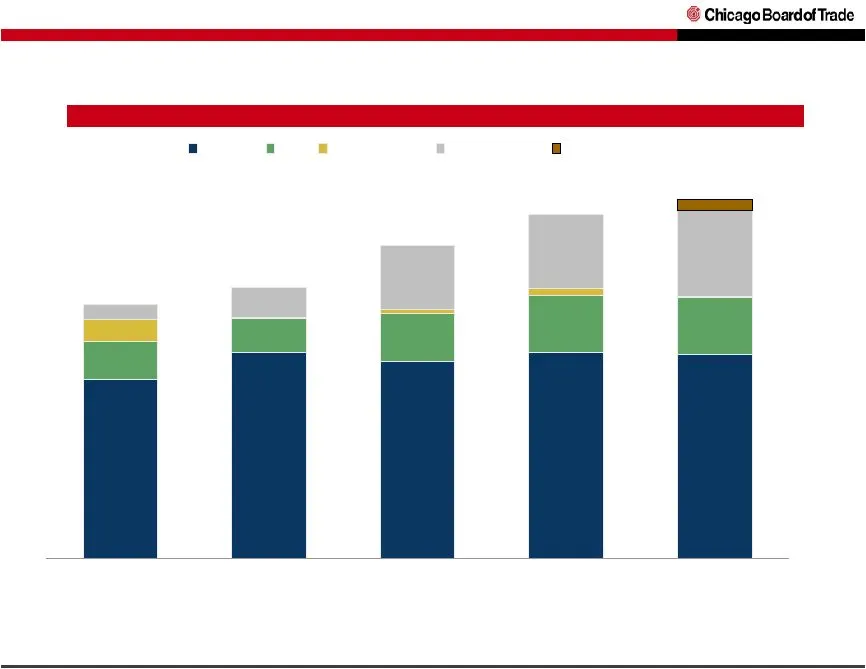
Slide 32: Fixed and Volume-Based Expenses
($ in millions) Fixed and Volume-Based Expenses Note: Special / Other expenses include loss impairment on long-lived assets, litigation settlement and severance costs $37 $33 $46 $55 $55 $10 $244 $261 $301 $331 $345 $1 $7 $4 $1 $21 $83 $71 $61 $14 $29 2002 2003 2004 2005 2006 Baseline D&A Special /
Slide 33: Net Income: 2006 versus 2005
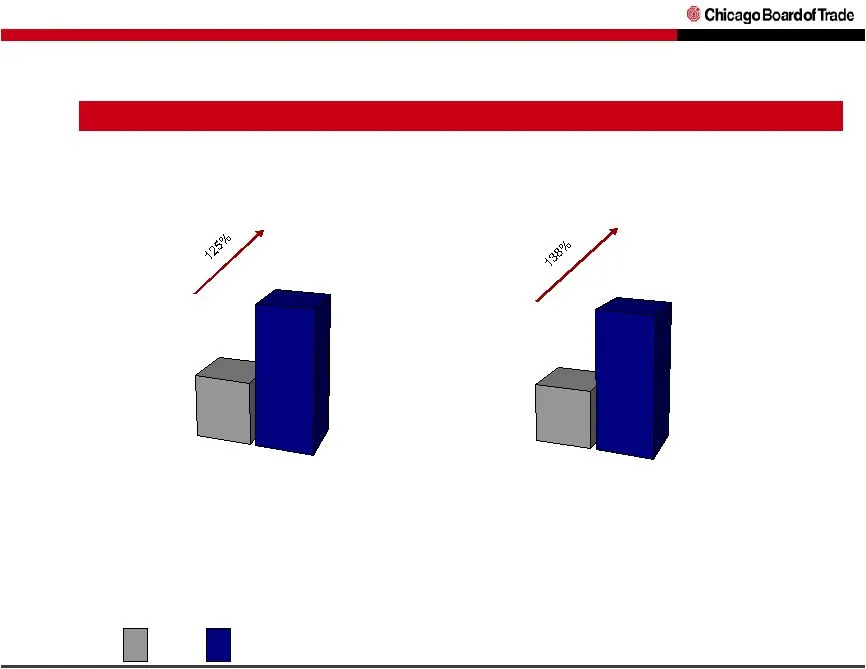
Net Income Year 2006 versus 2005 2005 2006 Non-GAAP * GAAP *Excludes $9.7 million in merger-related expenses $76.5 $172.2 $76.5 $181.9
Slide 34: Growing Operating Leverage
Strong cash flow with high capital efficiency Efficient and scalable operating platform Growing Operating Leverage New products Wider distribution of existing products Global expansion Leveraging technology efforts Fixed-cost control
Slide 35: Merger Update
Merger Update Looking to the Future
Slide 36: CBOT/CME Proposed Merger Update
CBOT/CME Proposed Merger Update Filed Form S-4 with SEC on Dec. 21, 2006 Filed “Amendment No.1” to S-4 with SEC on January 30, 2007 Entered into second review phase with the Department of Justice, as expected CBOT and CME shareholder and CBOT member votes expected in Q1 Integration planning underway
Slide 37: CME and CBOT Merger Transaction Highlights
Strategically Attractive Financially Compelling CME and CBOT Merger Transaction Highlights Solidifies combined company’s status as the premier global exchange Expands presence in attractive derivatives markets Positions combined company for continued growth Creates operational and cost efficiencies
Slide 38: CBOT: Looking to the Future
CBOT: Looking to the Future Increase access to our markets Deepen pools of liquidity Ensure market integrity
Slide 39: © Chicago Board of Trade
© Chicago Boardof Trade
Slide 40: Supplementary Information
Supplementary Information
Slide 41: Supplementary Information – EBITDA Reconciliation
Supplementary Information 2000 2001 2002 2003 2004 2005 2006 Non-GAAP Financial Measure - EBITDA $37 $62 $101 $90 $126 $190 $349 Deduct: Interest Expense (7) (7) (5) (4) (5) (3) (2) Income Tax Expense (1) (5) (24) (22) (33) (55) (120) Depreciation and Amortization Expense (41) (44) (38) (33) (46) (5
Slide 42: Reconciliation of GAAP to Non-GAAP Financial Measures
Supplementary Information Reconciliation of GAAP to Non-GAAP Financial Measures CBOT used non-GAAP financial measures of operating performance to eliminate 2006 merger-related expenses attributable to the announced merger with CBOT and CME. Non-GAAP measures do not replace and are not superior to th
Slide 43: Agriculture Complex Growth Rate
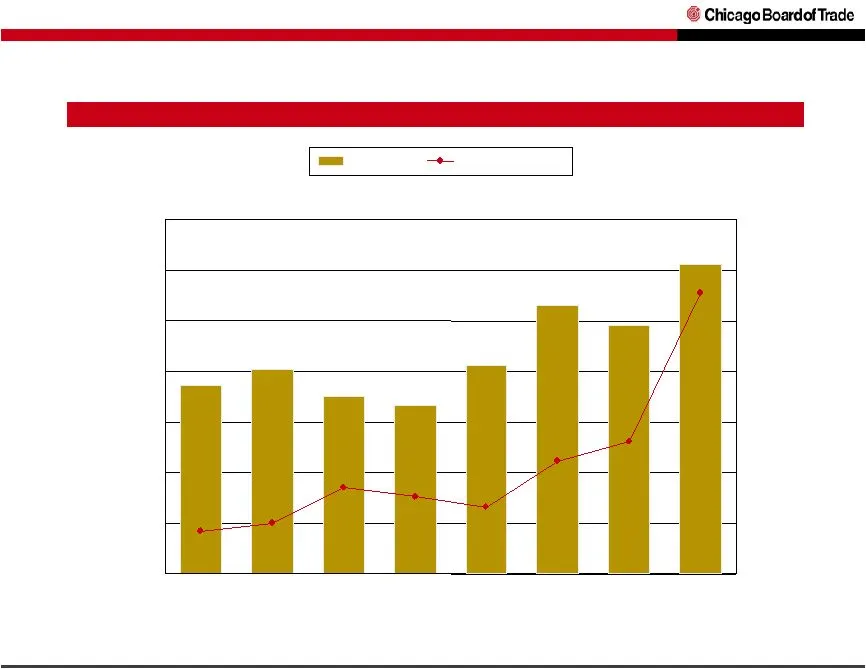
Agriculture Complex Growth Rate 1Q05 2Q05 3Q05 4Q05 1Q06 2Q06 3Q06 4Q06 -20 140% ADV (000s) Growth vs. Pr Yr
Slide 44: Growth in ADV by Product Group
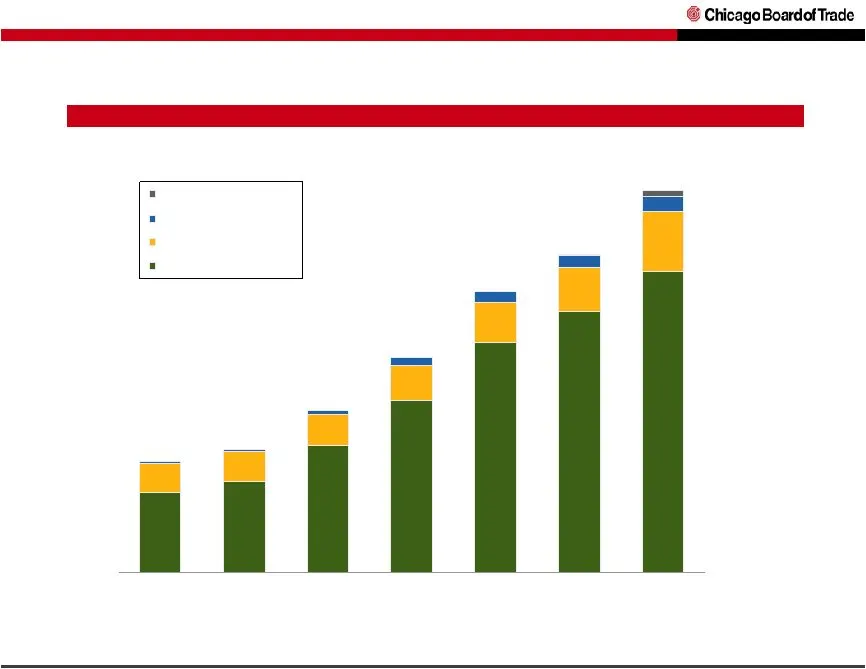
Growth in ADV by Product Group 20% 2,677 3,211 Total 880% Metals, Energy and Other 7% Equity Index 40% Agricultural 15% 2,199 2,534 Interest Rate % change 2005 2006 ADV (000)
Slide 45: Historical Volume
672 771 1,064 1,452 1,937 2,199 2,534 Average Daily Volume (in thousands) Historical Volume 1,037 1,365 1,804 2,372 2,677 3,211 2000 2001 2002 2003 2004 2005 2006 Metals, energy, and other Equity index Agricultural Interest rate *May not add due to rounding
Slide 46: CBOT's Volume Growth
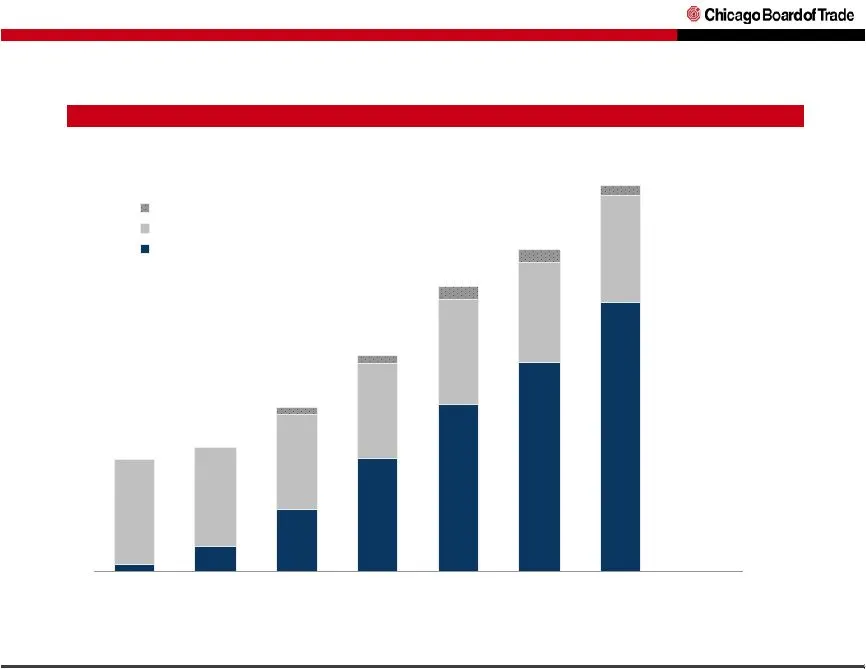
Average Daily Volume by Venue (in thousands) 62 209 513 935 1,382 1,739 2,240 CBOT’s Volume Growth 3,211 2,677 2,372 1,804 1,365 1,037 2000 2001 2002 2003 2004 2005 2006 Off-exchange Open-auction Electronic *May not add due to rounding
Slide 47: Year 2006 Revenue Components
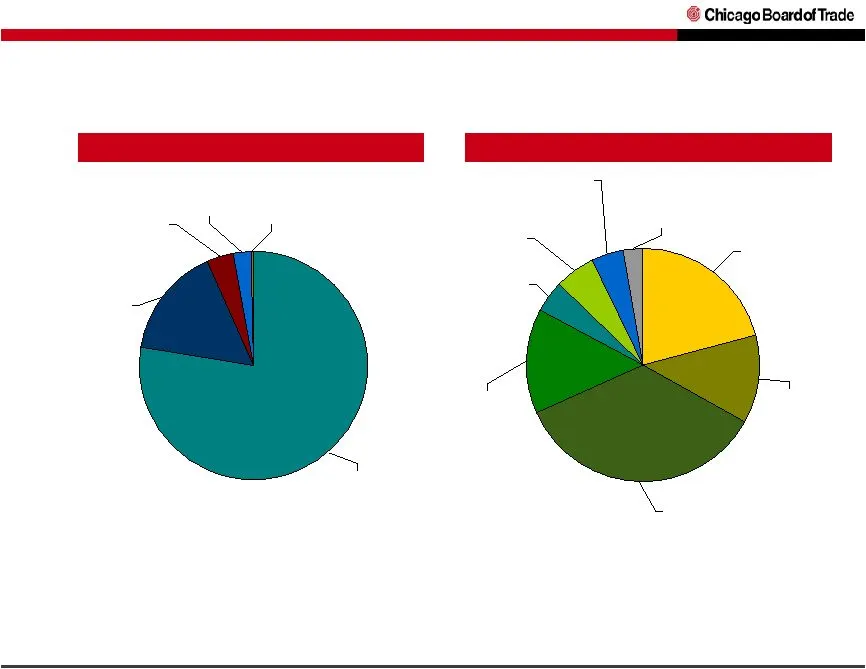
Year 2006 Revenue Components ($ in millions) Year 2006 Exchange & Clearing Fees ($ in millions) Services $16 3% Interest Income & Other $2 0% Building $23 4% Market Data $99 16% Exchange Fees & Clearing $481 77% Sources of Revenue for 2006 Total Exchange & Clearing Fees = $481 mm Metals $13 3% 30 yr
Source: SEC EDGAR · 425 filed Feb 8, 2007
More decks from Cbot Holdings Inc
 Cbot Holdings — Merger or Acquisition (June 2007)18 slides · Jun 28, 2007
 Merger or Acquisition (June 2007)30 slides · Jun 26, 2007
 Merger or Acquisition (June 2007)20 slides · Jun 26, 2007
 Cbot Holdings — Merger or Acquisition (June 2007)24 slides · Jun 25, 2007
 Merger or Acquisition (June 2007)29 slides · Jun 22, 2007
 William Blair Annual Growth Stock Conference 200743 slides · Jun 20, 2007