RFA Financial Inc. · TSX:RFA
RFA Financial — Artis Real Estate Investment Trust — Q4 2009 Earnings Presentation
31 slides from RFA Financial's earnings presentation, Mar 22, 2010
Slide 1: Properties of Success
PROPERTIES OF SUCCESS MARCH 22 2010, Q4-09 INSTITUTIONAL INVESTOR PRESENTATION 1 1
Slide 2: Forward-Looking Disclaimer
FORWARD-LOOKING DISCLAIMER Certain information included in this presentation contains forward-looking statements within the meaning of applicable securities laws. For this purpose, any statements contained herein that are not statements of historical fact may be deemed to be forward looking statemen
Slide 3: Notice Respecting Non-GAAP Measures
NOTICE RESPECTING NON-GAAP MEASURES Distributable Income (“DI"), Property Net Operating Income (“Property NOI”) and Funds from Operations (“FFO”) are non-GAAP measures commonly used by Canadian income trusts as an indicator of financial performance. “GAAP” means the generally accepted accounting pri
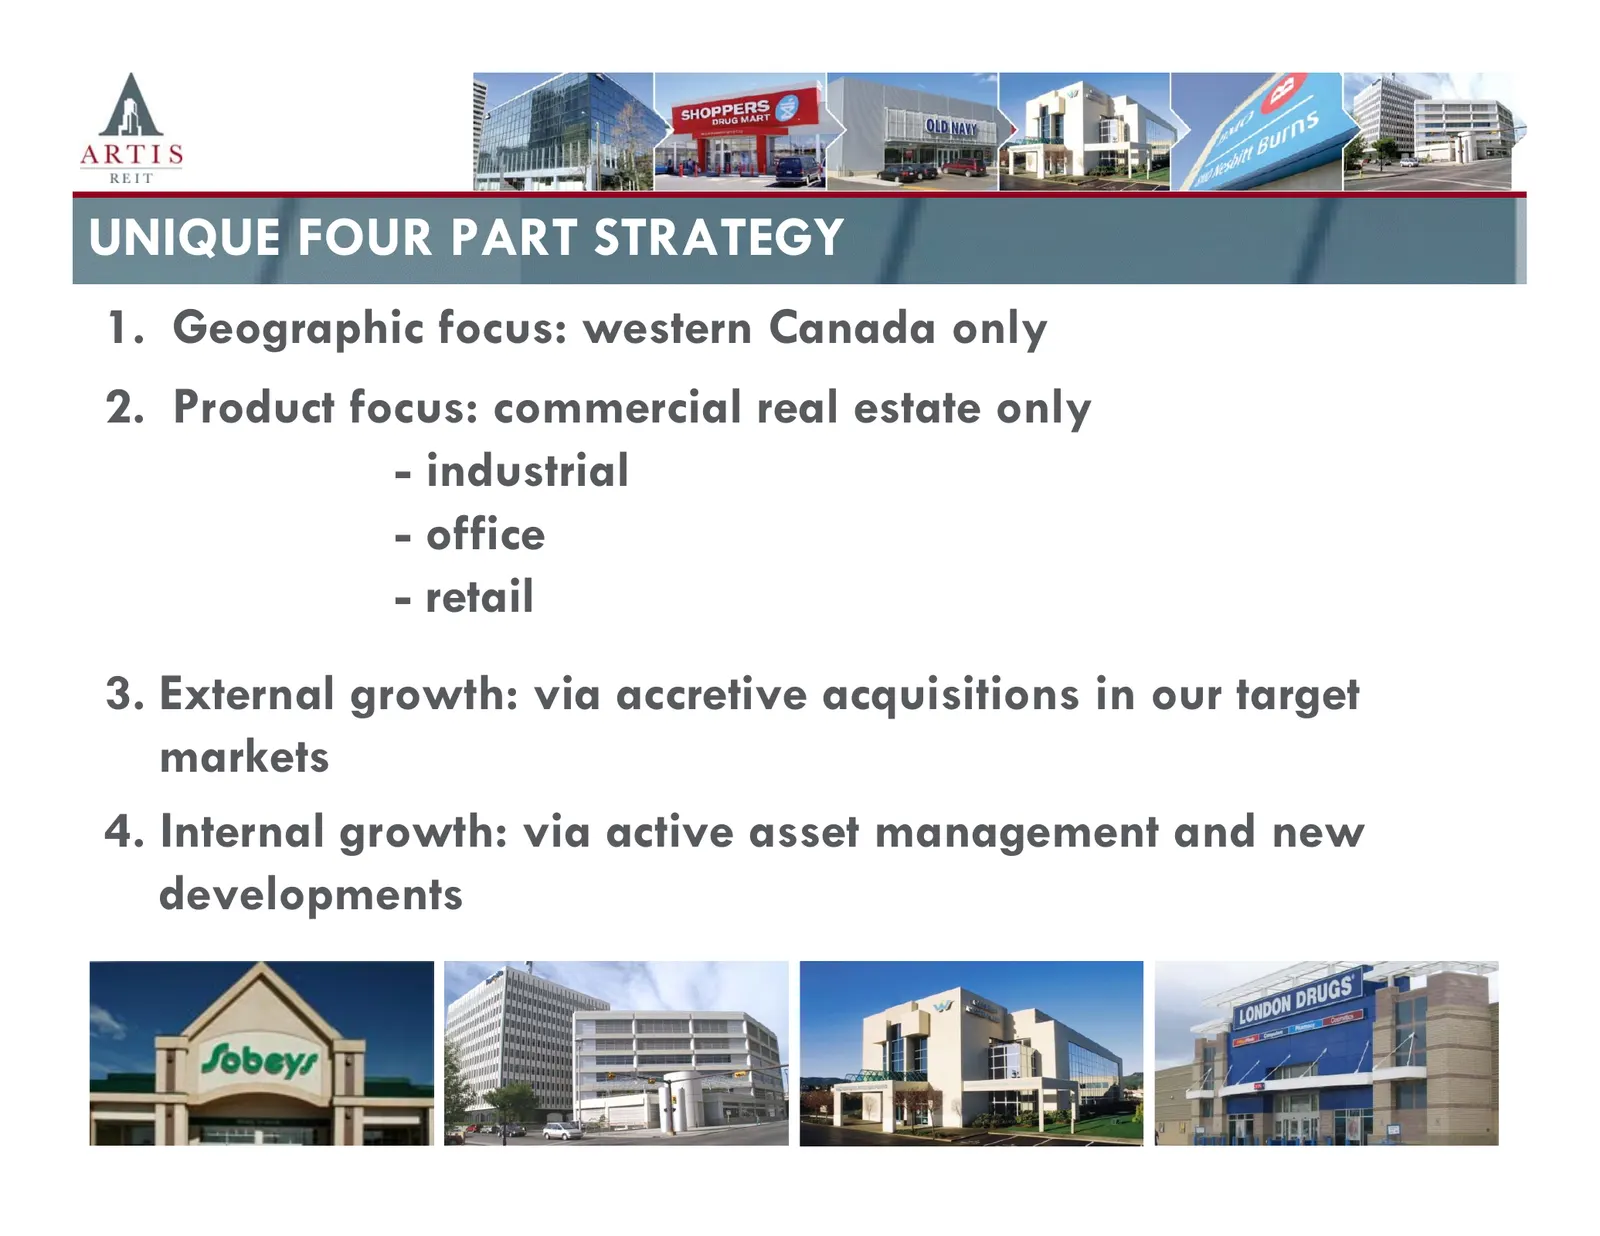
Slide 4: Unique Four Part Strategy
UNIQUE FOUR PART STRATEGY 1. Geographic focus: western Canada only 2. Product focus: commercial real estate only - industrial - office - retail 3. External growth: via accretive acquisitions in our target markets 4. Internal growth: via active asset management and new developments 4 4
Slide 5: Portfolio Overview
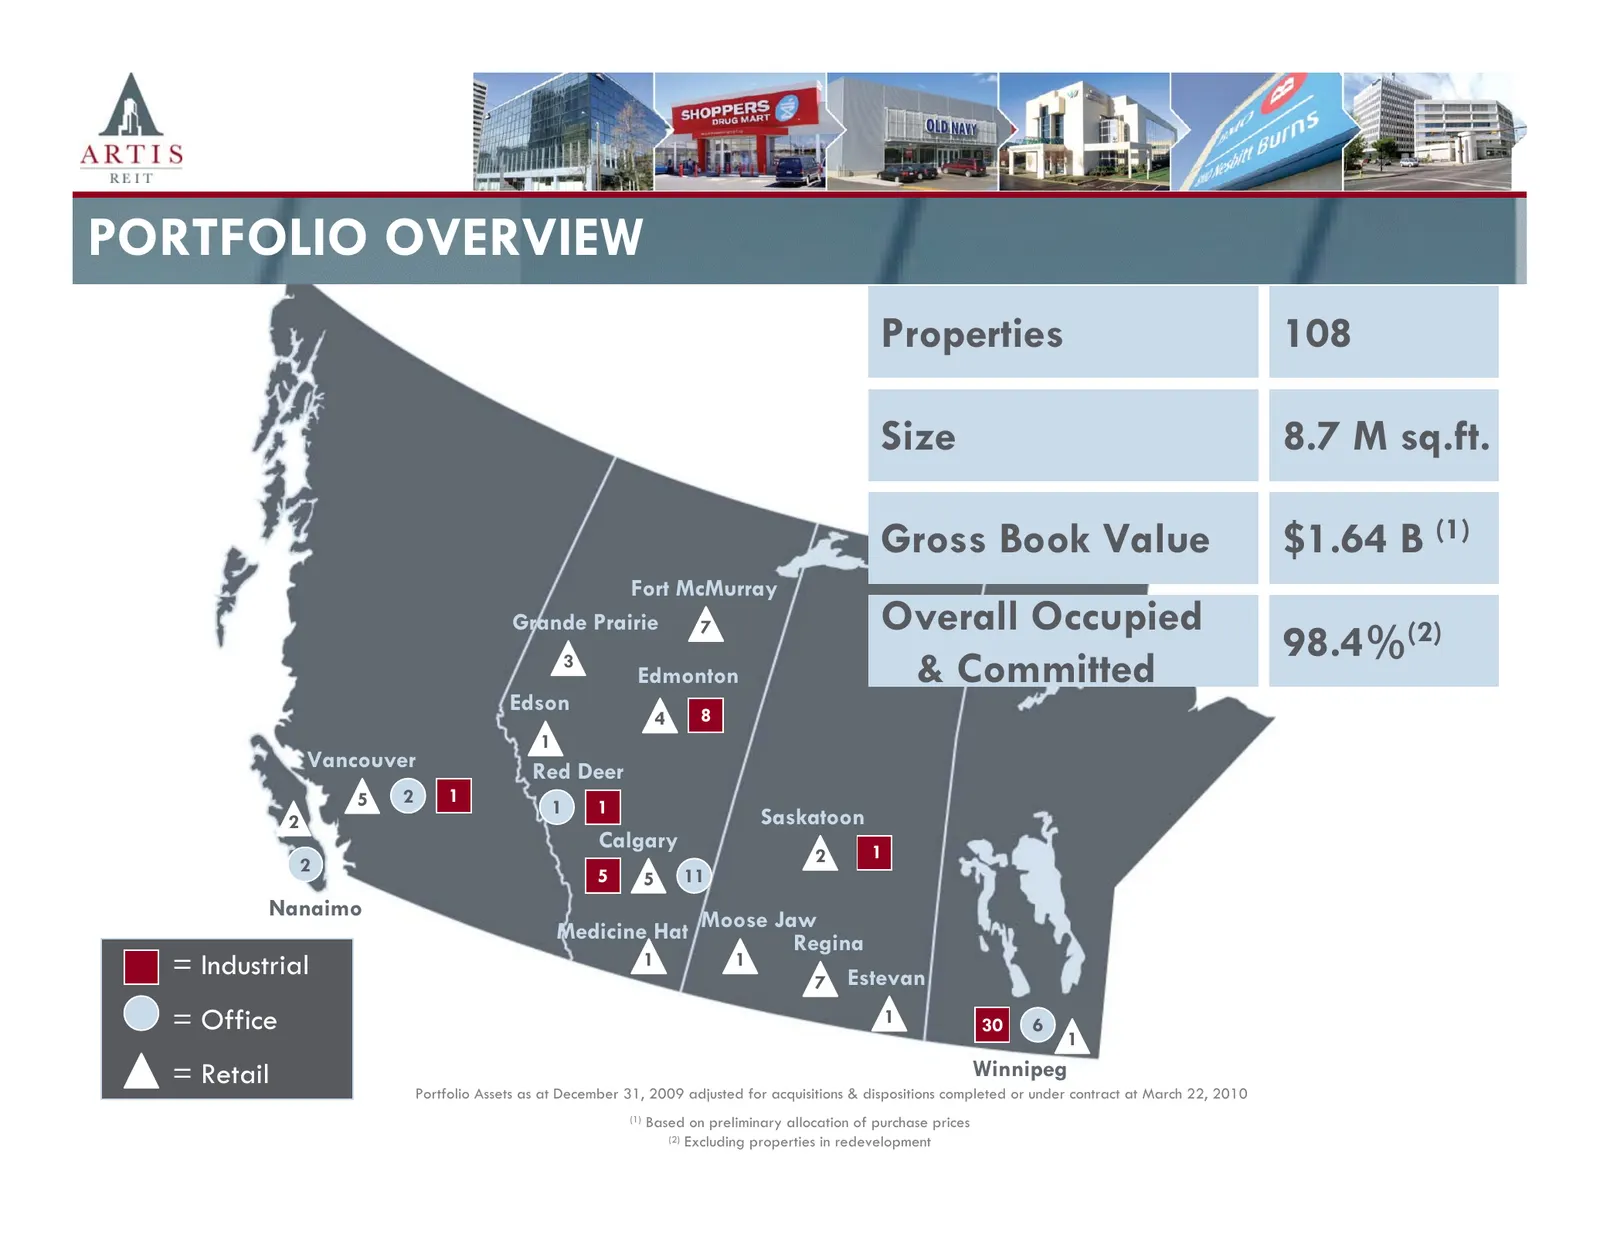
PORTFOLIO OVERVIEW Properties 108 Size 8.7 M sq.ft. Gross Book Value $1.64 B (1) Fort McMurray Grande Prairie Overall Occupied 98.4%(2) 7 3 Edmonton & Committed Edson 8 4 1 Vancouver Red Deer 5 2 1 1 1 2 Saskatoon Calgary 1 2 2 5 5 11 Nanaimo Medicine Hat Moose Jaw Regina = Industrial 1 1 7 Estevan
Slide 6: Portfolio Summary by Province
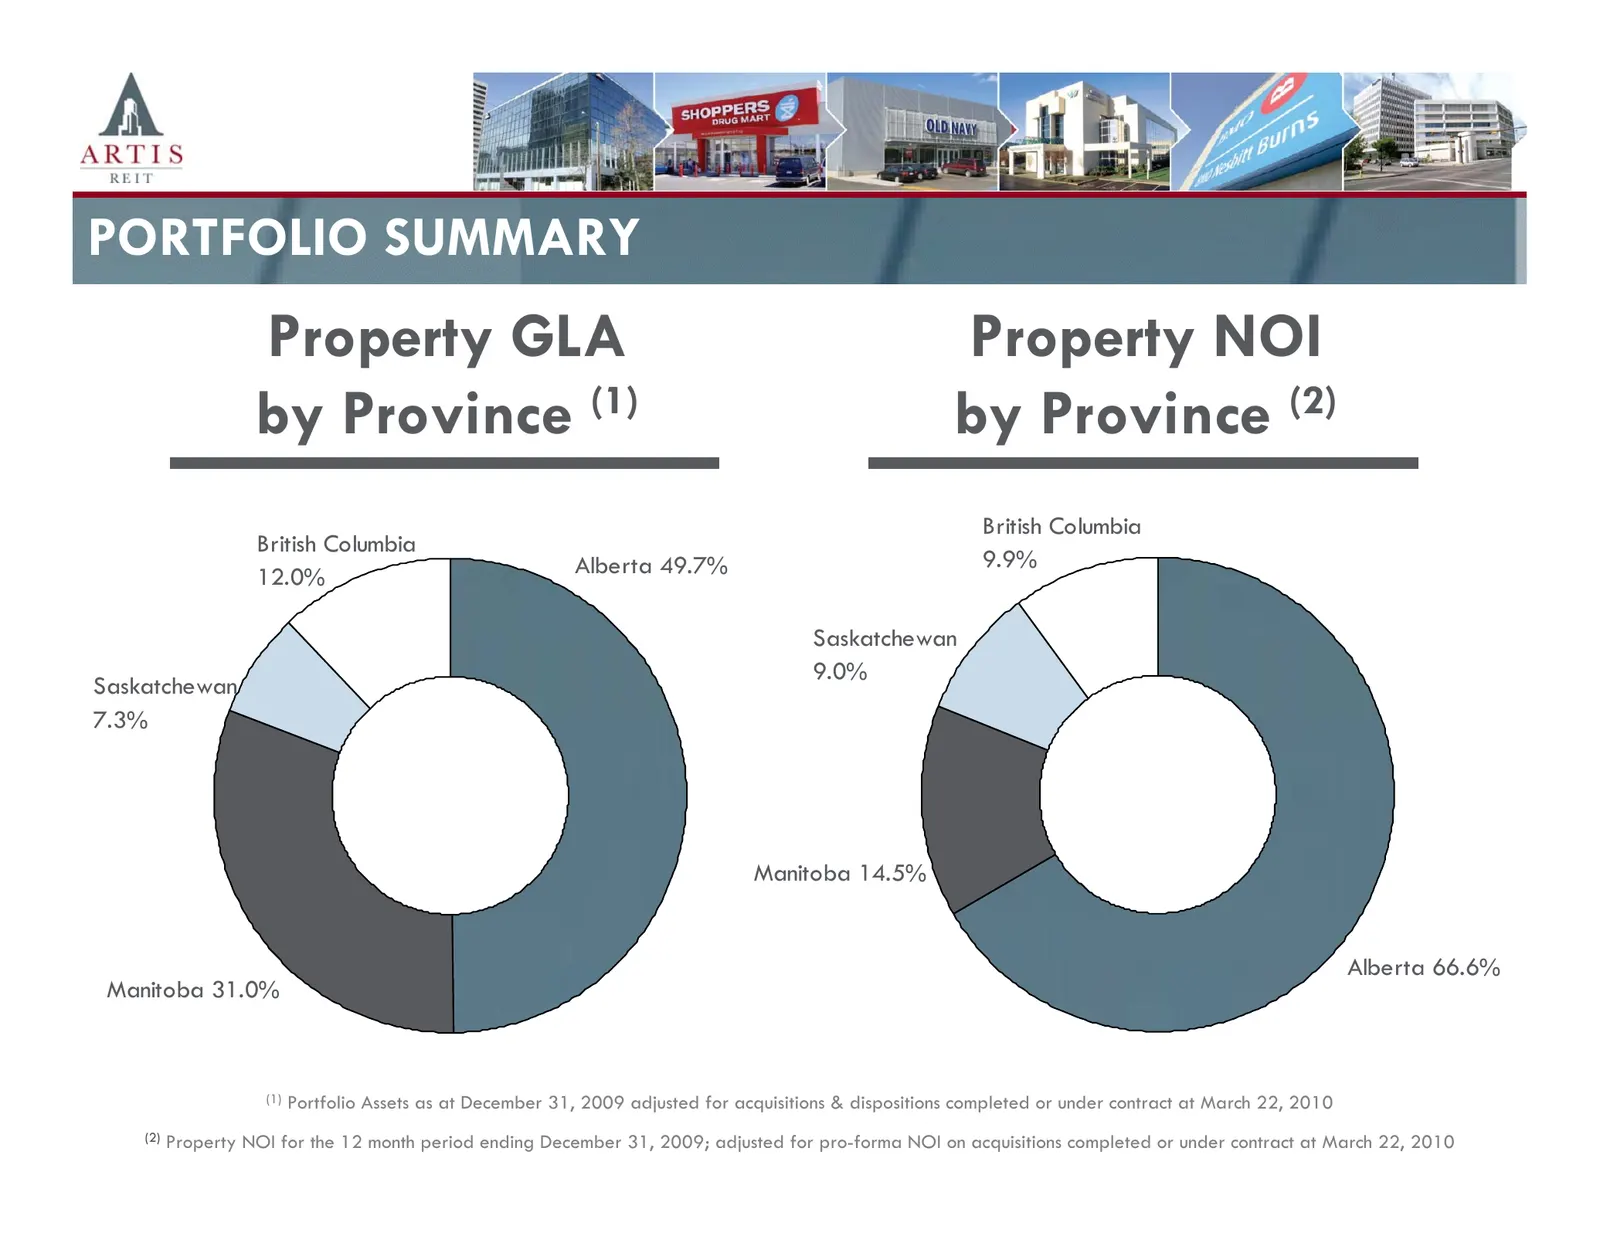
PORTFOLIO SUMMARY Property GLA Property NOI by Province (1) by Province (2) British Columbia British Columbia Alberta 49.7% 9.9% 12.0% Saskatchewan 9.0% Saskatchewan 7.3% Manitoba 14.5% Alberta 66.6% Manitoba 31.0% (1) Portfolio Assets as at December 31, 2009 adjusted for acquisitions & dispositions
Slide 7: Portfolio Summary by Asset Class
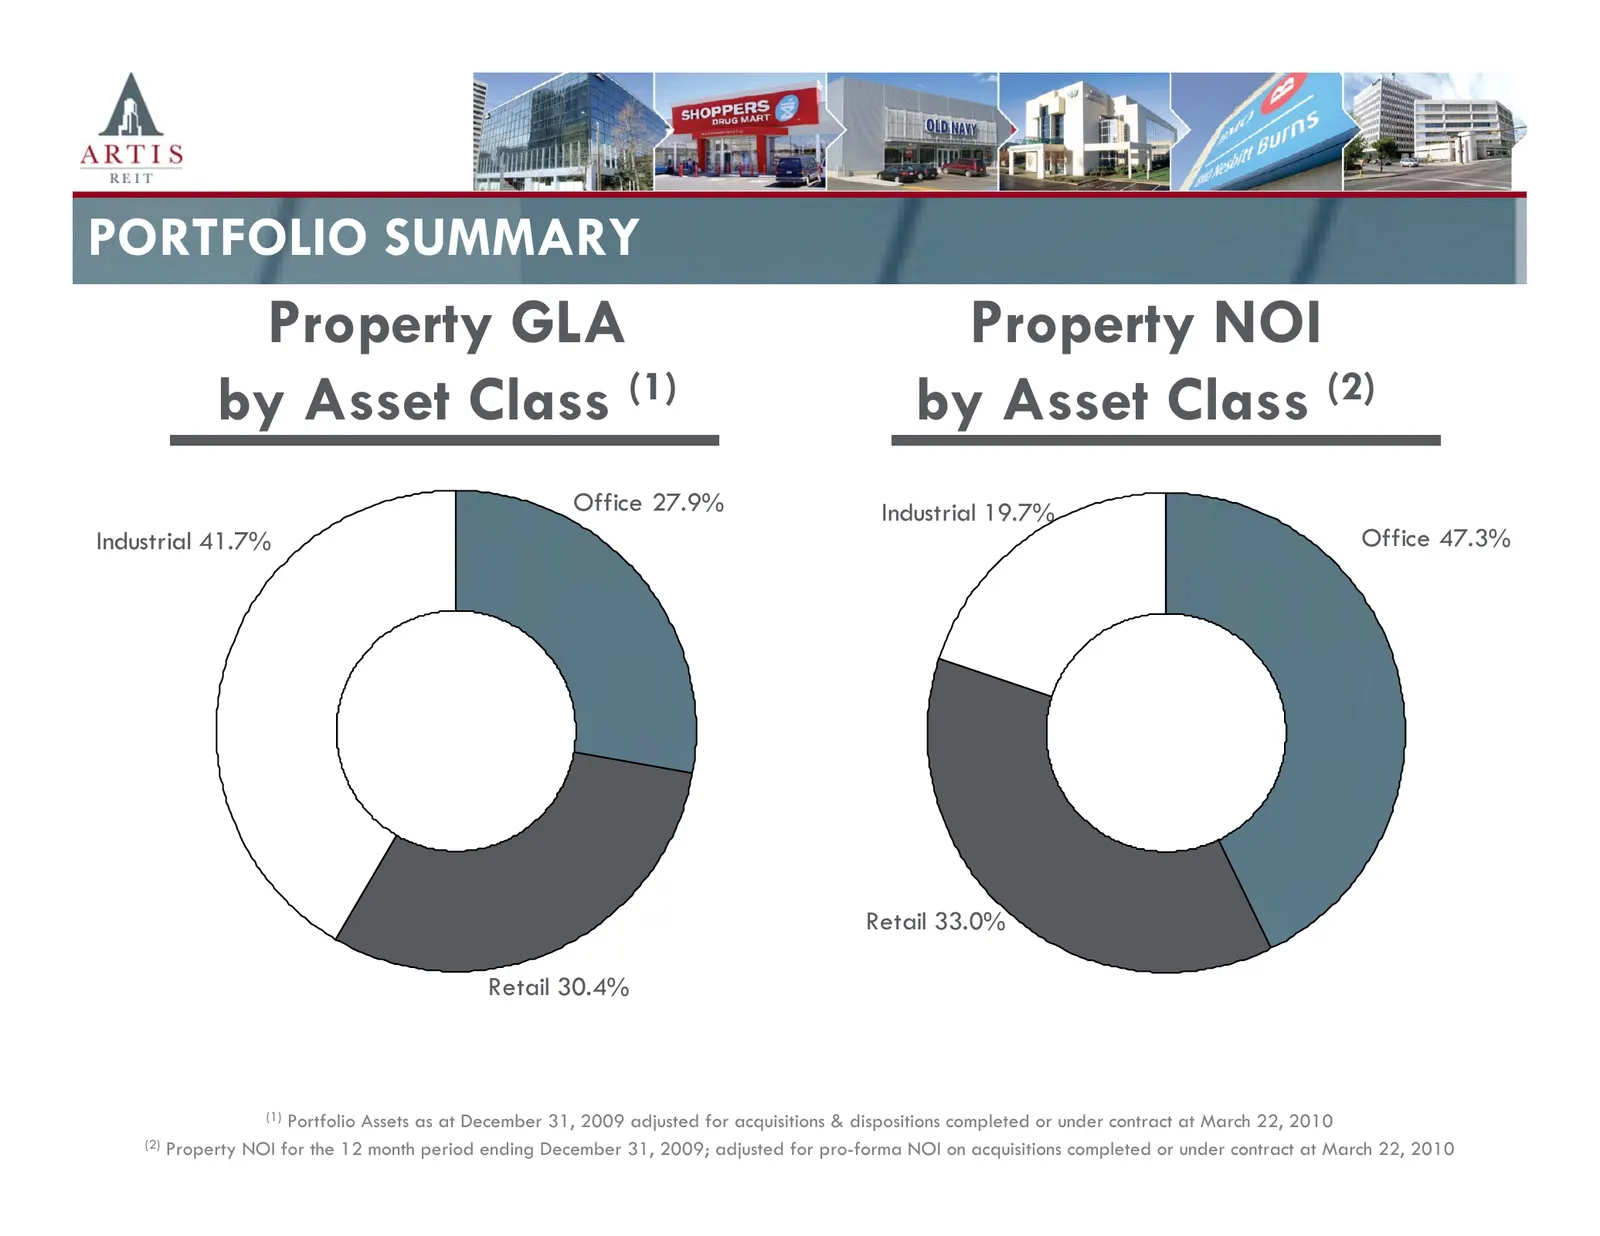
PORTFOLIO SUMMARY Property GLA Property NOI by Asset Class (1) by Asset Class (2) Office 27.9% Industrial 19.7% Industrial 41.7% Office 47.3% Retail 33.0% Retail 30.4% 7 (1) Portfolio Assets as at December 31, 2009 adjusted for acquisitions & dispositions completed or under contract at March 22, 201
Slide 8: Portfolio Summary – Top Three Submarkets by GLA
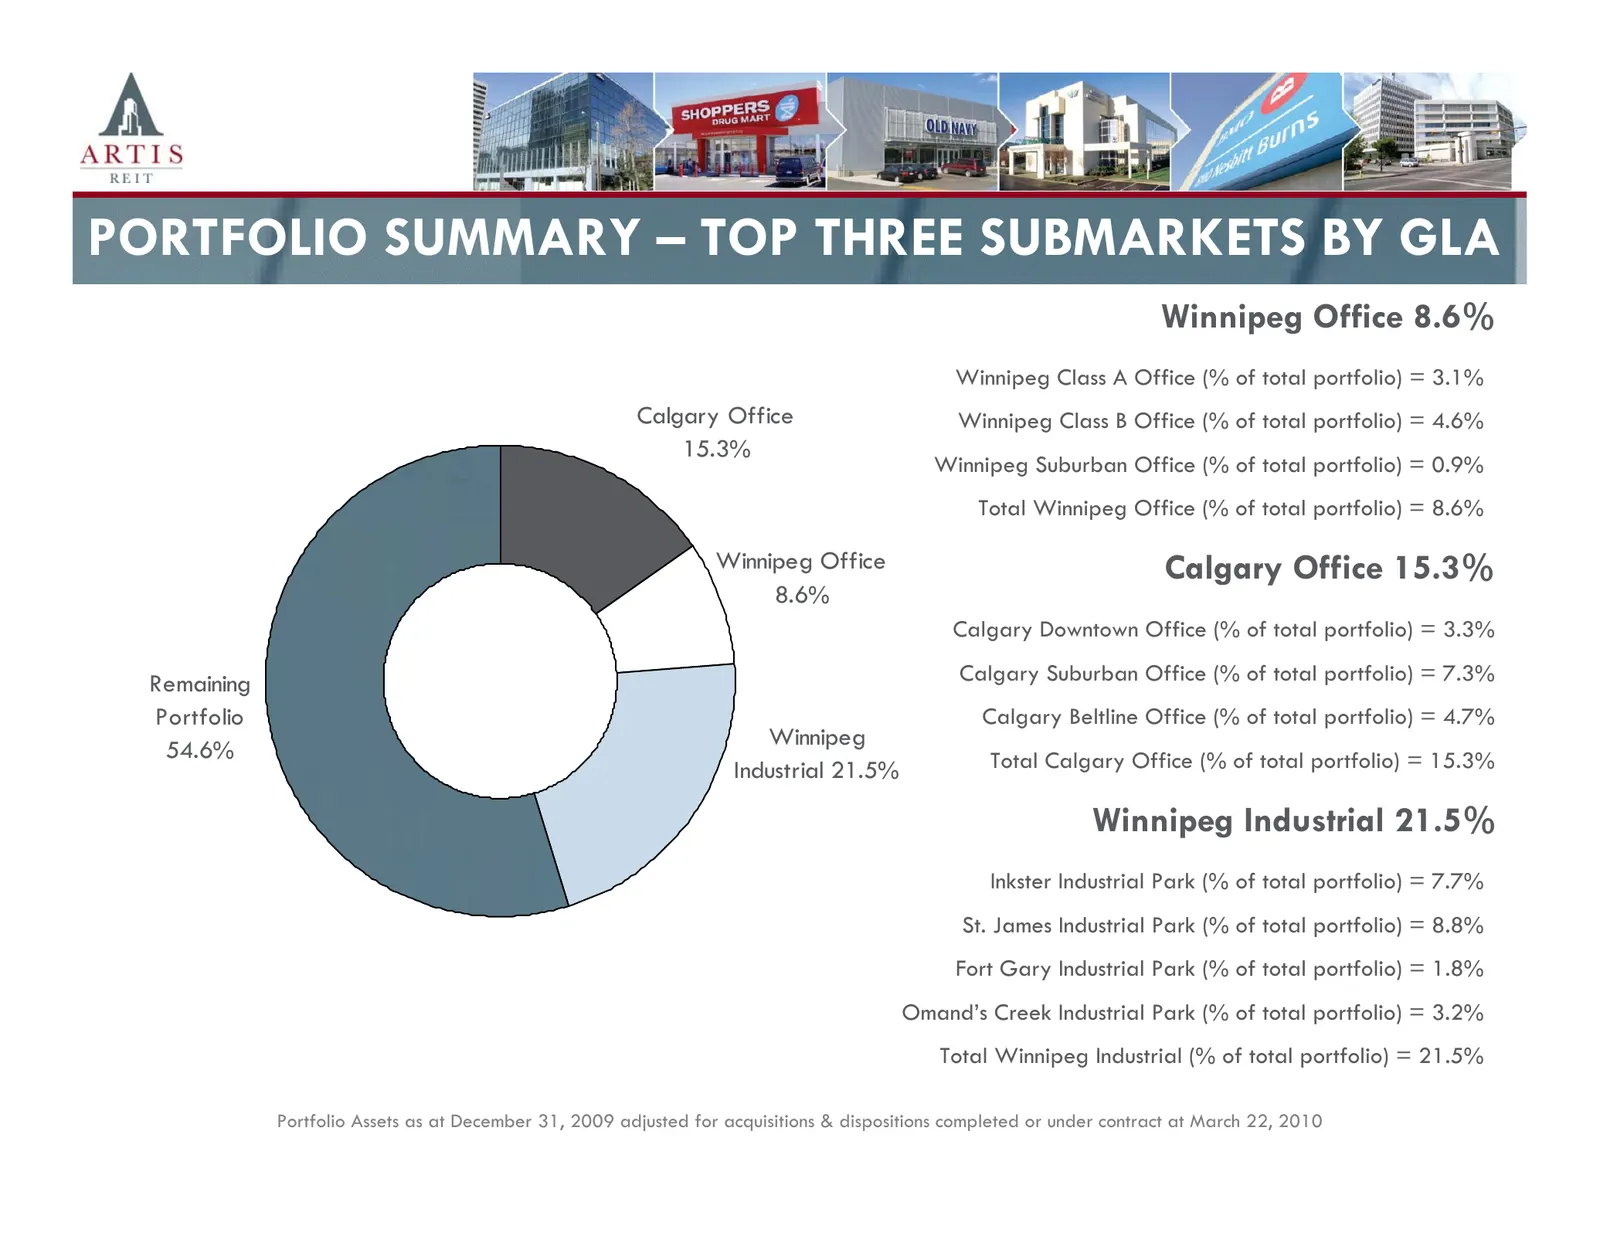
PORTFOLIO SUMMARY – TOP THREE SUBMARKETS BY GLA Winnipeg Office 8.6% Winnipeg Class A Office (% of total portfolio) = 3.1% Calgary Office Winnipeg Class B Office (% of total portfolio) = 4.6% 15.3% Winnipeg Suburban Office (% of total portfolio) = 0.9% Total Winnipeg Office (% of total portfolio) =
Slide 9: Portfolio Overview Lease Expiration Schedule
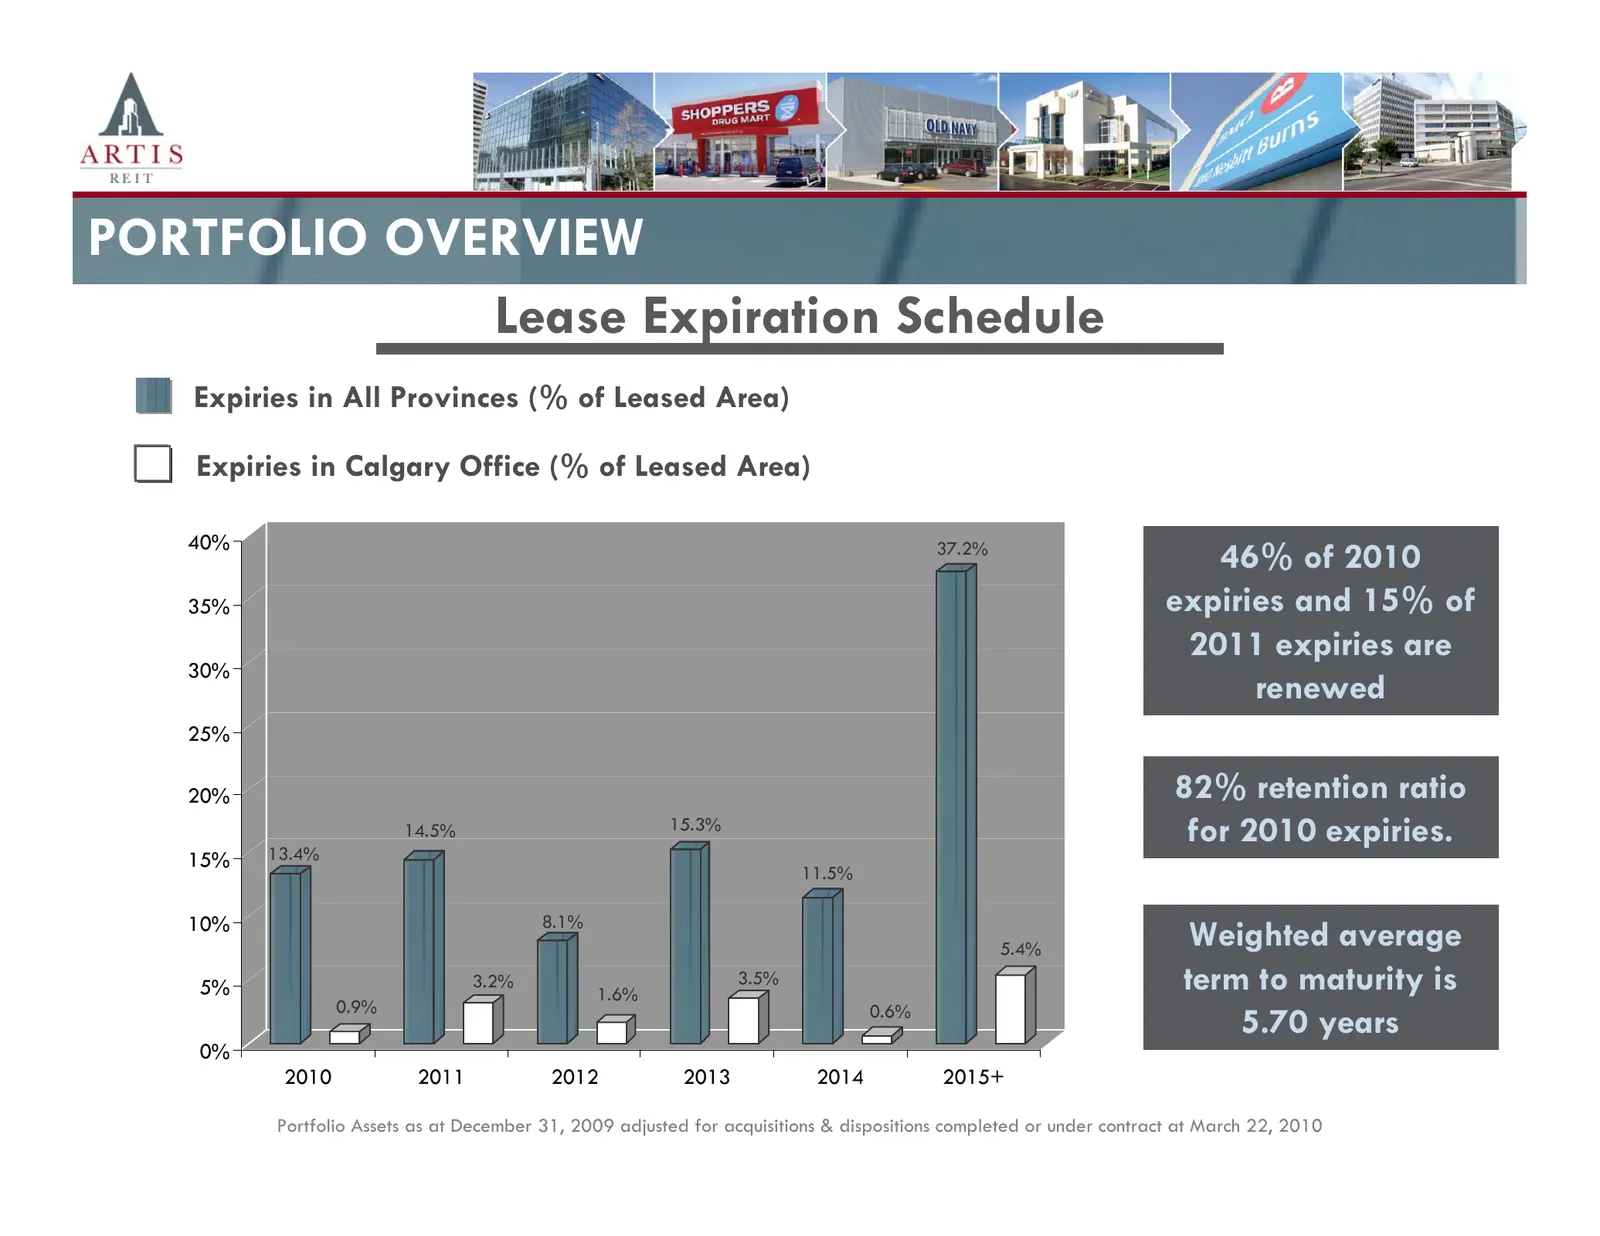
PORTFOLIO OVERVIEW Lease Expiration Schedule Expiries in All Provinces (% of Leased Area) Expiries in Calgary Office (% of Leased Area) 40% 37.2% 46% of 2010 35% expiries and 15% of 2011 expiries are 30% renewed 25% 20% 82% retention ratio 13.4% 14.5% 15.3% for 2010 expiries. 15% 11.5% 10% 8.1% 5.4%
Slide 10: Robust Western Economy
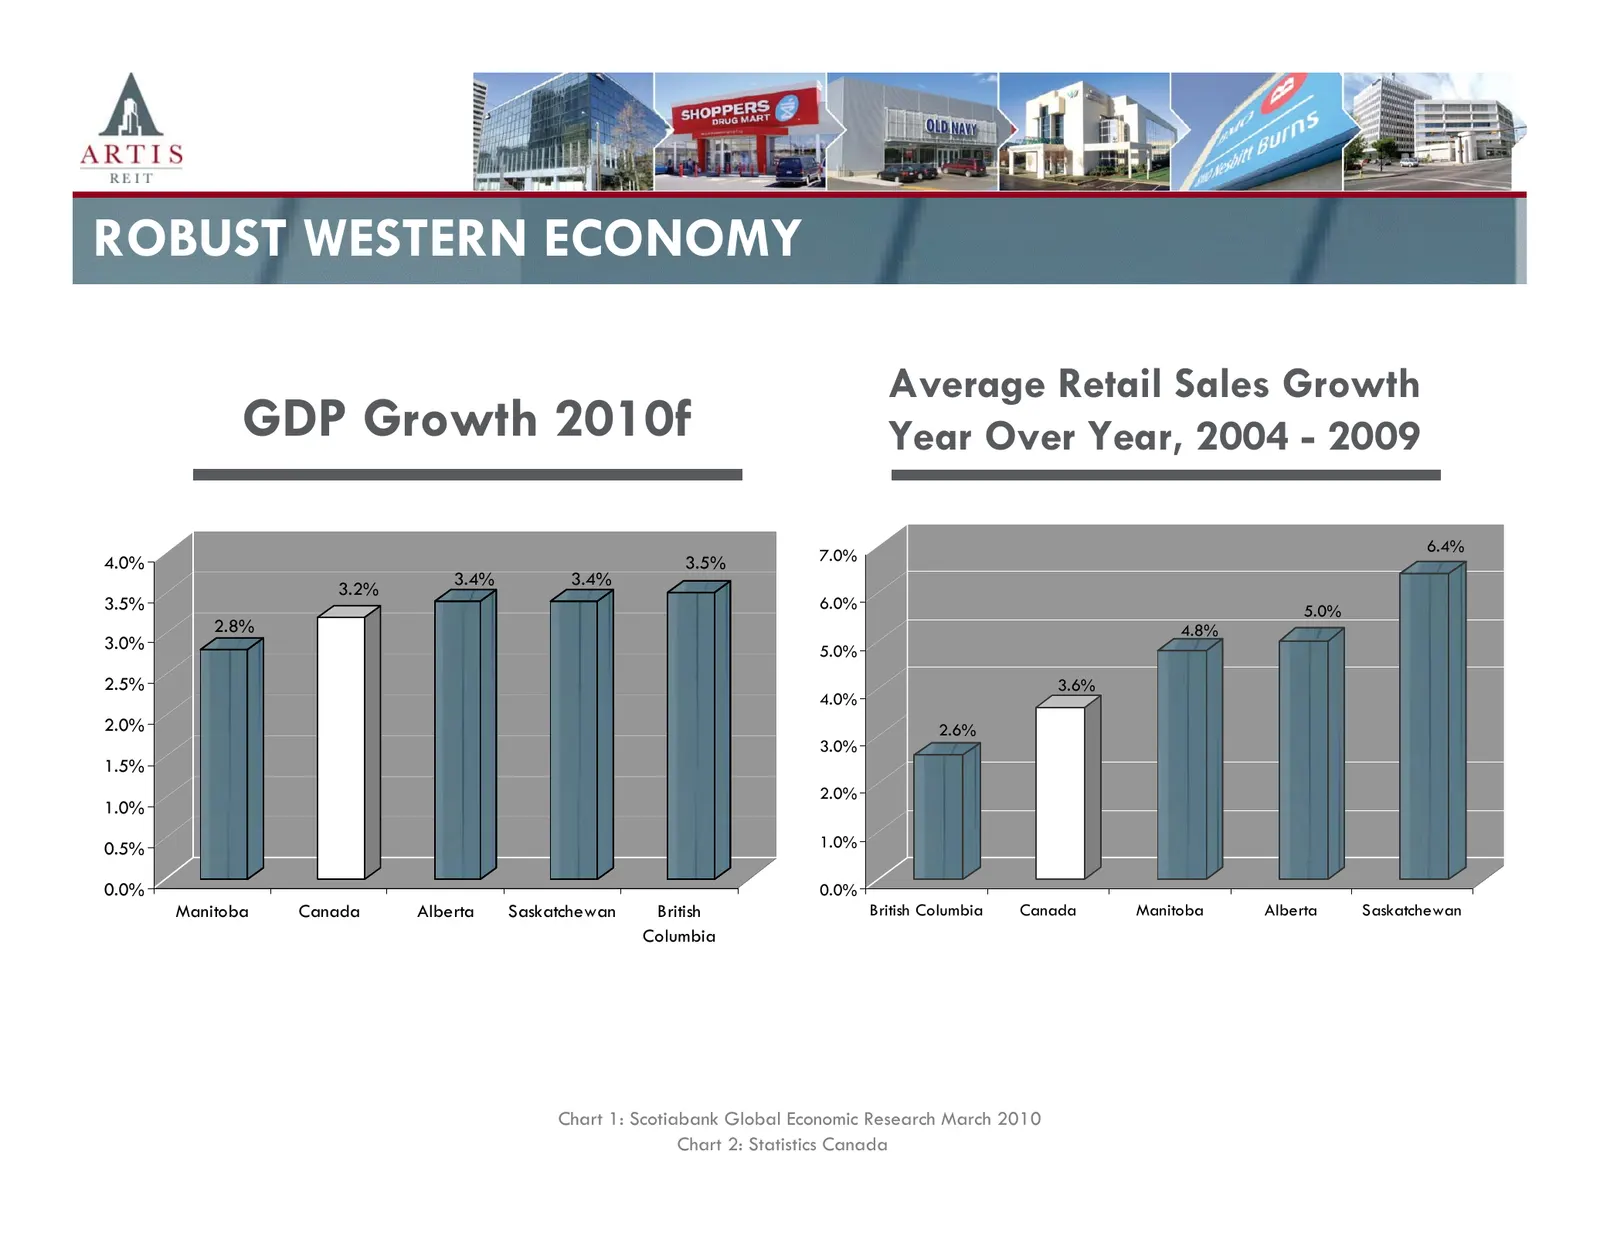
ROBUST WESTERN ECONOMY Average Retail Sales Growth GDP Growth 2010f Year Over Year, 2004 - 2009 6.4% 4.0% 3.5% 7.0% 3.4% 3.4% 3.2% 3.5% 6.0% 5.0% 2.8% 4.8% 3.0% 5.0% 2.5% 3.6% 4.0% 2.0% 2.6% 3.0% 1.5% 2.0% 1.0% 0.5% 1.0% 0.0% 0.0% Manitoba Canada Alberta Saskatchewan British British Columbia Canada
Slide 11: Robust Western Economy: Provincial Unemployment Rates
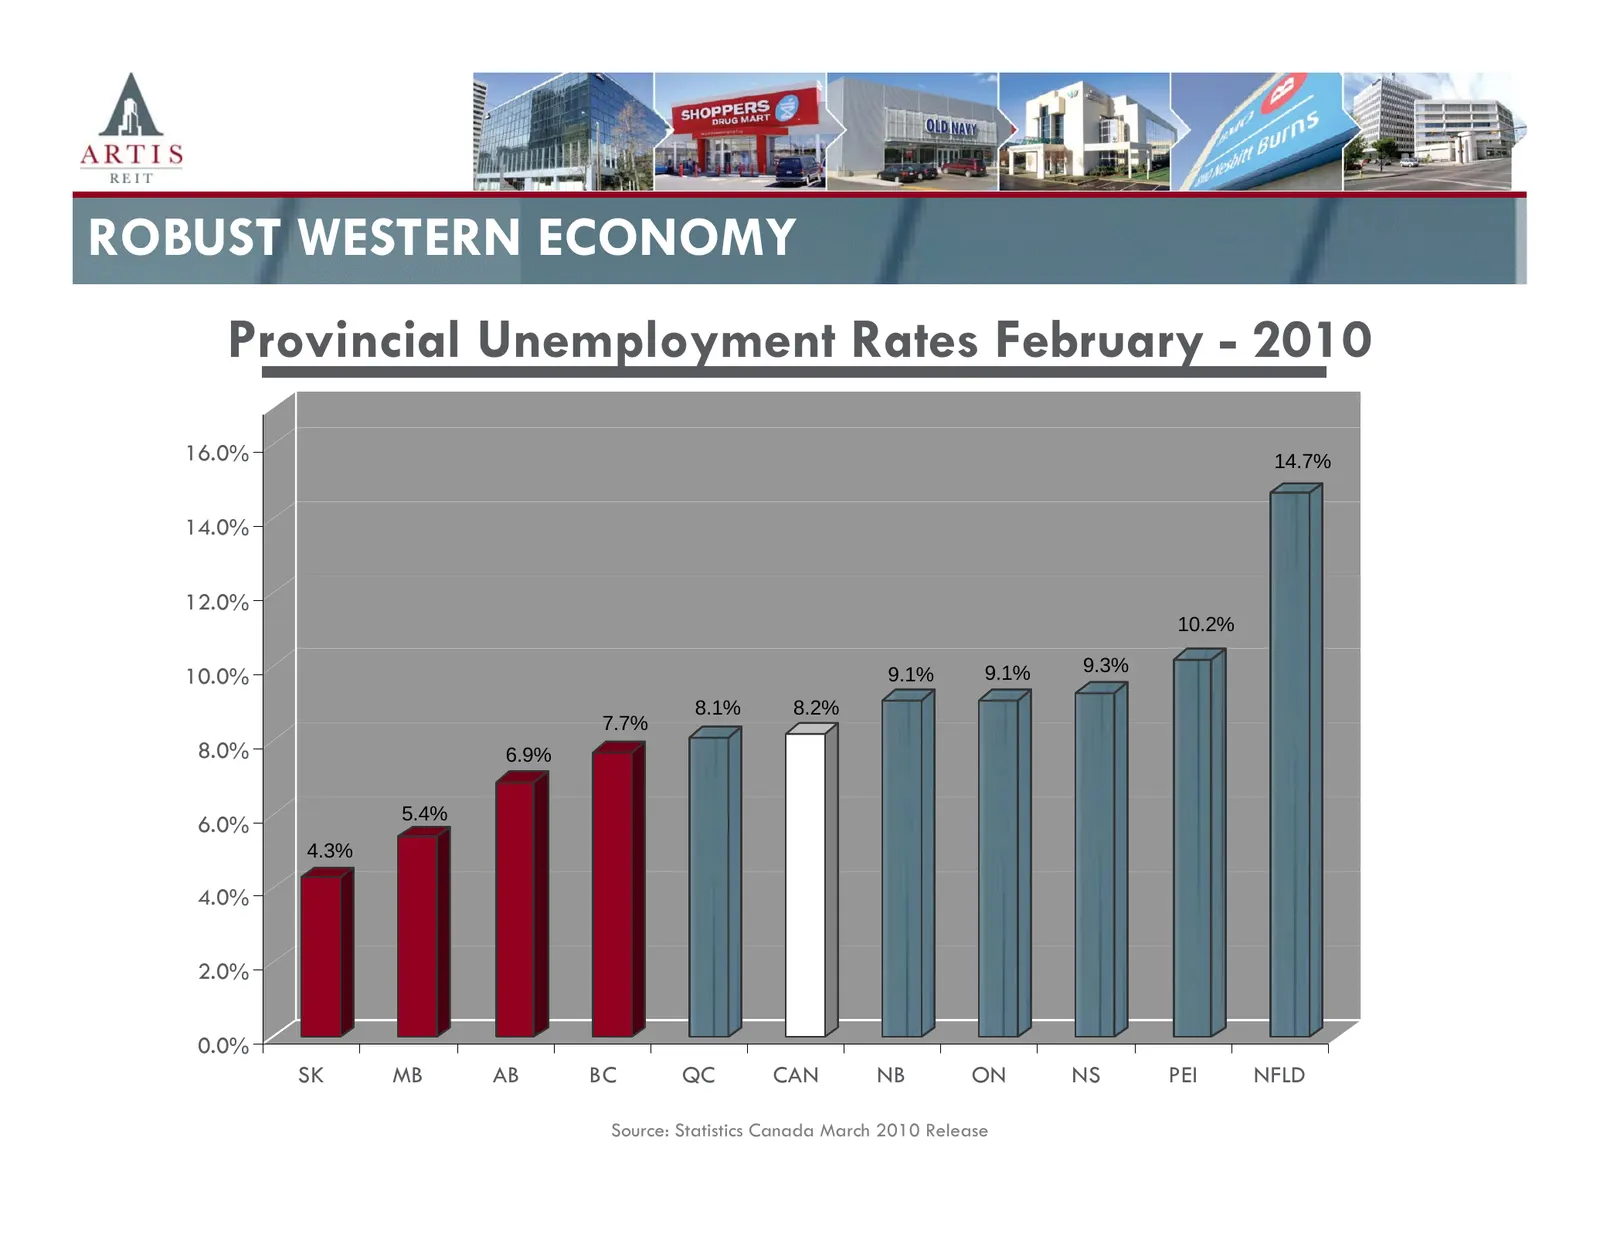
ROBUST WESTERN ECONOMY Provincial Unemployment Rates February - 2010 16.0% 14.7% 14.0% 12.0% 10.2% 9.3% 10.0% 9.1% 9.1% 8.1% 8.2% 7.7% 8.0% 6.9% 5.4% 6.0% 4.3% 4.0% 2.0% 0.0% SK MB AB BC QC CAN NB ON NS PEI NFLD 11 Source: Statistics Canada March 2010 Release 11
Slide 12: Robust Western Economy: Per Capita Retail Sales
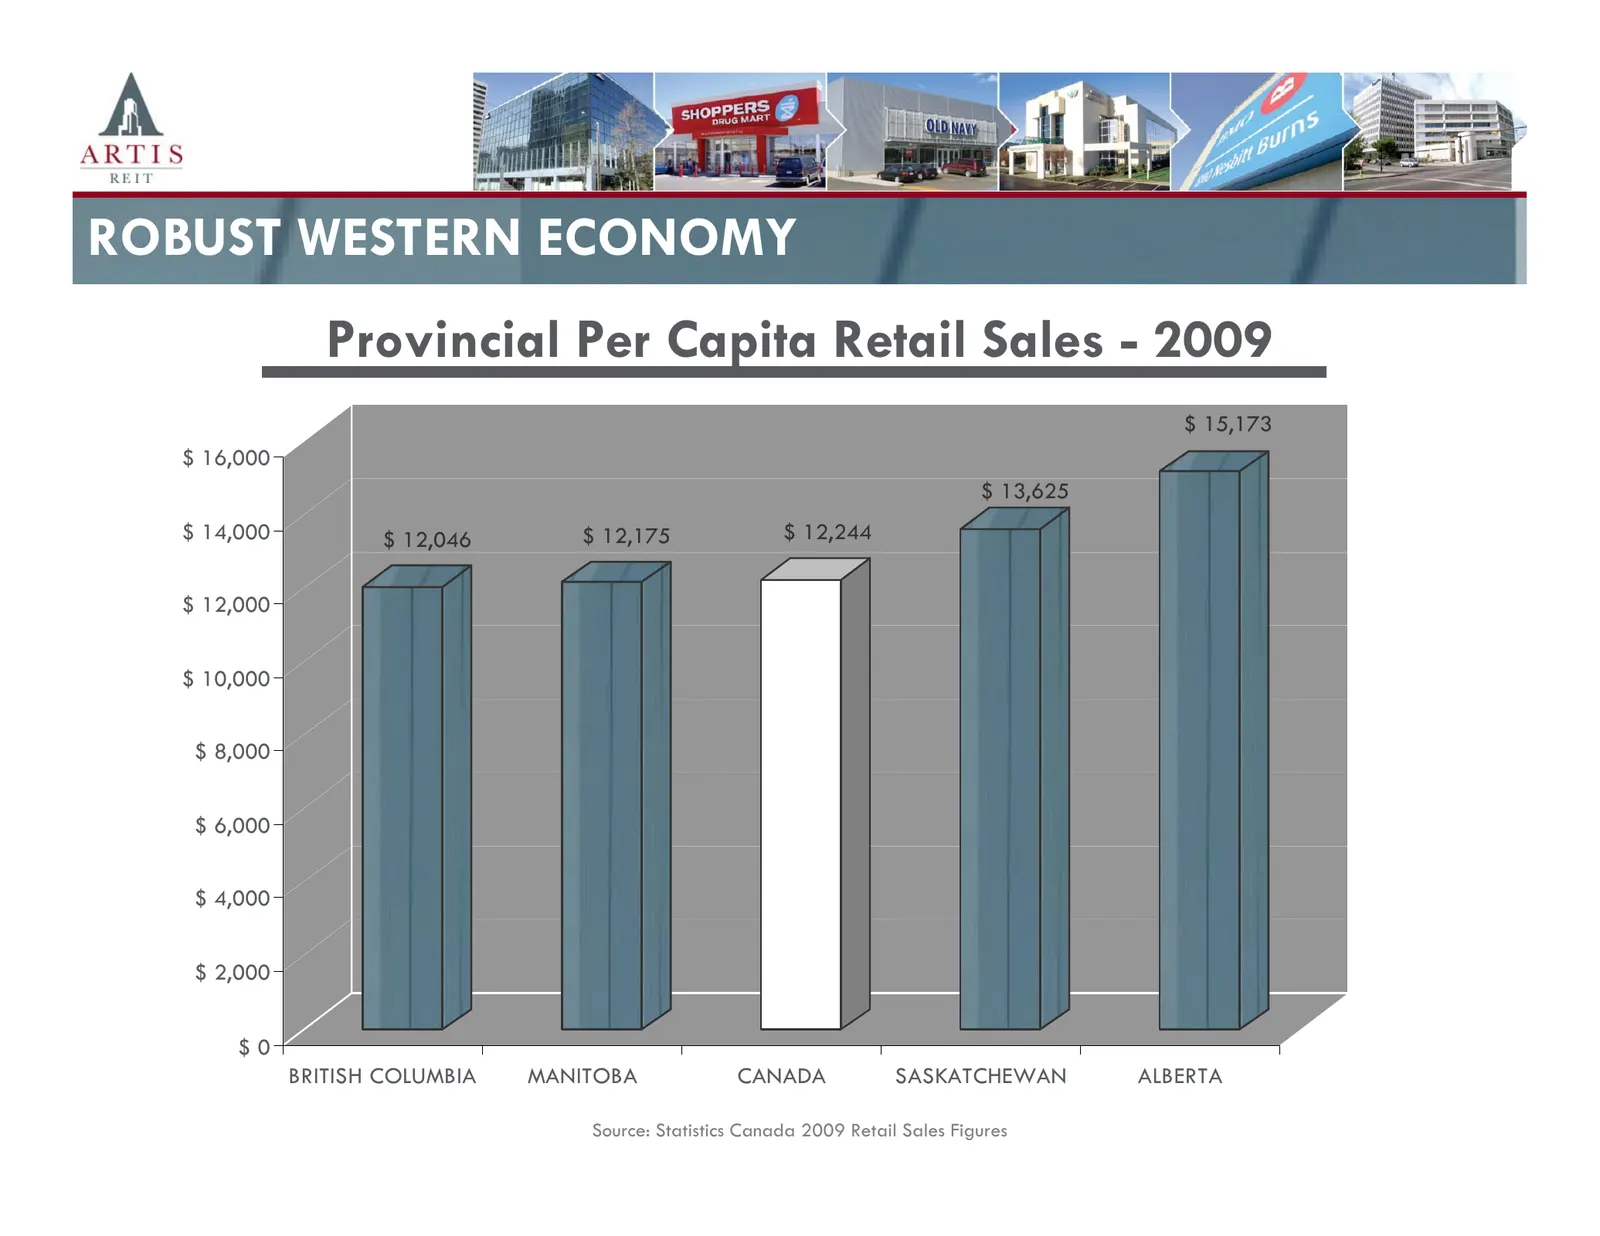
ROBUST WESTERN ECONOMY Provincial Per Capita Retail Sales - 2009 $ 15,173 $ 16,000 $ 13,625 $ 14,000 $ 12,046 $ 12,175 $ 12,244 $ 12,000 $ 10,000 $ 8,000 $ 6,000 $ 4,000 $ 2,000 $0 BRITISH COLUMBIA MANITOBA CANADA SASKATCHEWAN ALBERTA 12 Source: Statistics Canada 2009 Retail Sales Figures 12
Slide 13: Largest Tenants by Gross Revenue
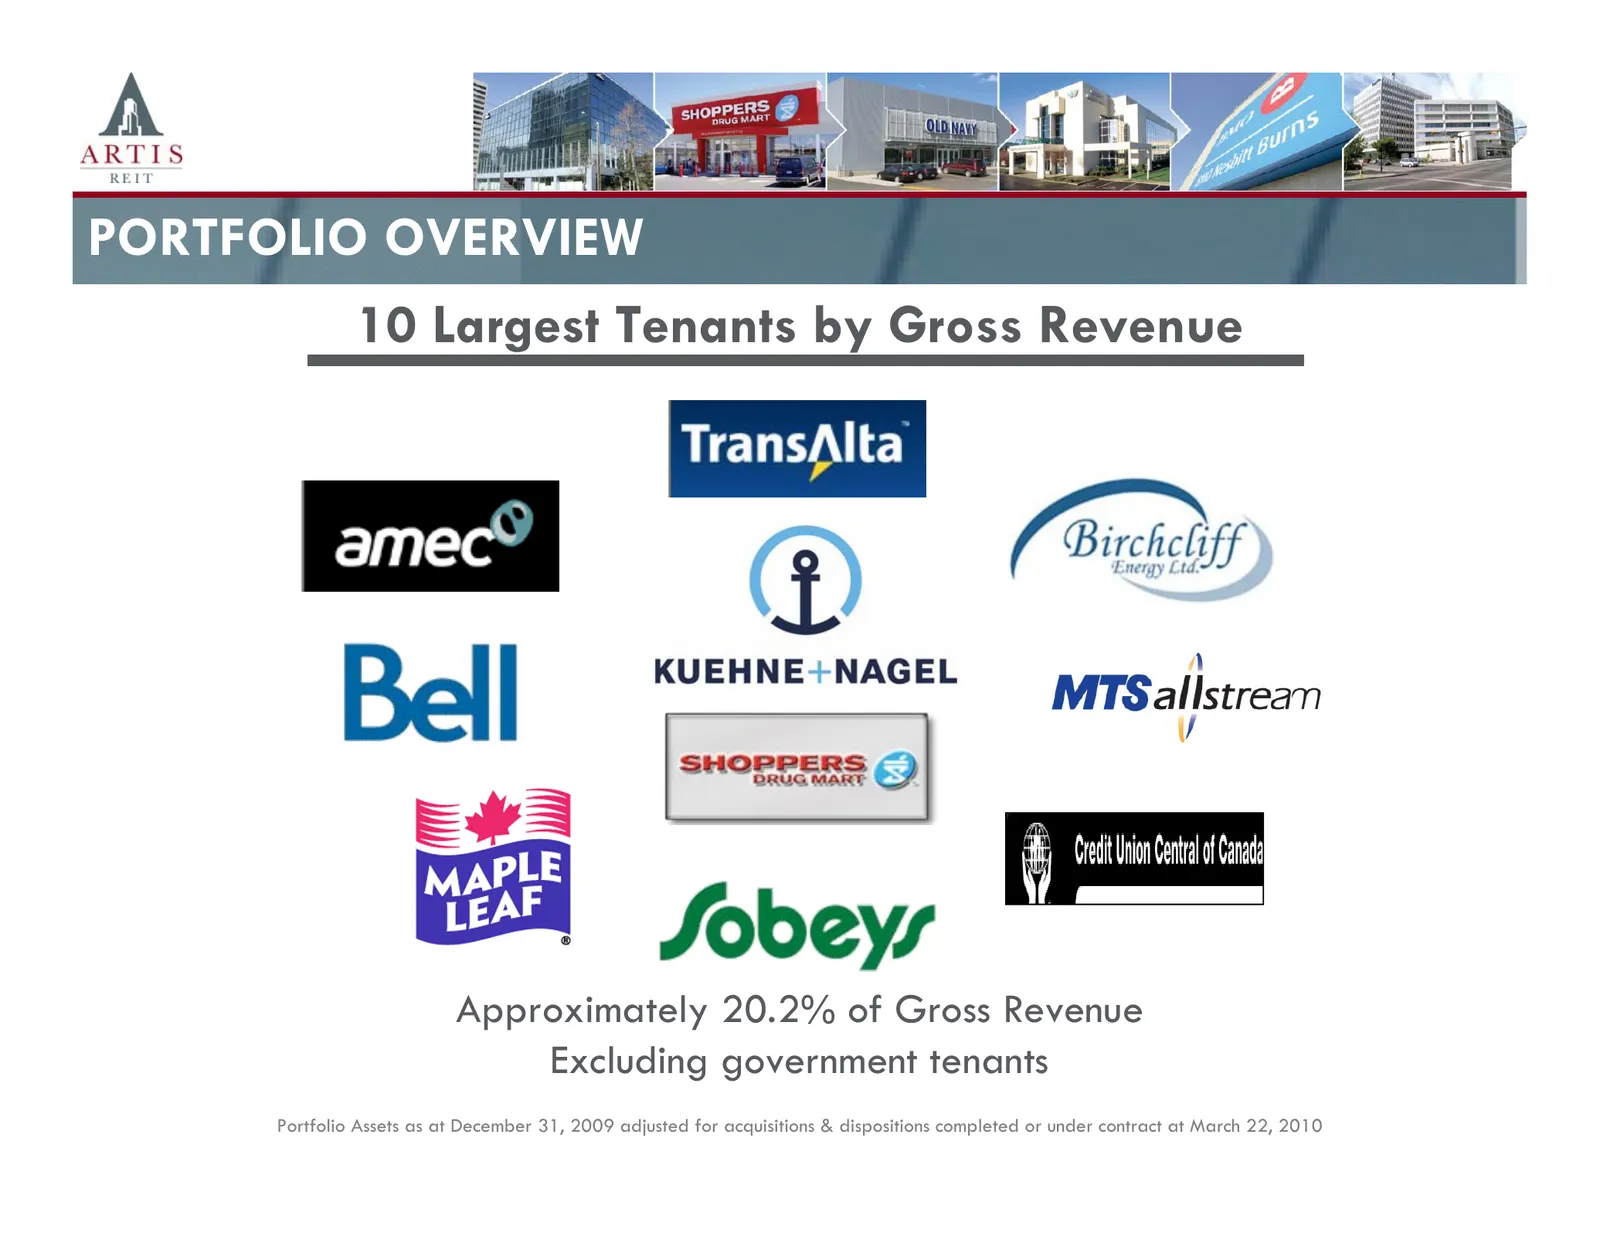
PORTFOLIO OVERVIEW 10 Largest Tenants by Gross Revenue Approximately 20.2% of Gross Revenue Excluding government tenants 13 Portfolio Assets as at December 31, 2009 adjusted for acquisitions & dispositions completed or under contract at March 22, 2010 13
Slide 14: 68.8% of Tenants are Government or National
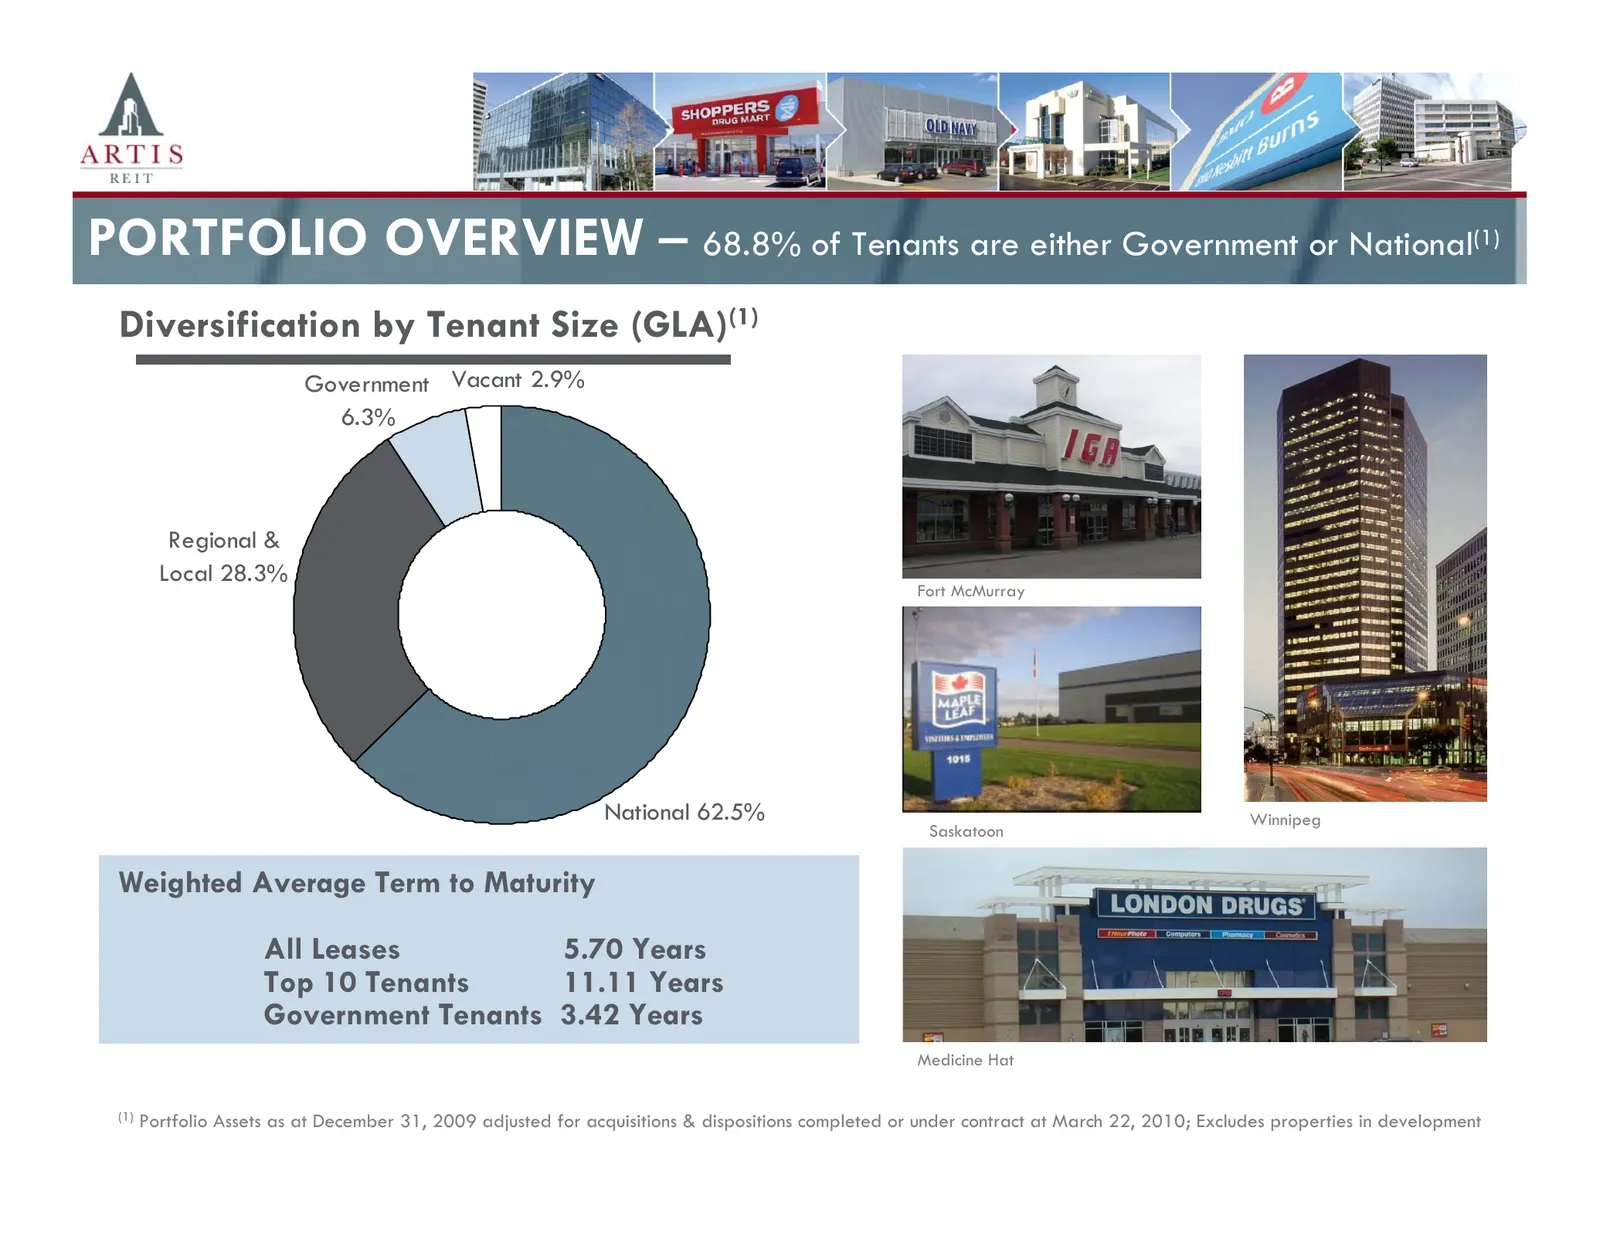
PORTFOLIO OVERVIEW – 68.8% of Tenants are either Government or National(1) Diversification by Tenant Size (GLA)(1) Government Vacant 2.9% 6.3% Regional & Local 28.3% Fort McMurray National 62.5% Winnipeg Saskatoon Weighted Average Term to Maturity All Leases 5.70 Years Top 10 Tenants 11.11 Years Gov
Slide 15: Portfolio Overview: GLA and Gross Book Value
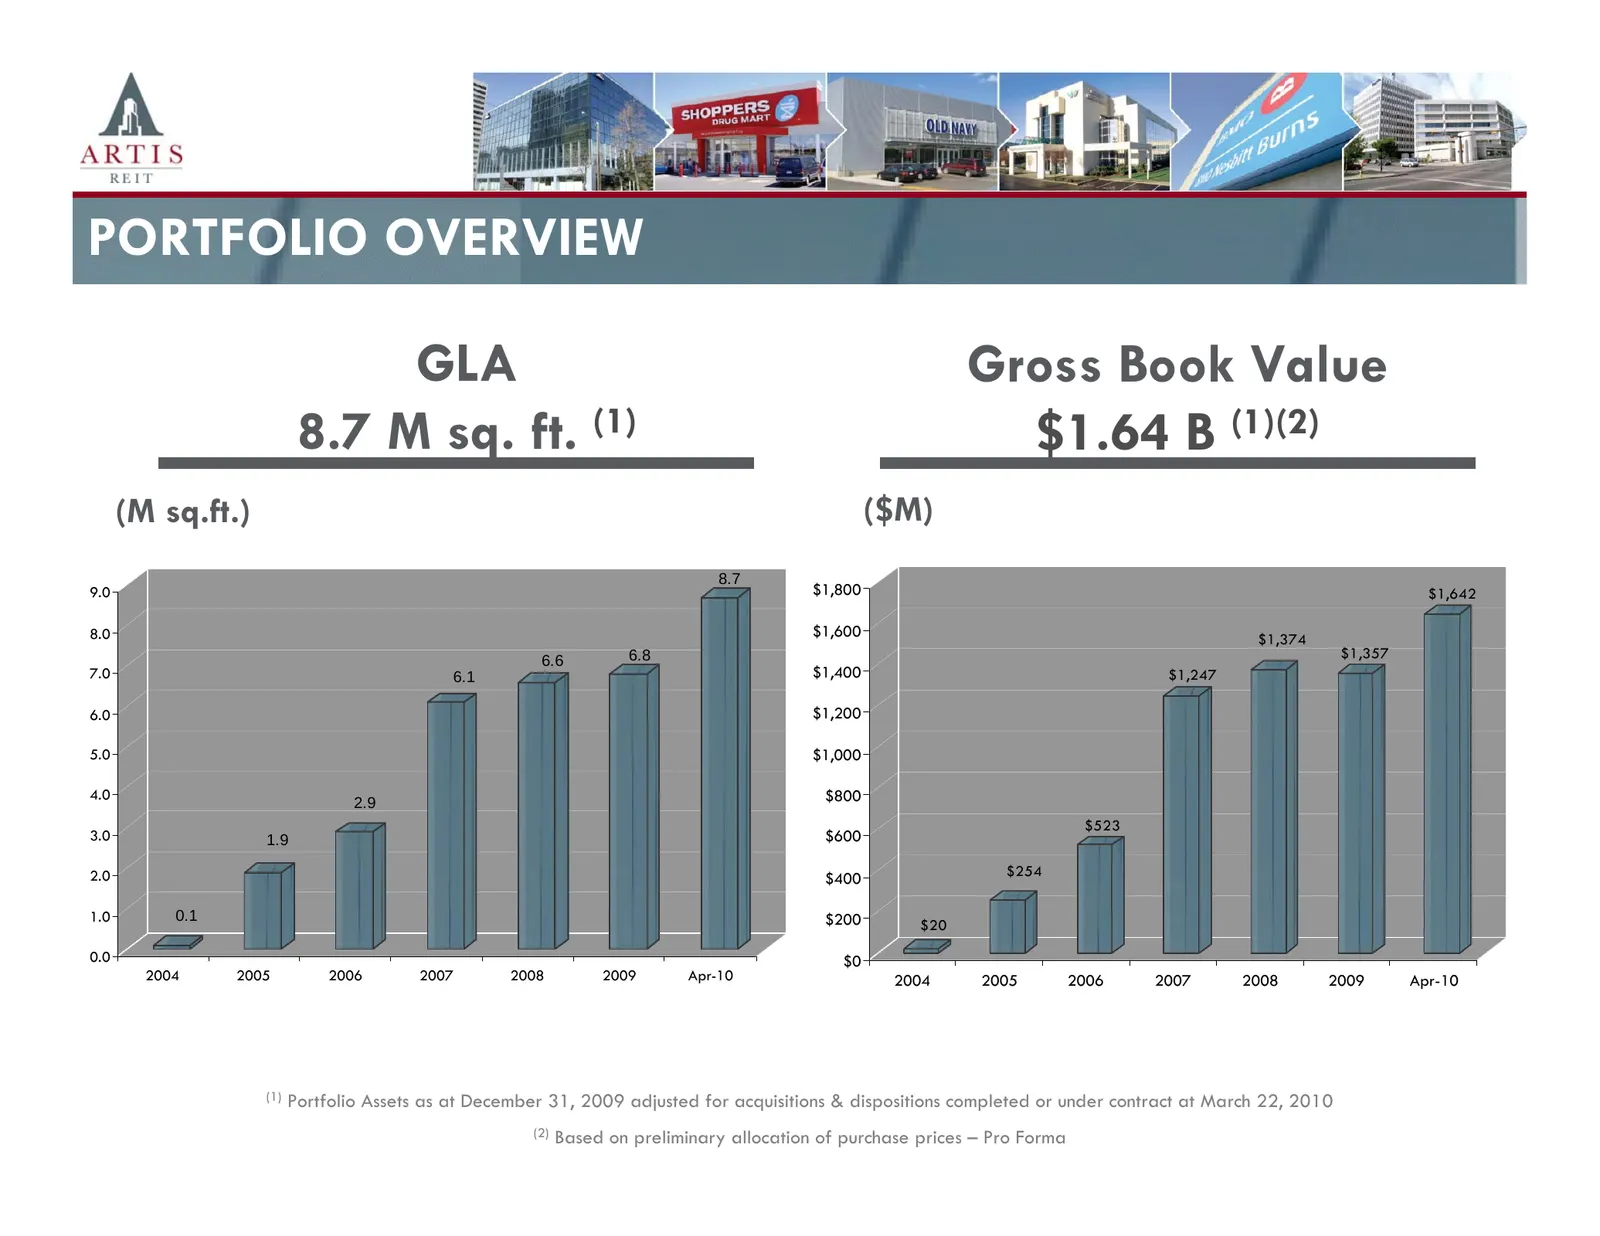
PORTFOLIO OVERVIEW GLA Gross Book Value 8.7 M sq. ft. (1) $1.64 B (1)(2) (M sq.ft.) ($M) 8.7 9.0 $1,800 $1,642 8.0 $1,600 $1,374 6.8 $1,357 6.6 7.0 6.1 $1,400 $1,247 6.0 $1,200 5.0 $1,000 4.0 $800 2.9 $523 3.0 1.9 $600 2.0 $400 $254 1.0 0.1 $200 $20 0.0 $0 2004 2005 2006 2007 2008 2009 Apr-10 2004 2
Slide 16: Annual Information
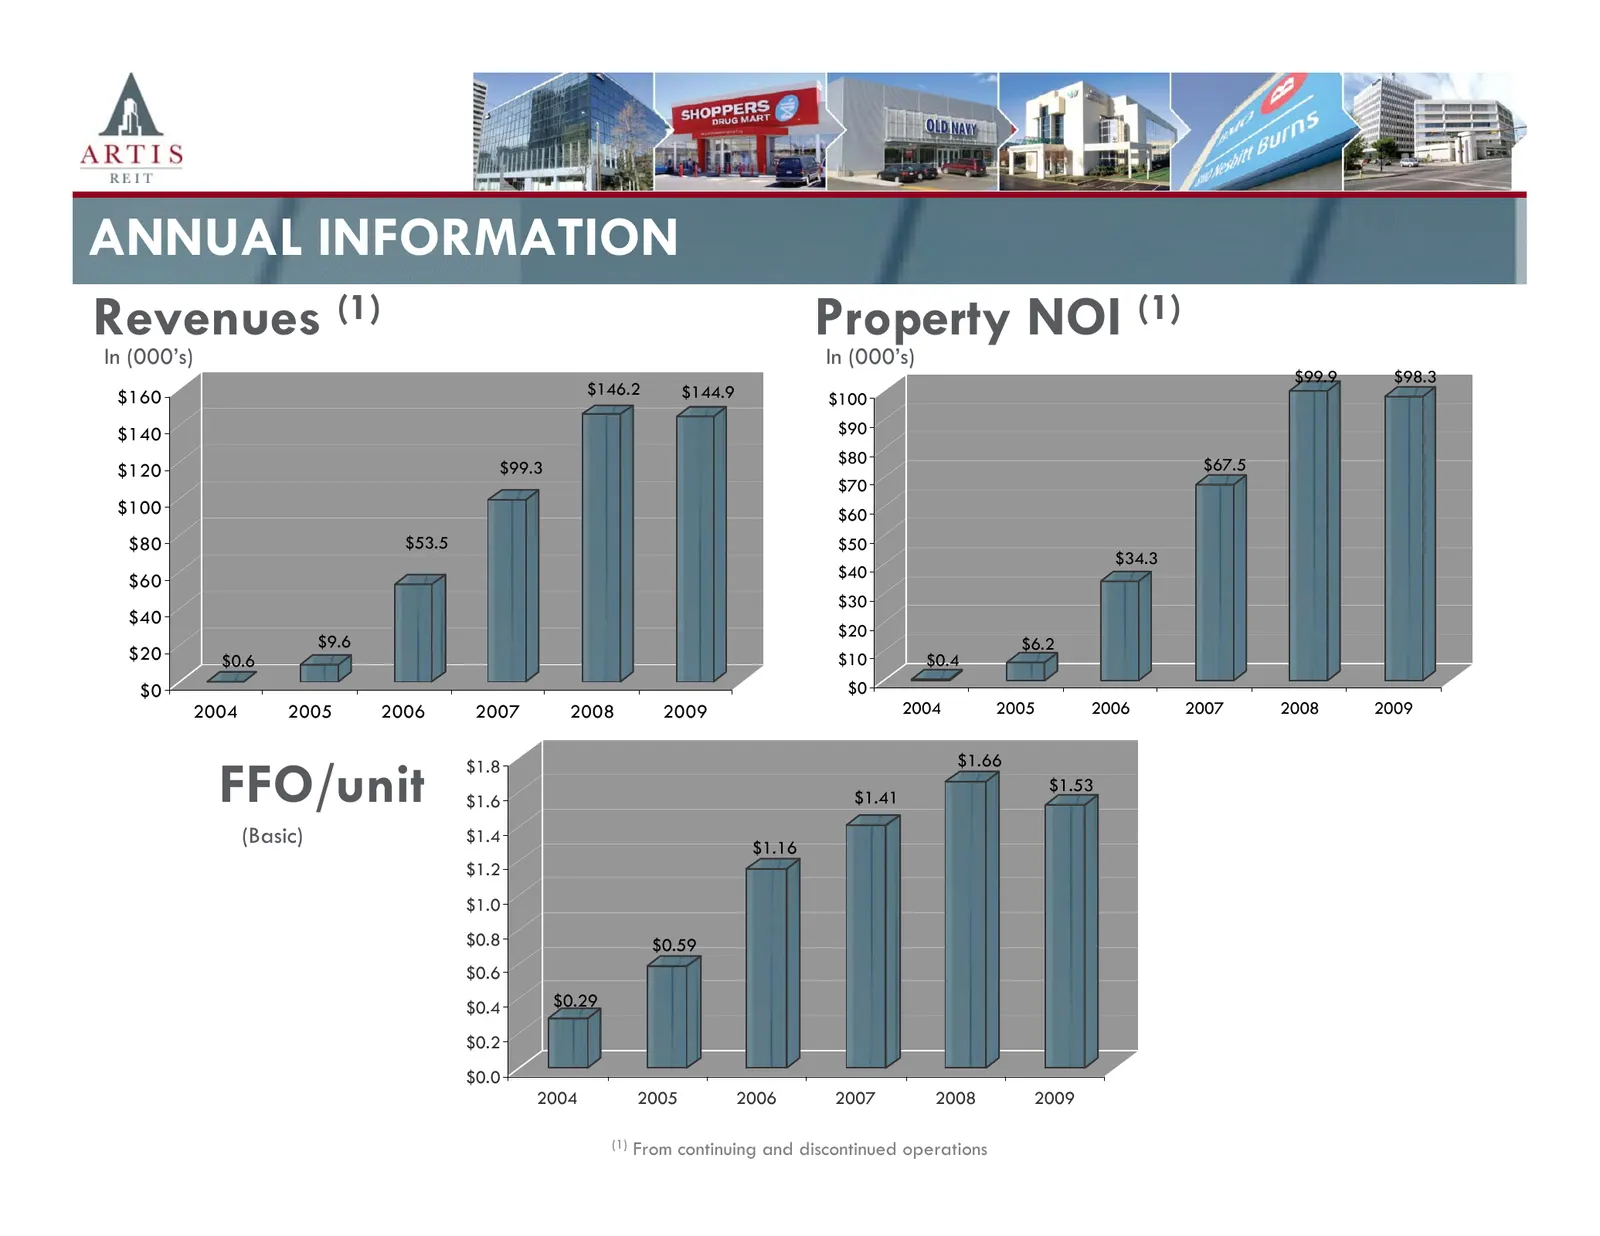
ANNUAL INFORMATION Revenues (1) Property NOI (1) In (000’s) In (000’s) $99.9 $98.3 $160 $146.2 $144.9 $100 $140 $90 $80 $67.5 $120 $99.3 $70 $100 $60 $80 $53.5 $50 $34.3 $60 $40 $30 $40 $20 $9.6 $6.2 $20 $0.6 $10 $0.4 $0 $0 2004 2005 2006 2007 2008 2009 2004 2005 2006 2007 2008 2009 $1.66 FFO/unit $
Slide 17: 2009 Year to Date Information
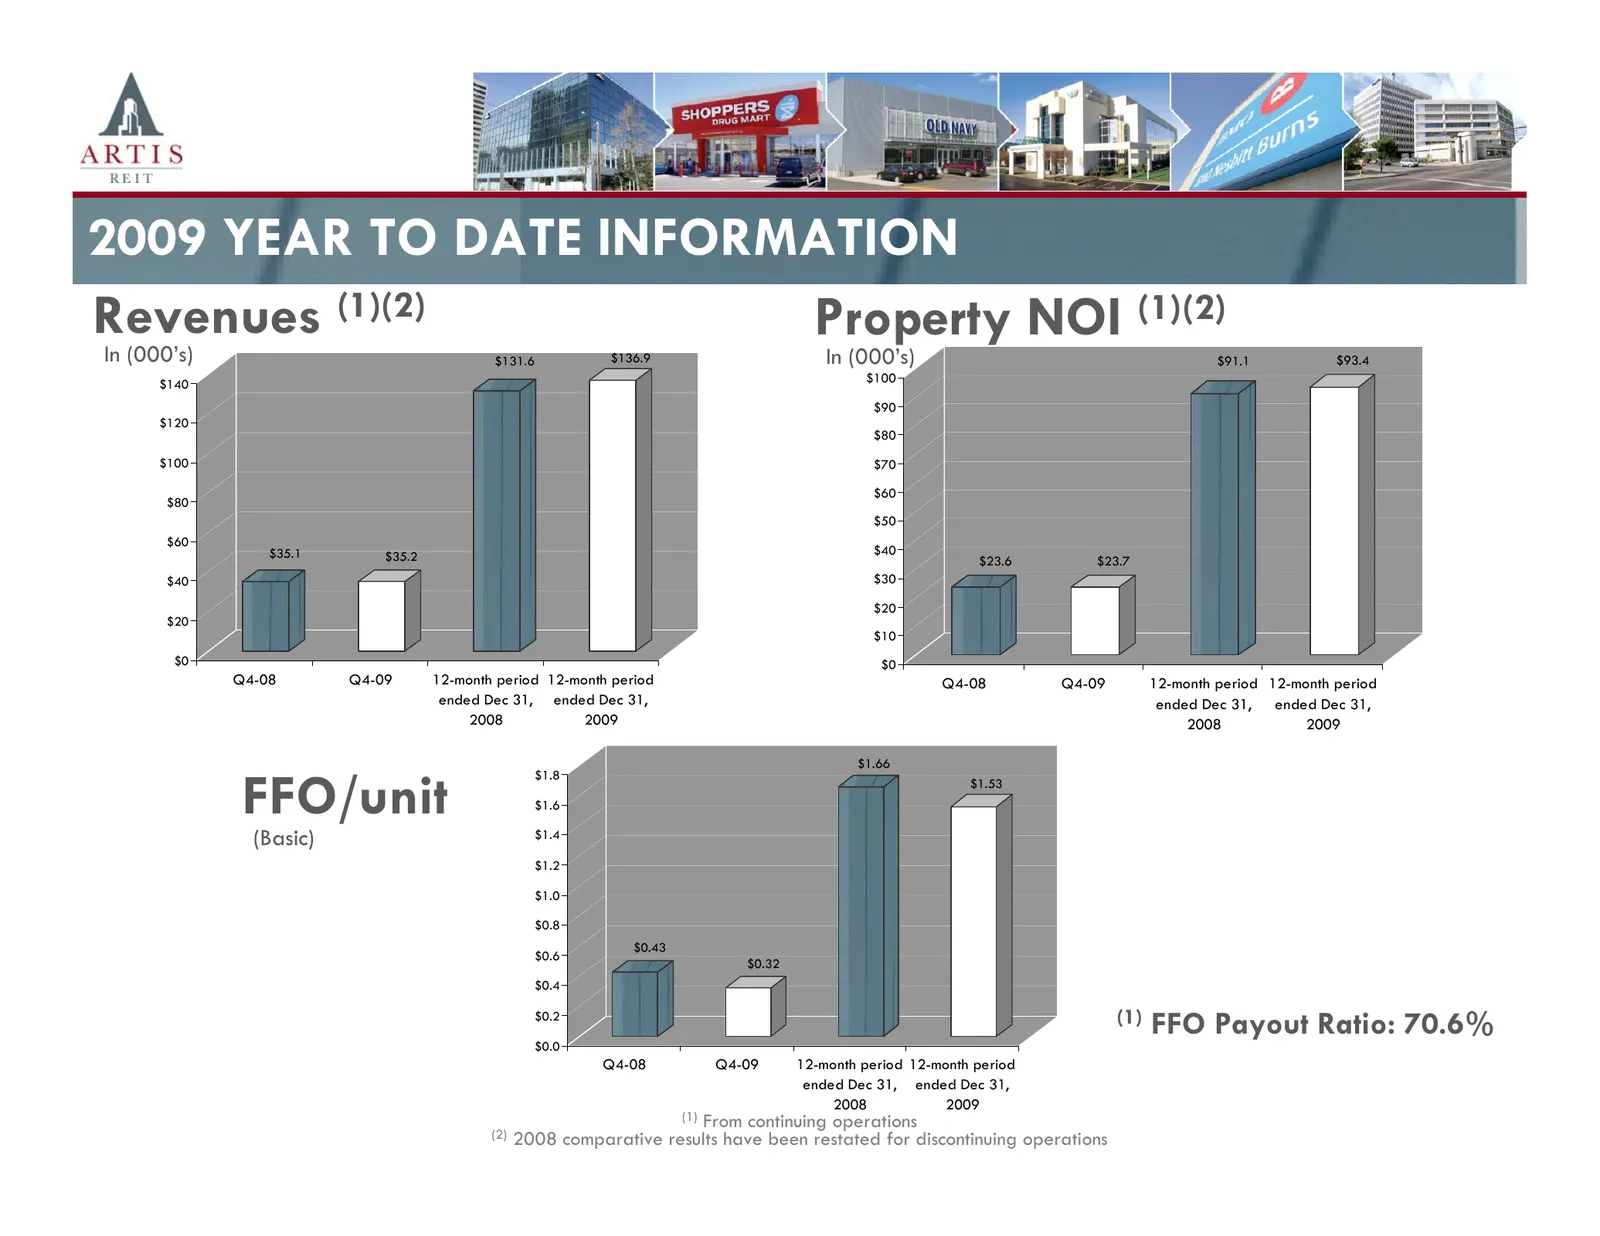
2009 YEAR TO DATE INFORMATION Revenues (1)(2) Property NOI (1)(2) In (000’s) $131.6 $136.9 In (000’s) $91.1 $93.4 $140 $100 $90 $120 $80 $100 $70 $60 $80 $50 $60 $35.1 $35.2 $40 $23.6 $23.7 $40 $30 $20 $20 $10 $0 $0 Q4-08 Q4-09 12-month period 12-month period Q4-08 Q4-09 12-month period 12-month per
Slide 18: Schedule of Mortgages Maturing
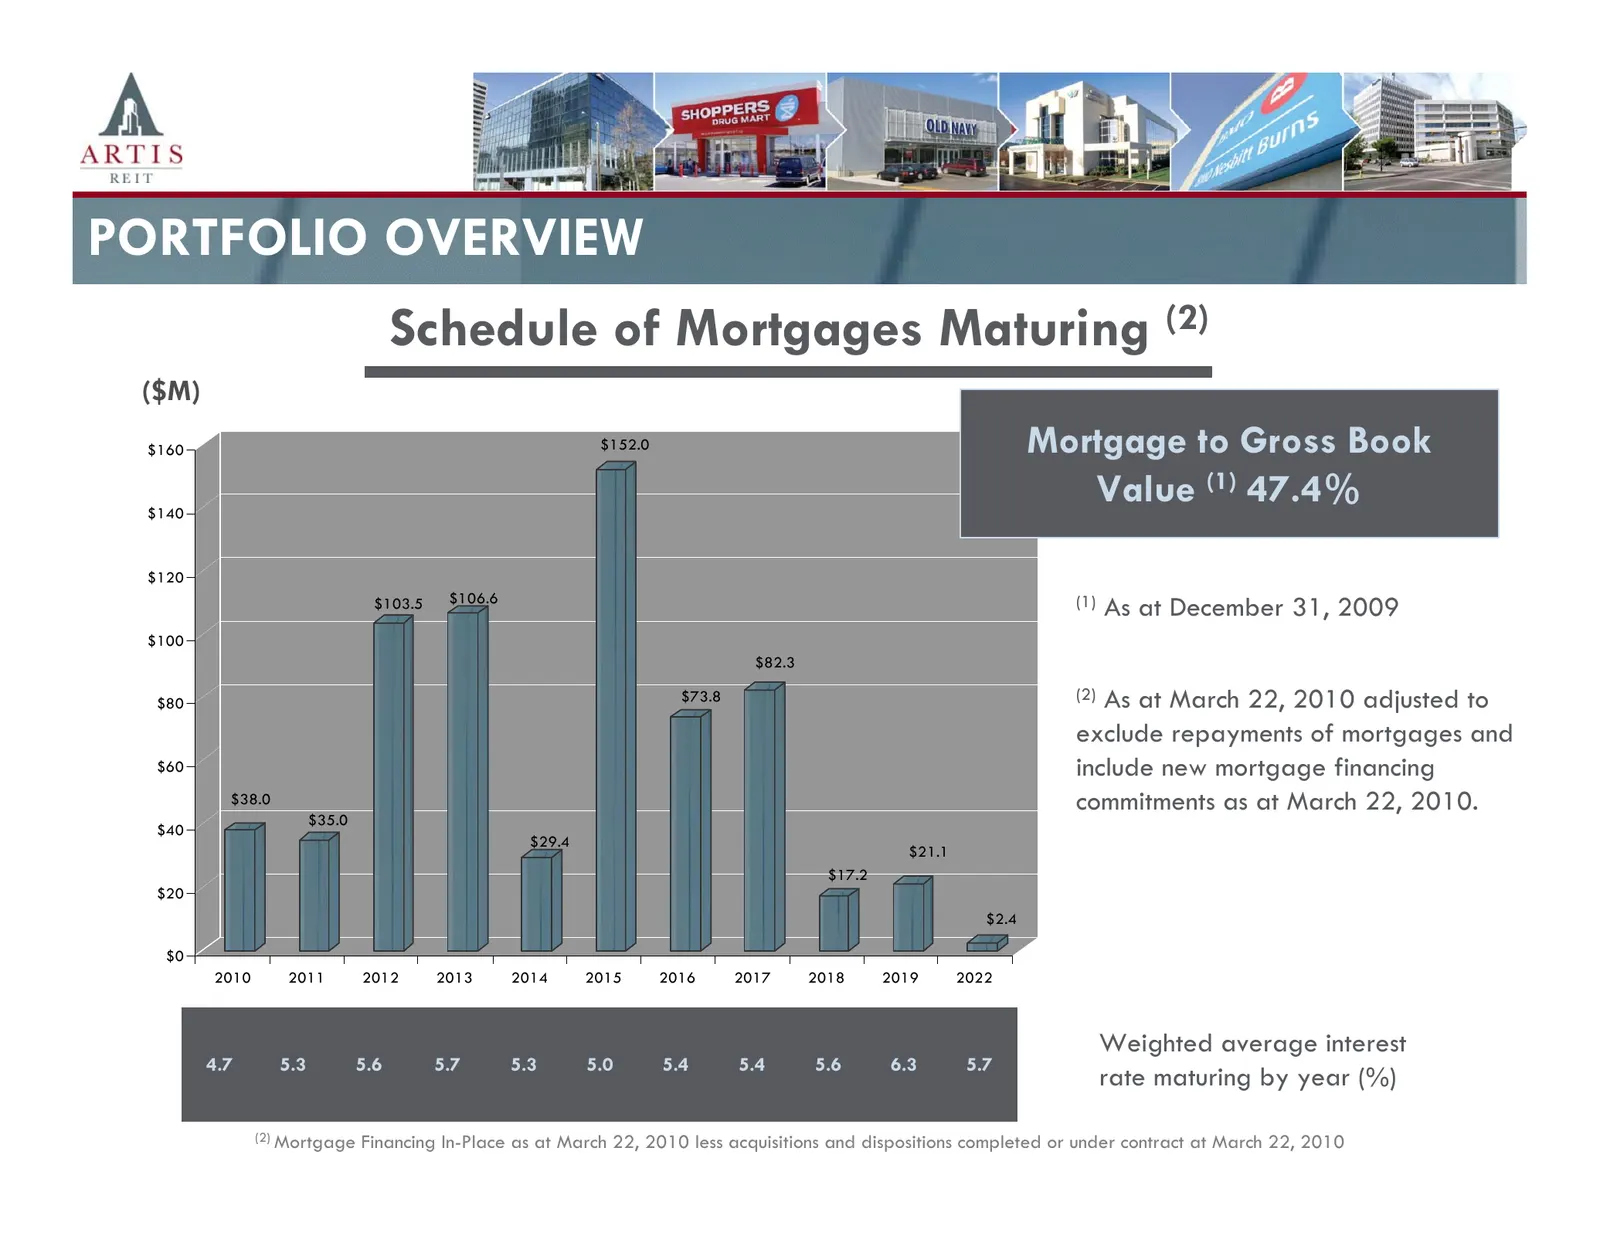
PORTFOLIO OVERVIEW Schedule of Mortgages Maturing (2) ($M) $160 $152.0 Mortgage to Gross Book $140 Value (1) 47.4% $120 $103.5 $106.6 (1) As at December 31, 2009 $100 $82.3 $80 $73.8 (2) As at March 22, 2010 adjusted to exclude repayments of mortgages and $60 include new mortgage financing $38.0 com
Slide 19: Mortgage Profile
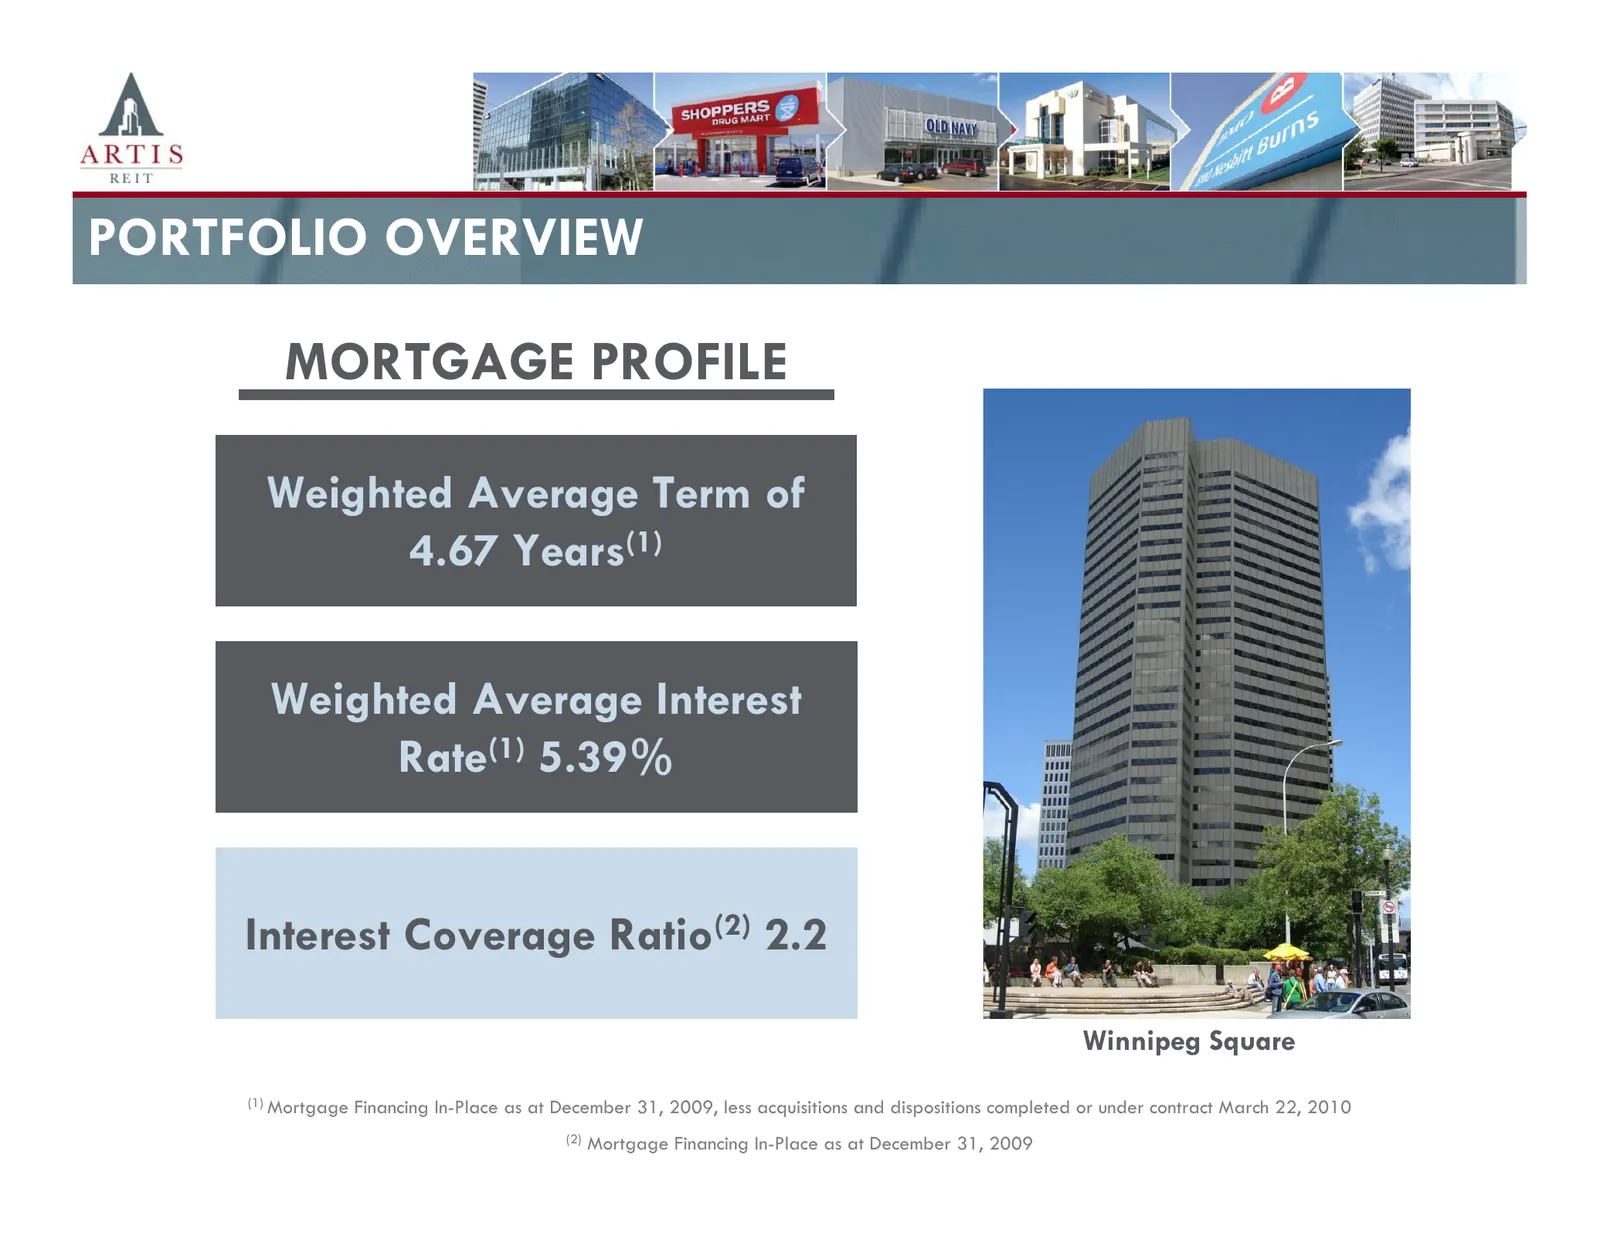
PORTFOLIO OVERVIEW MORTGAGE PROFILE Weighted Average Term of 4.67 Years(1) Weighted Average Interest Rate(1) 5.39% Interest Coverage Ratio(2) 2.2 Winnipeg Square (1) Mortgage Financing In-Place as at December 31, 2009, less acquisitions and dispositions completed or under contract March 22, 2010 19
Slide 20: Internal Growth
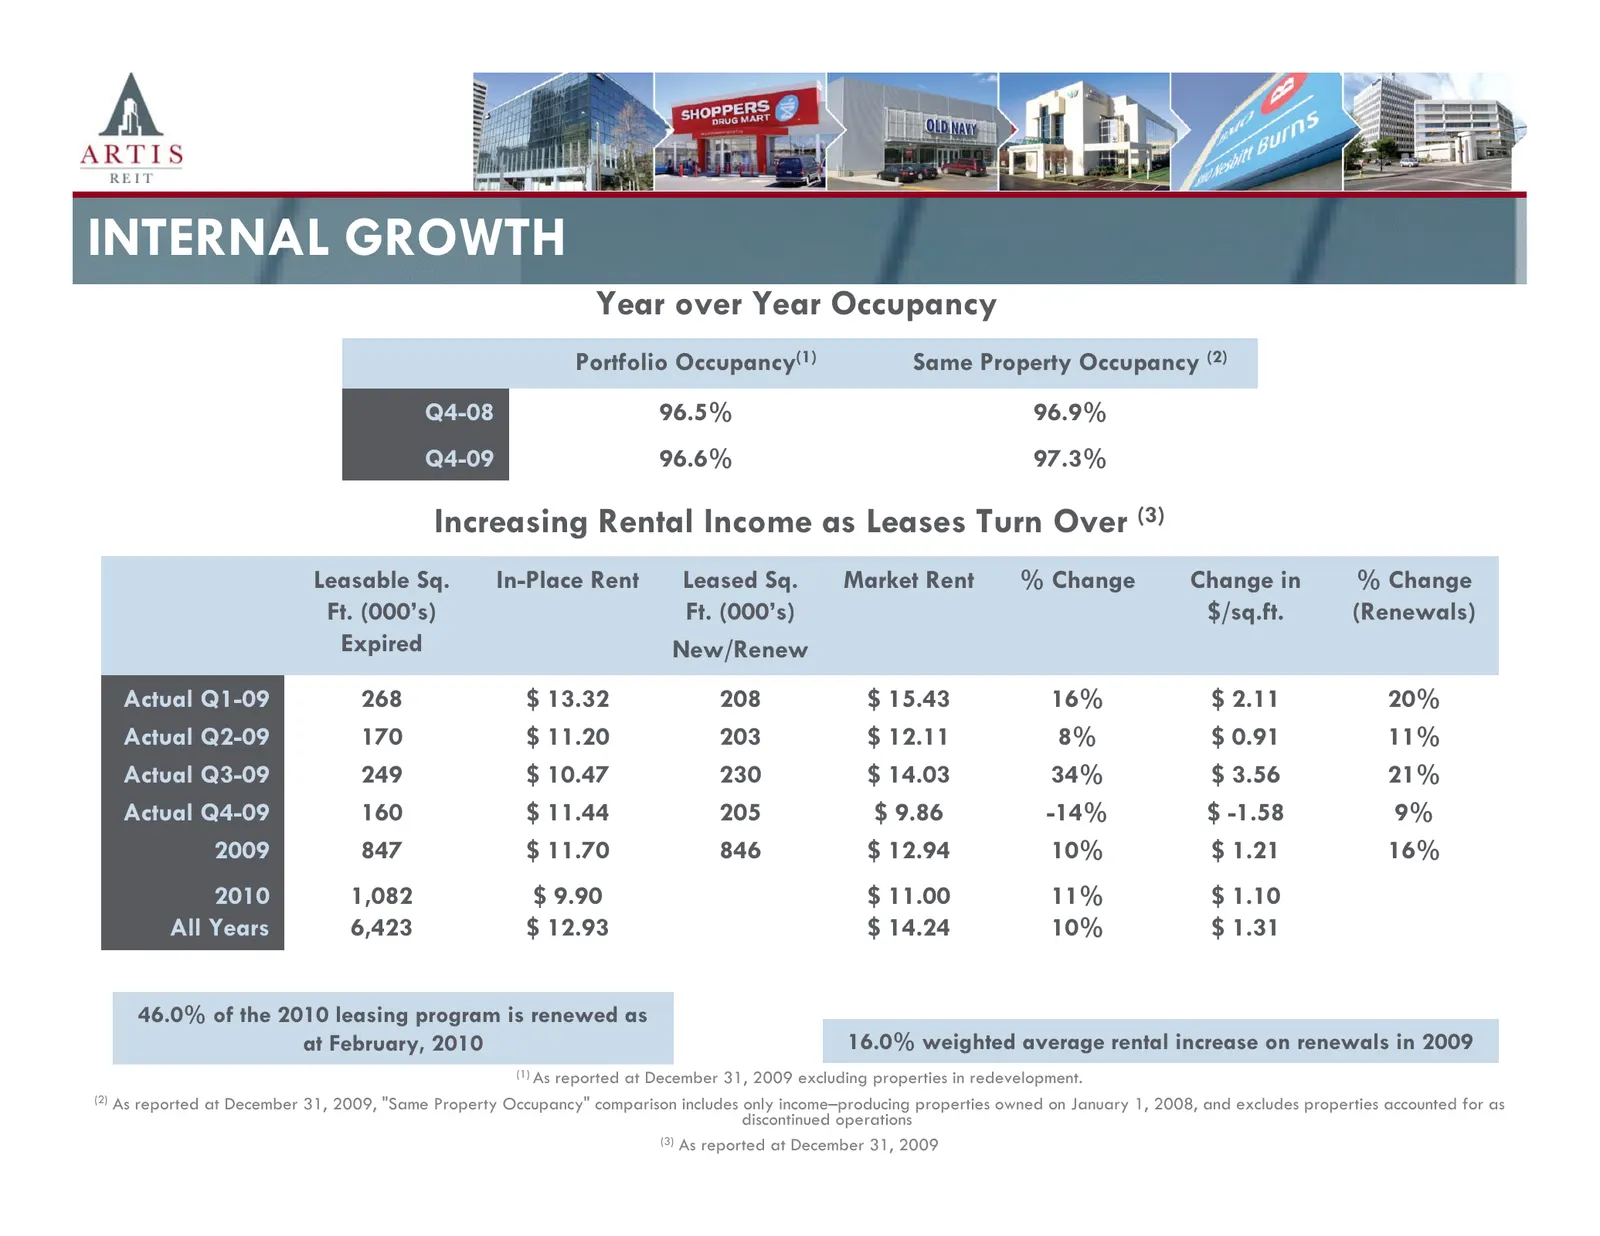
INTERNAL GROWTH Year over Year Occupancy Portfolio Occupancy(1) Same Property Occupancy (2) Q4-08 96.5% 96.9% Q4-09 96.6% 97.3% Increasing Rental Income as Leases Turn Over (3) Leasable Sq. In-Place Rent Leased Sq. Market Rent % Change Change in % Change Ft. (000’s) Ft. (000’s) $/sq.ft. (Renewals) E
Slide 21: Latest Analyst Projections
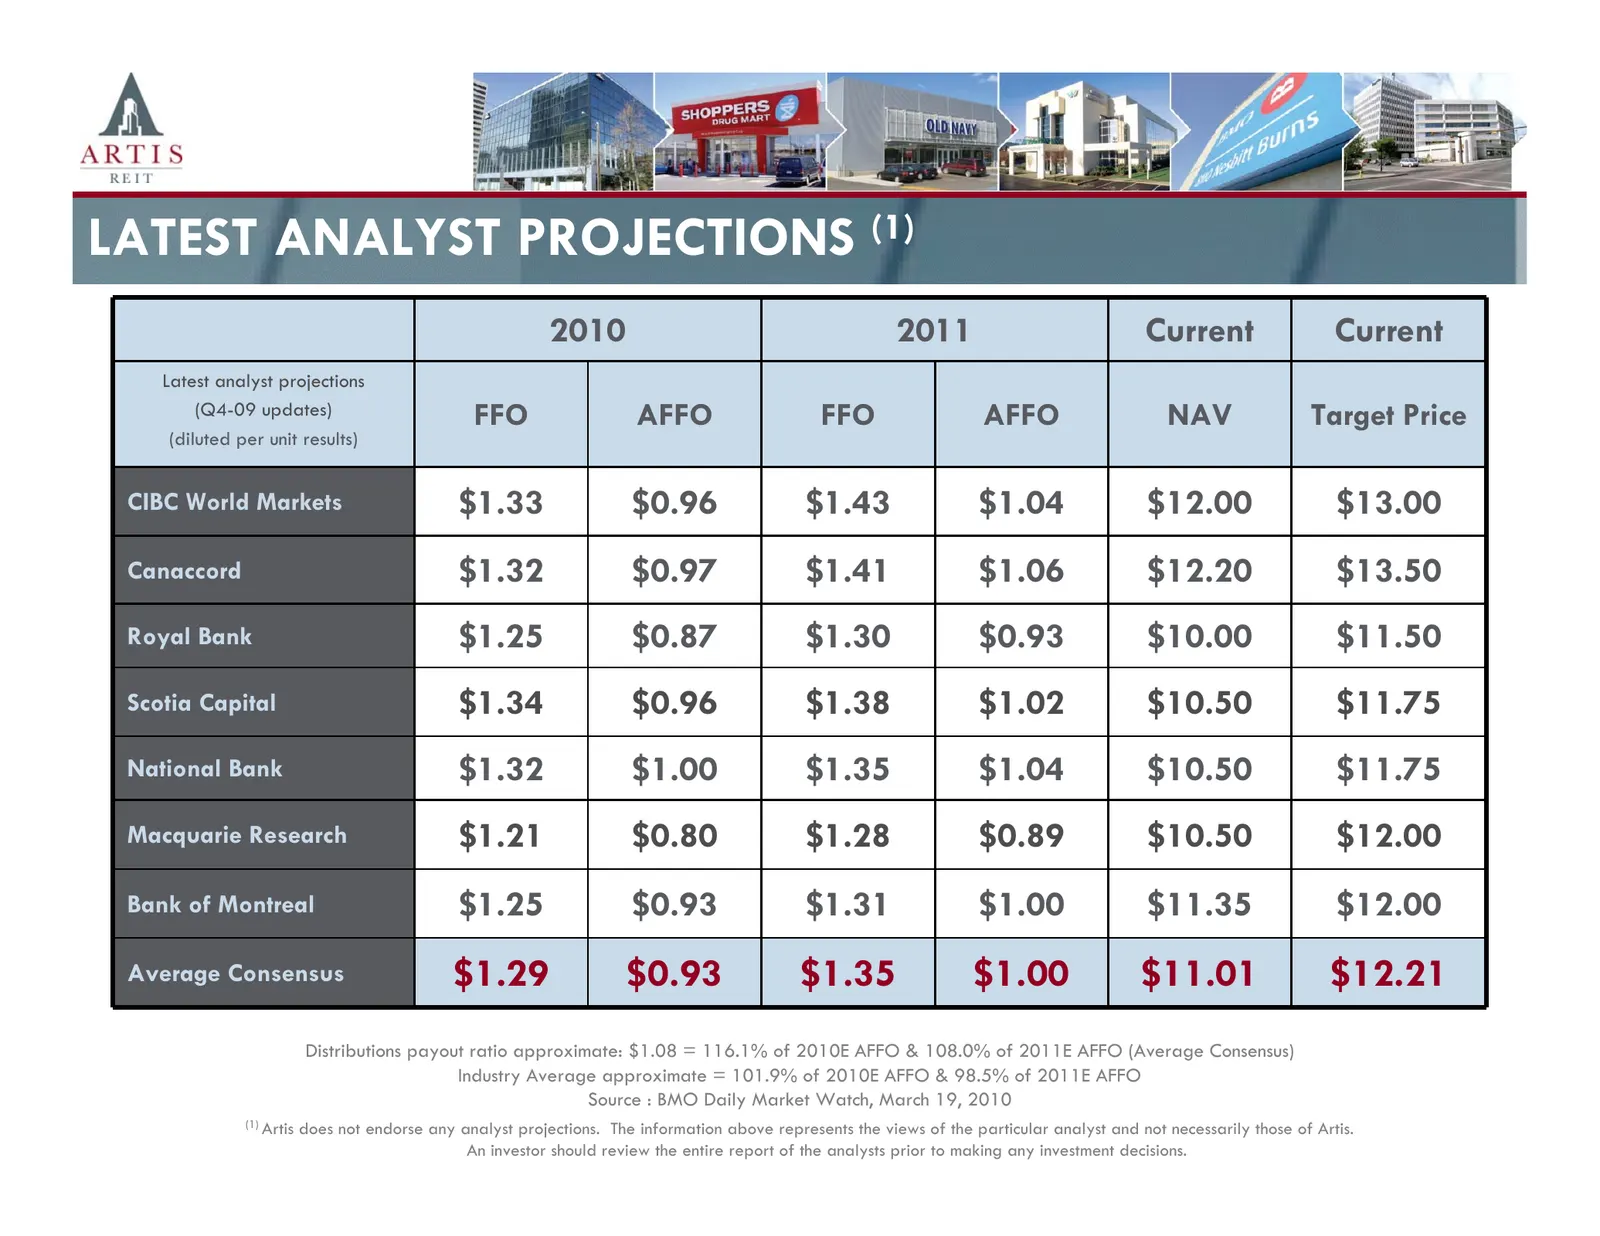
LATEST ANALYST PROJECTIONS (1) 2010 2011 Current Current Latest analyst projections (Q4-09 updates) FFO AFFO FFO AFFO NAV Target Price (diluted per unit results) CIBC World Markets $1.33 $0.96 $1.43 $1.04 $12.00 $13.00 Canaccord $1.32 $0.97 $1.41 $1.06 $12.20 $13.50 Royal Bank $1.25 $0.87 $1.30 $0.9
Slide 22: Peer Comparisons
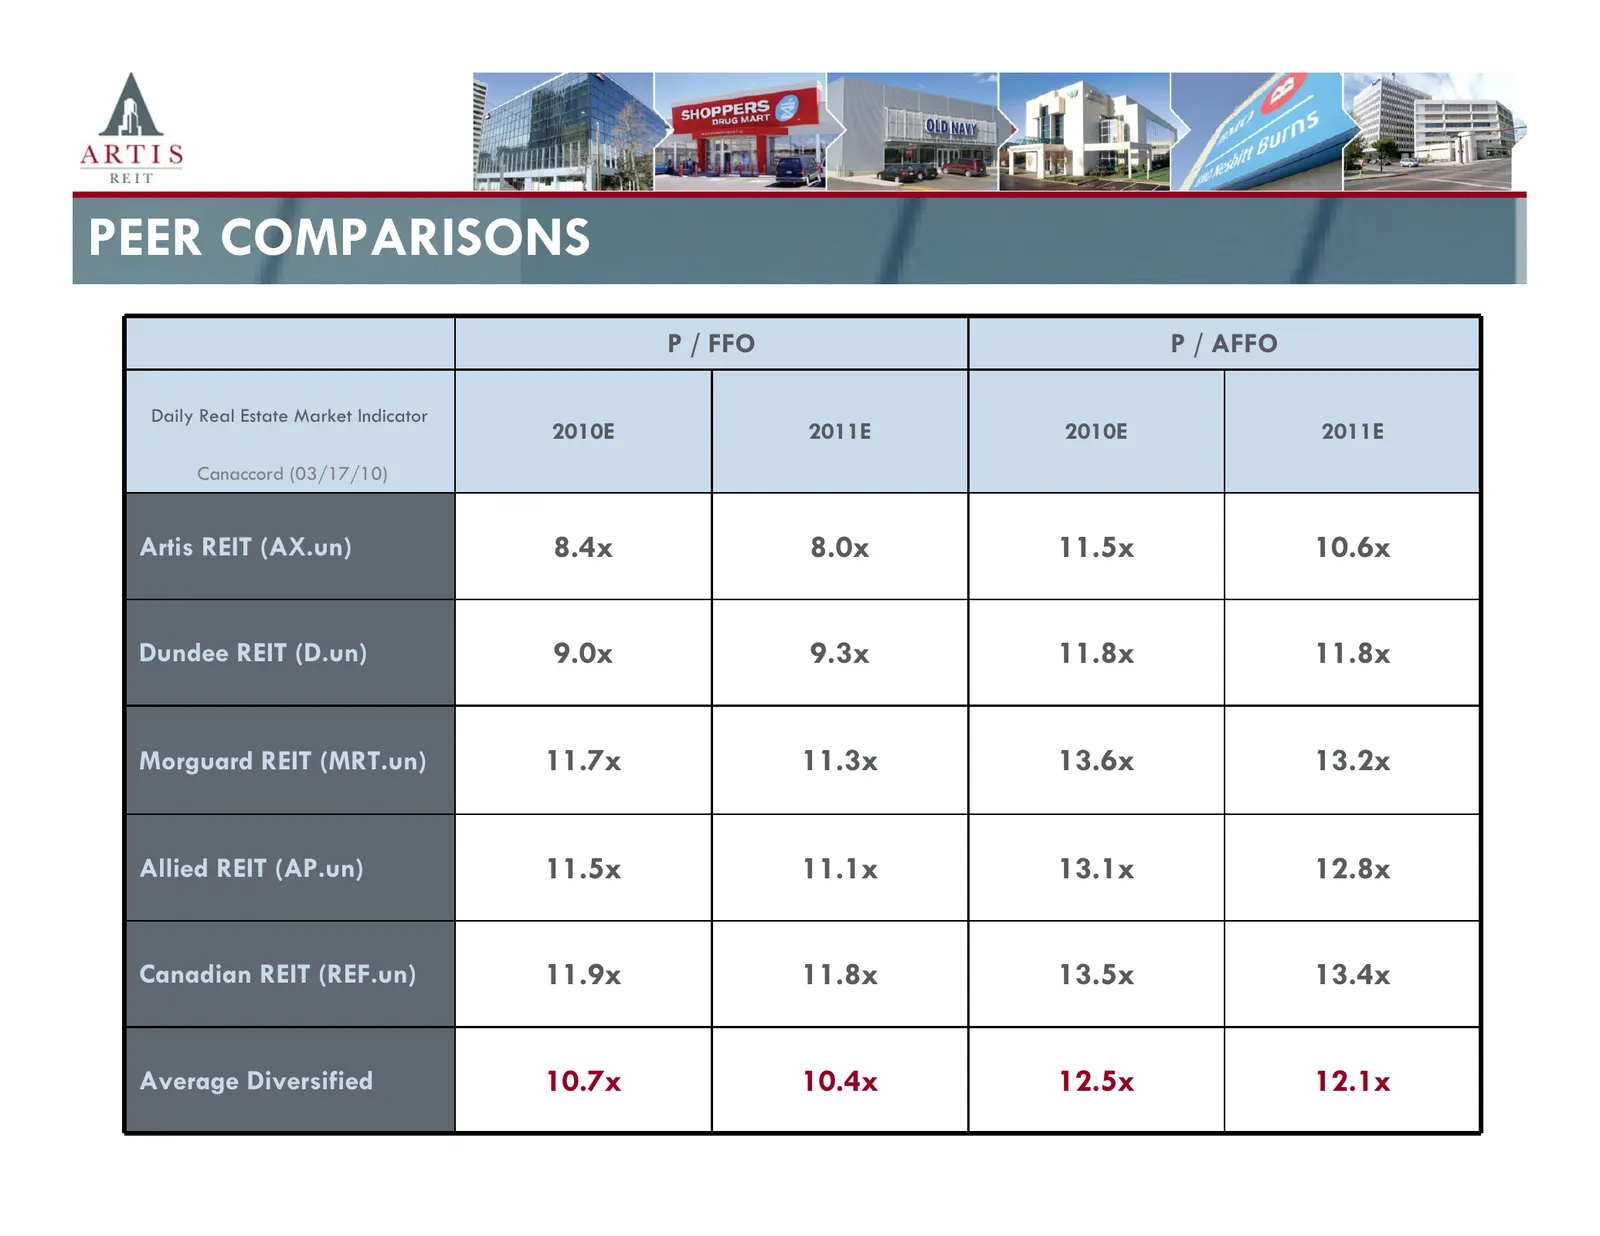
PEER COMPARISONS P / FFO P / AFFO Daily Real Estate Market Indicator 2010E 2011E 2010E 2011E Canaccord (03/17/10) Artis REIT (AX.un) 8.4x 8.0x 11.5x 10.6x Dundee REIT (D.un) 9.0x 9.3x 11.8x 11.8x Morguard REIT (MRT.un) 11.7x 11.3x 13.6x 13.2x Allied REIT (AP.un) 11.5x 11.1x 13.1x 12.8x Canadian REIT
Slide 23: Growth Strategy - External
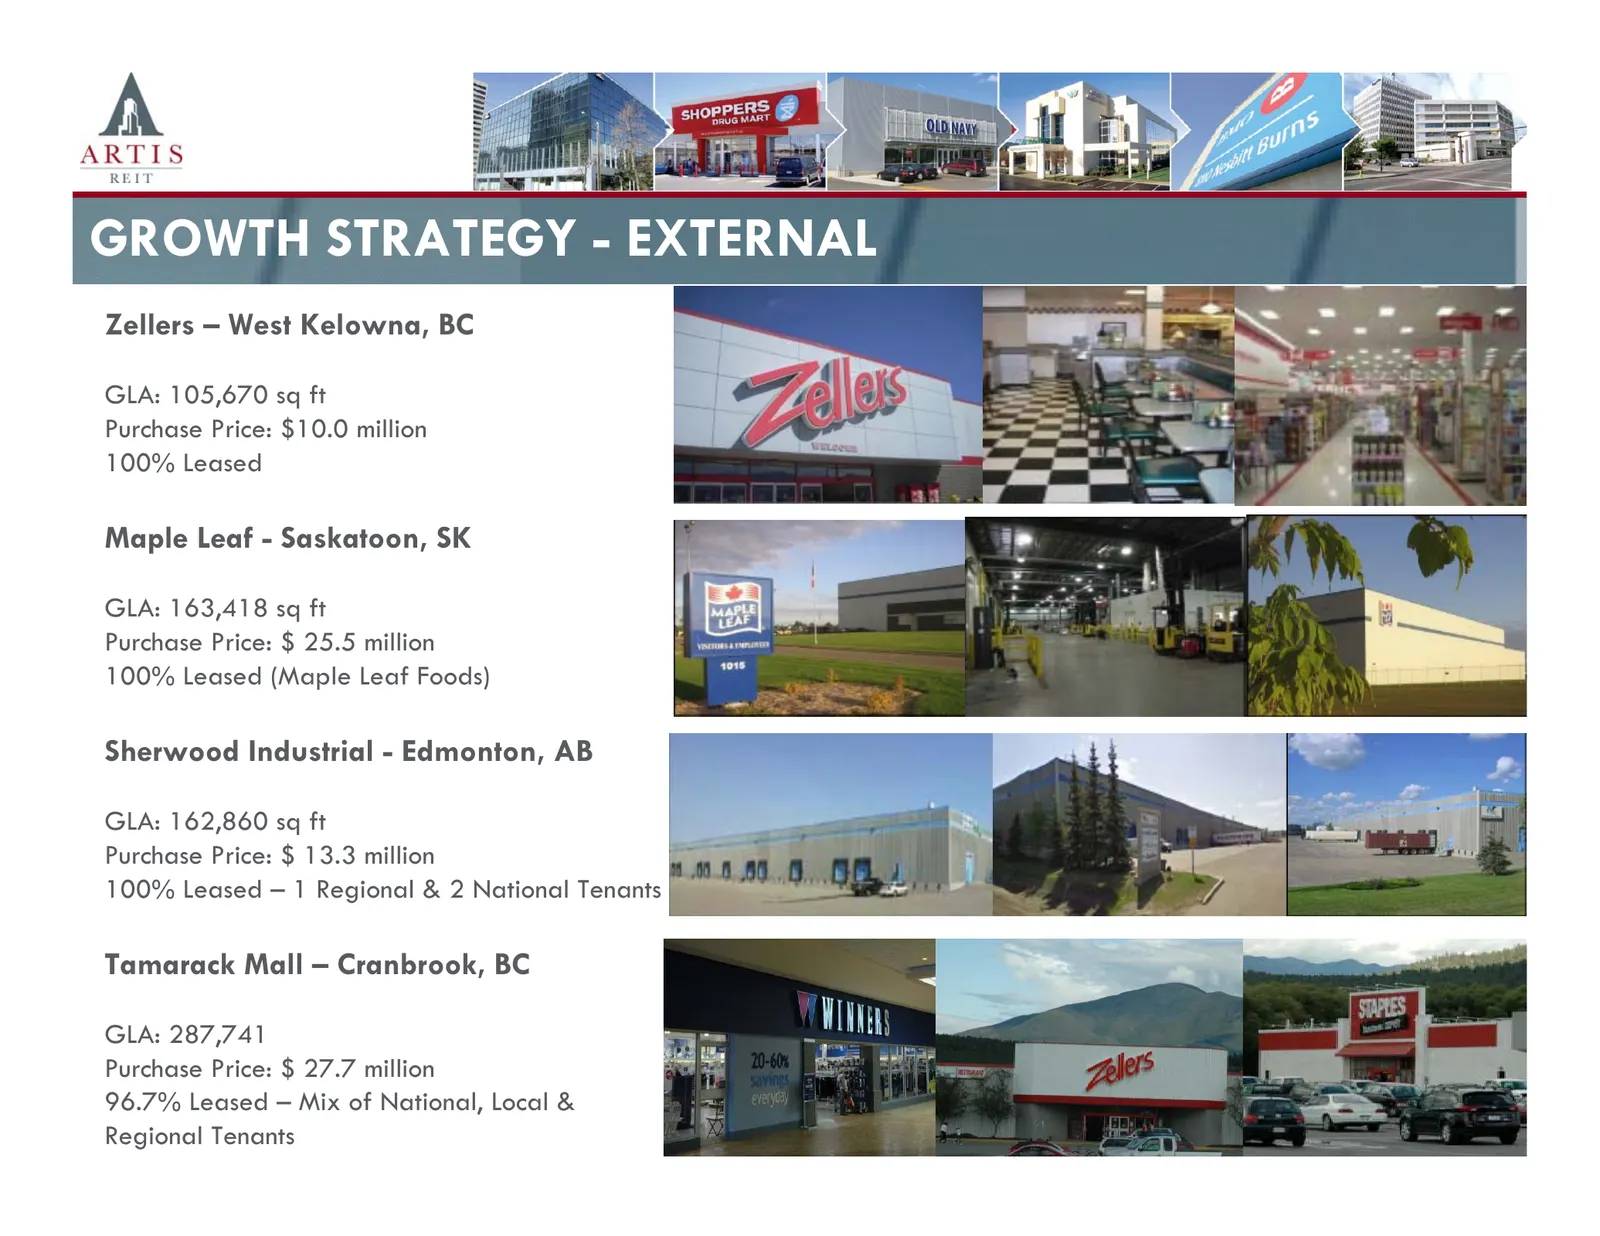
GROWTH STRATEGY - EXTERNAL Zellers – West Kelowna, BC GLA: 105,670 sq ft Purchase Price: $10.0 million 100% Leased Maple Leaf - Saskatoon, SK GLA: 163,418 sq ft Purchase Price: $ 25.5 million 100% Leased (Maple Leaf Foods) Sherwood Industrial - Edmonton, AB GLA: 162,860 sq ft Purchase Price: $ 13.3
Slide 24: Growth Strategy - External
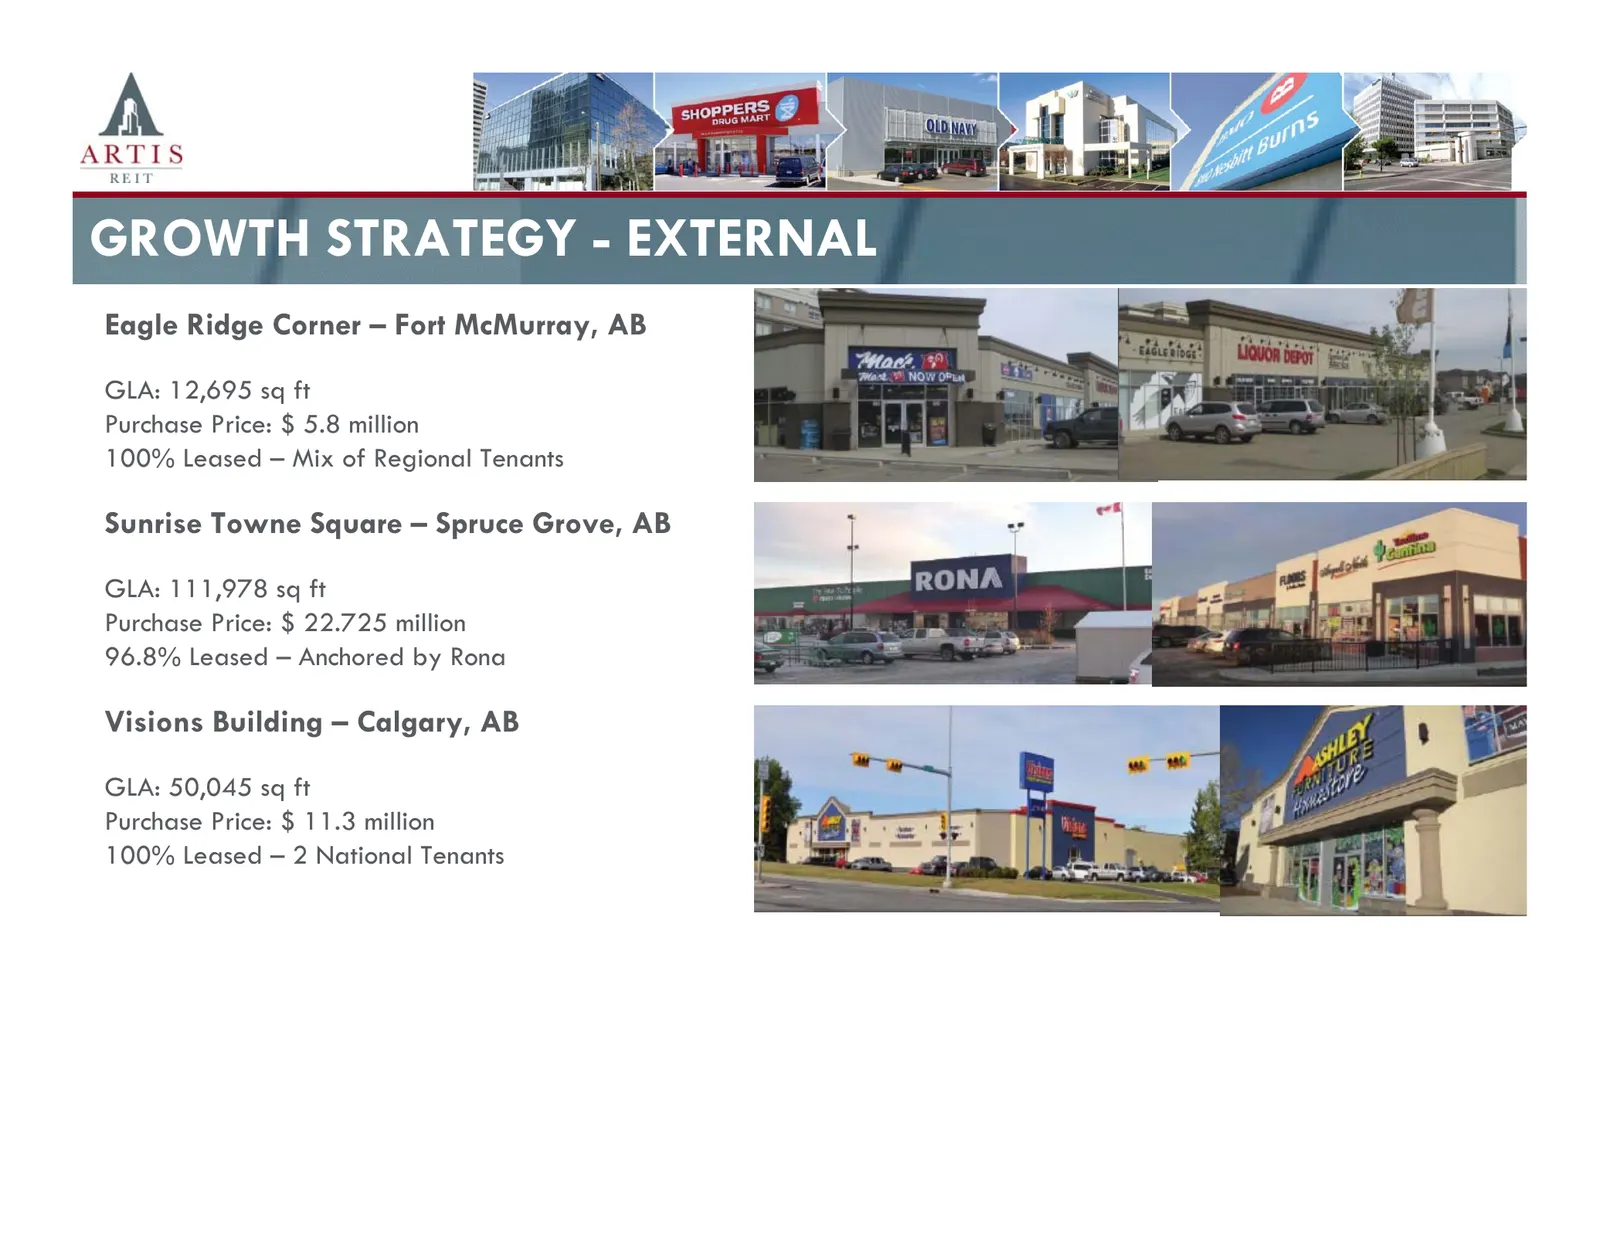
GROWTH STRATEGY - EXTERNAL Eagle Ridge Corner – Fort McMurray, AB GLA: 12,695 sq ft Purchase Price: $ 5.8 million 100% Leased – Mix of Regional Tenants Sunrise Towne Square – Spruce Grove, AB GLA: 111,978 sq ft Purchase Price: $ 22.725 million 96.8% Leased – Anchored by Rona Visions Building – Calga
Slide 25: Growth Strategy - External
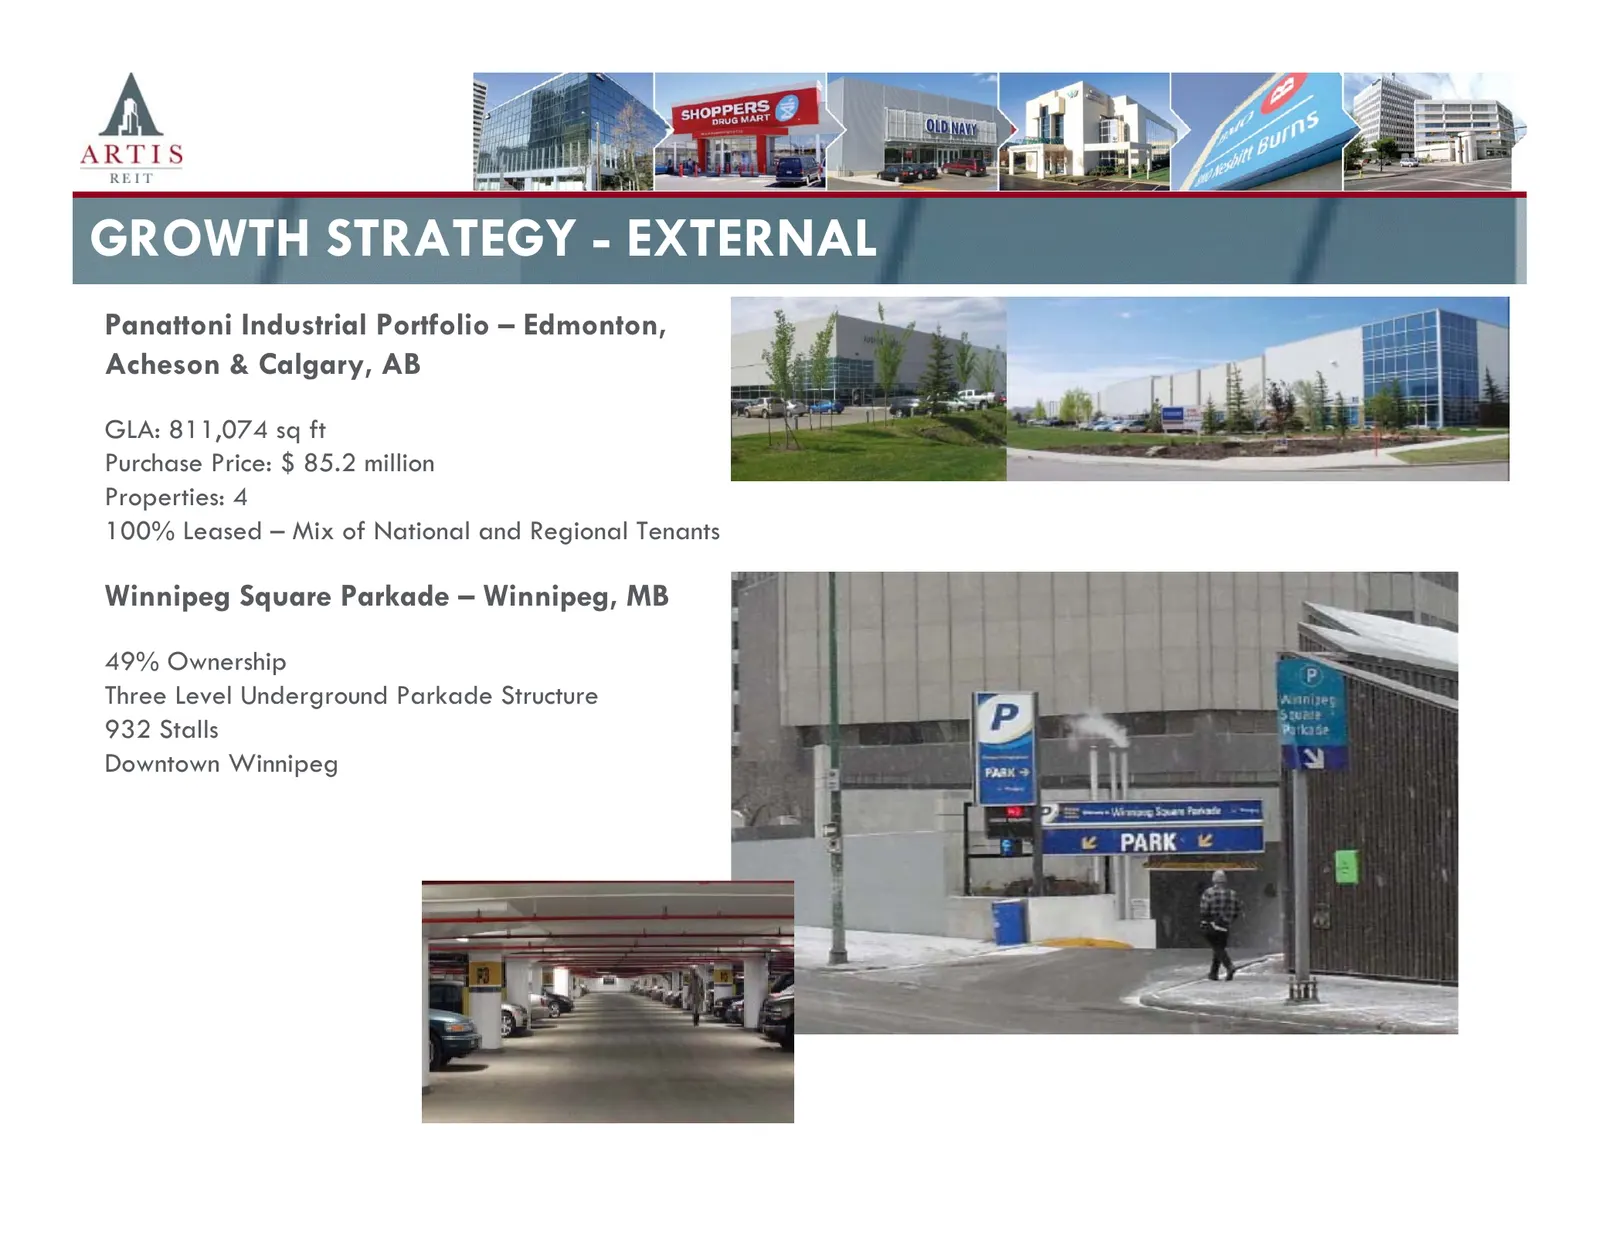
GROWTH STRATEGY - EXTERNAL Panattoni Industrial Portfolio – Edmonton, Acheson & Calgary, AB GLA: 811,074 sq ft Purchase Price: $ 85.2 million Properties: 4 100% Leased – Mix of National and Regional Tenants Winnipeg Square Parkade – Winnipeg, MB 49% Ownership Three Level Underground Parkade Structur
Slide 26: Growth Strategy - Internal
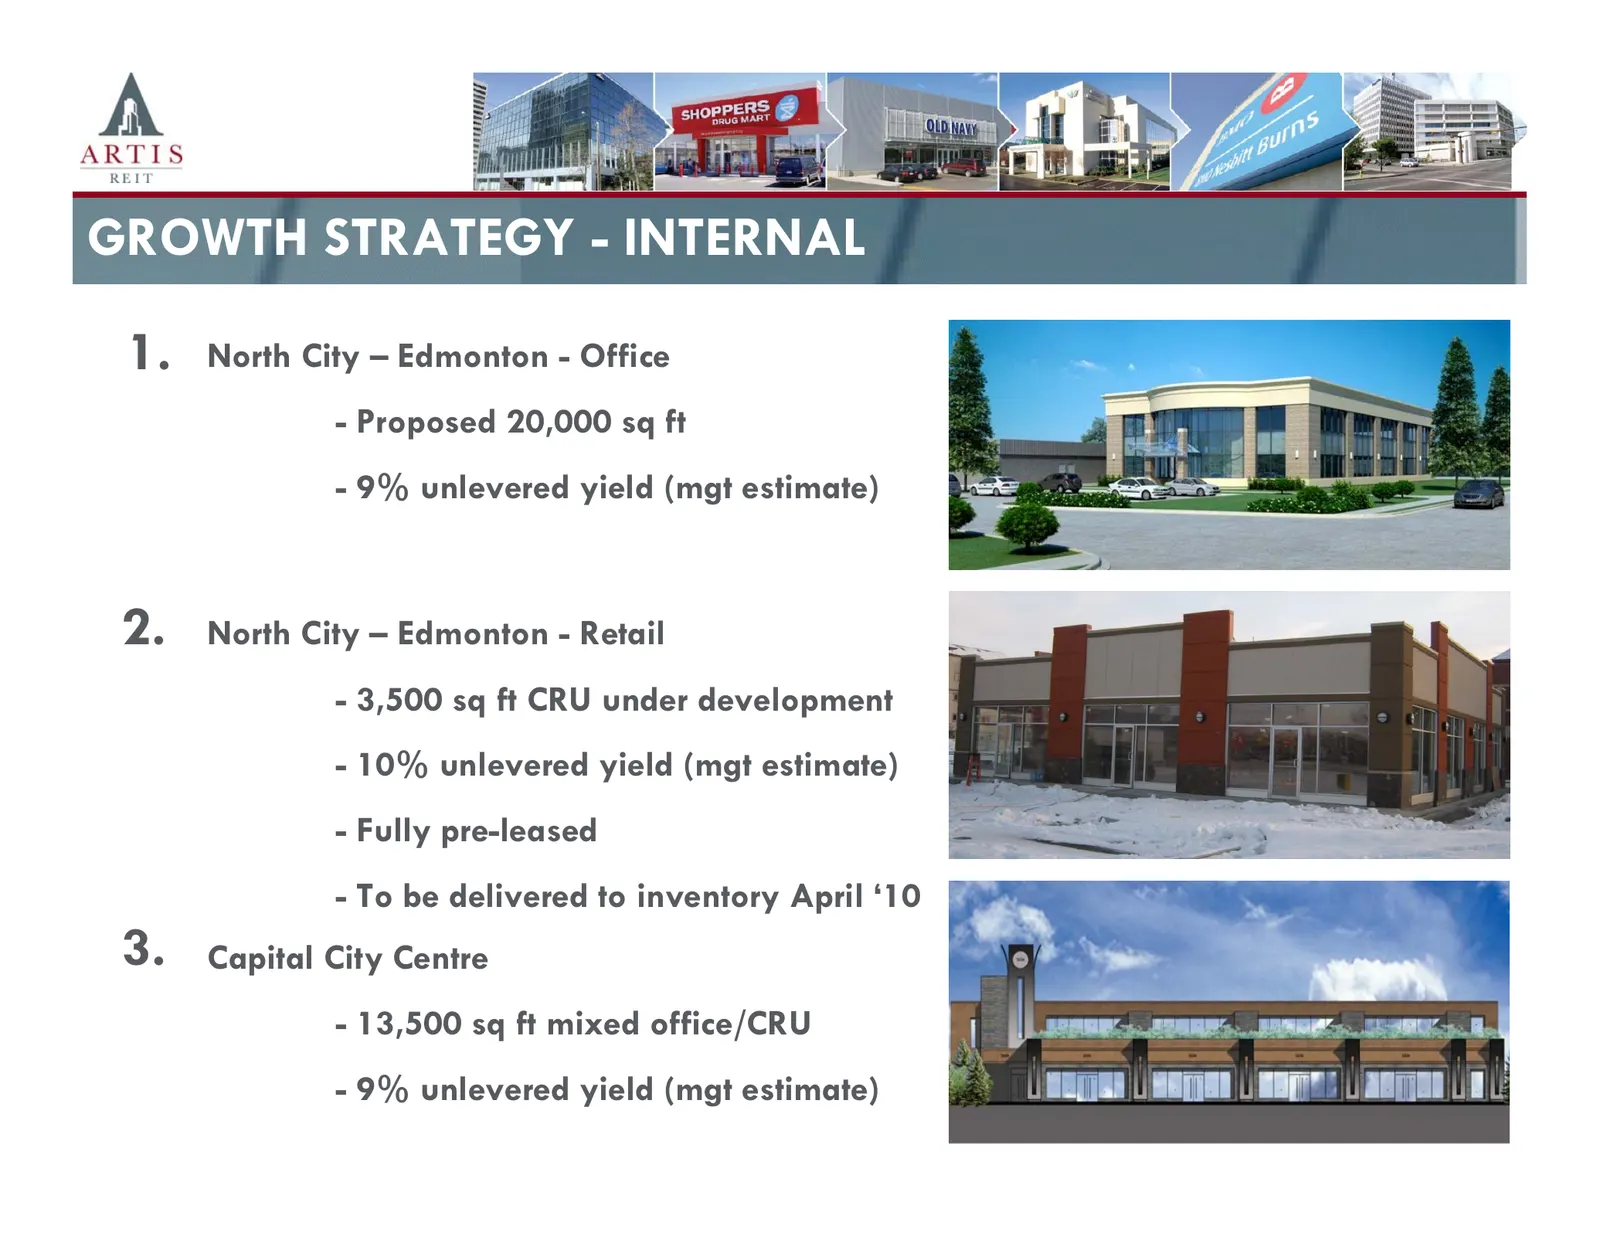
GROWTH STRATEGY - INTERNAL 1. North City – Edmonton - Office - Proposed 20,000 sq ft - 9% unlevered yield (mgt estimate) 2. North City – Edmonton - Retail - 3,500 sq ft CRU under development - 10% unlevered yield (mgt estimate) - Fully pre-leased - To be delivered to inventory April ‘10 3. Capital C
Slide 27: Growth Strategy - Internal
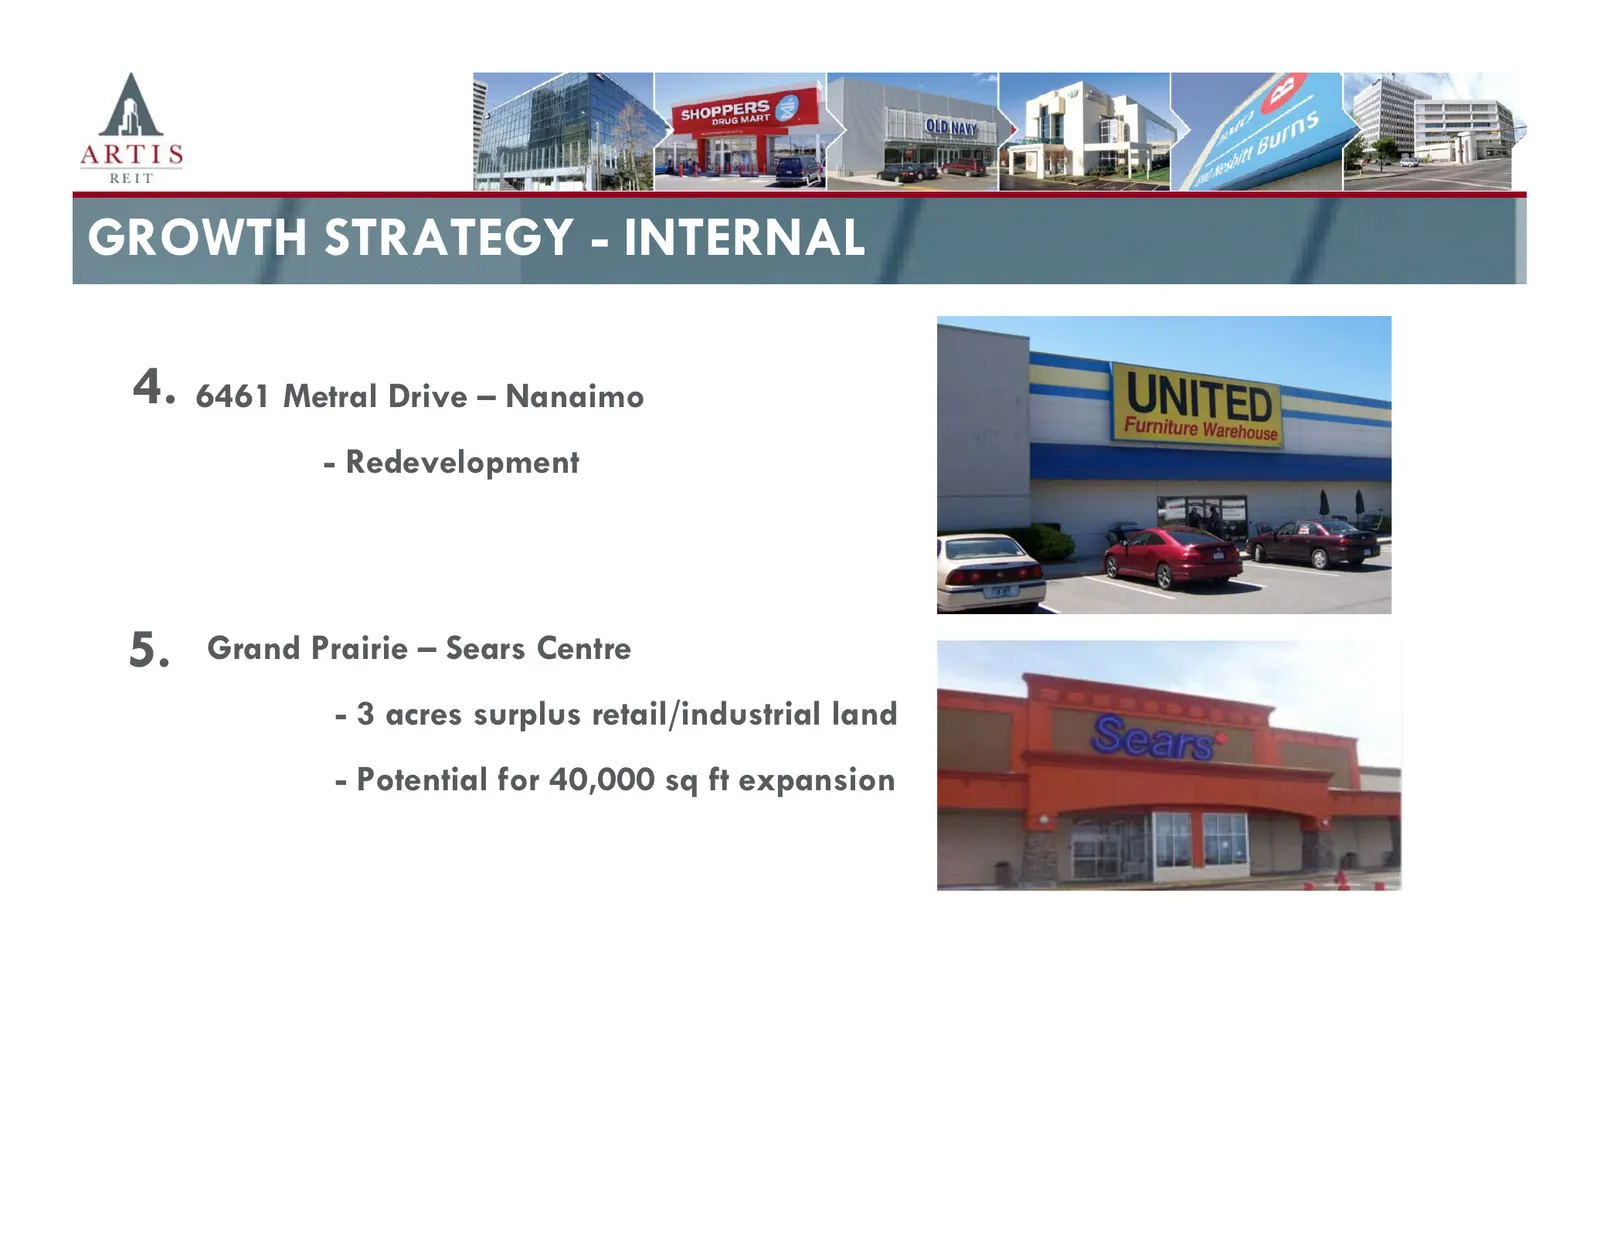
GROWTH STRATEGY - INTERNAL 4. 6461 Metral Drive – Nanaimo - Redevelopment 5. Grand Prairie – Sears Centre - 3 acres surplus retail/industrial land - Potential for 40,000 sq ft expansion 27 27
Slide 28: Growth Strategy - Internal
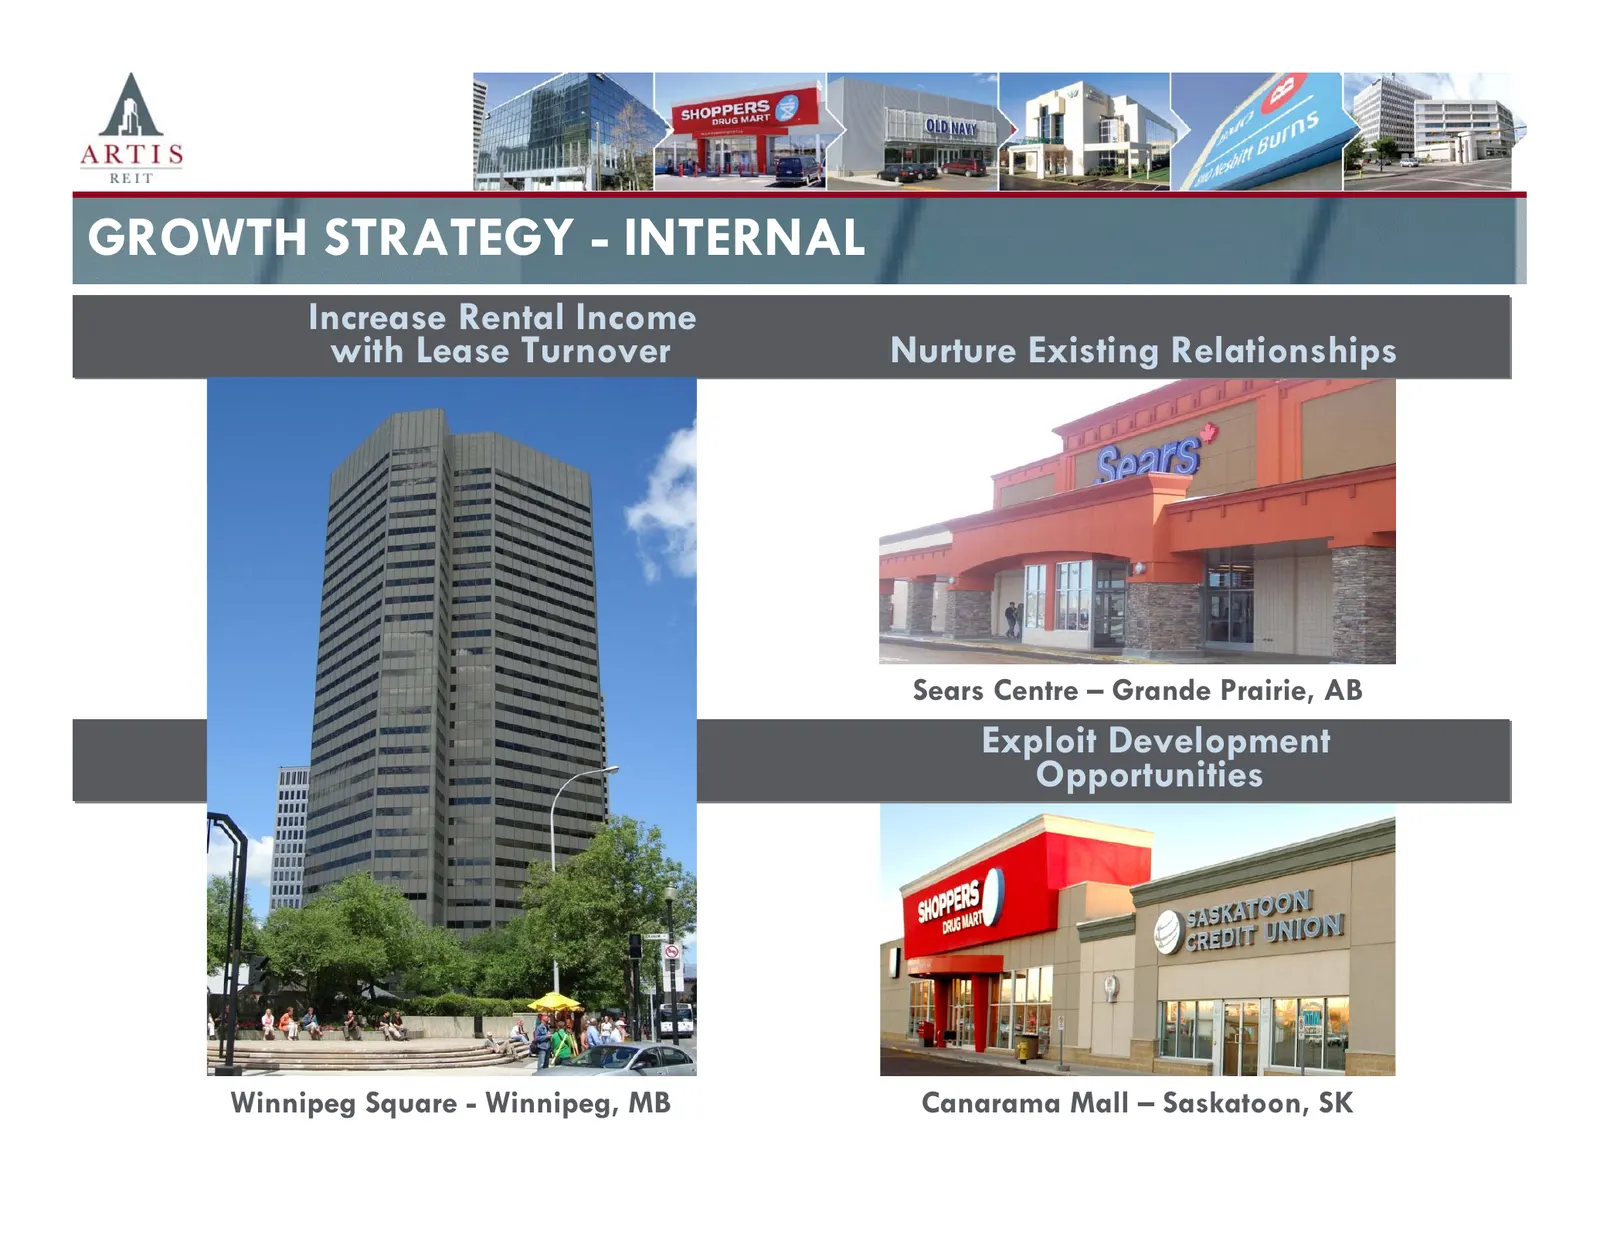
GROWTH STRATEGY - INTERNAL Increase Rental Income with Lease Turnover Nurture Existing Relationships Sears Centre – Grande Prairie, AB Exploit Development Opportunities Winnipeg Square - Winnipeg, MB Canarama Mall – Saskatoon, SK 28 28
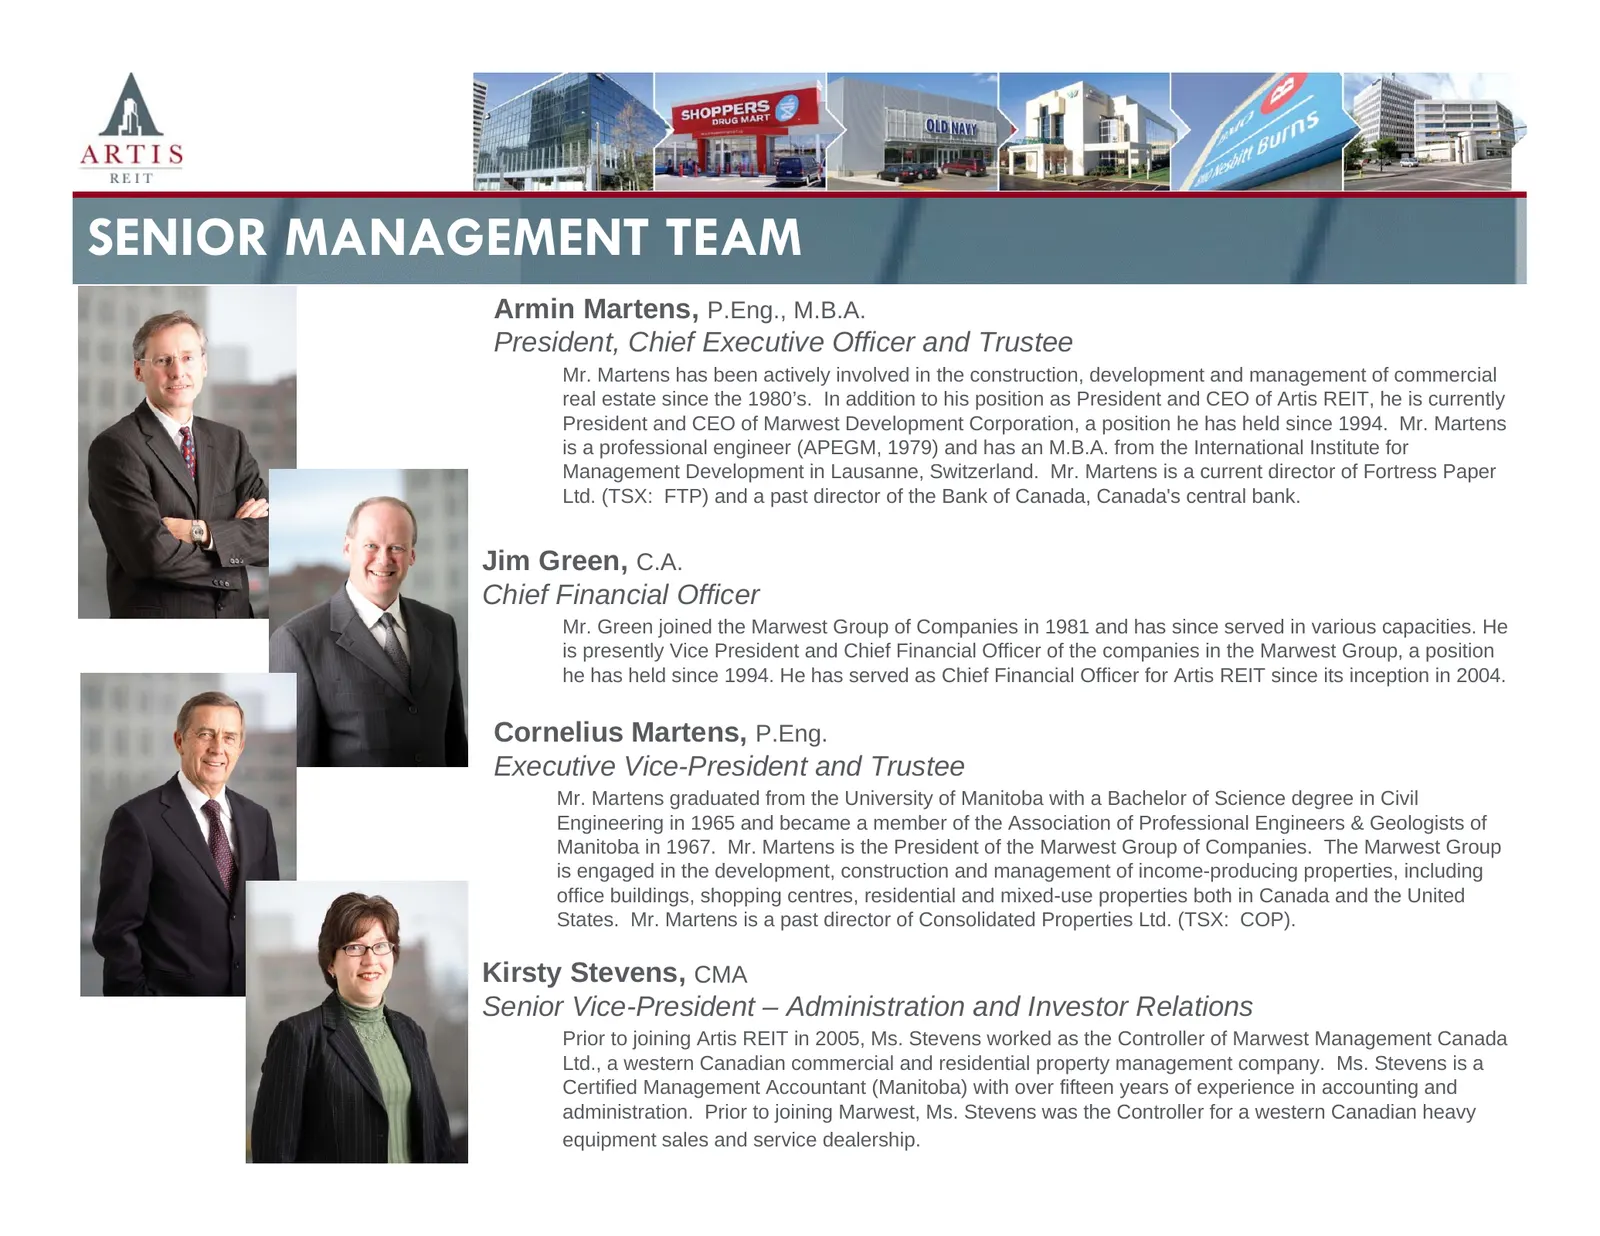
Slide 29: Senior Management Team
SENIOR MANAGEMENT TEAM Armin Martens, P.Eng., M.B.A. President, Chief Executive Officer and Trustee Mr. Martens has been actively involved in the construction, development and management of commercial real estate since the 1980’s. In addition to his position as President and CEO of Artis REIT, he is
Slide 30: Investment Highlights – Q4 2009
INVESTMENT HIGHLIGHTS – Q4 2009 • Artis REIT has an exclusively western Canadian focus • High quality commercial properties – all asset classes (Retail, Industrial, Office) • Proven management team • Consistent & reliable cash flow • Strong financial position (December 31, 2009) • Total Debt to GBV
Slide 31: Properties of Success
PROPERTIES OF SUCCESS
Source: Internet Archive copy of arwebstore.blob.core.windows.net
More decks from RFA Financial Inc.
 Q3 2026 Earnings Presentation19 slides · Nov 11, 2026
 Q2 2026 Earnings Presentation21 slides · Aug 14, 2026
 Q1 2026 Earnings Presentation28 slides · May 13, 2026
 Merger or Acquisition (September 2025)18 slides · Sep 15, 2025
 Artis Real Estate Investment Trust — Q2 2025 Earnings Presentation22 slides · Aug 7, 2025
 Artis Real Estate Investment Trust — Q1 2025 Earnings Presentation22 slides · May 8, 2025