Soltec Power Holdings SA · BME:SOL
Soltec Power Holdings SA — 9M 2022 Earnings Presentation
26 slides from Soltec Power Holdings SA's earnings presentation, Nov 15, 2022
Slide 1: 9M 2022 Financial Results
9M 2022 FINANCIAL RESULTS November 15th, 2022
Slide 2: Agenda
01 9M 2022 Key Highlights 02 Operational Indicators 03 9M 2022 Financial Results 04 Closing Remarks 05 Appendix 9M 2022 FINANCIAL RESULTS Agenda
Slide 3: 9M 2022 Key Highlights
01 9M 2022 Key Highlights
Slide 4: 9M 2022 Key Highlights
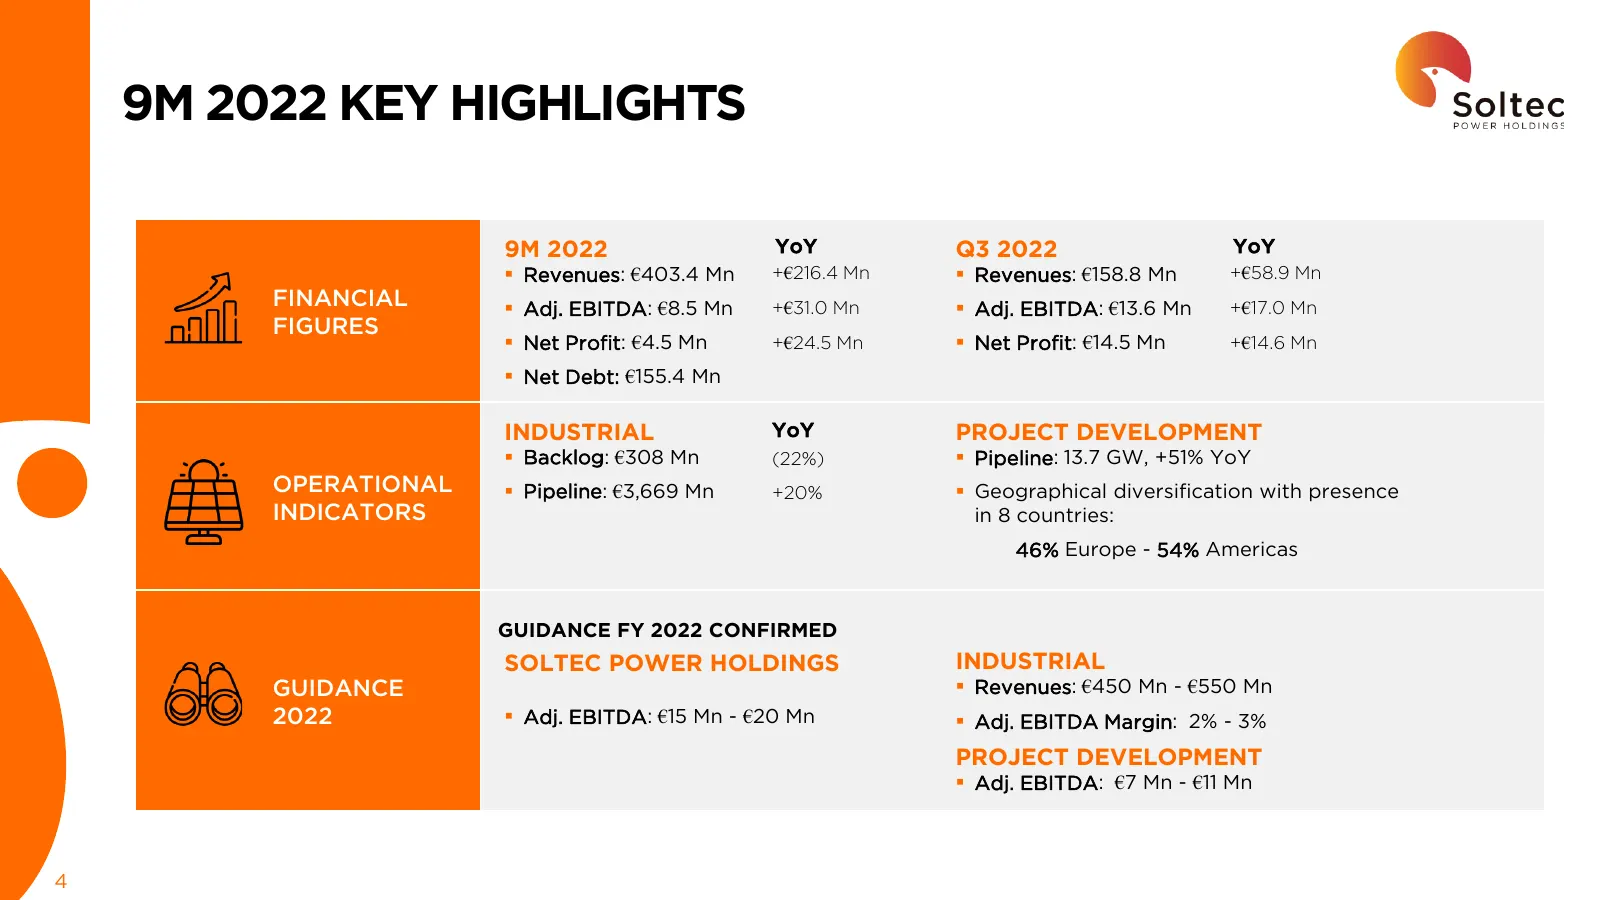
9M 2022 KEY HIGHLIGHTS 9M 2022 YoY Q3 2022 YoY ▪ Revenues: €403.4 Mn +€216.4 Mn ▪ Revenues: €158.8 Mn +€58.9 Mn FINANCIAL ▪ Adj. EBITDA: €8.5 Mn +€31.0 Mn ▪ Adj. EBITDA: €13.6 Mn +€17.0 Mn FIGURES ▪ Net Profit: €4.5 Mn +€24.5 Mn ▪ Net Profit: €14.5 Mn +€14.6 Mn ▪ Net Debt: €155.4 Mn INDUSTRIAL YoY P
Slide 5: Guidance 2022
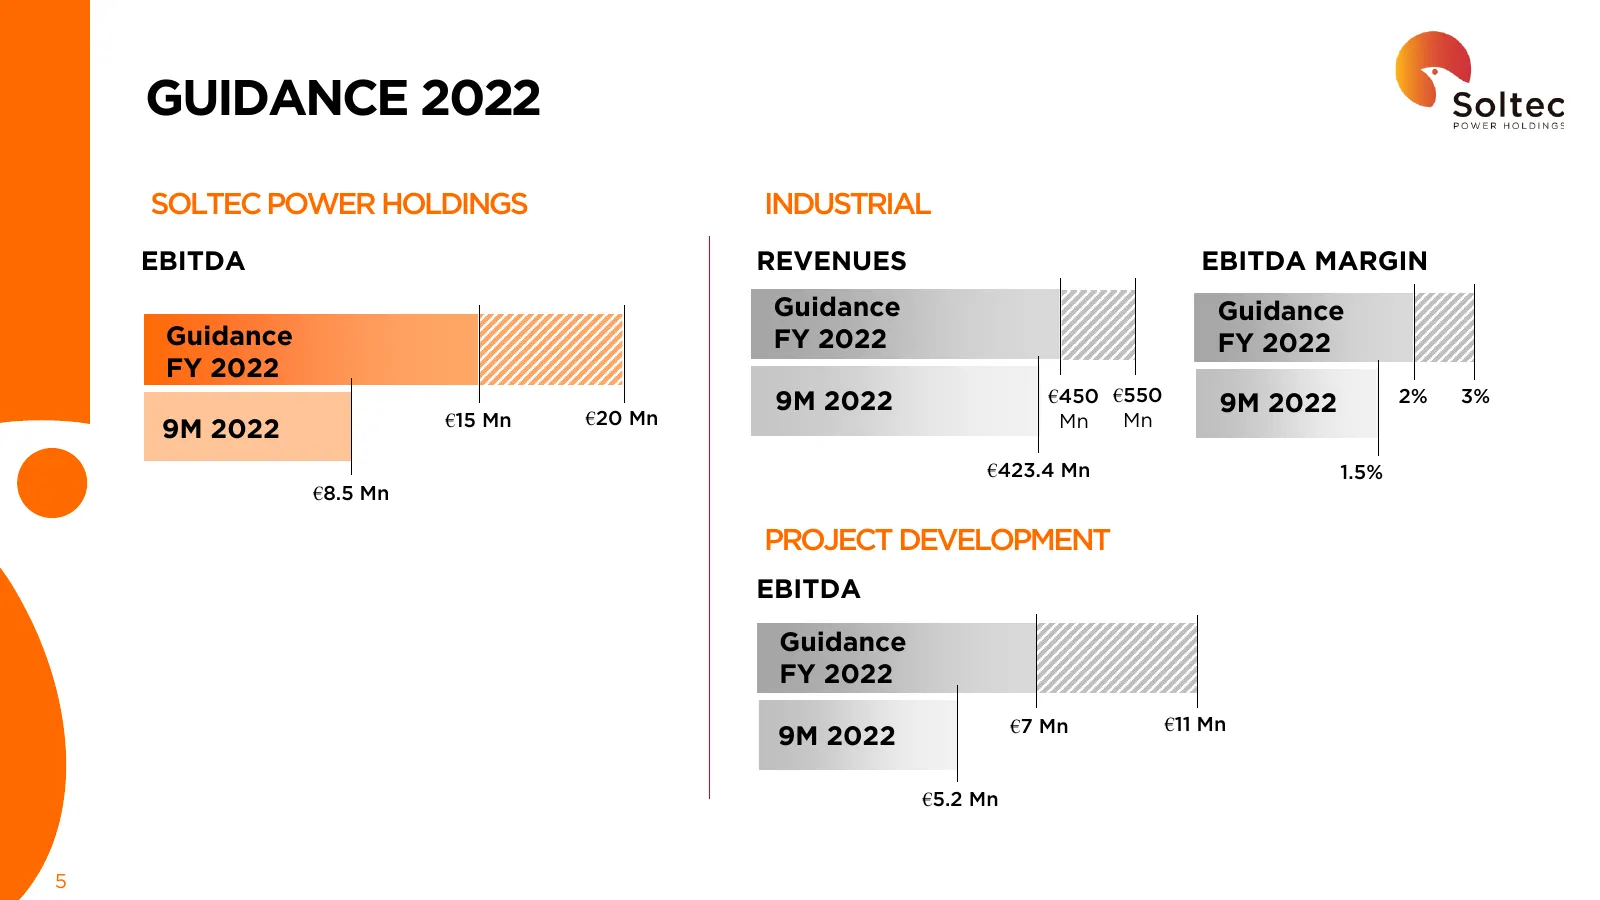
GUIDANCE 2022 SOLTEC POWER HOLDINGS INDUSTRIAL EBITDA REVENUES EBITDA MARGIN Guidance Guidance Guidance FY 2022 FY 2022 FY 2022 9M 2022 €450 €550 9M 2022 2% 3% €15 Mn €20 Mn Mn Mn 9M 2022 €423.4 Mn 1.5% €8.5 Mn PROJECT DEVELOPMENT EBITDA Guidance FY 2022 €7 Mn €11 Mn 9M 2022 €5.2 Mn 5
Slide 6: Operational Indicators
02 Operational Indicators
Slide 7: Track Record
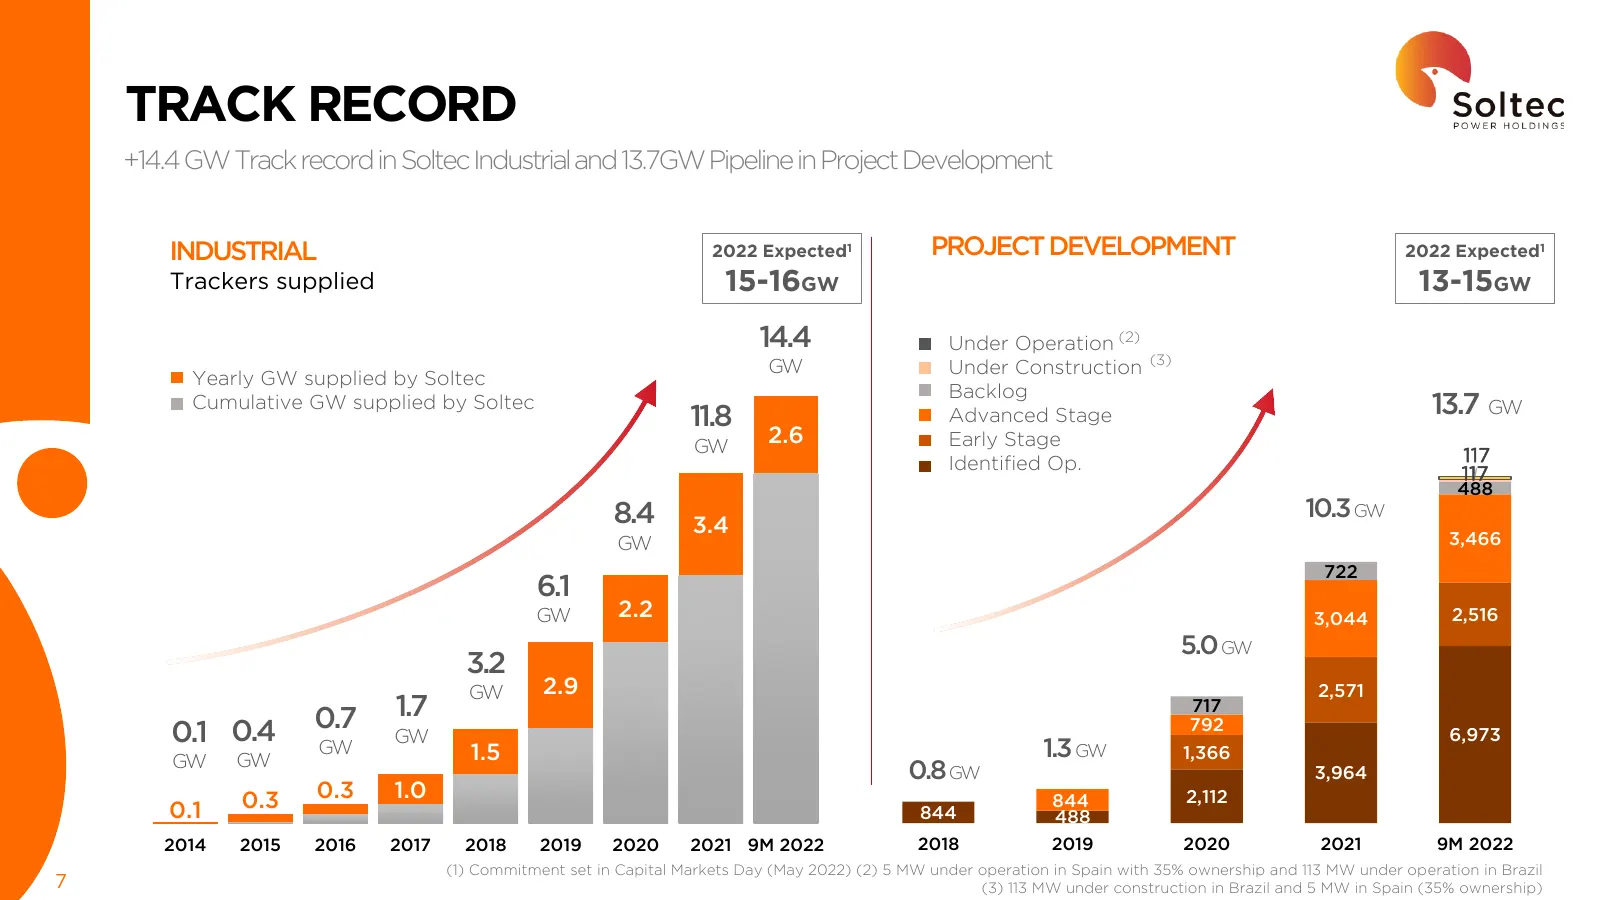
TRACK RECORD +14.4 GW Track record in Soltec Industrial and 13.7GW Pipeline in Project Development INDUSTRIAL 2022 Expected1 PROJECT DEVELOPMENT 2022 Expected1 Trackers supplied 15-16GW 13-15GW 14.4 Under Operation (2) GW Under Construction (3) Yearly GW supplied by Soltec Backlog Cumulative GW supp
Slide 8: Operational Indicators Soltec Industrial
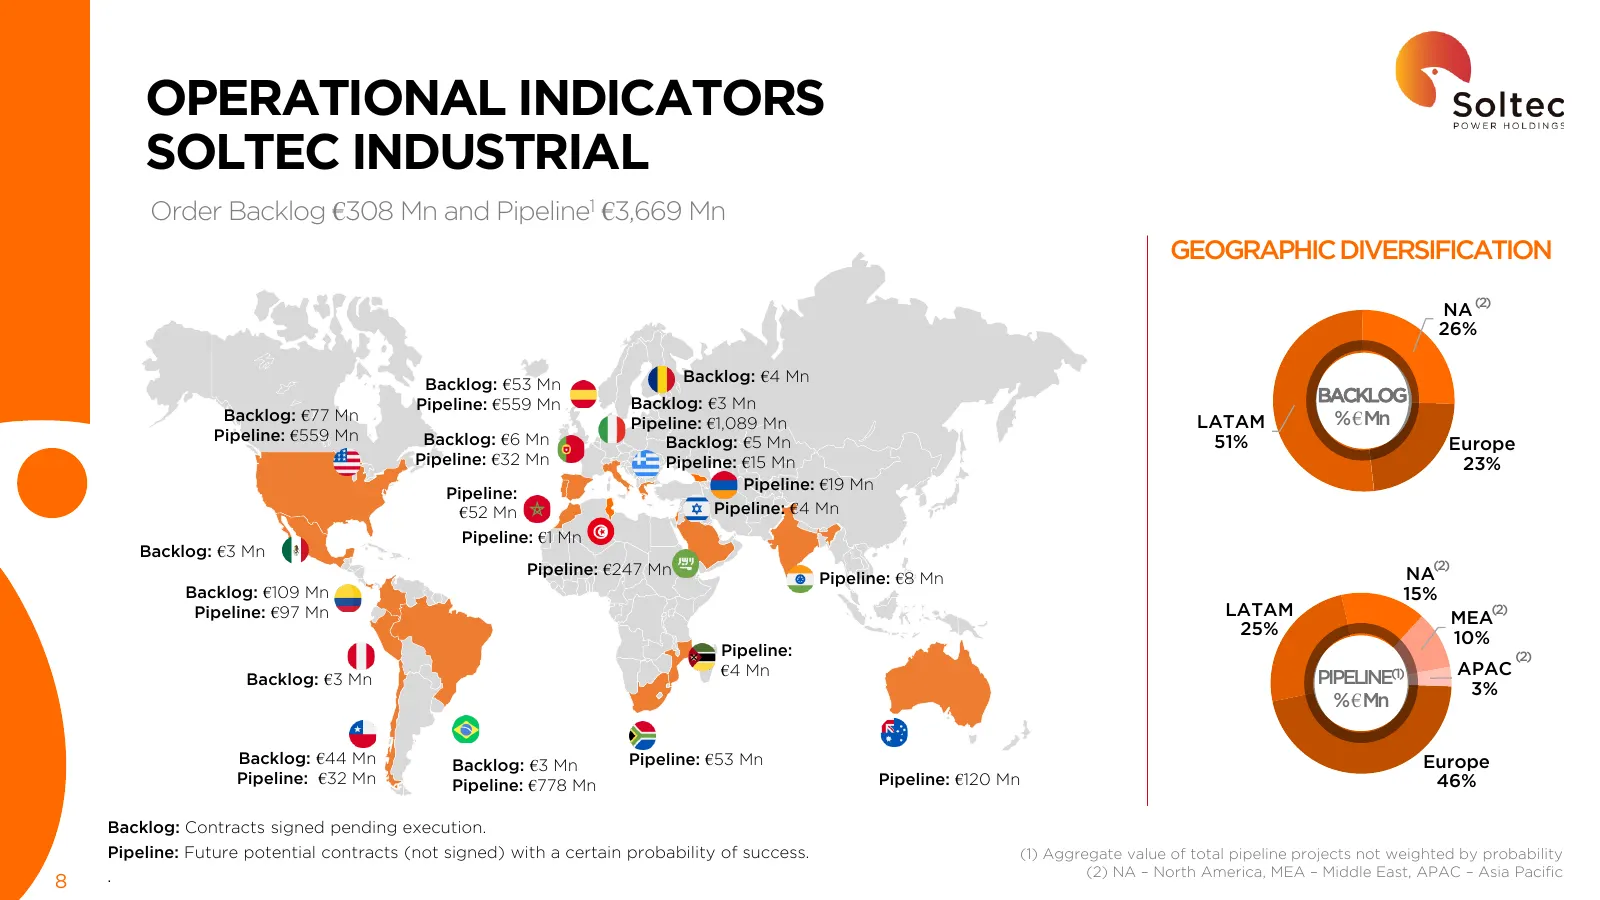
OPERATIONAL INDICATORS SOLTEC INDUSTRIAL Order Backlog €308 Mn and Pipeline1 €3,669 Mn GEOGRAPHIC DIVERSIFICATION NA (2) 26% Backlog: €53 Mn Backlog: €4 Mn Pipeline: €559 Mn Backlog: €3 Mn BACKLOG Backlog: €77 Mn Pipeline: €1,089 Mn LATAM % €Mn Pipeline: €559 Mn Backlog: €6 Mn Backlog: €5 Mn 51% Eur
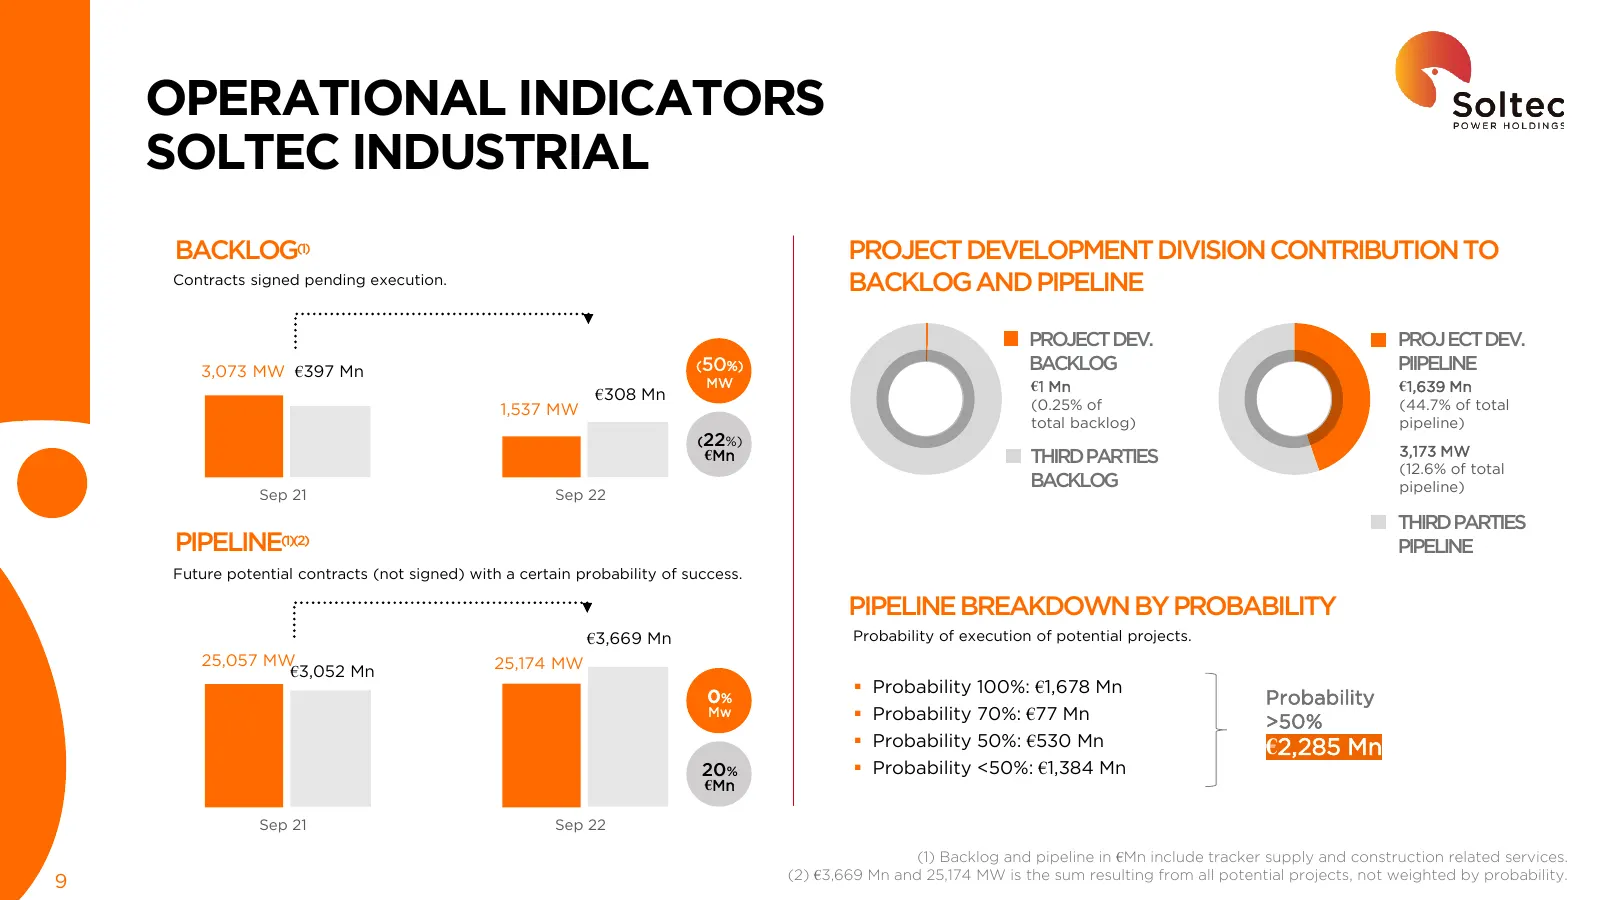
Slide 9: Operational Indicators Soltec Industrial
OPERATIONAL INDICATORS SOLTEC INDUSTRIAL BACKLOG(1) PROJECT DEVELOPMENT DIVISION CONTRIBUTION TO Contracts signed pending execution. BACKLOG AND PIPELINE PROJECT DEV. PROJ ECT DEV. 3,073 MW €397 Mn (50%) BACKLOG PIIPELINE MW €1 Mn €1,639 Mn €308 Mn 1,537 MW (0.25% of (44.7% of total total backlog) p
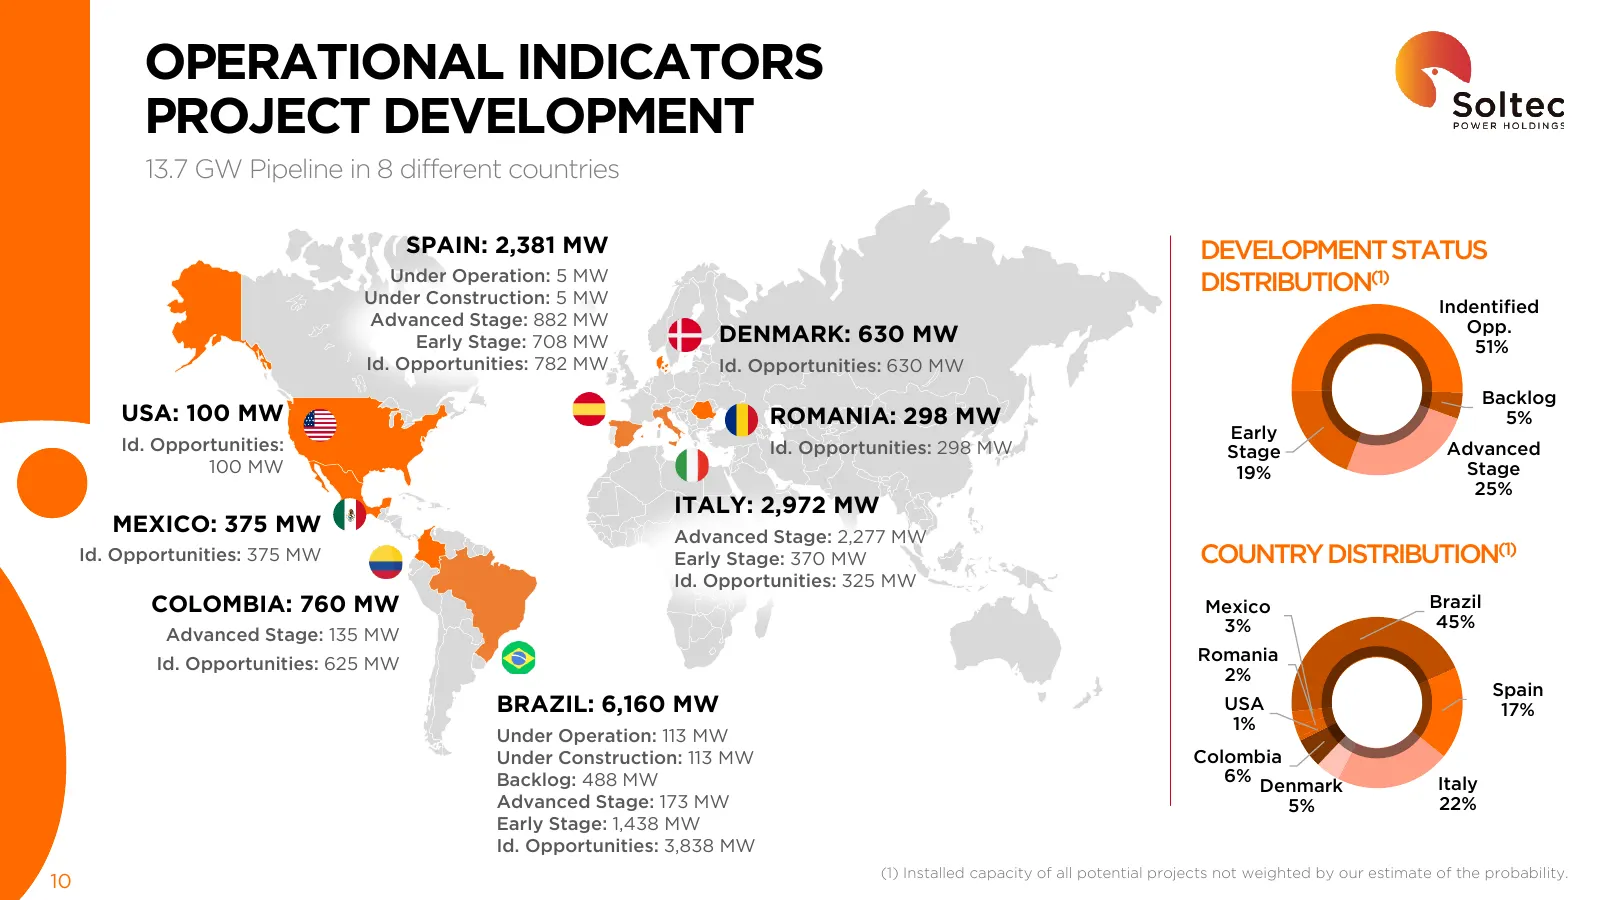
Slide 10: Operational Indicators Project Development
OPERATIONAL INDICATORS PROJECT DEVELOPMENT 13.7 GW Pipeline in 8 different countries SPAIN: 2,381 MW DEVELOPMENT STATUS Under Operation: 5 MW DISTRIBUTION(1) Under Construction: 5 MW Indentified Advanced Stage: 882 MW Opp. Early Stage: 708 MW DENMARK: 630 MW 51% Id. Opportunities: 782 MW Id. Opportu
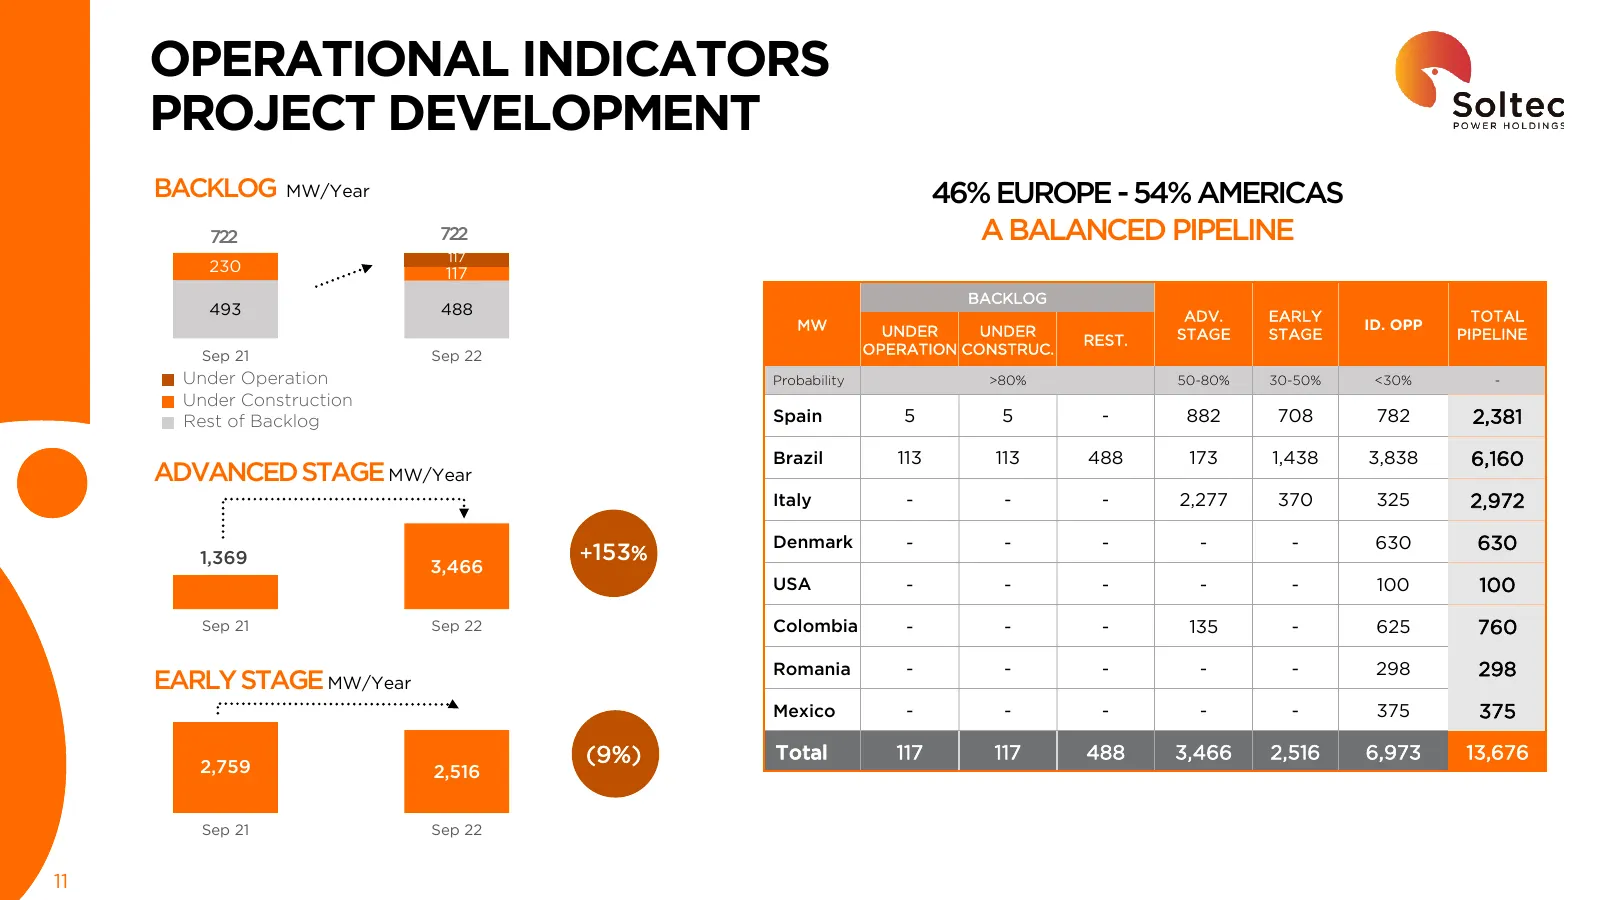
Slide 11: Operational Indicators Project Development
OPERATIONAL INDICATORS PROJECT DEVELOPMENT BACKLOG MW/Year 46% EUROPE - 54% AMERICAS 722 722 A BALANCED PIPELINE 117 230 117 BACKLOG 493 488 ADV. EARLY TOTAL MW UNDER UNDER ID. OPP REST. STAGE STAGE PIPELINE… Sep 21 Sep 22 OPERATION CONSTRUC. Under Operation Probability >80% 50-80% 30-50% <30% - Und
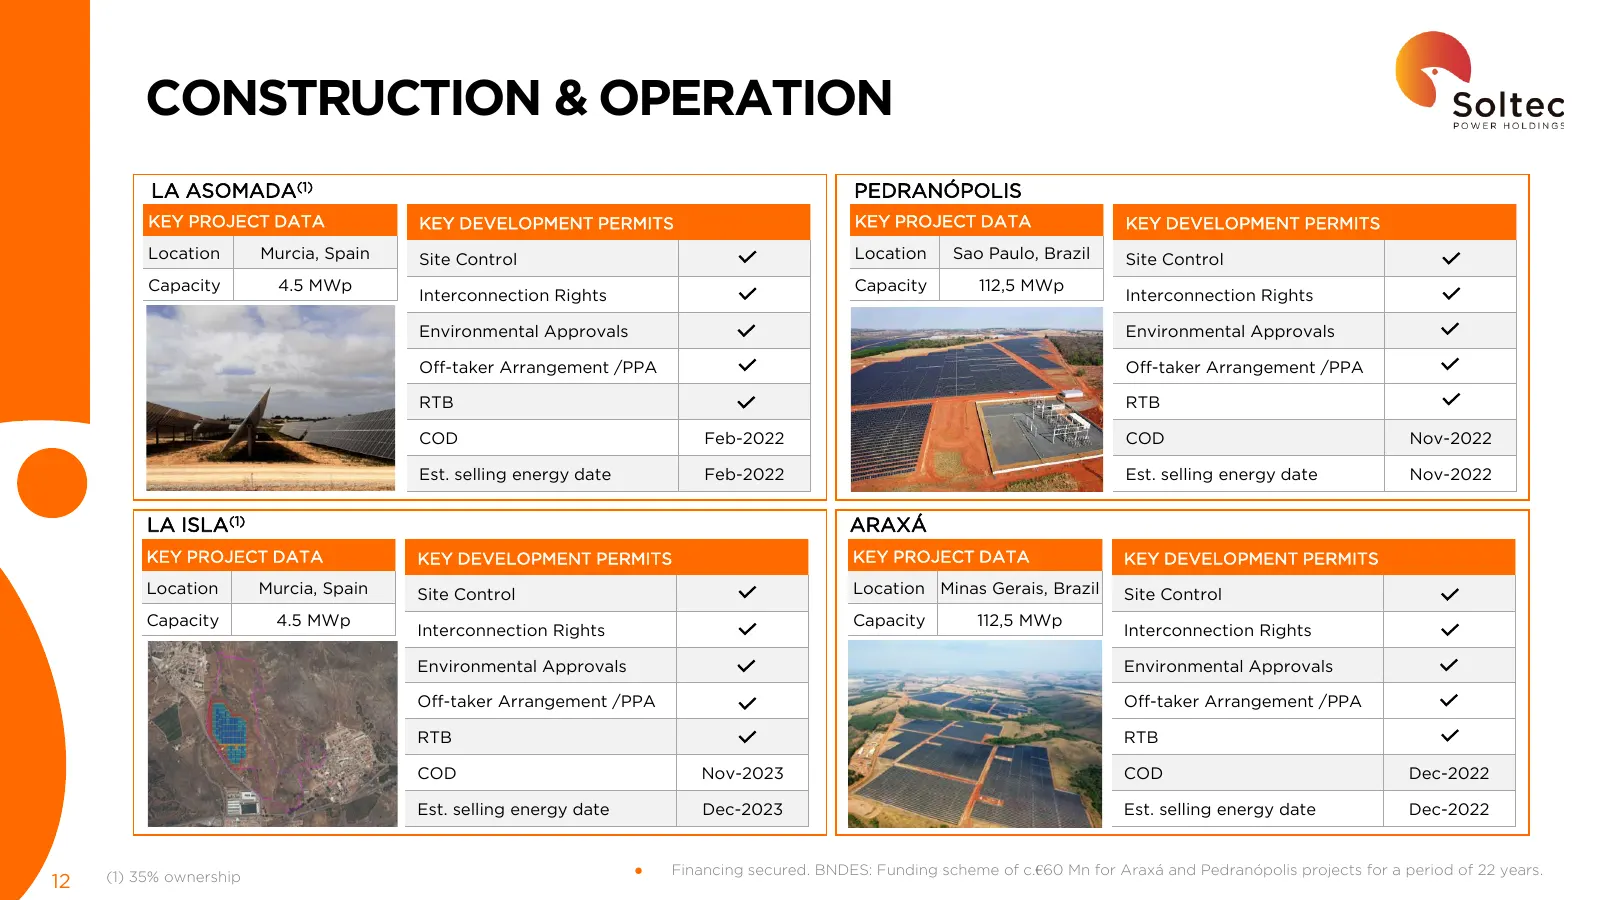
Slide 12: Construction & Operation
CONSTRUCTION & OPERATION LA ASOMADA(1) PEDRANÓPOLIS KEY PROJECT DATA KEY DEVELOPMENT PERMITS KEY PROJECT DATA KEY DEVELOPMENT PERMITS Location Murcia, Spain Site Control Location Sao Paulo, Brazil Site Control Capacity 4.5 MWp Capacity 112,5 MWp Interconnection Rights Interconnection Rights Environm
Slide 13: 9M 2022 Financial Results
03 9M 2022 Financial Results
Slide 14: Soltec Power Holdings 9M 2022 & Q3 2022 Results
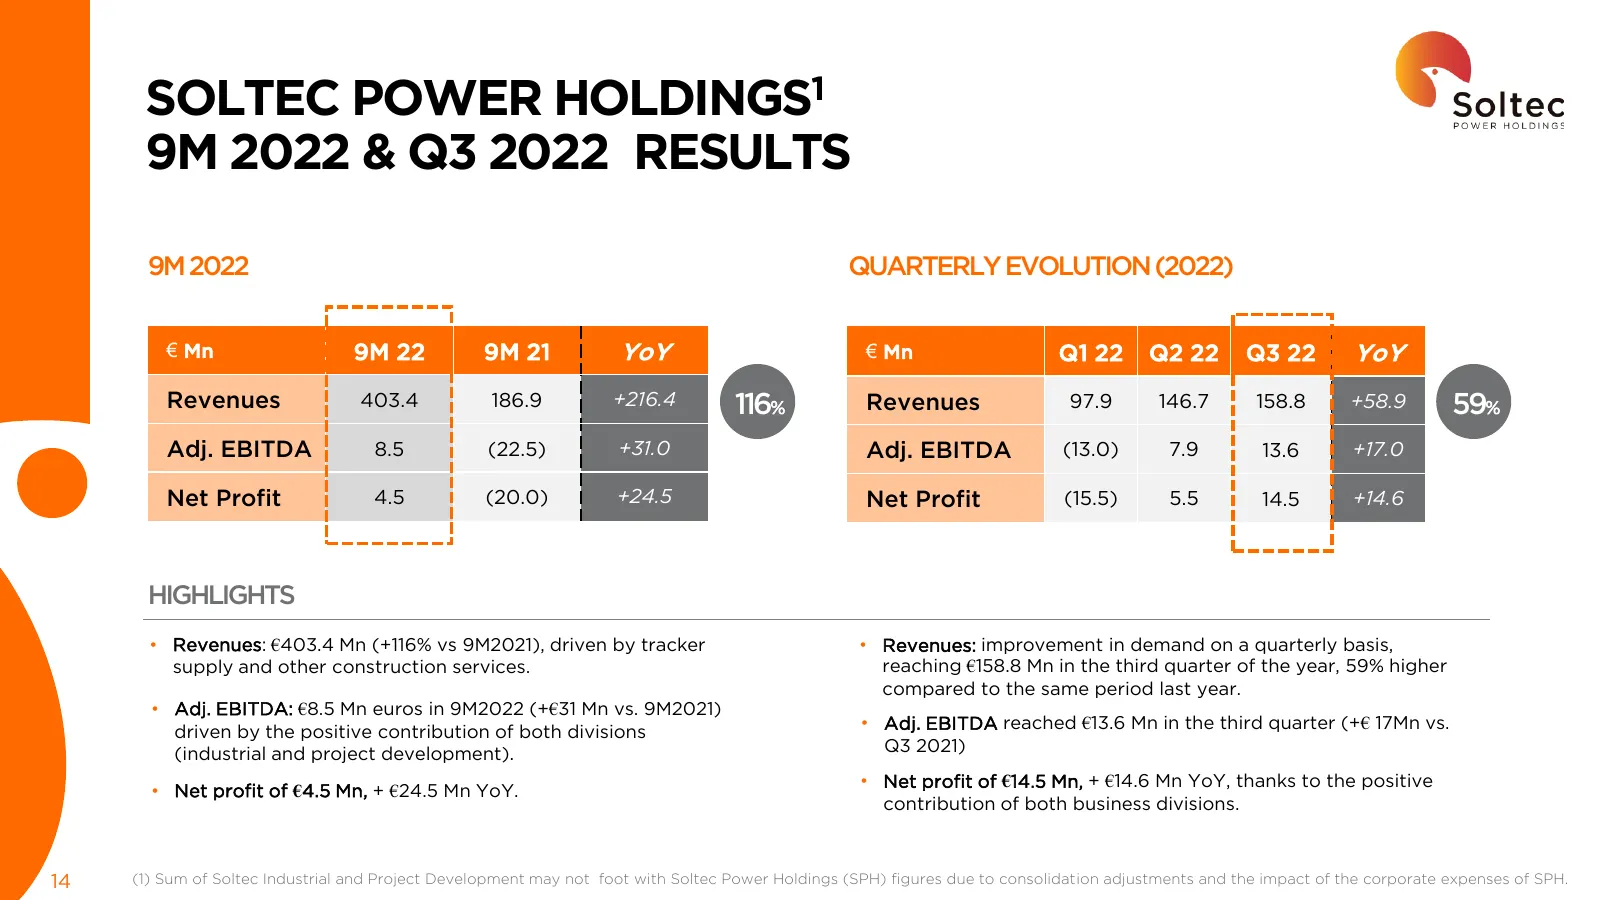
SOLTEC POWER HOLDINGS1 9M 2022 & Q3 2022 RESULTS 9M 2022 QUARTERLY EVOLUTION (2022) € Mn 9M 22 9M 21 YoY € Mn Q1 22 Q2 22 Q3 22 YoY Revenues 403.4 186.9 +216.4 116% Revenues 97.9 146.7 158.8 +58.9 59% Adj. EBITDA 8.5 (22.5) +31.0 Adj. EBITDA (13.0) 7.9 13.6 +17.0 Net Profit 4.5 (20.0) +24.5 Net Prof
Slide 15: Soltec Industrial 9M 2022 & Q3 2022 Results
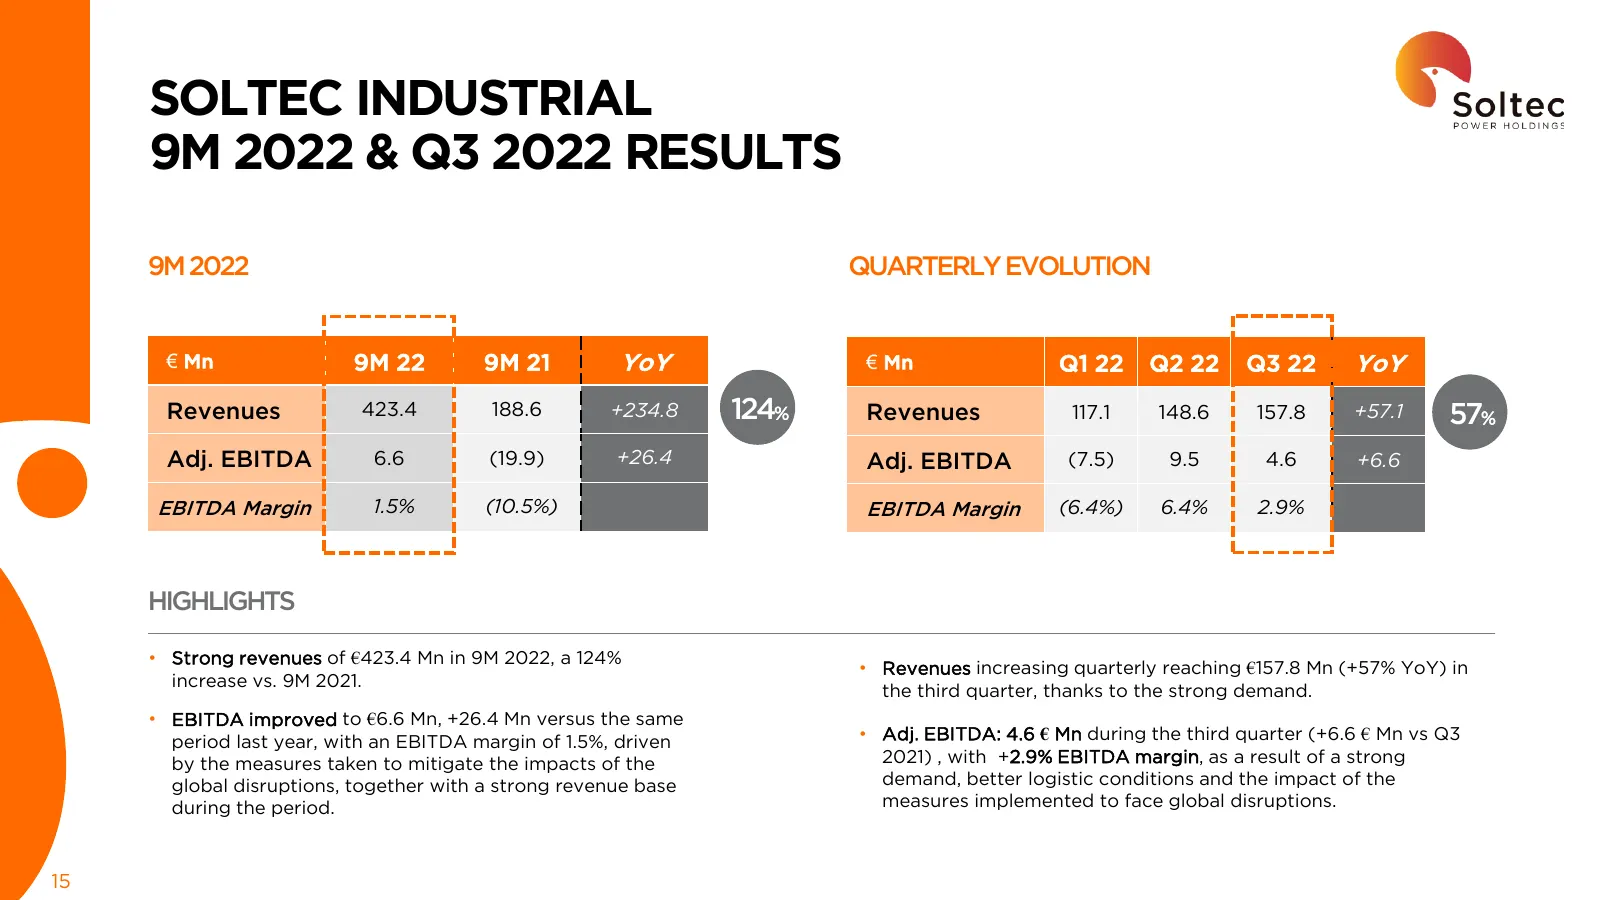
SOLTEC INDUSTRIAL 9M 2022 & Q3 2022 RESULTS 9M 2022 QUARTERLY EVOLUTION € Mn 9M 22 9M 21 YoY € Mn Q1 22 Q2 22 Q3 22 YoY Revenues 423.4 188.6 +234.8 124% Revenues 117.1 148.6 157.8 +57.1 57% Adj. EBITDA 6.6 (19.9) +26.4 Adj. EBITDA (7.5) 9.5 4.6 +6.6 EBITDA Margin 1.5% (10.5%) EBITDA Margin (6.4%) 6.
Slide 16: Soltec Industrial Revenue & EBITDA Margins
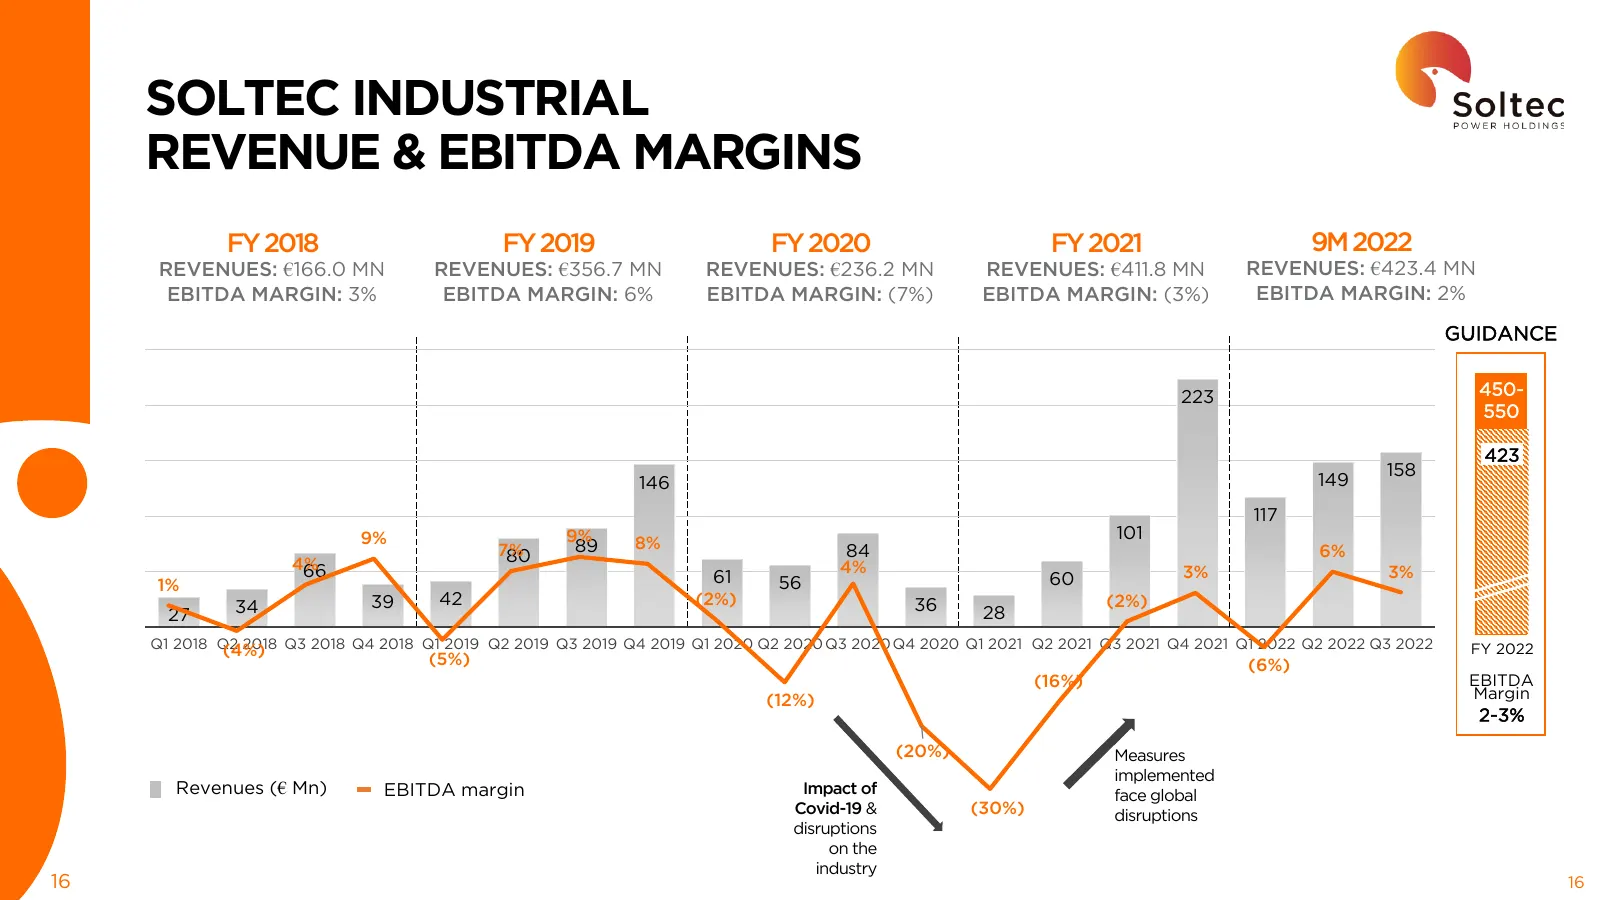
SOLTEC INDUSTRIAL REVENUE & EBITDA MARGINS FY 2018 FY 2019 FY 2020 FY 2021 9M 2022 REVENUES: €166.0 MN REVENUES: €356.7 MN REVENUES: €236.2 MN REVENUES: €411.8 MN REVENUES: €423.4 MN EBITDA MARGIN: 3% EBITDA MARGIN: 6% EBITDA MARGIN: (7%) EBITDA MARGIN: (3%) EBITDA MARGIN: 2% GUIDANCE 223 450- 550 4
Slide 17: Soltec Industrial 9M 2022 Revenues
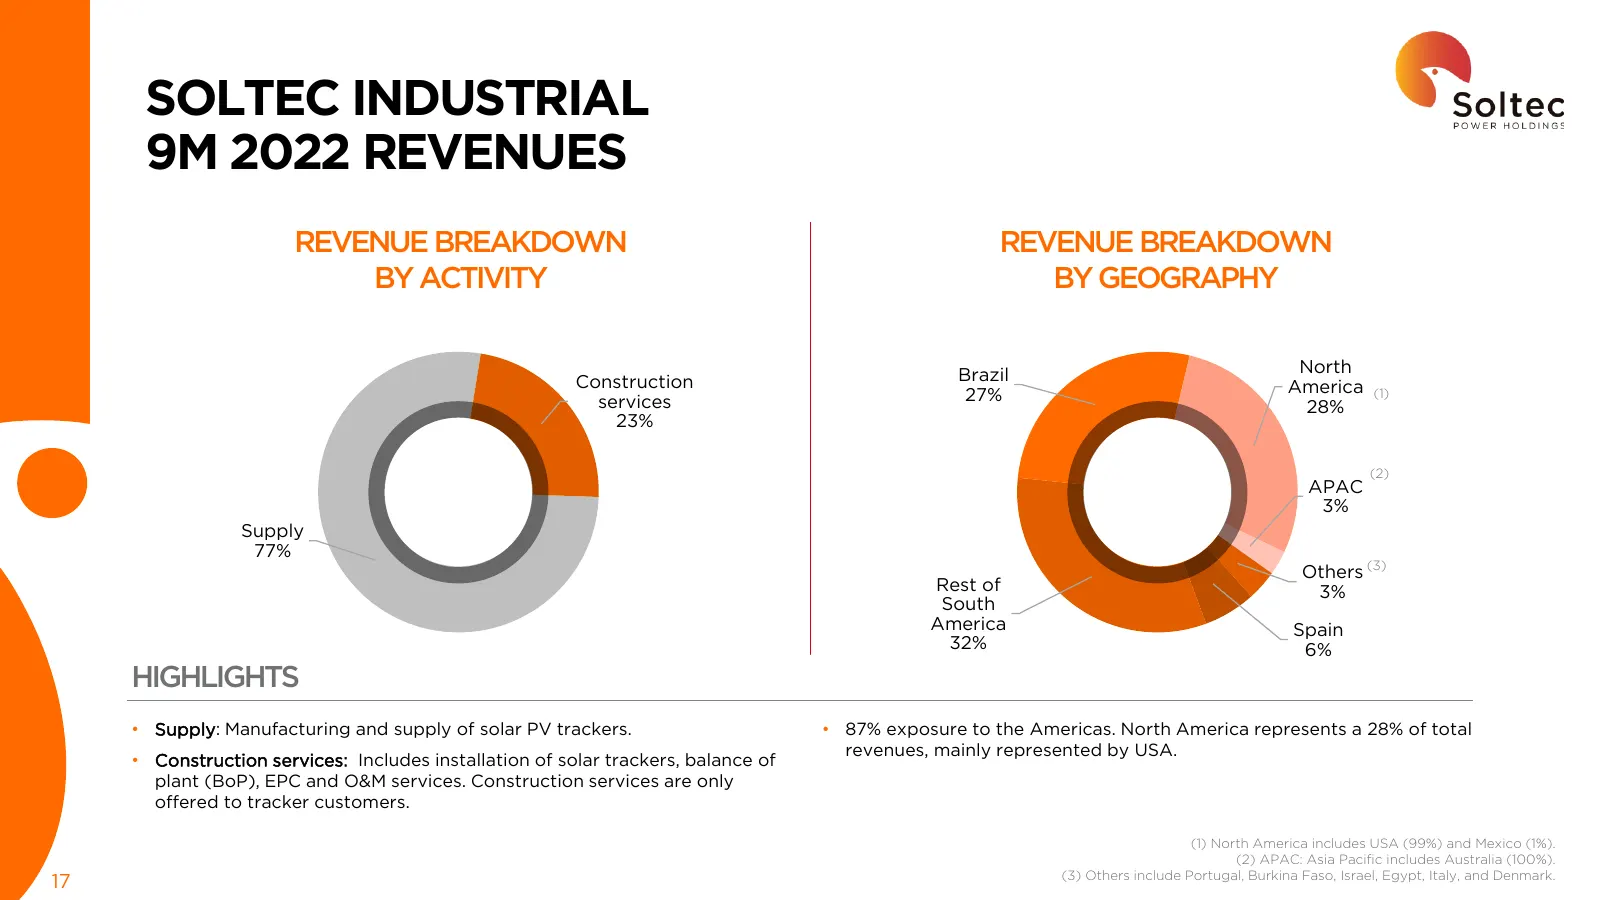
SOLTEC INDUSTRIAL 9M 2022 REVENUES REVENUE BREAKDOWN REVENUE BREAKDOWN BY ACTIVITY BY GEOGRAPHY Brazil North Construction America (1) services 27% 28% 23% (2) APAC 3% Supply 77% Others (3) Rest of 3% South America Spain 32% 6% HIGHLIGHTS • Supply: Manufacturing and supply of solar PV trackers. • 87%
Slide 18: Project Development 9M 2022 & Q3 2022 Results
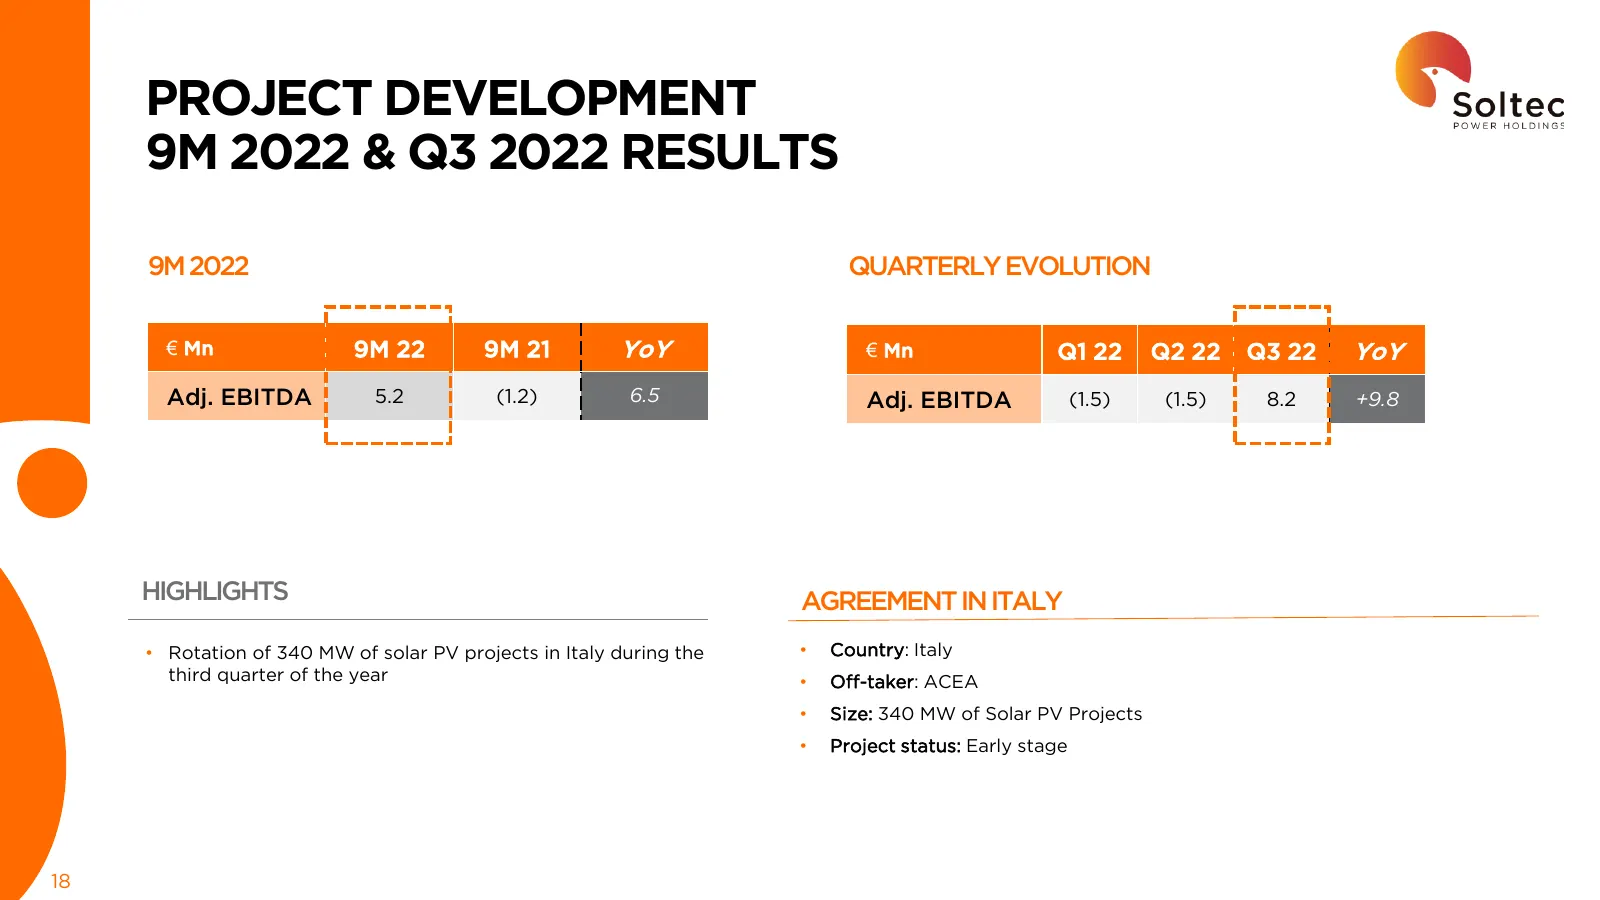
PROJECT DEVELOPMENT 9M 2022 & Q3 2022 RESULTS 9M 2022 QUARTERLY EVOLUTION € Mn 9M 22 9M 21 YoY € Mn Q1 22 Q2 22 Q3 22 YoY Adj. EBITDA 5.2 (1.2) 6.5 Adj. EBITDA (1.5) (1.5) 8.2 +9.8 HIGHLIGHTS AGREEMENT IN ITALY • Rotation of 340 MW of solar PV projects in Italy during the • Country: Italy third quar
Slide 19: Net Financial Debt Profile as of September 30th, 2022
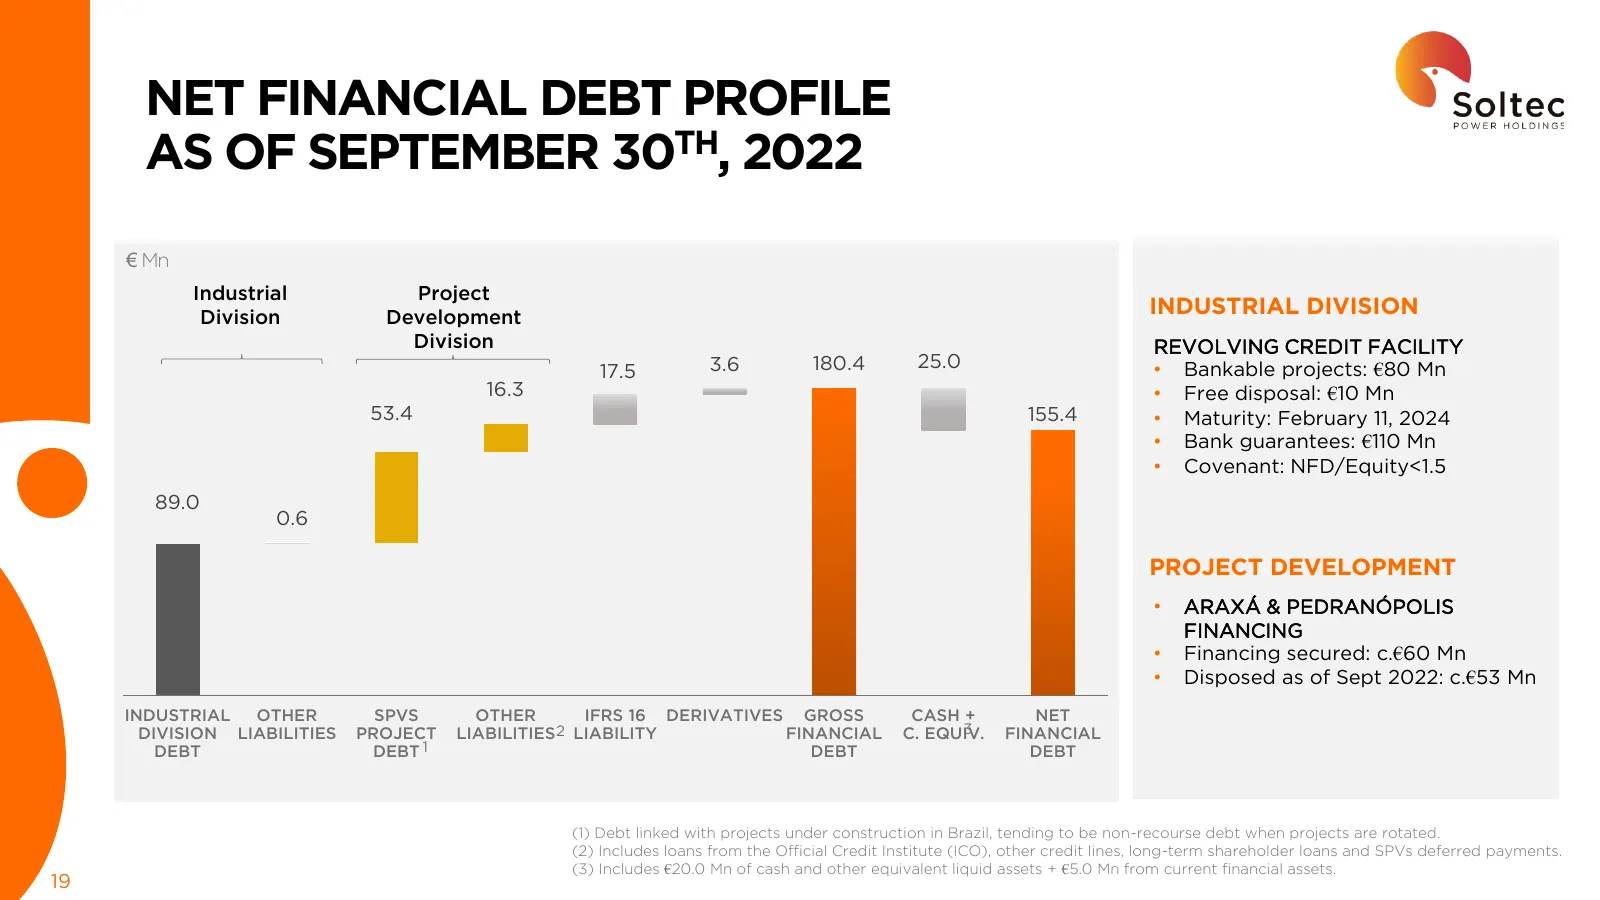
NET FINANCIAL DEBT PROFILE AS OF SEPTEMBER 30TH, 2022 € Mn Industrial Project Division Development INDUSTRIAL DIVISION Division REVOLVING CREDIT FACILITY 3.6 180.4 25.0 • Bankable projects: €80 Mn 17.5 16.3 • Free disposal: €10 Mn 53.4 155.4 • Maturity: February 11, 2024 • Bank guarantees: €110 Mn •
Slide 20: Closing Remarks
04 Closing Remarks
Slide 21: Closing Remarks
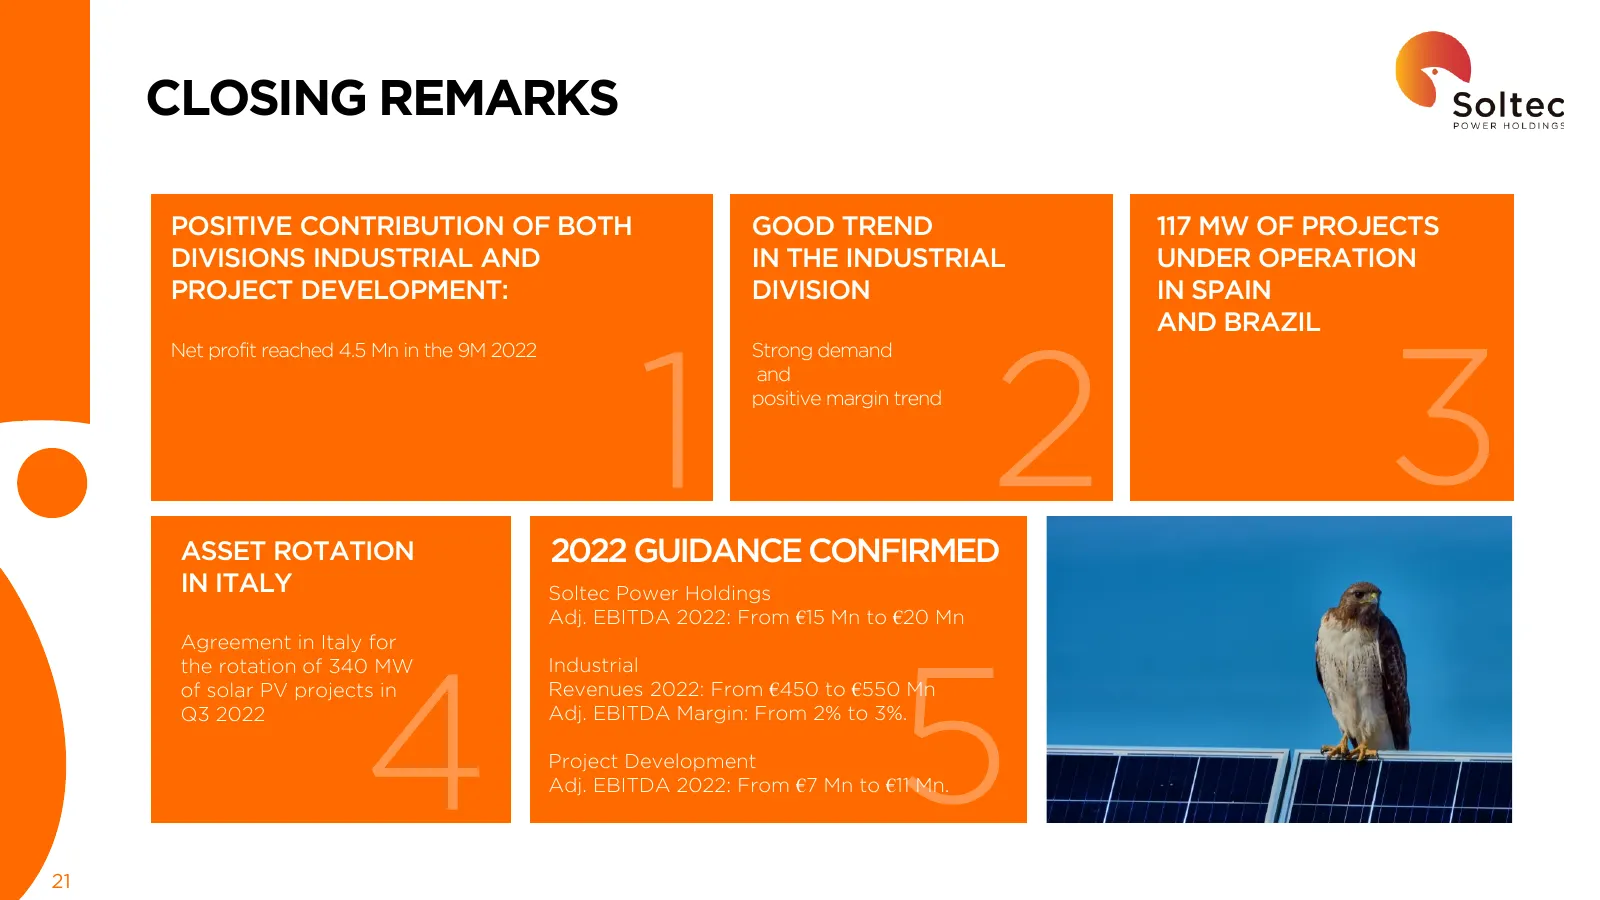
CLOSING REMARKS POSITIVE CONTRIBUTION OF BOTH GOOD TREND 117 MW OF PROJECTS DIVISIONS INDUSTRIAL AND IN THE INDUSTRIAL UNDER OPERATION PROJECT DEVELOPMENT: DIVISION IN SPAIN AND BRAZIL Net profit reached 4.5 Mn in the 9M 2022 Strong demand and positive margin trend RECORD REVENUES FOR ASSET ROTATION
Slide 22: Appendix
05 Appendix
Slide 23: Soltec Power Holdings P&L
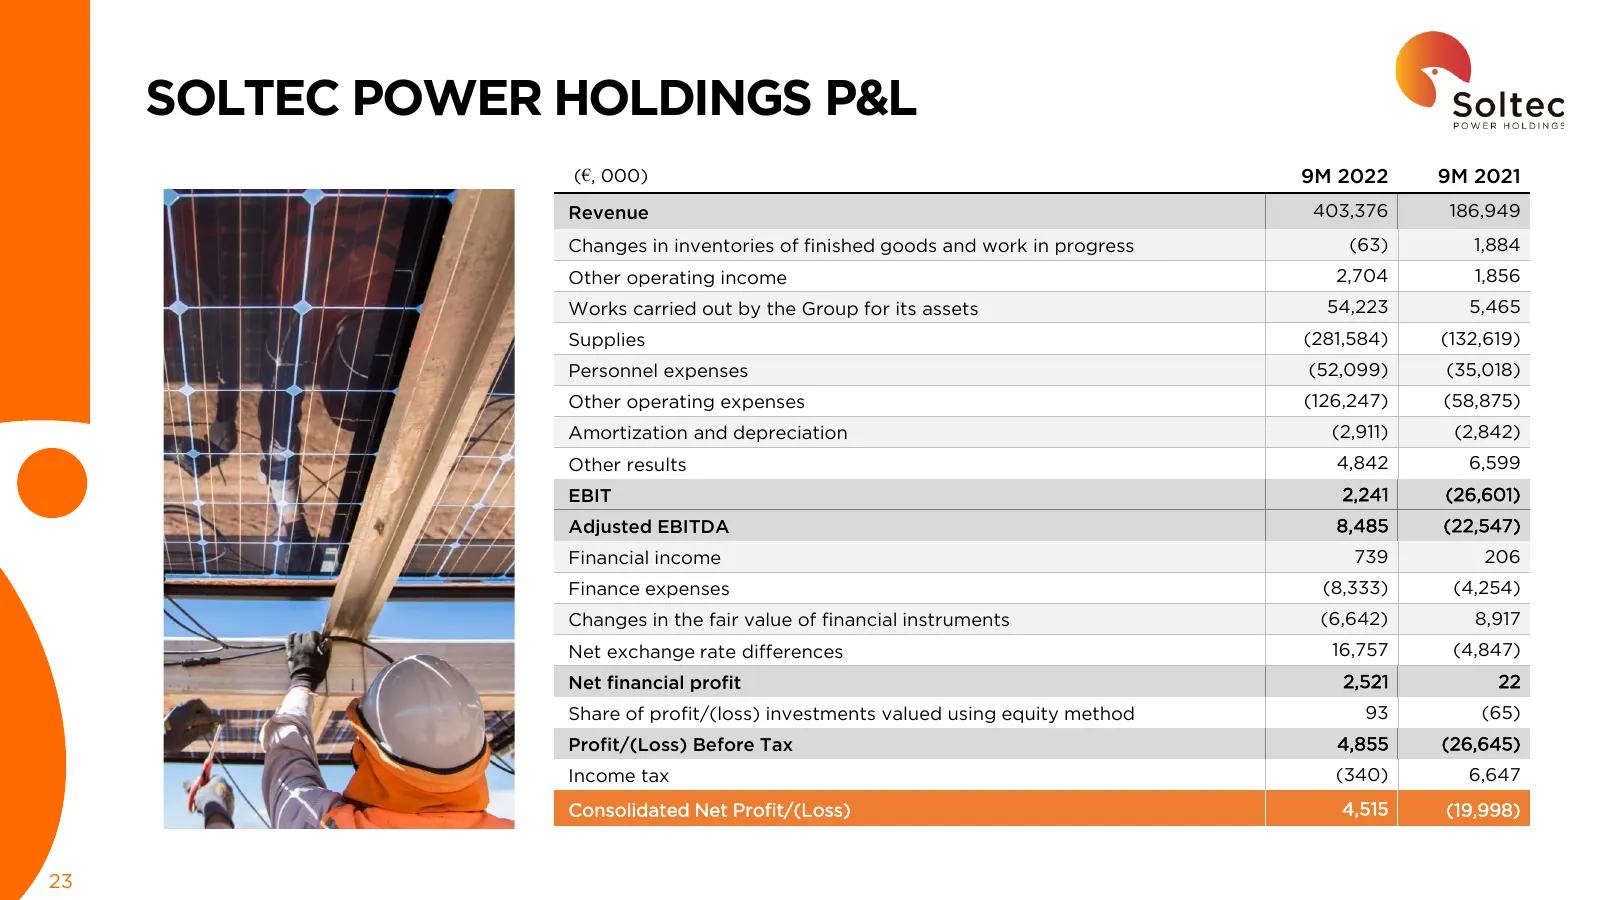
SOLTEC POWER HOLDINGS P&L (€, 000) 9M 2022 9M 2021 Revenue 403,376 186,949 Changes in inventories of finished goods and work in progress (63) 1,884 Other operating income 2,704 1,856 Works carried out by the Group for its assets 54,223 5,465 Supplies (281,584) (132,619) Personnel expenses (52,099) (
Slide 24: Order Pipeline Categorization Criteria
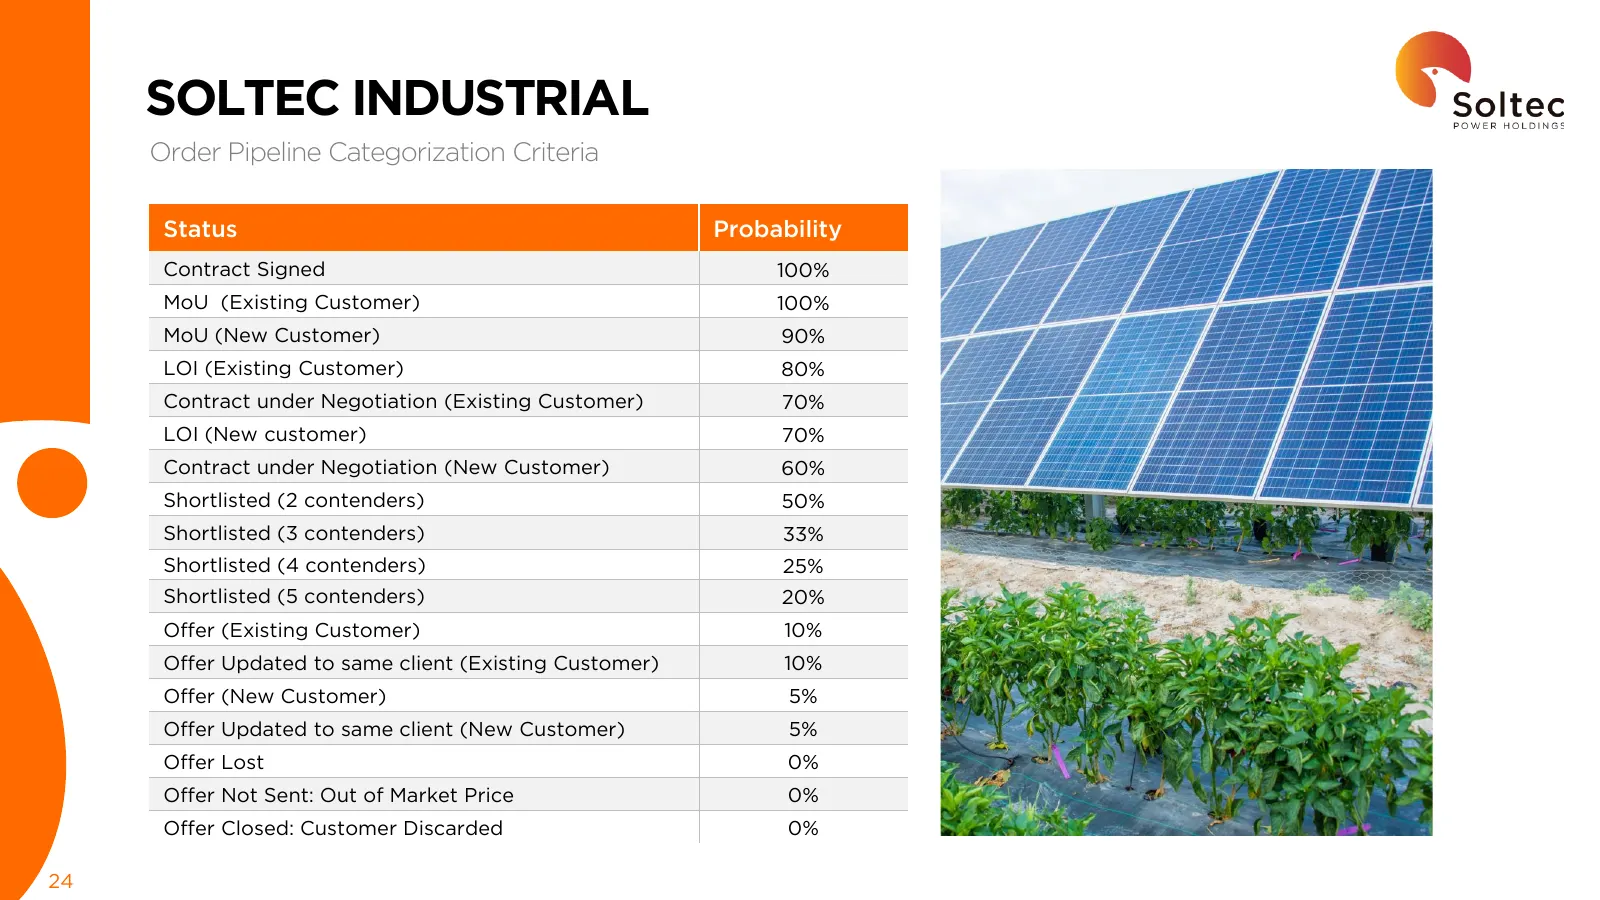
SOLTEC INDUSTRIAL Order Pipeline Categorization Criteria Status Probability Contract Signed 100% MoU (Existing Customer) 100% MoU (New Customer) 90% LOI (Existing Customer) 80% Contract under Negotiation (Existing Customer) 70% LOI (New customer) 70% Contract under Negotiation (New Customer) 60% Sho
Slide 25: Disclaimer
DISCLAIMER This document has been prepared by Soltec Power Holdings, S.A. (“Soltec”) exclusively for use during the financial results presentation for the nine-month period ended on September 30th, 2022. Therefore, thereof, this document may not be disclosed or published, nor used by any other perso
Slide 26: Thank You
olte. POWER HOLDINGS:
Source: Internet Archive copy of soltec.com
More decks from Soltec Power Holdings SA
 H1 2026 Earnings Presentation26 slides · September 2026
 H1 2026 Earnings Presentation26 slides · September 2026
 FY2025 Earnings Presentation37 slides · Mar 26, 2026
 H1 2024 Earnings Presentation54 slides · Feb 27, 2025
 Investor Presentation (April 2024)54 slides · April 2024
 FY2023 Earnings Presentation31 slides · Apr 1, 2024