Dilip Buildcon Ltd. · NSE:DBL
Dilip Buildcon — Q3 FY2018 Earnings Presentation
31 slides from Dilip Buildcon's earnings presentation, February 2018
Slide 1: Q3FY18 Earnings Presentation
INFRASTRUCTURE & BEYOND Q3FY18 Earnings Presentation
Slide 2: Safe Harbour
Safe Harbour Q3FY18 All statements included or incorporated by reference in this presentation, other than statements or characterizations of historical fact, are forward-looking statements. These forward-looking statements are based on our current expectations, estimates and projections about our in
Slide 3: Table of Content
Table of Content 1 Results Summary Page : 04 2 Business Highlights Page : 06 3 Financial Highlights Page : 10 4 Strategy & Model Page : 15 5 Appendix Page : 18 3
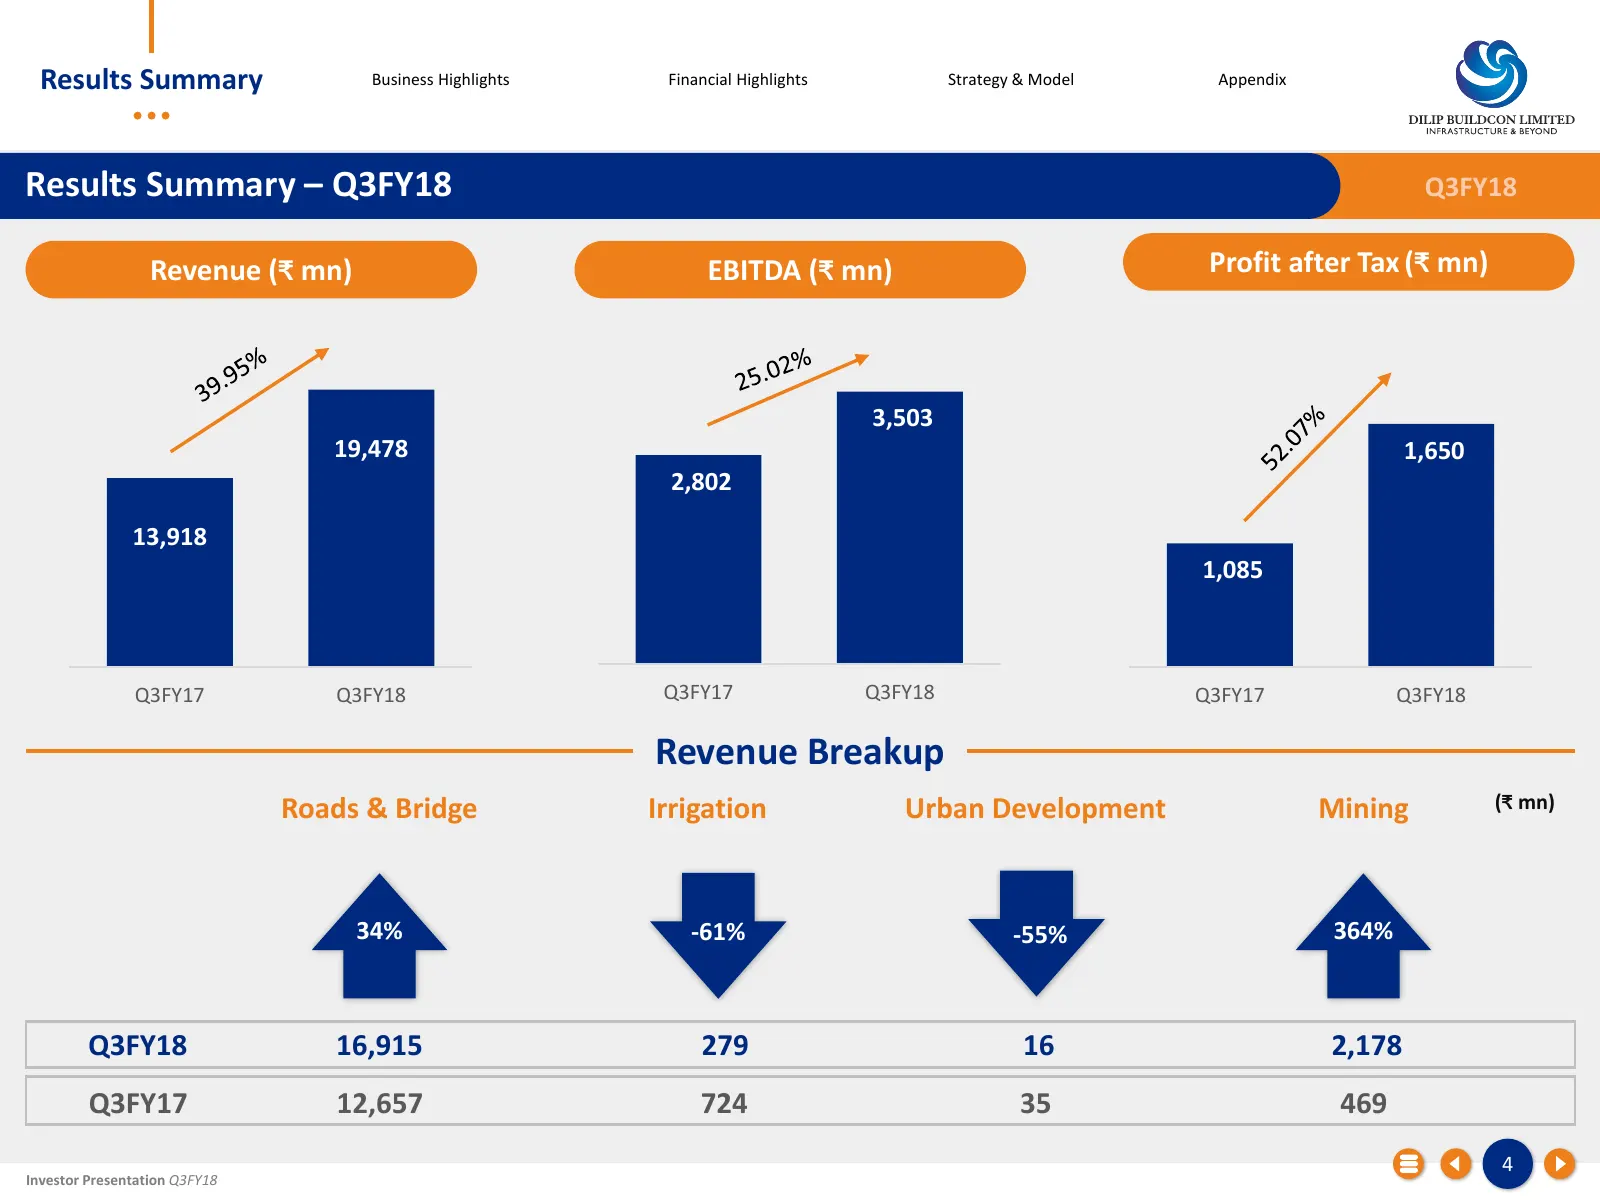
Slide 4: Results Summary – Q3FY18 Revenue Breakup
Results Summary Business Highlights Financial Highlights Strategy & Model Appendix Results Summary – Q3FY18 Q3FY18 Revenue (₹ mn) EBITDA (₹ mn) Profit after Tax (₹ mn) 3,503 19,478 1,650 2,802 13,918 1,085 Q3FY17 Q3FY18 Q3FY17 Q3FY18 Q3FY17 Q3FY18 Revenue Breakup Roads & Bridge Irrigation Urban Deve
Slide 5: Results Summary – 9MFY18 Revenue Breakup
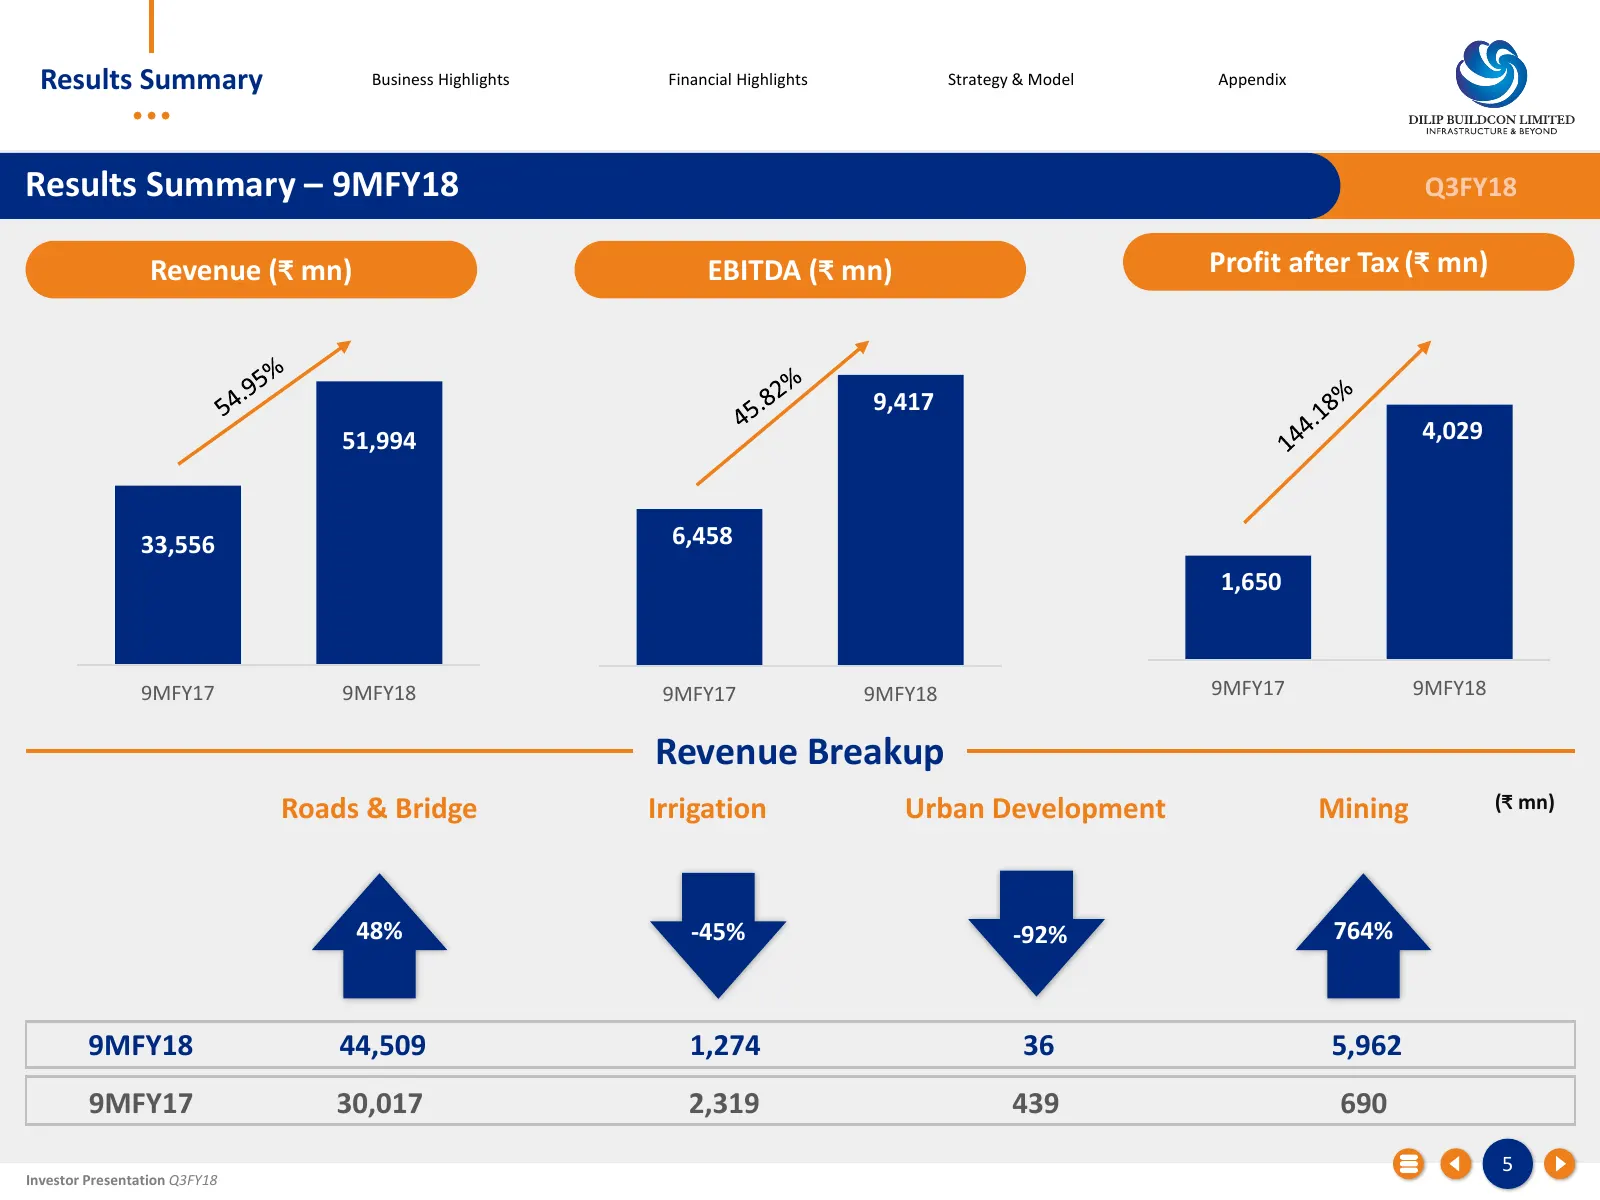
Results Summary Business Highlights Financial Highlights Strategy & Model Appendix Results Summary – 9MFY18 Q3FY18 Revenue (₹ mn) EBITDA (₹ mn) Profit after Tax (₹ mn) 9,417 51,994 4,029 33,556 6,458 1,650 9MFY17 9MFY18 9MFY17 9MFY18 9MFY17 9MFY18 Revenue Breakup Roads & Bridge Irrigation Urban Deve
Slide 6: Key Highlights for the quarter
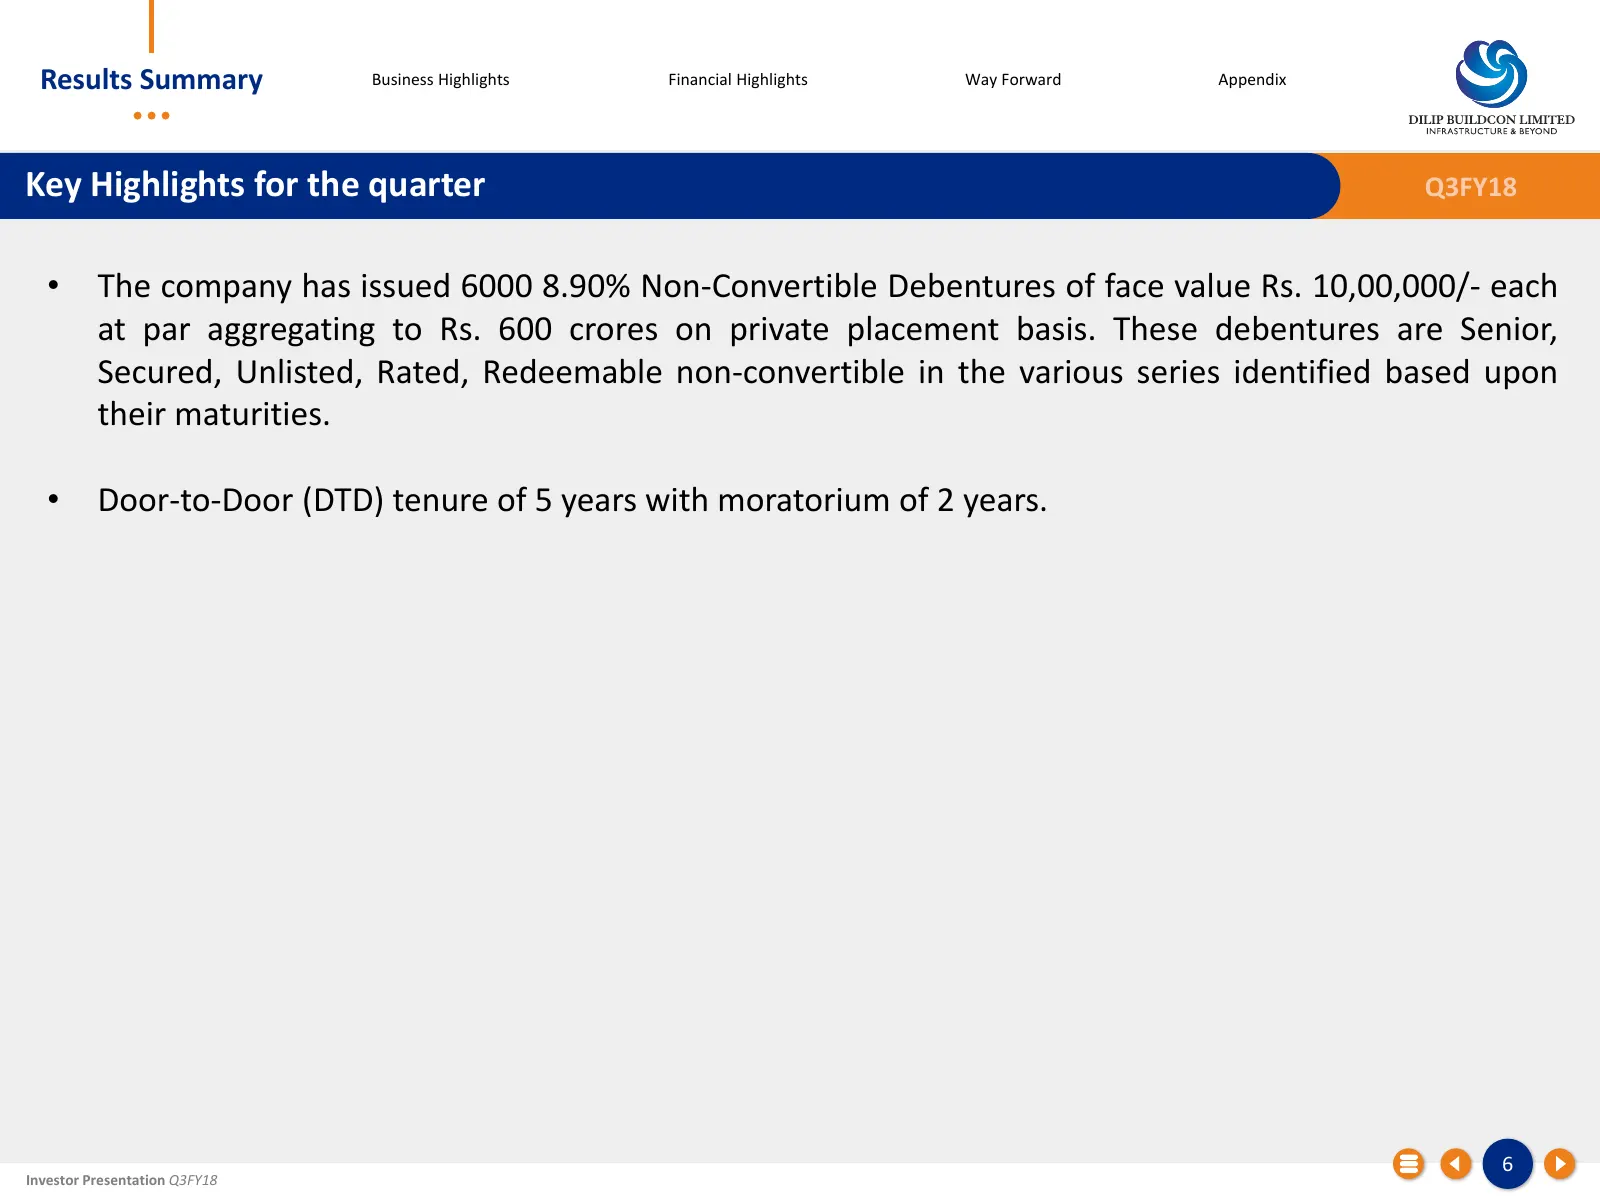
Results Summary Business Highlights Financial Highlights Way Forward Appendix Key Highlights for the quarter Q3FY18 • The company has issued 6000 8.90% Non-Convertible Debentures of face value Rs. 10,00,000/- each at par aggregating to Rs. 600 crores on private placement basis. These debentures are
Slide 7: Result Update
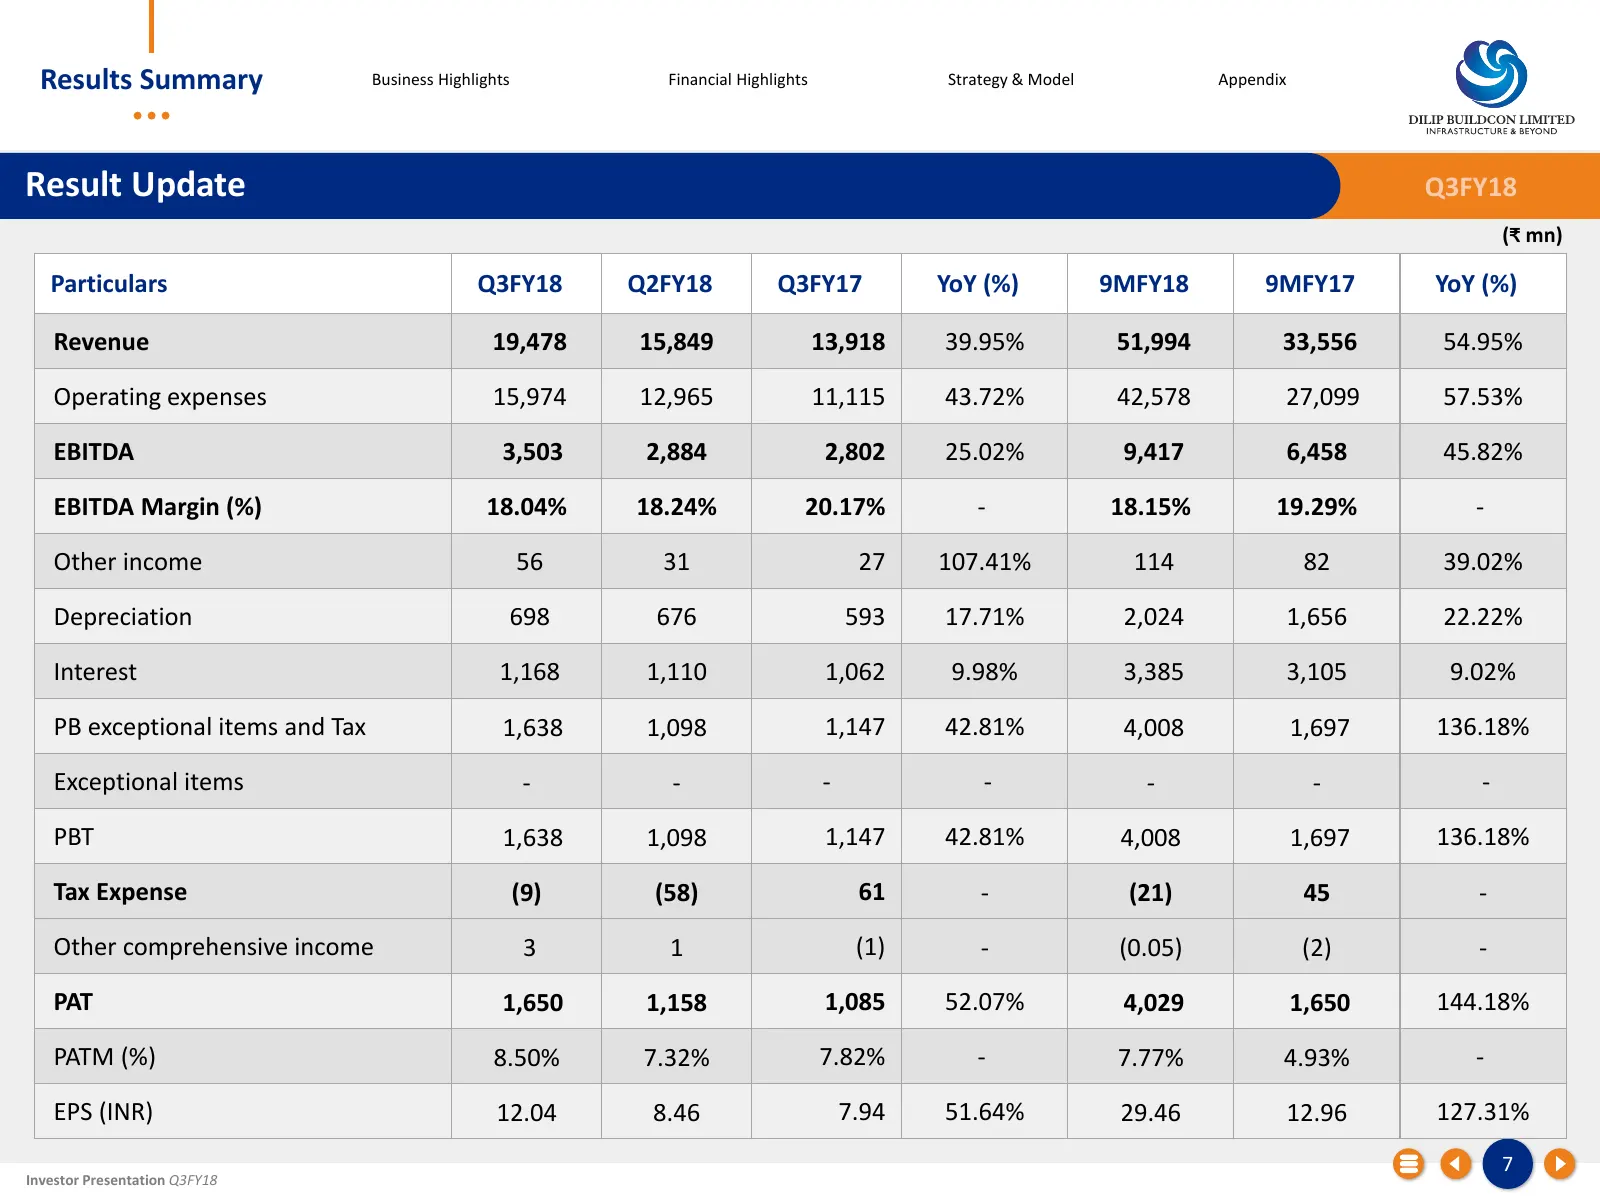
Results Summary Business Highlights Financial Highlights Strategy & Model Appendix Result Update Q3FY18 (₹ mn) Particulars Q3FY18 Q2FY18 Q3FY17 YoY (%) 9MFY18 9MFY17 YoY (%) Revenue 19,478 15,849 13,918 39.95% 51,994 33,556 54.95% Operating expenses 15,974 12,965 11,115 43.72% 42,578 27,099 57.53% E
Slide 8: Net Working Capital Days- Quarterly
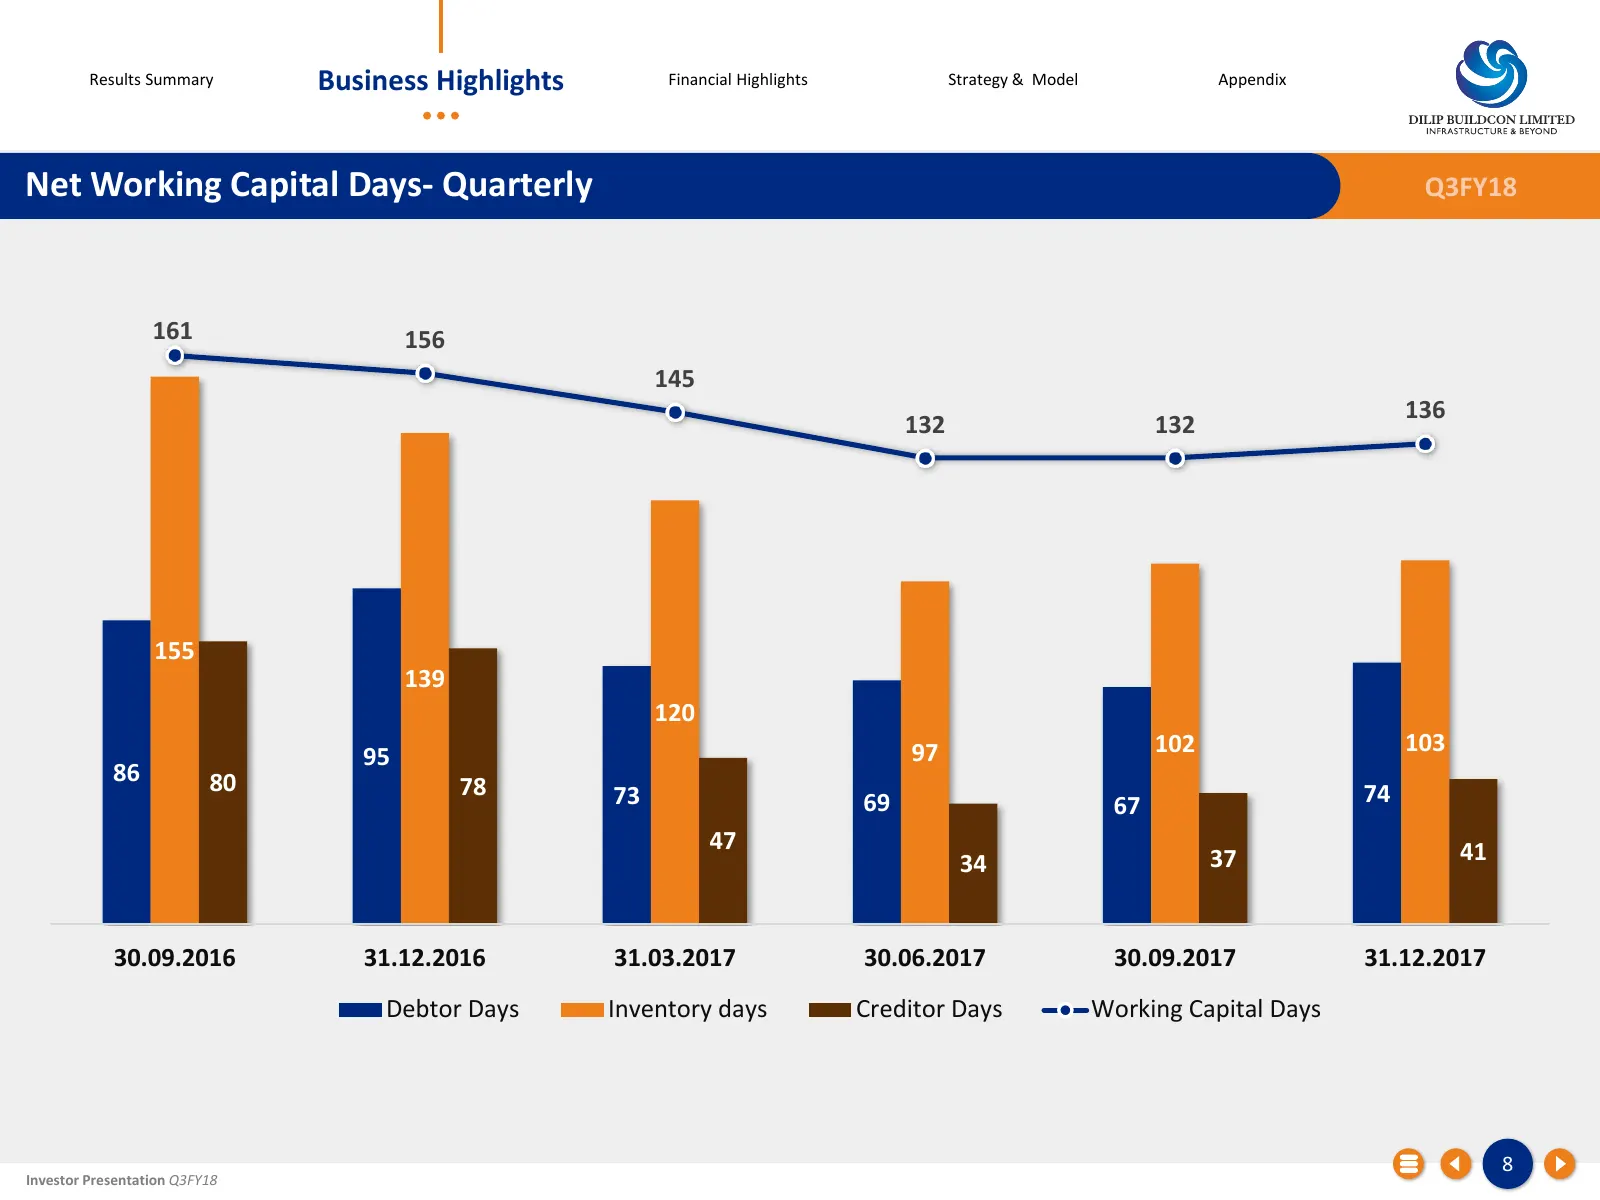
Results Summary Business Highlights Financial Highlights Strategy & Model Appendix Net Working Capital Days- Quarterly Q3FY18 161 156 145 136 132 132 155 139 120 97 102 103 95 86 80 78 73 74 69 67 47 41 34 37 30.09.2016 31.12.2016 31.03.2017 30.06.2017 30.09.2017 31.12.2017 Debtor Days Inventory day
Slide 9: Order Book
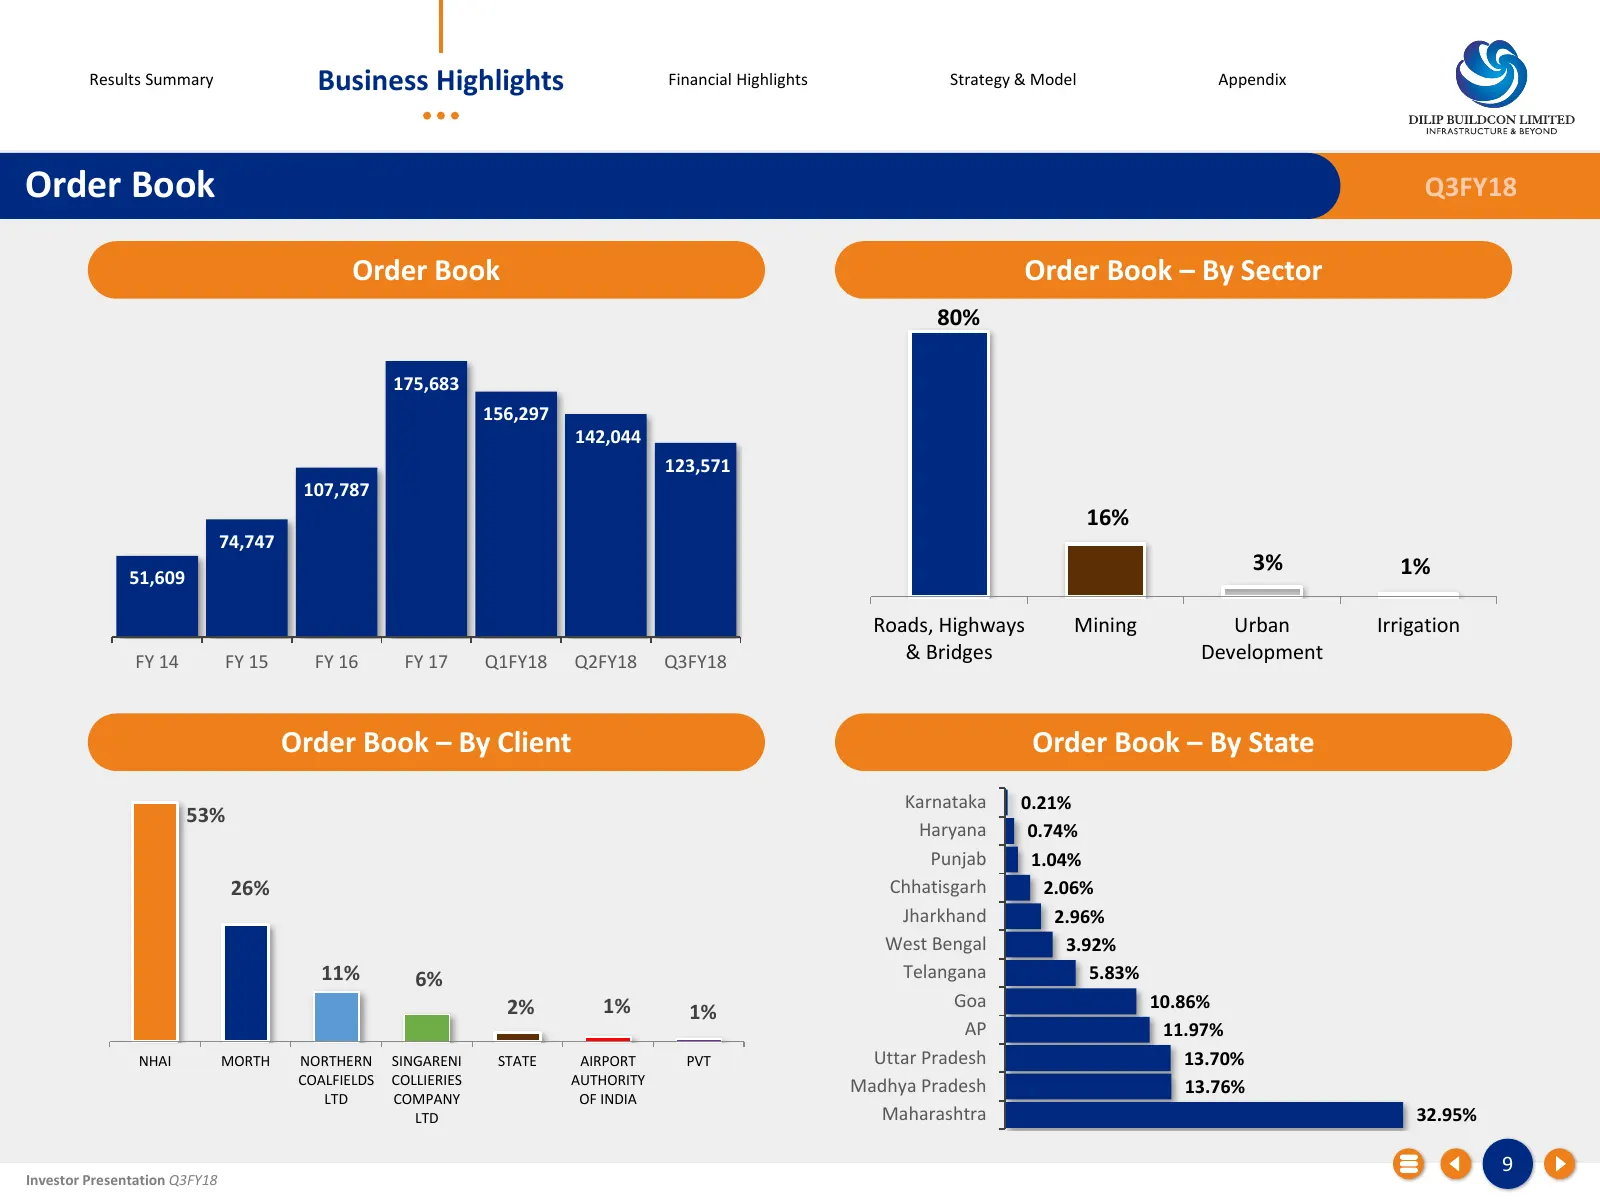
Results Summary Business Highlights Financial Highlights Strategy & Model Appendix Order Book Q3FY18 Order Book Order Book – By Sector 80% 175,683 156,297 142,044 123,571 107,787 16% 74,747 3% 1% 51,609 Roads, Highways Mining Urban Irrigation FY 14 FY 15 FY 16 FY 17 Q1FY18 Q2FY18 Q3FY18 & Bridges De
Slide 10: Projects won post December (Q3) till date
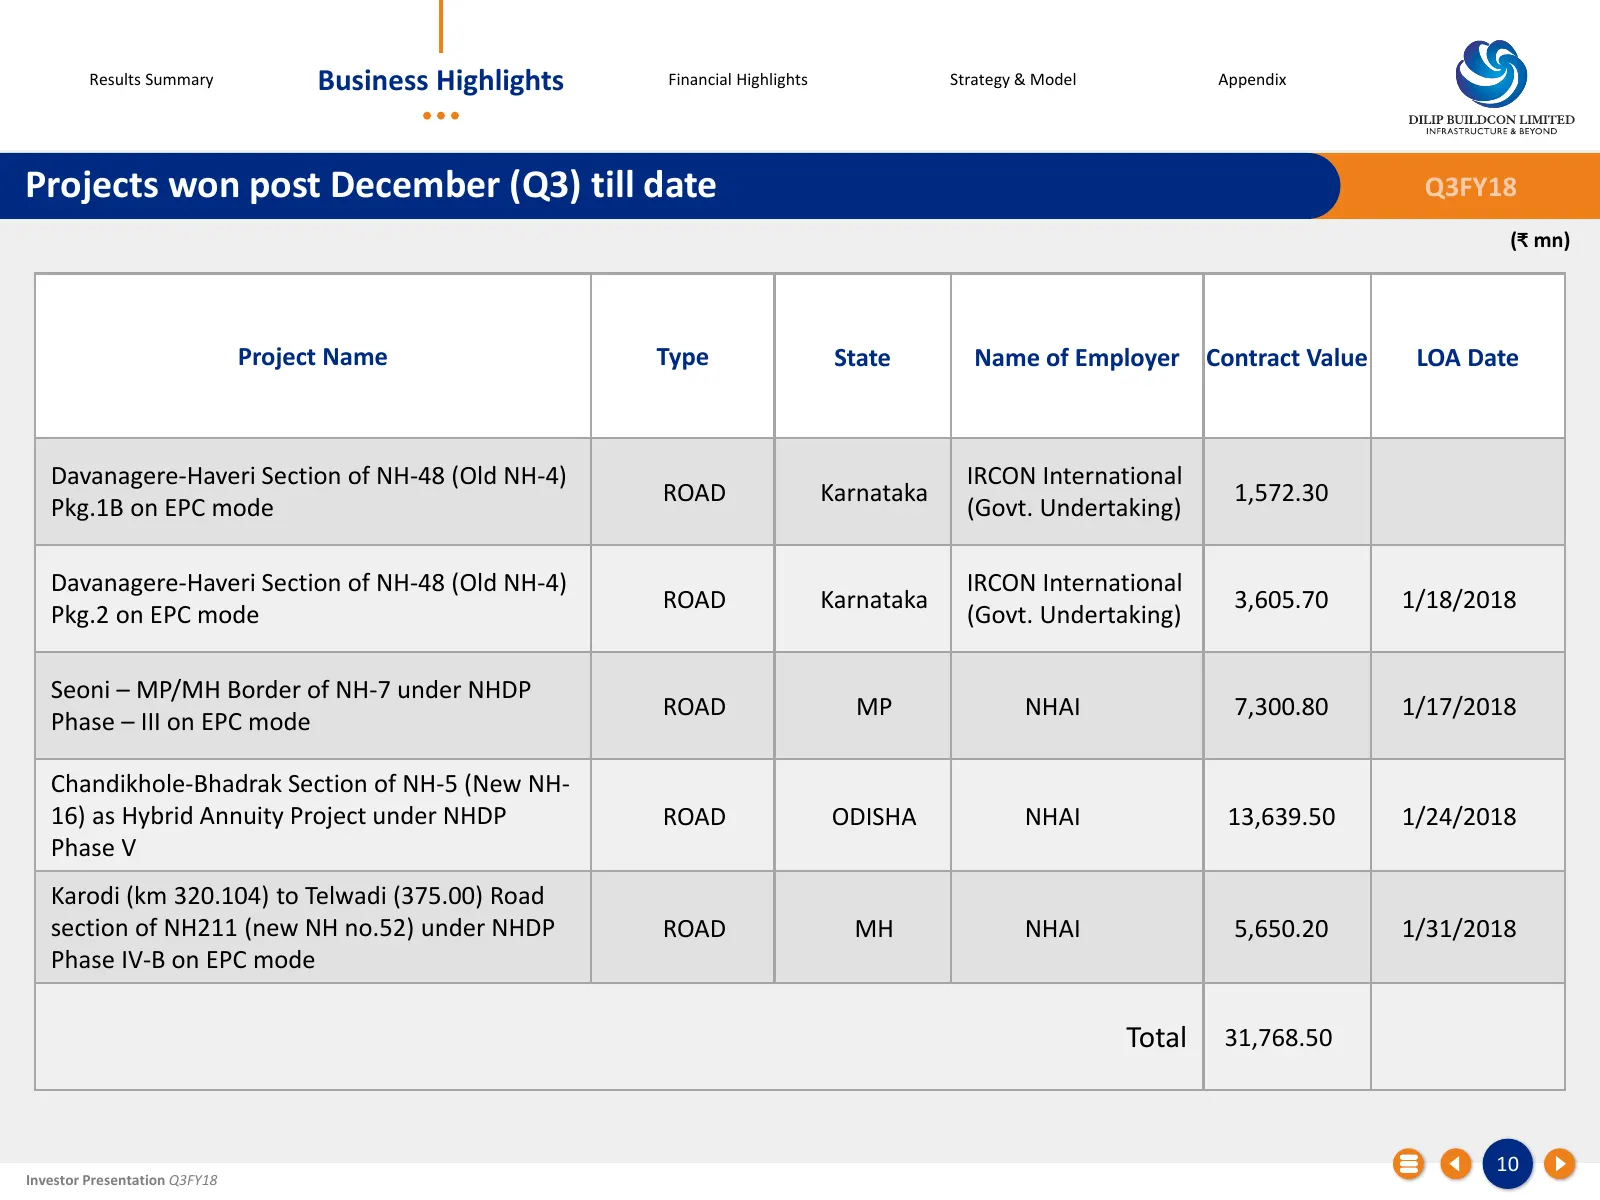
Results Summary Business Highlights Financial Highlights Strategy & Model Appendix Projects won post December (Q3) till date Q3FY18 (₹ mn) Project Name Type State Name of Employer Contract Value LOA Date Davanagere-Haveri Section of NH-48 (Old NH-4) IRCON International ROAD Karnataka 1,572.30 Pkg.1B
Slide 11: Projects completed in Q3
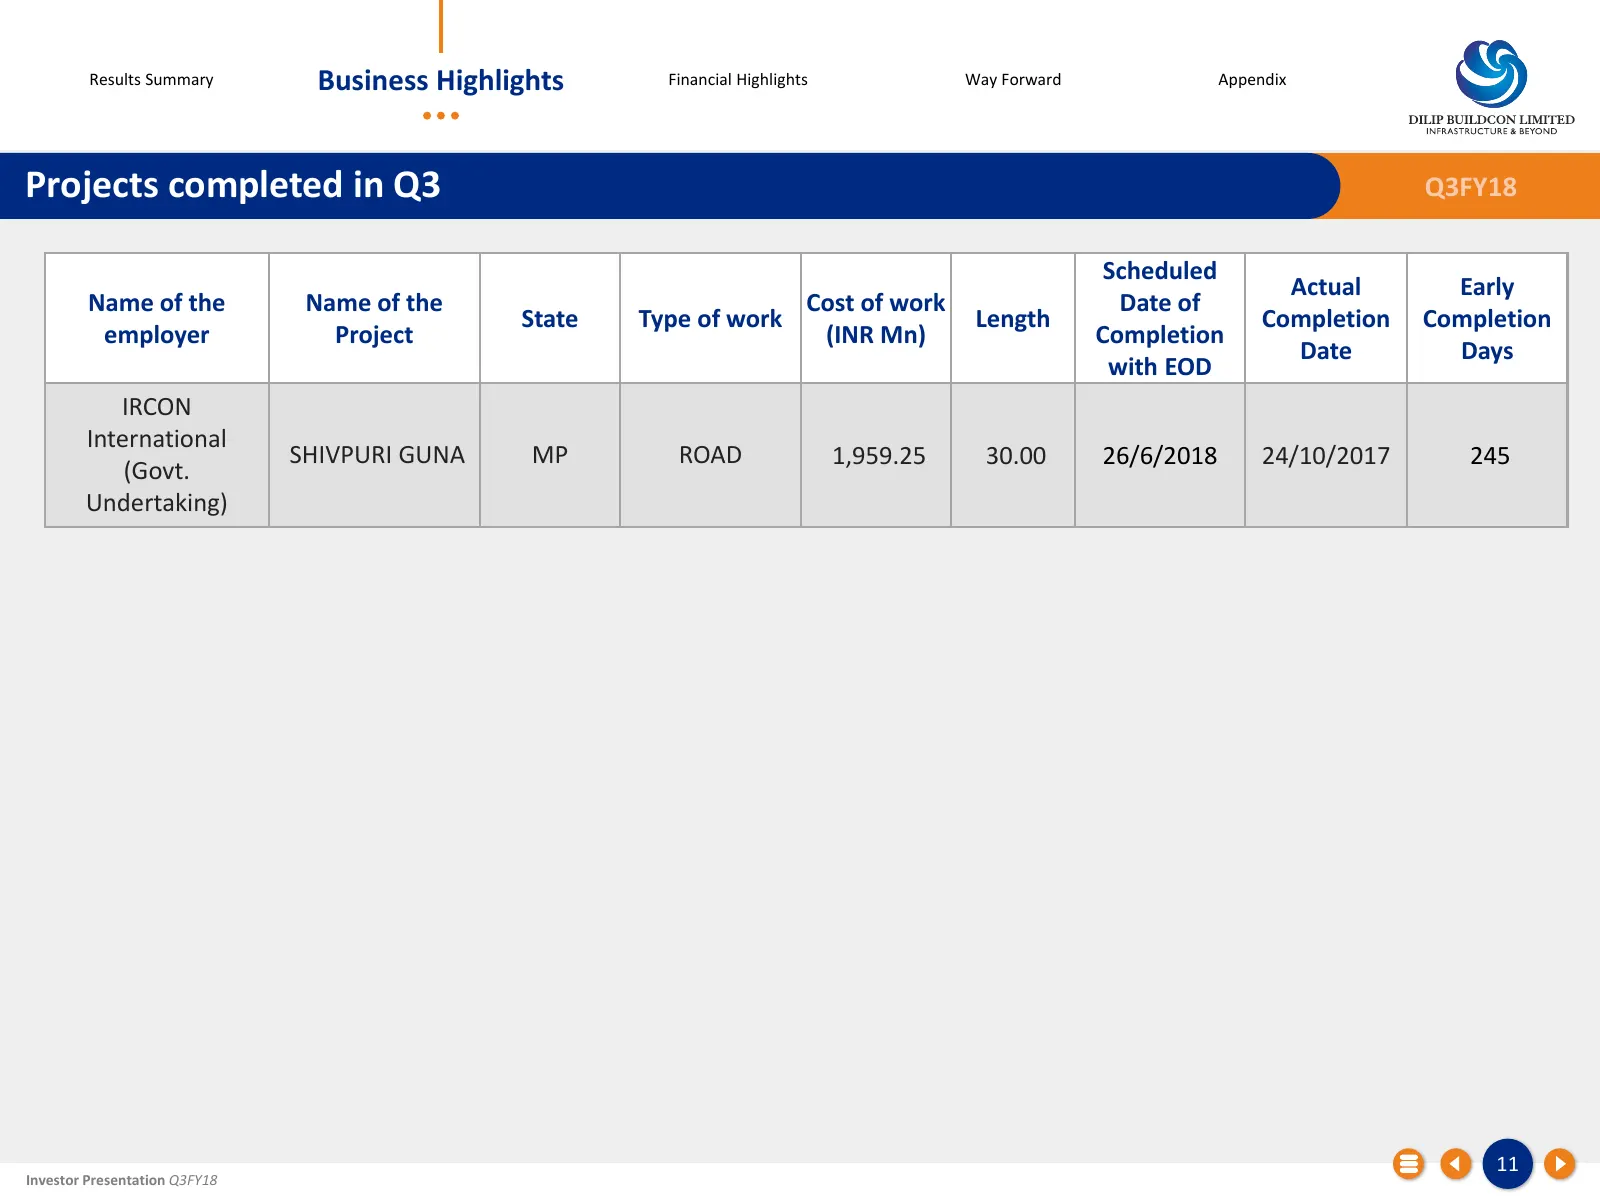
Results Summary Business Highlights Financial Highlights Way Forward Appendix Projects completed in Q3 Q3FY18 Scheduled Actual Early Name of the Name of the Cost of work Date of State Type of work Length Completion Completion employer Project (INR Mn) Completion Date Days with EOD IRCON Internationa
Slide 12: Profit & Loss - Quarterly
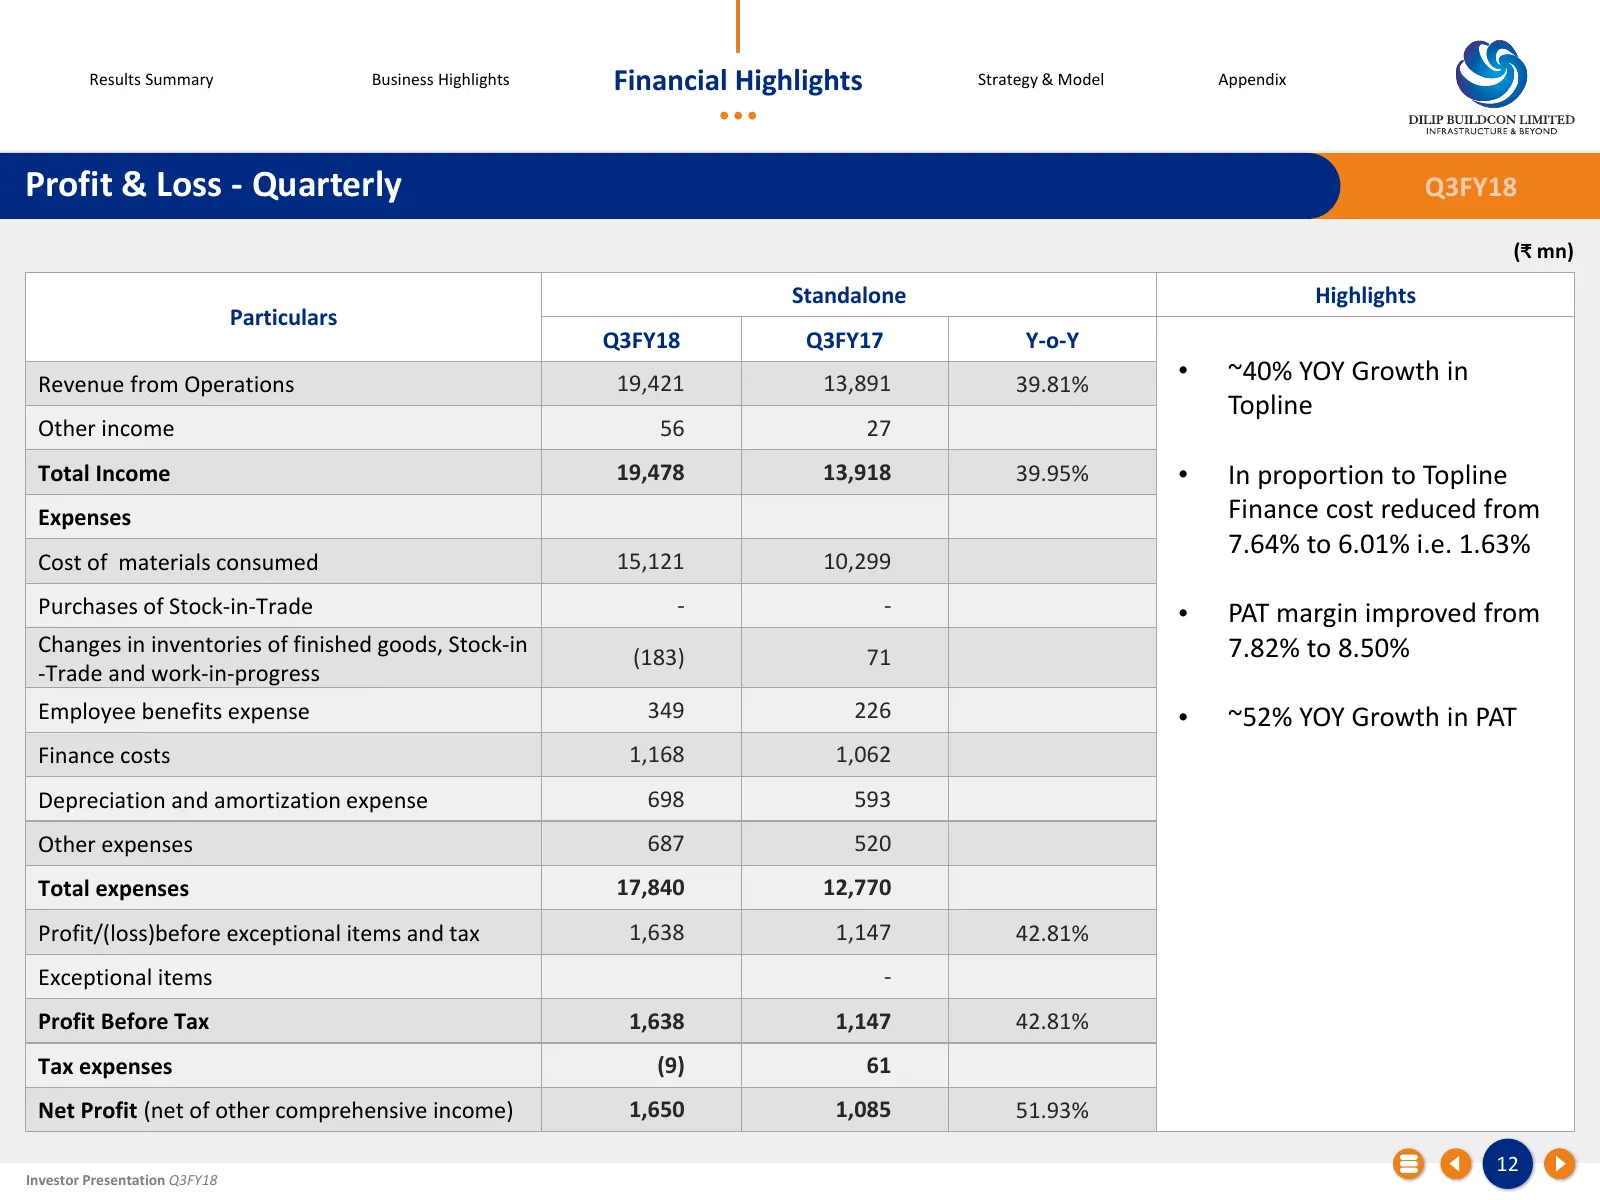
Results Summary Business Highlights Financial Highlights Strategy & Model Appendix Profit & Loss - Quarterly Q3FY18 (₹ mn) Standalone Highlights Particulars Q3FY18 Q3FY17 Y-o-Y Revenue from Operations 19,421 13,891 39.81% • ~40% YOY Growth in Topline Other income 56 27 Total Income 19,478 13,918 39.
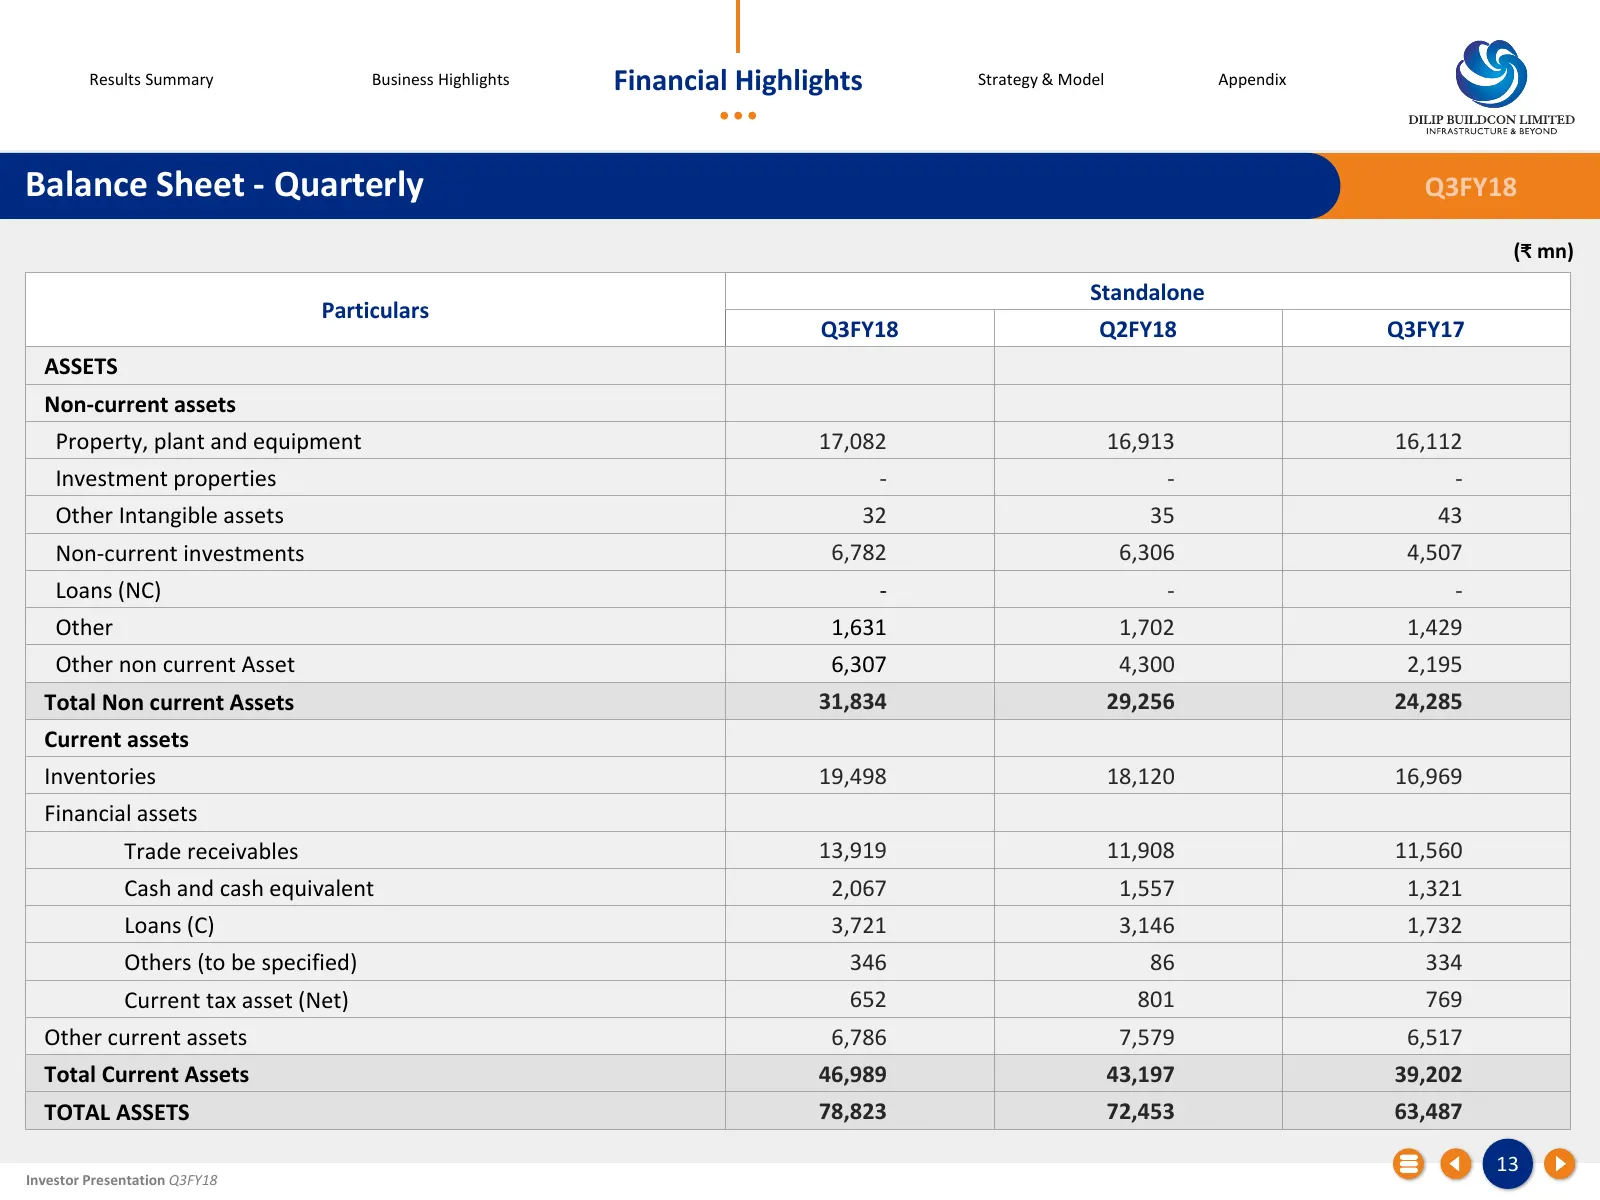
Slide 13: Balance Sheet - Quarterly
Results Summary Business Highlights Financial Highlights Strategy & Model Appendix Balance Sheet - Quarterly Q3FY18 (₹ mn) Standalone Particulars Q3FY18 Q2FY18 Q3FY17 ASSETS Non-current assets Property, plant and equipment 17,082 16,913 16,112 Investment properties - - - Other Intangible assets 32 3
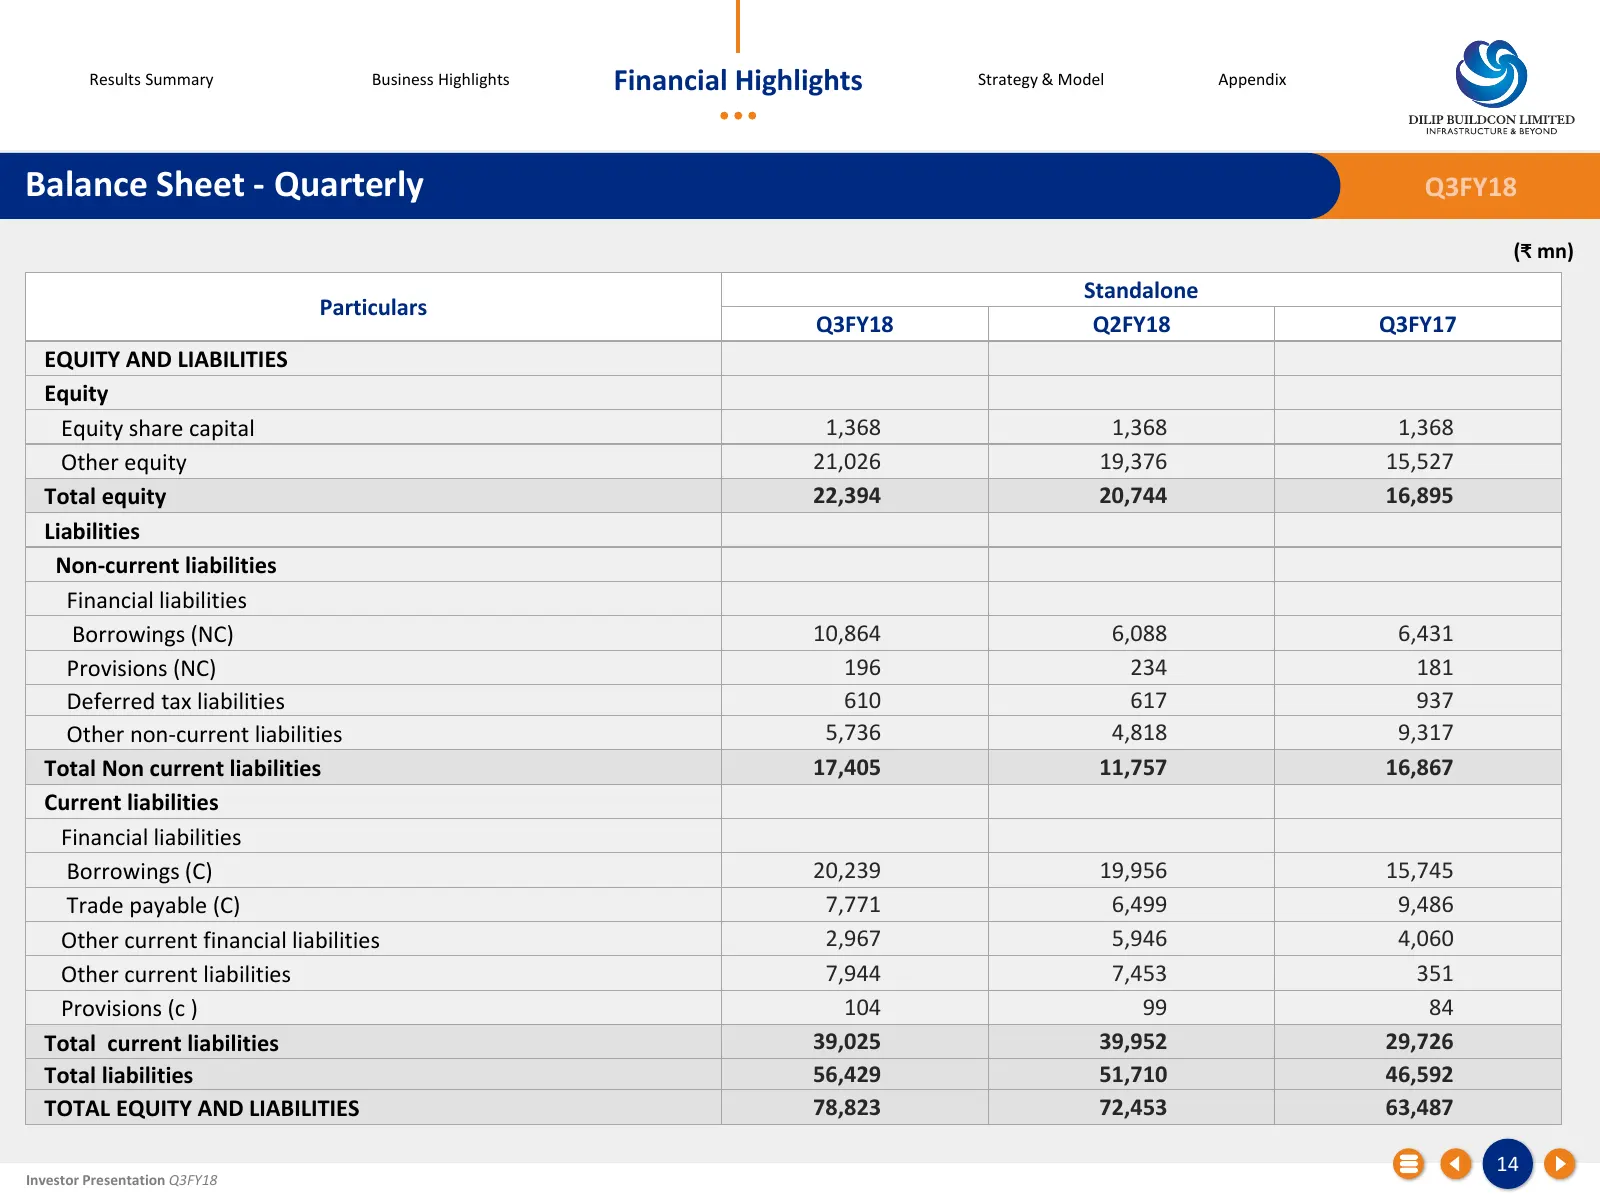
Slide 14: Balance Sheet - Quarterly
Results Summary Business Highlights Financial Highlights Strategy & Model Appendix Balance Sheet - Quarterly Q3FY18 (₹ mn) Standalone Particulars Q3FY18 Q2FY18 Q3FY17 EQUITY AND LIABILITIES Equity Equity share capital 1,368 1,368 1,368 Other equity 21,026 19,376 15,527 Total equity 22,394 20,744 16,
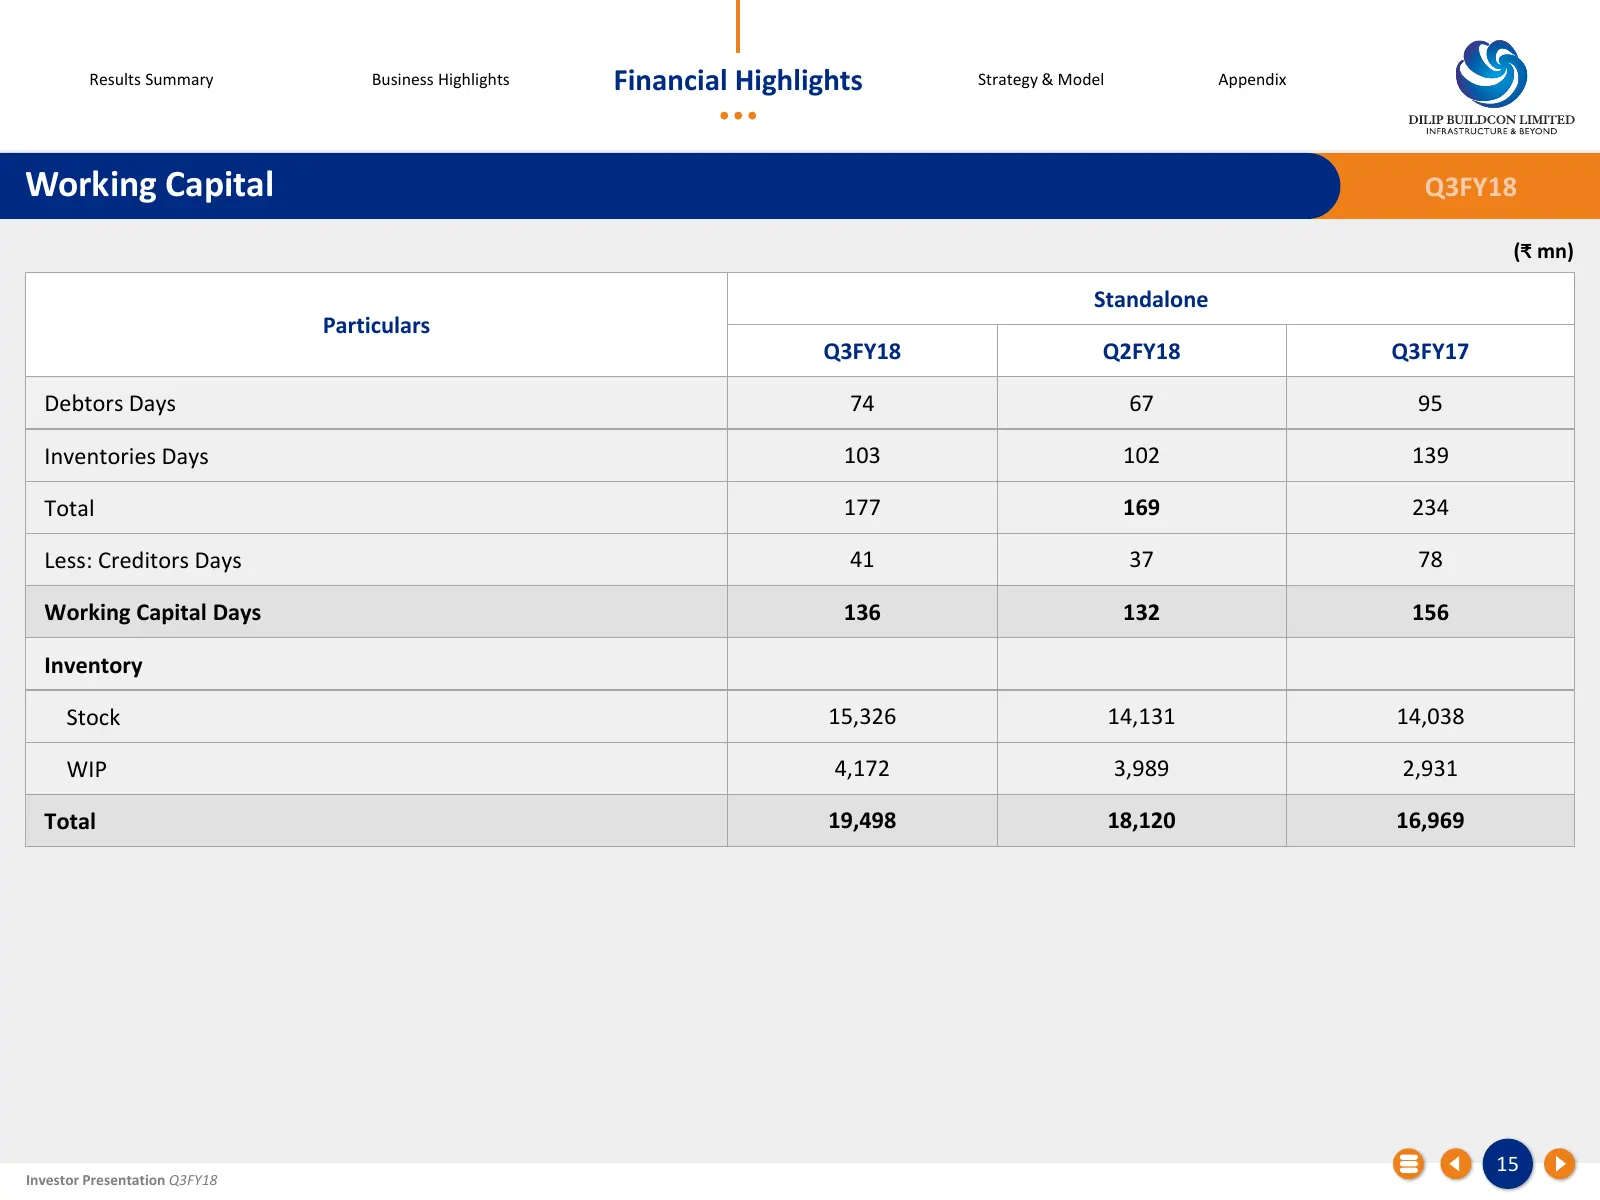
Slide 15: Working Capital
Results Summary Business Highlights Financial Highlights Strategy & Model Appendix Working Capital Q3FY18 (₹ mn) Standalone Particulars Q3FY18 Q2FY18 Q3FY17 Debtors Days 74 67 95 Inventories Days 103 102 139 Total 177 169 234 Less: Creditors Days 41 37 78 Working Capital Days 136 132 156 Inventory S
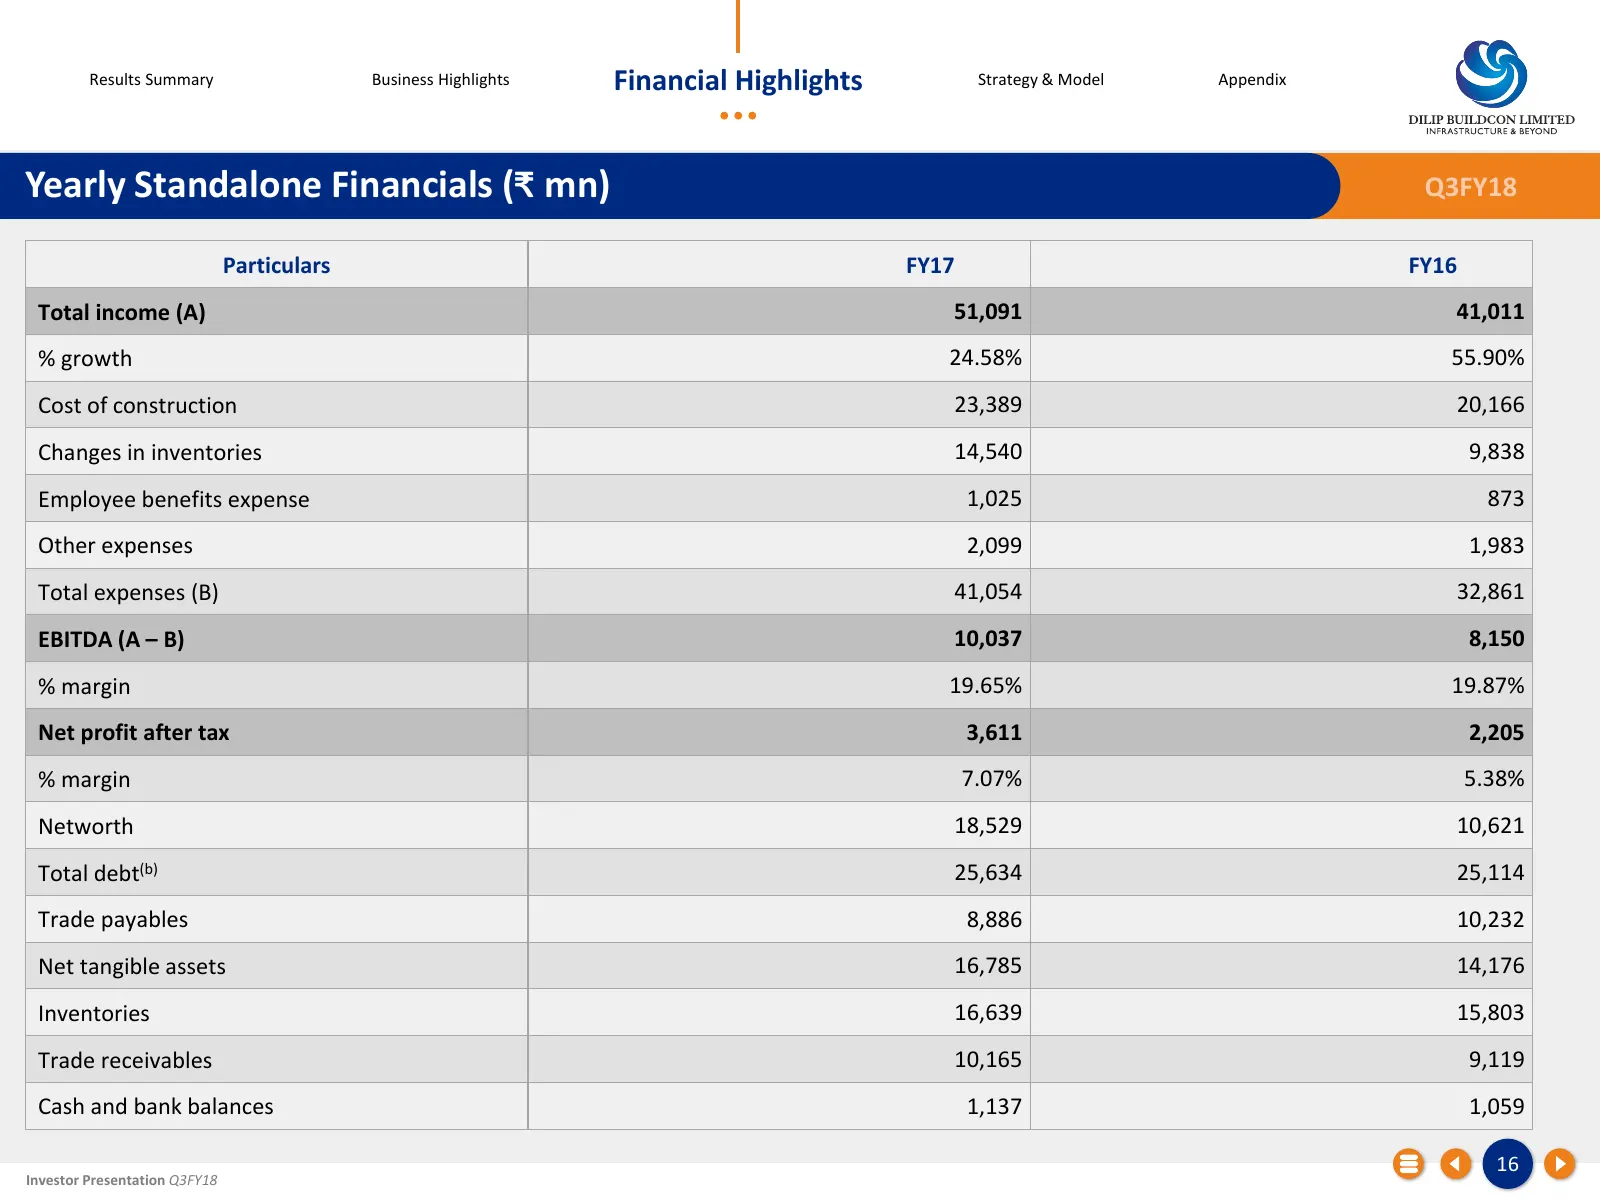
Slide 16: Yearly Standalone Financials (₹ mn)
Results Summary Business Highlights Financial Highlights Strategy & Model Appendix Yearly Standalone Financials (₹ mn) Q3FY18 Particulars FY17 FY16 Total income (A) 51,091 41,011 % growth 24.58% 55.90% Cost of construction 23,389 20,166 Changes in inventories 14,540 9,838 Employee benefits expense 1
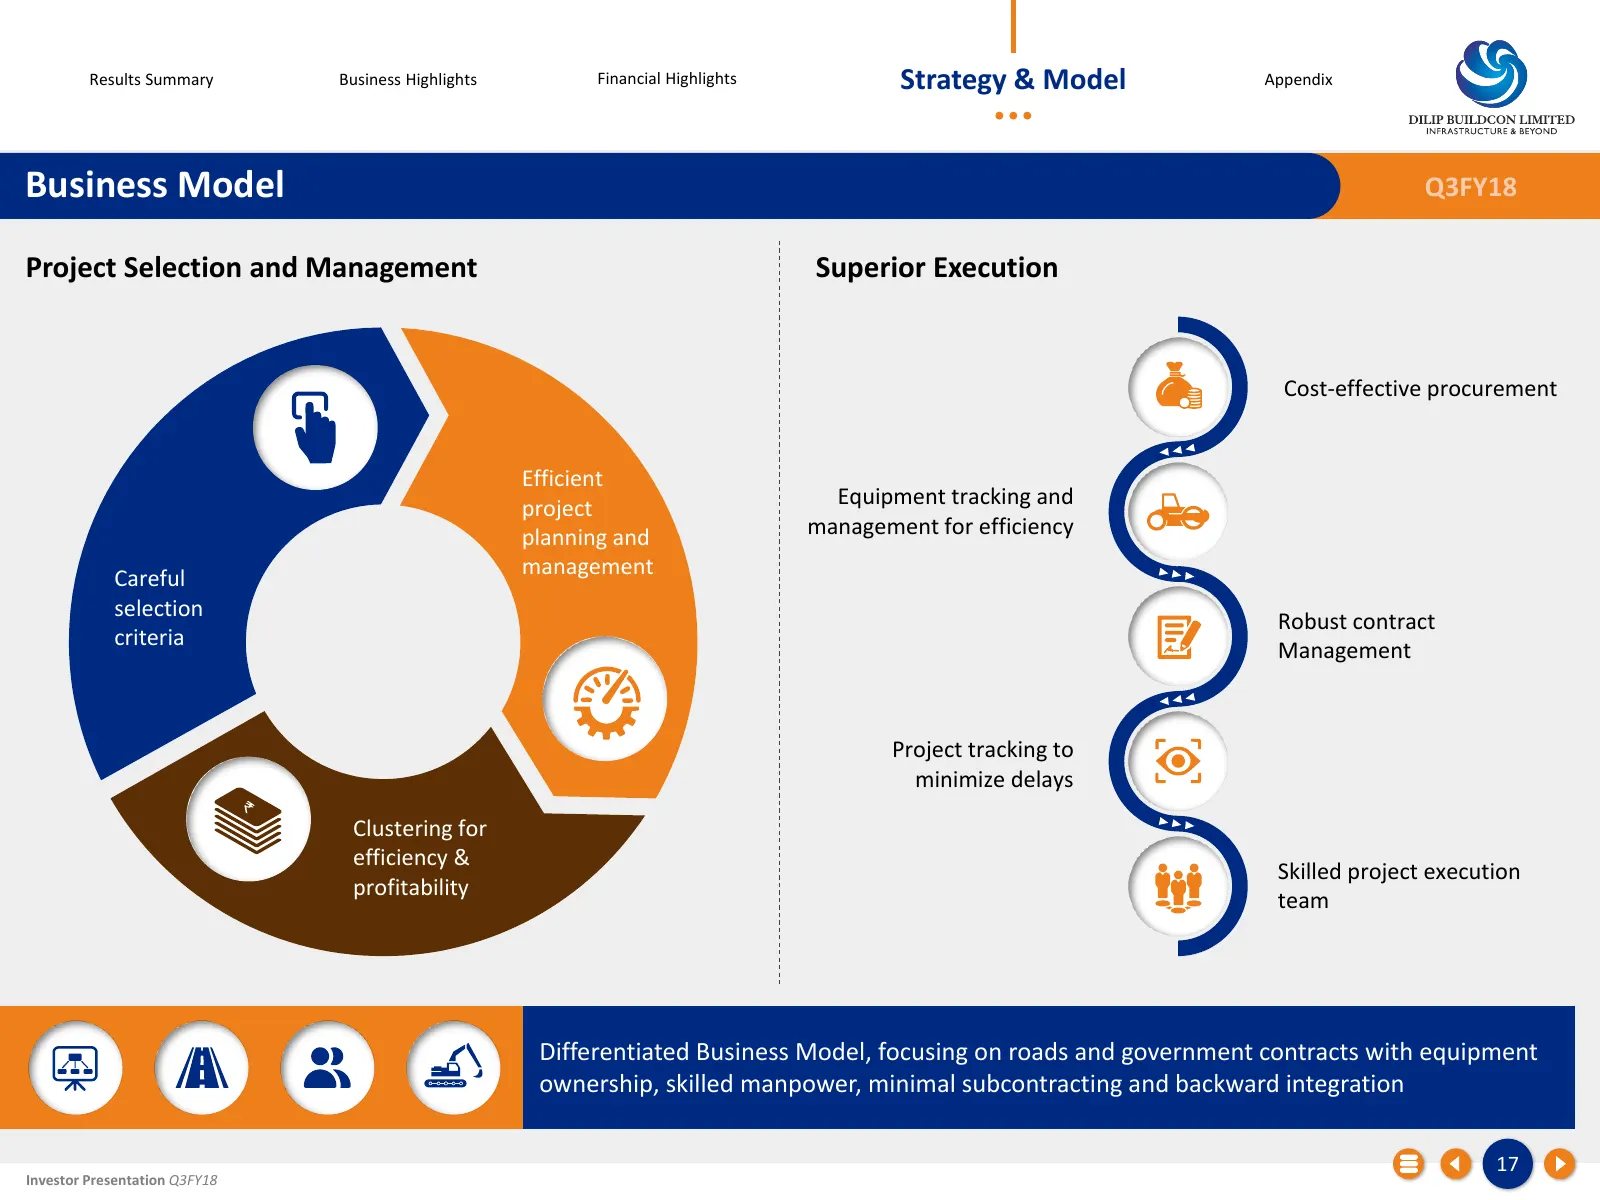
Slide 17: Business Model
Results Summary Business Highlights Financial Highlights Strategy & Model Appendix Business Model Q3FY18 Project Selection and Management Superior Execution Cost-effective procurement Efficient project Equipment tracking and planning and management for efficiency Careful management selection Robust
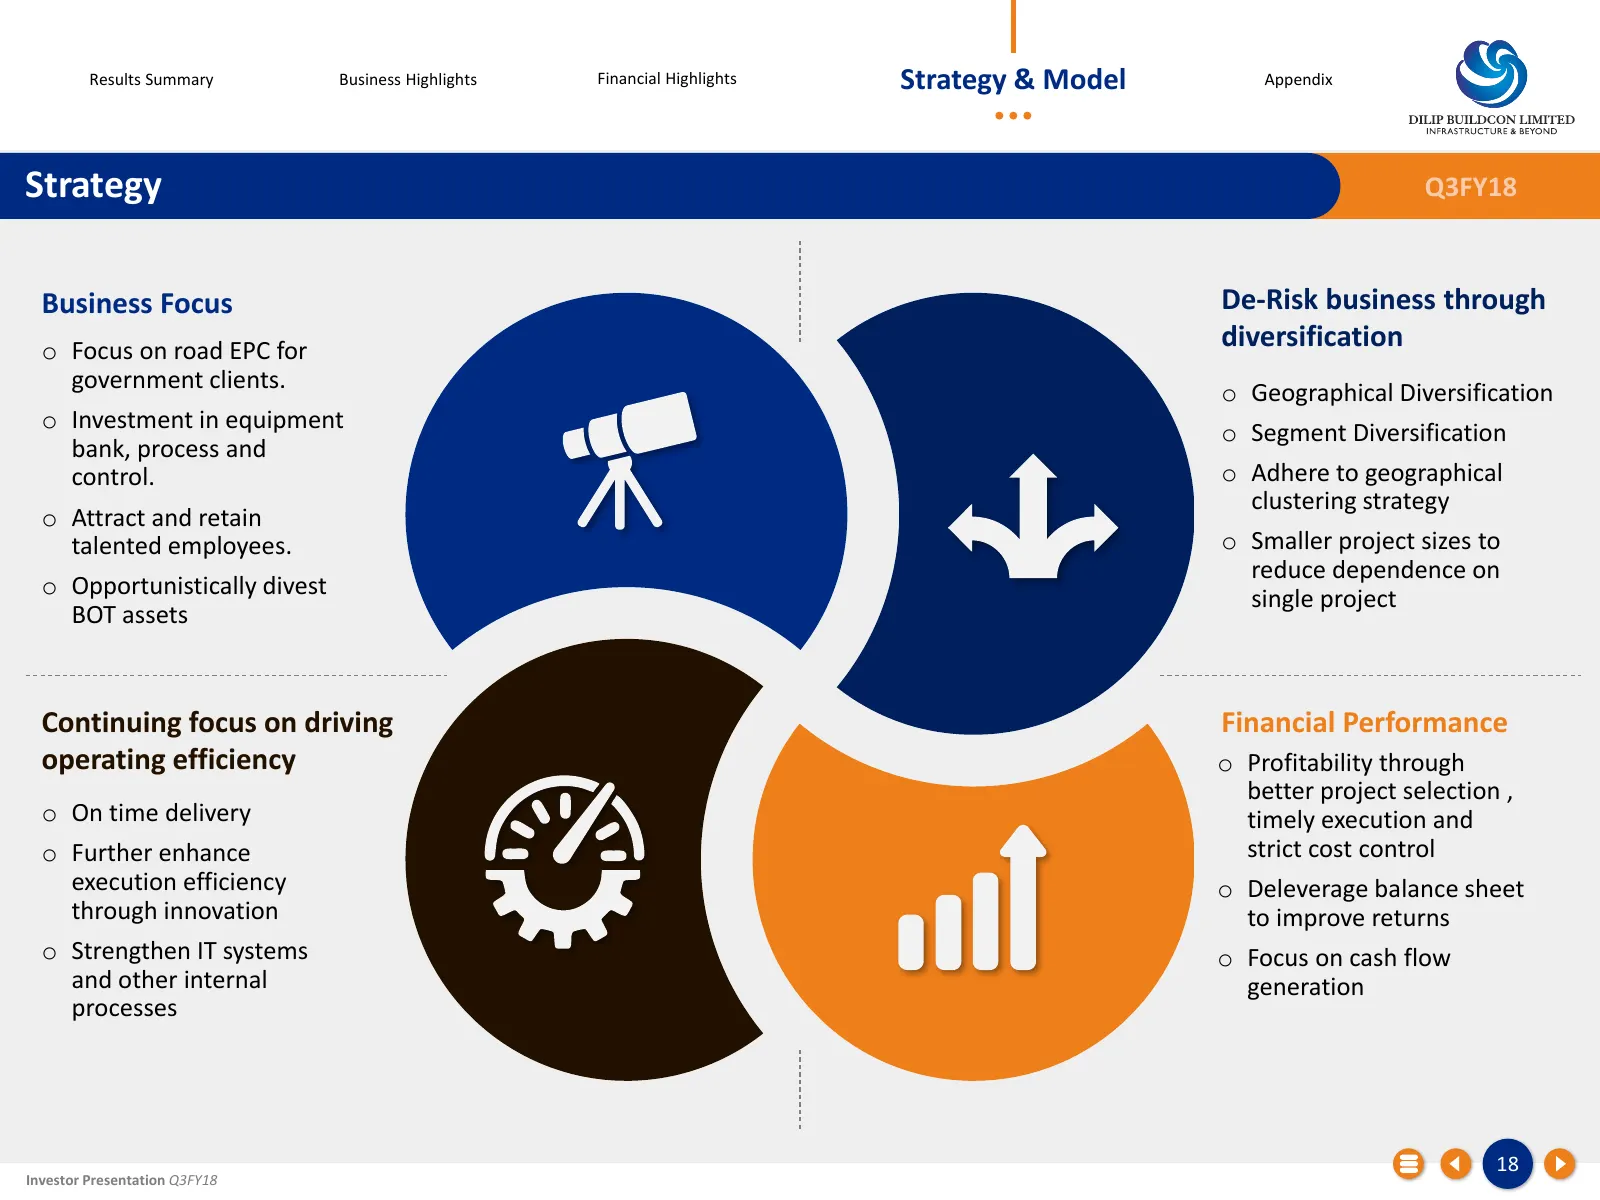
Slide 18: Strategy
Results Summary Business Highlights Financial Highlights Strategy & Model Appendix Strategy Q3FY18 Business Focus De-Risk business through o Focus on road EPC for diversification government clients. o Geographical Diversification o Investment in equipment o Segment Diversification bank, process and
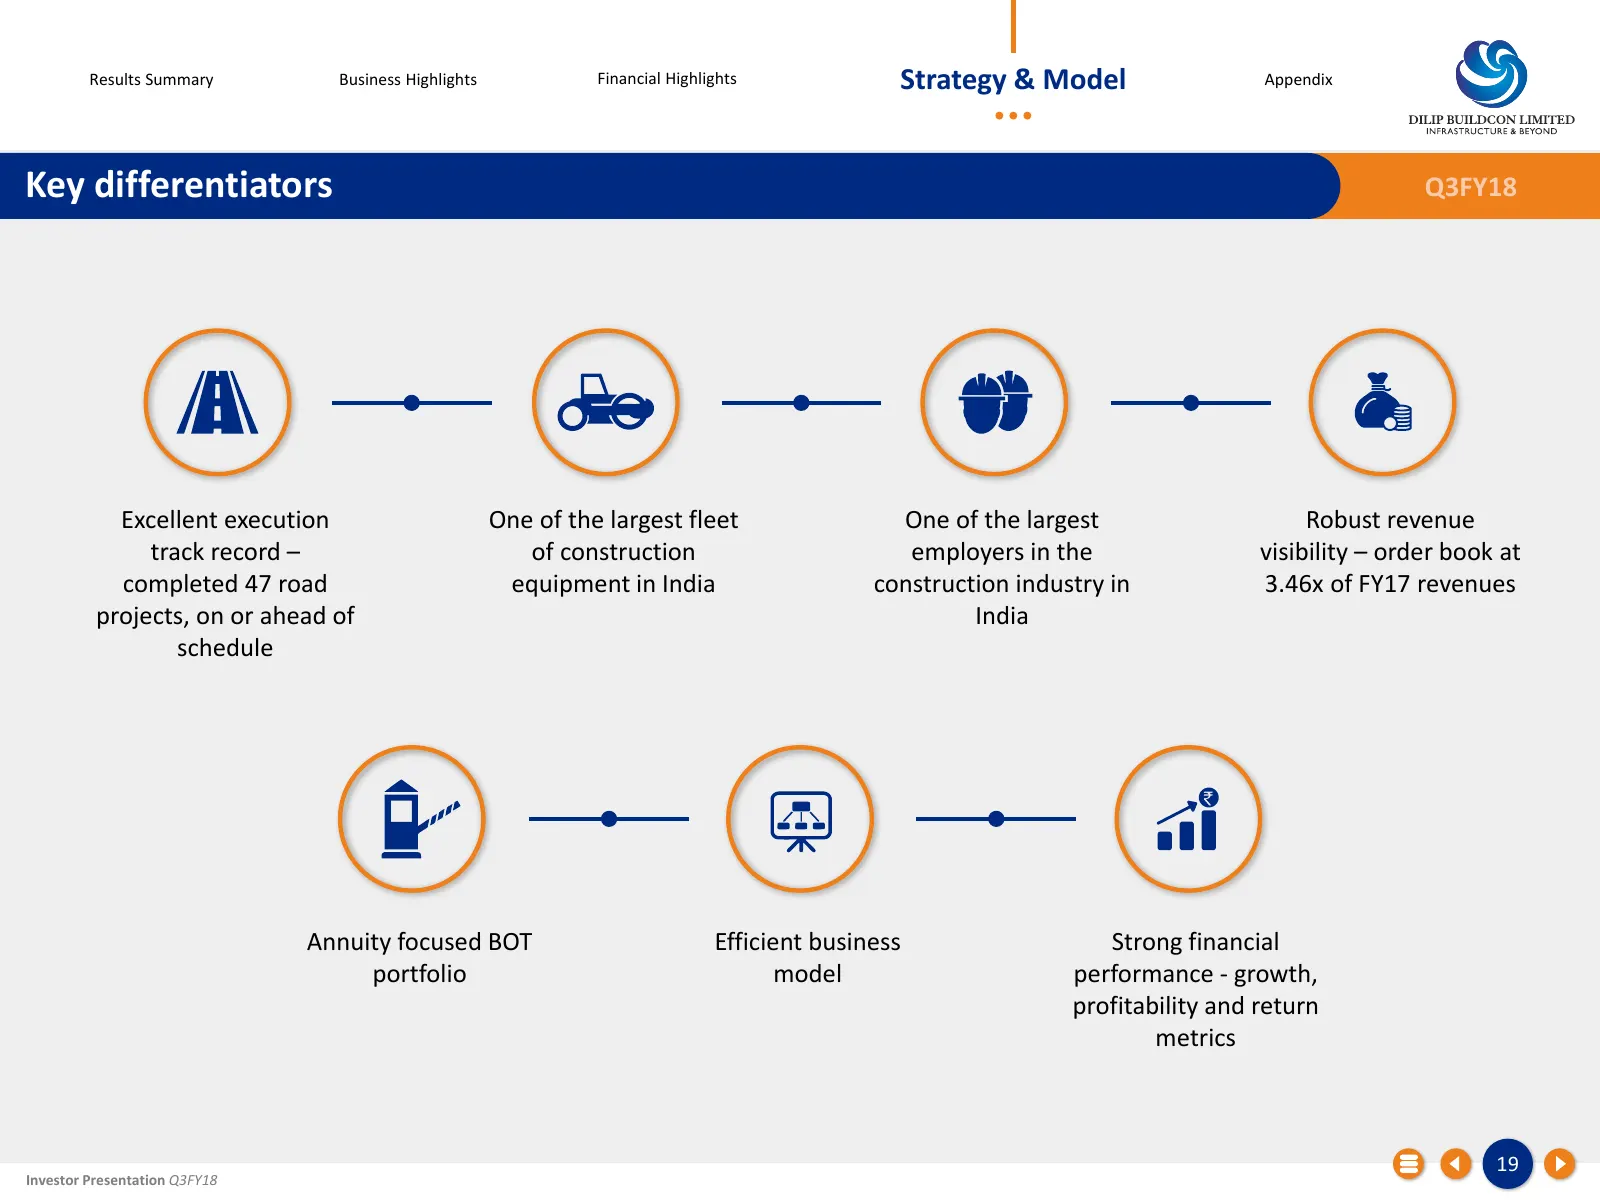
Slide 19: Key differentiators
Results Summary Business Highlights Financial Highlights Strategy & Model Appendix Key differentiators Q3FY18 Excellent execution One of the largest fleet One of the largest Robust revenue track record – of construction employers in the visibility – order book at completed 47 road equipment in India
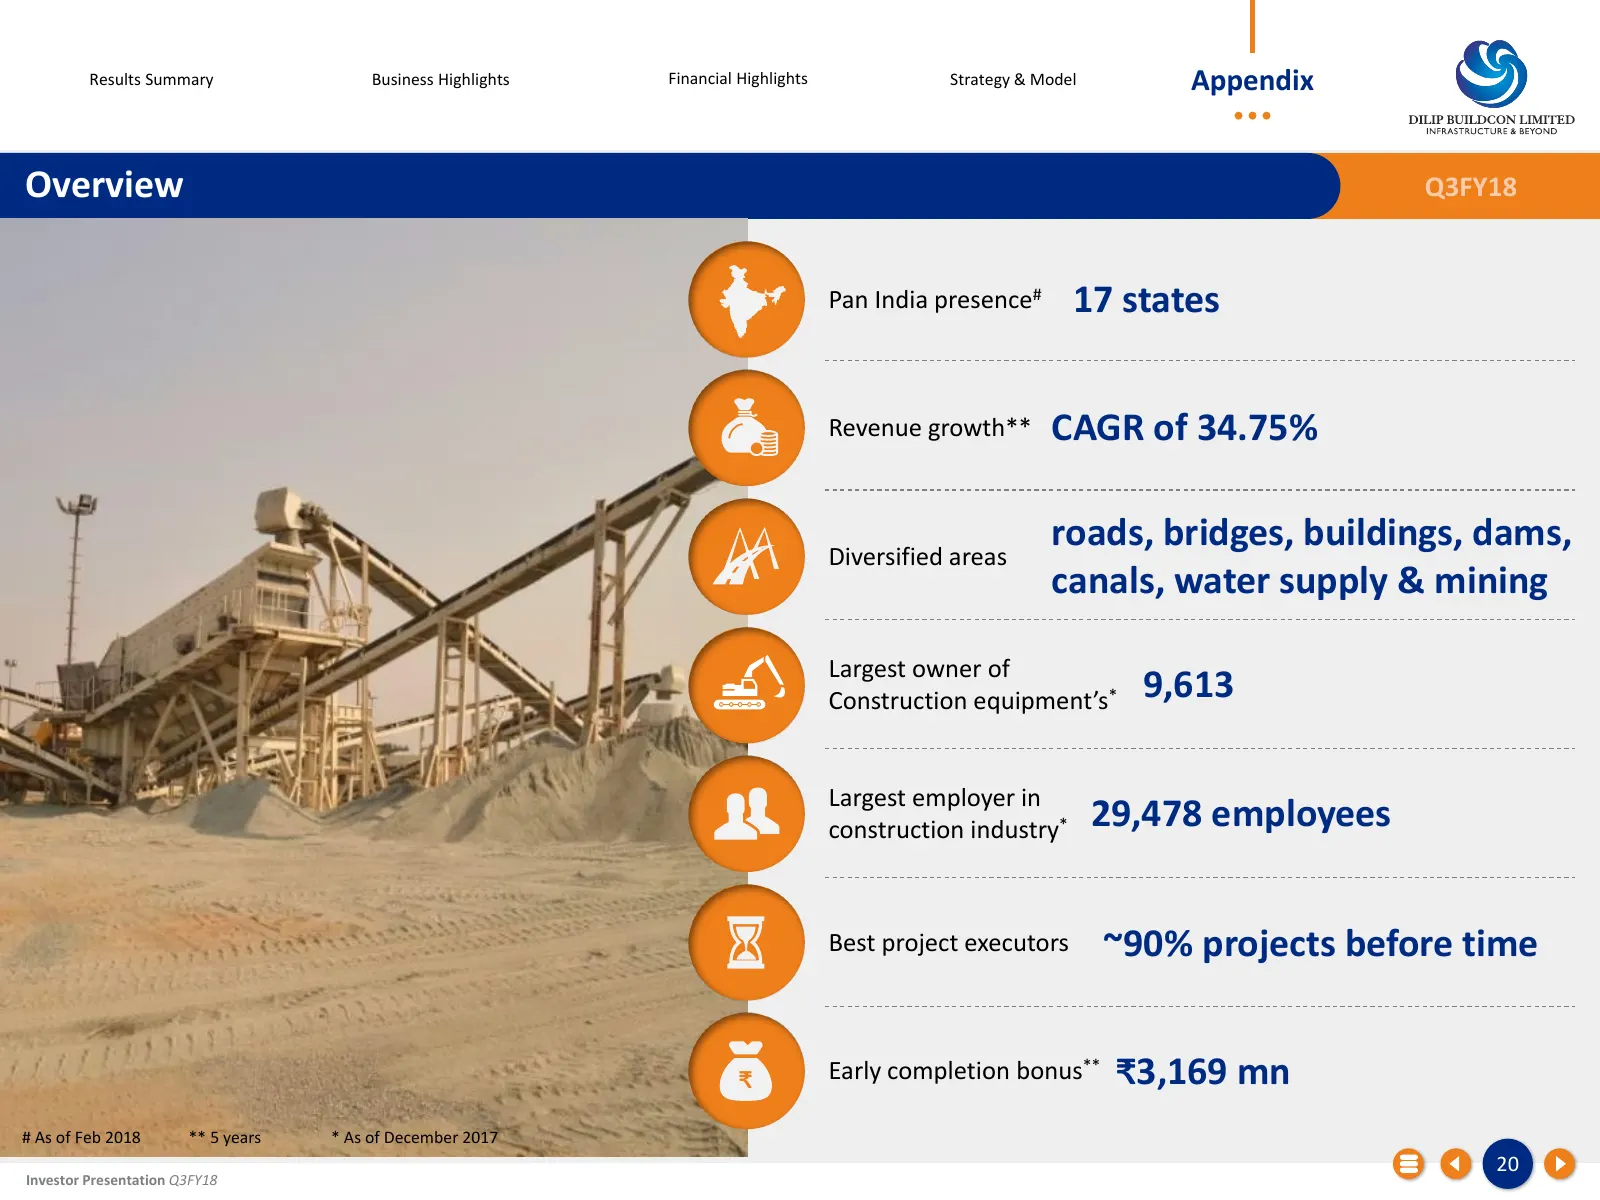
Slide 20: Overview
Results Summary Business Highlights Financial Highlights Strategy & Model Appendix Overview Q3FY18 Pan India presence# 17 states Revenue growth** CAGR of 34.75% Diversified areas roads, bridges, buildings, dams, canals, water supply & mining Largest owner of Construction equipment’s* 9,613 Largest e
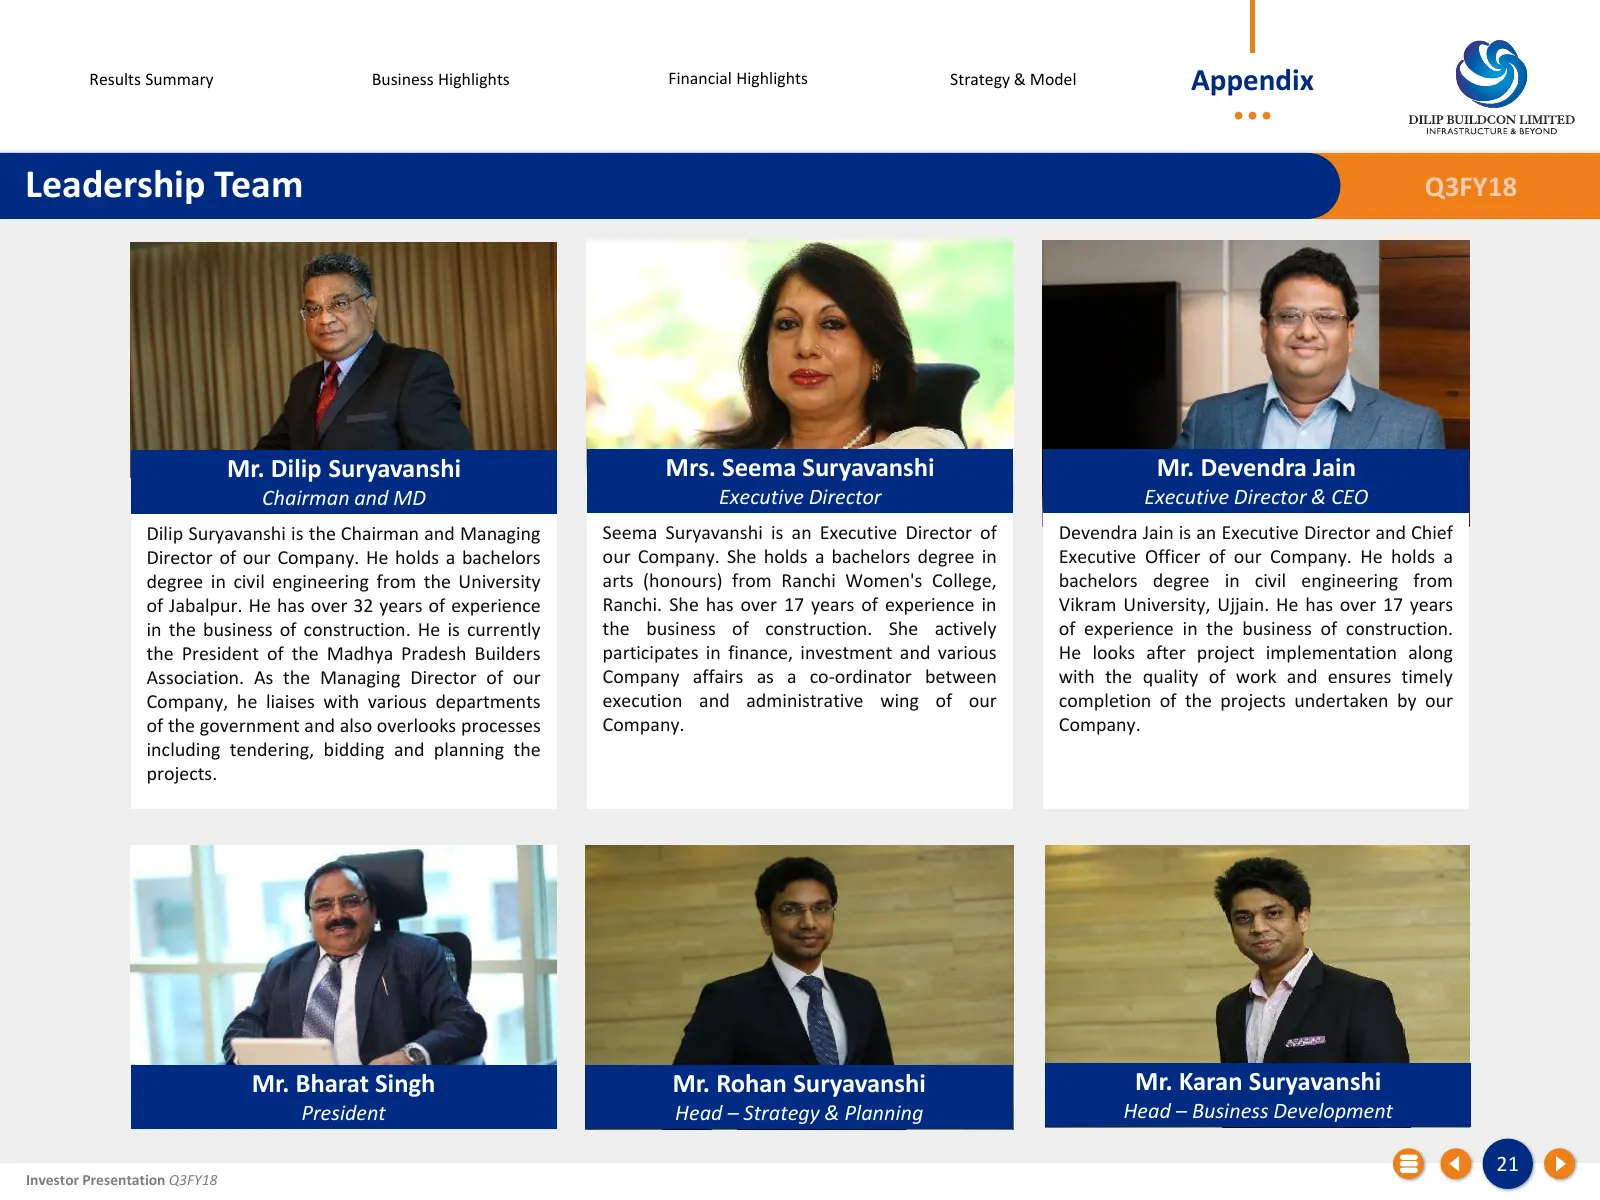
Slide 21: Leadership Team
Results Summary Business Highlights Financial Highlights Strategy & Model Appendix Leadership Team Q3FY18 Mr. Dilip Suryavanshi Mrs. Seema Suryavanshi Mr. Devendra Jain Chairman and MD Executive Director Executive Director & CEO Dilip Suryavanshi is the Chairman and Managing Seema Suryavanshi is an
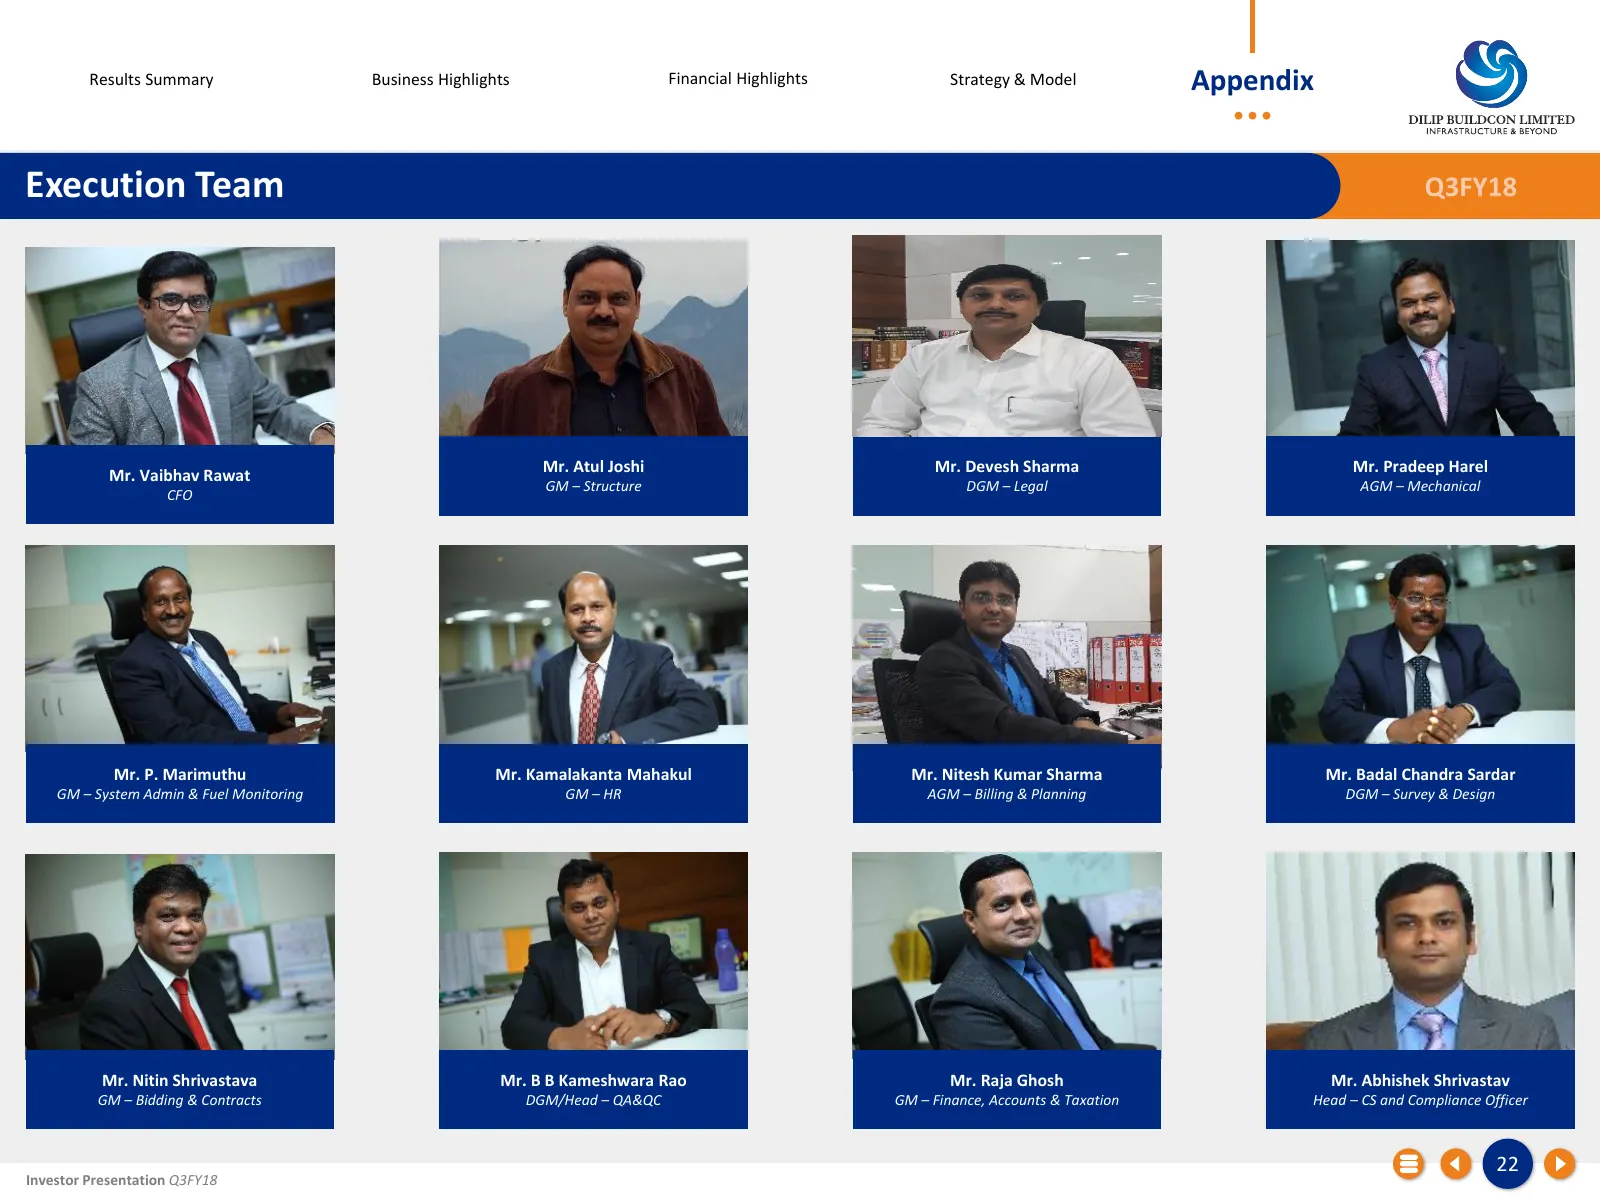
Slide 22: Execution Team
Results Summary Business Highlights Financial Highlights Strategy & Model Appendix Execution Team Q3FY18 Mr. Vaibhav Rawat Mr. Atul Joshi Mr. Devesh Sharma Mr. Pradeep Harel GM – Structure DGM – Legal AGM – Mechanical CFO Mr. P. Marimuthu Mr. Kamalakanta Mahakul Mr. Nitesh Kumar Sharma Mr. Badal Cha
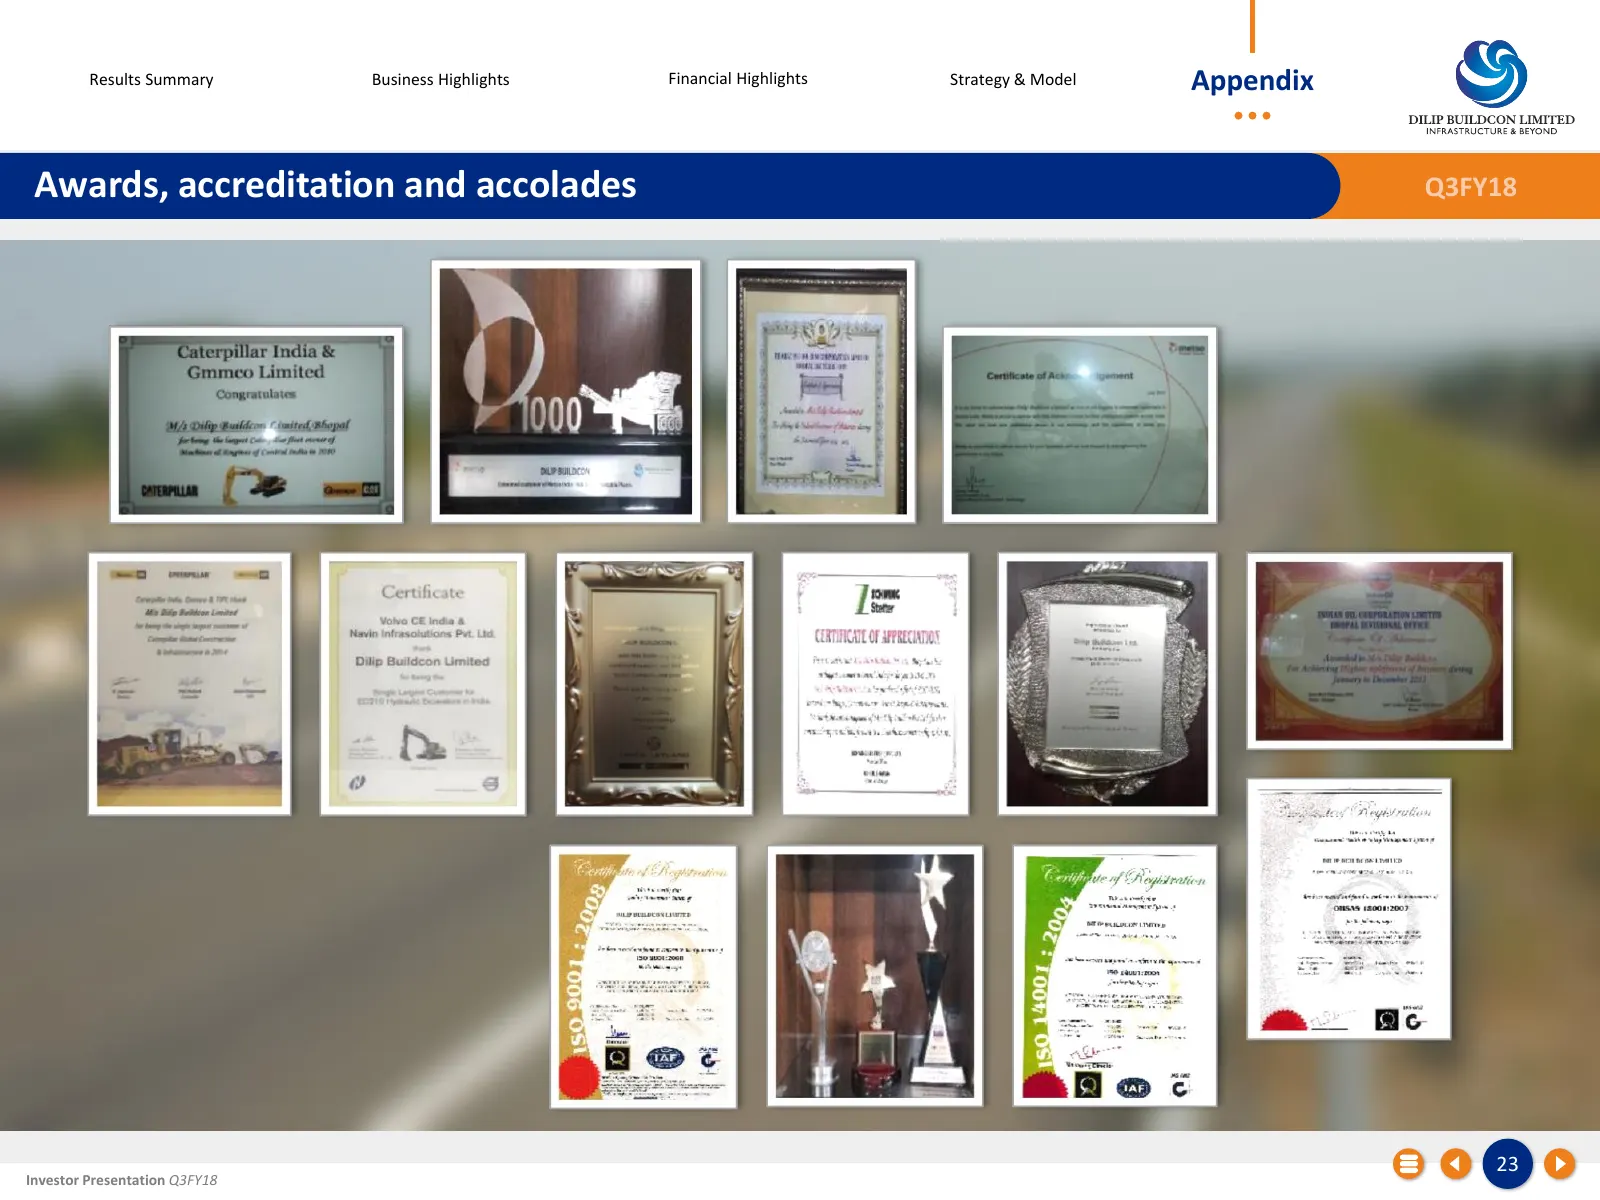
Slide 23: Awards, accreditation and accolades
Results Summary Business Highlights Financial Highlights Strategy & Model Appendix Awards, accreditation and accolades Q3FY18 23 Investor Presentation Q3FY18
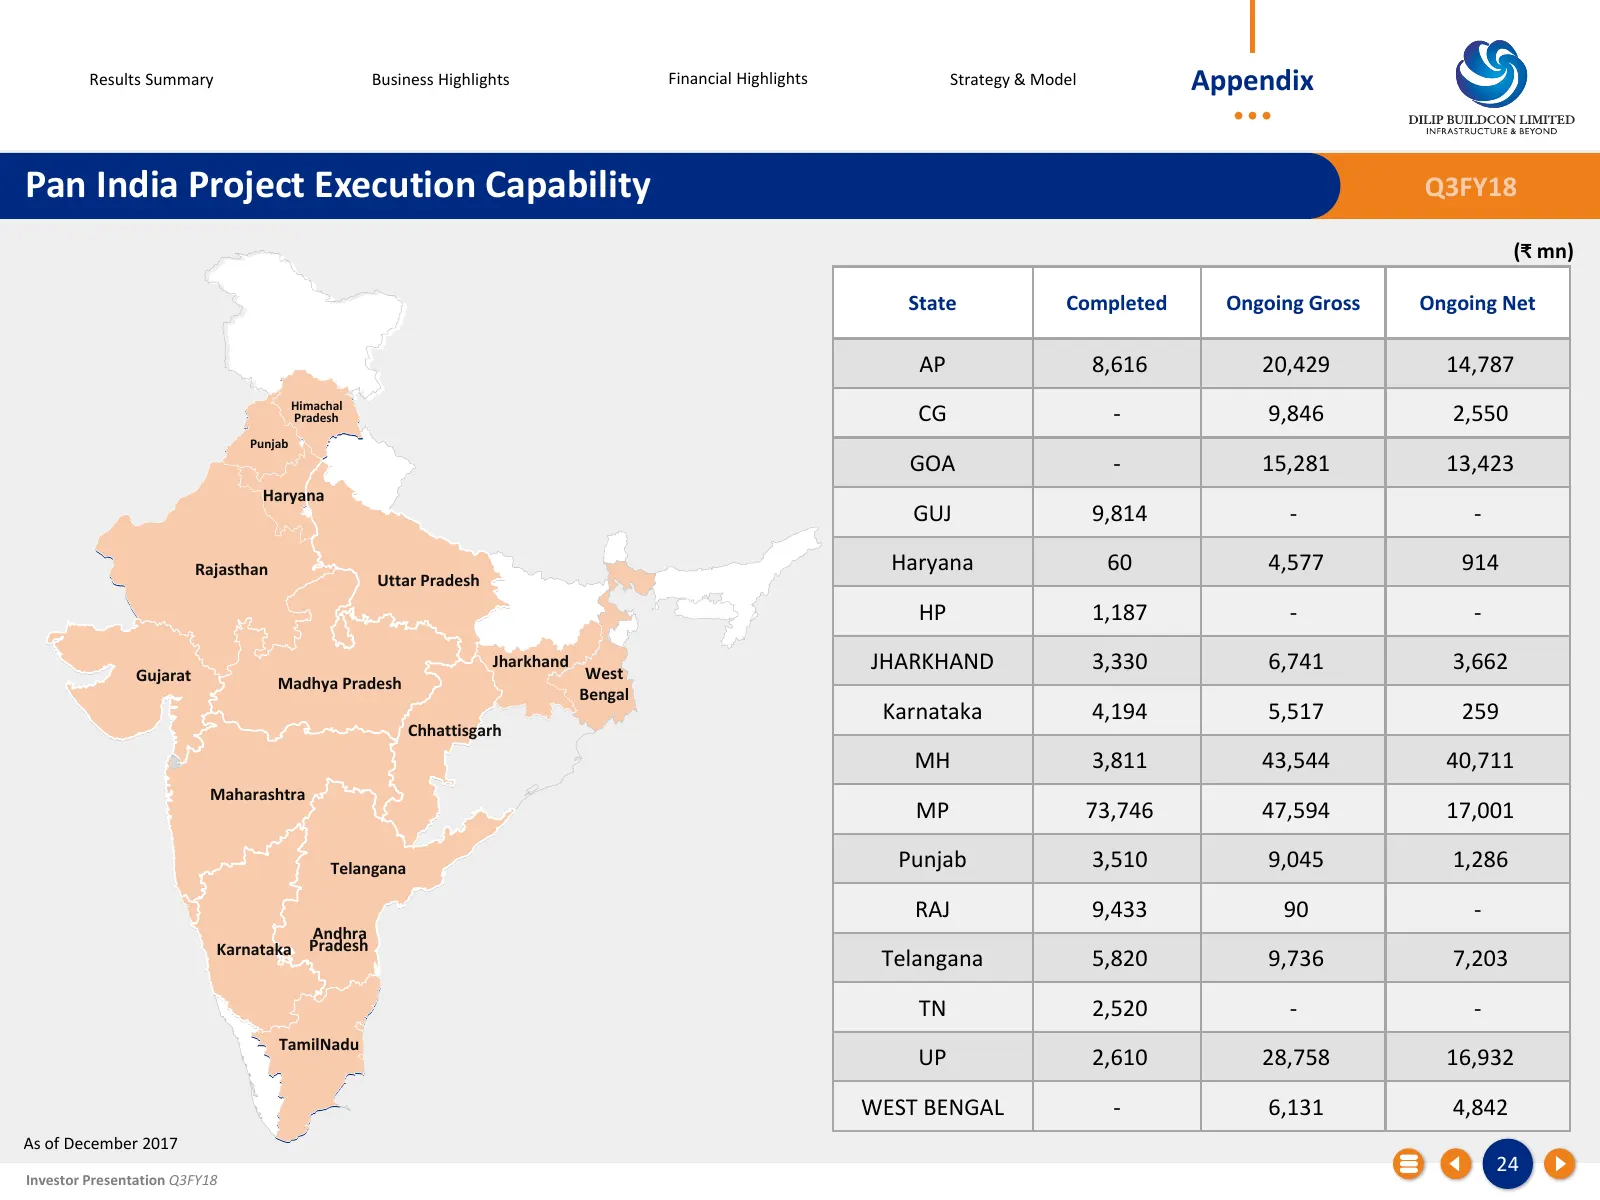
Slide 24: Pan India Project Execution Capability
Results Summary Business Highlights Financial Highlights Strategy & Model Appendix Pan India Project Execution Capability Q3FY18 (₹ mn) State Completed Ongoing Gross Ongoing Net AP 8,616 20,429 14,787 Himachal Pradesh CG - 9,846 2,550 Punjab GOA - 15,281 13,423 Haryana GUJ 9,814 - - Rajasthan Haryan
Slide 25: Key Outstanding EPC Projects
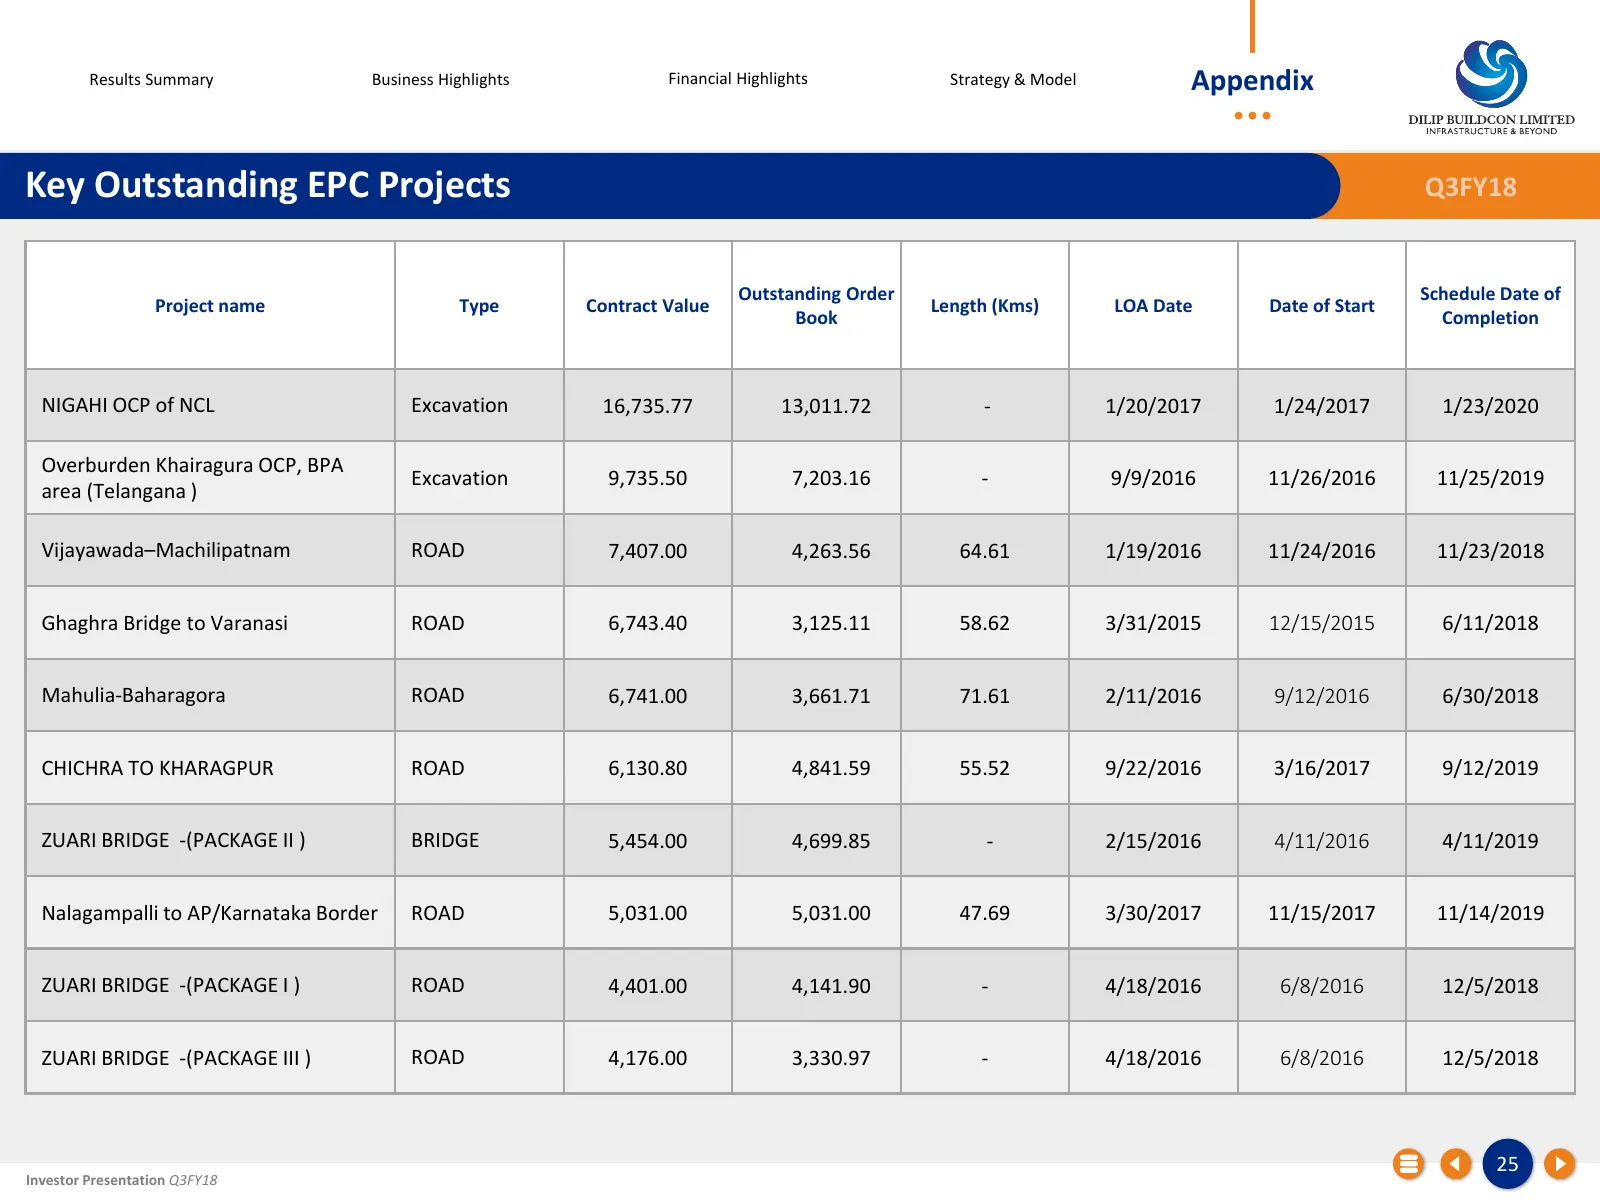
Results Summary Business Highlights Financial Highlights Strategy & Model Appendix Key Outstanding EPC Projects Q3FY18 Outstanding Order Schedule Date of Project name Type Contract Value Length (Kms) LOA Date Date of Start Book Completion NIGAHI OCP of NCL Excavation 16,735.77 13,011.72 - 1/20/2017
Slide 26: BOT Project Portfolio Update
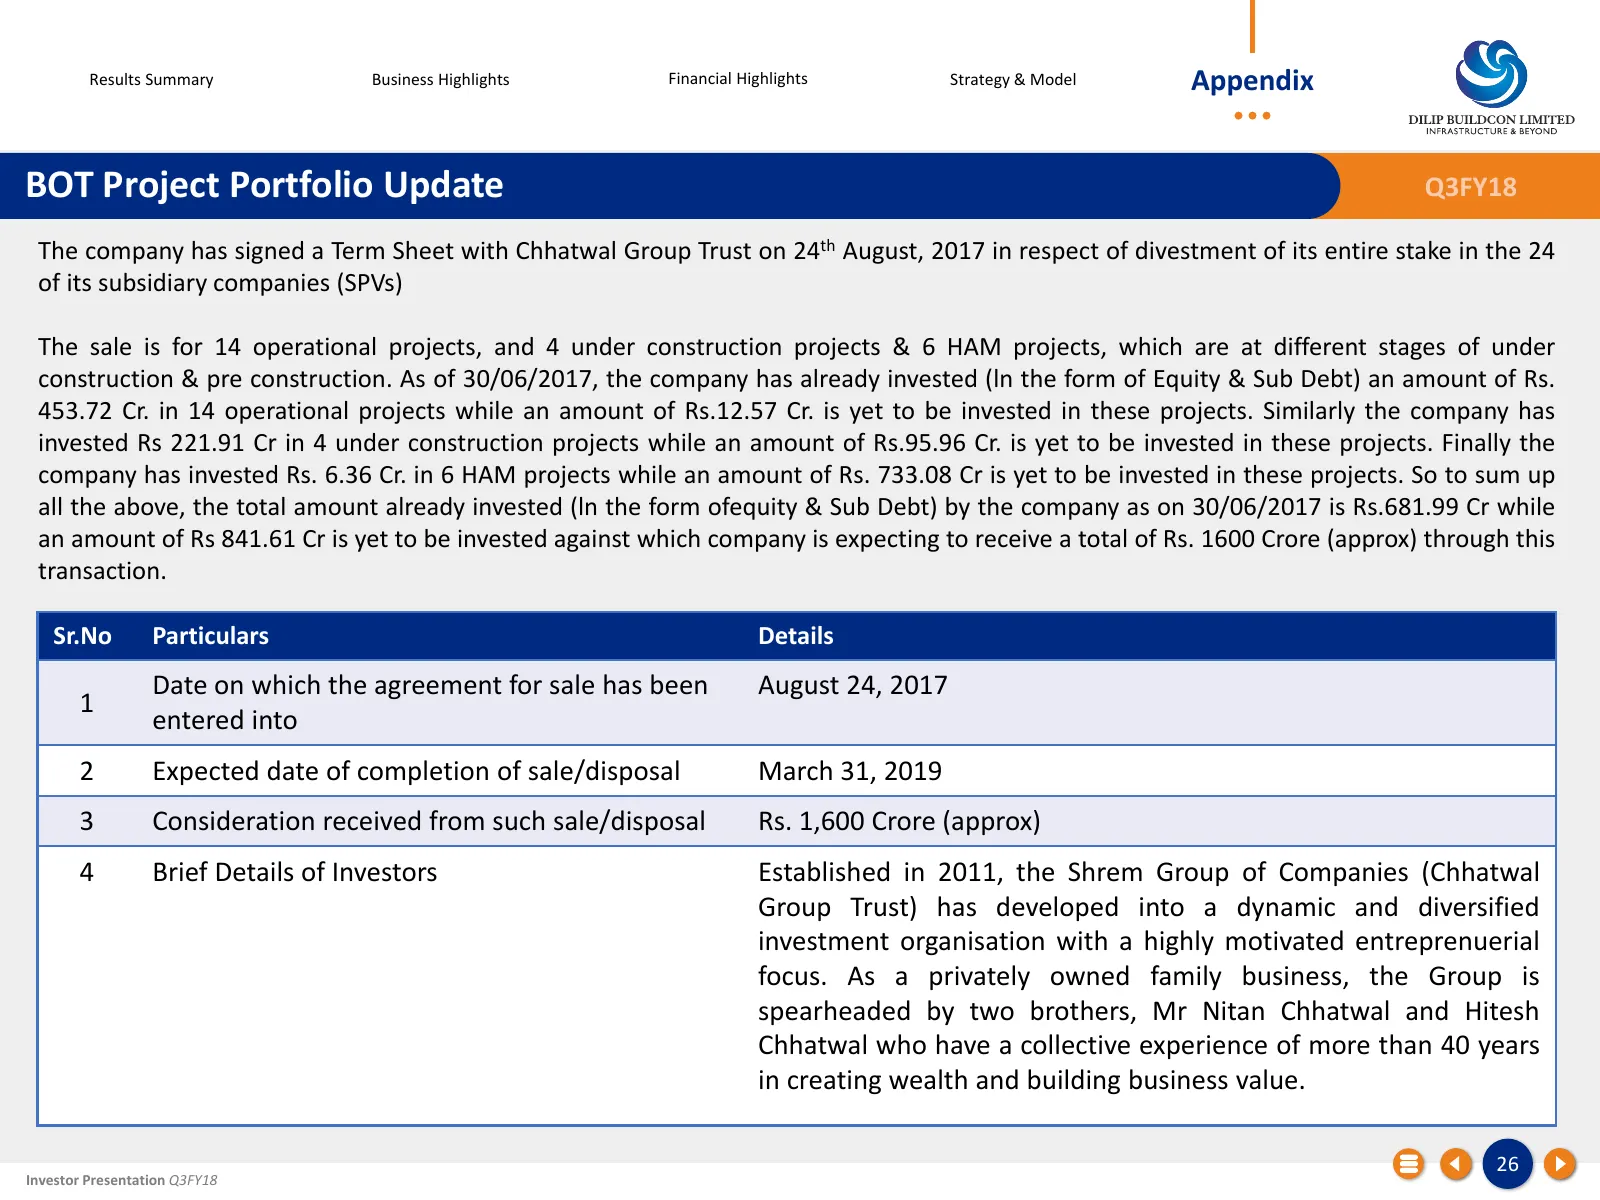
Results Summary Business Highlights Financial Highlights Strategy & Model Appendix BOT Project Portfolio Update Q3FY18 The company has signed a Term Sheet with Chhatwal Group Trust on 24th August, 2017 in respect of divestment of its entire stake in the 24 of its subsidiary companies (SPVs) The sale
Slide 27: BOT Project Portfolio
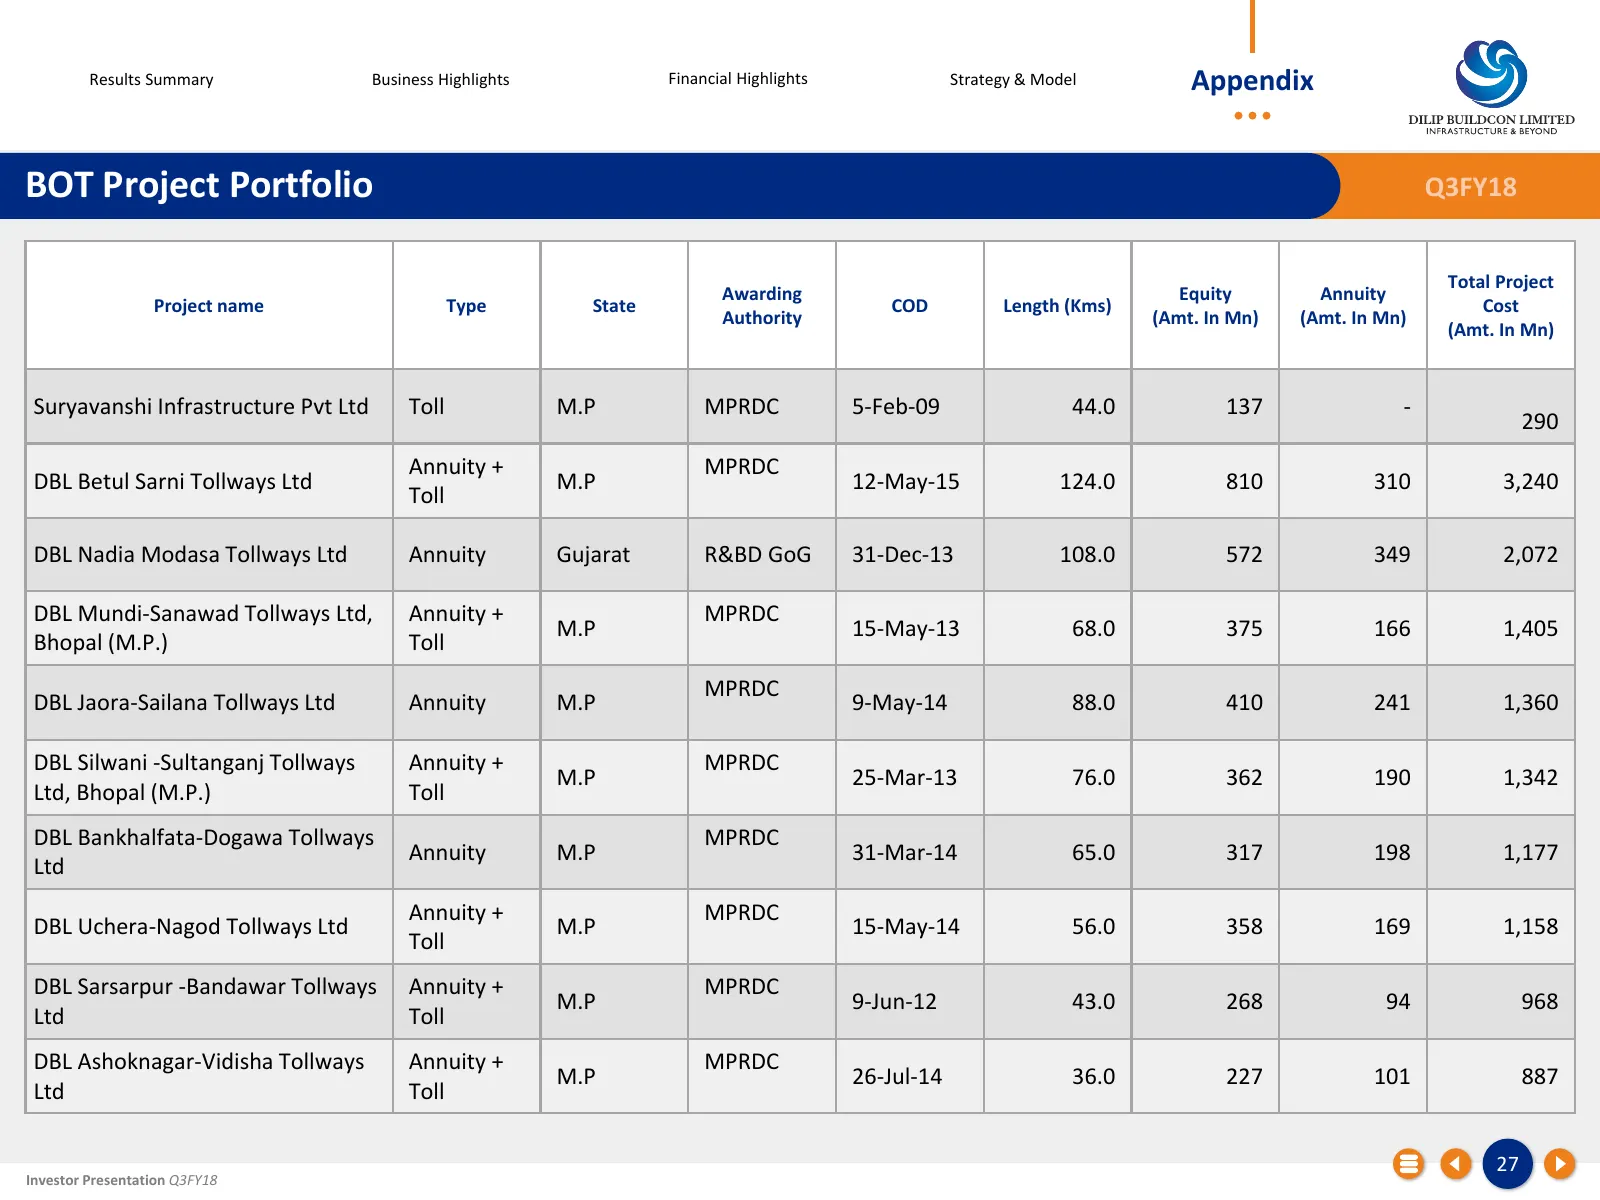
Results Summary Business Highlights Financial Highlights Strategy & Model Appendix BOT Project Portfolio Q3FY18 Total Project Awarding Equity Annuity Project name Type State COD Length (Kms) Cost Authority (Amt. In Mn) (Amt. In Mn) (Amt. In Mn) Suryavanshi Infrastructure Pvt Ltd Toll M.P MPRDC 5-Feb
Slide 28: BOT Project Portfolio
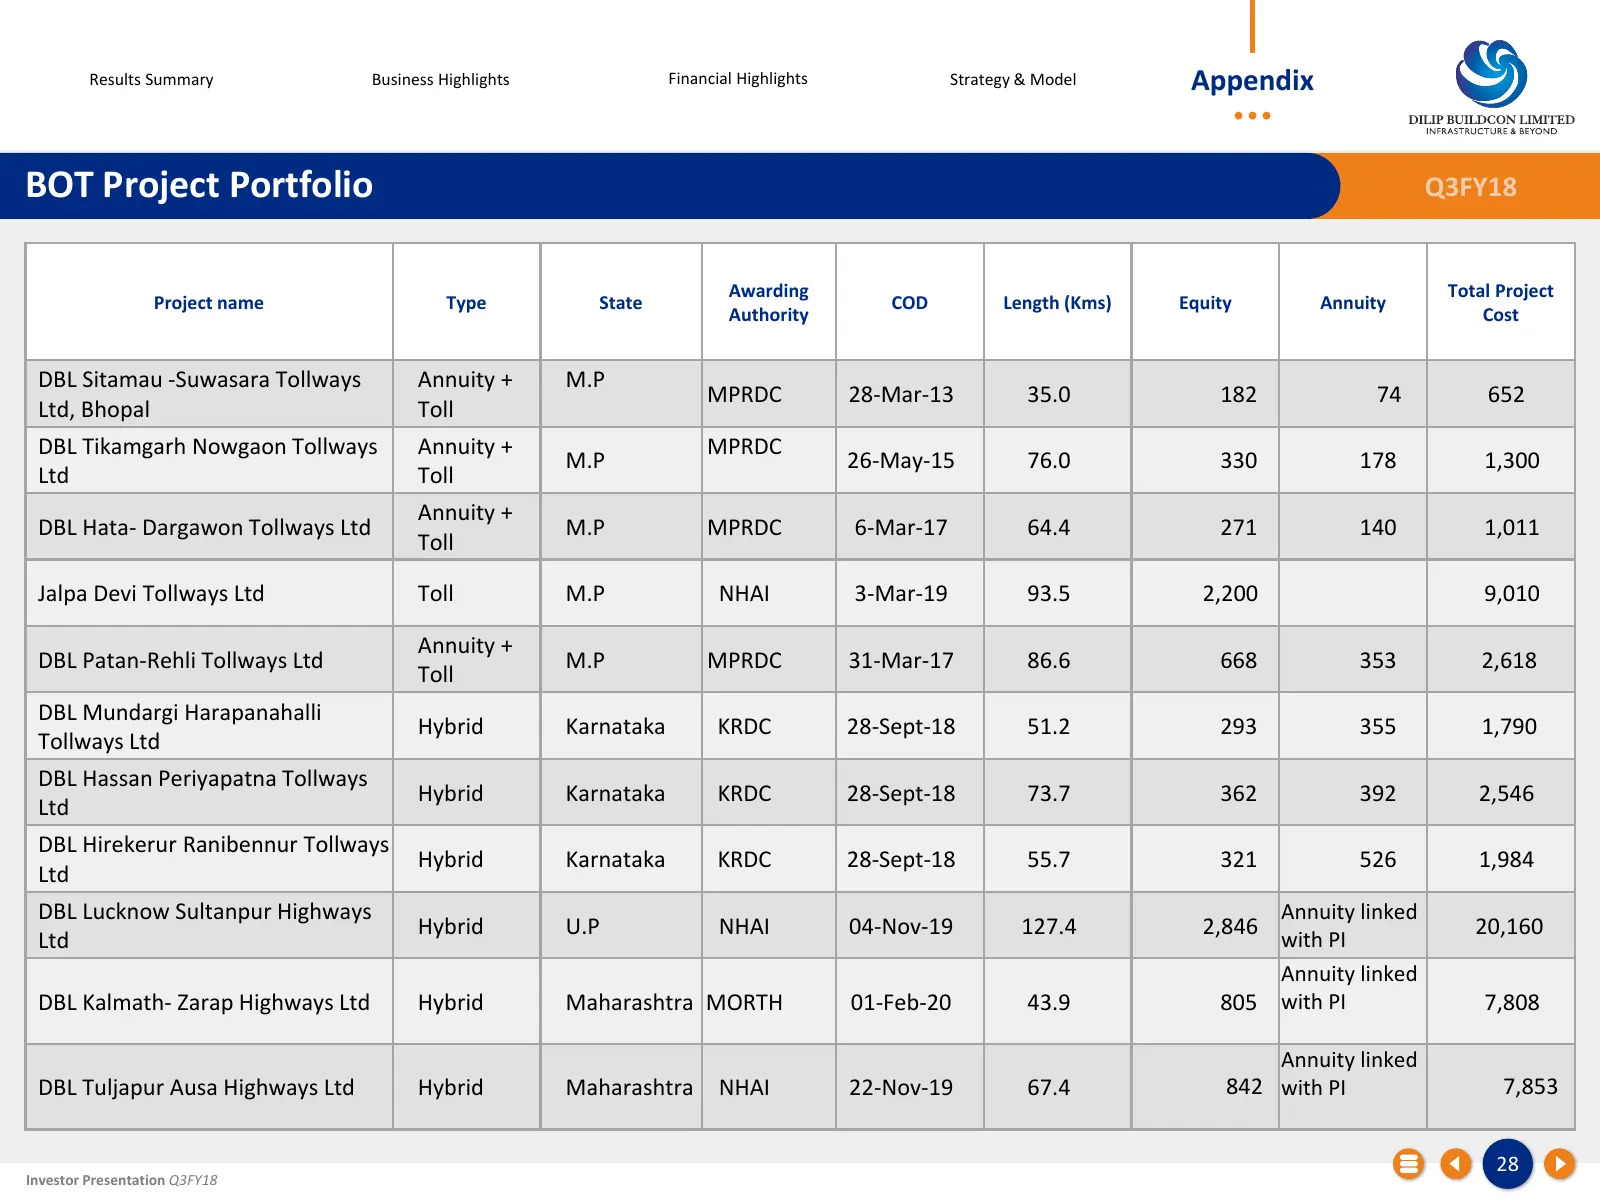
Results Summary Business Highlights Financial Highlights Strategy & Model Appendix BOT Project Portfolio Q3FY18 Awarding Total Project Project name Type State COD Length (Kms) Equity Annuity Authority Cost DBL Sitamau -Suwasara Tollways Annuity + M.P MPRDC 28-Mar-13 35.0 182 74 652 Ltd, Bhopal Toll
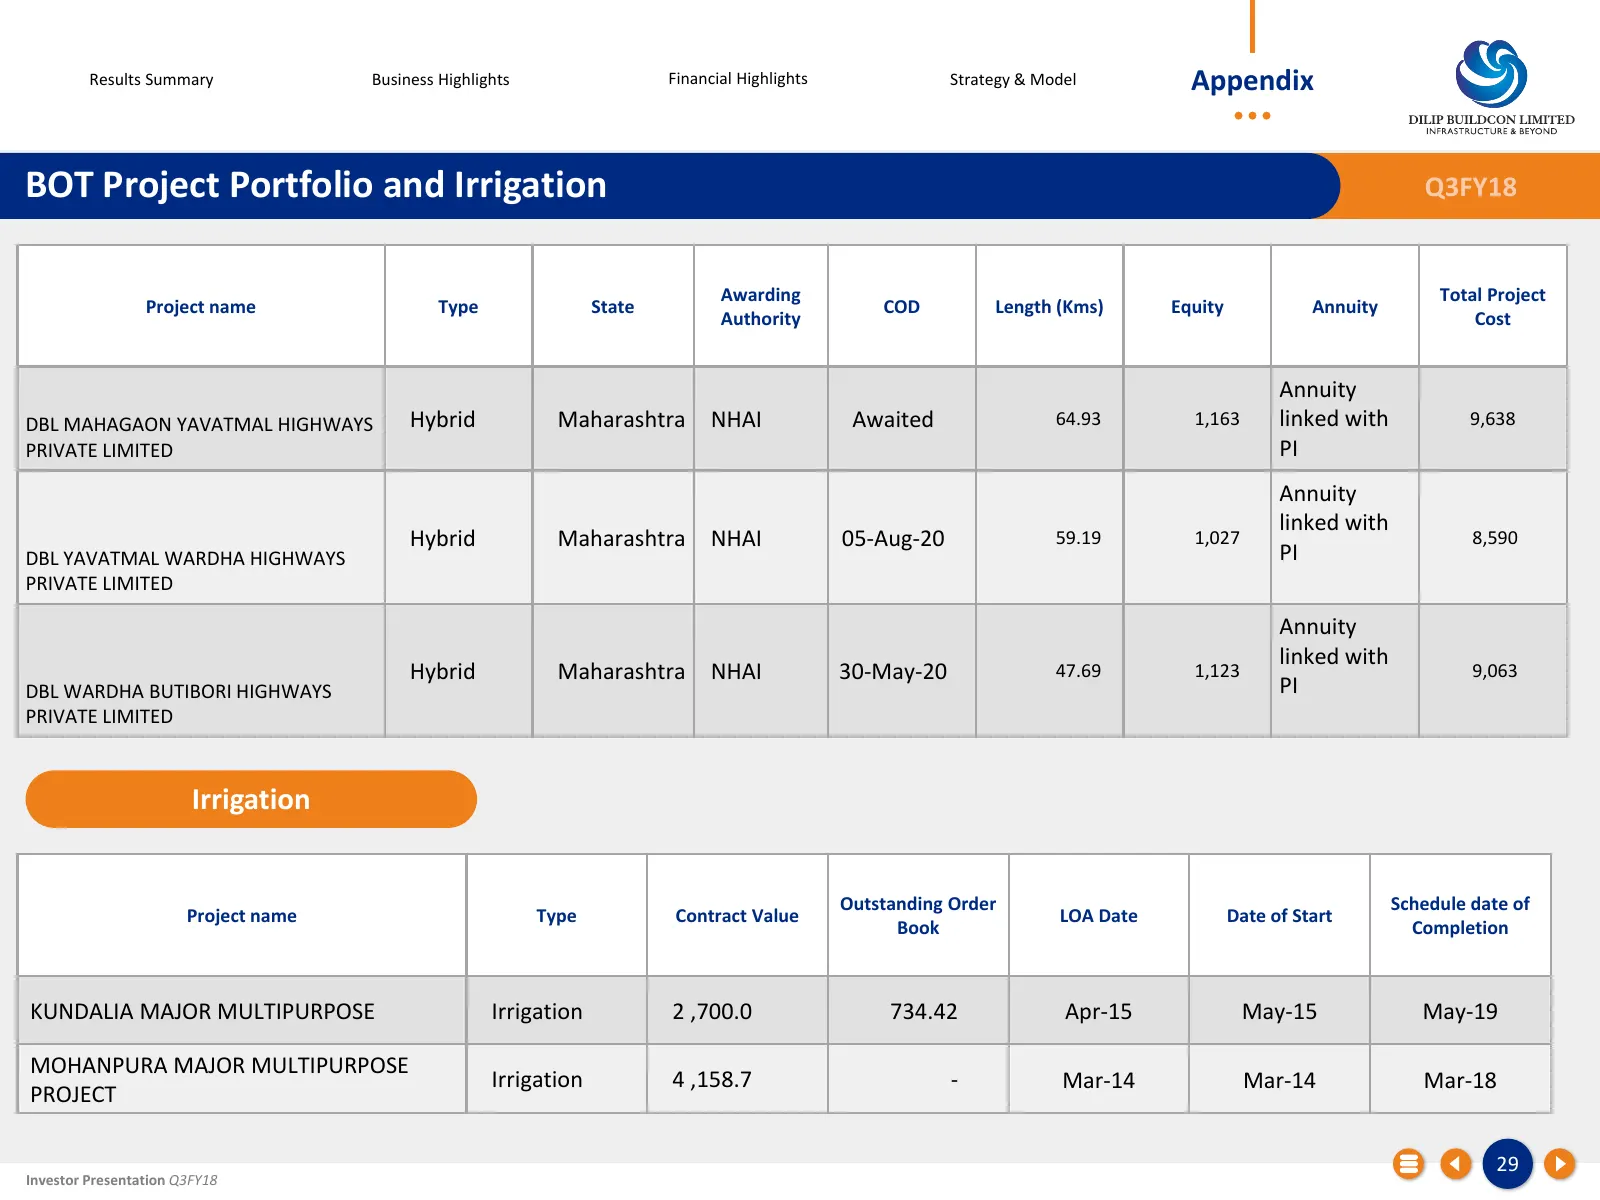
Slide 29: BOT Project Portfolio and Irrigation
Results Summary Business Highlights Financial Highlights Strategy & Model Appendix BOT Project Portfolio and Irrigation Q3FY18 Awarding Total Project Project name Type State COD Length (Kms) Equity Annuity Authority Cost Annuity DBL MAHAGAON YAVATMAL HIGHWAYS Hybrid Maharashtra NHAI Awaited 64.93 1,
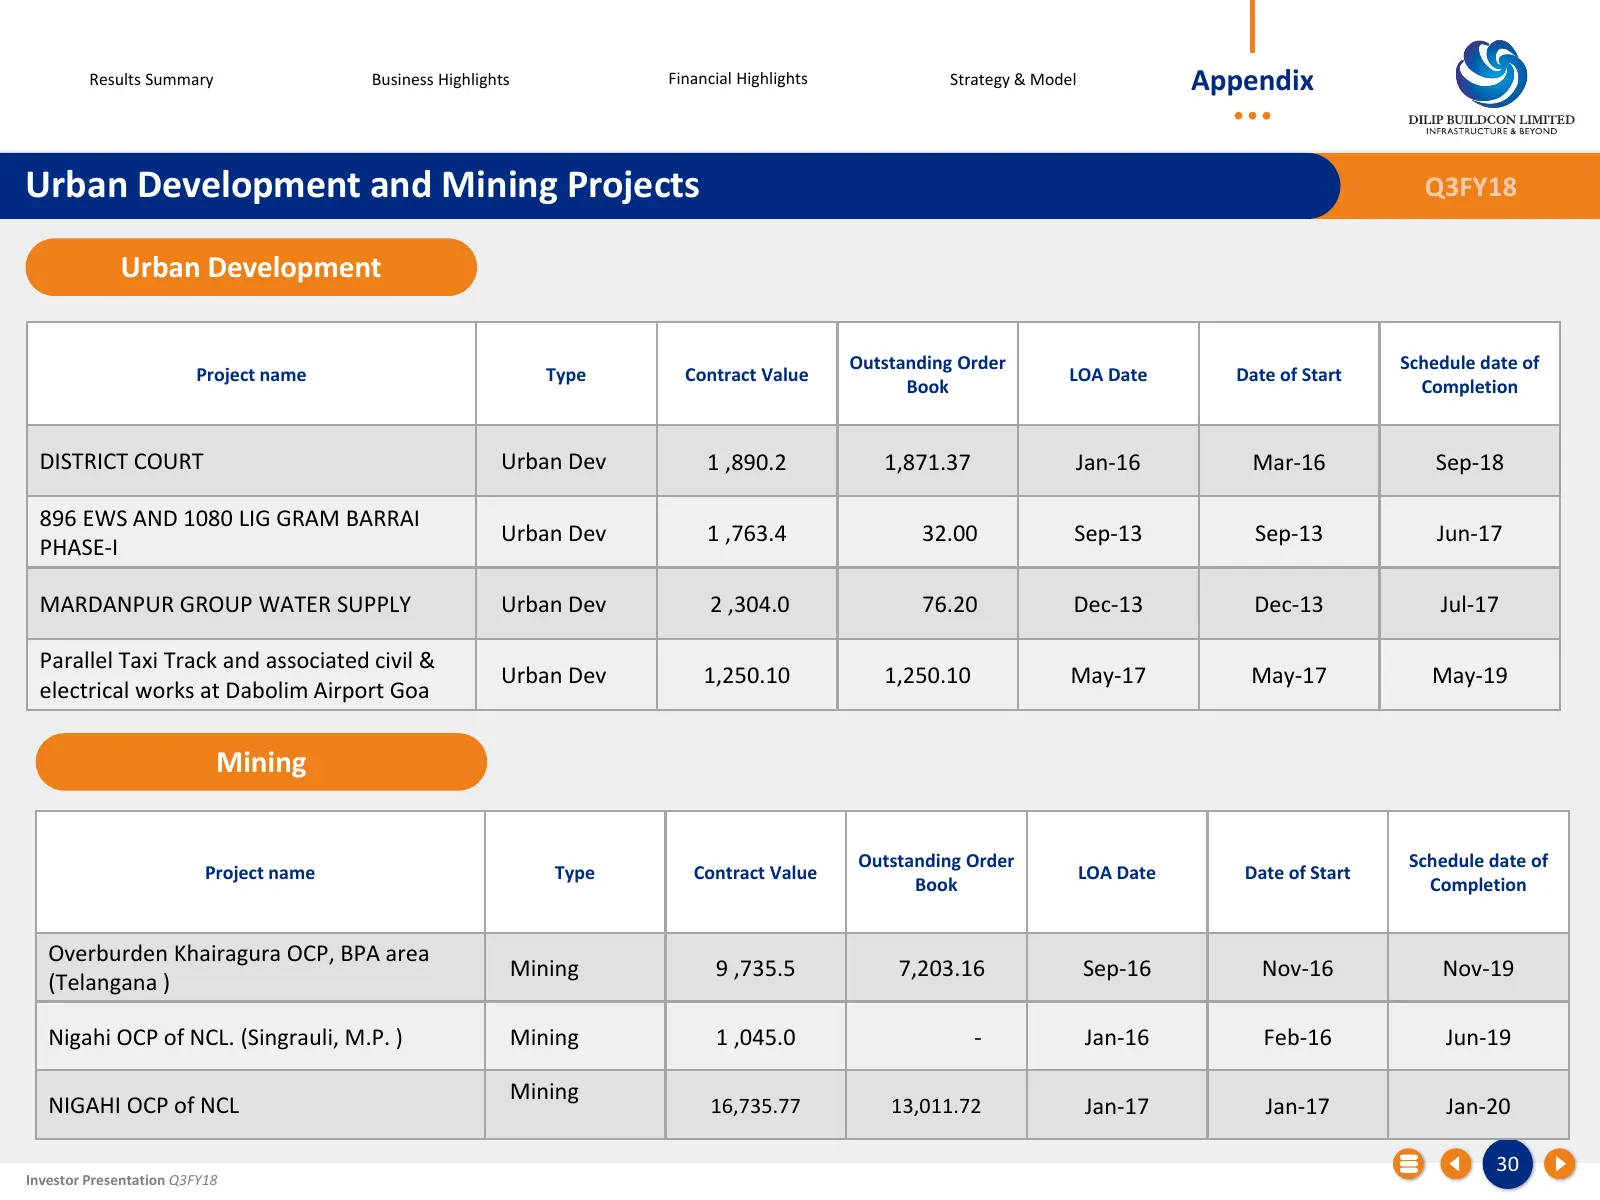
Slide 30: Urban Development and Mining Projects
Results Summary Business Highlights Financial Highlights Strategy & Model Appendix Urban Development and Mining Projects Q3FY18 Urban Development Outstanding Order Schedule date of Project name Type Contract Value LOA Date Date of Start Book Completion DISTRICT COURT Urban Dev 1 ,890.2 1,871.37 Jan-
Slide 31: Thank You
Thank You DILIP BUILDCON LIMITED Plot No. 5, Inside Govind Narayan Singh Gate, Chuna Bhatti, Kolar Road, Bhopal Madhya Pradesh - 462 016 Tel.: 0755 – 4029999 Fax: 0755 – 4029998 Email: db@dilipbuildcon.co.in CIN: U45201MP2006PLC018689 S-ANCIAL GLOBAL SOLUTIONS PVT. LTD. Rahul Rajagopalan (Investor R
Source: Internet Archive copy of dilipbuildcon.com
More decks from Dilip Buildcon Ltd.
 Q2 & H1 FY27 Earnings Presentation43 slides · Nov 12, 2026
 Q1 FY27 Earnings Presentation38 slides · Aug 10, 2026
 Q4 FY26 Earnings Presentation43 slides · May 14, 2026
 Q3 FY26 Earnings Presentation47 slides · Feb 10, 2026
 Q2 FY26 Earnings Presentation46 slides · Nov 13, 2025
 Q1 FY26 Earnings Presentation42 slides · Jul 29, 2025