Ushio Inc. · TSE:6925
Ushio — H1 FY2023 Earnings Presentation
49 slides from Ushio's earnings presentation, Nov 6, 2023

Slide 1: Second Quarter FY2023 Financial Results
Second Quarter FY2023 Financial Results Ushio Inc. November 6, 2023 * All figures in the material have been rounded down to the nearest billion yen. * FY2023 starts from April 1st, 2023 through March 31st, 2024. Copyright © 2023 Ushio Inc., All Rights Reserved Confidential Copyright © 2023 Ushio Inc
Slide 2: H1 FY2023 Overview
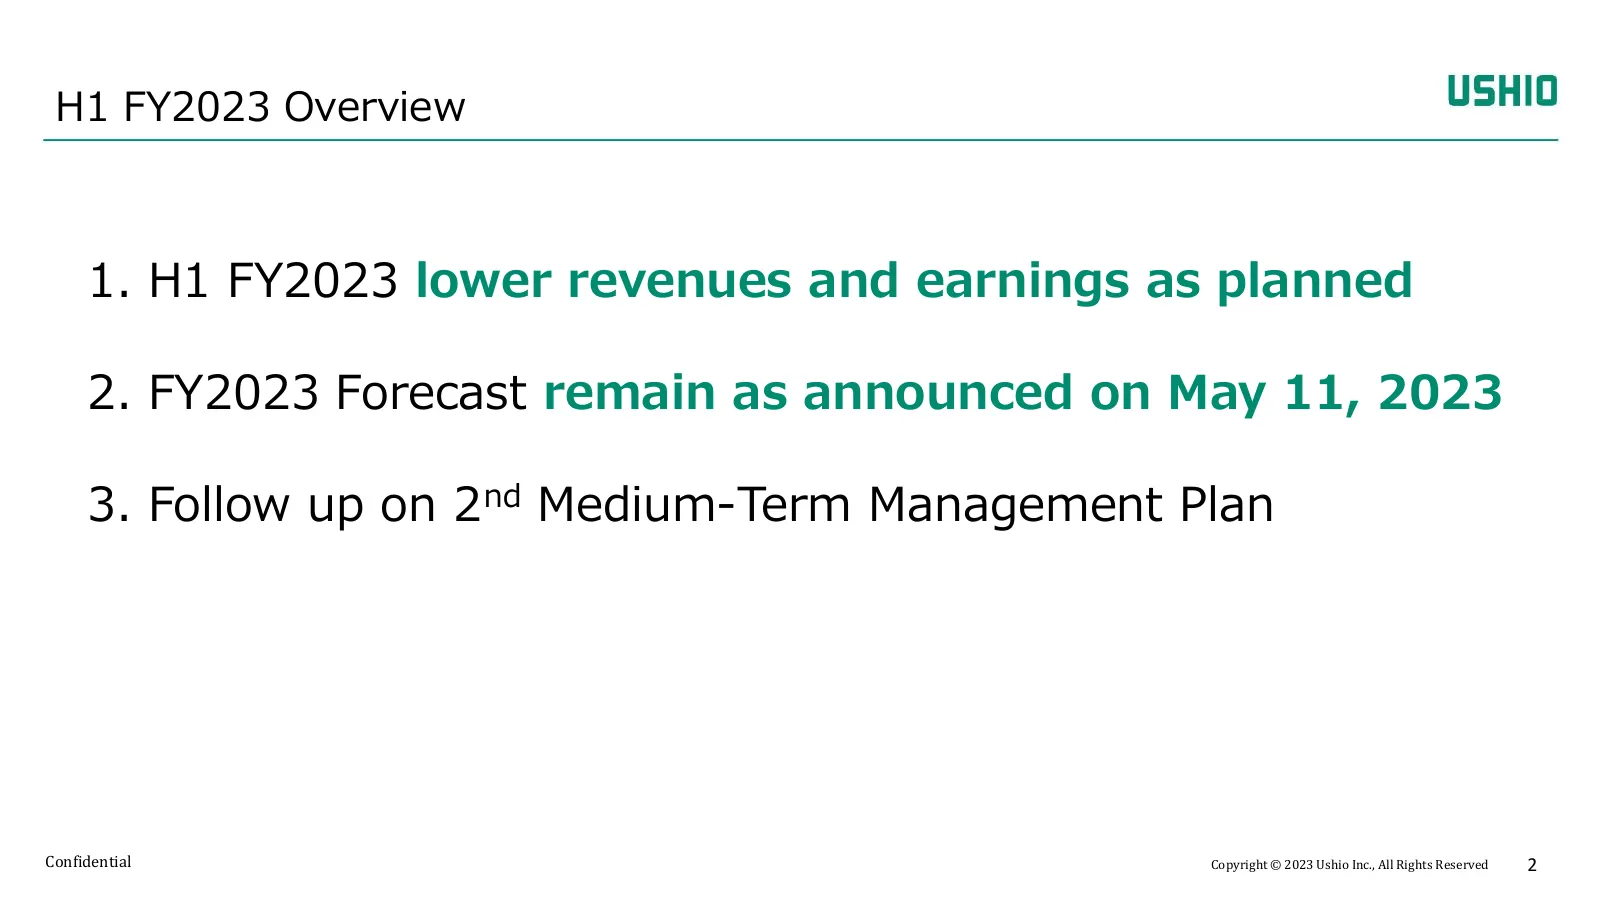
H1 FY2023 Overview 1. H1 FY2023 lower revenues and earnings as planned 2. FY2023 Forecast remain as announced on May 11, 2023 3. Follow up on 2 nd Medium-Term Management Plan Confidential Copyright © 2023 Ushio Inc., All Rights Reserved 2
Slide 3: Agenda
Agenda I. Financial Results for H1 FY2023 II. Full-Year Forecast for FY2023 III. Follow up on 2 nd Medium-Term Management Plan IV. Supplementary Information Copyright © 2023 Ushio Inc., All Rights Reserved 3
Slide 4: Financial Results for H1 FY2023
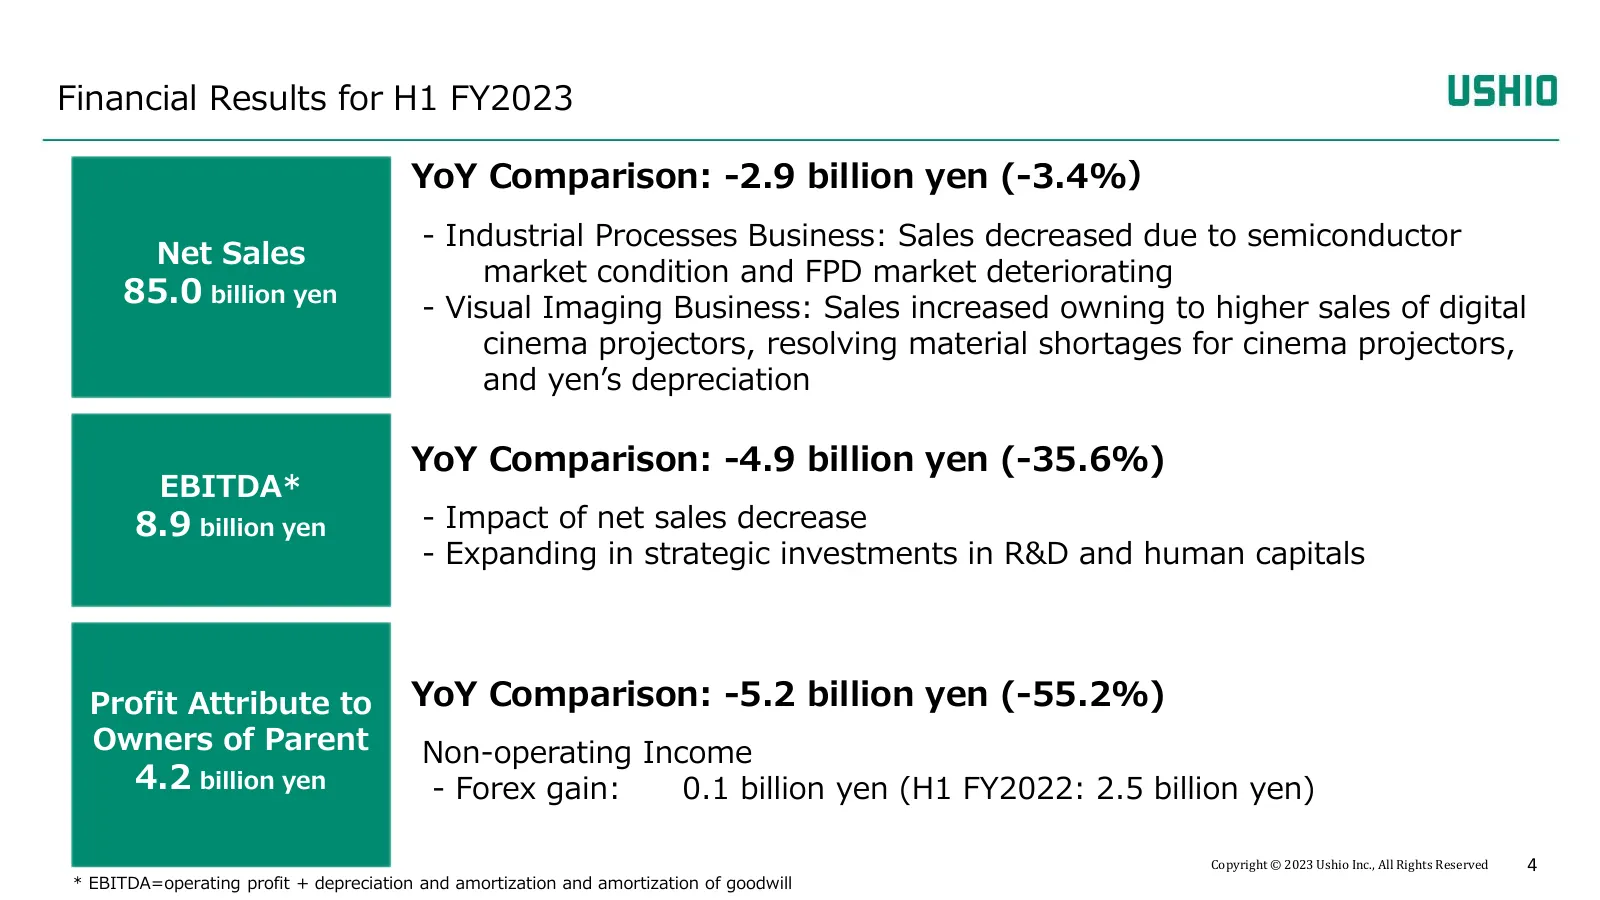
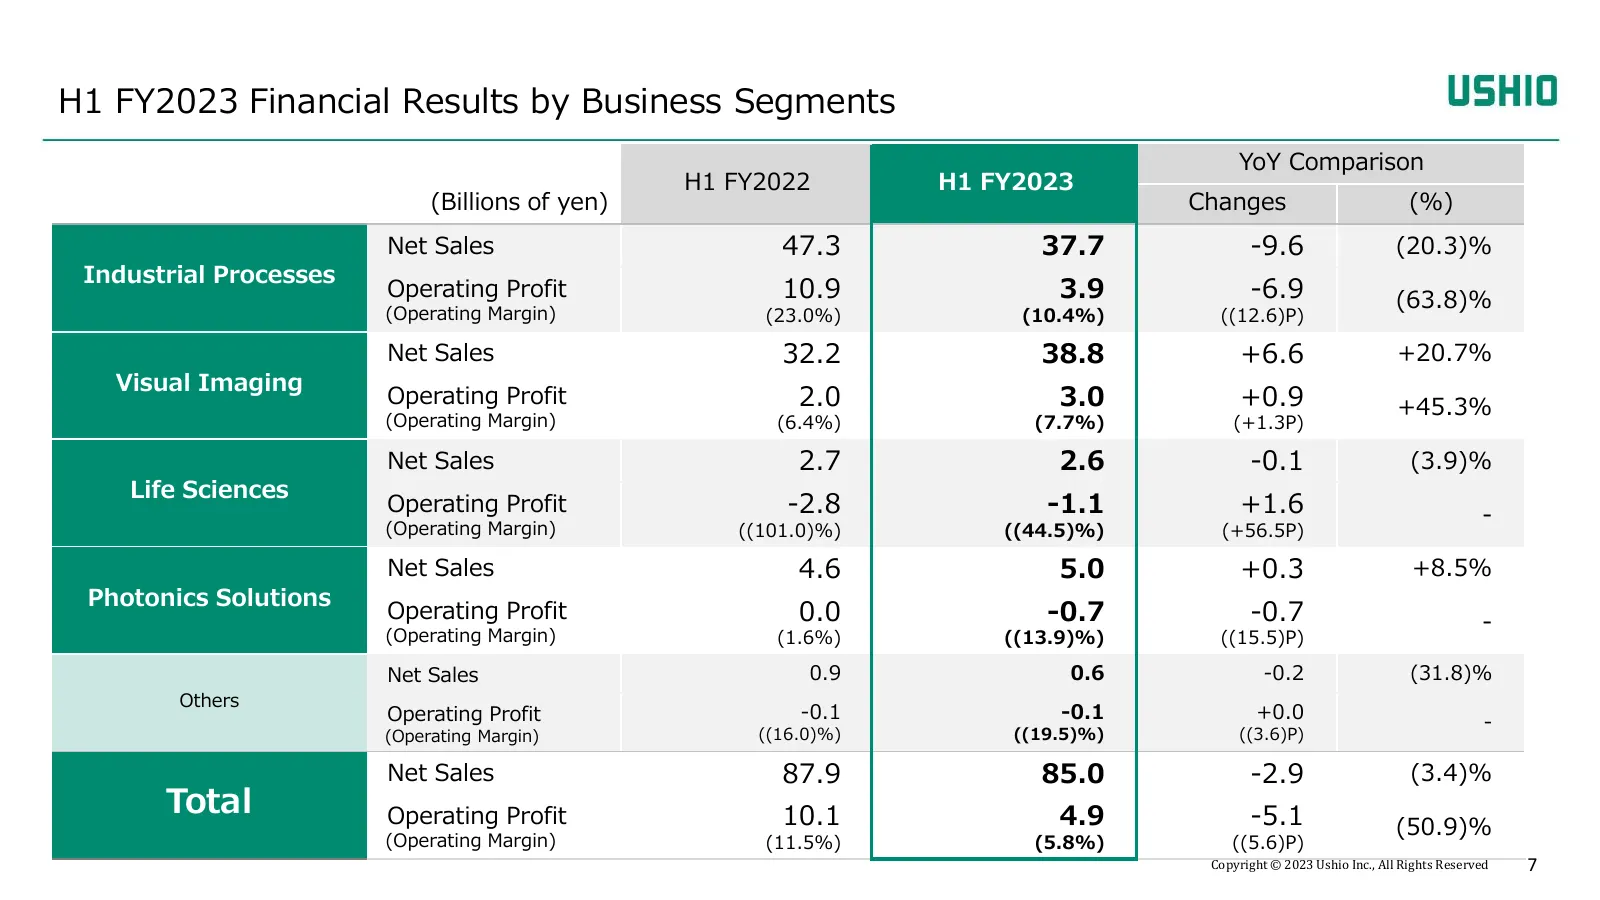
Financial Results for H1 FY2023 YoY Comparison: -2.9 billion yen (-3.4%) - Industrial Processes Business: Sales decreased due to semiconductor Net Sales market condition and FPD market deteriorating 85.0 billion yen - Visual Imaging Business: Sales increased owning to higher sales of digital cinema
Slide 5: FY2023 H1 Summary of Financial Results
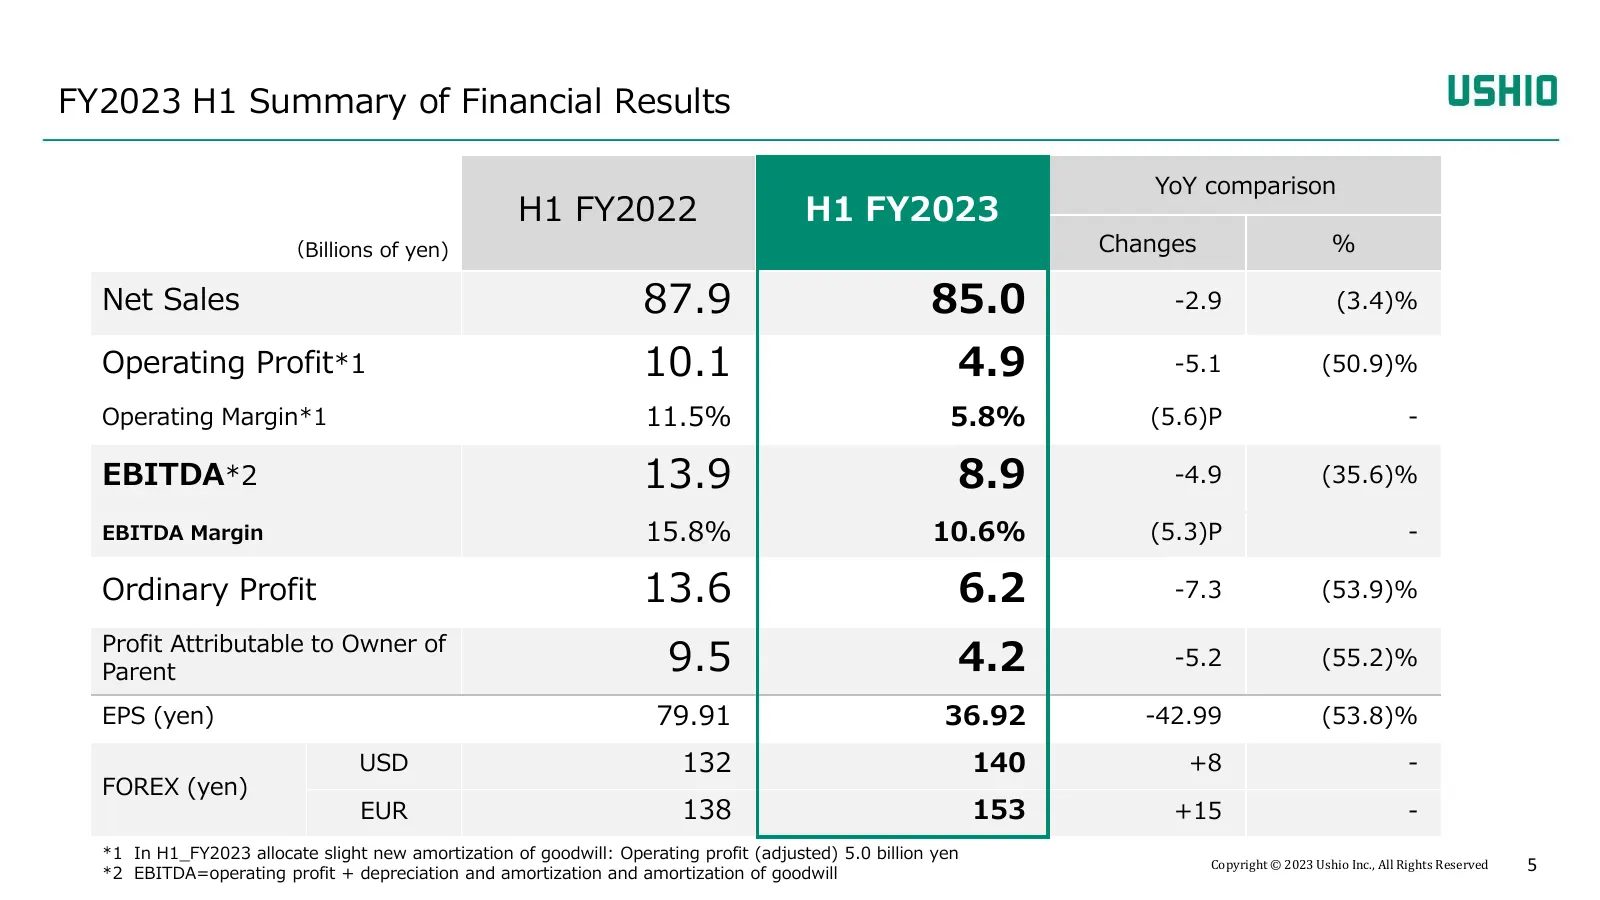
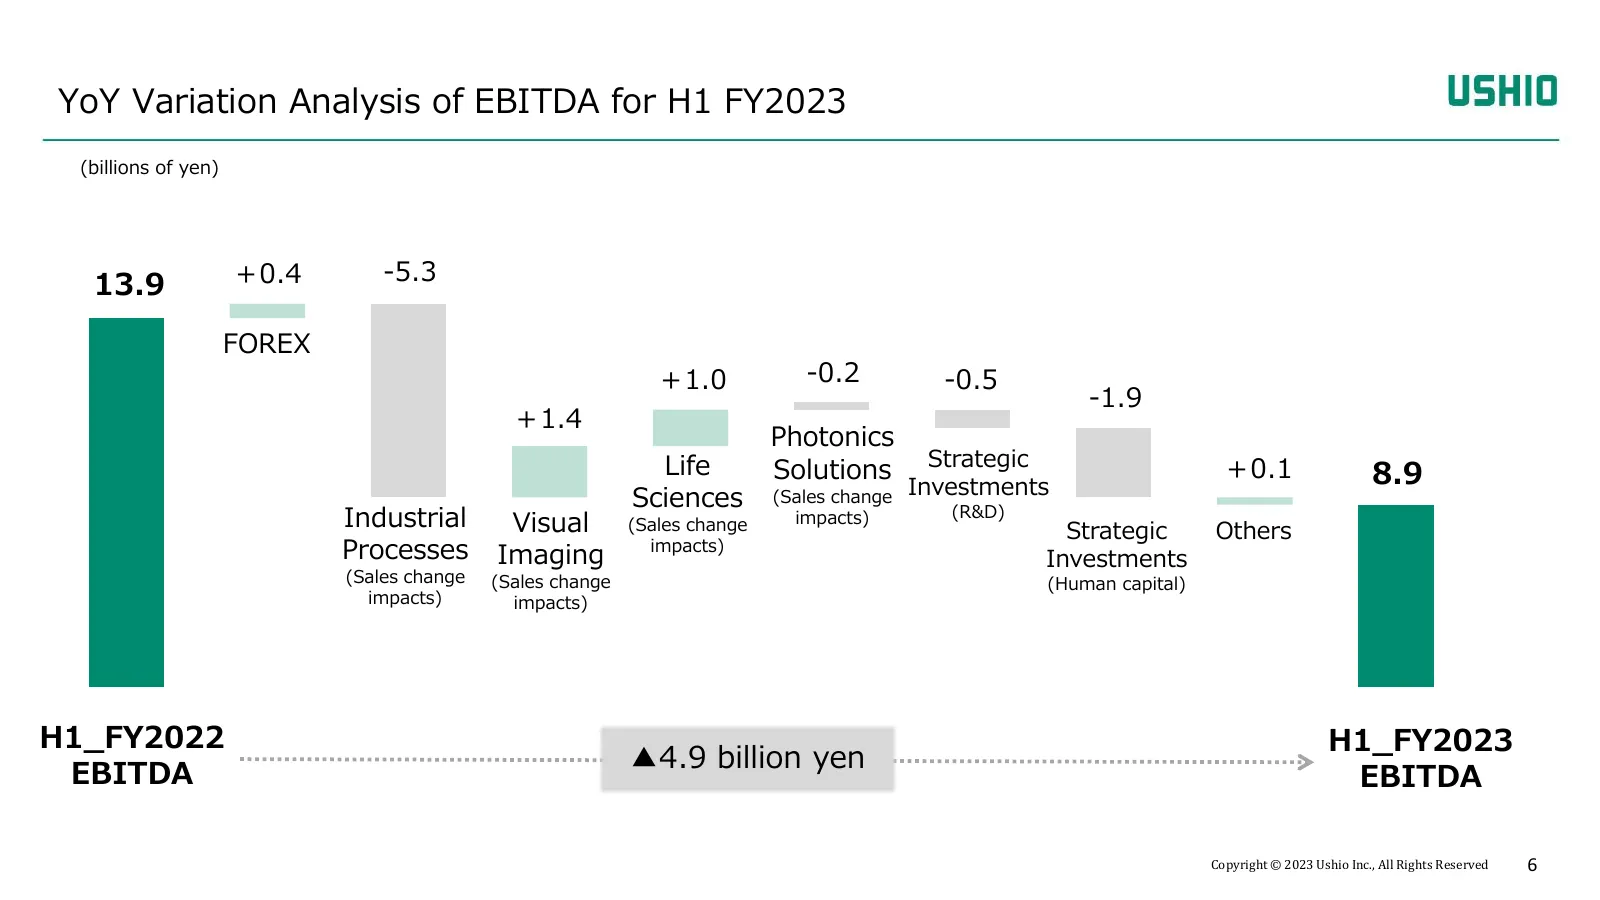
FY2023 H1 Summary of Financial Results YoY comparison H1 FY2022 H1 FY2023 (Billions of yen) Changes % Net Sales 87.9 85.0 -2.9 (3.4)% Operating Profit*1 10.1 4.9 -5.1 (50.9)% Operating Margin*1 11.5% 5.8% (5.6)P - EBITDA*2 13.9 8.9 -4.9 (35.6)% EBITDA Margin 15.8% 10.6% (5.3)P - Ordinary Profit 13.6
Slide 6: YoY Variation Analysis of EBITDA for H1 FY2023
YoY Variation Analysis of EBITDA for H1 FY2023 (billions of yen) +0.4 -5.3 13.9 FOREX +1.0 -0.2 -0.5 -1.9 +1.4 Photonics Life Solutions Strategic +0.1 8.9 Sciences (Sales change Investments Industrial Visual (Sales change impacts) (R&D) Strategic Others Processes Imaging impacts) Investments (Sales
Slide 7: H1 FY2023 Financial Results by Business Segments
H1 FY2023 Financial Results by Business Segments YoY Comparison H1 FY2022 H1 FY2023 (Billions of yen) Changes (%) Net Sales 47.3 37.7 -9.6 (20.3)% Industrial Processes Operating Profit 10.9 3.9 -6.9 (63.8)% (Operating Margin) (23.0%) (10.4%) ((12.6)P) Net Sales 32.2 38.8 +6.6 +20.7% Visual Imaging O
Slide 8: H1 FY2023: Industrial Processes Results
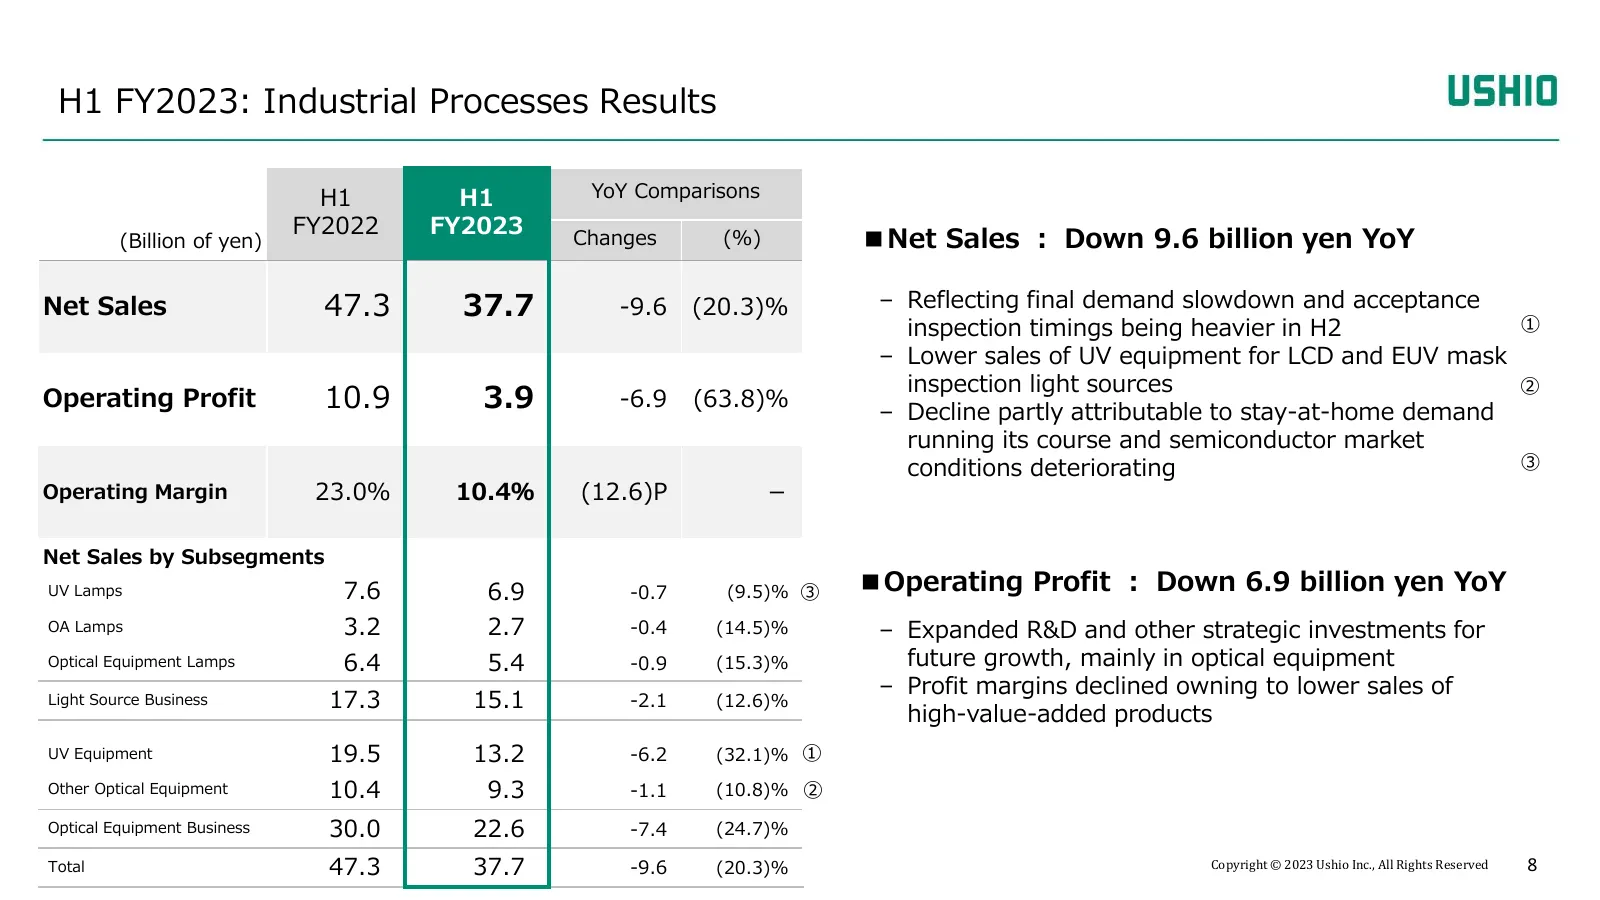
H1 FY2023: Industrial Processes Results H1 H1 YoY Comparisons FY2022 FY2023 (Billion of yen) Changes (%) ■Net Sales : Down 9.6 billion yen YoY Net Sales 47.3 37.7 -9.6 (20.3)% – Reflecting final demand slowdown and acceptance inspection timings being heavier in H2 ① – Lower sales of UV equipment for
Slide 9: H1 FY2023: Visual Imaging Results
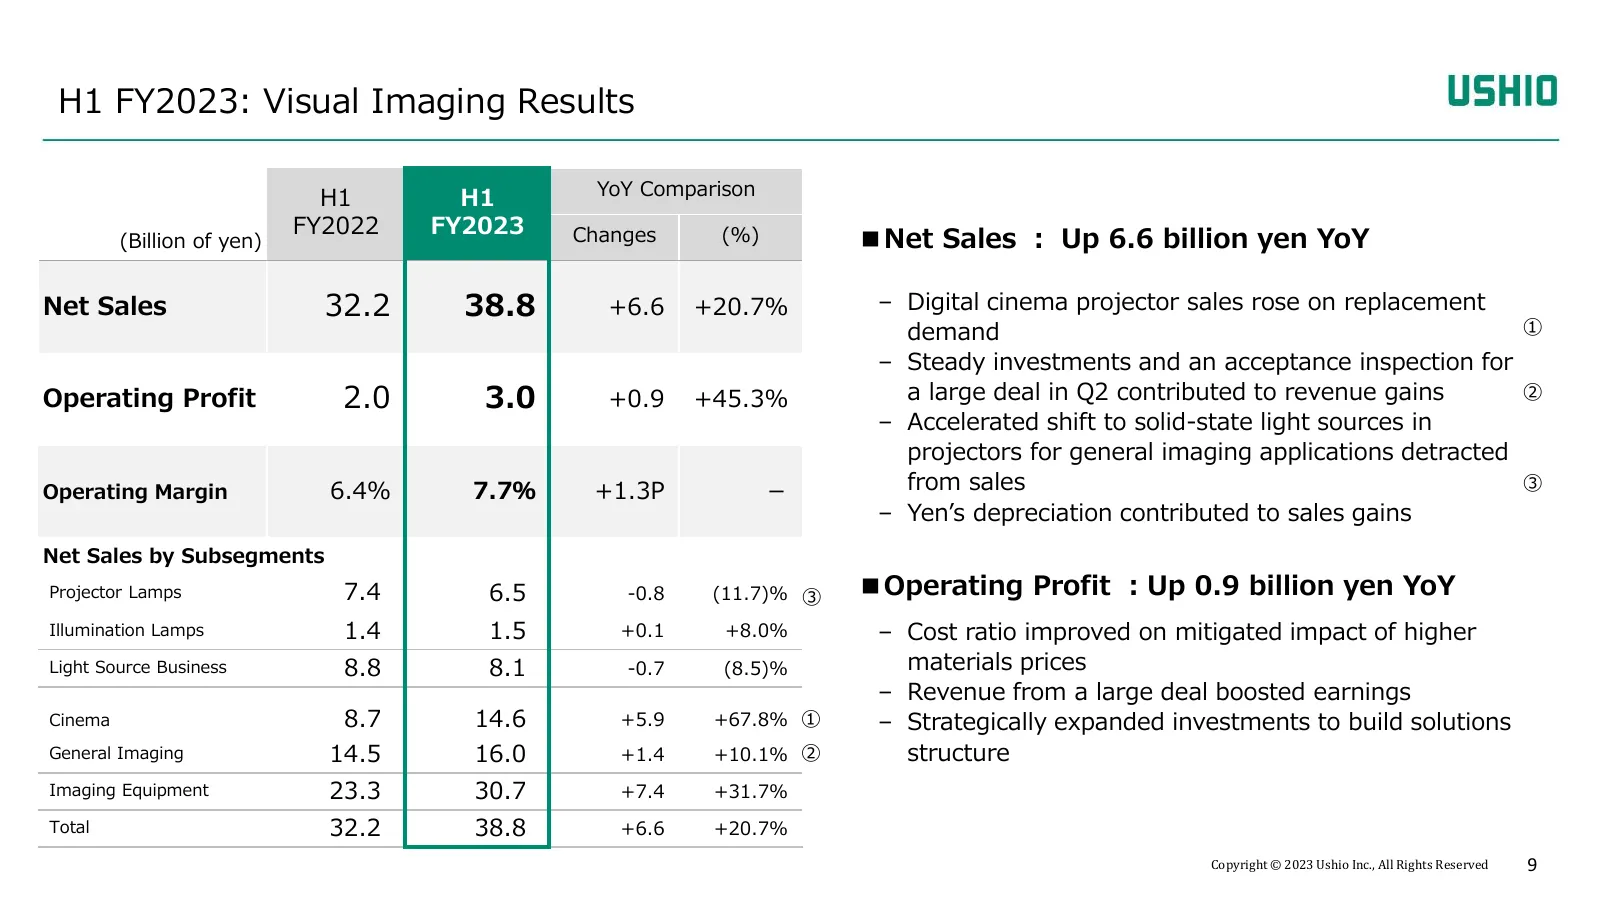
H1 FY2023: Visual Imaging Results H1 H1 YoY Comparison FY2022 FY2023 (Billion of yen) Changes (%) ■Net Sales : Up 6.6 billion yen YoY Net Sales 32.2 38.8 +6.6 +20.7% – Digital cinema projector sales rose on replacement demand ① – Steady investments and an acceptance inspection for Operating Profit 2
Slide 10: H1 FY2023: Life Sciences and Photonics Solutions Results
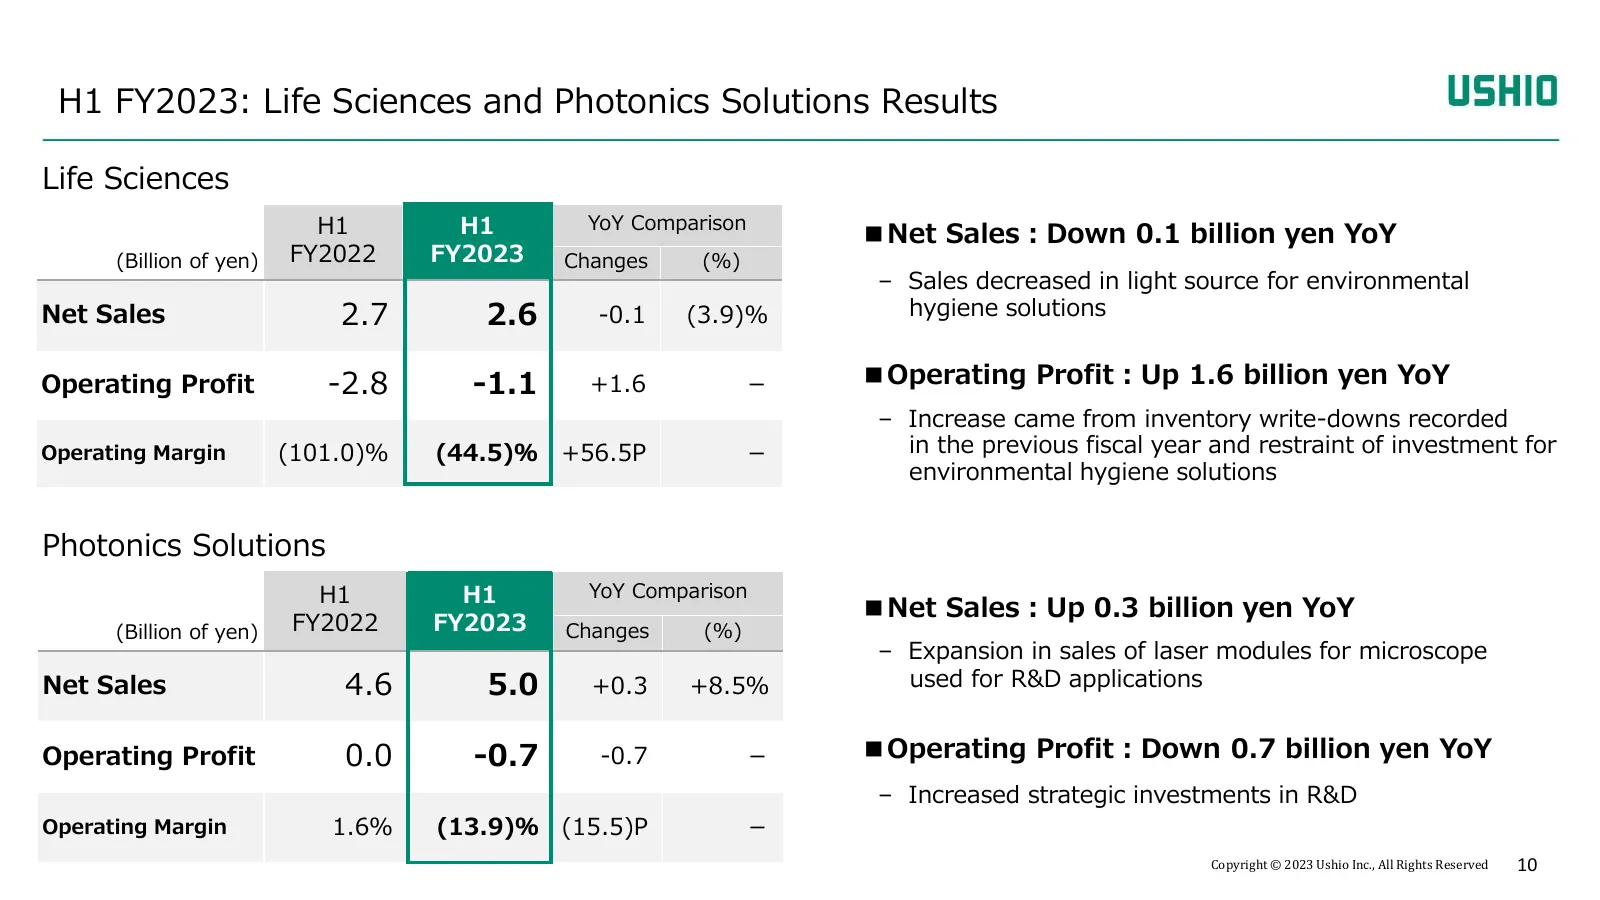
H1 FY2023: Life Sciences and Photonics Solutions Results Life Sciences H1 H1 YoY Comparison ■Net Sales:Down 0.1 billion yen YoY (Billion of yen) FY2022 FY2023 Changes (%) – Sales decreased in light source for environmental Net Sales 2.7 2.6 -0.1 (3.9)% hygiene solutions Operating Profit -2.8 -1.1 +1
Slide 11: Full-Year Forecast for FY2023
I. Financial Results for H1 FY2023 II. Full-Year Forecast for FY2023 III. Follow up on 2 nd Medium-Term Management Plan IV. Supplementary Information Copyright © 2023 Ushio Inc., All Rights Reserved 11
Slide 12: Summary of FY2023 Full-Year Forecast
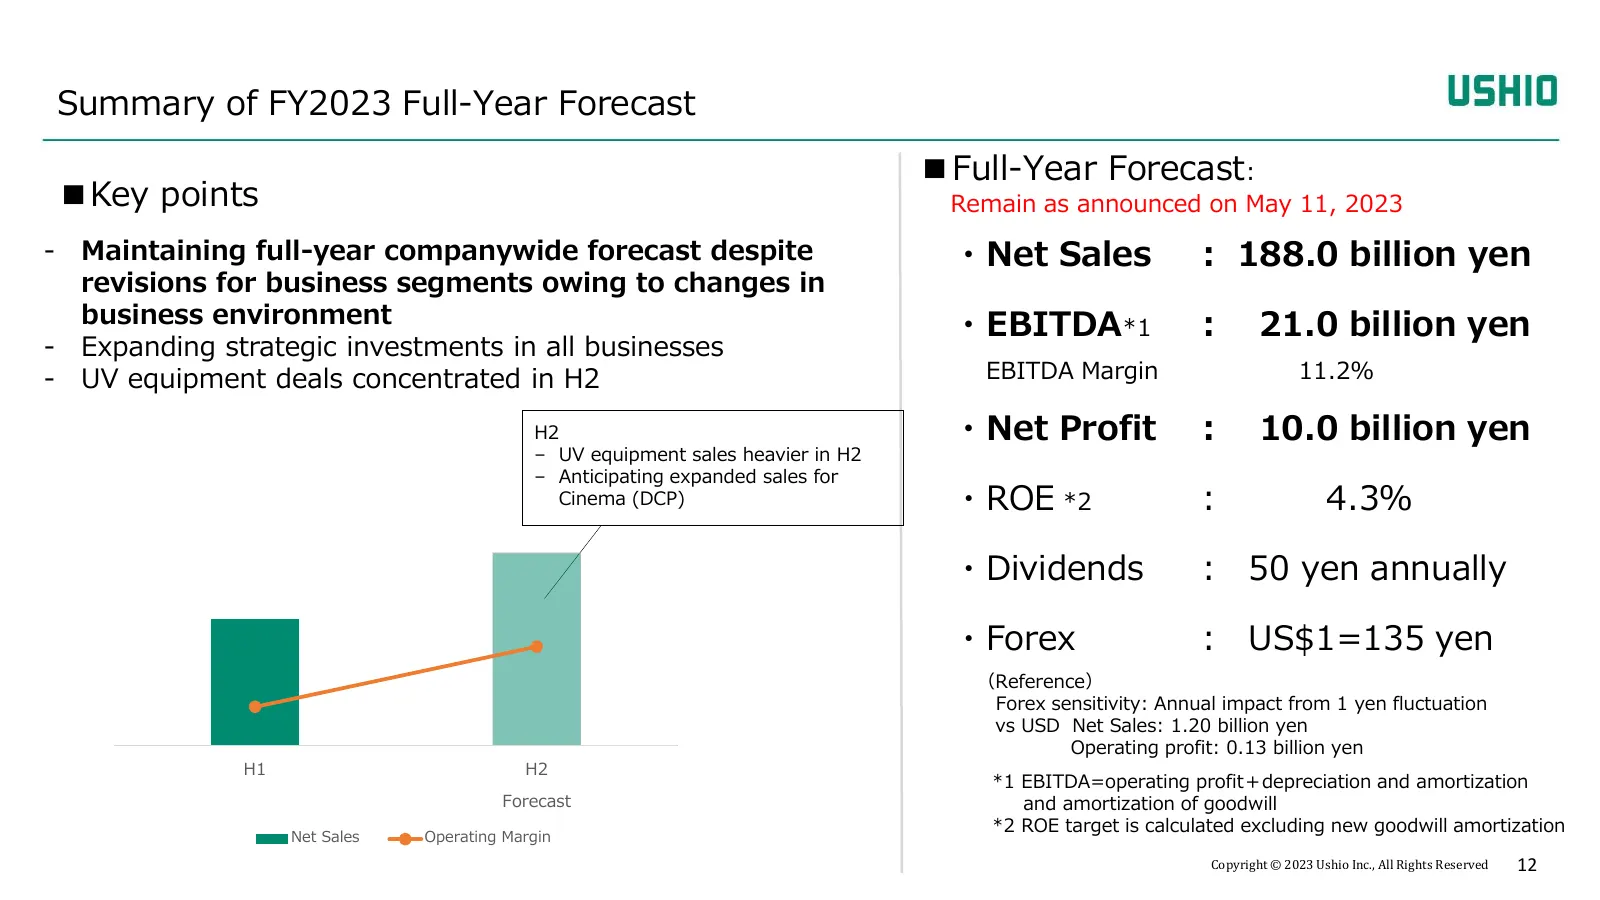
Summary of FY2023 Full-Year Forecast ■Full-Year Forecast: ■Key points Remain as announced on May 11, 2023 - Maintaining full-year companywide forecast despite ・Net Sales : 188.0 billion yen revisions for business segments owing to changes in business environment ・EBITDA*1 : 21.0 billion yen - Expand
Slide 13: FY2023 Full-Year Forecast
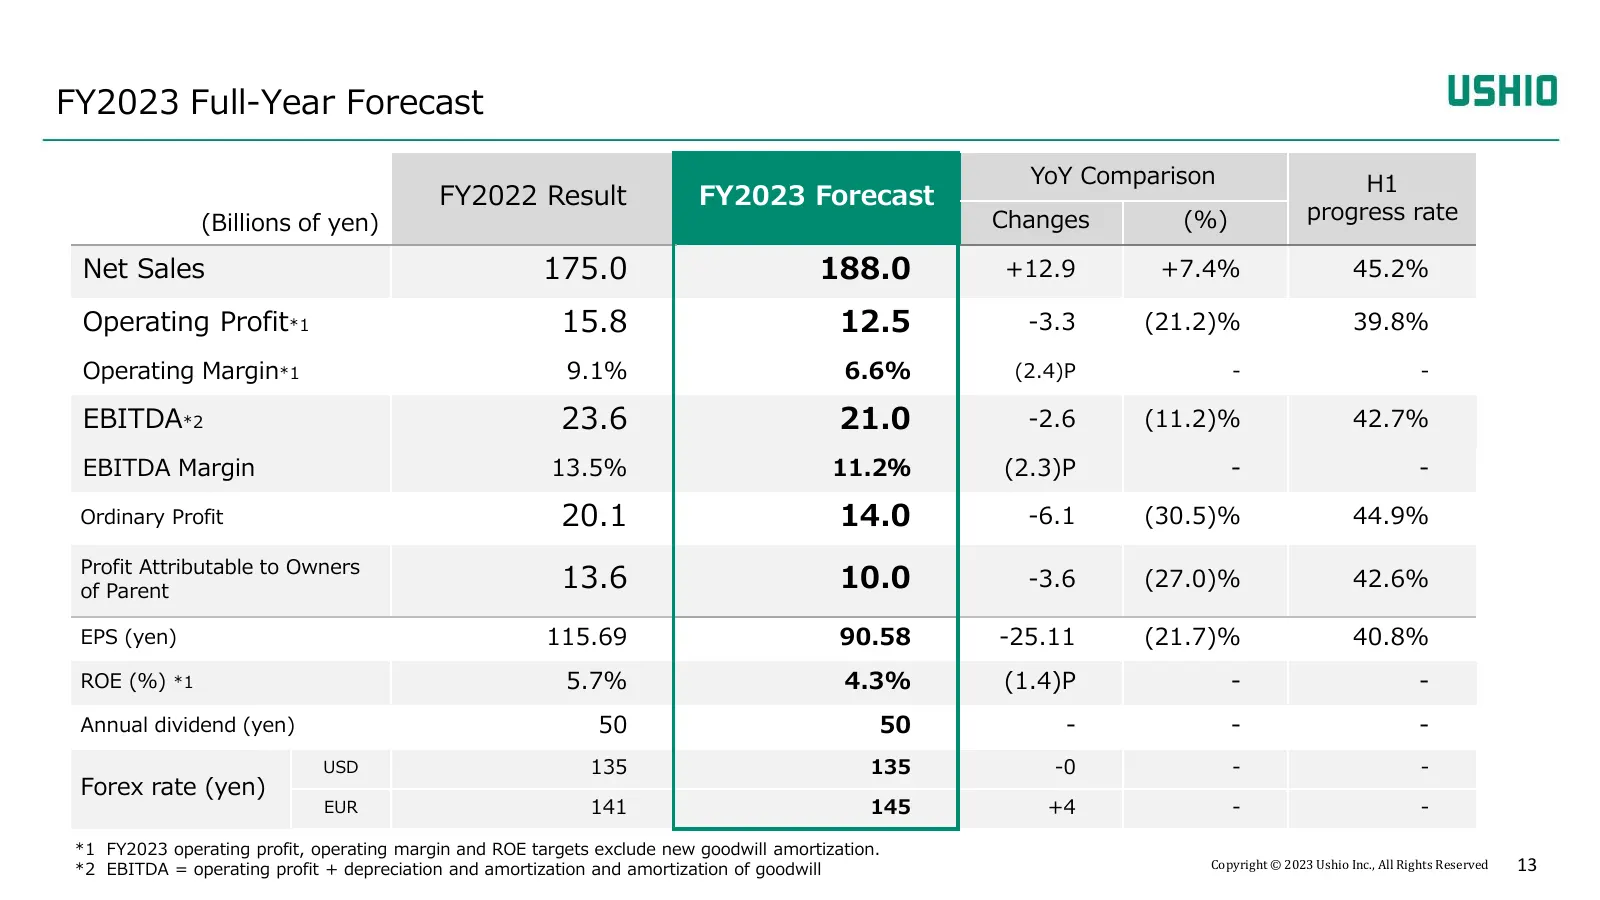
FY2023 Full-Year Forecast YoY Comparison H1 FY2022 Result FY2023 Forecast (Billions of yen) Changes (%) progress rate Net Sales 175.0 188.0 +12.9 +7.4% 45.2% Operating Profit*1 15.8 12.5 -3.3 (21.2)% 39.8% Operating Margin*1 9.1% 6.6% (2.4)P - - EBITDA*2 23.6 21.0 -2.6 (11.2)% 42.7% EBITDA Margin 13
Slide 14: FY2023 Full-Year Forecast Revision by Business Segments
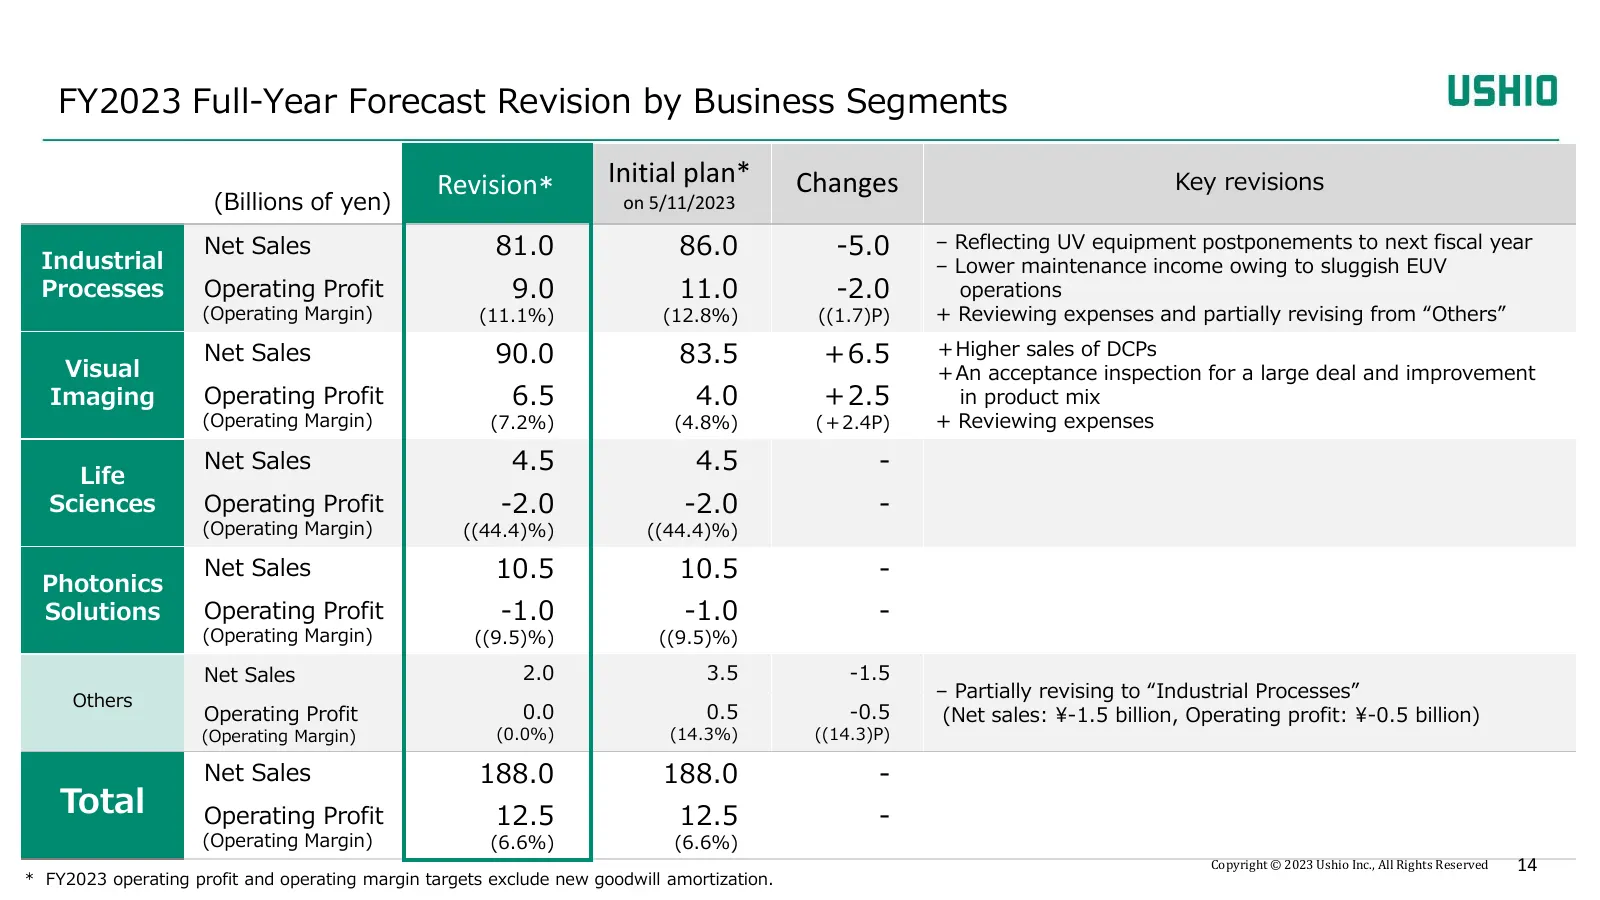
FY2023 Full-Year Forecast Revision by Business Segments Revision* Initial plan* Changes Key revisions (Billions of yen) on 5/11/2023 Net Sales 81.0 86.0 -5.0 – Reflecting UV equipment postponements to next fiscal year Industrial – Lower maintenance income owing to sluggish EUV Processes Operating P
Slide 15: FY2023 YoY Variation Analysis of EBITDA
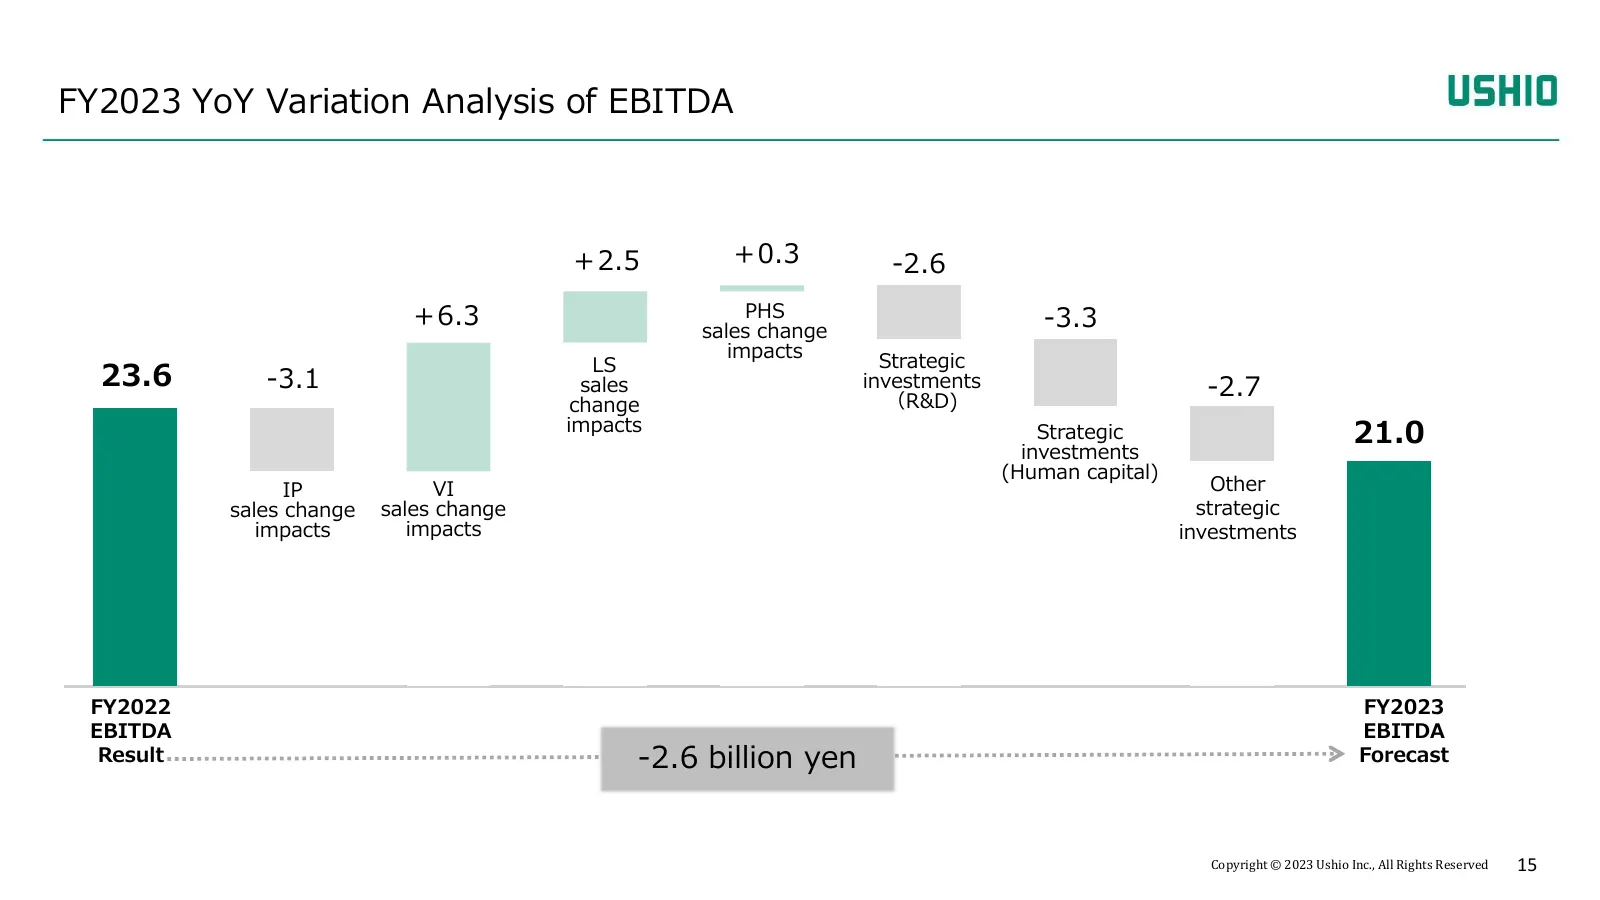
FY2023 YoY Variation Analysis of EBITDA +2.5 +0.3 -2.6 +6.3 PHS -3.3 sales change impacts Strategic LS 23.6 -3.1 sales investments -2.7 change (R&D) impacts Strategic 21.0 investments (Human capital) IP VI Other sales change sales change strategic impacts impacts investments FY2022 FY2023 EBITDA EBI
Slide 16: FY2023 Financial Forecast Revision by Sub-segments
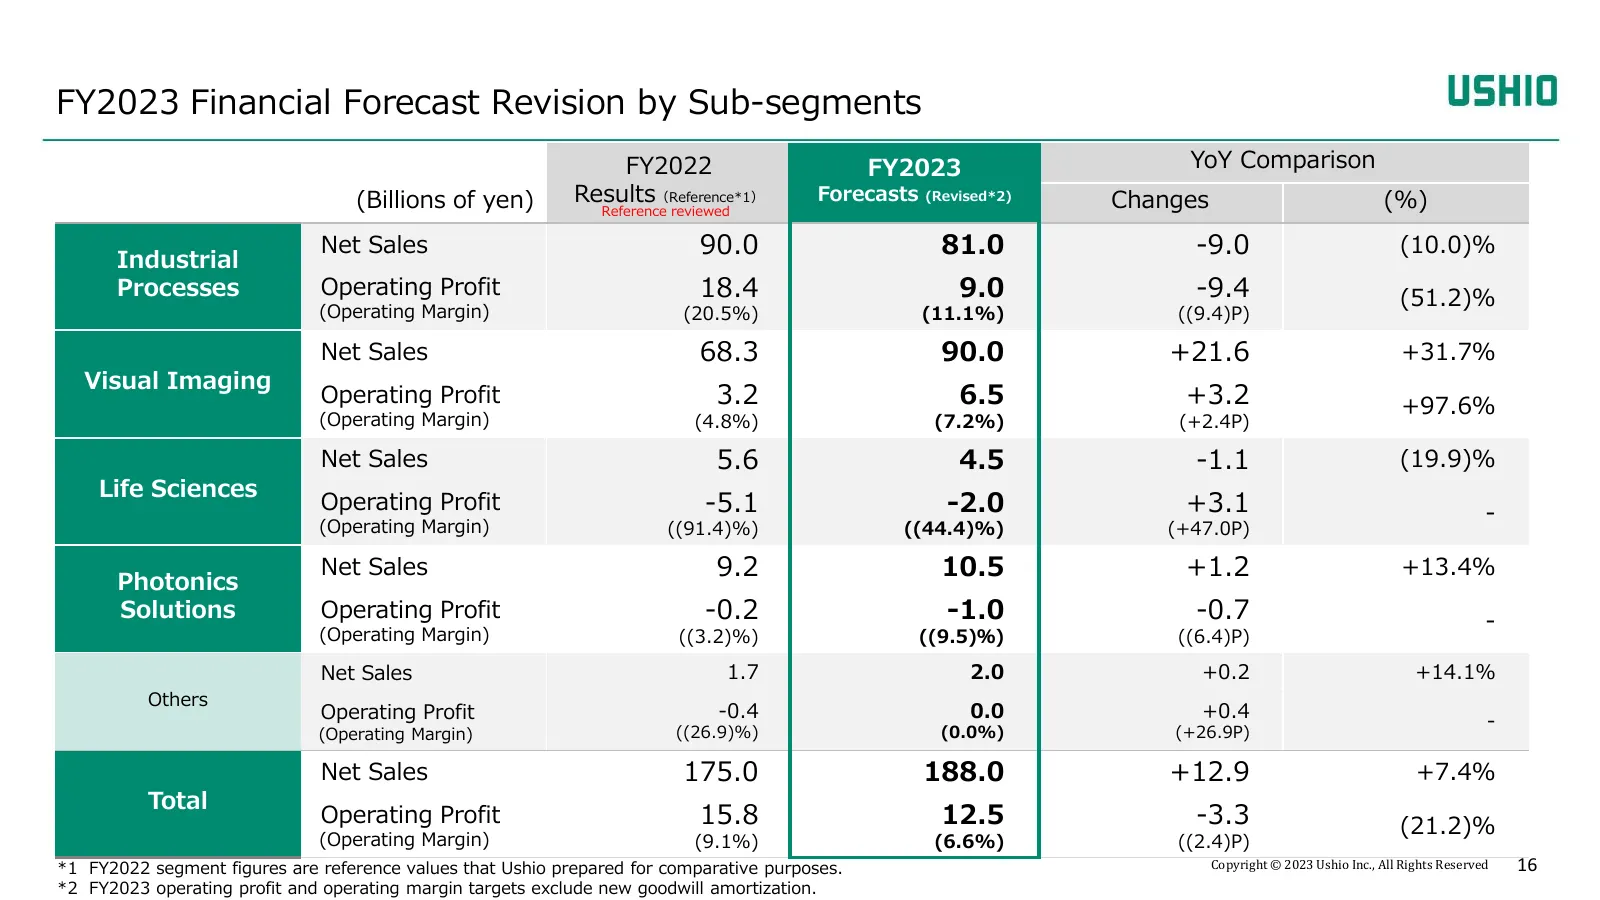
FY2023 Financial Forecast Revision by Sub-segments FY2022 FY2023 YoY Comparison (Billions of yen) Results(Reference*1) Forecasts (Revised*2) Changes (%) Reference reviewed Net Sales 90.0 81.0 -9.0 (10.0)% Industrial Processes Operating Profit 18.4 9.0 -9.4 (51.2)% (Operating Margin) (20.5%) (11.1%)
Slide 17: FY2023 Full-Year Forecast: Industrial Processes Business
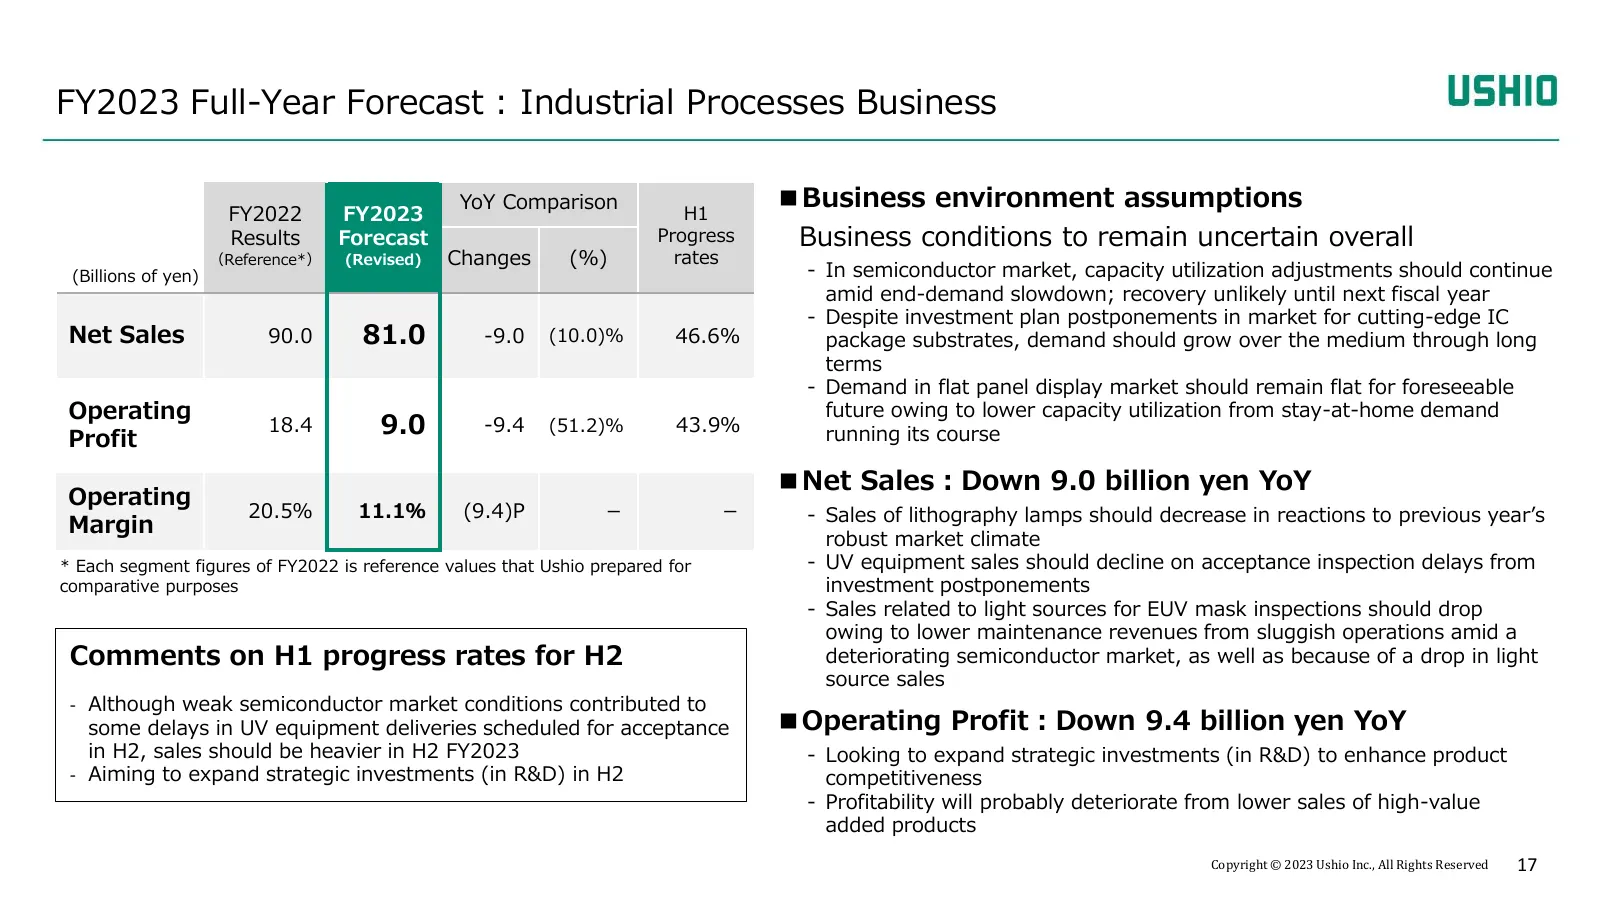
FY2023 Full-Year Forecast : Industrial Processes Business YoY Comparison ■Business environment assumptions FY2022 FY2023 H1 Results Forecast Progress Business conditions to remain uncertain overall (Reference*) (Revised) Changes (%) rates (Billions of yen) - In semiconductor market, capacity utiliza
Slide 18: FY2023 Main Products of Industrial Processes Business
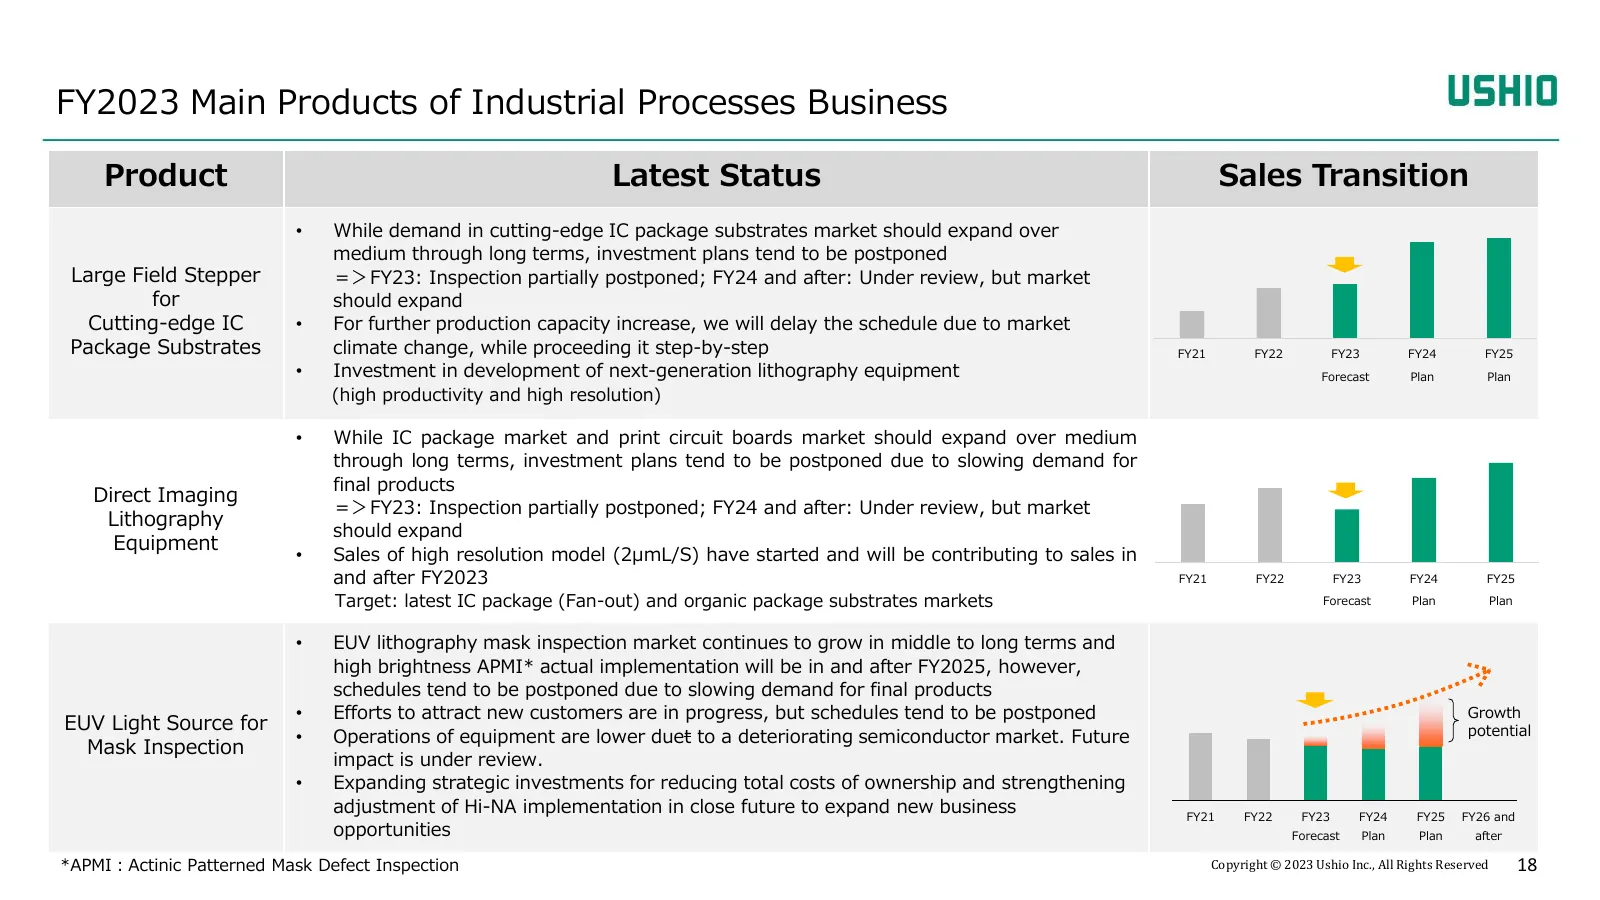
FY2023 Main Products of Industrial Processes Business Product Latest Status Sales Transition • While demand in cutting-edge IC package substrates market should expand over medium through long terms, investment plans tend to be postponed Large Field Stepper =>FY23: Inspection partially postponed; FY2
Slide 19: FY2023 Full-Year Forecast: Visual Imaging Business
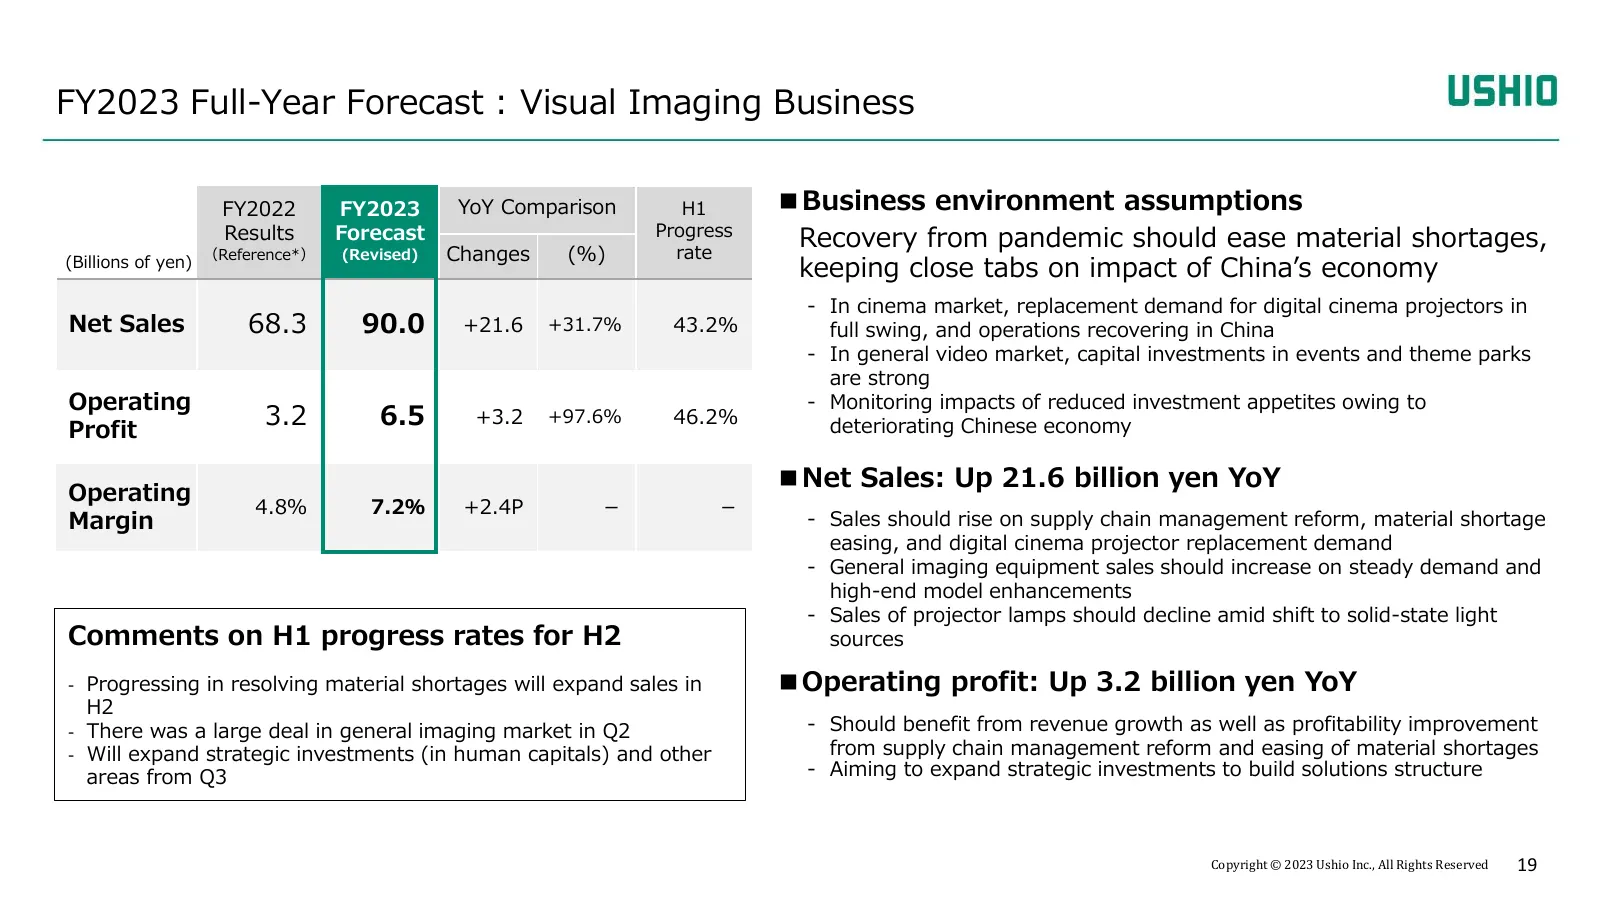
FY2023 Full-Year Forecast : Visual Imaging Business FY2022 FY2023 YoY Comparison H1 ■Business environment assumptions Progress Results Forecast rate Recovery from pandemic should ease material shortages, (Billions of yen) (Reference*) (Revised) Changes (%) keeping close tabs on impact of China’s eco
Slide 20: FY2023 Main Markets of Visual Imaging Business
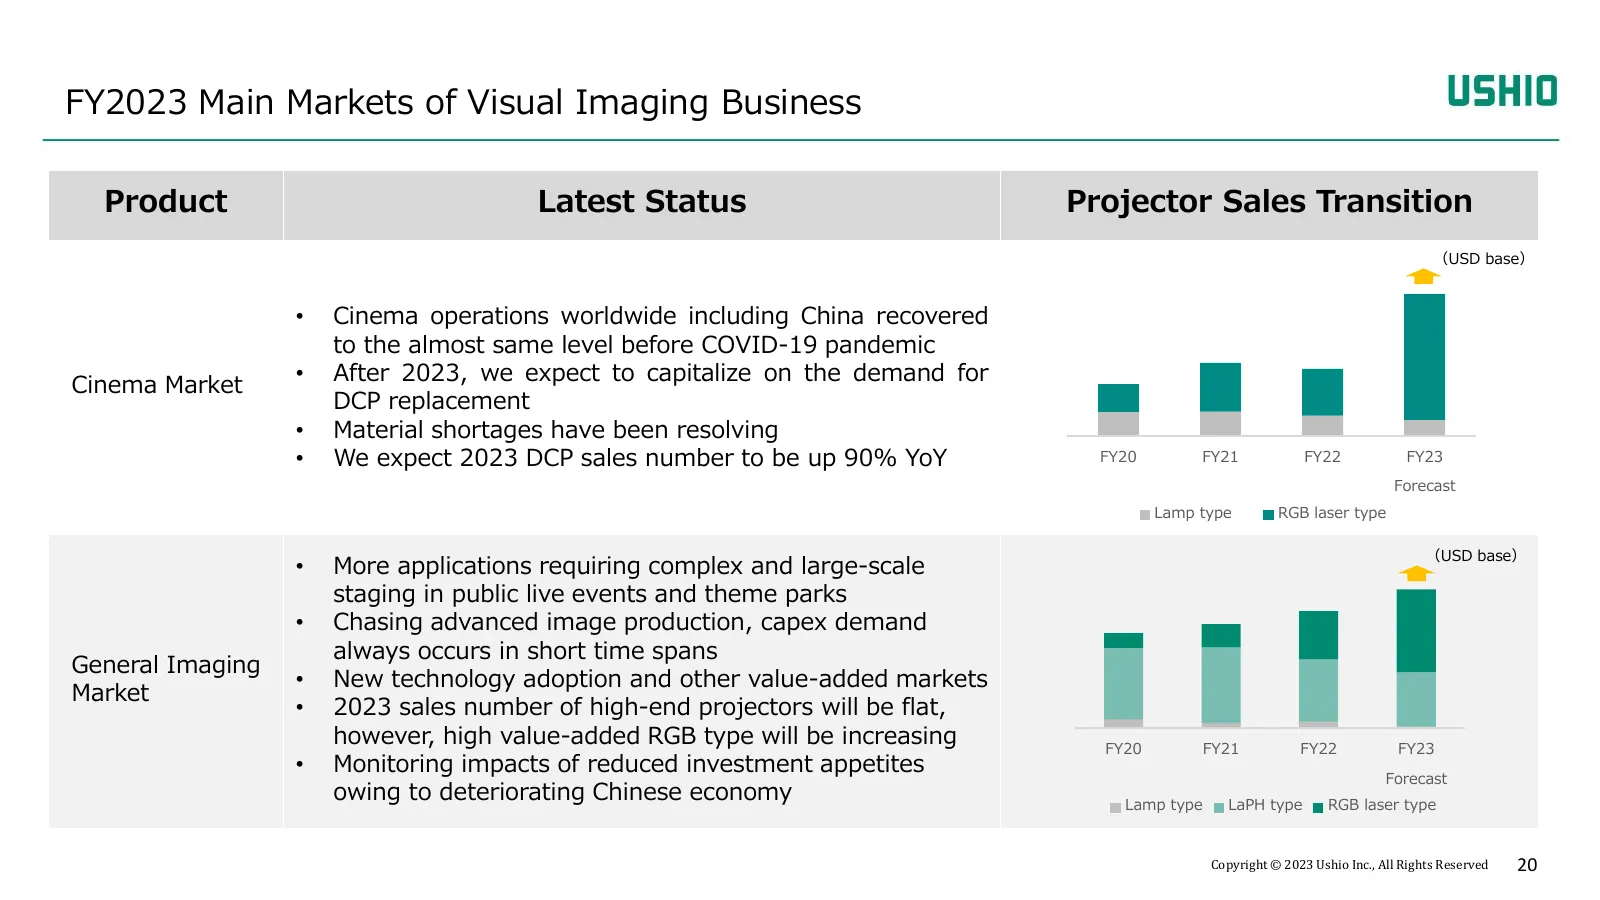
FY2023 Main Markets of Visual Imaging Business Product Latest Status Projector Sales Transition (USD base) • Cinema operations worldwide including China recovered to the almost same level before COVID-19 pandemic Cinema Market • After 2023, we expect to capitalize on the demand for DCP replacement •
Slide 21: FY2023 Full-Year Forecast: Life Sciences/Photonics Solution Business
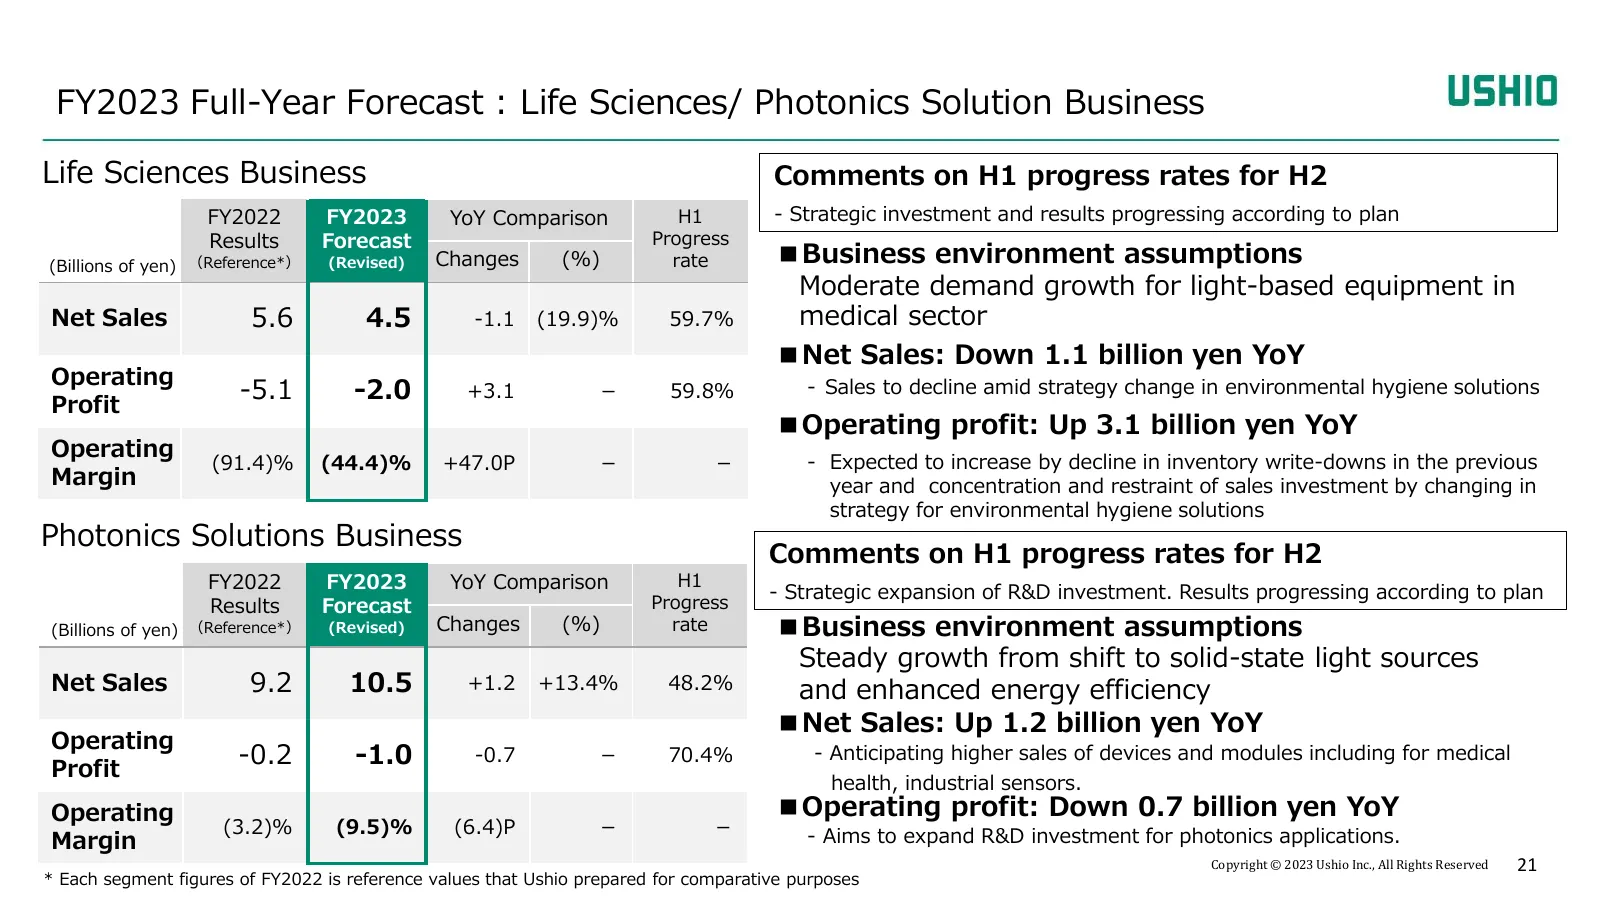
FY2023 Full-Year Forecast : Life Sciences/ Photonics Solution Business Life Sciences Business Comments on H1 progress rates for H2 FY2022 FY2023 YoY Comparison H1 - Strategic investment and results progressing according to plan Results Forecast Progress (Billions of yen) (Reference*) (Revised) Chang
Slide 22: Shareholder Returns
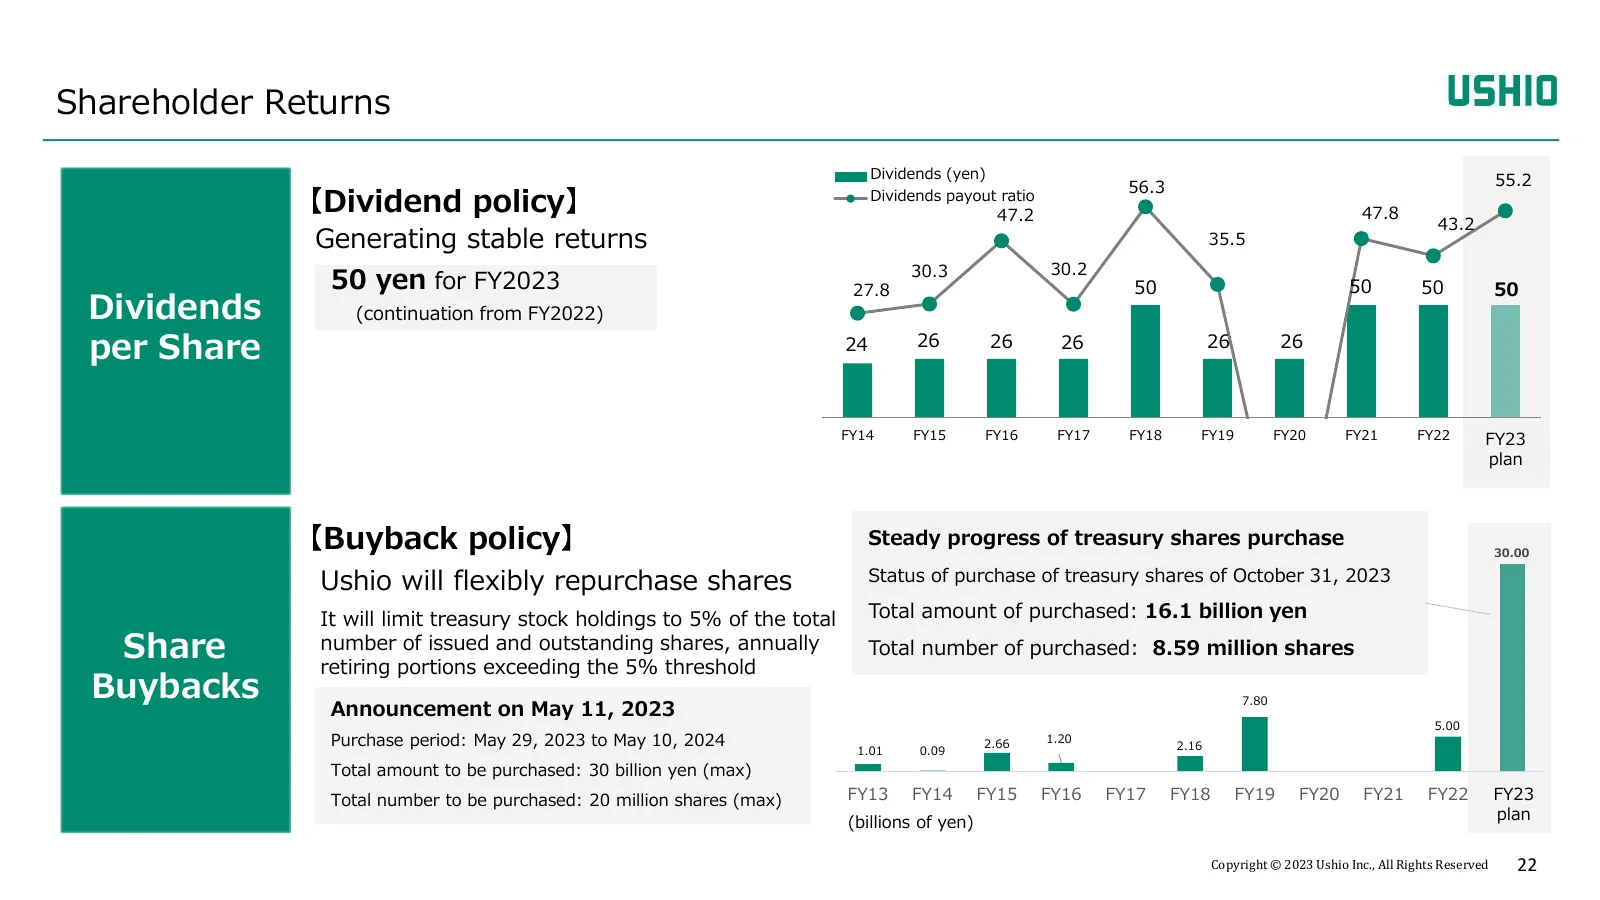
Shareholder Returns Dividends (yen) 55.2 56.3 【Dividend policy】 Dividends payout ratio 47.2 47.8 43.2 Generating stable returns 35.5 30.3 30.2 50 yen for FY2023 27.8 50 50 50 50 Dividends (continuation from FY2022) per Share 24 26 26 26 26 26 FY14 FY15 FY16 FY17 FY18 FY19 FY20 FY21 FY22 FY23 FY23 pl
Slide 23: Follow up on 2nd Medium-Term Management Plan
I. Financial Results for H1 FY2023 II. Full-Year Forecast for FY2023 III. Follow up on 2 nd Medium-Term Management Plan IV. Supplementary Information Copyright © 2023 Ushio Inc., All Rights Reserved 23
Slide 24: Investor Relations Progress
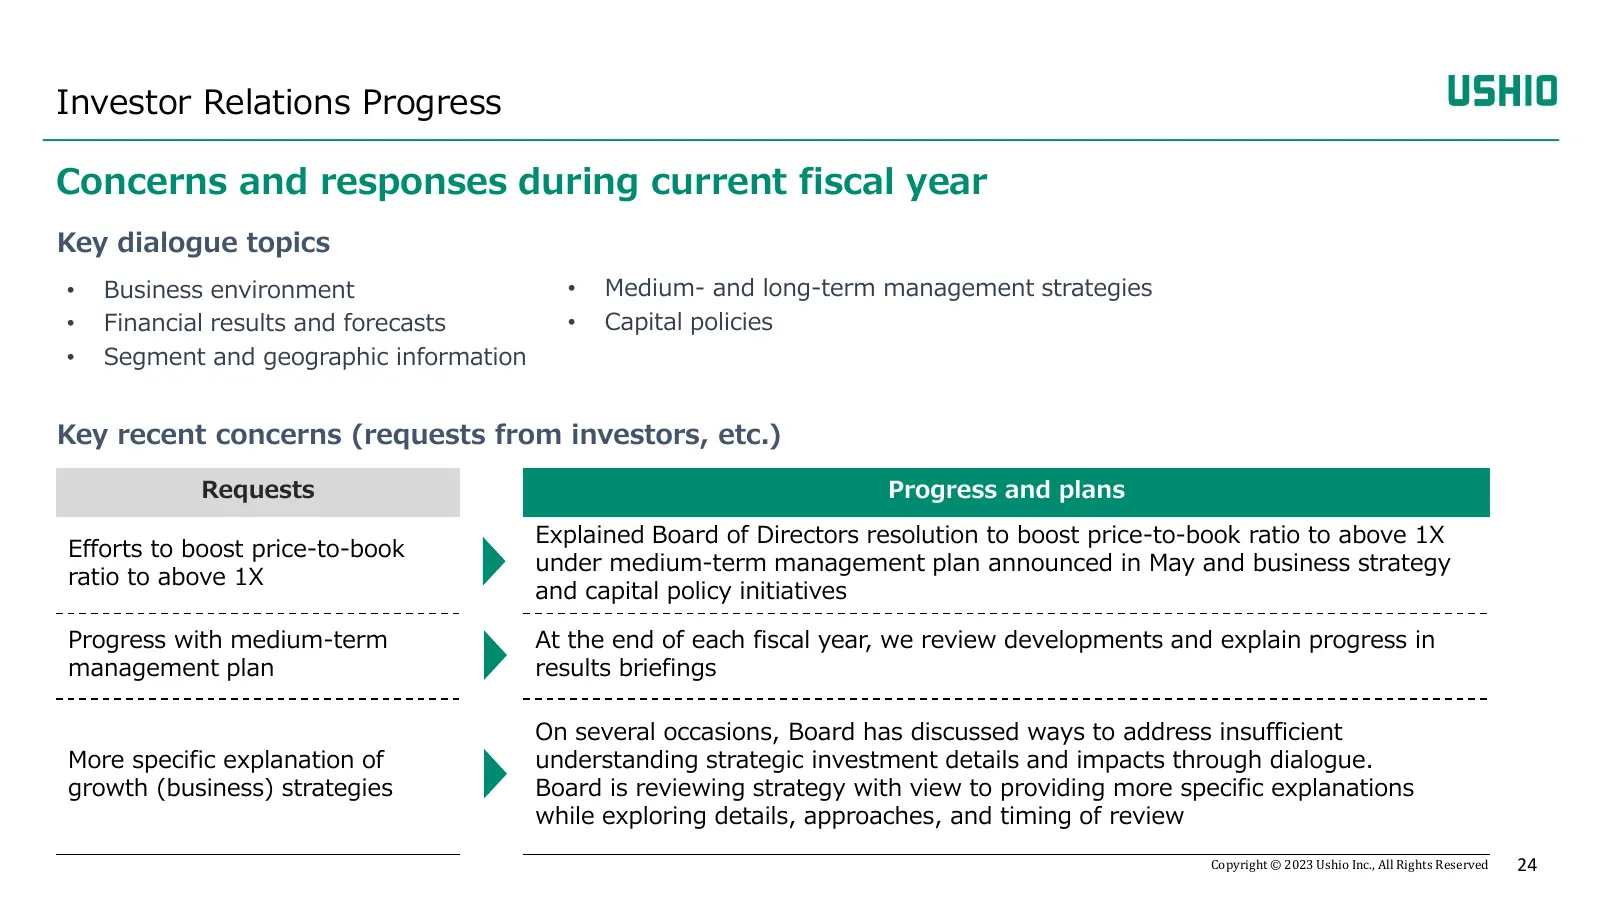
Investor Relations Progress Concerns and responses during current fiscal year Key dialogue topics • Business environment • Medium- and long-term management strategies • Financial results and forecasts • Capital policies • Segment and geographic information Key recent concerns (requests from investor
Slide 25: Key components of ¥40.0 billion + in growth investments
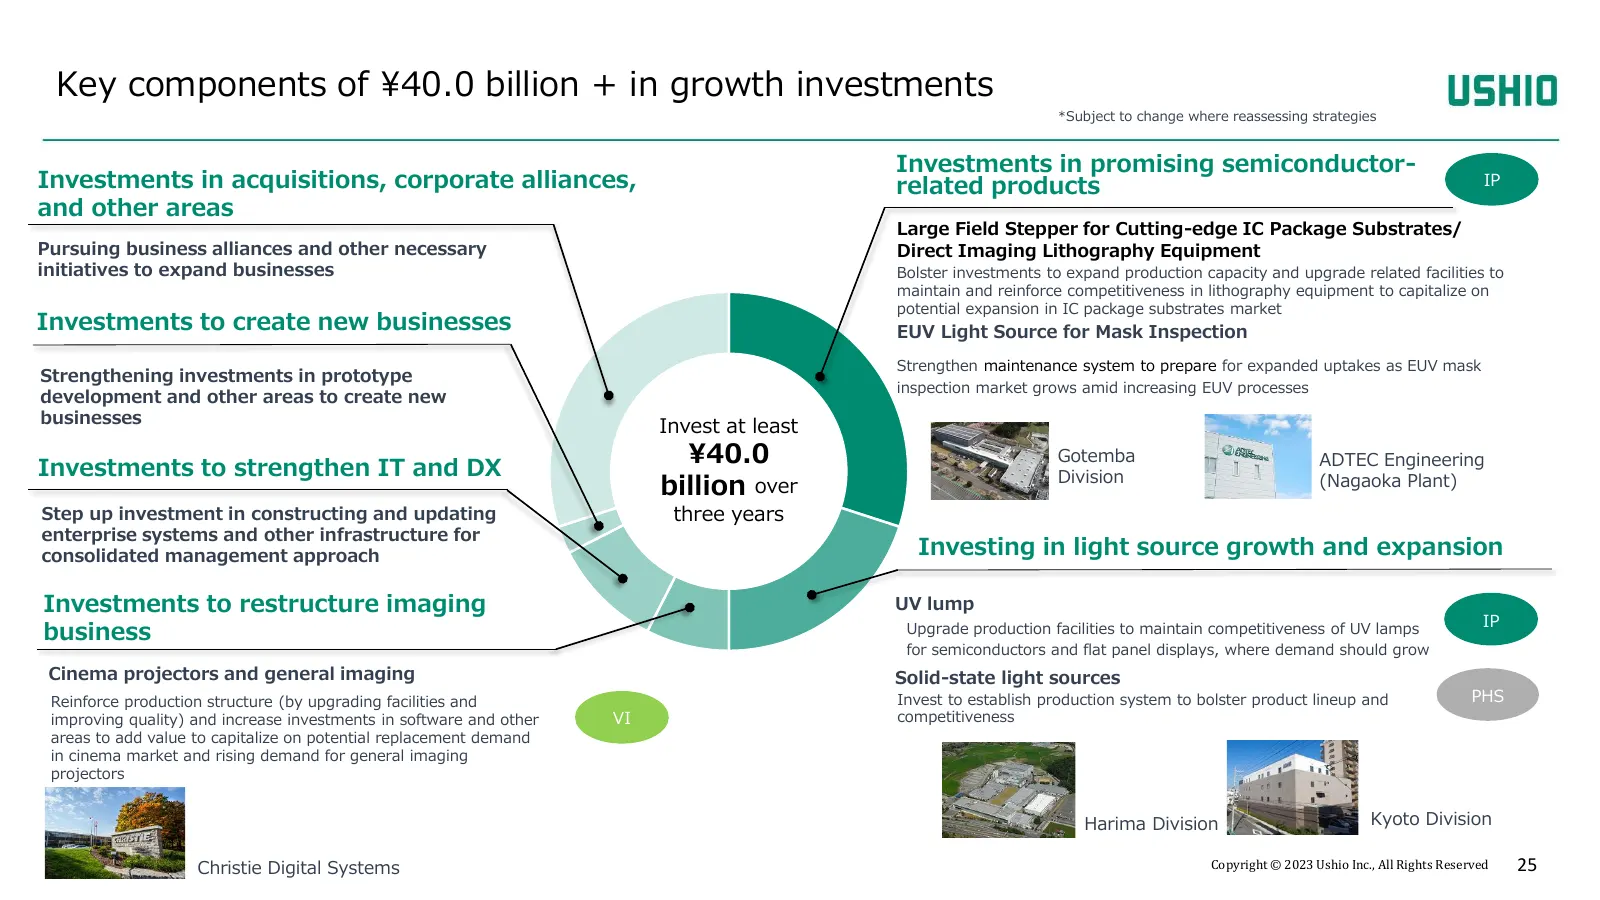
Key components of ¥40.0 billion + in growth investments *Subject to change where reassessing strategies Investments in promising semiconductor- Investments in acquisitions, corporate alliances, related products IP and other areas Large Field Stepper for Cutting-edge IC Package Substrates/ Pursuing b
Slide 26: Key components of ¥46.0 billion in strategic investments (in R&D)
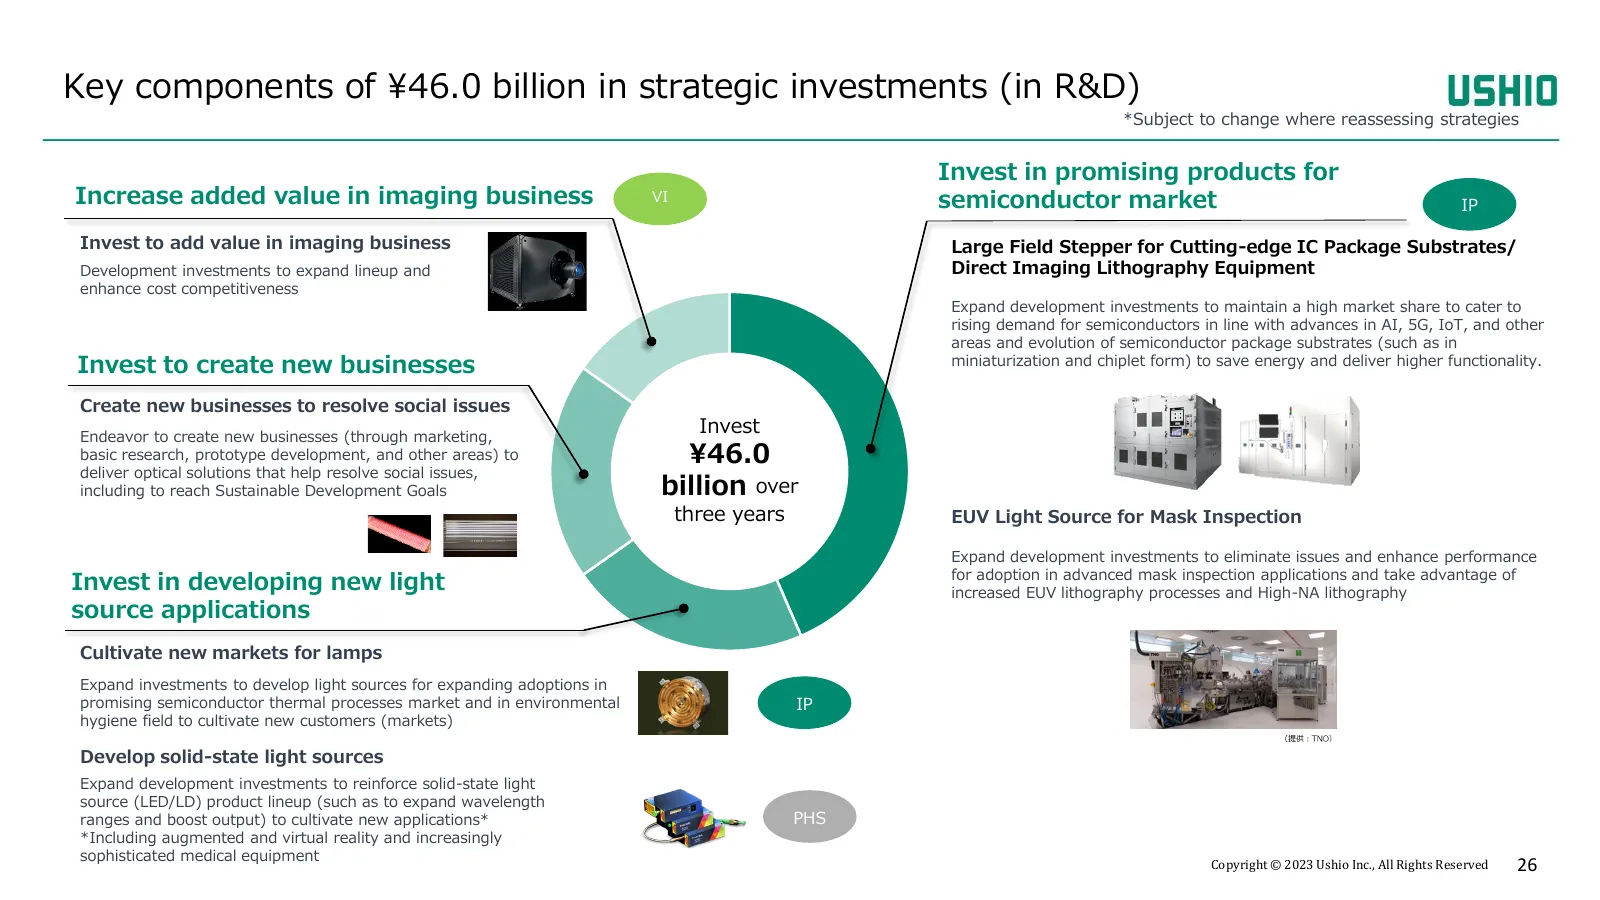
Key components of ¥46.0 billion in strategic investments (in R&D) *Subject to change where reassessing strategies Invest in promising products for Increase added value in imaging business VI semiconductor market IP Invest to add value in imaging business Large Field Stepper for Cutting-edge IC Packa
Slide 27: Asset Sale Details and Schedule
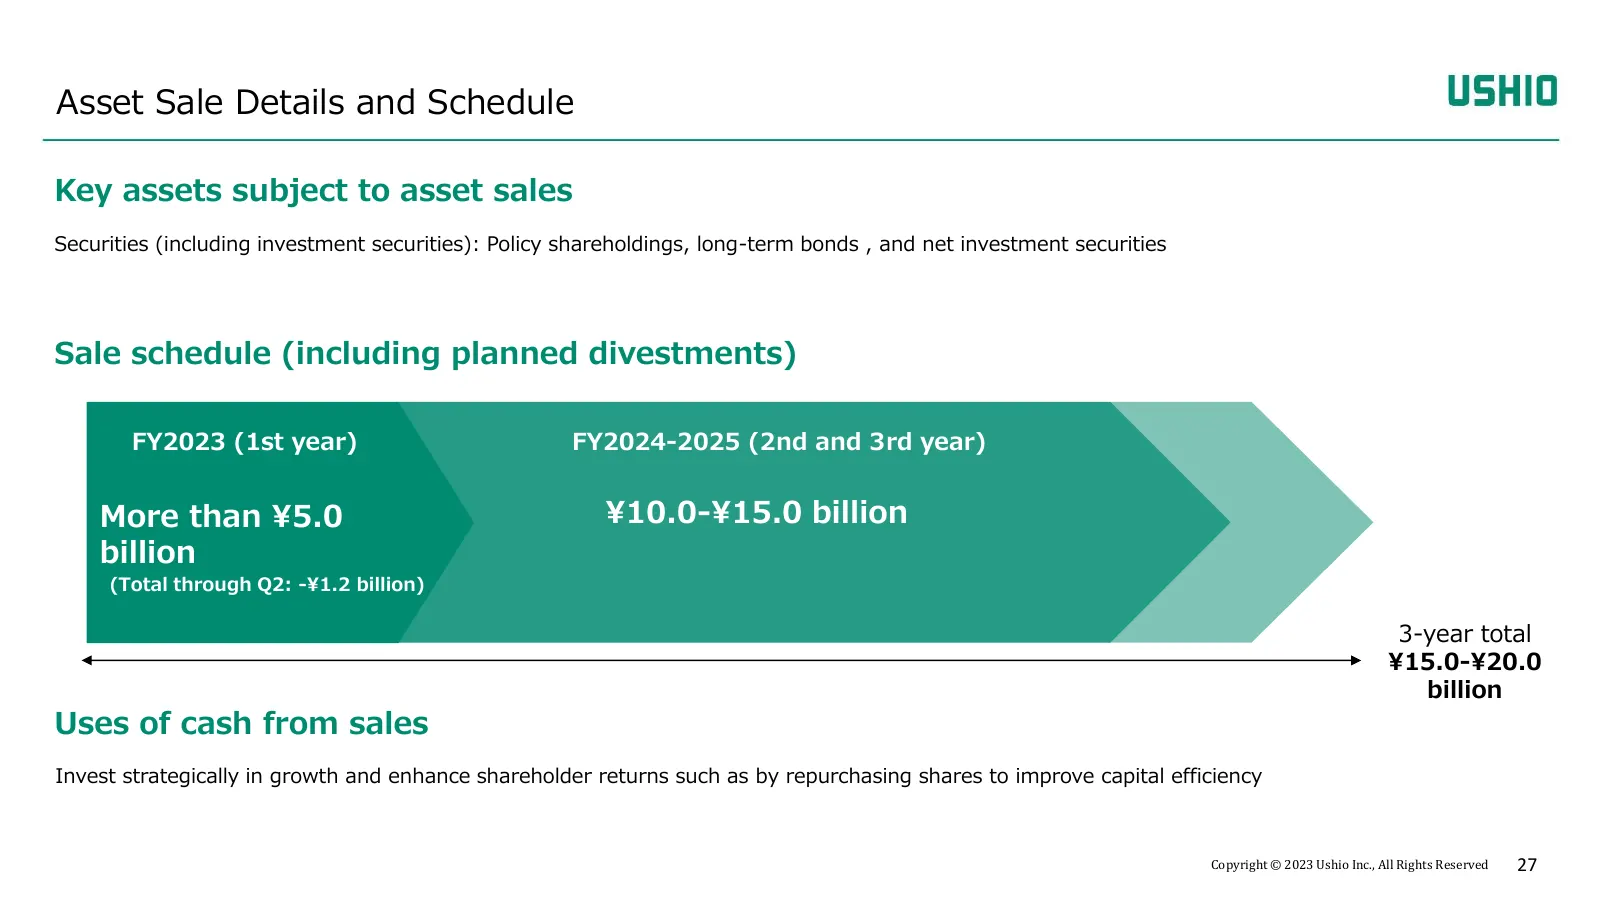
Asset Sale Details and Schedule Key assets subject to asset sales Securities (including investment securities): Policy shareholdings, long-term bonds , and net investment securities Sale schedule (including planned divestments) FY2023 (1st year) FY2024-2025 (2nd and 3rd year) More than ¥5.0 ¥10.0-¥1
Slide 28: Progress with Reducing Policy shareholdings
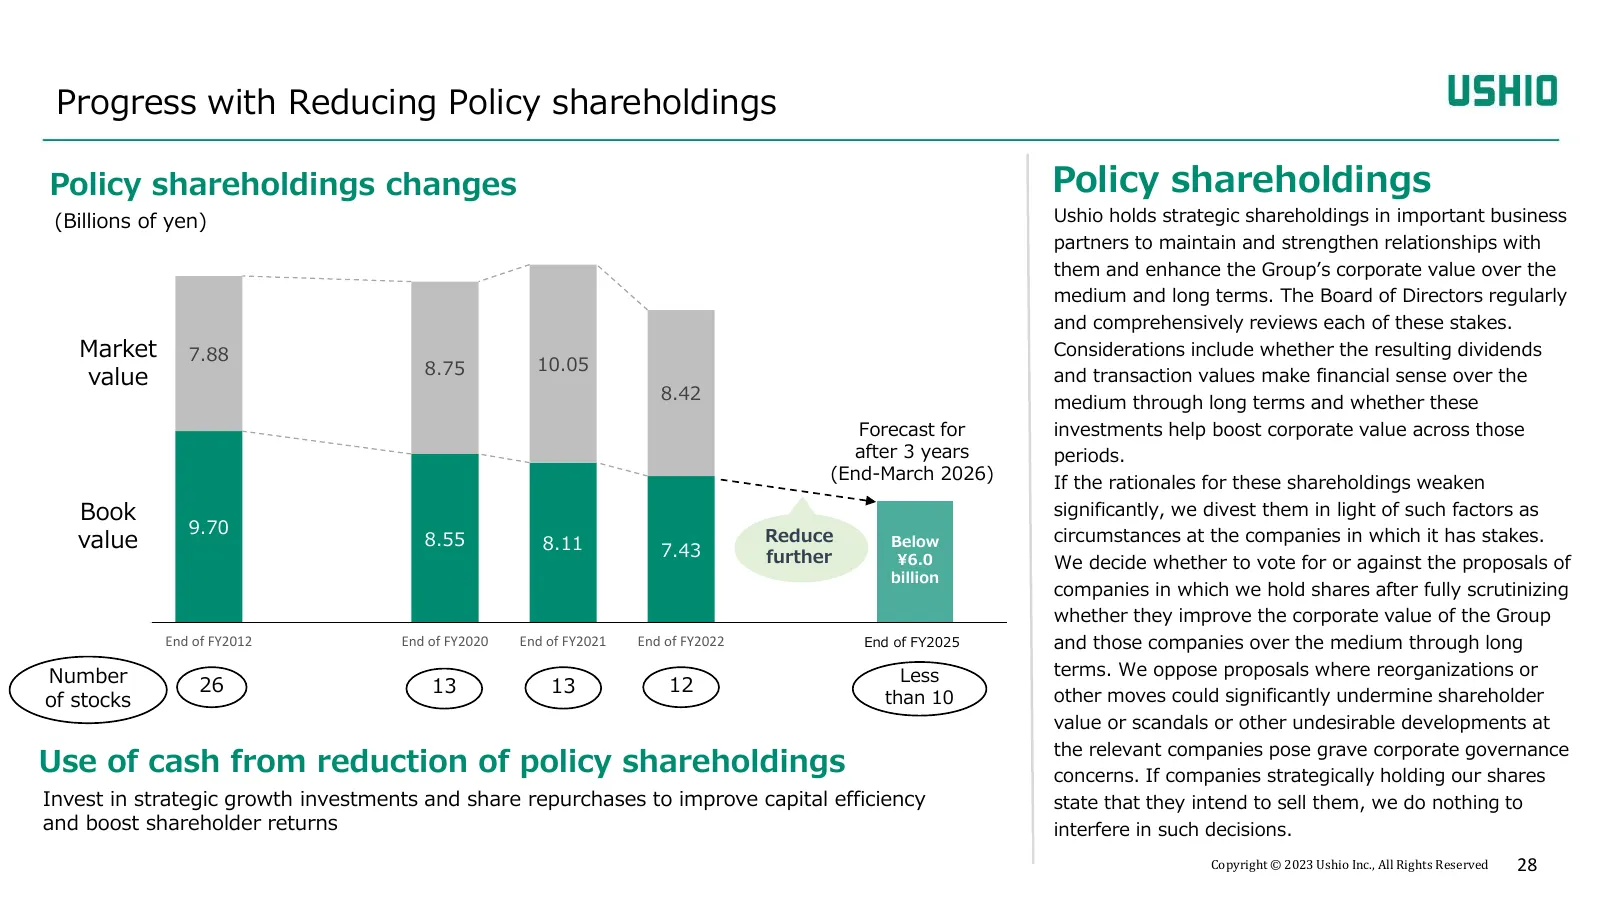
Progress with Reducing Policy shareholdings Policy shareholdings changes Policy shareholdings (Billions of yen) Ushio holds strategic shareholdings in important business partners to maintain and strengthen relationships with them and enhance the Group’s corporate value over the medium and long terms
Slide 29: Schedule and Progress with Treasury Share Investments and Dividends
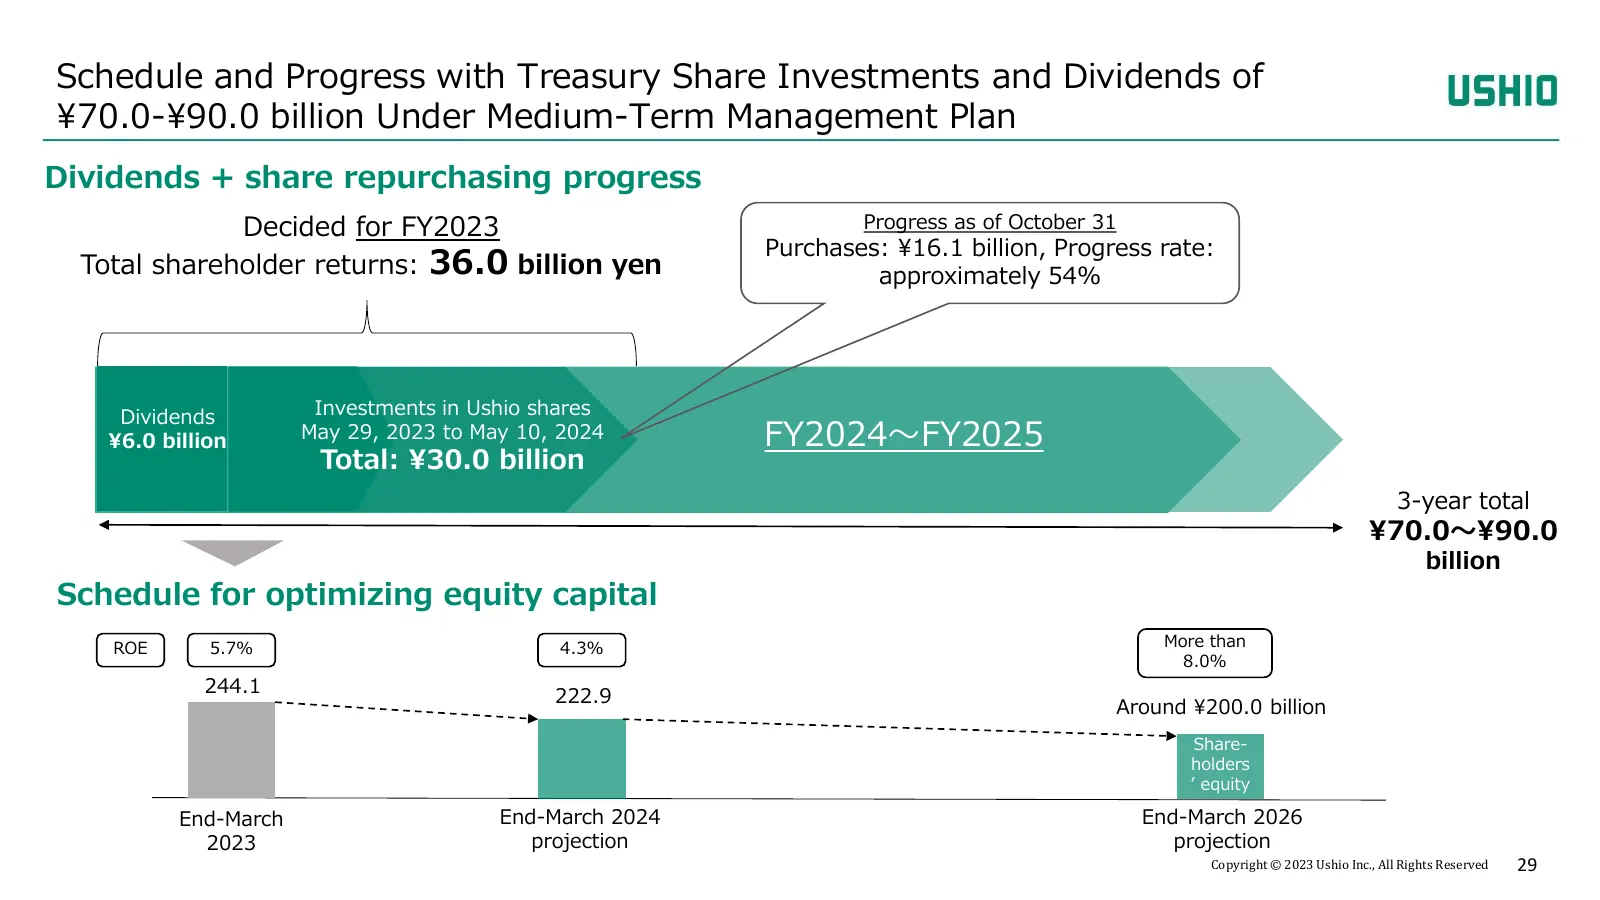
Schedule and Progress with Treasury Share Investments and Dividends of ¥70.0-¥90.0 billion Under Medium-Term Management Plan Dividends + share repurchasing progress Decided for FY2023 Progress as of October 31 Purchases: ¥16.1 billion, Progress rate: Total shareholder returns: 36.0 billion yen appro
Slide 30: Supplementary Information
I. Financial Results for H1 FY2023 II. Full-Year Forecast for FY2023 III. Follow up on 2 nd Medium-Term Management Plan IV. Supplementary Information Copyright © 2023 Ushio Inc., All Rights Reserved 30
Slide 31: (New) Business Segments and Main Products
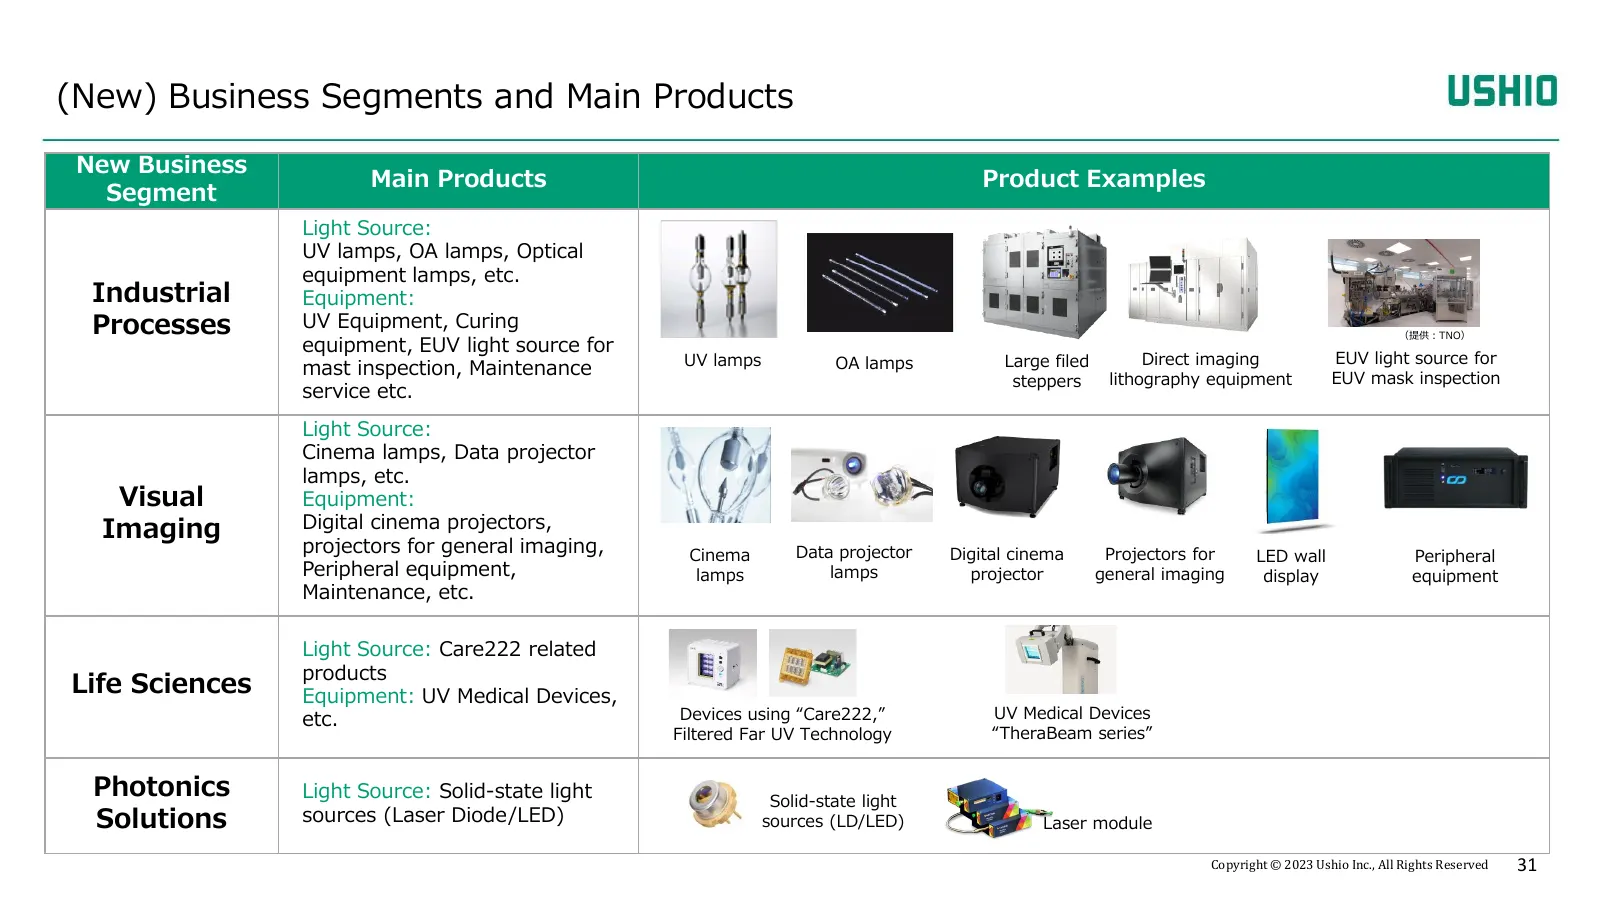
(New) Business Segments and Main Products New Business Main Products Product Examples Segment Light Source: UV lamps, OA lamps, Optical equipment lamps, etc. Industrial Equipment: Processes UV Equipment, Curing (提供:TNO) equipment, EUV light source for UV lamps OA lamps Large filed Direct imaging EUV
Slide 32: Reference: Reporting Segment Changes
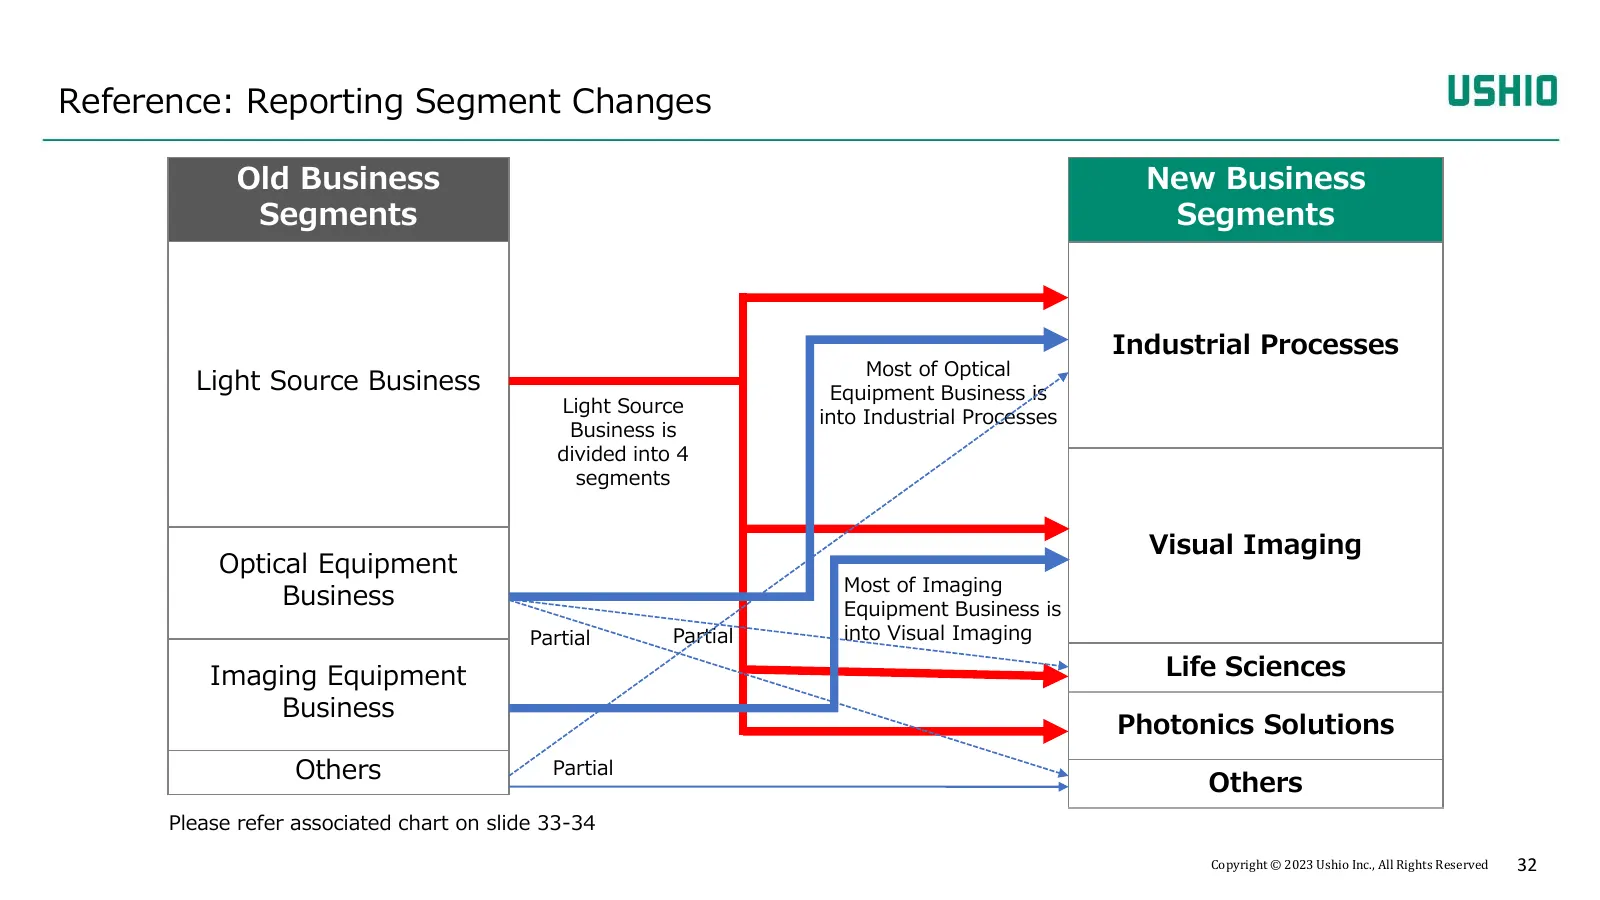
Reference: Reporting Segment Changes Old Business New Business Segments Segments Industrial Processes Most of Optical Light Source Business Equipment Business is Light Source into Industrial Processes Business is divided into 4 segments Visual Imaging Optical Equipment Most of Imaging Business Equip
Slide 33: Reference: Reporting Segment Changes (including subsegments)
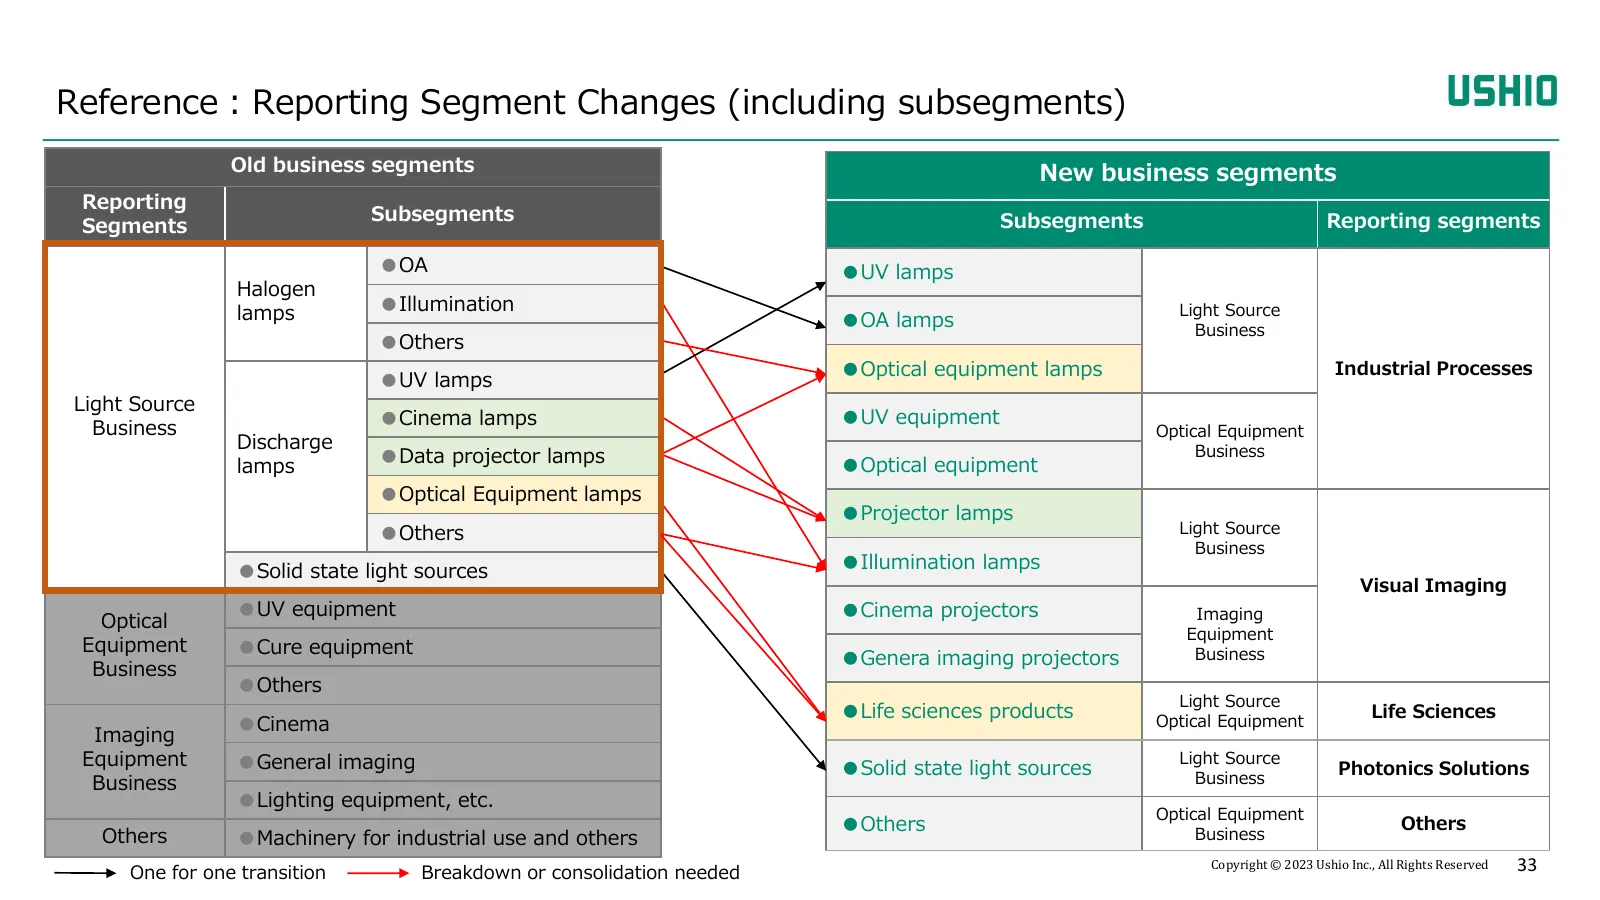
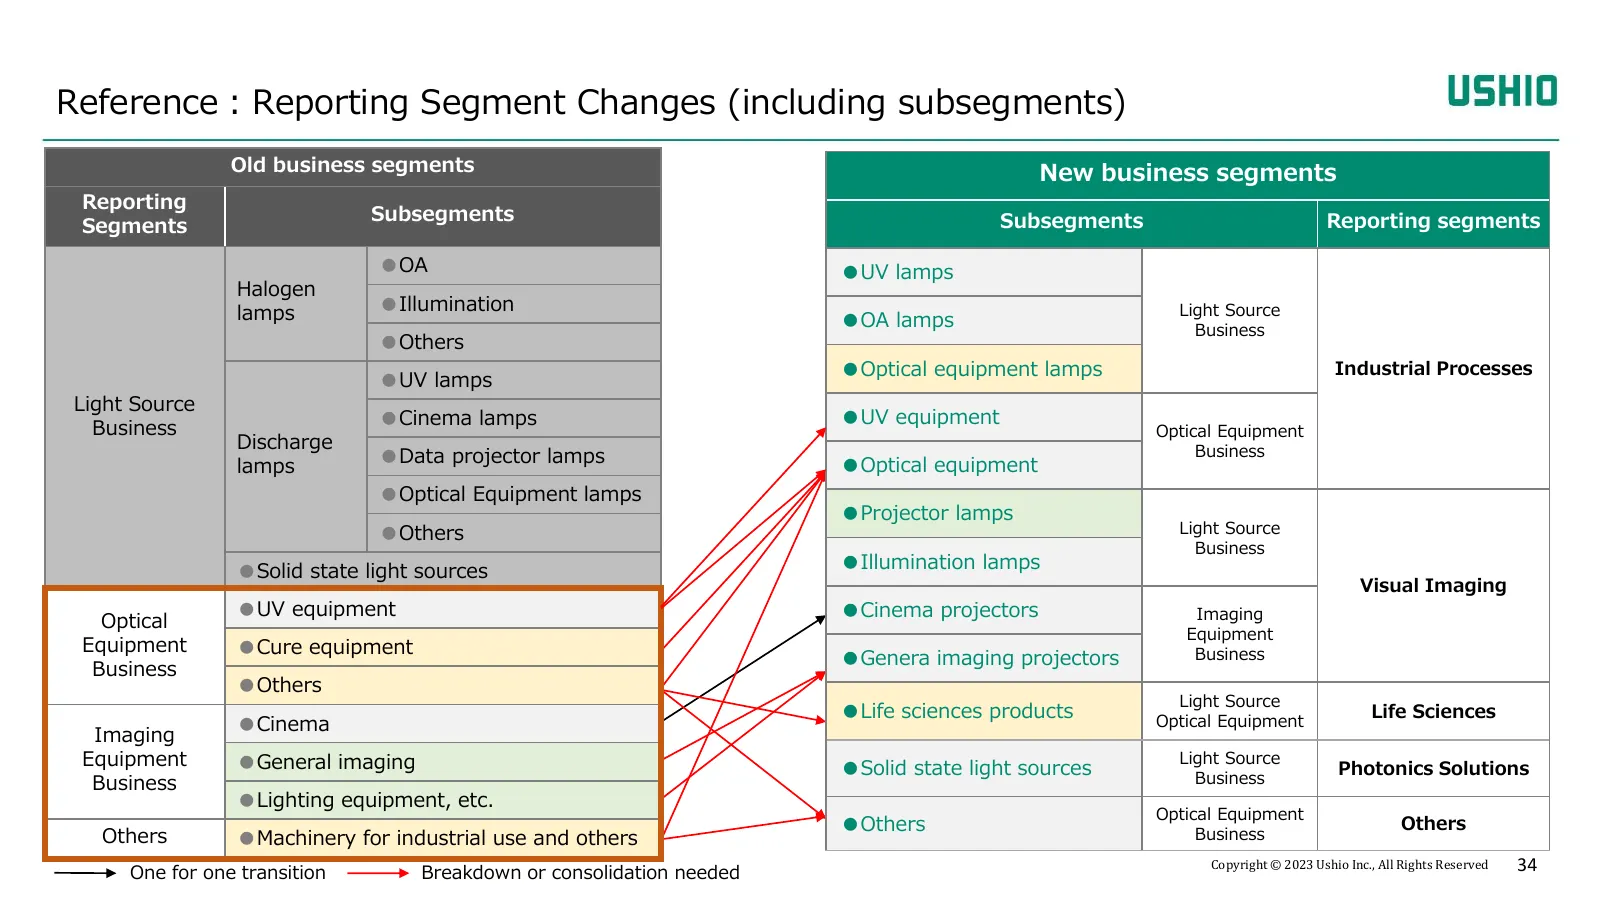
Reference:Reporting Segment Changes (including subsegments) Old business segments New business segments Reporting Subsegments Subsegments Reporting segments Segments ●OA ●UV lamps Halogen lamps ●Illumination Light Source ●OA lamps Business ●Others ●Optical equipment lamps Industrial Processes ●UV la
Slide 34: Reference: Reporting Segment Changes (including subsegments)
Reference:Reporting Segment Changes (including subsegments) Old business segments New business segments Reporting Subsegments Subsegments Reporting segments Segments ●OA ●UV lamps Halogen lamps ●Illumination Light Source ●OA lamps Business ●Others ●Optical equipment lamps Industrial Processes ●UV la
Slide 35: Industrial Processes: Semiconductor process and Ushio's involvement
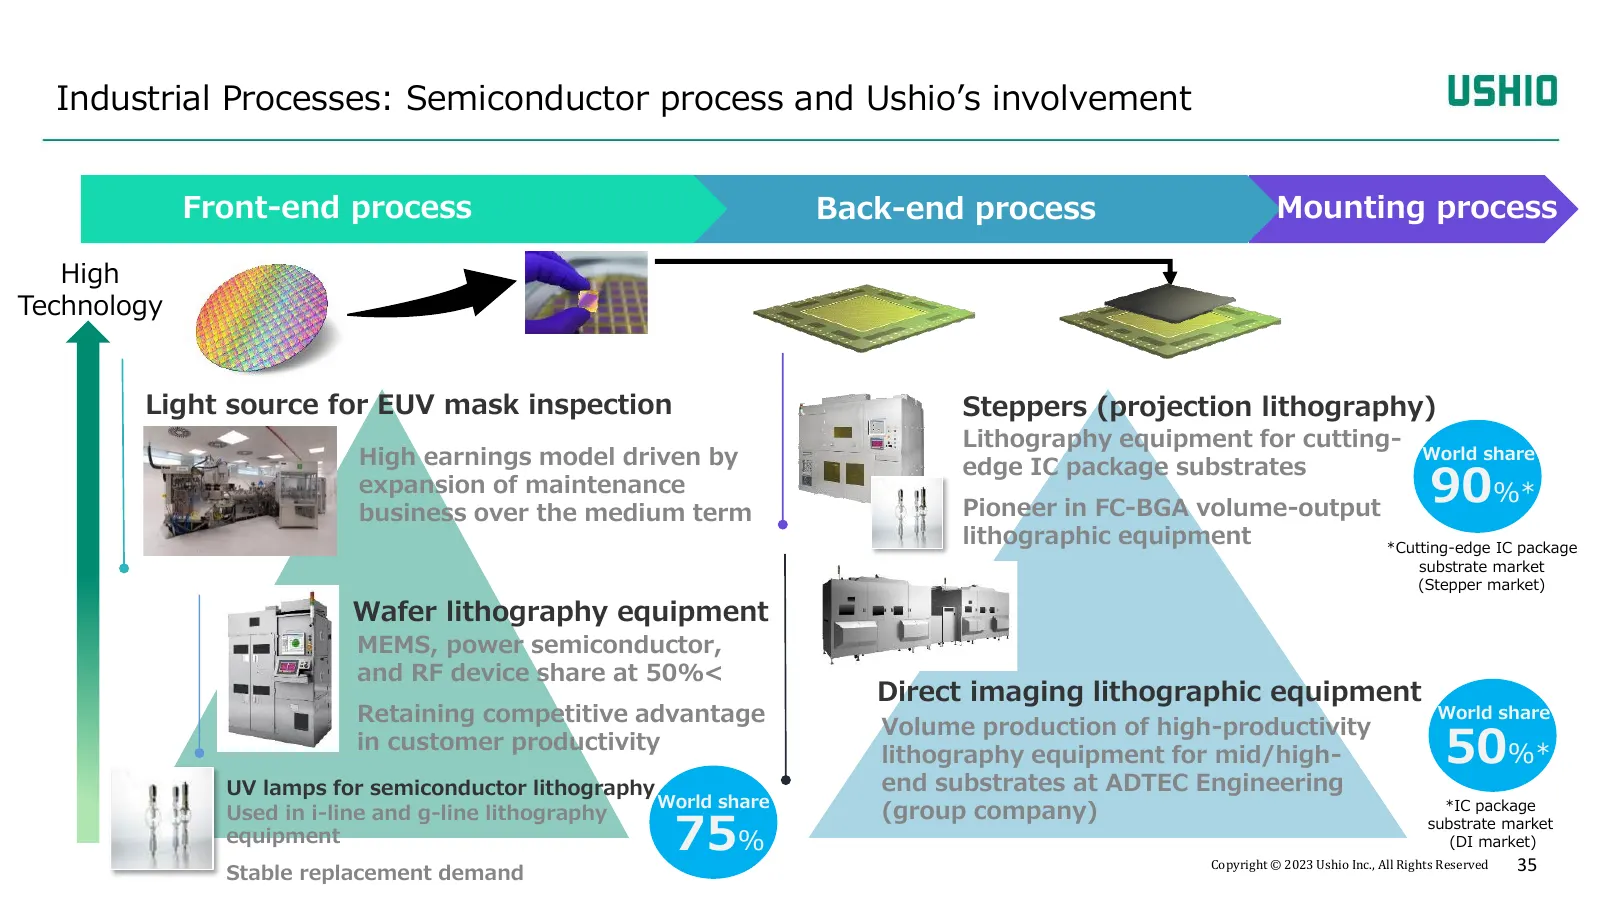
Industrial Processes: Semiconductor process and Ushio’s involvement Front-end process Back-end process Mounting process High Technology Light source for EUV mask inspection Steppers (projection lithography) Lithography equipment for cutting- High earnings model driven by edge IC package substrates W
Slide 36: EUV Light Source for EUV Mask Inspection
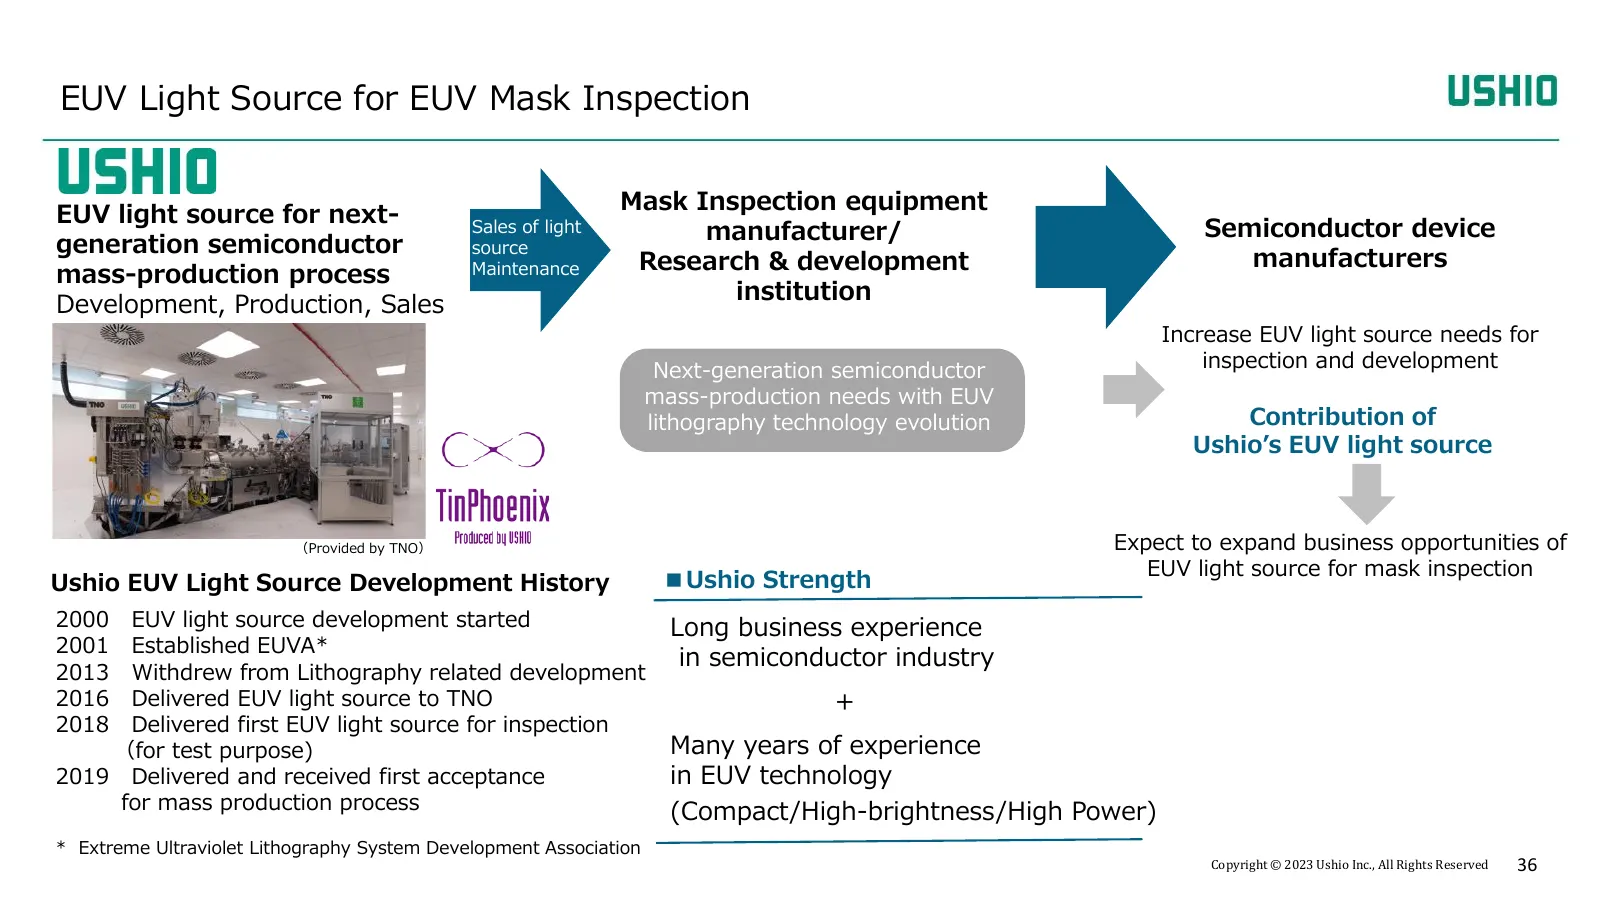
EUV Light Source for EUV Mask Inspection Mask Inspection equipment EUV light source for next- Sales of light manufacturer/ Semiconductor device generation semiconductor source Research & development manufacturers mass-production process Maintenance institution Development, Production, Sales Increase
Slide 37: Sales Expansion of UV Equipment for Cutting-edge IC Package Substrates
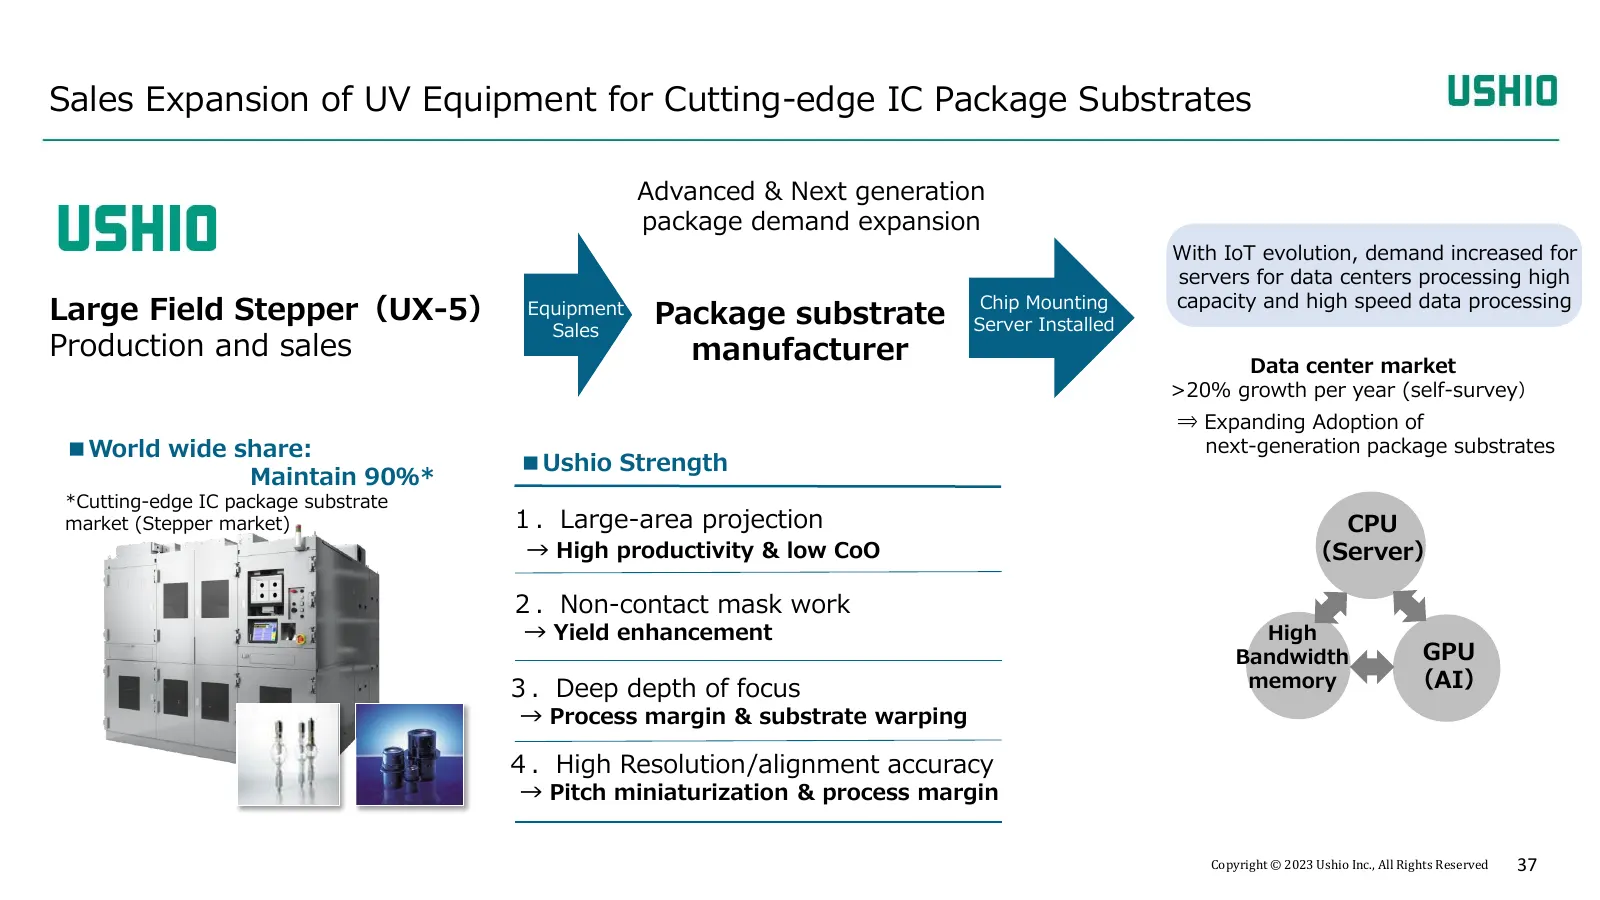
Sales Expansion of UV Equipment for Cutting-edge IC Package Substrates Advanced & Next generation package demand expansion With IoT evolution, demand increased for servers for data centers processing high capacity and high speed data processing Large Field Stepper(UX-5) Equipment Package substrate C
Slide 38: Direct Imaging (DI) Lithography Equipment
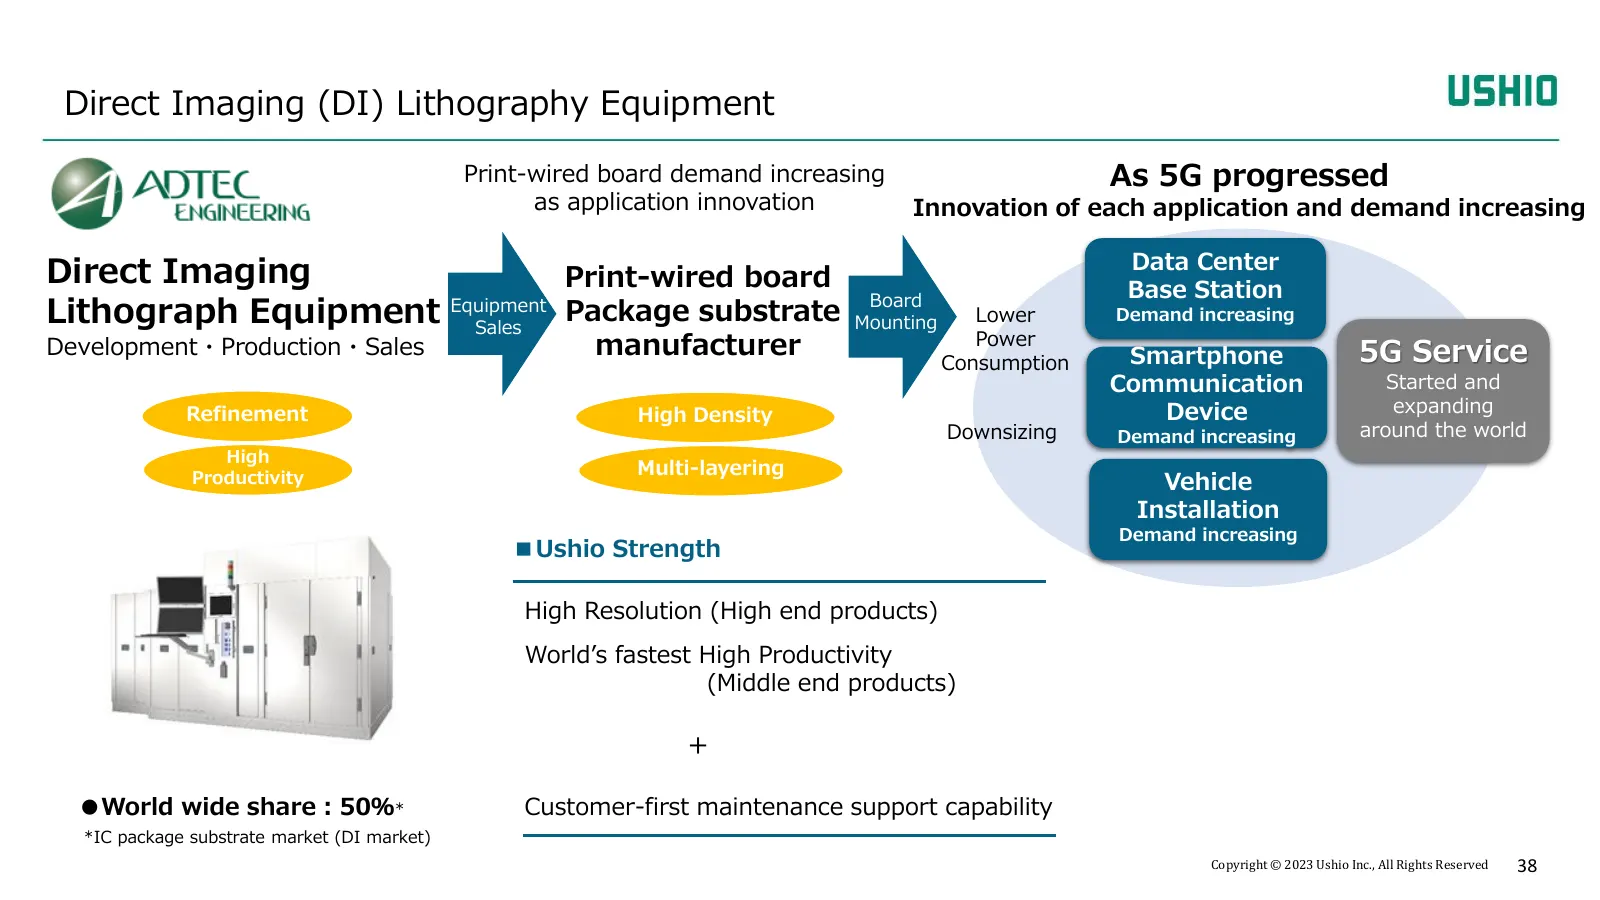
Direct Imaging (DI) Lithography Equipment Print-wired board demand increasing As 5G progressed as application innovation Innovation of each application and demand increasing Data Center Direct Imaging Print-wired board Base Station Lithograph Equipment Sales Equipment Package substrate Board Mountin
Slide 39: Reference: Summary of Quarterly Financial Results
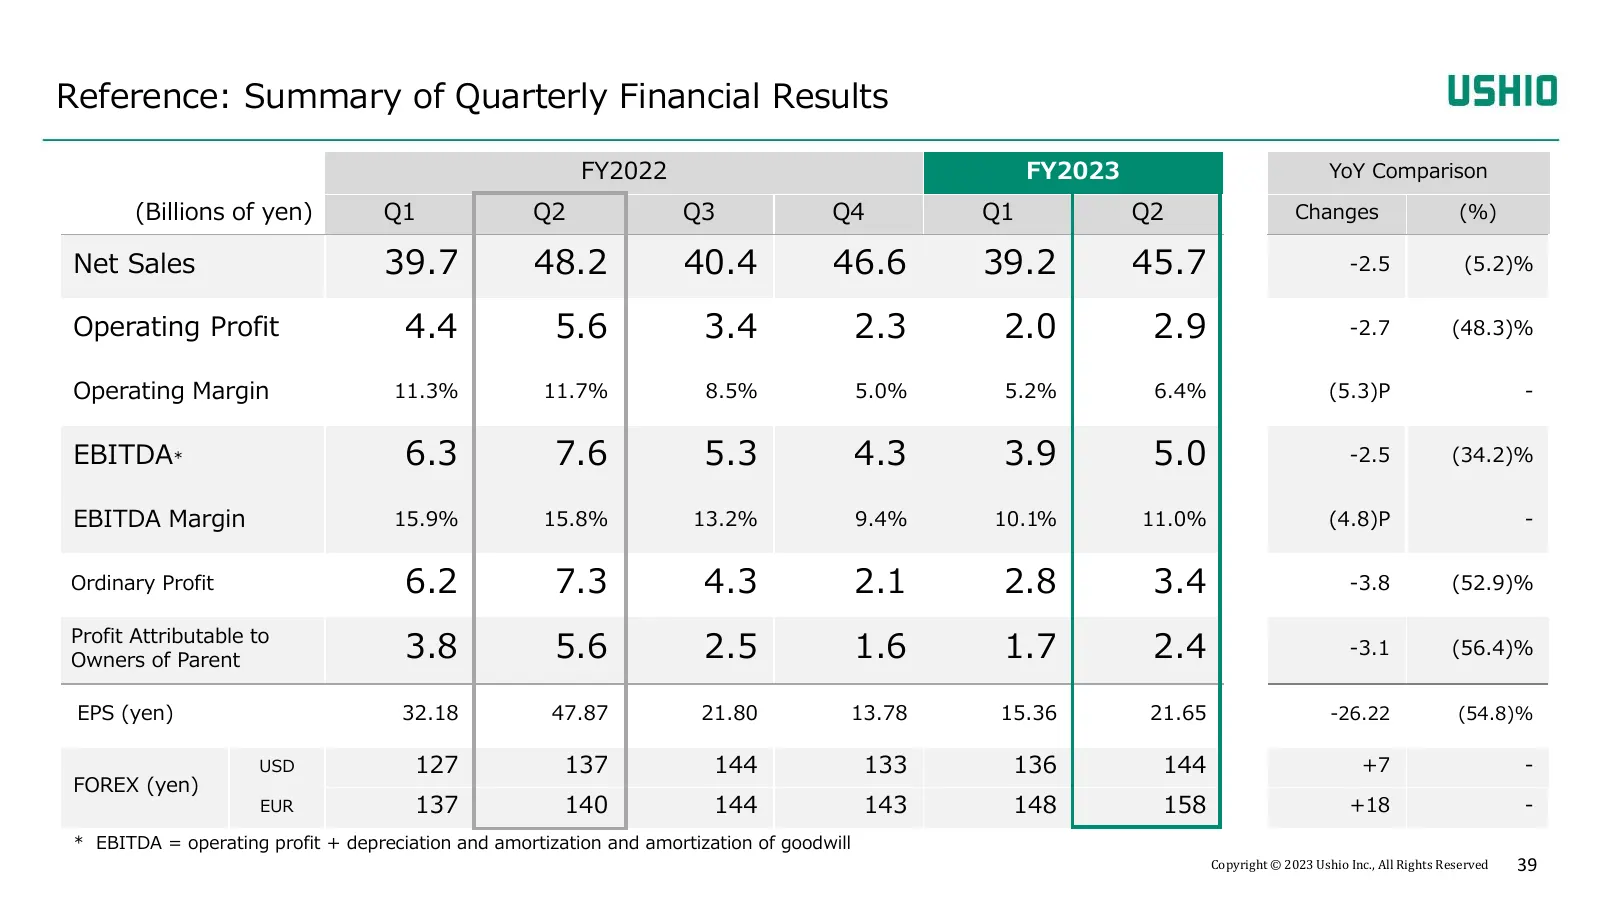
Reference: Summary of Quarterly Financial Results FY2022 FY2023 YoY Comparison (Billions of yen) Q1 Q2 Q3 Q4 Q1 Q2 Changes (%) Net Sales 39.7 48.2 40.4 46.6 39.2 45.7 -2.5 (5.2)% Operating Profit 4.4 5.6 3.4 2.3 2.0 2.9 -2.7 (48.3)% Operating Margin 11.3% 11.7% 8.5% 5.0% 5.2% 6.4% (5.3)P ‐ EBITDA* 6
Slide 40: Reference: Summary of Quarterly Financial Results by Business Segments
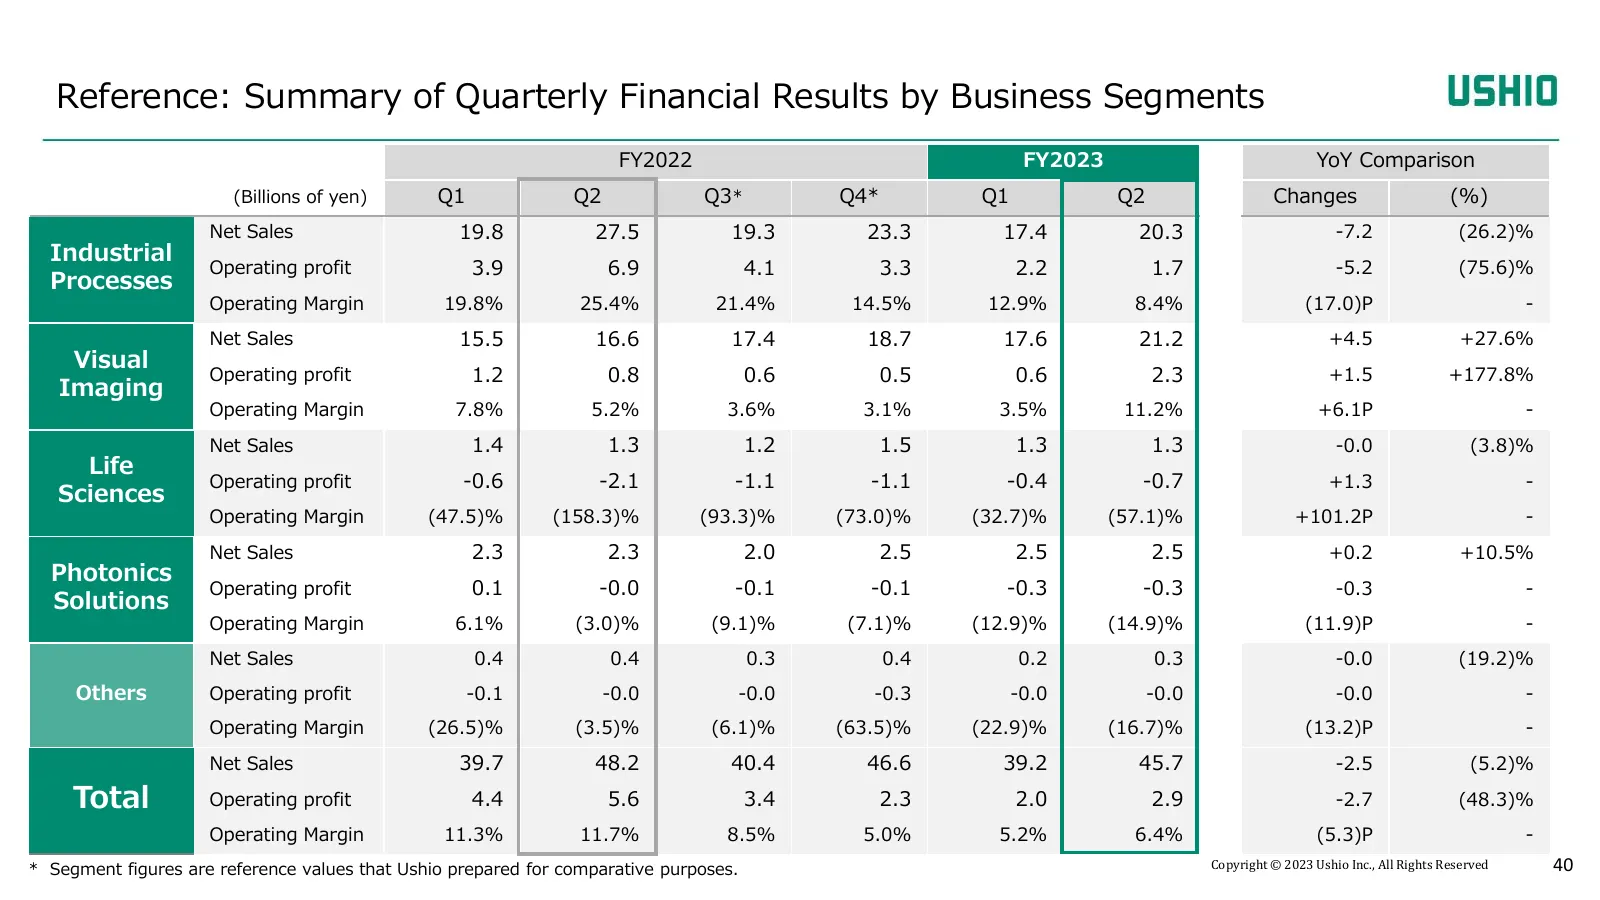
Reference: Summary of Quarterly Financial Results by Business Segments FY2022 FY2023 YoY Comparison (Billions of yen) Q1 Q2 Q3* Q4* Q1 Q2 Changes (%) Net Sales 19.8 27.5 19.3 23.3 17.4 20.3 -7.2 (26.2)% Industrial Operating profit 3.9 6.9 4.1 3.3 2.2 1.7 -5.2 (75.6)% Processes Operating Margin 19.8%
Slide 41: Cash Allocation Strategy
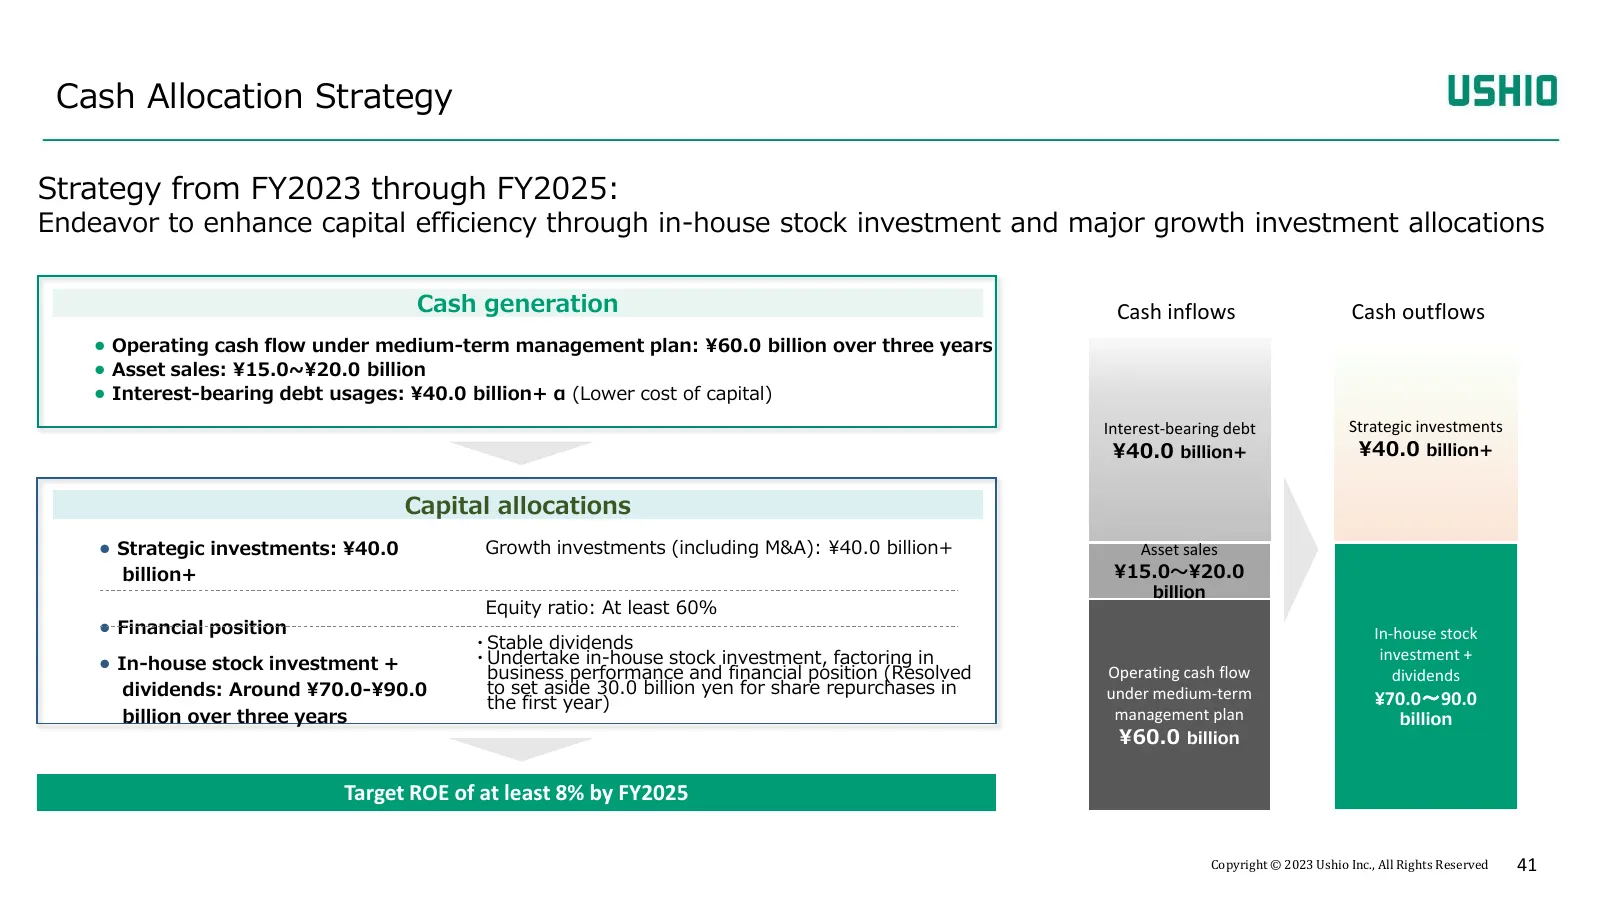
Cash Allocation Strategy Strategy from FY2023 through FY2025: Endeavor to enhance capital efficiency through in-house stock investment and major growth investment allocations Cash generation Cash inflows Cash outflows • Operating cash flow under medium-term management plan: ¥60.0 billion over three
Slide 42: Reference: Sales Ratio by Region
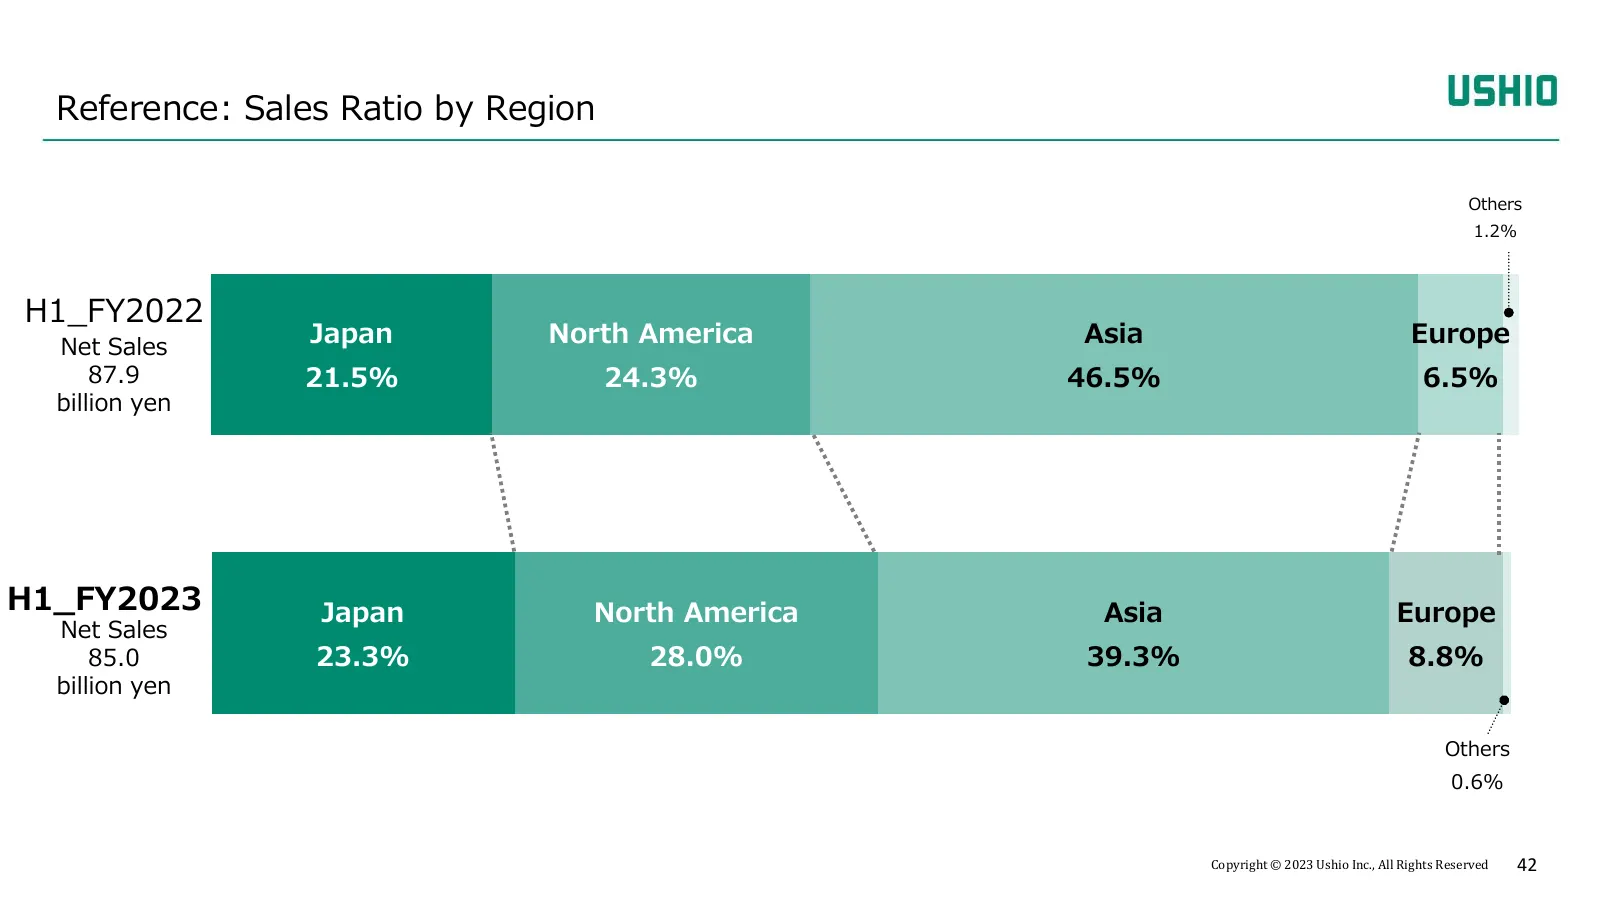
Reference: Sales Ratio by Region Others 1.2% H1_FY2022 Net Sales Japan North America Asia Europe 87.9 21.5% 24.3% 46.5% 6.5% billion yen H1_FY2023 Japan North America Asia Europe Net Sales 85.0 23.3% 28.0% 39.3% 8.8% billion yen Others 0.6% Copyright © 2023 Ushio Inc., All Rights Reserved 42
Slide 43: Reference: R&D Expenses/Capital Expenditures and Depreciation
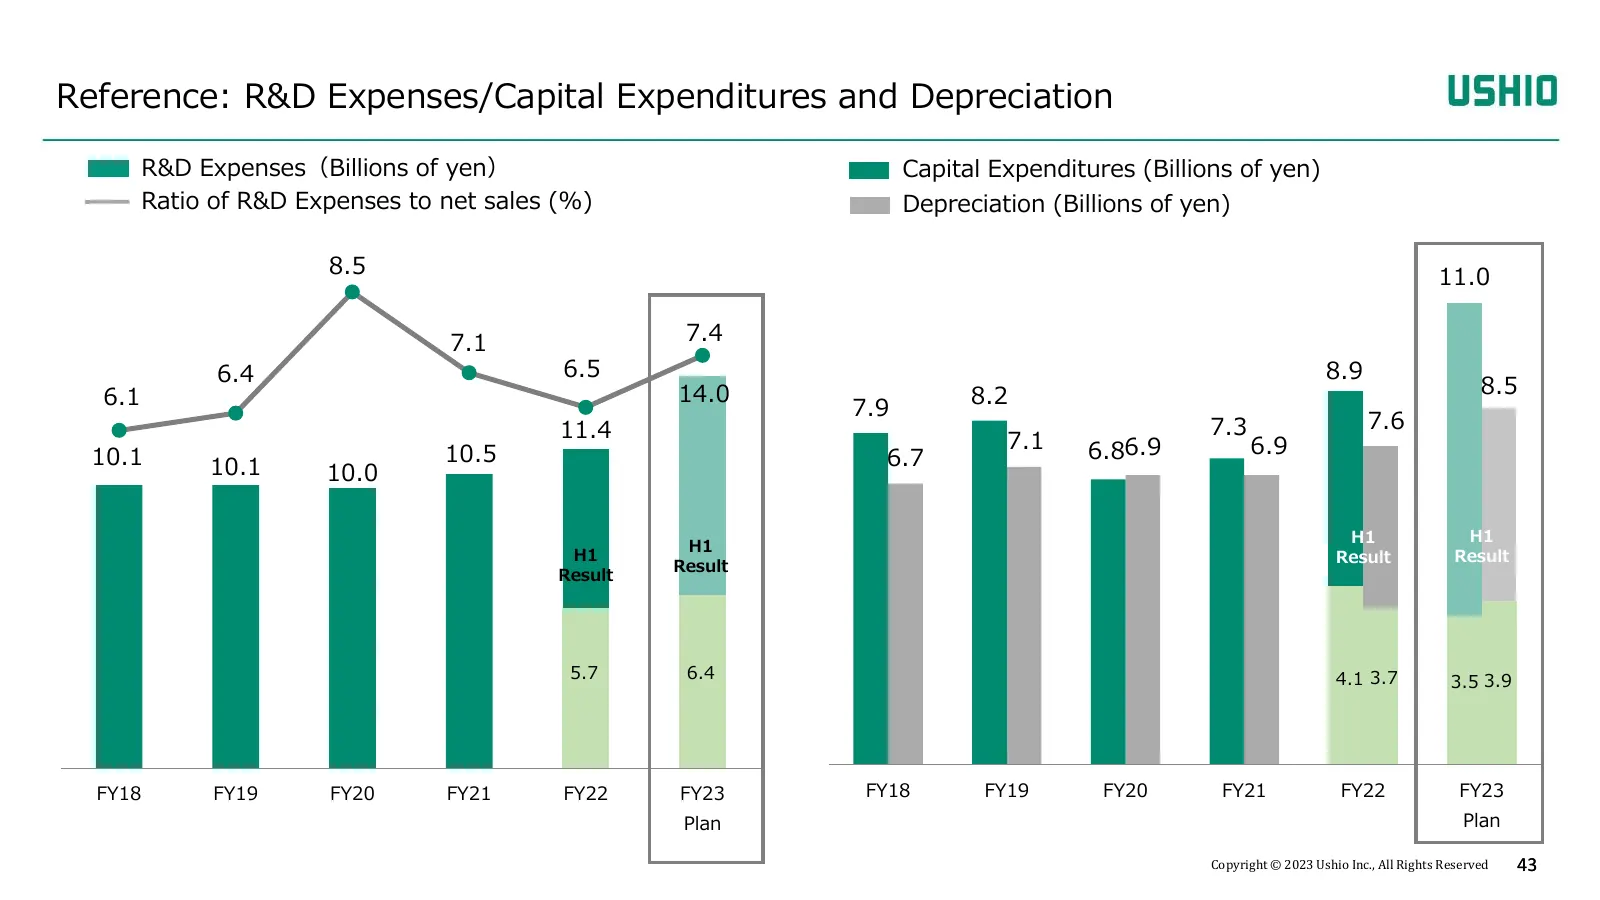
Reference: R&D Expenses/Capital Expenditures and Depreciation R&D Expenses(Billions of yen) Capital Expenditures (Billions of yen) Ratio of R&D Expenses to net sales (%) Depreciation (Billions of yen) 8.5 11.0 7.1 7.4 6.4 6.5 8.9 6.1 14.0 8.2 8.5 7.9 11.4 7.3 7.6 7.1 6.86.9 6.9 10.1 10.5 6.7 10.1 10
Slide 44: Reference: Balance Sheet
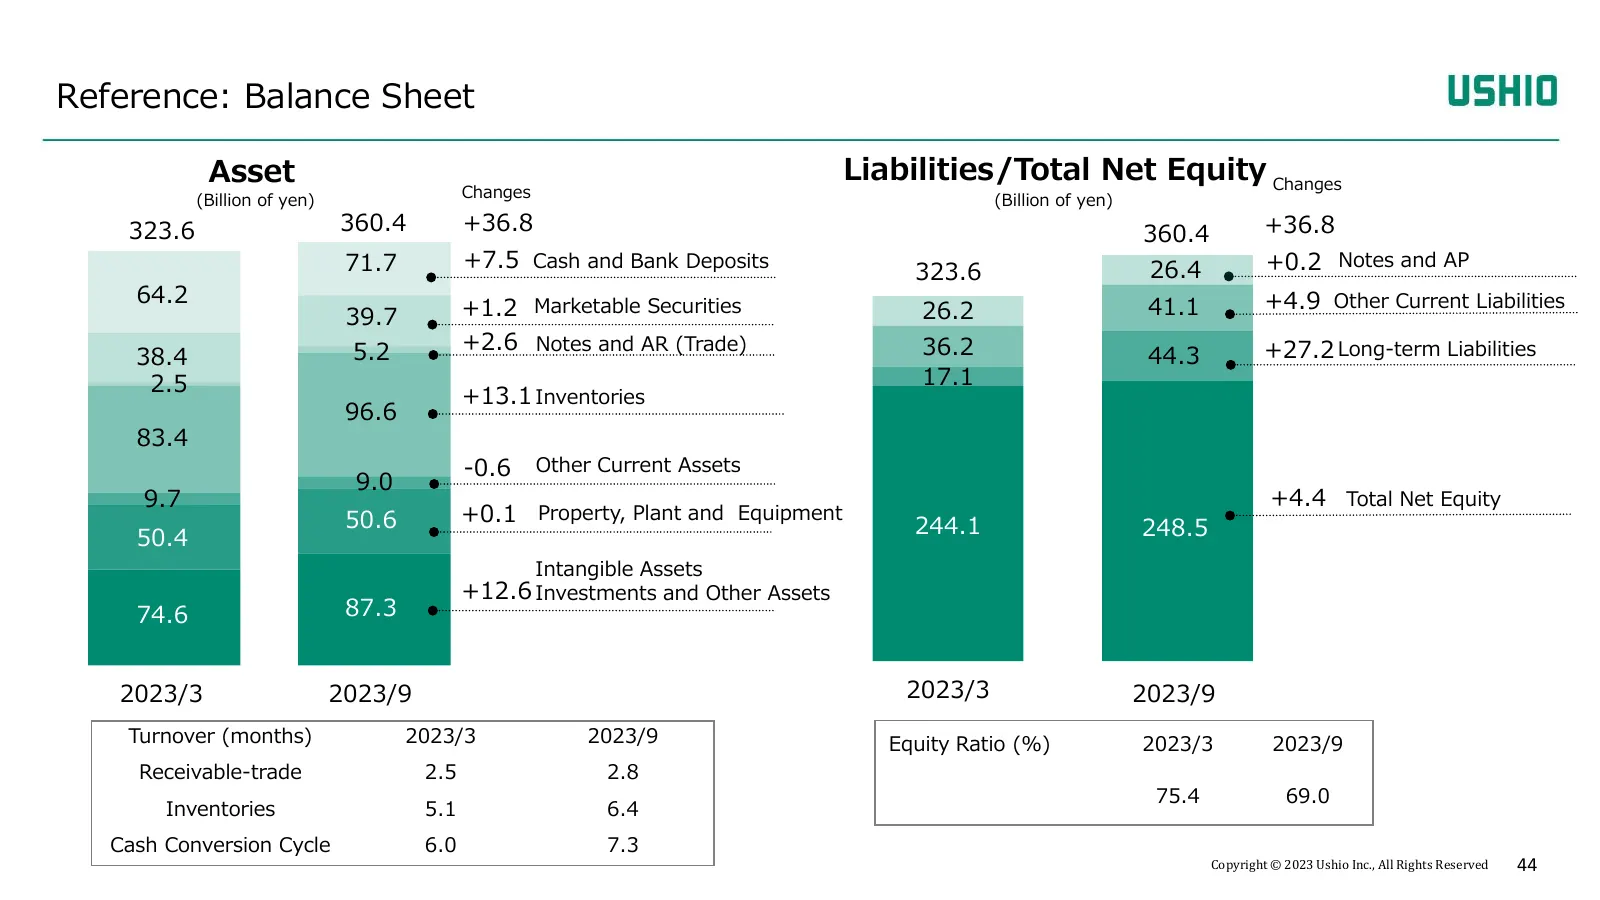
Reference: Balance Sheet Asset Liabilities/Total Net Equity Changes (Billion of yen) Changes (Billion of yen) 323.6 360.4 +36.8 360.4 +36.8 71.7 +7.5 Cash and Bank Deposits 323.6 26.4 +0.2 Notes and AP 64.2 41.1 +4.9 Other Current Liabilities 39.7 +1.2 Marketable Securities 26.2 5.2 +2.6 Notes and A
Slide 45: Reference: Cash Flow
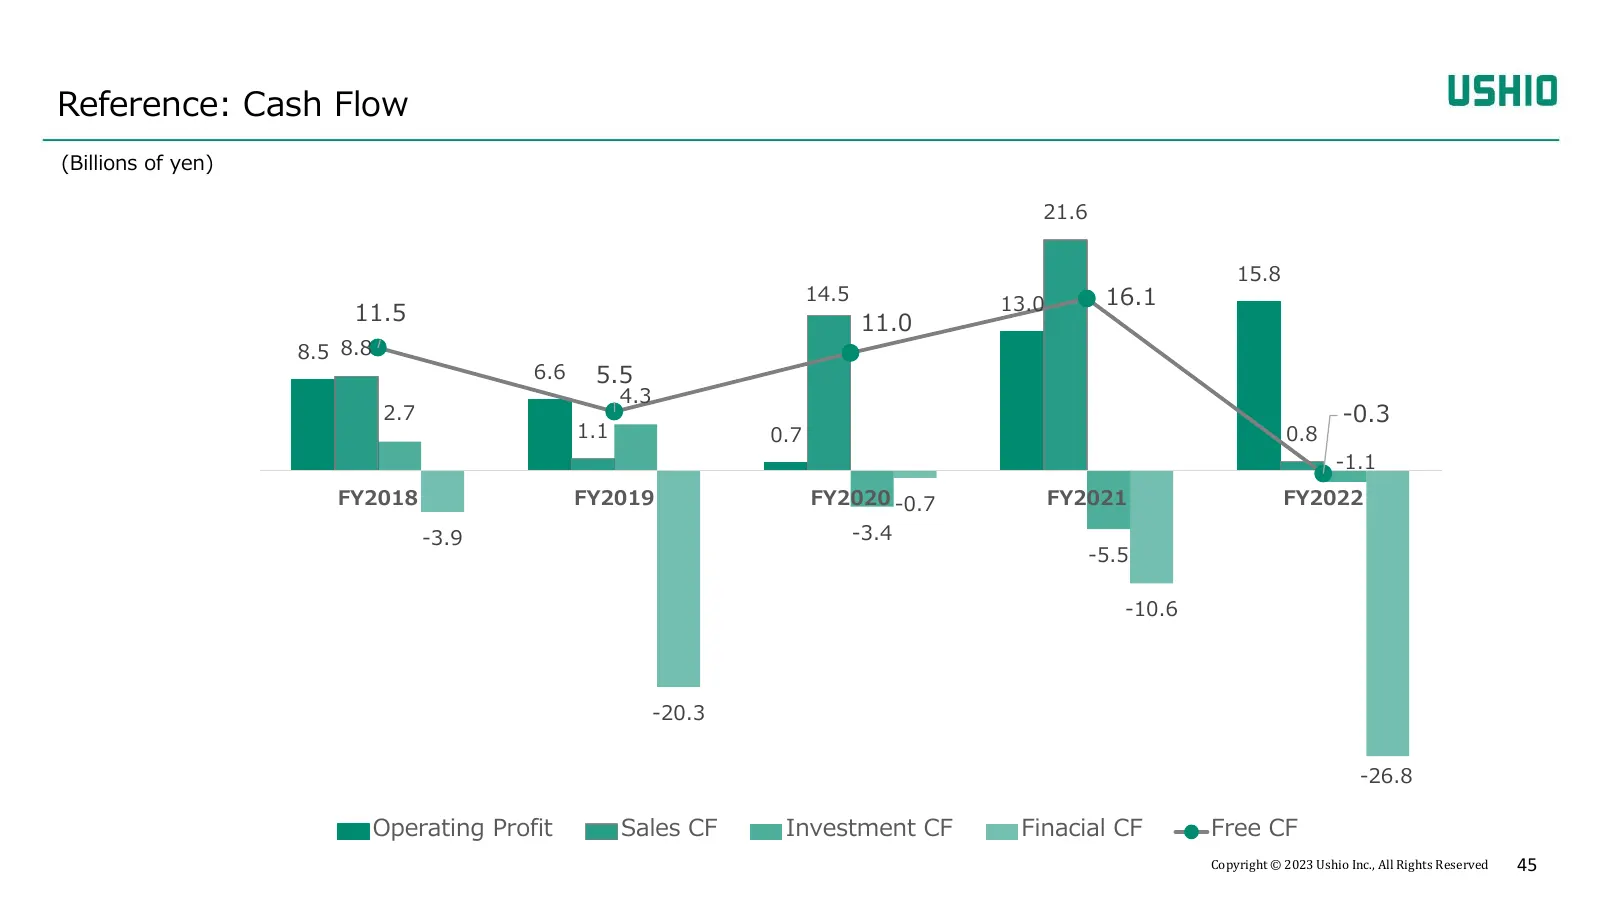
Reference: Cash Flow (Billions of yen) 21.6 15.8 14.5 13.0 16.1 11.5 11.0 8.5 8.8 6.6 5.5 4.3 2.7 -0.3 1.1 0.7 0.8 -1.1 FY2018 FY2019 FY2020 -0.7 FY2021 FY2022 -3.9 -3.4 -5.5 -10.6 -20.3 -26.8 Operating Profit Sales CF Investment CF Finacial CF Free CF Copyright © 2023 Ushio Inc., All Rights Reserve
Slide 46: Glossary
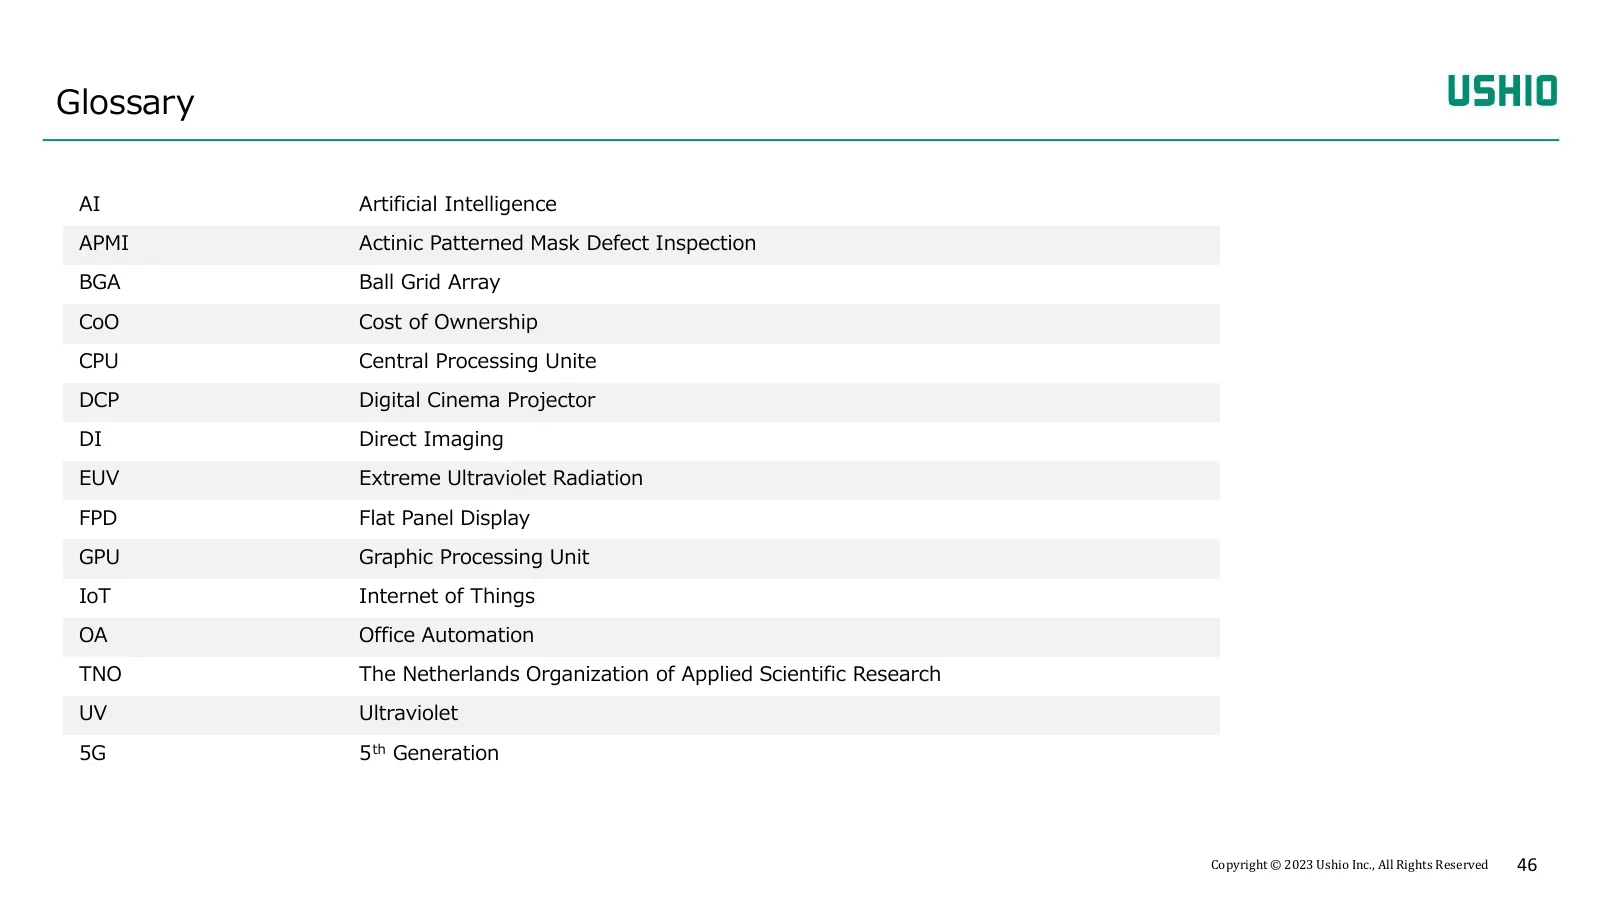
Glossary AI Artificial Intelligence APMI Actinic Patterned Mask Defect Inspection BGA Ball Grid Array CoO Cost of Ownership CPU Central Processing Unite DCP Digital Cinema Projector DI Direct Imaging EUV Extreme Ultraviolet Radiation FPD Flat Panel Display GPU Graphic Processing Unit IoT Internet of
Slide 47: Renewed IR Website/IR Mail Distribution Feature
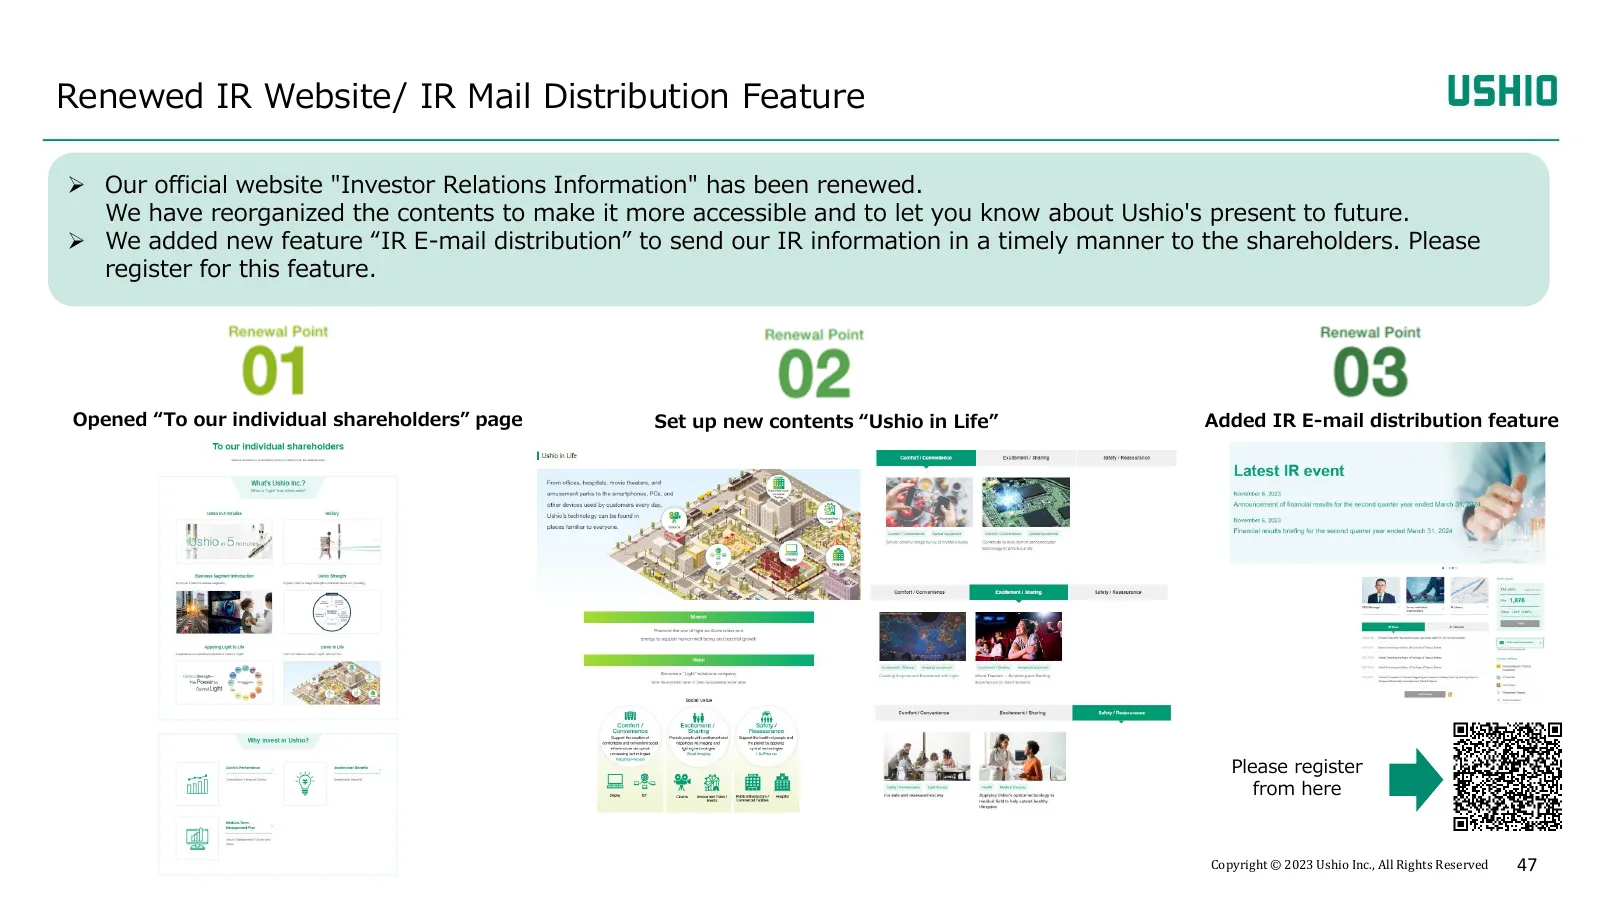
Renewed IR Website/ IR Mail Distribution Feature ➢ Our official website "Investor Relations Information" has been renewed. We have reorganized the contents to make it more accessible and to let you know about Ushio's present to future. ➢ We added new feature “IR E-mail distribution” to send our IR i
Slide 48: Disclaimer
<Disclaimer> This report contains forward-looking statements, including earnings forecasts, which are based on information currently available to the Company and on certain assumptions deemed to be reasonable. Please be advised that actual results may differ substantially from those forward-looking

Slide 49: Contact: Investor Relations Section
Contact: Investor Relations Section Corporate Communication Department Ushio Inc. Email: ir@ushio.co.jp https://www.ushio.co.jp/en/ Copyright © 2023 Ushio Inc., All Rights Reserved 49
Source: Internet Archive copy of ushio.co.jp
More decks from Ushio Inc.
 Q2 FY2027 Earnings Presentation39 slides · Nov 6, 2026
 Q2 FY2026 Earnings Presentation39 slides · Nov 6, 2026
 Q1 FY2027 Earnings Presentation34 slides · Aug 4, 2026
 Q1 FY2027/3 Earnings Presentation34 slides · Aug 4, 2026
 Investor Presentation (June 2026)107 slides · Jun 30, 2026
 FY2025 Earnings Presentation55 slides · May 14, 2026