
Vancouver, British Columbia--(Newsfile Corp. - July 8, 2026) - Lode Gold Resources Inc. (TSXV: LOD) (OTCQB: LODFF) ("Lode Gold" or the "Company") is pleased to announce that further to its news release dated June 29, 2026, it has filed its independent National Instrument 43-101 ("NI 43-101") Technical Report, "NI 43-101 Updated Technical Report for the Fremont Gold Property, Mariposa County, California, USA" for the Fremont Gold Mine on SEDAR+.
Mineral Resource Estimate and Sensitivity Analysis
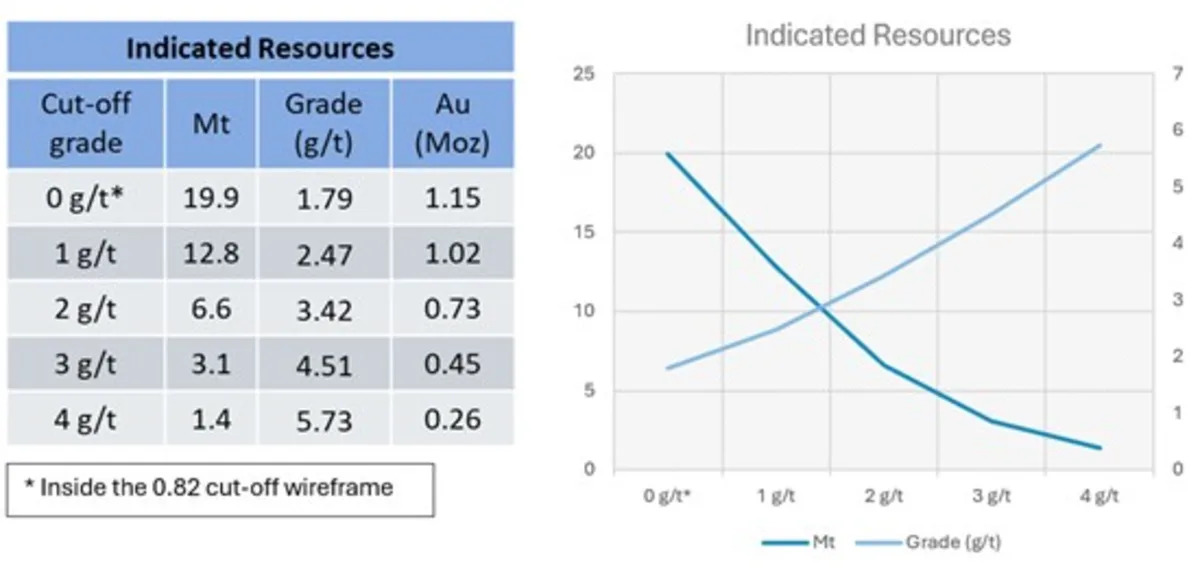
The updated mineral resource estimate incorporates multiple cut-off grade scenarios evaluated within the block model to demonstrate the nature of the deposit under varying parameters. The official tonnage, average gold grades, and contained ounces are detailed independently by resource classification in the following tables:
Table 1: Mineral Resources Report per category at 0.82 g/t cut-off
Category | Tonnage (Mt) | Au (gr/t) | Au Content (Moz) |
Indicated | 19.9 | 1.79 | 1.15 |
Inferred | 38.5 | 1.73 | 2.17 |
Table 2: Indicated Mineral Resource Sensitivity
To view an enhanced version of this graphic, please visit:
https://images.newsfilecorp.com/files/4064/304412_94cc412184b6c88a_001full.jpg
Table 3: Inferred Mineral Resource Sensitivity
To view an enhanced version of this graphic, please visit:
https://images.newsfilecorp.com/files/4064/304412_94cc412184b6c88a_002full.jpg
Technical Commentary on Thickness and Mineralization Density
To complement the global resource framework, the Grams x Meter (g*m) is a very useful metric to evaluate the intensity of gold distribution (mineralization density) in the Fremont Gold Mine.
Table 4 shows the spatial and geometric behavior of the mineralized domains across sequential cut-off grade increments. By consolidating the physical parameters of thickness, tonnage, and grade, this analysis illustrates how the deposit scales uniformly:
Table 4: Combined Deposit Geometry and Metal Intensity Profile
* Inside the 0.82 cut-off wireframe
To view an enhanced version of this graphic, please visit:
https://images.newsfilecorp.com/files/4064/304412_787605d3844e49b4_006full.jpg
In the Fremont Gold mine, the global g*m values remain consistent across cut-off grade increments from 0 g/t up to 3 g/t Au. This stable relationship highlights key technical attributes of the deposit:
Predictability: The grade increases in direct mathematical proportion to the reduction in mining width, maintaining a stable metal density of mineralization.
Operational Optionality: The balanced distribution allows for the evaluation of a variety of engineering scenarios, ranging from bulk-tonnage configurations within the wider envelopes to selective underground designs focused on the internal vein structures.
Structural Coherence: The continuity of the g*m values confirms that the higher-grade mineralized components are structurally hosted and well-defined within the overall domain geometry.