

Half Year Results for the six months to 31 January 2026
17 March 2026
Mike Morgan, Chief Executive, said:
"Close Brothers has been part of the backbone of the UK business community for nearly 150 years. Last year alone we lent £7 billion into the economy, continuing to make a real difference to the businesses and consumers we serve.
In the first half of the 2026 financial year, the group delivered a resilient trading performance reflecting cost discipline, solid credit performance and a robust net interest margin. We have repositioned the business to focus on markets where we see strong and sustainable opportunities. As a result, and given current market conditions, the loan book has marginally reduced in the first half, while a number of our core businesses continued to grow. We are well positioned for future growth as a specialist banking group.
Our CET1 capital ratio remains strong at 14.3% and we are confident that this leaves us well placed to absorb a range of potential outcomes from the FCA's proposed motor finance commission redress scheme.
We remain focused on delivering our strategic priorities: simplify, optimise, and grow. With the simplification of our business largely complete, we are firmly in the optimisation stage, and have accelerated our cost savings plans. We now expect to deliver c.£25 million of annualised savings in the current financial year and a total of c.£60 million of annualised savings by the end of 2027 rather than 2028. This positions us well to reach double-digit returns by the 2028 financial year, rising thereafter."
Key Financials1
Unless otherwise stated, all metrics refer to continuing operations only
|
First half 2026 £ million |
First half 2025 £ million |
Change % |
|
|
Operating loss before tax |
(65.5) |
(102.2) |
(36) |
|
Adjusted operating profit2 |
65.2 |
80.5 |
(19) |
|
Profit/(loss) from discontinued operations, net of tax3 |
0.8 |
(0.4) |
(300) |
|
Loss attributable to shareholders and other equity owners |
(64.4) |
(111.8) |
(42) |
|
Adjusted basic earnings per share (continuing operations)2,4 |
27.1p |
33.8p |
|
|
Basic (loss)/earnings per share (continuing operations)4 |
(51.0)p |
(81.8)p |
|
|
Basic (loss)/earnings per share (continuing and discontinued operations)3,4 |
(50.5)p |
(82.1)p |
|
|
Ordinary dividend per share |
- |
- |
|
|
Return on opening equity5 |
5.6% |
7.1% |
|
|
Return on average tangible equity5 |
6.3% |
8.7% |
|
|
Net interest margin |
7.1% |
7.3% |
|
|
Bad debt ratio |
0.8% |
1.0% |
|
|
Expense/income ratio |
68% |
63% |
|
31 January 2026 |
31 July 2025 |
Change |
|
|
Loan book6 |
£9.2bn |
£9.5bn |
(2) |
|
Net asset value ("NAV") per share (continuing and discontinued operations) |
£9.8 |
£10.3 |
|
|
Tangible net asset value ("TNAV") per share (continuing and discontinued operations) |
£8.7 |
£9.1 |
|
|
CET1 capital ratio (continuing and discontinued operations)7 |
14.3% |
13.8% |
|
|
Tier 1 capital ratio (continuing and discontinued operations)7 |
16.5% |
15.8% |
|
|
Total capital ratio (continuing and discontinued operations)7 |
18.8% |
17.8% |
|
1. |
Please refer to definitions on pages 65 to 67. |
|
2. |
Adjusted measures are presented on a basis consistent with prior periods and exclude any exceptional and adjusting items which do not reflect underlying trading performance. Current adjusting items include: customer remediation provisions, operational or legal costs incurred in relation to an event that is deemed to be adjusting, Close Brewery Rentals Limited which was sold in the period, Close Brothers Vehicle Hire which is in wind-down, restructuring costs and amortisation of intangible assets on acquisition. There are no exceptional items presented in these financial results. Please refer to the Basis of Presentation on page 4 for further information, and the tables on page 8 for details on the reconciliation between operating and adjusted measures. |
|
3. |
Discontinued operations relate to Close Brothers Asset Management and Winterflood, which have been classified as "discontinued operations" in the group's income statement for the 2025 and 2026 financial years in line with the requirements of IFRS 5. The related assets and liabilities are classified as held for sale on the group's balance sheet at 31 July 2025. Please refer to Note 20 "Discontinued operations and assets and liabilities classified as held for sale". |
|
4. |
Refer to Note 4 "Earnings per Share" for the calculation of basic and adjusted earnings per share. |
|
5. |
Return on opening equity and return on average tangible equity have been restated for the first half of 2025 to exclude discontinued operations. Return on average tangible equity, defined as annualised adjusted operating profit less tax and AT1 coupons divided by average total shareholders' equity, excluding intangible assets and AT1, for continuing operations. See note 7 on page 8 for further details. |
|
6. |
Loan book includes operating lease assets of £1.3 million (31 July 2025: £1.3 million) and excludes £157.0 million (31 July 2025: £165.0 million) of operating lease assets related to Close Brothers Vehicle Hire, which is in wind-down, and £nil of operating lease assets related to Close Brewery Rentals Limited (31 July 2025: £41.0 million), sold on 31 August 2025. |
|
7. |
Capital ratios at 31 July 2025 shown after applying IFRS 9 transitional arrangements and the CRR transitional and qualifying own funds arrangements in force at the time. Without their application, at 31 July 2025 the CET1 capital ratio would be 13.7%, tier 1 capital ratio 15.7% and total capital ratio 17.8%. |
Highlights
|
• |
Adjusted operating profit of £65.2 million (H1 2025: £80.5 million) and RoTE of 6.3% (H1 2025: 8.7%) reflecting a reduction in income partly offset by lower impairment losses |
|
• |
Adjusted operating income decreased 6% driven by a lower average loan book, reflecting the impact of current market conditions, in particular on our Property book; and the repositioning of our businesses including the wind-down of Novitas and the planned reduction of personal lines in Premium Finance |
|
• |
Across the lending divisions of Commercial, Retail and Property, NIM remained robust at 7.1% (H1 2025: 7.3%). We continue to expect NIM to be slightly below 7% for the full year reflecting loan book mix impacts |
|
• |
Adjusted operating expenses remained broadly flat at £221.9 million (H1 2025: £221.0 million), with cost discipline offsetting inflationary impacts and continued investment in technology and capabilities across the business |
|
• |
Adjusted impairment losses on financial assets reduced to £39.5 million (H1 2025: £47.1 million), with a bad debt ratio of 0.8% (H1 2025: 1.0%) reflecting the implementation of an updated IFRS 9 model for the Motor Finance book, partially offset by an increase in individually assessed provisions in Property. We expect the bad debt ratio to remain below the long-term average of 1.2% for the full year |
|
• |
On a statutory basis, the group reported a loss before tax of £65.5 million (H1 2025: operating loss before tax £102.2 million), primarily reflecting the additional £135.0 million motor finance provision taken in October 2025 |
|
• |
The loan book reduced 2% to £9.2 billion (31 July 2025: £ 9.5 billion). On an underlying basis, the loan book decreased 1%, excluding planned exit of Premium Finance personal lines and run-off of the legacy Republic of Ireland Motor Finance business |
|
• |
The CET1 capital ratio increased to 14.3% (31 July 2025: 13.8%), reflecting the completion of the sale of Winterflood and lower RWAs, partly offset by the £135.0 million increase in the motor finance commissions provision |
|
• |
Following the half year results, we are presenting a business update, where we will provide further information on the business, strategy and market opportunity for each of our three lending divisions |
New guidance
We have accelerated our cost savings targets, reflecting strong progress in our transformation activities. The other components of outlook and guidance remain unchanged, as we continue to progress towards double-digit RoTE by the 2028 financial year, rising thereafter:
|
• |
Adjusted operating loss from Group (central functions): We now expect c.£45-50 million in the 2026 financial year (previous guidance: c.£50 million) |
|
• |
Costs: We now expect to deliver c.£25 million (previously c.£20 million) of annualised savings in the 2026 financial year, and a total of c.£60 million annualised savings by the end of the 2027 financial year (previously 2028) |
|
• |
Costs: We now expect the group's adjusted operating expenses to be c.£450 million in the 2026 financial year (previously in the £440-460 million range) |
|
• |
Adjusting items: We now expect to incur c.£10-15 million (previously c.£5-10 million) of restructuring costs in the 2026 financial year and c.£30-40 million in the 2027 financial year, reflecting the acceleration of our cost reduction activities |
|
• |
Headcount: We expect the delivery of our transformation activities to result in a reduction in headcount of c.600 FTE by the end of the 2027 financial year |
Existing guidance
|
• |
Loan book across divisions: We have repositioned the business to focus on segments where we see a strong and sustainable market opportunity, targeting 5-10% p.a. growth through the cycle |
|
• |
Net interest margin: In the 2026 financial year, we expect the net interest margin to be slightly lower than 7%, reflecting loan book mix impacts and staying around this level on a medium term basis |
|
• |
Bad debt ratio: We expect the bad debt ratio for the 2026 financial year, and in the medium term, to remain below our long-term average of 1.2% |
|
• |
Costs: We expect the group's adjusted operating expenses to be in the £410-430 million range in the 2028 financial year, taking the group's expense/income ratio below 60% |
|
• |
Adjusting items: We expect complaints handling expenses and other operational and legal costs in relation to motor finance commissions to be in the single-digit millions in the 2026 financial year |
|
• |
Dividends: As previously outlined, the reinstatement of dividends will be reviewed once there is further clarity on the financial impact of the FCA review of motor finance commission arrangements |
|
• |
Capital: In the near-term, we expect to maintain our CET1 capital ratio above our medium-term target range of 12% to 13%, based on our current assessment of the provision in respect of motor finance commissions |
|
• |
RoTE: Together, the actions above set a clear path back to double-digit RoTE by the 2028 financial year, rising thereafter |
Presentation
A virtual presentation to analysts and investors will be held today at 9.30am GMT followed by a Q&A session and a business update where we will provide further information on the business, strategy and market opportunity for each of our three lending divisions, as well as additional detail on our current cost initiatives.
A webcast will be available by registering at:
https://webcasts.closebrothers.com/results/HalfYearResults2026
Enquiries
|
Maritz Carvalho |
Close Brothers Group plc |
020 3857 6063 |
|
Sam Cartwright |
H/Advisors Maitland |
07827 254 561 |
About Close Brothers
Close Brothers is a UK specialist banking group providing lending and deposit taking. We employ approximately 2,600 people, principally in the United Kingdom and Ireland. Close Brothers Group plc is listed on the London Stock Exchange.
Basis of presentation
Results are presented both on a statutory and an adjusted basis to aid comparability between periods. Adjusted measures are presented on a basis consistent with prior periods and exclude any exceptional and adjusting items which do not reflect underlying trading performance. Current adjusting items include customer remediation provisions, operational or legal costs incurred in relation to an event that is deemed to be adjusting, Close Brewery Rentals Limited ("CBRL") which was sold in the period, Close Brothers Vehicle Hire ("CBVH") which is in wind-down, restructuring costs and amortisation of intangible assets on acquisition. There are no exceptional items presented in these financial results.
Discontinued operations relate to Close Brothers Asset Management ("CBAM") and Winterflood Securities ("Winterflood"), which were classified as discontinued operations in the group's income statement in the 2024 and 2025 full year results respectively. The group's income statement for the 2025 half year has been restated to classify Winterflood as a discontinued operation. Winterflood's assets and liabilities were classified as held for sale on the group balance sheet at 31 July 2025. The sale of CBAM completed on 28 February 2025, and the sale of Winterflood completed on 1 December 2025; therefore no assets or liabilities in respect of these businesses remain on the balance sheet at 31 January 2026. The sale of CBRL completed on 31 August 2025. The assets and liabilities of this business were classified as held for sale on the group balance sheet at 31 July 2025. No assets or liabilities in respect of this business remain on the balance sheet at 31 January 2026.
Chief Executive's Statement
It has now been a year since I took on the role as Group Chief Executive. While this year has not been easy, I look back on it with immense pride in the progress made by the organisation. We have delivered our capital actions and substantially strengthened our capital position. Through the Supreme Court, we successfully overturned the Court of Appeal's judgment in respect of the Hopcraft case. We have addressed legacy issues, simplified the group and repositioned the business for growth. We delivered an initial £25 million of annualised cost savings in 2025, launched our transformation programme and are now accelerating our cost targets for the next two years.
Although 2026 performance has been impacted by both market conditions and the actions we have taken to reposition the business, those actions have strengthened the business and laid the foundations for a recovery in growth and returns going forward.
Close Brothers has been part of the backbone of the UK business community for nearly 150 years. Last year alone we lent £7 billion into the economy, continuing to make a real difference to the businesses and consumers we serve. Our business rests on strong foundations, with an excellent customer reputation and clear differentiation.
At the same time I have been clear that despite these strong foundations, our returns are not where they need to be. A combination of external factors, internal challenges and a rising cost base have intensified the need for fundamental change.
A year ago, I set out a clear set of strategic priorities: simplify, optimise, and grow.
The simplify leg of our strategy is largely complete. By selling Close Brothers Asset Management, Winterflood and Brewery Rentals, exiting Vehicle Hire and concentrating on our higher value commercial brokers in Premium, we have simplified the group and refocused on our core markets where we can deliver strong returns and grow.
Today we are a simpler group, focused exclusively on specialist lending through our three divisions: Commercial, Retail, and Property. Our performance in the first half continues to demonstrate the resilience and strong foundations of these core businesses.
We are now firmly into the optimise stage. In the summer we launched our transformation programme, focused on significant cost reduction and streamlining of our historically federated organisational model. We now expect to deliver c.£25 million (previously c.£20 million) of annualised cost savings in the 2026 financial year, and a total of c.£60 million of annualised savings by the end of 2027 (previously 2028), in addition to the £25 million annualised savings delivered in 2025, setting us firmly on the path to double-digit returns by 2028, and rising thereafter.
These savings will be delivered through a combination of centralisation and rationalisation of shared services, increased use of outsourcing and offshoring, and further reductions in our third party spend and property footprint.
In parallel, we are progressing the deployment of automation and artificial intelligence at pace, providing further opportunity both to reduce costs and enhance customer experience.
I look forward to providing further details on these cost initiatives in our business update to the market, which we are hosting this morning.
These changes will result in a reduction of c.600 FTE by the end of 2027. While the impact on affected colleagues is regrettable, these actions are necessary to structurally lower our cost base, while increasing our agility and ability to serve our customers with the speed, flexibility and reliability that they have come to expect.
These actions represent an important step in the evolution of our operating model to support future scalability, improving our ability to deliver operating leverage and achieve further savings in years to come.
We are equally committed to building on our long track record of growth through the cycle. In the first half we were pleased to see expansion in both Asset Finance and Motor Finance, with a strong contribution from our Irish businesses. While the repositioning of our business and current market conditions have impacted overall growth in the period, I am confident we are in the right markets, with the right proposition, and that our businesses have capacity for meaningful growth through a combination of core business expansion and new initiatives.
In today's presentation you will hear directly from each of our three divisional CEOs about the opportunities in each of their areas, underpinning our confidence that we can continue to grow at a rate of 5-10% p.a. through the cycle.
We have also further strengthened our CET1 capital ratio to 14.3% at 31 January 2026 after taking a total motor finance provision of £300 million, and we continue to make progress towards Phase 3 of the Internal Ratings Based ("IRB") application process. While we continue to await details of the FCA's proposed redress scheme, we are confident that this leaves us well placed to absorb a range of potential outcomes without impacting our prospects for growth and investment. As clarity emerges, we will continue to optimise funding, capital and liquidity, to further enhance our long-term returns trajectory.
I am confident that the resilience of our core businesses, our strong market positions and determination to address the cost base, leave us well placed for sustainable growth, resumption of capital returns for shareholders, and the delivery of higher levels of returns.
We recognise the uncertainty in the macroeconomic outlook, both in the UK, reflecting interest rate and inflation dynamics, and globally amid heightened geopolitical tensions. We continue to monitor developments closely, maintaining a disciplined focus on execution, risk management and supporting our people. The group remains well positioned, underpinned by a resilient balance sheet and clear strategic priorities.
Mike Morgan
Chief Executive
Historical motor finance commission arrangements
Overview of Developments in relation to Motor Finance Commissions
On 1 August 2025, the Supreme Court gave its judgment, in which Close Brothers Limited ("CBL") successfully overturned the Court of Appeal's judgment in respect of the "Hopcraft" case. The Supreme Court determined that motor dealers (acting as a credit broker) do not owe fiduciary duties to their customers. As a result, the Supreme Court dismissed the Hopcrafts' claims against CBL entirely. The Supreme Court reached the same conclusion on these issues in relation to the "Wrench" and "Johnson" cases against FirstRand Bank Limited.
Following the publication of the Financial Conduct Authority ("FCA")'s consultation paper on 7 October 2025 on a proposed industry-wide redress scheme in respect of motor finance commissions, we updated our range of probability-weighted scenarios. This resulted in an increase of £135 million in our provision, which has been recognised in the first quarter, to a total provision of c.£300 million as at 31 October 2025, which includes both redress and certain operational costs. This represents the group's current best estimate based on all available information at this stage. The ultimate cost to the group could be materially higher or lower than the provision taken and remains subject to further clarity from the FCA on the scope and design of any redress scheme and any further legal, regulatory or industry developments. This position remains unchanged as at 31 January 2026.
The group is committed to achieving a fair outcome for customers and providing redress where loss has occurred. However, it does not believe the current redress methodology proposed by the FCA appropriately reflects actual customer loss or achieves a proportionate outcome. In addition, the FCA's proposed approach to assessing unfairness does not align with the legal clarity provided by the Supreme Court judgment in respect of the "Johnson" case, which confirmed that the test for unfairness is highly fact specific and must take into account a broad range of factors.
The group responded to the FCA consultation paper prior to the deadline of 12 December 2025 and awaits the final redress scheme rules, which the FCA has stated it expects to publish in late March 2026.
Financial overview
Summary group income statement1
|
First half 2026 £ million |
First half 2025 £ million |
Change % |
|
|
Adjusted operating income |
326.6 |
348.6 |
(6) |
|
Adjusted operating expenses |
(221.9) |
(221.0) |
- |
|
Adjusted impairment losses on financial assets |
(39.5) |
(47.1) |
(16) |
|
Adjusted operating profit |
65.2 |
80.5 |
(19) |
|
Commercial |
40.7 |
50.0 |
(19) |
|
Retail |
17.5 |
16.8 |
4 |
|
Property |
29.8 |
42.1 |
(29) |
|
Group (central functions) |
(22.8) |
(28.4) |
(20) |
|
Adjusting items: |
|||
|
Provision in relation to motor finance commissions |
(135.0) |
(165.0) |
(18) |
|
Complaints handling and other operational and legal costs incurred in relation to motor finance commissions2 |
0.9 |
(8.4) |
(111) |
|
Provision in relation to early settlements in Motor Finance |
(0.6) |
- |
n/a |
|
Restructuring costs |
(1.6) |
(0.4) |
300 |
|
Amortisation of intangible assets on acquisition |
(0.1) |
(0.1) |
- |
|
Operating profit/(loss) from Close Brewery Rentals Limited3 |
6.8 |
(2.6) |
(362) |
|
Operating loss from Close Brothers Vehicle Hire4 |
(1.1) |
(6.2) |
(82) |
|
Operating loss before tax |
(65.5) |
(102.2) |
(36) |
|
Tax |
0.3 |
(9.2) |
(103) |
|
Loss after tax from continuing operations |
(65.2) |
(111.4) |
(41) |
|
Discontinued operations5: |
|||
|
Close Brothers Asset Management |
0.1 |
0.3 |
(67) |
|
Winterflood |
0.7 |
(0.7) |
(200) |
|
Loss after tax (continuing and discontinued operations) |
(64.4) |
(111.8) |
(42) |
|
Attributable to |
|||
|
Shareholders |
(75.5) |
(122.9) |
(39) |
|
Other equity owners |
11.1 |
11.1 |
- |
|
Loss after tax attributable to shareholders and other equity owners |
(64.4) |
(111.8) |
(42) |
|
Adjusted basic earnings per share (continuing operations)1,6 |
27.1p |
33.8p |
|
|
Basic (loss)/earnings per share (continuing operations)6 |
(51.0)p |
(81.8)p |
|
|
Basic (loss)/earnings per share (continuing and discontinued operations)5,6 |
(50.5)p |
(82.1)p |
|
|
Ordinary dividend per share |
- |
- |
|
|
Return on opening equity7 |
5.6% |
7.1% |
|
|
Return on average tangible equity7 |
6.3% |
8.7% |
|
1. |
Income Statement presented includes continuing and discontinued operations. Adjusted measures are presented on a basis consistent with prior periods and exclude any exceptional and adjusting items which do not reflect underlying trading performance. Current adjusting items include: customer remediation provisions, operational or legal costs incurred in relation to an event that is deemed to be adjusting, CBRL which was sold in the period, CBVH which is in wind-down, restructuring costs and amortisation of intangible assets on acquisition. There are no exceptional items presented in these financial results. Please refer to the Basis of Presentation on page 4 for further information, and the tables on page 8 for details on the reconciliation between operating and adjusted measures. |
|
2. |
At 31 January 2026, £0.9m credit comprises insurance recoveries largely offset by certain legal costs and unwind of the time value discount in relation to the motor finance commissions provision. |
|
3. |
The sale of CBRL completed on 31 August 2025 and a gain of £6.4 million has been recognised. Please refer to Note 20 "Discontinued operations and assets and liabilities classified as held for sale". |
|
4. |
CBVH business is being exited. |
|
5. |
Discontinued operations relate to Close Brothers Asset Management and Winterflood, which have been classified as "discontinued operations" in the group's income statement for the 2025 and 2026 financial years in line with the requirements of IFRS 5. The related assets and liabilities are classified as held for sale on the group's balance sheet as at 31 July 2025. Please refer to Note 20 "Discontinued operations and assets and liabilities classified as held for sale". |
|
6. |
Refer to Note 4 "Earnings per Share" for the calculation of basic and adjusted earnings per share. |
|
7. |
Return on average tangible equity uses annualised adjusted operating profit after tax from continuing operations, less AT1 coupons (H1 2026: £81.0 million). Average tangible equity excludes discontinued operations. Average tangible equity is calculated based on the average of closing equity per the balance sheet (H1 2026: £1,662.8 million, FY 2025: £1,735.5 million), less AT1 (H1 2026 and FY 2025: £197.6 million), less intangibles (H1 2026: £163.0 million, FY 2025: £166.3 million), less CBAM and Winterflood equity (H1 2026: £nil, FY 2025: £90.6 million). |
Reconciliation from adjusted to statutory income statement
|
Adjusting items reconciling adjusted to statutory performance |
||||||||||
|
Summary income statement for the six months ended 31 January 2026 |
Adjusted £ million |
Provision in relation to motor finance commissions £ million |
Complaints handling and other operational and legal costs related to motor finance commissions £ million |
Provision in relation to early settlements in Motor Finance £ million |
Restructuring costs £ million |
Amortisation of intangible assets on acquisition £ million |
Close Brewery Rentals Limited (sold) £ million |
Close Brothers Vehicle Hire (in wind-down) £ million |
Total adjusting items £ million |
Statutory £ million |
|
Operating income |
326.6 |
- |
(4.4) |
(0.6) |
- |
- |
7.2 |
5.0 |
7.2 |
333.8 |
|
Operating expenses |
(221.9) |
(135.0) |
5.3 |
- |
(1.6) |
(0.1) |
(0.4) |
(6.1) |
(137.9) |
(359.8) |
|
Impairment losses on financial assets |
(39.5) |
- |
- |
- |
- |
- |
- |
- |
- |
(39.5) |
|
Operating profit/(loss) before tax |
65.2 |
(135.0) |
0.9 |
(0.6) |
(1.6) |
(0.1) |
6.8 |
(1.1) |
(130.7) |
(65.5) |
|
Adjusting items reconciling adjusted to statutory performance |
||||||||||
|
Summary income statement for the six months ended 31 January 2025 |
Adjusted £ million |
Provision in relation to motor finance commissions £ million |
Complaints handling and other operational and legal costs related to motor finance commissions £ million |
Provision in relation to early settlements in Motor Finance £ million |
Restructuring costs £ million |
Amortisation of intangible assets on acquisition £ million |
Close Brewery Rentals Limited (sold) £ million |
Close Brothers Vehicle Hire (in wind-down) £ million |
Total adjusting items £ million |
Statutory £ million |
|
Operating income |
348.6 |
- |
- |
- |
- |
- |
3.6 |
3.2 |
6.8 |
355.4 |
|
Operating expenses |
(221.0) |
(165.0) |
(8.4) |
- |
(0.4) |
(0.1) |
(5.7) |
(8.9) |
(188.5) |
(409.5) |
|
Impairment losses on financial assets |
(47.1) |
- |
- |
- |
- |
- |
(0.5) |
(0.5) |
(1.0) |
(48.1) |
|
Operating profit/(loss) before tax |
80.5 |
(165.0) |
(8.4) |
- |
(0.4) |
(0.1) |
(2.6) |
(6.2) |
(182.7) |
(102.2) |
Statutory operating profit
The group reported a statutory operating loss before tax of £65.5 million (H1 2025: £102.2 million). Underlying operating profit was more than offset by £130.7 million of adjusting items, predominantly the £135.0 million increase in provision charge in relation to motor finance commissions following publication of the FCA consultation paper.
Adjusted operating profit
Adjusted operating profit decreased 19% to £65.2 million (H1 2025: £80.5 million), driven by reduced operating income, partly offset by lower impairment charges in Retail. The operating loss in Group (central functions), which includes the central functions such as finance, legal and compliance, risk and human resources, reduced to £22.8 million (H1 2025: £28.4 million). We now expect the operating loss from Group (central functions), to be c.£45-50 million in the 2026 financial year (previous guidance: c.£50 million).
Return on opening equity reduced to 5.6% (H1 2025: 7.1%) and return on average tangible equity reduced to 6.3% (H1 2025: 8.7%) primarily reflecting the reduction in adjusted operating profit. We seek to achieve double-digit RoTE by the 2028 financial year, rising thereafter.
Adjusted operating income
Adjusted operating income decreased 6% to £326.6 million (H1 2025: £348.6 million), driven by a lower average loan book, reflecting the impact of current market conditions, in particular on our Property book; and the repositioning of our businesses including the wind-down of Novitas and the planned reduction of personal lines in Premium Finance.
NIM across the lending divisions remained robust at 7.1% (H1 2025: 7.3%), with the reduction reflecting changes in business mix, including the wind-down of Novitas, as well as lower behavioural fee income. We continue to expect NIM to be slightly lower than 7% for the 2026 financial year, reflecting loan book mix impacts.
Group (central functions) income was £(4.6) million (H1 2025: £(7.3) million), reflecting interest earned on higher cash balances.
Adjusted operating expenses
Adjusted operating expenses were broadly flat at £221.9 million (H1 2025: £221.0 million), reflecting strong cost discipline offsetting inflationary impacts and continued investment in technology and capabilities across the business.
Expenses in Group (central functions) reduced 14% reflecting lower legal and professional fees associated with the impact of the FCA's ongoing review.
Overall, the group's expense/income ratio increased to 68% (H1 2025: 63%), and the compensation ratio increased to 35% (H1 2025: 34%), both reflecting the lower income in the period.
We now expect to deliver c.£25 million (previously c.£20 million) of annualised savings in the 2026 financial year, and a total of c.£60 million annualised savings by the end of the 2027 financial year (previously 2028), in addition to the £25 million annualised savings delivered in the 2025 financial year.
We expect the group's adjusted operating expenses to be c.£450 million in the 2026 financial year, and in the £410-430 million range in the 2028 financial year.
Impairment charges and IFRS 9 provisioning
Impairment charges decreased to £39.5 million (H1 2025: £47.1 million), equivalent to a bad debt ratio of 0.8% (H1 2025: 1.0%). The reduced impairment charge reflects the implementation of an updated IFRS 9 model which recognises the evolving composition and behaviour of the Motor Finance book1. This was partially offset by an increase in individually assessed provisions in Property. The bad debt ratio remains comfortably below our long-term average of 1.2%. Overall, provision coverage was flat at 2.6% (31 July 2025: 2.6%).
Since the 2025 financial year end, we have updated the macroeconomic scenarios we source from Moody's Analytics to reflect the latest available information. The weightings assigned to the scenarios remain unchanged.
Whilst we have not seen a significant impact on credit performance, we continue to monitor closely the evolving impacts of inflation and cost of living on our customers. We remain confident in the quality of our loan book, which is predominantly secured or structurally protected, prudently underwritten, diverse, and supported by the deep expertise of our people. Looking forward, we expect the bad debt ratio for the 2026 financial year to remain below our long-term average of 1.2%.
|
1. |
For further information please refer to Note 1 "Basis of preparation and accounting policies". |
Adjusting items
We recognised £130.7 million of adjusting items in first half of 2026 (H1 2025: £182.7 million), including the £135.0 million update to our provision charge relating to motor finance commissions, with H1 2025 including the initial £165.0 million provision charge. We also recognised £5.7 million of operating profit from the group's rentals businesses, CBRL (now sold), and CBVH (in wind-down), primarily reflecting the gain on disposal of CBRL.
We also incurred £1.6 million (H1 2025: £0.4 million) of restructuring costs, primarily relating to redundancy and associated costs. We now expect to incur c.£10-15 million of restructuring costs in the 2026 financial year and c.£30-40 million in the 2027 financial year, reflecting the acceleration of our cost reduction activities.
We expect complaints handling expenses and other operational and legal costs in relation to motor finance commissions to be in the single-digit millions in the 2026 financial year, including unwinding of the time value discount in relation to the motor finance commissions provision.
Tax
The tax credit in H1 2026 was £0.3 million (H1 2025: tax expense of £9.2 million), driven by an increase in tax deductible remediation provisions, giving rise to a tax credit more than offsetting other tax expense incurred in the period. The effective tax rate for the period was 0.5% (H1 2025: (9.0%)), including the £135.0 million provision charge (£120.8 million net of tax) in relation to motor finance commissions. Excluding the provision, the effective tax rate would have been approximately 20%.
The effective tax rate, excluding the provision in relation to motor finance commissions, was below the 25% UK corporation tax rate for the six months ended 31 January 2026 primarily due to tax relief on coupons on other equity instruments and the gain on sale of CBRL being tax exempt. The effective tax rate for the six months ended 31 January 2025, excluding the provision in relation to motor finance commissions, was also below the 25% UK corporation tax rate at approximately 23%, primarily due to tax relief on coupons on other equity instruments. Please refer to Note 3 "Taxation" for further details on the group's taxation.
Discontinued operations
|
• |
On 28 February 2025, we completed the sale of CBAM to funds managed by Oaktree Capital Management, L.P. |
|
• |
On 1 December 2025, we completed the sale of Winterflood Securities to Marex Group plc. |
Performance of these businesses has been presented as discontinued operations. Following completion of the disposal of Winterflood, there are no assets or liabilities classified as held for sale on the balance sheet at 31 January 2026, and minimal impact through the income statement.
Winterflood delivered total profit after tax of £0.7 million (H1 2025: loss after tax of £0.7 million).
For further information on the discontinued operations, refer to Note 20 "Discontinued operations and assets and liabilities classified as held for sale".
Earnings per share
Adjusted basic earnings per share ("AEPS") for continuing operations decreased to 27.1p (H1 2025: 33.8p) and basic earnings per share ("EPS") for continuing operations increased to (51.0)p (H1 2025: (81.8)p).
Basic earnings per share ("EPS") for continuing and discontinued operations increased to (50.5)p (H1 2025: (82.1)p).
Both the adjusted and basic EPS calculations include the payment of the coupon related to the Fixed Rate Resetting Additional Tier 1 Perpetual Subordinated Contingent Convertible Securities ("AT1"), at an annual rate of 11.125%, in December 2025, amounting to £11.1 million. The associated coupon is due semi-annually, with any AT1 coupons paid deducted from retained earnings, reducing the profit attributable to ordinary shareholders.
Dividend
Given the continued uncertainty regarding the outcome of the FCA's review of motor finance commission arrangements and any potential financial impact, the group will not pay an interim dividend on its ordinary shares in respect of the first half of the 2026 financial year. As previously stated, the decision to reinstate dividends will be reviewed by the Board once there is further clarity on the financial impact of the FCA review of motor finance commission arrangements.
Summary group balance sheet
|
31 January |
31 July |
|
|
Loans and advances to customers and operating lease assets1 |
9,399.6 |
9,625.7 |
|
Treasury assets2 |
2,215.7 |
2,770.4 |
|
Assets classified as held for sale3 |
- |
934.0 |
|
Other assets |
668.3 |
741.8 |
|
Total assets |
12,283.6 |
14,071.9 |
|
Deposits by customers |
7,874.0 |
8,799.3 |
|
Borrowings4 |
2,144.2 |
2,188.3 |
|
Liabilities classified as held for sale3 |
- |
773.4 |
|
Other liabilities |
602.6 |
575.4 |
|
Total liabilities |
10,620.8 |
12,336.4 |
|
Equity5 |
1,662.8 |
1,735.5 |
|
Total liabilities and equity |
12,283.6 |
14,071.9 |
|
1. |
Includes operating lease assets of £158.3 million (31 July 2025: £166.3 million). |
|
2. |
Treasury assets comprise cash and balances at central banks and debt securities held to support the group. |
|
3. |
Assets and liabilities relating to CBRL and discontinued operation Winterflood have been classified as held for sale on the group's balance sheet at 31 July 2025. Please refer to Note 20 "Discontinued operations and assets and liabilities classified as held for sale". |
|
4. |
Borrowings comprise debt securities in issue, loans and overdrafts from banks and subordinated loan capital. |
|
5. |
Equity includes the group's £200.0 million Fixed Rate Reset Perpetual Subordinated Contingent Convertible Securities (AT1 securities), net of £2.4 million transaction costs, which are classified as an equity instrument under IAS 32. |
The group maintained a strong balance sheet and continues to take a prudent approach to managing its financial resources. The fundamental structure of the balance sheet remains unchanged, with most of the assets and liabilities relating to our lending divisions. Loans and advances to customers and operating lease assets make up the majority of assets. Other items on the group's balance sheet include treasury assets, with intangibles, property, plant and equipment, and prepayments included as other assets. Liabilities are predominantly made up of customer deposits and both secured and unsecured borrowings to fund the loan book.
Total assets reduced to £12.3 billion (31 July 2025: £14.1 billion), primarily due to the completion of the sales of Winterflood and CBRL which no longer feature on the group balance sheet, and a 20% reduction in treasury assets reflecting a planned reduction in excess liquidity.
Total liabilities reduced to £10.6 billion (31 July 2025: £12.3 billion), due to 11% lower customer deposits reflecting our lower funding requirement in the first half of the 2026 financial year, and the completion of the sales of Winterflood and CBRL which no longer feature on the group balance sheet.
Total equity was broadly flat at £1.7 billion as at 31 January 2026 (31 July 2025: £1.7 billion).
The group's return on assets excluding discontinued operations reduced to 0.6% (31 July 2025: 0.8%).
Group Capital
|
31 January 2026 £ million |
31 July 2025 £ million |
|
|
Common Equity Tier 1 capital |
1,266.3 |
1,348.1 |
|
Tier 1 capital |
1,466.3 |
1,548.1 |
|
Total capital |
1,666.3 |
1,748.1 |
|
Risk weighted assets |
8,882.5 |
9,798.5 |
|
Common Equity Tier 1 capital ratio1 |
14.3% |
13.8% |
|
Tier 1 capital ratio1 |
16.5% |
15.8% |
|
Total capital ratio1 |
18.8% |
17.8% |
|
Leverage ratio2 |
13.5% |
12.9% |
|
1. |
Capital ratios at 31 July 2025 shown after applying IFRS 9 transitional arrangements and the CRR transitional and qualifying own funds arrangements in force at the time. Without their application, at 31 July 2025 the CET1 capital ratio would be 13.7%, tier 1 capital ratio 15.7% and total capital ratio 17.8%. |
|
2. |
The leverage ratio is calculated as tier 1 capital as a percentage of total balance sheet assets excluding central bank claims, adjusting for certain capital deductions, including intangible assets, and off-balance sheet exposures, in line with the UK leverage framework under the UK Capital Requirements Regulation. |
Movements in capital and other regulatory metrics
The Common Equity Tier 1 ("CET1") capital ratio increased from 13.8% to 14.3%, as the additional £135.0 million provision in relation to motor finance commissions (c.-125bps net of tax) was more than offset by a reduction in loan book Risk Weighted Assets ("RWAs") (c.70bps), the recognition of other profits attributable to shareholders (c.60bps), and the sale of Winterflood (c.55bps).
CET1 capital decreased 6% to £1,266.3 million (31 July 2025: £1,348.1 million), primarily driven by the motor finance commissions provision increase (£120.8 million net of tax), partly offset by other profits attributable to shareholders in the period of £56.4 million. Tier 1 capital and total capital both decreased 5% to £1,466.3 million and £1,666.3 million respectively (31 July 2025: £1,548.1 million and £1,748.1 million respectively), reflecting the same movements underpinning CET1 capital.
RWAs decreased 9% to £8.9 billion (31 July 2025: £9.8 billion). This was primarily driven by a £639.5 million reduction in credit risk RWAs reflecting lower loan book balances, the benefit of the ENABLE Build Guarantee Scheme in Property, and the disposals of Winterflood and CBRL. Operational risk RWAs also reduced £159.8 million and market risk RWAs reduced £114.0 million, both primarily reflecting the disposal of Winterflood.
As a result, CET1, tier 1 and total capital ratios were 14.3% (31 July 2025: 13.8%), 16.5% (31 July 2025: 15.8%) and 18.8% (31 July 2025: 17.8%), respectively.
The applicable CET1, tier 1 and total capital ratio requirements, including Capital Requirements Directive ("CRD") buffers but excluding any applicable PRA buffer, were 9.7%, 11.4% and 13.7%, respectively, at 31 January 2026. Accordingly, we continue to have headroom significantly above the applicable CET1 requirement of c.460bps.
Until 31 July 2025, the group applied IFRS 9 regulatory transitional arrangements which allowed banks to add back to their capital base a proportion of the IFRS 9 impairment charges during the transitional period. The transitional period ended on 31 July 2025.
The leverage ratio, which is a transparent measure of capital strength not affected by risk weightings, increased to 13.5% (31 July 2025: 12.9%).
We currently estimate that following the disposal of Winterflood, the implementation of Basel 3.1 from 1 January 2027 will result in an increase in the group's RWAs of less than 10%. Given the group expects to receive a full offset in Pillar 2a requirements at total capital level for the removal of the Pillar 1 RWA SME support factor, the implementation is not expected to have a significant impact on the group's overall capital headroom position.
As reported in our Full Year 2025 results, engagement with the regulator continues following our application in December 2020 to transition to the IRB approach. We continue to make progress towards Phase 3 of the application process.
After the period end, we issued £250 million of 6.125% Subordinated Tier 2 Notes due 2036, accompanied by a related tender of our outstanding £200 million 2.00% Fixed Rate Subordinated Notes due 2031.
Capital outlook
In the near-term, we expect to maintain our CET1 capital ratio above the top end of our medium-term target range of 12% to 13%, based on our current assessment of the provision in respect of motor finance commissions.
Group funding1
|
31 January 2026 £ million |
31 July 2025 £ million |
|
|
Customer deposits |
7,874.0 |
8,799.3 |
|
Secured funding |
1,036.3 |
1,077.4 |
|
Unsecured funding2 |
1,106.6 |
1,109.4 |
|
Equity |
1,662.8 |
1,735.5 |
|
Total available funding3 |
11,679.7 |
12,721.6 |
|
Total available funding as a percentage of loan book4 |
124% |
132% |
|
Average maturity of funding allocated to loan book5 |
18 months |
18 months |
|
1. |
Numbers relate to core funding and exclude working capital facilities at the business level. |
|
2. |
Unsecured funding excludes £1.3 million (31 July 2025: £1.5 million) of non-facility overdrafts included in borrowings and includes £nil (31 July 2025: £nil) of undrawn facilities. |
|
3. |
Includes £250.0 million of funds raised via a senior unsecured bond with a five-year tenor by Close Brothers Group plc, the group's holding company, in June 2023, with proceeds currently used for general corporate purposes. |
|
4. |
Total funding as a percentage of loan book includes £158.3 million (31 July 2025: £207.3 million of which £41.0 million for CBRL were classified as held for sale) of operating lease assets in the loan book figure. |
|
5. |
Simple weighted average of the applicable funding allocated to the loan book. The applicable funding excludes equity (except AT1 instruments) and deducts funding held for liquidity purposes. |
The Treasury function is focused on managing funding and liquidity to support the lending divisions, as well as managing interest rate risk. Our funding draws on a wide range of wholesale and deposit markets including several public debt securities at both group and operating company level, as well as public and private secured funding programmes and a diverse mix of customer deposits. This broad funding base reduces concentration risk and ensures we can adapt our position through the cycle.
We have maintained a prudent maturity profile, with the average maturity of funding allocated to the loan book at 18 months (31 July 2025: 18 months), ahead of the average loan book maturity at 15 months (31 July 2025: 15 months).
Total funding decreased 8% to £11.7 billion (31 July 2025: £12.7 billion), which accounted for 124% (31 July 2025: 132%) of the loan book at the balance sheet date, as we sought to optimise funding and liquidity from elevated levels held during the recent period of uncertainty. The average cost of funding1 across our lending divisions reduced to 4.9% for the six months ended 31 January 2026 (12 months ended 31 July 2025: 5.4%) primarily reflecting the lower base rate in the period.
|
1. |
The cost of funding across our lending divisions interest expense (excluding relevant allocations to CBRL and CBVH) for the first half of the 2026 financial year was £232.3 million (31 July 2025: £520.8 million). |
The ongoing investment in our Savings capability, franchise and product offering has allowed us to significantly grow and diversify our retail deposit base in recent years. As a proportion of total funding, our retail deposits have grown from 27% at the end of the 2022 financial year to account for 54% in the first half of the 2026 financial year (31 July 2025: 54%). Continued growth and diversification of our offering creates opportunity to further optimise funding cost and maturity in future years.
In the first half, customer deposits decreased 11% to £7.9 billion (31 July 2025: £8.8 billion) as we sought to optimise the pricing and level of deposit funding following strong growth in recent years. Retail customer deposits decreased 8% to £6.3 billion (31 July 2025: £6.8 billion), with non-retail deposits reducing 19% to £1.6 billion (31 July 2025: £2.0 billion), in line with our funding plan. In accordance with our prudent and conservative approach to funding, only 19% of total deposits are available on demand and 47% have at least three months to maturity. At 31 January 2026 approximately 91% of retail deposits were protected by the Financial Services Compensation Scheme.
Secured funding decreased 4% to £1.0 billion (31 July 2025: £1.1 billion) reflecting scheduled repayments under our public securitisations.
Unsecured funding, which includes senior unsecured and subordinated bonds, was unchanged at £1.1 billion (31 July 2025: £1.1 billion).
Moody's ratings for the group and CBL (Bank deposit rating) are Baa2/P2 and A3/P2 respectively (at 17 October 2025), with a negative outlook. This follows a one notch downgrade for both the group and CBL long term ratings, and the short-term deposit rating of CBL, primarily owing to the impact of the £135.0 million additional motor finance provision on our capital position. This action has concluded the review for downgrade that was initiated on 1 November 2024. Fitch Ratings ("Fitch") for both the group and CBL are BBB/F3, affirmed on 15 December 2025, with a negative outlook. Our credit ratings remain robust, and we retain strong access to funding markets.
Group liquidity
|
31 January 2026 £ million |
31 July 2025 £ million |
|
|
Cash and balances at central banks |
1,386.8 |
1,917.0 |
|
Sovereign and central bank debt |
578.2 |
601.6 |
|
Supranational, sub-sovereigns and agency ("SSA") bonds |
145.1 |
146.2 |
|
Covered bonds |
105.6 |
105.6 |
|
Treasury assets |
2,215.7 |
2,770.4 |
The group continues to adopt a conservative stance on liquidity, ensuring it is comfortably ahead of both internal risk appetite and regulatory requirements.
During the recent uncertainty regarding the outcome of the FCA's review of historical motor finance commission arrangements, we have consciously maintained an elevated level of liquidity, which has now begun to normalise. Accordingly, treasury assets reduced 20% to £2.2 billion (31 July 2025: £2.8 billion) in the first half. The majority of our treasury assets continue to be held on deposit with the Bank of England.
We regularly assess and stress test the group's liquidity requirements and continue to materially exceed the liquidity coverage ratio ("LCR") regulatory requirements, with a 12-month average LCR to 31 January 2026 of 1,141% (31 July 2025: 1,012%). In addition to internal measures, we monitor funding risk based on the CRR rules for the net stable funding ratio ("NSFR"). The four-quarter average NSFR to 31 January 2026 was 148.6% (31 July 2025: 145.9%).
Business Review
Commercial
|
First half 2026 £ million |
First half 2025 £ million |
Change % |
|
|
Adjusted operating income |
151.2 |
158.4 |
(5) |
|
Adjusted operating expenses |
(94.0) |
(93.3) |
1 |
|
Adjusted impairment losses on financial assets |
(16.5) |
(15.1) |
9 |
|
Adjusted operating profit |
40.7 |
50.0 |
(19) |
|
Adjusted operating profit, pre provisions for impairment losses |
57.2 |
65.1 |
(12) |
|
Adjusting items: |
|||
|
Restructuring costs |
(0.6) |
(0.1) |
n/a |
|
Operating profit/(loss) from Close Brewery Rentals Limited1 |
6.8 |
(2.6) |
(362) |
|
Operating loss from Close Brothers Vehicle Hire |
(1.1) |
(6.2) |
(82) |
|
Statutory operating profit |
45.8 |
41.1 |
11 |
|
Net interest margin |
6.5% |
6.6% |
|
|
Expense/income ratio |
62% |
59% |
|
|
Bad debt ratio |
0.7% |
0.6% |
|
|
Closing loan book and operating lease assets2 |
4,627.3 |
4,765.3 |
(3) |
|
1. |
The sale of CBRL completed on 31 August 2025 and a gain of £6.4 million has been recognised. Please refer to Note 20 "Discontinued operations and assets and liabilities classified as held for sale". |
|
2. |
Operating lease assets of £1.3 million (31 January 2025: £1.8 million). |
Commercial lends to more than 28,000 small and medium-sized enterprises through our in-house teams, where loans are originated via our direct sales force or introduced by third-party distribution channels. Asset Finance provides commercial asset financing, hire purchase and leasing solutions for a diverse range of assets and sectors. Invoice Finance provides debt factoring, invoice discounting and asset based lending to SMEs and corporates.
Adjusted operating profit for Commercial decreased to £40.7 million (H1 2025: £50.0 million), primarily reflecting lower utilisation in Invoice Finance, the impact of the wind-down of Novitas, and lower behavioural income in Asset Finance.
On a statutory basis, operating profit increased to £45.8 million (H1 2025: £41.1 million), benefitting from the gain on sale of CBRL.
Adjusted operating income decreased to £151.2 million (H1 2025: £158.4 million) reflecting reductions in loan balances in Invoice Finance and through the wind-down of the Novitas book, and lower behavioural income in Asset Finance. NIM remained broadly stable at 6.5% (H1 2025: 6.6%).
Adjusted operating expenses were broadly flat at £94.0 million (H1 2025: £93.3 million), as continued investment in technology and annual staff cost increases were partially offset by the benefits of cost actions in Asset Finance, and non-recurrence of Novitas expenses. The Commercial expense/income ratio increased to 62% (H1 2025: 59%).
Adjusted impairment charges increased to £16.5 million (H1 2025: £15.1 million) driven by the non-recurrence of a prior year reduction in Stage 3 loans in Invoice Finance, partially offset by lower impairment charges following the wind-down of Novitas, with a stable credit performance in Asset Finance. This corresponded to a bad debt ratio of 0.7% (H1 2025: 0.6%) and a broadly stable provision coverage ratio of 1.6% (31 July 2025: 1.5%).
Retail
|
First half 2026 £ million |
First half 2025 £ million |
Change % |
|
|
Operating income |
118.4 |
128.8 |
(8) |
|
Adjusted operating expenses |
(92.7) |
(88.8) |
4 |
|
Impairment losses on financial assets |
(8.2) |
(23.2) |
(65) |
|
Adjusted operating profit |
17.5 |
16.8 |
4 |
|
Adjusted operating profit, pre provisions for impairment losses |
25.7 |
40.0 |
(36) |
|
Adjusting items: |
|||
|
Provision in relation to motor finance commissions |
(135.0) |
(165.0) |
(18) |
|
Complaints handling and other operational and legal costs incurred in relation to motor finance commissions1 |
0.9 |
(8.4) |
(111) |
|
Provision in relation to early settlements in Motor Finance |
(0.6) |
- |
n/a |
|
Restructuring costs |
(0.8) |
(0.2) |
300 |
|
Amortisation of intangible assets on acquisition |
(0.1) |
(0.1) |
- |
|
Statutory operating loss |
(118.1) |
(156.9) |
(25) |
|
Net interest margin |
8.3% |
8.7% |
|
|
Expense/income ratio |
78% |
69% |
|
|
Bad debt ratio |
0.6% |
1.6% |
|
|
Closing loan book2 |
2,852.5 |
2,871.7 |
(1) |
|
1. |
At 31 January 2026, £0.9m credit comprises insurance recoveries largely offset by certain legal costs and unwind of the time value discount in relation to the motor finance commissions provision. |
|
2. |
The Motor Finance loan book includes £16.0 million (31 January 2025: £58.0 million) relating to the legacy Republic of Ireland Motor Finance business, which is in run-off following the cessation of our previous partnership in the Republic of Ireland from 30 June 2022. |
Retail provides finance to individuals and businesses through a network of intermediaries. Motor Finance provides several products at point of sale in a dealership, or online via a broker, which allow consumers to buy vehicles from over 3,400 retailers in the UK and 450 retailers in Ireland. Premium Finance works with c.1,200 insurance brokers in the UK and Ireland and helps make insurance payments more manageable for individuals and businesses, by allowing them to spread the cost over fixed instalments. The division includes our Savings business, which provides simple and straightforward savings products to businesses and individuals. In 2025, we announced a strategic repositioning to focus the growth of our Premium Finance business towards commercial lines insurance premium finance where we see strongest risk-adjusted returns and long-term growth potential, and to reduce our emphasis on personal lines insurance premium finance.
We welcome the recently published FCA Premium Finance Market Study and its conclusions, which align with our existing approach.
Adjusted operating profit for Retail increased to £17.5 million (H1 2025: £16.8 million). The division experienced lower income with a reduced Premium Finance loan book partly reflecting the planned reduction in the personal lines book, as well as higher costs associated with the build out of Motor in Ireland. This was more than offset by a Motor Finance impairment provision release and improved credit performance in Premium Finance. Before provisions for impairment losses, adjusted operating profit decreased 36% to £25.7 million (H1 2025: £40.0 million).
The provision charge in respect of motor commissions stands at £300 million, having been reassessed following the FCA consultation in October 2025. The ultimate cost to the group could be materially higher or lower than the provision taken and remains subject to further clarity from the FCA on the scope and design of any redress scheme and any further legal, regulatory or industry developments. Please refer to Note 13 "Other Liabilities" for further details on the group's provisioning assessment of this matter.
On a statutory basis, Retail delivered an operating loss of £118.1 million (H1 2025: £156.9 million operating loss) reflecting the additional provision in respect of motor finance commissions.
Operating income decreased 8% to £118.4 million (H1 2025: £128.8 million), driven by the reduction in personal lines brokers in Premium Finance, partially offset by growth in business volumes in Motor Finance, particularly in Ireland. NIM decreased to 8.3% (H1 2025: 8.7%) reflecting normalisation of the Premium Finance net interest margin, the change in business mix with Motor Finance becoming a bigger proportion of the Retail loan book, and market rate fluctuations.
Adjusted operating expenses increased 4% to £92.7 million (H1 2025: £88.8 million), driven by Motor Finance with increased costs in Ireland as we scale the business, and additional investment spend across Retail to support further cost reduction. As a result, the expense/income ratio increased to 78% (H1 2025: 69%).
Impairment charges decreased to £8.2 million (H1 2025: £23.2 million), driven by the implementation of an updated IFRS 9 model which recognises the evolving composition and behaviour of the Motor Finance book1, and an improved credit performance in Premium Finance. The bad debt ratio reduced to 0.6% (H1 2025: 1.6%), with the provision coverage ratio decreasing to 2.9% (31 July 2025: 3.2%).
Property
|
First half 2026 £ million |
First half 2025 £ million |
Change % |
|
|
Operating income |
61.6 |
68.7 |
(10) |
|
Adjusted operating expenses |
(17.0) |
(17.8) |
(4) |
|
Impairment losses on financial assets |
(14.8) |
(8.8) |
68 |
|
Adjusted operating profit |
29.8 |
42.1 |
(29) |
|
Adjusted operating profit, pre provisions for impairment losses |
44.6 |
50.9 |
(12) |
|
Adjusting items |
|||
|
Restructuring costs |
(0.2) |
(0.1) |
100 |
|
Statutory operating profit |
29.6 |
42.0 |
(30) |
|
Net interest margin |
6.8% |
7.1% |
|
|
Expense/income ratio |
28% |
26% |
|
|
Bad debt ratio |
1.6% |
0.9% |
|
|
Closing loan book |
1,762.8 |
1,934.2 |
(9) |
Property provides residential development finance, bridging finance and commercial development loans to experienced property developers and investors across mainland UK and Northern Ireland, through its two brands, Close Brothers Property Finance and Commercial Acceptances. Property Finance lends to over 500 professional property developers with a focus on small to medium-sized residential developments, with Commercial Acceptances lending to c.400 developers, investors and traders.
Adjusted operating profit declined 29% to £29.8 million (H1 2025: £42.1 million), primarily due to a softer demand environment leading to lower loan balances, and increased impairment charges on a small number of developments. Before provisions for impairment losses, adjusted operating profit reduced 12% to £44.6 million (H1 2025: £50.9 million).
On a statutory basis, Property delivered an operating profit of £29.6 million (H1 2025: £42.0 million).
Operating income declined 10% to £61.6 million (H1 2025: £68.7 million), driven by a lower loan book as drawdowns were more than offset by repayments levels, alongside lower fees and interest yields reflective of the lower base rate environment with the net interest margin reducing to 6.8% (H1 2025: 7.1%).
Adjusted operating expenses decreased 4% to £17.0 million (H1 2025: £17.8 million), reflecting lower staff costs. The expense/income ratio increased to 28% (H1 2025: 26%).
|
1. |
For further information please refer to Note 1 "Basis of preparation and accounting policies". |
Impairment charges increased to £14.8 million (H1 2025: £8.8 million), corresponding to a higher bad debt ratio of 1.6% (H1 2025: 0.9%). This primarily related to increased individually assessed provisions on a small number of developments, driven by build cost inflation and a subdued sales market. As a result, the provision coverage ratio increased to 4.6% (31 July 2025: 4.2%). The Property book is predominantly secured, with conservative loan to value ratios. 72% of the loan book represents repeat business and c.40% of the book is to customers we have been lending to for over 10 years.
Group (central functions)
|
First half 2026 £ million |
First half 2025 £ million |
Change % |
|
|
Operating income |
(4.6) |
(7.3) |
(37) |
|
Operating expenses |
(18.2) |
(21.1) |
(14) |
|
Operating loss |
(22.8) |
(28.4) |
(20) |
The operating loss from Group (central functions), which includes the central functions such as finance, legal and compliance, risk and human resources, reduced to £22.8 million (H1 2025: £28.4 million). The negative income represents the net cost of group funding, which reduced in the period reflecting higher interest earned on group cash balances. The reduction in operating expenses reflects the non-recurrence of legal and professional fees associated with the impact of the FCA's ongoing review.
Loan Book Analysis
|
31 January 2026 £ million |
31 July 2025 £ million |
Change % |
|
|
Commercial |
4,627.3 |
4,729.3 |
(2) |
|
Asset Finance1 |
3,637.9 |
3,580.4 |
2 |
|
Invoice Finance |
989.4 |
1,148.9 |
(14) |
|
Retail |
2,852.5 |
2,878.9 |
(1) |
|
Motor Finance2 |
2,081.5 |
1,993.5 |
4 |
|
Premium Finance |
771.0 |
885.4 |
(13) |
|
Property |
1,762.8 |
1,852.5 |
(5) |
|
Closing loan book and operating lease assets3 |
9,242.6 |
9,460.7 |
(2) |
|
1. |
Asset Finance totals exclude £157.0 million (31 July 2025: £165.0 million) of operating lease assets related to CBVH, which is in wind-down, and £nil (31 July 2025: £41.0 million) of operating lease assets related to CBRL sold on 31 August 2025. Asset Finance includes £299.8 million (31 July 2025: £289.4 million) of loans in relation to Asset Ireland, previously reported within Invoice Finance. |
|
2. |
The Motor Finance loan book includes £16.0 million (31 July 2025: £32.1 million) relating to the Republic of Ireland Motor Finance business, which is in run-off following the cessation of our previous partnership in the Republic of Ireland from 30 June 2022. |
|
3. |
Includes operating lease assets of £1.3 million (31 July 2025: £1.3 million). |
The loan book decreased 2% over the first half of the financial year to £9.2 billion (31 July 2025: £9.5 billion). While we saw good growth in Motor Finance and in Asset Finance, the loan book reduced overall reflecting amplified seasonality and lower utilisation in Invoice Finance, continued simplification of the portfolio, including the planned reduction in the personal lines book of Premium Finance and run-off of the legacy Republic of Ireland Motor Finance business, as well as a softer current demand environment for Property.
On an underlying basis, excluding the repositioning of the portfolio, the loan book decreased 1%.
Through our recent simplification actions we have repositioned the business to focus on core markets where we see a strong and sustainable market opportunity and we continue to target 5-10% p.a. growth through the cycle through a combination of core business growth and new initiatives.
The Commercial loan book decreased 2% to £4.6 billion (31 July 2025: £4.7 billion), primarily driven by contraction in Invoice Finance, down 14% due to amplified seasonality in January 2026 and lower utilisation. Asset Finance grew 2%, with increases in the Wholesale Finance, Asset Ireland, and Energy portfolios since 31 July 2025. In the Commercial division, we continue to pursue organic growth in our core markets, as well as targeting new products and sectors such as commercial mortgages.
The Retail loan book was broadly flat at £2.9 billion (31 July 2025: £2.9 billion). While the prior year was impacted by the Hopcraft judgment, the Motor Finance loan book increased 4%, with record Motor Finance Ireland new business and a return to loan book growth in the UK. Excluding the run off of the legacy Republic of Ireland Motor Finance business, the Motor Finance loan book grew 5%. The Premium Finance loan book reduced by 13%, reflecting the planned reduction of a number of personal lines broker relationships in line with our strategic repositioning of the business, lower volumes, as well as market wide insurance premium deflation. In Retail, we are increasing our presence in the premium commercial lines market, and continuing to expand distribution of Motor Finance as well as growing our business in Ireland.
The Property loan book decreased 5% to £1.8 billion (31 July 2025: £1.9 billion) with drawdowns more than offset by repayment levels, as housing delivery across the UK remains constrained due to planning delays, build cost pressures and labour shortages, limiting new supply and reinforcing underlying demand pressures in local markets. In Property, we see significant opportunities in providing development loans for the delivery of Build-to-Rent and Purpose-Built Student Accommodation, and will continue to build our market position in these sectors alongside our core Build-to-Sell market.
Principal risks and uncertainties
The group faces a number of risks in the normal course of business. To manage these effectively, a consistent approach is adopted based on a set of overarching principles, namely:
|
• |
adhering to our established and proven business model; |
|
• |
implementing an integrated risk management approach based on the concept of "three lines of defence"; and |
|
• |
setting and operating within clearly defined risk appetites, monitored with defined metrics and limits. |
At the core of the group's risk management framework are the group's principal risks which are the risks that have been identified as those most material in the delivery of the group's strategic objectives. A detailed description of each, including an overview of our risk management and mitigation approach, is disclosed on pages 68 to 112 of the 2025 Annual Report. The Annual Report can be accessed via the Investor Relations home page on the group's website at www.closebrothers.com.
The principal risks are listed below and are subject to ongoing review to ensure that the framework remains aligned to the prevailing risk environment. In the current macroeconomic and operating environment, we remain vigilant to developments in our principal risk profile and proactively monitor a suite of emerging risks which reflect broader market uncertainties.
A summary of the group's principal risks is detailed below:
Business and strategic risk - The group operates in an environment where it is exposed to various independent influencing factors. Its profitability can be impacted by: the broader UK economic climate; changes in technology, regulation and customer behaviour; competition from traditional and new players; front-line sales performance; cost movements; and strategic changes. All of these can vary in both nature and extent across its divisions.
There remains elevated uncertainty while we await further details of the FCA's proposed industry-wide redress scheme for historical motor finance commissions. Nevertheless, we continue to focus on supporting our customers, and on maintaining underwriting standards and operational resilience, while we invest to support future income generation, operational efficiency and cost savings.
The business and strategic risk has stabilised following the Supreme Court ruling in August 2025 and the successful delivery of a number of management actions to strengthen our capital position, ensuring the group is well placed to navigate the current uncertainty. However, business risk may increase through FY26 and FY27 as the group continues to progress a number of key strategic and transformation initiatives, all of which come with execution risk attached.
Capital risk - The group is required to hold sufficient regulatory capital (including equity and other loss-absorbing debt instruments) to enable it to operate effectively. This includes meeting minimum regulatory requirements, operating within risk appetites set by the board and supporting its strategic goals. The group maintains a strong capital position, strengthened by the sale of Winterflood Securities in December 2025 with PRA approval for immediate relief of operational risk RWAs.
In October 2025, the group recognised a further provision in relation to motor finance commissions of £135 million, increasing the total provision to £300 million. While this represents the current best estimate based on a range of probability-weighted scenarios, there remains uncertainty in relation to the outcome of the FCA's consultation and the ultimate cost to the group could be materially higher or lower than the estimated provision. A range of additional potential management actions to further optimise RWAs has been evaluated, including potential risk transfer of assets in Motor Finance and other portfolios, should it be needed. Any decision to reinstate dividends will be reviewed by the board once there is further clarity on the financial impact of the FCA review of motor finance commission arrangements with such decision seeking to ensure that sufficient capital is retained in the group.
Change execution risk - As the group undertakes multiple strategic initiatives and change programmes driven by an evolving regulatory landscape and cost optimisation agenda, it faces increased exposure to associated risks. Failure to deliver business and technology change effectively may hinder our ability to achieve strategic objectives and meet the expectations of customers, regulators, colleagues, and shareholders - both at the group level and within individual businesses. Depending on the nature of the change, delays or failures in implementation could also impact financial performance. In addition, there is potential for regulatory and reputational consequences. Our current outlook on change execution risk remains broadly unchanged since the last reporting period.
Conduct risk - The group is exposed to conduct risk in its provision of products and services to customers both directly and via its intermediaries, and through other business activities that enable delivery. The regulatory change agenda continues at pace and is expected in the near term to continue to enhance consumer protection. Regulatory expectations, including with respect to retail customer savings and borrowing continue to evolve with impact on the group's businesses in each of these markets. Failure to evidence delivery of good customer outcomes may lead to reputational harm, legal or regulatory sanctions and/or customer redress. Where actual customer harm has been identified, the company is taking steps to address this, including through its response to the FCA's Borrowers in Financial Difficulty review for which remedial action is materially complete.
Credit risk - As a lender to businesses and individuals, the group is exposed to credit risk through the failure of counterparties or associated parties, with whom the group has contracted, to meet their obligations as they fall due.
The group applies consistent and prudent lending criteria to mitigate credit risk. Its lending activities are predominantly secured across a diverse range of asset classes. This ensures concentration risk is controlled in both the loan book and associated collateral. Credit risk appetites are set around unsecured and structurally protected lending to ensure portfolios remain predominantly secured.
Whilst credit performance remains resilient, we continue to monitor closely the evolving economic conditions and the impacts on our customers. We remain confident in the quality of our loan book, which is predominantly secured, prudently underwritten, diverse, and supported by the deep expertise of our people.
Cyber risk - The group's exposure to cyber risk is shaped by its engagement with third parties, the introduction of new digital products and services, and the need for secure, reliable data to conduct its business. These elements are integral to achieving the group's strategic goals.
The group continues to expect increased levels of risk of data loss or service disruption resulting from technology failures or malicious activities involving external or internal threats. Wider availability of advanced tools for conducting cyber-attacks, such as ransomware-as-a-service and AI technologies, are expected to lower technical barriers to entry in launching sophisticated and opportunistic attacks, leading to an increase in their frequency and intensity.
The group is committed to upholding high standards of cyber security in pursuit of its strategic goals, acknowledging that exposure may arise as threats and vulnerabilities evolve. To address these challenges, robust cyber controls and continuous monitoring are employed to ensure risks are managed within acceptable levels.
Funding and liquidity risk - The bank's funding position remains strong, with daily monitoring of liquidity metrics and appropriate escalation of any emerging risks. Throughout the period, the group closely assessed the impact of developments relating to motor commissions and has observed no material deterioration in its funding or liquidity position. The funding mix is predominantly comprised of retail deposits, providing a resilient funding base that supports lending activities. This is complemented by the maintenance of a robust level of liquid assets, ensuring the group is well placed to manage potential future liquidity pressure.
Legal and regulatory risk - The group is subject to the laws and regulations of the various jurisdictions in which it operates. This exposure includes risks of breaching financial services regulations and laws, as well as action resulting from contractual breach and litigation (including direct customer claims based on regulatory breaches). Failure to comply with existing legal or regulatory requirements, or to adapt to changes in a timely fashion in the course of the provision of products and services, may result in legal and regulatory risk. Changes could also affect our financial performance, capital liquidity and access to markets in which we operate.
With an increased regulatory focus on protecting customers, any failure to implement and/or adapt to these changes quickly may expose the group to reputational harm, legal or regulatory sanctions and/or customer redress requirements.
The group is awaiting the publication of the FCA's Policy Statement on Motor Commissions, which will set out the final form of any Consumer Redress Scheme.
In February 2026, the FCA issued the Premium Finance Market Study. The study aligns with our existing approach to consumer duty, customer outcomes and regulatory engagement.
Non-traded market risk - Changes in market prices such as interest rates, credit spreads and foreign exchange rates have the potential to impact the value of assets or liabilities. Our current outlook on non-traded market risk remains broadly unchanged since the last reporting period.
Operational risk - The group is exposed to various operational risks through its day-to-day operations, all of which have the potential to result in financial loss or other adverse impact. Operational risks arise as a result of inadequate or failed internal processes, people, models and systems, or as a result of external factors, including but not limited to Cyber and Information Security.
Operational risk is a core component of the Enterprise Risk Management Framework and its management is embedded in day-to-day business activities. Requirements and responsibilities are set out in the Operational Risk Policy and supporting standards and procedures as part of the framework to identify, assess, mitigate, monitor and report the operational risks, events and issues that could impact the achievement of business objectives or impact core business processes.
Businesses are responsible for the day-to-day management of operational risk, with oversight from the risk and compliance function, and independent assurance activities undertaken by group internal audit.
The group's exposure to operational risk is impacted through the desire to engage with third parties to deliver cost savings and enhanced services; and delivery of new products and services to support the group's strategic objectives.
The outlook for operational risk continues to be under upward pressure. Scenario analysis is used to assess how severe but plausible operational risks will affect the group, providing a forward-looking basis for evaluating and managing operational risk exposures. Notwithstanding, close monitoring continues on external factors and impacts which could arise from geo-political events and the legal and regulatory environment.
Reputational risk - Protection and effective stewardship of the group's reputation are fundamental to its long-term success. Detrimental stakeholder perception could lead to impairment of the group's current business and future goals. The group remains exposed to potential reputational risk in the course of its usual activities, such as through employee, supplier or intermediary conduct, the provision of products and services, crystallisation of another risk type, or as a result of changes outside its influence.
Media coverage of the publication of the FCA's Policy Statement on Motor Commissions, which will set out the final form of its Consumer Redress Scheme, will increase inherent reputational risk.
Traded Market risk - On 1 December 2025 it was announced that, following regulatory approval, the sale of Winterflood Securities to Marex Group was completed. Since traded market risk only related to Winterflood activities, this risk has now been removed from our set of principal risks.
Climate risk - Running alongside the suite of principal risks is climate risk, which the group categorises as a cross-cutting risk, as the impacts arising from climate change could emerge across the spectrum of principal risks.
Climate risk represents a continued area of focus, and the group continues to monitor government and regulatory developments closely in parallel to managing its own carbon footprint and supporting its customers to transition to a low carbon economy. Since the last reporting period the PRA has published a revised supervisory statement related to climate risk, which the group is currently reviewing in line with the proposed implementation period.
The group's current assessment remains that the short-dated tenor of the lending book and strong business model resilience capabilities mitigate current risk exposure, while the continued embedding of the climate risk framework will enable the group to review the evolution of the risk landscape on an ongoing basis. Climate disclosures are disclosed on pages 29 to 39 of the 2025 Annual Report.
Emerging and evolving risks
The group's suite of principal risks is accompanied by a portfolio of emerging risks reflecting broader market uncertainties. The established framework for monitoring these risks supports the group's organisational readiness to respond. Group-level emerging risks are monitored by the Group Risk and Compliance Committee ("GRCC") and Risk Committee on an ongoing basis, with agreed mitigating actions in place to ensure the group's preparedness should a risk crystallise. Ongoing monitoring also tracks several sub-risks to support identification of key themes and within the year the sub-risks covered has evolved accordingly in line with the perceived risk landscape.
Current group level emerging risks include economic and geopolitical uncertainty (including current heightened geopolitical tensions), climate and sustainability risks, and strategic disruption risk.
Directors' responsibility statement
Each of the Directors confirms that, to the best of their knowledge:
|
• |
the condensed consolidated interim financial statements ("interim financial statements") have been prepared in accordance with International Accounting Standard 34 "Interim Financial Reporting" as contained in UK-adopted International Accounting Standards ("IAS"); |
|
• |
the half year results include a fair review of the information required by Disclosure and Transparency Rule 4.2.7R (indication of important events during the first six months of the financial year and their impact on the interim financial statements, and a description of principal risks and uncertainties for the remaining six months of the financial year); and |
|
• |
the half year results include a fair review of the information required by Disclosure and Transparency Rule 4.2.8R (disclosure of related parties transactions that have taken place during the first six months of the current financial year and that have materially affected the financial position or performance of the company, and any changes in the related parties transactions described in the last Annual Report that could do so). |
The Directors of Close Brothers Group plc as at the date of this report are as listed on pages 120 to 122 of the company's 2025 Annual Report. A list of current Directors is maintained on the company's website www.closebrothers.com.
On behalf of the board
Michael B. Morgan Fiona McCarthy
Chief Executive Group Chief Finance Officer
17 March 2026
Independent review report to Close Brothers Group plc
Report on the condensed consolidated interim financial statements
Our conclusion
We have reviewed Close Brothers Group plc's condensed consolidated interim financial statements (the "interim financial statements") in the Half Year Results of Close Brothers Group plc for the 6 month period ended 31 January 2026 (the "period").
Based on our review, nothing has come to our attention that causes us to believe that the interim financial statements are not prepared, in all material respects, in accordance with UK adopted International Accounting Standard 34, 'Interim Financial Reporting' and the Disclosure Guidance and Transparency Rules sourcebook of the United Kingdom's Financial Conduct Authority.
The interim financial statements comprise:
|
• |
the consolidated balance sheet as at 31 January 2026; |
|
• |
the consolidated income statement and the consolidated statement of comprehensive income for the period then ended; |
|
• |
the consolidated cash flow statement for the period then ended; |
|
• |
the consolidated statement of changes in equity for the period then ended; and |
|
• |
the explanatory notes to the interim financial statements. |
The interim financial statements included in the Half Year Results of Close Brothers Group plc have been prepared in accordance with UK adopted International Accounting Standard 34, 'Interim Financial Reporting' and the Disclosure Guidance and Transparency Rules sourcebook of the United Kingdom's Financial Conduct Authority.
Basis for conclusion
We conducted our review in accordance with International Standard on Review Engagements (UK) 2410, 'Review of Interim Financial Information Performed by the Independent Auditor of the Entity' issued by the Financial Reporting Council for use in the United Kingdom ("ISRE (UK) 2410"). A review of interim financial information consists of making enquiries, primarily of persons responsible for financial and accounting matters, and applying analytical and other review procedures.
A review is substantially less in scope than an audit conducted in accordance with International Standards on Auditing (UK) and, consequently, does not enable us to obtain assurance that we would become aware of all significant matters that might be identified in an audit. Accordingly, we do not express an audit opinion.
We have read the other information contained in the Half Year Results and considered whether it contains any apparent misstatements or material inconsistencies with the information in the interim financial statements.
Conclusions relating to going concern
Based on our review procedures, which are less extensive than those performed in an audit as described in the Basis for conclusion section of this report, nothing has come to our attention to suggest that the directors have inappropriately adopted the going concern basis of accounting or that the directors have identified material uncertainties relating to going concern that are not appropriately disclosed. This conclusion is based on the review procedures performed in accordance with ISRE (UK) 2410. However, future events or conditions may cause the group to cease to continue as a going concern.
Responsibilities for the interim financial statements and the review
Our responsibilities and those of the directors
The Half Year Results, including the interim financial statements, is the responsibility of, and has been approved by the directors. The directors are responsible for preparing the Half Year Results in accordance with the Disclosure Guidance and Transparency Rules sourcebook of the United Kingdom's Financial Conduct Authority. In preparing the Half Year Results, including the interim financial statements, the directors are responsible for assessing the group's ability to continue as a going concern, disclosing, as applicable, matters related to going concern and using the going concern basis of accounting unless the directors either intend to liquidate the group or to cease operations, or have no realistic alternative but to do so.
Our responsibility is to express a conclusion on the interim financial statements in the Half Year Results based on our review. Our conclusion, including our Conclusions relating to going concern, is based on procedures that are less extensive than audit procedures, as described in the Basis for conclusion paragraph of this report.
Use of this report
This report, including the conclusion, has been prepared for and only for the company for the purpose of complying with the Disclosure Guidance and Transparency Rules sourcebook of the United Kingdom's Financial Conduct Authority and for no other purpose. We do not, in giving this conclusion, accept or assume responsibility for any other purpose or to any other person to whom this report is shown or into whose hands it may come save where expressly agreed by our prior consent in writing.
PricewaterhouseCoopers LLP
Chartered Accountants
London
17 March 2026
Consolidated income statement
For the six months ended 31 January 2026
|
Six months ended 31 January |
Year ended 31 July |
|||
|
Note |
2026 Unaudited £ million |
20251 Unaudited £ million |
2025 Audited £ million |
|
|
Interest income |
521.6 |
574.2 |
1,111.7 |
|
|
Interest expense |
(247.2) |
(280.6) |
(542.9) |
|
|
Net interest income |
274.4 |
293.6 |
568.8 |
|
|
Fee and commission income |
46.9 |
49.6 |
103.5 |
|
|
Fee and commission expense |
(7.6) |
(8.7) |
(16.7) |
|
|
Other income |
2 |
56.0 |
62.9 |
118.5 |
|
Depreciation of operating lease assets and other direct costs |
9 |
(35.9) |
(42.0) |
(84.6) |
|
Impairment of operating lease assets |
9 |
- |
- |
(30.0) |
|
Non-interest income |
59.4 |
61.8 |
90.7 |
|
|
Operating income |
333.8 |
355.4 |
659.5 |
|
|
Provision in relation to motor finance commissions |
13 |
(135.0) |
(165.0) |
(165.0) |
|
Complaints handling and other operational and legal costs incurred in relation to motor finance commissions |
13 |
5.3 |
(8.4) |
(18.7) |
|
Provision in relation to early settlements in Motor Finance |
13 |
- |
- |
(33.0) |
|
Other administrative expenses |
(230.1) |
(236.1) |
(472.4) |
|
|
Total administrative expenses |
(359.8) |
(409.5) |
(689.1) |
|
|
Impairment losses on financial assets |
6 |
(39.5) |
(48.1) |
(92.8) |
|
Total operating expenses |
(399.3) |
(457.6) |
(781.9) |
|
|
Operating loss before tax |
(65.5) |
(102.2) |
(122.4) |
|
|
Tax |
3 |
0.3 |
(9.2) |
(4.7) |
|
Loss after tax from continuing operations |
(65.2) |
(111.4) |
(127.1) |
|
|
Profit/(loss) from discontinued operations, net of tax |
20 |
0.8 |
(0.4) |
49.2 |
|
Loss after tax |
(64.4) |
(111.8) |
(77.9) |
|
|
Attributable to |
||||
|
Shareholders |
(75.5) |
(122.9) |
(100.2) |
|
|
Other equity owners |
11 |
11.1 |
11.1 |
22.3 |
|
(64.4) |
(111.8) |
(77.9) |
||
|
From continuing operations |
||||
|
Basic earnings per share |
4 |
(51.0)p |
(81.8)p |
(99.8)p |
|
Diluted earnings per share |
4 |
(51.0)p |
(81.8)p |
(99.8)p |
|
From continuing and discontinued operations |
||||
|
Basic earnings per share |
4 |
(50.5)p |
(82.1)p |
(66.9)p |
|
Diluted earnings per share |
4 |
(50.5)p |
(82.1)p |
(66.9)p |
|
Interim dividend per share |
5 |
- |
- |
- |
|
Final dividend per share |
5 |
- |
- |
- |
|
1. |
Comparative information restated for discontinued operations. See Notes 1, 2 and 20. |
Consolidated statement of comprehensive income
For the six months ended 31 January 2026
|
Six months ended 31 January |
Year ended 31 July |
|||
|
Note |
2026 Unaudited £ million |
2025 Unaudited £ million |
2025 Audited £ million |
|
|
Loss after tax |
(64.4) |
(111.8) |
(77.9) |
|
|
Items that may be reclassified to income statement |
||||
|
Currency translation (losses)/gains |
(0.1) |
(0.2) |
0.5 |
|
|
Losses on cash flow hedging |
(1.5) |
(11.5) |
(12.7) |
|
|
Gains/(losses) on financial instruments classified at fair value through other comprehensive income |
2.4 |
(6.5) |
(4.2) |
|
|
Tax relating to items that may be reclassified |
(0.3) |
5.0 |
4.3 |
|
|
0.5 |
(13.2) |
(12.1) |
||
|
Items that will not be reclassified to income statement |
||||
|
Defined benefit pension scheme losses |
- |
(0.1) |
(0.1) |
|
|
Other comprehensive income/(expense), net of tax |
0.5 |
(13.3) |
(12.2) |
|
|
Total comprehensive loss |
(63.9) |
(125.1) |
(90.1) |
|
|
Attributable to |
||||
|
Shareholders |
(75.0) |
(136.2) |
(112.4) |
|
|
Other equity owners |
11 |
11.1 |
11.1 |
22.3 |
|
(63.9) |
(125.1) |
(90.1) |
||
Consolidated balance sheet
At 31 January 2026
|
Note |
31 January 2026 Unaudited £ million |
31 July 2025 Audited £ million |
|
|
Assets |
|||
|
Cash and balances at central banks |
1,386.8 |
1,917.0 |
|
|
Loans and advances to banks |
137.4 |
161.7 |
|
|
Loans and advances to customers |
6 |
9,241.3 |
9,459.4 |
|
Debt securities |
7 |
833.5 |
859.2 |
|
Derivative financial instruments |
107.2 |
103.1 |
|
|
Intangible assets |
8 |
163.0 |
166.3 |
|
Property, plant and equipment |
9 |
198.0 |
209.4 |
|
Current tax assets |
50.2 |
44.2 |
|
|
Deferred tax assets |
32.8 |
31.0 |
|
|
Prepayments, accrued income and other assets |
133.4 |
186.6 |
|
|
Assets classified as held for sale |
20 |
- |
934.0 |
|
Total assets |
12,283.6 |
14,071.9 |
|
|
Liabilities |
|||
|
Deposits by banks |
10 |
26.6 |
88.1 |
|
Deposits by customers |
10 |
7,874.0 |
8,799.3 |
|
Loans and overdrafts from banks |
10 |
6.4 |
1.5 |
|
Debt securities in issue |
10 |
1,938.6 |
1,991.3 |
|
Derivative financial instruments |
83.6 |
104.7 |
|
|
Provisions for liabilities and charges |
13 |
340.7 |
210.3 |
|
Accruals, deferred income and other liabilities |
151.7 |
172.3 |
|
|
Subordinated loan capital |
10 |
199.2 |
195.5 |
|
Liabilities directly associated with assets classified as held for sale |
20 |
- |
773.4 |
|
Total liabilities |
10,620.8 |
12,336.4 |
|
|
Equity |
|||
|
Called up share capital |
38.0 |
38.0 |
|
|
Retained earnings |
1,457.2 |
1,532.3 |
|
|
Other equity instrument |
11 |
197.6 |
197.6 |
|
Other reserves |
(30.0) |
(32.4) |
|
|
Total shareholders' and other equity owners' equity |
1,662.8 |
1,735.5 |
|
|
Total equity |
1,662.8 |
1,735.5 |
|
|
Total equity and liabilities |
12,283.6 |
14,071.9 |
Consolidated statement of changes in equity
For the six months ended 31 January 2026
|
Other reserves |
Total attributable to shareholders and other equity owners £ million |
||||||||
|
Called up share capital £ million |
Retained earnings £ million |
Other equity instrument £ million |
FVOCI reserve £ million |
Share-based payments reserve £ million |
Exchange movements reserve £ million |
Cash flow hedging reserve £ million |
Total equity £ million |
||
|
At 1 August 2024 |
38.0 |
1,634.4 |
197.6 |
(5.3) |
(33.8) |
(1.4) |
13.0 |
1,842.5 |
1,842.5 |
|
(audited) |
|||||||||
|
Loss for the period |
- |
(111.8) |
- |
- |
- |
- |
- |
(111.8) |
(111.8) |
|
Other comprehensive expense |
- |
(0.1) |
- |
(4.7) |
- |
(0.2) |
(8.3) |
(13.3) |
(13.3) |
|
Total comprehensive expense for the period |
- |
(111.9) |
- |
(4.7) |
- |
(0.2) |
(8.3) |
(125.1) |
(125.1) |
|
Shares released |
- |
- |
- |
- |
2.4 |
- |
- |
2.4 |
2.4 |
|
Coupon paid on other equity instrument (Note 11) |
- |
(11.1) |
- |
- |
- |
- |
- |
(11.1) |
(11.1) |
|
Other movements |
- |
(0.8) |
- |
- |
2.8 |
- |
- |
2.0 |
2.0 |
|
At 31 January 2025 |
38.0 |
1,510.6 |
197.6 |
(10.0) |
(28.6) |
(1.6) |
4.7 |
1,710.7 |
1,710.7 |
|
(unaudited) |
|||||||||
|
Profit for the period |
- |
33.9 |
- |
- |
- |
- |
- |
33.9 |
33.9 |
|
Other comprehensive income/(expense) |
- |
- |
- |
1.7 |
- |
0.3 |
(0.9) |
1.1 |
1.1 |
|
Total comprehensive income/(expense) for the period |
- |
33.9 |
- |
1.7 |
- |
0.3 |
(0.9) |
35.0 |
35.0 |
|
Shares purchased |
- |
- |
- |
- |
(1.6) |
- |
- |
(1.6) |
(1.6) |
|
Shares released |
- |
- |
- |
- |
6.8 |
- |
- |
6.8 |
6.8 |
|
Coupon paid on other equity instrument (Note 11) |
- |
(11.2) |
- |
- |
- |
- |
- |
(11.2) |
(11.2) |
|
Other movements |
- |
(1.0) |
- |
- |
(3.2) |
- |
- |
(4.2) |
(4.2) |
|
At 31 July 2025 |
38.0 |
1,532.3 |
197.6 |
(8.3) |
(26.6) |
(1.3) |
3.8 |
1,735.5 |
1,735.5 |
|
(audited) |
|||||||||
|
Loss for the period |
- |
(64.4) |
- |
- |
- |
- |
- |
(64.4) |
(64.4) |
|
Other comprehensive income/(expense) |
- |
- |
- |
1.7 |
- |
(0.1) |
(1.1) |
0.5 |
0.5 |
|
Total comprehensive (expense)/income for the period |
- |
(64.4) |
- |
1.7 |
- |
(0.1) |
(1.1) |
(63.9) |
(63.9) |
|
Shares released |
- |
- |
- |
- |
1.5 |
- |
- |
1.5 |
1.5 |
|
Coupon paid on other equity instrument (Note 11) |
- |
(11.1) |
- |
- |
- |
- |
- |
(11.1) |
(11.1) |
|
Other movements |
- |
0.2 |
- |
- |
0.4 |
- |
- |
0.6 |
0.6 |
|
Income tax |
- |
0.2 |
- |
- |
- |
- |
- |
0.2 |
0.2 |
|
At 31 January 2026 |
|||||||||
|
(unaudited) |
38.0 |
1,457.2 |
197.6 |
(6.6) |
(24.7) |
(1.4) |
2.7 |
1,662.8 |
1,662.8 |
Consolidated cash flow statement
For the six months ended 31 January 2026
|
Six months ended 31 January |
Year ended 31 July |
|||
|
Note |
2026 Unaudited £ million |
2025 Unaudited £ million |
2025 Audited £ million |
|
|
Net cash (outflow)/inflow from operating activities |
15(a) |
(677.4) |
346.0 |
241.2 |
|
Net cash inflow/(outflow) from investing activities |
||||
|
Purchase of: |
||||
|
Property, plant and equipment |
(2.3) |
(1.9) |
(5.3) |
|
|
Intangible assets - software |
(15.2) |
(13.3) |
(24.5) |
|
|
Subsidiaries, net of cash acquired |
15(b) |
- |
(0.5) |
(0.5) |
|
Sale of: |
||||
|
Equity shares held for investment |
- |
- |
1.8 |
|
|
Subsidiaries, net of cash disposed |
15(c) |
122.4 |
- |
104.0 |
|
104.9 |
(15.7) |
75.5 |
||
|
Net cash (outflow)/inflow before financing activities |
(572.5) |
330.3 |
316.7 |
|
|
Financing activities |
||||
|
Purchase of own shares for employee share award schemes |
- |
- |
(1.6) |
|
|
Interest paid on subordinated loan capital and debt financing |
(11.7) |
(11.7) |
(23.4) |
|
|
Payment of lease liabilities |
(3.2) |
(7.4) |
(12.1) |
|
|
AT1 coupon payment |
(11.1) |
(11.1) |
(22.3) |
|
|
Net (decrease)/increase in cash |
(598.5) |
300.1 |
257.3 |
|
|
Cash and cash equivalents at beginning of period |
2,101.8 |
1,844.5 |
1,844.5 |
|
|
Cash and cash equivalents at end of period |
15(d) |
1,503.3 |
2,144.6 |
2,101.8 |
|
Cash and cash equivalents per the balance sheet |
1,503.3 |
2,102.2 |
2,046.8 |
|
|
Cash and cash equivalents within the assets of the disposal group classified as held for sale |
20 |
- |
42.4 |
55.0 |
|
1,503.3 |
2,144.6 |
2,101.8 |
||
The Notes
1. Basis of preparation and accounting policies
The half year results have been prepared in accordance with the Disclosure Guidance and Transparency Rules of the Financial Conduct Authority and the condensed consolidated interim financial statements ("interim financial statements") have been prepared in accordance with UK-adopted International Accounting Standards. These include International Accounting Standard ("IAS") 34 'Interim Financial Reporting', which specifically addresses the contents of interim financial statements. The interim financial statements incorporate the individual interim financial statements of Close Brothers Group plc and the entities it controls, using the acquisition method of accounting.
The half year results are unaudited and do not constitute statutory accounts within the meaning of Section 434 of the companies Act 2006. However, the information has been reviewed by the group's auditor, PricewaterhouseCoopers LLP, and their report appears above. The half year results for the six months ended 31 January 2025 presented as comparatives are also unaudited.
The financial information for the year ended 31 July 2025 contained within this half year report does not constitute statutory accounts as defined in Section 434 of the Companies Act 2006. A copy of those statutory accounts, which have been prepared in accordance with international accounting standards in conformity with the requirements of the Companies Act 2006, has been delivered to the Registrar of Companies. PricewaterhouseCoopers LLP has reported on those accounts. The report of the auditor on those statutory accounts was unqualified, did not contain an emphasis of matter paragraph and did not contain a statement under Section 498(2) or (3) of the Companies Act 2006.
Items relevant to understanding financial performance are presented on the consolidated income statement under IAS 1. Adjusting items and administrative expenses before adjusting items are not presented on the consolidated income statement this year to provide more clarity in relation to the statutory figures. Prior year comparatives have been re-presented on the same basis. In addition, the comparative information for the period ended 31 January 2025 in the consolidated income statement has been restated with £0.8 million of expenses relating to Asset Management reclassified from continuing to discontinued operations.
The accounting policies used are consistent with those set out on pages 184 to 189 of the 2025 Annual Report.
Going concern
The directors acknowledge that the risk landscape is constantly evolving and as such continually review the group's principal and emerging risks. The Financial Conduct Authority ("FCA") review of historical motor finance commission arrangements including the proposed industry-wide redress scheme and the impact on the group's activities, has continued to be a key area of focus.
In accordance with the relevant accounting standards, since the FCA's announcement of its review in January 2024, the group has assessed provision requirements on an ongoing basis. Based on all available information, including market developments in relation to a proposed industry-wide redress scheme for motor commissions in October 2025, the group holds a provision of £293.6 million as at 31 January 2026. This provision is based on probability weighted scenarios using various assumptions and includes estimates for certain potential operational and legal costs, as well as estimates for potential customer redress. Refer to Note 13 for further information regarding the assumptions used and sensitivity of those assumptions.
In light of the prevailing and continued uncertainty as to the range of outcomes from the FCA's ongoing review of motor finance commissions and the consultation on the proposed industry-wide redress scheme, the group recognises the need to plan for a range of possible outcomes, and continues to prioritise maintaining a strong capital position, balance sheet, and prudent approach to managing its financial resources.
As part of the directors' consideration of the appropriateness of adopting the going concern basis, the directors have reviewed the group's operating plan to June 2027, being 15 months from the date of approval of the interim financial statements. This is in line with the assessment period (15 months) reviewed as part of the FY25 going concern assessment.
The directors have considered a range of forward-looking scenario analyses, similar to those considered in the FY25 assessment (refer to page 113 of the 2025 Annual Report). The group's 'severe but plausible' going concern scenario overlays the operating plan with an additional provision relating to motor finance commissions in March 2026, subdued loan book growth and higher than expected bad debt and operational costs. Such additional provision was derived by stressing the assumptions used to calculate the existing provision relating to motor finance commissions.
The modelling output of all scenarios considered highlights the resilient capital position, and capacity to absorb losses and increases in RWAs beyond the impacts modelled, strengthened by modelled management actions.
The group continues to have a strong and conservative business model, lending in a variety of sectors across a diverse range of assets. The group remains well positioned in each of its businesses, is soundly funded, and has strong levels of liquidity. The group maintains strong headroom to minimum regulatory requirements to withstand the downside scenario elements. In making their going concern assessment, the directors have also considered the operational agility and resilience of the group. The directors continually expect to maintain a high level of operational and system performance.
Under all scenarios the group continues to operate with sufficient levels of capital for the next 15 months from the reporting date, with the group's capital ratios in excess of minimum regulatory requirements.
Separately from managing the group capital position the group adopts a conservative approach to funding and liquidity risk and seeks to maintain a funding and liquidity position characterised by preserving a simple and transparent balance sheet, sustaining a diverse range of funding sources and holding a prudent level of high-quality liquidity. As such, the weighted average maturity of its funding is longer than the weighted average maturity of its lending portfolio. The board reviewed these factors when concluding upon going concern.
As part of the liquidity management process the group also uses a suite of internally developed liquidity stress scenarios to monitor the potential liquidity exposure of its banking operations daily and determine its high-quality liquid asset requirements. This ensures that the group remains within risk appetite and identifies potential areas of vulnerability. These stresses are formally approved by the Asset and Liability Committee, Group Risk and Compliance Committee and board and cover both idiosyncratic and market wide stresses. The group uses a combined retail and wholesale stress scenario to determine the amount of liquidity it needs to hold for its banking operations. As at 31 January 2026 the group held sufficient liquidity resources to meet the applicable stress.
In conclusion, the directors have determined that they have a reasonable expectation that the group as a whole have adequate resources to continue as a going concern for a period of at least 12 months from the date of approval of the interim financial statements. Accordingly, they continue to adopt the going concern basis in preparing the interim results.
Critical accounting judgements and estimates
The reported results of the group are sensitive to the judgements, estimates and assumptions that underlie the application of its accounting policies and preparation of its interim financial statements. UK company law and IFRS require the directors, in preparing the group's interim financial statements, to select suitable accounting policies, apply them consistently and make judgements, estimates and assumptions that are reasonable.
The group's estimates and assumptions are based on historical experience and reasonable expectations of future events and are reviewed on an ongoing basis. Actual results in the future may differ from the amounts estimated due to the inherent uncertainty.
The group's critical accounting judgements, made in applying its accounting policies, and the key sources of estimation uncertainty that may have a significant risk of causing a material adjustment within the next financial year are set out below.
The impact of climate change on the group's judgements, estimates and assumptions has been considered in preparing these interim financial statements. While no material impact has been identified, climate risk continues to be monitored on an ongoing basis.
Critical accounting judgements
The critical accounting judgements of the group, which relate to expected credit loss provisions under IFRS 9 and motor finance commissions, are as follows:
|
• |
Establishing the criteria for a significant increase in credit risk; |
|
• |
Determining the appropriate definition of default; and |
|
• |
Determining the affected customers in the motor finance commissions provisioning assessment, with further judgement and estimation then applied on the level of compensation and appropriate scenarios. |
Information on the first two accounting judgements can be found below, while further information on the third judgement can be found in Note 13.
Significant increase in credit risk
Assets are transferred from Stage 1 to Stage 2 when there has been a significant increase in credit risk since initial recognition. Typically, the group assesses whether a significant increase in credit risk has occurred based on a quantitative and qualitative assessment, with a "30 days past due" backstop.
Due to the diverse nature of the group's lending businesses, the specific indicators of a significant increase in credit risk vary by business and may include some or all of the following factors:
|
• |
quantitative assessment: the lifetime probability of default ("PD") has increased by more than an agreed threshold relative to the equivalent at origination. Thresholds are based on a fixed number of risk grade movements which are bespoke to each business to ensure that the increased risk since origination is appropriately captured; |
|
• |
qualitative assessment: events or observed behaviour indicate credit deterioration. This includes a wide range of information that is reasonably available including individual credit assessments of the financial performance of borrowers as appropriate during routine reviews, plus forbearance and watch list information; or |
|
• |
backstop criteria: the "30 days past due" backstop is met. |
Definition of default
The definition of default is an important building block for expected credit loss models and is considered a key judgement. A default is considered to have occurred if any unlikeliness to pay criterion is met or when a financial asset meets a "90 days past due" backstop. While some criteria are factual (e.g. administration, insolvency or bankruptcy), others require a judgemental assessment of whether the borrower has financial difficulties which are expected to have a detrimental impact on their ability to meet contractual obligations. A change in the definition of default may have a material impact on the expected credit loss provision.
As part of the ongoing review and maintenance of credit models, in November 2025 an updated IFRS 9 model was deployed for the Motor Finance business. The updated model incorporated changes to definition of default alongside amended cure criteria, recognising the evolving composition and behaviour of the portfolio, and recalibrations. The model implementation resulted in a reduction in modelled provisions and the overall impaired population (see Note 6 for further detail). Simultaneously, a post-model adjustment was applied to offset some of the provision release from the implementation based on management's expert judgement. This adjustment was applied to facilitate a phased approach that allows for regular management review to ensure provision levels remain appropriate in the context of recent unemployment trends and the wider macroeconomic environment.
Key sources of estimation uncertainty
The key sources of estimation uncertainty of the group, which relate to expected credit loss provisions, value in use calculations, and motor finance commissions, are as follows. These sources of estimation uncertainty are consistent with the prior year, albeit the estimates relating to motor finance commissions have been updated in line with the latest developments.
|
• |
Forward-looking macroeconomic information incorporated into expected credit loss models; |
|
• |
Adjustments by management to model calculated expected credit losses due to limitations in the group's expected credit loss models or input data, which may be identified through ongoing model monitoring and validation of models; |
|
• |
Estimate of future cash flow forecasts in the calculation of value in use for the testing of goodwill for impairment in relation to the group's cash generating units, in particular Motor Finance, due to lower cash flow forecasts; and |
|
• |
Estimates and assumptions applied in the calculation of the provision relating to motor finance commissions. These assumptions are the final scheme rules, customer claim rates, costs to administer the scheme and any further legal, regulatory or industry developments. Claim rate is defined as the estimated cost of customer remediation (based on customer engagement with redress invitation) as a percentage of the estimated cost of the eligible in scope population. |
Forward-looking information
Determining expected credit losses under IFRS 9 requires the incorporation of forward-looking macroeconomic information that is reasonable, supportable and includes assumptions linked to economic variables that impact losses in each portfolio. The introduction of macroeconomic information introduces additional volatility to provisions.
In order to calculate forward-looking provisions, economic scenarios are sourced from Moody's Analytics. These cover a range of plausible economic paths that are used in conjunction with PD, EAD and LGD parameters for each portfolio to assess expected credit loss provisions across a range of conditions. An overview of these scenarios using key macroeconomic indicators is provided under 'Scenario forecasts and weights' later in Note 1. Ongoing benchmarking of the scenarios to other economic providers is carried out monthly to provide management with comfort on Moody's Analytics scenario paths.
Five different projected economic scenarios are currently considered to cover a range of possible outcomes. These include a baseline scenario, which reflects the best view of future economic events. In addition, one upside scenario and three downside scenario paths are defined relative to the baseline. Management assigns the scenarios a probability weighting to reflect the likelihood of specific scenarios, and therefore loss outcomes, materialising, using a combination of quantitative analysis and expert judgement.
The impact of forward-looking information varies across the group's lending businesses because of the differing sensitivity of each portfolio to specific macroeconomic variables. This is reflected through the development of bespoke macroeconomic models that recognise the specific response of each business to the macroeconomic environment.
The modelled impact of macroeconomic scenarios and their respective weightings is reviewed by business experts in relation to stage allocation and coverage ratios at the individual and portfolio level, incorporating management's experience and knowledge of customers, the sectors in which they operate, and the assets financed.
This includes assessment of the reaction of the ECL in the context of the prevailing and forecast economic conditions, for example where currently higher interest rates and inflationary conditions exist compared to recent periods.
Economic forecasts have continued to develop over the course of the financial year to date and reflect the mixed external environment observed during the period. Forecasts deployed in IFRS 9 macroeconomic models are updated on a monthly basis. At 31 January 2026, the latest baseline scenario forecasts gross domestic product ("GDP") growth of 0.9% in calendar year 2026 and an average base rate of 3.4% across the same period. Consumer Price Index ("CPI") inflation is forecast to be 2.1% in calendar year 2026 in the baseline scenario, remaining consistent at 2.1% in 2027.
At 31 January 2026, the scenario weightings were: 30% strong upside, 32.5% baseline, 20% mild downside, 10.5% moderate downside and 7% protracted downside. As economic forecasts are considered to recognise developments in the macroeconomic environment appropriately, no change has been made to the weightings ascribed to the scenarios since 31 July 2025.
Given the prevailing economic uncertainty, regular analysis is undertaken to assess the appropriateness of the five scenarios used. This included benchmarking the baseline scenario to consensus economic views, as well as consideration of an additional forecast related to stagflation, which could be considered as an alternative downside scenario.
Compared to the scenarios in use in the expected credit losses calculation, the stagflation scenario includes a longer period of higher interest rates coupled with a shallower but extended impact on GDP. Due to the relatively short tenor of the portfolios, the stagflation scenario is considered to be of less relevance than those deployed. Additionally, due to the higher severity of recessionary factors in the existing scenarios, utilising the stagflation scenario would result in lower expected credit losses.
The final scenarios deployed reflect a broadly comparable UK economic outlook relative to 31 July 2025. Under the baseline scenario, UK headline CPI inflation is expected to moderate from current levels and meet the Bank of England's 2% target during the second half of 2026. Following the downward trend in inflation from its 2022 peak, the Bank of England base rate is forecast to continue to reduce in all scenarios, albeit at a slower pace than previously expected. House price outlook has been broadly stable, reflecting a degree of resilience through challenging market conditions in recent months. Unemployment rate forecasts have deteriorated compared to 31 July 2025, recognising recent reported increases above 5%.
The forecasts represent an economic view at 31 January 2026, after which there have been further economic developments, including the decision to maintain the UK base rate at 3.75% at the February Monetary Policy Committee meeting. These developments, and their impact on scenarios and weightings, are subject to ongoing monitoring by management.
These periods have been included as they demonstrate the short, medium and long-term outlooks for the key macroeconomic indicators which form the basis of the scenario forecasts. The portfolio has an average residual maturity of 15 months, with 99% of loan value having a maturity of five years or less.
The tables below show economic assumptions within each scenario, and the weighting applied to each at 31 January 2026. The metrics shown are key UK economic indicators, chosen to describe the economic scenarios. These are the main metrics used to set scenario paths, which then influence a wide range of additional metrics that are used in expected credit loss models. The first tables show the forecasts of the key metrics for the scenarios utilised for calendar years 2026 and 2027. The subsequent tables show averages and peak-to-trough ranges for the same key metrics over the five-year period from 2026 to 2030.
Scenario forecasts and weights
|
Baseline |
Upside (strong) |
Downside (mild) |
Downside (moderate) |
Downside (protracted) |
||||||
|
2026 |
2027 |
2026 |
2027 |
2026 |
2027 |
2026 |
2027 |
2026 |
2027 |
|
|
At 31 January 2026 |
||||||||||
|
UK GDP growth |
0.9% |
1.5% |
3.5% |
2.7% |
(1.5)% |
0.5% |
(2.3)% |
(0.8)% |
(2.8)% |
(2.1)% |
|
UK unemployment |
5.1% |
5.0% |
4.7% |
4.2% |
5.5% |
5.4% |
6.3% |
7.6% |
6.9% |
8.9% |
|
UK HPI growth |
2.0% |
2.3% |
16.4% |
5.4% |
(5.3)% |
1.5% |
(9.2)% |
(7.0)% |
(15.4)% |
(11.0)% |
|
BoE base rate |
3.4% |
2.9% |
3.6% |
3.3% |
2.9% |
1.8% |
2.7% |
1.2% |
2.2% |
0.9% |
|
Consumer Price Index |
2.1% |
2.1% |
2.3% |
2.1% |
(0.4)% |
1.2% |
(1.1)% |
0.7% |
(2.1)% |
(0.1)% |
|
Weighting |
32.5% |
30% |
20% |
10.5% |
7% |
|||||
|
Baseline |
Upside (strong) |
Downside (mild) |
Downside (moderate) |
Downside (protracted) |
||||||
|
2025 |
2026 |
2025 |
2026 |
2025 |
2026 |
2025 |
2026 |
2025 |
2026 |
|
|
At 31 July 2025 |
||||||||||
|
UK GDP growth |
1.1% |
1.0% |
1.9% |
3.7% |
0.4% |
(1.9)% |
0.2% |
(3.4)% |
0.1% |
(4.3)% |
|
UK unemployment |
4.7% |
4.7% |
4.5% |
4.1% |
4.8% |
5.2% |
5.0% |
6.8% |
5.1% |
8.0% |
|
UK HPI growth |
3.3% |
3.2% |
9.9% |
13.4% |
0.2% |
(2.6)% |
(1.6)% |
(9.2)% |
(3.6)% |
(16.4)% |
|
BoE base rate |
4.2% |
3.2% |
4.3% |
3.5% |
4.1% |
2.4% |
4.1% |
1.8% |
3.9% |
1.3% |
|
Consumer Price Index |
3.1% |
2.0% |
3.2% |
2.1% |
2.1% |
0.3% |
1.7% |
(0.6)% |
1.3% |
(1.1)% |
|
Weighting |
32.5% |
30% |
20% |
10.5% |
7% |
|||||
Notes:
UK GDP growth: National Accounts Annual Real Gross Domestic Product, Seasonally Adjusted - year-on-year change (%).
UK unemployment: ONS Labour Force Survey, Seasonally Adjusted - Average (%).
UK HPI growth: Average nominal house prices, Land Registry, Seasonally Adjusted - Q4-to-Q4 change (%).
BoE base rate: Bank of England base rate - Average (%).
Consumer Price Index: ONS, All items, annual inflation - Q4-to-Q4 change (%).
|
Five-year average (calendar years 2026 to 2030) |
|||||
|
Baseline |
Upside (strong) |
Downside (mild) |
Downside (moderate) |
Downside (protracted) |
|
|
At 31 January 2026 |
|||||
|
UK GDP growth |
1.6% |
2.4% |
1.1% |
0.8% |
0.7% |
|
UK unemployment |
5.0% |
4.3% |
5.2% |
7.1% |
8.1% |
|
UK HPI growth |
2.1% |
3.5% |
0.4% |
(1.2)% |
(3.7)% |
|
BoE base rate |
2.8% |
3.0% |
2.5% |
1.7% |
1.1% |
|
Consumer Price Index |
2.0% |
2.1% |
1.3% |
1.0% |
0.6% |
|
Weighting |
32.5% |
30% |
20% |
10.5% |
7% |
|
Five-year average (calendar years 2025 to 2029) |
|||||
|
Baseline |
Upside (strong) |
Downside (mild) |
Downside (moderate) |
Downside (protracted) |
|
|
At 31 July 2025 |
|||||
|
UK GDP growth |
1.6% |
2.3% |
1.1% |
0.8% |
0.7% |
|
UK unemployment |
4.7% |
4.1% |
4.9% |
6.7% |
7.6% |
|
UK HPI growth |
2.5% |
4.2% |
0.8% |
(1.0)% |
(3.5)% |
|
BoE base rate |
3.0% |
3.1% |
2.7% |
2.0% |
1.5% |
|
Consumer Price Index |
2.2% |
2.3% |
1.6% |
1.2% |
0.9% |
|
Weighting |
32.5% |
30% |
20% |
10.5% |
7% |
Notes:
UK GDP growth: National Accounts Annual Real Gross Domestic Product, Seasonally Adjusted - CAGR (%)
UK unemployment: ONS Labour Force Survey, Seasonally Adjusted - Average (%)
UK HPI growth: Average nominal house prices, Land Registry, Seasonally Adjusted - CAGR (%)
BoE base rate: Bank of England base rate - Average (%)
Consumer Price Index: ONS, All items, annual inflation - CAGR (%)
|
Five-year period (calendar year 2026 to 2030) |
||||||||||
|
Baseline |
Upside (strong) |
Downside (mild) |
Downside (moderate) |
Downside (protracted) |
||||||
|
Peak |
Trough |
Peak |
Trough |
Peak |
Trough |
Peak |
Trough |
Peak |
Trough |
|
|
At 31 January 2026 |
||||||||||
|
UK GDP growth |
8.2% |
0.3% |
12.5% |
1.4% |
5.8% |
(2.5)% |
4.0% |
(4.1)% |
3.6% |
(5.3)% |
|
UK unemployment |
5.1% |
4.9% |
4.9% |
4.1% |
5.6% |
4.9% |
7.8% |
5.4% |
9.1% |
5.6% |
|
UK HPI growth |
10.7% |
0.4% |
22.9% |
2.3% |
1.9% |
(5.8)% |
(1.2)% |
(15.9)% |
(2.1)% |
(24.9)% |
|
BoE base rate |
3.6% |
2.5% |
3.8% |
2.5% |
3.5% |
1.7% |
3.5% |
1.0% |
3.4% |
0.7% |
|
Consumer Price Index |
2.9% |
1.9% |
2.9% |
2.0% |
2.4% |
(0.4)% |
2.2% |
(1.3)% |
2.0% |
(2.1)% |
|
Weighting |
32.5% |
30% |
20% |
10.5% |
7% |
|||||
|
Five-year period (calendar year 2025 to 2029) |
||||||||||
|
Baseline |
Upside (strong) |
Downside (mild) |
Downside (moderate) |
Downside (protracted) |
||||||
|
Peak |
Trough |
Peak |
Trough |
Peak |
Trough |
Peak |
Trough |
Peak |
Trough |
|
|
At 31 July 2025 |
||||||||||
|
UK GDP growth |
8.2% |
0.7% |
12.3% |
0.7% |
5.7% |
(2.1)% |
4.0% |
(3.8)% |
3.6% |
(5.0)% |
|
UK unemployment |
4.8% |
4.5% |
4.7% |
3.8% |
5.2% |
4.5% |
7.5% |
4.5% |
8.8% |
4.5% |
|
UK HPI growth |
13.2% |
1.5% |
27.8% |
1.5% |
4.3% |
(3.1)% |
2.2% |
(12.6)% |
2.2% |
(22.0)% |
|
BoE base rate |
4.6% |
2.5% |
4.6% |
2.5% |
4.6% |
1.8% |
4.6% |
1.0% |
4.6% |
0.6% |
|
Consumer Price Index |
3.4% |
1.9% |
3.4% |
2.0% |
3.4% |
(0.5)% |
3.4% |
(1.2)% |
3.4% |
(2.1)% |
|
Weighting |
32.5% |
30% |
20% |
10.5% |
7% |
|||||
Notes:
UK GDP growth: Maximum and minimum quarterly GDP as a percentage change from start of period (%)
UK unemployment: Maximum and minimum unemployment rate (%)
UK HPI growth: Maximum and minimum average nominal house price as a percentage change from start of period (%)
BoE base rate: Maximum and minimum Bank of England base rate (%)
Consumer Price Index: Maximum and minimum inflation rate over the five-year period (%)
The following charts below represent the quarterly forecast data included in the above tables incorporating actual metrics up to 31 January 2026. The dark blue line shows the baseline scenario, while the other lines represent the various upside and downside scenarios.
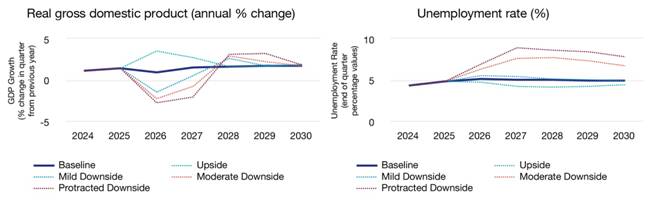
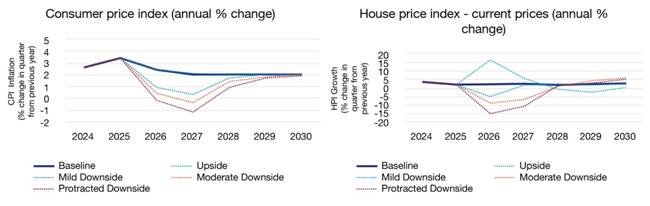
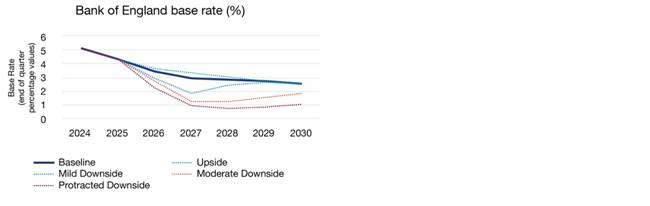
Scenario sensitivity analysis
The expected credit loss provision is sensitive to judgements and estimations made with regard to the selection and weighting of multiple economic scenarios. As a result, management has assessed and considered the sensitivity of the provision as follows:
|
• |
For the majority of the portfolios, the modelled expected credit loss provision has been recalculated under the upside strong and downside protracted scenarios described above, applying a 100% weighting to each scenario in turn. The change in provision requirement is driven by the movement in risk metrics under each scenario and resulting impact on stage allocation. |
|
|
• |
Expected credit losses based on a simplified approach, which do not utilise a macroeconomic model and require expert judgement, are excluded from the sensitivity analysis. |
|
|
• |
In addition to the above, key considerations for the sensitivity analysis are set out below, by segment: |
|
|
- |
In Retail, the sensitivity analysis does not apply further stress to the expected credit loss provision on loans and advances to customers in Stage 3, because the measurement of expected credit losses is considered more sensitive to credit factors specific to the borrower than macroeconomic scenarios. |
|
|
- |
In Property, the sensitivity analysis excludes individually assessed provisions, and certain sub-portfolios which are deemed more sensitive to credit factors than the macroeconomic scenarios. |
|
Based on the above analysis, at 31 January 2026, application of 100% weighting to the upside strong scenario would decrease the expected credit loss by £20.4 million whilst application of 100% weighting to the downside protracted scenario would increase the expected credit loss by £35.2 million, driven by the aforementioned changes in risk metrics and stage allocation of the portfolios.
When performing sensitivity analysis there is a high degree of estimation uncertainty. On this basis, 100% weighted expected credit loss provisions presented for the upside and downside scenarios should not be taken to represent the lower or upper range of possible and actual expected credit loss outcomes. The recalculated expected credit loss provision for each of the scenarios should be read in the context of the sensitivity analysis as a whole and in conjunction with the disclosures provided in Note 6. The modelled impact presented is based on gross loans and advances to customers at 31 January 2026; it does not incorporate future changes relating to performance, growth or credit risk. In addition, given the change in the macroeconomic conditions, underlying modelled provisions and methodology, and refined approach to adjustments, direct comparison between the sensitivity results at 31 July 2025 and 31 January 2026 is not appropriate.
The economic environment remains uncertain and future impairment charges may be subject to further volatility, including from updates to macroeconomic variable forecasts impacted by sustained cost-of-living pressures, changes in fiscal policy, trade-related uncertainty (including the impact of tariffs), and ongoing geopolitical conflicts.
Use of adjustments
Limitations in the group's expected credit loss models or input data may be identified through ongoing model monitoring and validation of models. In certain circumstances, management make appropriate adjustments to model-calculated expected credit losses. These adjustments are based on management judgements or quantitative back-testing to ensure expected credit loss provisions adequately reflect all known information. These adjustments are generally determined by considering the attributes or risks of a financial asset which are not captured by existing expected credit loss model outputs. Management adjustments are actively monitored, reviewed and incorporated into future model developments where applicable.
Portfolio performance has been closely monitored during the financial year under review, over which modelled provisions have increased and external forecasts have remained broadly stable. As a result, macroeconomic adjustments in place at 31 July 2025 have been retained in recognition of persistent external uncertainty.
The overall value of adjustments has increased since 31 July 2025 as a result of the application of adjustments relating to specific portfolios or sub-portfolios where, in management's judgement, modelled provisions do not adequately reflect expected credit losses. This includes a new short-term adjustment in Motor Finance following deployment of updated credit models in November 2025 (see 'Definition of Default' in Note 1 for more information).
The approach to adjustments continues to reflect the use of expert management judgement which incorporates management's experience and knowledge of customers, the areas in which they operate, and the underlying assets financed. The need for adjustments will continue to be monitored as new information emerges which might not be recognised in existing models.
At 31 January 2026, £6.2 million (31 July 2025: £4.0 million) of the expected credit loss provision was attributable to adjustments, which reflects a combination of positive and negative adjustments depending on the adjustment purpose or model requirement. Adjustments include £2.1 million held to reflect ongoing economic uncertainty (31 July 2025: £2.1 million).
2. Segmental analysis
The directors manage the group by class of business and present the segmental analysis on that basis. The group's activities are presented in three (2025: three) operating segments: Commercial, Retail, and Property.
In the segmental reporting information that follows, Group consists of central functions as well as various non-trading head office companies and consolidation adjustments and is set out in order that the information presented reconciles to the consolidated income statement. The Group balance sheet primarily includes treasury assets and liabilities comprising cash and balances at central banks, debt securities, customer deposits and other borrowings.
Businesses continue to charge market prices for the limited services rendered to other parts of the group. Funding charges allocated to the segments take into account commercial demands. More than 90% of the group's activities, revenue and assets are located in the UK.
|
Commercial £ million |
Retail £ million |
Property £ million |
Group £ million |
Continuing operations £ million |
Discontinued operations1 £ million |
Total £ million |
|
|
Summary income statement for the six months ended 31 January 2026 |
|||||||
|
Net interest income/(expense) |
113.6 |
104.5 |
61.1 |
(4.8) |
274.4 |
- |
274.4 |
|
Other non-interest income |
49.8 |
8.9 |
0.5 |
0.2 |
59.4 |
- |
59.4 |
|
Operating income/(expense) |
163.4 |
113.4 |
61.6 |
(4.6) |
333.8 |
- |
333.8 |
|
Provision in relation to motor finance commissions |
- |
(135.0) |
- |
- |
(135.0) |
- |
(135.0) |
|
Complaints handling and other operational and legal costs incurred in relation to motor finance commissions |
- |
5.3 |
- |
- |
5.3 |
- |
5.3 |
|
Depreciation and amortisation |
(11.8) |
(9.0) |
(1.7) |
(1.5) |
(24.0) |
- |
(24.0) |
|
Other administrative expenses |
(89.3) |
(84.6) |
(15.5) |
(16.7) |
(206.1) |
- |
(206.1) |
|
Impairment losses on financial assets |
(16.5) |
(8.2) |
(14.8) |
- |
(39.5) |
- |
(39.5) |
|
Total operating expenses |
(117.6) |
(231.5) |
(32.0) |
(18.2) |
(399.3) |
- |
(399.3) |
|
Operating profit/(loss) before tax from continuing operations |
45.8 |
(118.1) |
29.6 |
(22.8) |
(65.5) |
- |
(65.5) |
|
Operating profit before tax from discontinued operations |
- |
- |
- |
- |
- |
1.4 |
1.4 |
|
External operating income/(expense) |
252.0 |
169.3 |
95.2 |
(182.7) |
333.8 |
- |
333.8 |
|
Inter segment operating (expense)/income |
(88.6) |
(55.9) |
(33.6) |
178.1 |
- |
- |
- |
|
Segment operating income/(expense) |
163.4 |
113.4 |
61.6 |
(4.6) |
333.8 |
- |
333.8 |
|
1. |
Discontinued operations comprise Winterflood Securities sold on 1 December 2025 and Close Brothers Asset Management sold on 28 February 2025. See Note 20. |
Other non-interest income of £59.4 million (six months ended 31 January 2025: £61.8 million; year ended 31 July 2025: £120.7 million) includes other income of £56.0 million (six months ended 31 January 2025: £62.9 million; year ended 31 July 2025: £118.5 million), which predominantly relates to the operating lease assets rental income of Close Brothers Vehicle Hire (which is in wind-down) and Close Brewery Rentals Limited (which was sold in August 2025). In the current period, other income also includes a gain on disposal of Close Brewery Rentals Limited of £6.4 million - please refer to Note 20 for more information.
As set out in Note 20 "Discontinued operations and assets and liabilities classified as held for sale", on 25 July 2025, the group announced the sale of Winterflood Securities, an execution services and securities business, to Marex Group plc. The sale completed on 1 December 2025 and its financial results are presented within this note as discontinued operations.
|
Commercial £ million |
Retail £ million |
Property £ million |
Group2 £ million |
Continuing operations £ million |
Discontinued operations £ million |
Total £ million |
|
|
Summary balance sheet information at 31 January 2026 |
|||||||
|
Total assets¹ |
4,784.3 |
2,852.5 |
1,762.8 |
2,884.0 |
12,283.6 |
- |
12,283.6 |
|
Total liabilities |
- |
- |
- |
10,620.8 |
10,620.8 |
- |
10,620.8 |
|
1. |
Total assets for the operating segments comprise the loan book and operating lease assets only. |
|
2. |
Balance sheet includes £2,840.2 million assets and £10,706.7 million liabilities largely relating to the treasury balances described in the second paragraph of this note. The remaining difference relates to the assets and liabilities of the Group central functions. |
Equity is allocated across the group as set out below. The equity of Commercial, Retail and Property, which is managed as a whole rather than on a segmental basis, reflects loan book and operating lease assets of £9,399.6 million, in addition to assets and liabilities of £2,840.2 million and £10,706.7 million respectively primarily comprising treasury balances which are included within the Group column above. The remaining difference relates to the assets and liabilities of the Group central functions.
|
Equity at 31 January 2026 |
Operating segments £ million |
Group £ million |
Continuing operations £ million |
Discontinued operations £ million |
Total £ million |
|
Equity |
1,533.1 |
129.7 |
1,662.8 |
- |
1,662.8 |
|
Commercial £ million |
Retail £ million |
Property £ million |
Group £ million |
Continuing operations £ million |
Discontinued operations1 £ million |
Total £ million |
|
|
Summary income statement for the six months ended 31 January 2025 |
|||||||
|
Net interest income/(expense) |
116.5 |
117.2 |
67.1 |
(7.2) |
293.6 |
- |
293.6 |
|
Other non-interest income/(expense) |
48.7 |
11.6 |
1.6 |
(0.1) |
61.8 |
- |
61.8 |
|
Operating income/(expense) |
165.2 |
128.8 |
68.7 |
(7.3) |
355.4 |
- |
355.4 |
|
Provision in relation to motor finance commissions |
- |
(165.0) |
- |
- |
(165.0) |
- |
(165.0) |
|
Complaints handling and other operational and legal costs incurred in relation to motor finance commissions |
- |
(8.4) |
- |
- |
(8.4) |
- |
(8.4) |
|
Provision in relation to early settlements in Motor Finance |
- |
- |
- |
- |
- |
- |
- |
|
Depreciation and amortisation |
(14.2) |
(10.4) |
(2.7) |
(1.1) |
(28.4) |
- |
(28.4) |
|
Other administrative expenses |
(93.8) |
(78.7) |
(15.2) |
(20.0) |
(207.7) |
- |
(207.7) |
|
Impairment losses on financial assets |
(16.1) |
(23.2) |
(8.8) |
- |
(48.1) |
- |
(48.1) |
|
Total operating expenses |
(124.1) |
(285.7) |
(26.7) |
(21.1) |
(457.6) |
- |
(457.6) |
|
Operating profit/(loss) before tax from continuing operations |
41.1 |
(156.9) |
42.0 |
(28.4) |
(102.2) |
- |
(102.2) |
|
Operating (loss)/profit before tax from discontinued operations |
- |
- |
- |
(2.4) |
(2.4) |
3.3 |
0.9 |
|
External operating income/(expense) |
266.6 |
189.2 |
114.1 |
(214.5) |
355.4 |
- |
355.4 |
|
Inter segment operating (expense)/income |
(101.4) |
(60.4) |
(45.4) |
207.2 |
- |
- |
- |
|
Segment operating income/(expense) |
165.2 |
128.8 |
68.7 |
(7.3) |
355.4 |
- |
355.4 |
|
1. |
Comparative information restated for discontinued operations. See Notes 1 and 20. |
|
Commercial £ million |
Retail £ million |
Property £ million |
Group £ million |
Continuing operations £ million |
Discontinued operations1 £ million |
Total £ million |
|
|
Summary income statement for the year ended 31 July 2025 |
|||||||
|
Net interest income/(expense) |
228.1 |
224.5 |
128.3 |
(12.1) |
568.8 |
- |
568.8 |
|
Impairment of operating lease assets |
(30.0) |
- |
- |
- |
(30.0) |
- |
(30.0) |
|
Other non-interest income |
95.8 |
22.2 |
2.3 |
0.4 |
120.7 |
- |
120.7 |
|
Operating income/(expense) |
293.9 |
246.7 |
130.6 |
(11.7) |
659.5 |
- |
659.5 |
|
Provision in relation to motor finance commissions |
- |
(165.0) |
- |
- |
(165.0) |
(165.0) |
|
|
Complaints handling and other operational and legal costs incurred in relation to motor finance commissions |
- |
(18.7) |
- |
- |
(18.7) |
- |
(18.7) |
|
Provision in relation to early settlements in Motor Finance |
- |
(33.0) |
- |
- |
(33.0) |
- |
(33.0) |
|
Depreciation and amortisation |
(26.8) |
(20.0) |
(4.5) |
(2.8) |
(54.1) |
- |
(54.1) |
|
Other administrative expenses |
(185.0) |
(164.1) |
(29.7) |
(39.5) |
(418.3) |
- |
(418.3) |
|
Impairment losses on financial assets |
(18.8) |
(44.5) |
(29.5) |
- |
(92.8) |
- |
(92.8) |
|
Total operating expenses |
(230.6) |
(445.3) |
(63.7) |
(42.3) |
(781.9) |
- |
(781.9) |
|
Operating profit/(loss) before tax from continuing operations |
63.3 |
(198.6) |
66.9 |
(54.0) |
(122.4) |
- |
(122.4) |
|
Operating profit before tax from discontinued operations |
- |
- |
- |
46.3 |
46.3 |
4.9 |
51.2 |
|
External operating income/(expense) |
491.4 |
364.3 |
215.1 |
(411.3) |
659.5 |
- |
659.5 |
|
Inter segment operating (expense)/income |
(197.5) |
(117.6) |
(84.5) |
399.6 |
- |
- |
- |
|
Segment operating income/(expense) |
293.9 |
246.7 |
130.6 |
(11.7) |
659.5 |
- |
659.5 |
|
1. |
Comparative information restated for discontinued operations. See Notes 1 and 20. |
|
Commercial £ million |
Retail £ million |
Property £ million |
Group² £ million |
Continuing operations £ million |
Discontinued operations3 £ million |
Total £ million |
|
|
Summary balance sheet information at 31 July 2025 |
|||||||
|
Total assets¹ |
4,894.3 |
2,878.9 |
1,852.5 |
3,567.3 |
13,193.0 |
878.9 |
14,071.9 |
|
Total liabilities |
- |
- |
- |
11,548.1 |
11,548.1 |
788.3 |
12,336.4 |
|
1. |
Total assets for the operating segments comprise the loan book and operating lease assets only. |
|
2. |
Balance sheet includes £3,117.6 million assets and £11,353.5 million liabilities largely relating to the treasury balances described in the second paragraph of this note. The remaining difference relates to the assets and liabilities of the Group central functions. |
|
3. |
Discontinued operations on the balance sheet comprise Winterflood Securities. See Note 20. The assets and liabilities of Winterflood Securities presented in this table include intercompany balances for the purposes of segmental reporting. |
Equity is allocated across the group as set out below. The equity of Commercial, Retail and Property, which is managed as a whole rather than on a segmental basis, reflects loan book and operating lease assets of £9,625.7 million, in addition to assets and liabilities of £3,521.9 million and £11,556.2 million respectively primarily comprising treasury balances which are included within the Group column above. The remaining difference relates to the assets and liabilities of the Group central functions.
|
Equity at 31 July 2025 |
Operating segments £ million |
Group £ million |
Continuing operations £ million |
Discontinued operations £ million |
Total £ million |
|
Equity |
1,591.4 |
53.5 |
1,644.9 |
90.6 |
1,735.5 |
3. Taxation
|
Six months ended 31 January |
Year ended 31 July |
||
|
2026 £ million |
20251 £ million |
2025 £ million |
|
|
Tax charged/(credited) to the income statement |
|||
|
Current tax: |
|||
|
UK corporation tax |
0.6 |
10.9 |
15.0 |
|
Foreign tax |
1.0 |
0.7 |
1.0 |
|
Adjustments in respect of previous years |
(0.1) |
- |
(1.3) |
|
1.5 |
11.6 |
14.7 |
|
|
Deferred tax: |
|||
|
Deferred tax credit for the current year |
(1.9) |
(2.4) |
(11.6) |
|
Adjustments in respect of previous years |
0.1 |
- |
1.6 |
|
(0.3) |
9.2 |
4.7 |
|
|
Tax on items not (credited)/charged to the income statement |
|||
|
Current tax relating to: |
|||
|
Acquisitions and disposals |
- |
- |
3.7 |
|
Deferred tax relating to: |
|||
|
Cash flow hedging |
(0.4) |
(3.2) |
(3.5) |
|
Financial instruments classified as fair value through other comprehensive income |
0.7 |
(1.8) |
(1.2) |
|
Share-based payments |
(0.2) |
- |
- |
|
Currency translation gains |
- |
- |
0.4 |
|
Acquisitions and disposals |
- |
- |
1.7 |
|
0.1 |
(5.0) |
1.1 |
|
|
Reconciliation to tax expense |
|||
|
UK corporation tax for the period at 25% (2025: 25%) on operating loss |
(16.4) |
(25.6) |
(30.6) |
|
Disallowable items and other permanent differences2 |
18.9 |
37.6 |
40.6 |
|
Banking surcharge |
- |
- |
- |
|
Tax relief on coupon on other equity instruments |
(2.8) |
(2.8) |
(5.6) |
|
Prior period tax provision |
- |
- |
0.3 |
|
(0.3) |
9.2 |
4.7 |
|
|
1. |
Comparative information restated following the classification of Winterflood as discontinued operations. See Notes 2 and 20. |
|
2. |
Disallowable items and other permanent differences largely relate to the non-deductible provision in relation to motor finance commissions. |
The standard UK corporation tax rate for the period is 25.0% (2025: 25.0%). An additional 3.0% (2025: 3.0%) surcharge applies to banking company profits as defined in legislation, but only above a threshold amount which is not exceeded by the current year banking company profits.
The effective tax rate for the period is 0.5% (six months ended 31 January 2025: (9.0)%; year ended 31 July 2025: (3.8)%) representing the best estimate of the annual effective tax rate expected for the full year, with the exception of the tax rate impact of the £135.0 million of provision and costs relating to the FCA's review of historical motor finance commission arrangements which have been recognised in the period (see Note 13 for further detail). Excluding this item the effective tax rate is approximately 20.0%.
The UK government has implemented the Pillar Two global minimum tax rate of 15% and a UK domestic minimum top-up tax. The jurisdictions in relation to which Pillar Two tax liabilities are expected to potentially arise for the group are the Republic of Ireland, Jersey and Guernsey. The current tax charge for the period includes £nil in respect of Pillar Two income taxes. The group has adopted the IAS 12 exemption from recognition and disclosure regarding the impact on deferred tax assets and liabilities arising from this legislation.
4. Earnings per share
The calculation of basic earnings per share is based on the profit attributable to shareholders and the number of basic weighted average shares. When calculating the diluted earnings per share, the weighted average number of shares in issue is adjusted for the effects of all dilutive share options and awards.
|
Six months ended 31 January |
Year ended 31 July |
||
|
2026 |
20251 |
2025 |
|
|
Continuing operations |
|||
|
Basic |
(51.0)p |
(81.8)p |
(99.8)p |
|
Diluted |
(51.0)p |
(81.8)p |
(99.8)p |
|
Adjusted basic2 |
27.1p |
33.8p |
59.3p |
|
Adjusted diluted2 |
27.1p |
33.8p |
59.3p |
|
Discontinued operations |
|||
|
Basic |
0.5p |
(0.3)p |
32.9p |
|
Diluted |
0.5p |
(0.3)p |
32.9p |
|
Continuing and discontinued operations |
|||
|
Basic |
(50.5)p |
(82.1)p |
(66.9)p |
|
Diluted |
(50.5)p |
(82.1)p |
(66.9)p |
|
1. |
Comparative information restated for discontinued operations. See Notes 1, 2 and 20. |
|
2. |
Excludes the adjusting items set out in the table below and the associated tax effect. |
|
Six months ended 31 January |
Year ended 31 July |
||
|
2026 £ million |
20251 £ million |
2025 £ million |
|
|
Loss attributable to shareholders |
(75.5) |
(122.9) |
(100.2) |
|
Less profit from discontinued operations, net of tax |
(0.8) |
0.4 |
(49.2) |
|
Loss attributable to shareholders on continuing operations |
(76.3) |
(122.5) |
(149.4) |
|
Adjustments: |
|||
|
Provision in relation to motor finance commissions |
135.0 |
165.0 |
165.0 |
|
Complaints handling and other operational and legal costs incurred in relation to motor finance commissions |
(5.3) |
8.4 |
18.7 |
|
Discount unwind in relation to the provisions for motor finance commissions and early settlements in Motor Finance2 |
5.0 |
- |
- |
|
Provision in relation to early settlements in Motor Finance |
- |
- |
33.0 |
|
Gain on disposal of Close Brewery Rentals Limited |
(6.4) |
- |
- |
|
Restructuring costs |
1.6 |
0.4 |
2.3 |
|
Amortisation of intangible assets on acquisition |
0.1 |
0.1 |
0.2 |
|
Operating (profit)/loss before tax of Close Brewery Rentals Limited |
(0.4) |
2.6 |
4.1 |
|
Operating loss before tax of Close Brothers Vehicle Hire |
1.1 |
6.2 |
43.4 |
|
Tax effect of adjustments |
(13.9) |
(9.6) |
(28.6) |
|
Adjusted profit attributable to shareholders on continuing operations |
40.5 |
50.6 |
88.7 |
|
1. |
Comparative information restated for discontinued operations. See Notes 1, 2 and 20. |
|
2. |
Refer to Note 13 for further information. |
The tax rate on adjusting items is 10.6% (six months ended 31 January 2025: 5.3%; year ended 31 July 2025: 10.7%), which differs to the standard UK corporation tax rate for the financial year of 25.0% (six months ended 31 January 2025: 25.0%; year ended 31 July 2025: 25.0%). This is primarily due to £81.5 million (six months ended 31 January 2025: £143.4 million; year ended 31 July 2025: £150.0 million) of the provisions in relation to motor finance commissions and early settlements in Motor Finance comprising disallowable expenditure, partly offset by the gain on disposal of Close Brewery Rentals Limited being tax exempt.
|
Six months ended 31 January |
Year ended 31 July |
||
|
2026 million |
2025 million |
2025 million |
|
|
Average number of shares |
|||
|
Basic weighted |
149.6 |
149.7 |
149.7 |
|
Effect of dilutive share options and awards |
2.1 |
0.2 |
0.2 |
|
Diluted weighted |
151.7 |
149.9 |
149.9 |
5. Dividends
|
Six months ended 31 January |
Year ended 31 July |
||
|
2026 £ million |
2025 £million |
2025 £ million |
|
|
For each ordinary share |
|||
|
Interim dividend for previous financial year paid in April 2025: nil (April 2024: nil) |
- |
- |
- |
|
Final dividend for previous financial year paid in November 2025: nil (November 2024: nil) |
- |
- |
- |
|
- |
- |
- |
|
Given the continued uncertainty regarding the outcome of the FCA's review of motor finance commission arrangements and any potential financial impact, the group will not pay an interim dividend on its ordinary shares for the 2026 financial year. As previously stated, the decision to reinstate dividends will be reviewed by the board once there is further clarity on the financial impact of the FCA review of motor finance commissions.
6. Loans and advances to customers
(a) Maturity and classification analysis of loans and advances to customers
The following tables set out the maturity and IFRS 9 classification analysis of loans and advances to customers. At 31 January 2026 loans and advances to customers with a maturity of two years or less was £7,011.4 million (31 July 2025: £7,346.3 million) representing 73.9% (31 July 2025: 75.7%) of total gross loans and advances to customers:
|
On demand £ million |
Within three months £ million |
Between three months and one year £ million |
Between one and two years £ million |
Between two and five years £ million |
After more than five years £ million |
Total gross loans and advances to customers £ million |
Impairment provisions £ million |
Total net loans and advances to customers £ million |
|
|
At 31 January 2026 |
87.0 |
2,860.6 |
2,319.9 |
1,743.9 |
2,355.9 |
118.9 |
9,486.2 |
(244.9) |
9,241.3 |
|
At 31 July 2025 |
85.1 |
2,984.1 |
2,512.4 |
1,764.7 |
2,220.7 |
142.1 |
9,709.1 |
(249.7) |
9,459.4 |
|
31 January 2026 £ million |
31 July 2025 £ million |
|
|
Gross loans and advances to customers |
||
|
Held at amortised cost |
9,474.5 |
9,697.3 |
|
Held at fair value through profit or loss |
11.7 |
11.8 |
|
9,486.2 |
9,709.1 |
(b) Loans and advances to customers held at amortised cost and impairment provisions by stage
Gross loans and advances to customers held at amortised cost by stage and the corresponding impairment provisions and provision coverage ratios are set out below:
|
Stage 2 |
||||||
|
Stage 1 £ million |
Less than 30 days past due £ million |
Greater than or equal to 30 days past due £ million |
Total £ million |
Stage 3 £ million |
Total £ million |
|
|
At 31 January 2026 |
||||||
|
Gross loans and advances to customers held at amortised cost |
||||||
|
Commercial |
3,565.1 |
975.2 |
36.3 |
1,011.5 |
112.2 |
4,688.8 |
|
Retail |
2,719.5 |
125.8 |
21.4 |
147.2 |
70.3 |
2,937.0 |
|
Property |
1,415.3 |
30.9 |
139.0 |
169.9 |
263.5 |
1,848.7 |
|
7,699.9 |
1,131.9 |
196.7 |
1,328.6 |
446.0 |
9,474.5 |
|
|
Impairment provisions |
||||||
|
Commercial |
21.6 |
9.8 |
5.5 |
15.3 |
37.6 |
74.5 |
|
Retail |
27.6 |
11.0 |
4.4 |
15.4 |
41.5 |
84.5 |
|
Property |
4.0 |
1.8 |
0.5 |
2.3 |
79.6 |
85.9 |
|
53.2 |
22.6 |
10.4 |
33.0 |
158.7 |
244.9 |
|
|
Provision coverage ratio |
||||||
|
Commercial |
0.6% |
1.0% |
15.2% |
1.5% |
33.5% |
1.6% |
|
Retail |
1.0% |
8.7% |
20.6% |
10.5% |
59.0% |
2.9% |
|
Property |
0.3% |
5.8% |
0.4% |
1.4% |
30.2% |
4.6% |
|
0.7% |
2.0% |
5.3% |
2.5% |
35.6% |
2.6% |
|
|
Stage 2 |
||||||
|
Stage 1 £ million |
Less than 30 days past due £ million |
Greater than or equal to 30 days past due £ million |
Total £ million |
Stage 3 £ million |
Total £ million |
|
|
At 31 July 2025 |
||||||
|
Gross loans and advances to customers held at amortised cost |
||||||
|
Commercial |
3,717.5 |
925.1 |
39.0 |
964.1 |
108.1 |
4,789.7 |
|
Retail |
2,611.1 |
252.6 |
15.1 |
267.7 |
95.2 |
2,974.0 |
|
Property |
1,585.6 |
15.7 |
43.5 |
59.2 |
288.8 |
1,933.6 |
|
7,914.2 |
1,193.4 |
97.6 |
1,291.0 |
492.1 |
9,697.3 |
|
|
Impairment provisions |
||||||
|
Commercial |
21.7 |
10.8 |
5.2 |
16.0 |
35.8 |
73.5 |
|
Retail |
25.3 |
13.9 |
2.7 |
16.6 |
53.2 |
95.1 |
|
Property |
3.6 |
1.0 |
- |
1.0 |
76.5 |
81.1 |
|
50.6 |
25.7 |
7.9 |
33.6 |
165.5 |
249.7 |
|
|
Provision coverage ratio |
||||||
|
Commercial |
0.6% |
1.2% |
13.3% |
1.7% |
33.1% |
1.5% |
|
Retail |
1.0% |
5.5% |
17.9% |
6.2% |
55.9% |
3.2% |
|
Property |
0.2% |
6.4% |
-% |
1.7% |
26.5% |
4.2% |
|
0.6% |
2.2% |
8.1% |
2.6% |
33.6% |
2.6% |
|
In Commercial, the impairment coverage ratio increased to 1.6% (31 July 2025: 1.5%), reflecting a marginal deterioration in staging profile, but broadly stable provision levels against the context of a reduced loan book.
In Retail, the provision coverage ratio decreased to 2.9% (31 July 2025: 3.2%), primarily due to the deployment of new Motor Finance models which included updated default definitions, resulting in a material reduction in the Stage 3 population. Refer to Note 1 "Basis of Preparation and Accounting Policies' for further information on the updated default definitions.
In Property, the provision coverage ratio increased to 4.6% (31 July 2025: 4.2%), primarily as a result of increased provisions on existing impaired accounts since 31 July 2025.
(c) Adjustments
By their nature, limitations in the group's expected credit loss models or input data may be identified through ongoing model monitoring and validation of models. In certain circumstances, management make appropriate adjustments to model-calculated expected credit losses. Adjustments have been identified as a key source of estimation uncertainty as set out in Note 1.
(d) Reconciliation of loans and advances to customers held at amortised cost and impairment provisions
Reconciliation of gross loans and advances to customers and associated impairment provisions are set out below.
New financial assets originate in Stage 1 only, and the amount presented represents the value at origination.
Subsequently, a loan may transfer between stages, and the presentation of such transfers is based on a comparison of the loan at the beginning of the year (or at origination if this occurred during the year) and the end of the year (or just prior to final repayment or write off).
Repayments relating to loans which transferred between stages during the year are presented within the transfers between stages lines. Such transfers do not represent overnight reclassification from one stage to another. All other repayments are presented in a separate line.
ECL model methodologies may be updated or enhanced from time to time and the impacts of such changes are presented on a separate line.
Enhancements to our model suite are a contributory factor to ECL movements and such factors have been taken into consideration when assessing any required adjustments to modelled output and ensuring appropriate provision coverage levels.
A loan is written off when there is no reasonable expectation of further recovery following realisation of all associated collateral and available recovery actions against the customer.
|
Stage 1 £ million |
Stage 2 £ million |
Stage 3 £ million |
Total £ million |
|
|
Gross loans and advances to customers held at amortised cost |
||||
|
At 1 August 2025 |
7,914.2 |
1,291.0 |
492.1 |
9,697.3 |
|
New financial assets originated |
2,798.5 |
- |
- |
2,798.5 |
|
Transfers to Stage 1 |
226.4 |
(287.3) |
(7.3) |
(68.2) |
|
Transfers to Stage 2 |
(892.6) |
804.4 |
(5.9) |
(94.1) |
|
Transfers to Stage 3 |
(81.7) |
(94.9) |
140.1 |
(36.5) |
|
Net transfer between stages and repayments¹ |
(747.9) |
422.2 |
126.9 |
(198.8) |
|
Repayments while stage remained unchanged and final repayments |
(2,395.1) |
(278.2) |
(104.6) |
(2,777.9) |
|
Changes to model methodologies2 |
131.8 |
(104.8) |
(27.0) |
- |
|
Write offs |
(1.6) |
(1.6) |
(41.4) |
(44.6) |
|
At 31 January 2026 |
7,699.9 |
1,328.6 |
446.0 |
9,474.5 |
|
1. |
Repayments relate only to financial assets which transferred between stages during the year. Other repayments are shown in the line below. |
|
2. |
Changes relate to the updated model deployed for the Motor Finance business - see "Critical accounting judgements" in Note 1 for more information. |
|
Stage 1 £ million |
Stage 2 £ million |
Stage 3 £ million |
Total £ million |
|
|
Gross loans and advances to customers held at amortised cost |
||||
|
At 1 August 2024 |
8,410.5 |
1,128.8 |
725.5 |
10,264.8 |
|
New financial assets originated |
5,766.1 |
- |
- |
5,766.1 |
|
Transfers to Stage 1 |
200.4 |
(289.4) |
(5.2) |
(94.2) |
|
Transfers to Stage 2 |
(1,381.4) |
1,112.6 |
(4.5) |
(273.3) |
|
Transfers to Stage 3 |
(274.4) |
(146.1) |
321.9 |
(98.6) |
|
Net transfer between stages and repayments1 |
(1,455.4) |
677.1 |
312.2 |
(466.1) |
|
Repayments while stage remained unchanged and final repayments |
(4,852.2) |
(464.3) |
(223.7) |
(5,540.2) |
|
Changes to model methodologies |
48.3 |
(48.3) |
- |
- |
|
Write offs |
(3.1) |
(2.3) |
(321.9) |
(327.3) |
|
At 31 July 2025 |
7,914.2 |
1,291.0 |
492.1 |
9,697.3 |
|
1. |
Repayments relate only to financial assets which transferred between stages during the year. Other repayments are shown in the line below. |
|
Stage 1 £ million |
Stage 2 £ million |
Stage 3 £ million |
Total £ million |
|
|
Impairment provisions on loans and advances to customers held at amortised cost |
||||
|
At 1 August 2025 |
50.6 |
33.6 |
165.5 |
249.7 |
|
New financial assets originated |
23.0 |
- |
- |
23.0 |
|
Transfers to Stage 1 |
2.0 |
(6.1) |
(2.6) |
(6.7) |
|
Transfers to Stage 2 |
(7.3) |
25.7 |
(1.8) |
16.6 |
|
Transfers to Stage 3 |
(1.2) |
(12.0) |
41.4 |
28.2 |
|
Net remeasurement of expected credit losses arising from transfer of stages and repayments1 |
(6.5) |
7.6 |
37.0 |
38.1 |
|
Repayments and ECL movements while stage remained unchanged and final repayments |
(14.3) |
(4.6) |
4.3 |
(14.6) |
|
Changes to model methodologies2 |
1.8 |
(2.1) |
(13.9) |
(14.2) |
|
Charge to the income statement |
4.0 |
0.9 |
27.4 |
32.3 |
|
Write offs |
(1.4) |
(1.5) |
(34.2) |
(37.1) |
|
At 31 January 2026 |
53.2 |
33.0 |
158.7 |
244.9 |
|
1. |
Repayments relate only to financial assets which transferred between stages during the year. Other repayments are shown in the line below. |
|
2. |
Changes relate to the updated model deployed for the Motor Finance business - see "Critical accounting judgements" in Note 1 for more information. |
|
Stage 1 £ million |
Stage 2 £ million |
Stage 3 £ million |
Total £ million |
|
|
Impairment provisions on loans and advances to customers held at amortised cost |
||||
|
At 1 August 2024 |
52.2 |
31.3 |
362.3 |
445.8 |
|
New financial assets originated |
46.0 |
- |
- |
46.0 |
|
Transfers to Stage 1 |
1.1 |
(4.3) |
(1.0) |
(4.2) |
|
Transfers to Stage 2 |
(13.4) |
30.6 |
(1.4) |
15.8 |
|
Transfers to Stage 3 |
(4.3) |
(11.4) |
88.0 |
72.3 |
|
Net remeasurement of expected credit losses arising from transfer of stages and repayments1 |
(16.6) |
14.9 |
85.6 |
83.9 |
|
Repayments and ECL movements while stage remained unchanged and final repayments |
(29.5) |
(10.9) |
27.0 |
(13.4) |
|
Changes to model methodologies |
1.4 |
0.5 |
(0.4) |
1.5 |
|
Charge to the income statement |
1.3 |
4.5 |
112.2 |
118.0 |
|
Write offs |
(2.9) |
(2.2) |
(309.0) |
(314.1) |
|
At 31 July 2025 |
50.6 |
33.6 |
165.5 |
249.7 |
|
1. |
Repayments relate only to financial assets which transferred between stages during the year. Other repayments are shown in the line below. |
|
Six months ended 31 January |
Year ended 31 July |
||
|
2026 £ million |
2025 £ million |
2025 £ million |
|
|
Impairment losses relating to loans and advances to customers held at amortised cost: |
|||
|
Charge to income statement arising from movement in impairment provisions |
32.3 |
59.0 |
118.0 |
|
Amounts written off directly to income statement and other costs, net of discount unwind on Stage 3 loans to interest income, and recoveries |
7.3 |
(11.7) |
(29.9) |
|
39.6 |
47.3 |
88.1 |
|
|
Impairment losses relating to other financial assets |
(0.1) |
0.8 |
4.7 |
|
Impairment losses on financial assets recognised in income statement |
39.5 |
48.1 |
92.8 |
Impairment losses on financial assets of £39.5 million (six months ended 31 January 2025: £48.1 million; year ended 31 July 2025 £92.8 million) include £nil in relation to Novitas (six months ended 31 January 2025: £0.9 million impairment loss; year ended 31 July 2025: an impairment credit of £6.8 million).
7. Debt securities
|
Fair value through profit or loss £ million |
Fair value through other comprehensive income £ million |
Amortised cost £ million |
Total £ million |
|
|
Sovereign and central bank debt |
- |
578.2 |
- |
578.2 |
|
Supranational, sub-sovereigns and agency ("SSA") bonds |
- |
145.1 |
- |
145.1 |
|
Covered bonds |
- |
105.6 |
- |
105.6 |
|
Other debt securities |
1.0 |
- |
3.6 |
4.6 |
|
At 31 January 2026 |
1.0 |
828.9 |
3.6 |
833.5 |
|
Fair value through profit or loss £ million |
Fair value through other comprehensive income £ million |
Amortised cost £ million |
Total £ million |
|
|
Sovereign and central bank debt |
- |
601.6 |
- |
601.6 |
|
Supranational, sub-sovereigns and agency ("SSA") bonds |
- |
146.2 |
- |
146.2 |
|
Covered bonds |
- |
105.6 |
- |
105.6 |
|
Other debt securities |
1.1 |
- |
4.7 |
5.8 |
|
At 31 July 2025 |
1.1 |
853.4 |
4.7 |
859.2 |
Movements on the book value of sovereign and central bank debt comprise:
|
Six months ended 31 January |
Year ended 31 July |
|
|
2026 £ million |
2025 £ million |
|
|
Sovereign and central bank debt at 1 August |
601.6 |
383.7 |
|
Additions |
318.8 |
512.4 |
|
Redemptions |
(350.0) |
(299.1) |
|
Currency translation differences |
0.1 |
2.2 |
|
Movement in value |
7.7 |
2.4 |
|
Sovereign and central bank debt at end of the period |
578.2 |
601.6 |
Movements on the book value of SSA bonds comprise:
|
Six months ended 31 January |
Year ended 31 July |
|
|
2026 £ million |
2025 £ million |
|
|
SSA bonds at 1 August |
146.2 |
145.5 |
|
Additions |
- |
- |
|
Redemptions |
- |
- |
|
Currency translation differences |
- |
0.4 |
|
Movement in value |
(1.1) |
0.3 |
|
SSA bonds at end of the period |
145.1 |
146.2 |
Movements on the book value of covered bonds comprise:
|
Six months ended 31 January |
Year ended 31 July |
|
|
2026 £ million |
2025 £ million |
|
|
Covered bonds 1 August |
105.6 |
187.7 |
|
Additions |
- |
15.5 |
|
Redemptions/disposals |
- |
(97.4) |
|
Currency translation differences |
- |
0.5 |
|
Movement in value |
- |
(0.7) |
|
Covered bonds at end of the period |
105.6 |
105.6 |
8. Intangible assets
|
Goodwill £ million |
Software £ million |
Intangible assets on acquisition £ million |
Group total £ million |
|
|
Cost |
||||
|
At 1 August 2024 |
150.8 |
348.7 |
57.4 |
556.9 |
|
Additions |
- |
15.1 |
- |
15.1 |
|
Disposals |
- |
(6.5) |
- |
(6.5) |
|
Reclassification to assets held for sale1 |
(47.0) |
(16.6) |
(51.7) |
(115.3) |
|
At 31 January 2025 |
103.8 |
340.7 |
5.7 |
450.2 |
|
Additions |
- |
10.5 |
- |
10.5 |
|
Disposals |
- |
0.4 |
- |
0.4 |
|
Reclassification to assets held for sale2 |
(67.6) |
(20.4) |
- |
(88.0) |
|
At 31 July 2025 |
36.2 |
331.2 |
5.7 |
373.1 |
|
Additions |
- |
14.1 |
- |
14.1 |
|
Disposals |
(1.3) |
(7.2) |
- |
(8.5) |
|
At 31 January 2026 |
34.9 |
338.1 |
5.7 |
378.7 |
|
Accumulated amortisation and impairments |
||||
|
At 1 August 2024 |
47.9 |
195.3 |
47.7 |
290.9 |
|
Amortisation charge for the year |
- |
19.8 |
0.7 |
20.5 |
|
Impairment charge for the year |
2.1 |
1.9 |
- |
4.0 |
|
Disposals |
- |
(4.1) |
- |
(4.1) |
|
Reclassification to assets held for sale 1 |
(3.5) |
(9.2) |
(46.0) |
(58.7) |
|
At 31 January 2025 |
46.5 |
203.7 |
2.4 |
252.6 |
|
Amortisation charge for the year |
- |
18.5 |
0.1 |
18.6 |
|
Impairment charge for the year |
14.5 |
0.1 |
- |
14.6 |
|
Disposals |
- |
(1.2) |
- |
(1.2) |
|
Reclassification to assets held for sale 2 |
(58.9) |
(18.9) |
- |
(77.8) |
|
At 31 July 2025 |
2.1 |
202.2 |
2.5 |
206.8 |
|
Amortisation charge for the year |
- |
16.9 |
0.1 |
17.0 |
|
Disposals |
(1.3) |
(6.8) |
- |
(8.1) |
|
At 31 January 2026 |
0.8 |
212.3 |
2.6 |
215.7 |
|
Net book value at 31 January 2026 |
34.1 |
125.8 |
3.1 |
163.0 |
|
Net book value 31 July 2025 |
34.1 |
129.0 |
3.2 |
166.3 |
|
Net book value at 31 January 2025 |
57.3 |
137.0 |
3.3 |
197.6 |
|
Net book value at 1 August 2024 |
102.9 |
153.4 |
9.7 |
266.0 |
|
1. |
Intangible assets relating to Close Brothers Asset Management were reclassified to assets held for sale at 31 January 2025 - see Note 20. |
|
2. |
Intangible assets relating to Winterflood Securities and Close Brewery Rentals were reclassified to assets held for sale at 31 July 2025 - see Note 20. |
Software includes assets under development of £33.8 million (31 July 2025: £30.6 million).
Intangible assets on acquisition relate to customer relationships and are amortised over a period of 16.7 years.
In the six months ended 31 January 2026, £17.0 million (six months ended 31 January 2025: £19.1 million; year ended 31 July 2025: £37.4 million) of the amortisation charge, relating to continuing operations, is included in the consolidated income statement within other administrative expenses. The residual is included within profit/(loss) from discontinued operations, net of tax in the consolidated income statement.
Impairment tests for goodwill and other intangible assets
At 31 January 2026, goodwill has been allocated to seven (31 July 2025: eight) individual cash generating units ("CGUs"). All seven relate to the Commercial, Retail and Property operating segments, previously collectively known as the Banking division. At 31 July 2025, a further CGU related to the Winterflood Securities division ("Winterflood"). However, as disclosed in Note 20, the group completed the sale of Winterflood on 1 December 2025 and therefore the CGU and associated goodwill have been derecognised from the balance sheet.
Goodwill is allocated to the CGU in which the historical acquisition occurred and hence the goodwill originated. Goodwill impairment reviews are carried out at least annually by assessing the recoverable amount of the group's CGUs, which is the higher of fair value less costs to sell and value in use.
At 31 July 2025, impairment assessments were performed for all CGUs and in relation to the seven existing CGUs, no goodwill impairment was identified, with the recoverable amount of each CGU calculated to exceed carrying value. At 31 January 2026, the group has performed a review of relevant indicators of impairment and is satisfied that there are no indicators requiring a further impairment analysis.
Refer to Note 14 "Intangible assets" of the 2025 Annual Report for further information on the impairment assessment performed. In addition, refer to Note 2 "Segmental analysis" for further information on the performance of each segment in the six months ended 31 January 2026.
9. Property, plant and equipment
|
Leasehold property £ million |
Fixtures, fittings and equipment £ million |
Assets held under operating leases £ million |
Motor vehicles £ million |
Right of use assets¹ £ million |
Total £ million |
|
|
Cost |
||||||
|
At 1 August 2024 |
22.4 |
65.1 |
441.9 |
0.4 |
92.9 |
622.7 |
|
Additions |
0.5 |
2.2 |
28.4 |
- |
5.1 |
36.2 |
|
Disposals |
(0.5) |
(3.6) |
(37.7) |
- |
(5.2) |
(47.0) |
|
Reclassification to assets held for sale2 |
(5.2) |
(6.8) |
- |
- |
(11.0) |
(23.0) |
|
At 31 January 2025 |
17.2 |
56.9 |
432.6 |
0.4 |
81.8 |
588.9 |
|
Additions |
2.7 |
0.5 |
11.9 |
- |
5.2 |
20.3 |
|
Disposals |
(12.8) |
(0.6) |
(38.2) |
- |
(21.3) |
(72.9) |
|
Reclassification to assets held for sale3 |
(0.6) |
(21.9) |
(80.1) |
(0.1) |
(15.6) |
(118.3) |
|
At 31 July 2025 |
6.5 |
34.9 |
326.2 |
0.3 |
50.1 |
418.0 |
|
Additions |
0.9 |
0.6 |
17.4 |
- |
1.5 |
20.4 |
|
Disposals |
(0.2) |
(0.6) |
(26.4) |
(0.1) |
(3.3) |
(30.6) |
|
At 31 January 2026 |
7.2 |
34.9 |
317.2 |
0.2 |
48.3 |
407.8 |
|
Accumulated depreciation and impairments |
||||||
|
At 1 August 2024 |
17.0 |
36.6 |
174.0 |
0.3 |
45.2 |
273.1 |
|
Depreciation and impairment charges for the year |
1.2 |
4.7 |
24.1 |
- |
7.8 |
37.8 |
|
Disposals |
(0.2) |
(3.6) |
(29.1) |
- |
(4.3) |
(37.2) |
|
Reclassification to assets held for sale2 |
(3.2) |
(4.7) |
- |
- |
(6.5) |
(14.4) |
|
At 31 January 2025 |
14.8 |
33.0 |
169.0 |
0.3 |
42.2 |
259.3 |
|
Depreciation and impairment charges for the year |
0.1 |
3.5 |
54.2 |
- |
5.5 |
63.3 |
|
Disposals |
(12.8) |
(0.5) |
(24.2) |
- |
(20.8) |
(58.3) |
|
Reclassification to assets held for sale3 |
(0.6) |
(13.8) |
(39.1) |
(0.1) |
(2.1) |
(55.7) |
|
At 31 July 2025 |
1.5 |
22.2 |
159.9 |
0.2 |
24.8 |
208.6 |
|
Depreciation and impairment charges for the year |
0.8 |
2.0 |
19.7 |
0.1 |
4.2 |
26.8 |
|
Disposals |
(0.1) |
(0.6) |
(20.7) |
(0.2) |
(4.0) |
(25.6) |
|
At 31 January 2026 |
2.2 |
23.6 |
158.9 |
0.1 |
25.0 |
209.8 |
|
Net book value at 31 January 2026 |
5.0 |
11.3 |
158.3 |
0.1 |
23.3 |
198.0 |
|
Net book value at 31 July 2025 |
5.0 |
12.7 |
166.3 |
0.1 |
25.3 |
209.4 |
|
Net book value at 31 January 2025 |
2.4 |
23.9 |
263.6 |
0.1 |
39.6 |
329.6 |
|
Net book value at 1 August 2024 |
5.4 |
28.5 |
267.9 |
0.1 |
47.7 |
349.6 |
|
1. |
Right of use assets primarily relate to the group's leasehold properties. |
|
2. |
Property, plant and equipment relating to Close Brothers Asset Management were reclassified to assets held for sale at 31 January 2025 - see Note 20. |
|
3. |
Property, plant and equipment relating to Winterflood Securities and Close Brewery Rentals were reclassified to assets held for sale at 31 July 2025 - see Note 20. |
10. Financial liabilities
|
On demand £ million |
Within three months £ million |
Between three months and one year £ million |
Between one and two years £ million |
Between two and five years £ million |
After more than five years £ million |
Total £ million |
|
|
Deposits by banks |
26.6 |
- |
- |
- |
- |
- |
26.6 |
|
Deposits by customers |
1,562.8 |
2,648.4 |
2,372.9 |
700.4 |
589.5 |
- |
7,874.0 |
|
Loans and overdrafts from banks |
1.3 |
5.1 |
- |
- |
- |
- |
6.4 |
|
Debt securities in issue |
- |
41.7 |
425.9 |
387.1 |
1,083.9 |
- |
1,938.6 |
|
Subordinated loan capital1 |
- |
1.4 |
(0.1) |
- |
- |
197.9 |
199.2 |
|
At 31 January 2026 |
1,590.7 |
2,696.6 |
2,798.7 |
1,087.5 |
1,673.4 |
197.9 |
10,044.8 |
|
On demand £ million |
Within three months £ million |
Between three months and one year £ million |
Between one and two years £ million |
Between two and five years £ million |
After more than five years £ million |
Total £ million |
|
|
Deposits by banks |
9.3 |
78.8 |
- |
- |
- |
- |
88.1 |
|
Deposits by customers |
1,161.4 |
2,640.3 |
3,533.7 |
852.9 |
611.0 |
- |
8,799.3 |
|
Loans and overdrafts from banks |
1.5 |
- |
- |
- |
- |
- |
1.5 |
|
Debt securities in issue |
- |
56.5 |
124.1 |
974.2 |
503.2 |
333.3 |
1,991.3 |
|
Subordinated loan capital1 |
- |
1.4 |
(0.3) |
- |
- |
194.4 |
195.5 |
|
At 31 July 2025 |
1,172.2 |
2,777.0 |
3,657.5 |
1,827.1 |
1,114.2 |
527.7 |
11,075.7 |
|
1. |
Comprises an issuance of £200.0 million with a contractual maturity date of 2031 and optional prepayment date of 2026. See Note 21 for information on a post balance sheet event relating to this instrument. |
Assets pledged and received as collateral
The group pledges assets for repurchase agreements and securities borrowing agreements which are generally conducted under terms that are customary to standard borrowing contracts.
As at 31 January 2026, the group is a participant of the Bank of England's Short-Term Repo ("STR"), Indexed Long Term Repo ("ILTR") and Discount Window Facility ("DWF").
Under these schemes, UK gilts with a market value of £7.2 million (31 July 2025: £nil) were positioned as collateral with the Bank of England, against which £5.0 million (31 July 2025: £nil) was drawn from the ILTR.
The group has securitised without recourse and restrictions £1,394.0 million (31 July 2025: £1,544.8 million) of its insurance premium and motor loan receivables in return for cash and asset-backed securities in issue of £1,189.4 million (31 July 2025: £1,323.4 million), of which £158.1 million (31 July 2025: £245.9 million) is retained by the group. This includes the £nil (31 July 2025: £nil) retained notes positioned as collateral with the Bank of England.
As the group has retained exposure to substantially all the risks and rewards of the above receivables, it continues to recognise these assets in loans and advances to customers on its consolidated balance sheet.
The majority of loans and advances to customers are secured against specific assets. Consistent and prudent lending criteria are applied across the whole loan book with emphasis on the quality of the security provided.
11. Other equity instrument
Other equity instrument comprises the group's £200.0 million Fixed Rate Reset Perpetual Subordinated Contingent Convertible Securities, or Additional Tier 1 capital ("AT1"), issued on 29 November 2023. These AT1 securities are classified as an equity instrument under IAS 32 "Financial Instruments: Presentation" with the proceeds recognised in equity net of transaction costs of £2.4 million.
These securities carry a coupon of 11.125%, payable semi-annually on 29 May and 29 November of each year, and have a first reset date on 29 May 2029. One coupon payment totalling £11.1 million was made on 1 December 2025. The securities include a conversion trigger of 7.0% Common Equity Tier 1 capital ratio and are callable any time in the six-month period prior to and including the first reset date or on each reset date occurring every five years thereafter.
12. Capital
|
31 January 2026 |
31 July 2025 |
|
|
£ million |
£ million |
|
|
CET1 capital |
||
|
Shareholders' equity per balance sheet |
1,662.8 |
1,735.5 |
|
Regulatory adjustments to CET1 capital |
||
|
Contingent convertible securities recognised as AT1 capital1 |
(197.6) |
(197.6) |
|
Intangible assets, net of associated deferred tax liabilities |
(162.5) |
(176.1) |
|
Foreseeable AT1 coupon charges2 |
(3.8) |
(3.8) |
|
Cash flow hedging reserve |
(2.7) |
(3.8) |
|
Pension asset, net of associated deferred tax liabilities |
(0.1) |
(0.1) |
|
Prudent valuation adjustment |
(0.9) |
(1.0) |
|
Securitisation positions which can alternatively be subject to a 1,250% risk weight3 |
(26.8) |
(11.3) |
|
Deferred tax assets that rely on future profitability |
(2.1) |
- |
|
IFRS 9 transitional arrangements4 |
- |
6.3 |
|
CET1 capital5 |
1,266.3 |
1,348.1 |
|
Additional tier 1 capital |
200.0 |
200.0 |
|
Total tier 1 capital5 |
1,466.3 |
1,548.1 |
|
Tier 2 capital - subordinated debt |
200.0 |
200.0 |
|
Total regulatory capital5 |
1,666.3 |
1,748.1 |
|
RWAs |
||
|
Credit and counterparty credit risk |
8,222.2 |
8,864.4 |
|
Operational risk |
660.3 |
820.1 |
|
Market risk |
- |
114.0 |
|
8,882.5 |
9,798.5 |
|
|
CET1 capital ratio5 |
14.3% |
13.8% |
|
Tier 1 capital ratio5 |
16.5% |
15.8% |
|
Total capital ratio5 |
18.8% |
17.8% |
|
1. |
The contingent convertible securities are classified as an equity instrument for accounting but treated as AT1 for regulatory capital purposes, see note 11. |
|
2. |
Under CRR Article 26, a deduction for foreseeable charges has been recognised at 31 January 2026 and 31 July 2025. The deduction at 31 January 2026 reflects charges for the coupon on the group's contingent convertible securities. |
|
3. |
Under CRR Article 36, a deduction for securitisations positions, which are subject to a 1,250% risk weight, but alternatively are allowed to be deducted from CET1 has been recognised. For more information on this securitisation with the British Business Bank, refer to the Group Capital section of the Financial Overview. |
|
4. |
The group elected to apply IFRS 9 transitional arrangements for 31 July 2025, which allow the capital impact of expected credit losses to be phased in over the transitional period. The transitional arrangements ended on 31 July 2025. |
|
5. |
Capital ratios at 31 July 2025 shown after applying IFRS 9 transitional arrangements and the CRR transitional and qualifying own funds arrangements in force at the time. Without their application, at 31 July 2025 the CET1 capital ratio would be 13.7%, tier 1 capital ratio 15.7% and total capital ratio 17.8%. |
The following table shows the movement in CET1 capital during the year:
|
Six months ended 31 January |
Year ended 31 July |
||
|
2026 £ million |
2025 £ million |
2025 £ million |
|
|
CET1 capital at 1 August |
1,348.1 |
1,374.8 |
1,374.8 |
|
(Loss) in the year attributable to shareholders |
(64.4) |
(111.8) |
(77.9) |
|
AT1 coupon charges |
(11.1) |
(11.2) |
(22.3) |
|
IFRS 9 transitional arrangements |
(6.3) |
(5.9) |
(5.8) |
|
Decrease in intangible assets, net of associated deferred tax liabilities |
13.6 |
11.5 |
87.8 |
|
Deferred tax assets that rely on future profitability |
(2.1) |
- |
- |
|
Other movements in reserves recognised for CET1 capital |
3.9 |
(3.1) |
2.4 |
|
Other movements in adjustments from CET1 capital |
(15.4) |
3.0 |
(10.9) |
|
CET1 capital at end of period |
1,266.3 |
1,257.3 |
1,348.1 |
13. Other liabilities
Provisions are made for claims and other items which arise in the normal course of business. Claims may arise in respect of legal and regulatory matters, while other items largely relate to property dilapidations and employee benefits. A provision is recognised where it is determined that there is a present obligation arising from a past event, payment is probable, and the amount can be estimated reliably. The timing and/or outcome of these claims and other items are uncertain. Provisions recognised on the balance sheet of £340.7 million (31 July 2025: £210.3 million) primarily relate to the following matters.
Provision in relation to motor finance commissions
An overview of the developments in relation to motor finance commissions is set out in the "Historical motor finance commission arrangements" section of this report. In the previous financial year, a detailed assessment against IAS 37 "Provisions, Contingent Liabilities and Contingent Assets" determined that the criteria for a provision had been met and a provision of £165.0 million was recognised based on a range of probability-weighted redress scenarios. As at 31 July 2025, the provision held was £163.9 million, reflecting some utilisation in relation to costs, partly offset by an unwinding of the discount relating to the time value of money.
Following the publication of the Financial Conduct Authority ("FCA")'s consultation paper on 7 October 2025 on a proposed industry-wide redress scheme in respect of motor finance commissions, the group carried out a review of the potential financial impact of the proposed scheme. The FCA consultation provided more detail on the proposed redress scheme, including the commission models that would be in scope, how unfairness would be assessed, and the proposed approach to calculation of redress.
While uncertainty in relation to the outcome of the consultation remains, taking into account all available information, the group updated its range of probability-weighted scenarios to include the consultation proposals as well as potential alternative schemes which might arise following the consultation, resulting in an additional provision charge of £135.0 million in October 2025, increasing the total provision charge to date to £300.0 million. This reflects a greater likelihood that more historical cases, particularly those involving Discretionary Commission Arrangements, would qualify for redress, as well as the possibility of the proposed redress methodology resulting in higher compensation levels than reflected in some of the group's previous range of scenarios. The provision envisages a redress scheme commencing in mid-2026, in line with current guidance. As at 31 January 2026, the provision held was £293.6 million, reflecting some utilisation in relation to costs, partly offset by an unwinding of the discount relating to the time value of money.
A number of assumptions have been applied in the calculation of the provision, with certain assumptions representing key sources of estimation uncertainty. These relate to the final scheme rules, customer claim rates, costs to administer the scheme, scenario weightings and any further legal, regulatory or industry developments. A 10% relative increase or decrease in the assumed claim rates would result in a £27.5 million increase or decrease in the estimated provision. Changes in assumptions listed above may also result in material changes to the estimated provision.
The estimated provision is the outcome of a thorough assessment, representing the group's current evaluation based on available information and recent developments. There remains significant uncertainty over the FCA's proposals in relation to a redress scheme and a significant number of responses were submitted to the consultation. Therefore the ultimate cost to the group could be materially higher or lower than the provision taken and remains subject to further clarity from the FCA on the scope and design of any redress scheme and any further legal, regulatory or industry developments.
During the current period, the group incurred a net credit of £0.9 million (six months ended 31 January 2025: costs of £8.4 million; year ended 31 July 2025: costs of £18.7 million) in relation to motor finance commissions. This includes legal costs and fees that do not directly relate to the potential redress exercise for which the provision was created, the unwinding of the time value discount in relation to the provision and were more than offset by associated insurance recoveries recognised in the period. In the prior period, these expenses also included complaints handling costs incurred before the provision was established. These costs, as well as the £135.0 million provision described above, do not reflect underlying trading performance and therefore have been presented as separate adjusting items and excluded from adjusted operating profit by management.
Provision in relation to early settlements in Motor Finance
Following the identification of historical deficiencies in certain operational processes related to early settlement of loans in the Motor Finance business, the group recognised a separate provision of £33.0 million at 31 July 2025 in relation to a proactive customer remediation programme to be implemented by the group.
As at 31 January 2026, the provision held was £32.2 million, reflecting some utilisation in relation to costs, partly offset by an unwinding of the discount relating to the time value of money, and it continues to reflect management's best estimate of the cost of remediation in relation to impacted customers. The provision includes compensatory interest and associated administrative costs based on the information currently available and will be refined as the scope and design of the remediation programme are finalised. Since the year end, the group has been refining the data and planning the remediation exercise which is expected to commence towards the end of the 2026 financial year.
14. Contingent liabilities
In the normal course of the group's business, there may be other contingent liabilities relating to complaints, legal proceedings or regulatory reviews. These cases are not currently expected to have a material impact on the group.
15. Consolidated cash flow statement reconciliation
|
Six months ended 31 January |
Year ended 31 July |
||
|
2026 |
2025 |
2025 |
|
|
£ million |
£ million |
£ million |
|
|
(a) Reconciliation of operating loss before tax to net cash inflow from operating activities |
|||
|
Operating loss before tax from continuing operations |
(65.5) |
(102.2) |
(122.4) |
|
Operating profit before tax from discontinued operations |
1.4 |
0.9 |
51.2 |
|
Tax paid |
(7.5) |
(10.7) |
(28.1) |
|
Depreciation, amortisation and impairment |
45.0 |
58.3 |
159.4 |
|
Impairment losses on financial assets |
39.5 |
48.2 |
92.7 |
|
Provision in relation to motor finance commissions excluding cash paid |
133.0 |
165.0 |
161.4 |
|
Complaints handling and other operational and legal costs incurred excluding cash paid in relation to motor finance commissions |
(5.3) |
- |
5.6 |
|
Provision in relation to early settlements in Motor Finance |
- |
- |
33.0 |
|
Gain on disposal of CBAM excluding cash paid in relation to transaction costs |
- |
- |
(67.6) |
|
Gain on disposal of Winterflood Securities excluding cash paid in relation to transaction costs |
(4.2) |
- |
- |
|
Gain of disposal of Brewery excluding cash paid in relation to transaction costs |
(6.6) |
- |
- |
|
Amortisation of de-designated cash flow hedges |
(0.9) |
(9.0) |
(11.4) |
|
Decrease/(increase) in: |
|||
|
Interest receivable and prepaid expenses |
13.2 |
(4.9) |
4.8 |
|
Net settlement balances and trading positions |
(24.2) |
(2.0) |
3.8 |
|
Net money broker loans against stock advanced |
25.2 |
4.6 |
(7.7) |
|
Decrease in interest payable and accrued expenses |
(8.2) |
(14.3) |
(0.8) |
|
Net cash inflow from trading activities |
134.9 |
133.9 |
273.9 |
|
Cash inflow/(outflow) arising from changes in: |
|||
|
Loans and advances to banks not repayable on demand |
10.8 |
- |
1.4 |
|
Loans and advances to customers |
176.3 |
193.4 |
196.8 |
|
Assets let under operating leases |
(12.1) |
(20.2) |
(20.3) |
|
Sovereign and central bank debt |
31.2 |
76.7 |
(213.3) |
|
Covered bonds |
- |
59.0 |
81.9 |
|
Deposits by banks |
(62.1) |
(43.7) |
(52.1) |
|
Deposits by customers |
(926.5) |
36.7 |
100.1 |
|
Loans and overdrafts from banks |
1.6 |
30.4 |
(148.8) |
|
Debt securities in issue (net) |
(62.5) |
(121.9) |
(18.4) |
|
Derivative financial instruments (net) |
1.0 |
- |
1.0 |
|
Other assets less other liabilities1 |
30.0 |
1.6 |
39.0 |
|
Net cash (outflow)/inflow from operating activities |
(677.4) |
346.0 |
241.2 |
|
(b) Analysis of net cash outflow in respect of the purchase of subsidiaries |
|||
|
Purchase of subsidiaries, net of cash acquired |
- |
(0.5) |
(0.5) |
|
(c) Analysis of net cash inflow in respect of the sale of subsidiaries |
|||
|
Cash consideration received from the disposal of Winterflood Securities |
103.6 |
- |
- |
|
Cash consideration received from the disposal of Close Brewery Rentals Limited |
8.1 |
- |
- |
|
Cash consideration received from the disposal of Close Brothers Asset Management |
- |
- |
146.4 |
|
Total cash consideration received |
111.7 |
- |
146.4 |
|
Cash received in respect of amounts owed by disposed entities, net of cash and cash equivalents disposed of |
10.7 |
- |
(42.4) |
|
122.4 |
- |
104.0 |
|
|
(d) Analysis of cash and cash equivalents2 |
|||
|
Cash and balances at central banks |
1,387.0 |
1,852.5 |
1,917.2 |
|
Loans and advances to banks |
116.3 |
292.1 |
184.6 |
|
1,503.3 |
2,144.6 |
2,101.8 |
|
|
1. |
Net cash inflow in the period includes £48.5 million received for an insurance settlement relating to the loans and advances to customers of Novitas. |
|
2. |
Excludes £21.1 million (31 January 2025: £33.2 million, 31 July 2025: £31.9 million) of cash reserve accounts and cash held in trust. |
During the period ended 31 January 2026, the non-cash changes on debt financing amounted to £15.7 million (six months ended 31 January 2025: £16.1 million, year ended 31 July 2025: £32.2 million) arising largely from interest accretion and fair value hedging movements.
16. Fair value of financial assets and liabilities
The fair values of the group's subordinated loan capital and debt securities in issue are set out below.
|
31 January 2026 |
31 July 2025 |
||||
|
Fair value £ million |
Carrying value £ million |
Fair value £ million |
Carrying value £ million |
||
|
Subordinated loan capital |
199.6 |
199.2 |
193.5 |
195.5 |
|
|
Debt securities in issue |
1,962.5 |
1,938.6 |
2,013.2 |
1,991.3 |
|
The fair value of gross loans and advances to customers at 31 January 2026 is estimated to be £9,286.7 million (31 July 2025: £9,543.4 million), with a carrying value of £9,241.3 million (31 July 2025: £9,459.4 million). The fair value of deposits by customers is estimated to be £7,879.0 million (31 July 2025: £8,798.2 million), with a carrying value of £7,874.0 million (31 July 2025 : £8,799.3 million). These estimates are based on simplified assumptions and inputs and may differ to actual amounts received or paid. The differences between fair value and carrying value are not considered to be significant, and are consistent with management's expectations given the nature of the business and the short average tenor of the instruments. However, the differences have decreased in comparison to the prior year in line with market interest rates.
The group holds financial instruments that are measured at fair value subsequent to initial recognition. Each instrument has been categorised within one of three levels using a fair value hierarchy that reflects the significance of the inputs used in making the measurements. These levels are based on the degree to which the fair value is observable.
The instruments included within the three levels, the valuation methodologies and the most significant inputs are consistent with those described in Note 26 of the 2025 Annual Report. The group believes that there is no reasonably possible change to the inputs used in the valuation of these positions which would have a material effect on the group's consolidated income statement.
The tables below show the classification of financial instruments held at fair value into the valuation hierarchy.
|
Level 1 £ million |
Level 2 £ million |
Level 3 £ million |
Total £ million |
|
|
At 31 January 2026 |
||||
|
Assets |
||||
|
Loans and advances to customers held at FVTPL |
- |
- |
11.7 |
11.7 |
|
Debt securities: |
||||
|
Sovereign and central bank debt |
578.2 |
- |
- |
578.2 |
|
SSA bonds |
145.1 |
- |
- |
145.1 |
|
Covered bonds |
105.6 |
- |
- |
105.6 |
|
Derivative financial instruments |
- |
104.6 |
2.6 |
107.2 |
|
Contingent consideration |
- |
- |
21.1 |
21.1 |
|
Other assets |
- |
- |
1.0 |
1.0 |
|
828.9 |
104.6 |
36.4 |
969.9 |
|
|
Liabilities |
||||
|
Short positions: |
||||
|
Derivative financial instruments |
- |
80.9 |
2.7 |
83.6 |
|
- |
80.9 |
2.7 |
83.6 |
|
Level 1 £ million |
Level 2 £ million |
Level 3 £ million |
Total £ million |
|
|
At 31 July 2025 |
||||
|
Assets |
||||
|
Loans and advances to customers held at FVTPL |
- |
- |
11.8 |
11.8 |
|
Debt securities: |
||||
|
Sovereign and central bank debt |
601.6 |
- |
- |
601.6 |
|
SSA bonds |
146.2 |
- |
- |
146.2 |
|
Covered bonds |
105.6 |
- |
- |
105.6 |
|
Derivative financial instruments |
- |
99.1 |
4.0 |
103.1 |
|
Contingent consideration |
- |
- |
21.1 |
21.1 |
|
Other assets |
- |
- |
1.1 |
1.1 |
|
853.4 |
99.1 |
38.0 |
990.5 |
|
|
Liabilities |
||||
|
Short positions: |
||||
|
Derivative financial instruments |
- |
100.5 |
4.2 |
104.7 |
|
- |
100.5 |
4.2 |
104.7 |
During the period, there were no transfers between Levels 1, 2 and 3 (2025: no transfers).
Movements in financial instruments categorised as Level 3 were:
|
Loans and advances to customers held at FVTPL £ million |
Derivative financial assets £ million |
Derivative financial liabilities £ million |
Equity shares £ million |
Contingent consideration £ million |
Other assets £ million |
Total £ million |
|
|
At 1 August 2024 |
11.8 |
6.1 |
(6.4) |
0.1 |
(1.8) |
0.8 |
10.6 |
|
Total (losses)/gains recognised in the consolidated income statement |
- |
(1.7) |
1.8 |
- |
(0.2) |
- |
(0.1) |
|
Purchases, issues, originations and transfers in |
4.9 |
- |
- |
- |
- |
0.6 |
5.5 |
|
Sales, settlements and transfers out |
- |
- |
- |
- |
- |
- |
- |
|
Reclassification to liabilities held for sale |
- |
- |
- |
- |
2.0 |
- |
2.0 |
|
At 31 January 2025 |
16.7 |
4.4 |
(4.6) |
0.1 |
- |
1.4 |
18.0 |
|
Total gains/(losses) recognised in the consolidated income statement |
1.5 |
(0.4) |
0.4 |
- |
0.2 |
- |
1.7 |
|
Purchases, issues, originations and transfers in |
(1.3) |
- |
- |
- |
- |
(0.3) |
(1.6) |
|
Sales, settlements and transfers out |
(5.1) |
- |
- |
(0.1) |
22.9 |
- |
17.7 |
|
Reclassification to liabilities held for sale |
- |
- |
- |
- |
(2.0) |
- |
(2.0) |
|
At 31 July 2025 |
11.8 |
4.0 |
(4.2) |
- |
21.1 |
1.1 |
33.8 |
|
Total gains/(losses) recognised in the consolidated income statement |
0.7 |
(1.4) |
1.5 |
- |
- |
- |
0.8 |
|
Purchases, issues, originations and transfers in |
2.0 |
- |
- |
- |
- |
(0.1) |
1.9 |
|
Sales, settlements and transfers out |
(2.8) |
- |
- |
- |
- |
- |
(2.8) |
|
At 31 January 2026 |
11.7 |
2.6 |
(2.7) |
- |
21.1 |
1.0 |
33.7 |
The gains recognised in the consolidated income statement relating to Level 3 instruments held at 31 January 2026 amounted to £0.8 million (31 January 2025: £1.3 million gain; 31 July 2025: £1.6 million gain).
17. Additional support for customers
Forbearance
Forbearance occurs when a customer is experiencing difficulty in meeting their financial commitments and a concession is granted, by changing the terms of the financial arrangement, which would not otherwise be considered. This arrangement can be temporary or permanent, depending on the customer's circumstances. The group reports on forborne exposures as either performing or non-performing in line with regulatory requirements. A forbearance policy is maintained to ensure the necessary processes are in place to enable consistently fair treatment of all customers and that each is managed based on their individual circumstances. The arrangements agreed with customers will aim to create a sustainable and affordable financial position, thereby reducing the likelihood of suffering a credit loss. The forbearance policy is periodically reviewed to ensure it remains effective.
The group offers a range of concessions to support customers which vary depending on the product and the customer's status. Such concessions include grace periods/payment moratoria, extensions of the loan term, and refinancing.
Loans are classified as forborne at the time a customer in financial difficulty is granted a concession and the loan will remain treated and recorded as forborne until the following exit conditions are met:
|
• |
The loan is considered as performing and there is no past-due amount according to the amended contractual terms; |
|
• |
a minimum two-year probation period has passed from the date the forborne exposure was considered as performing, during which time regular and timely payments have been made; and |
|
• |
none of the customer's exposures with Close Brothers are more than 30 days past due at the end of the probation period. |
At 31 January 2026, the gross carrying amount of exposures with forbearance measures was £424.5 million (31 July 2025: £406.1 million). The main driver of this increase was the Commercial division where we saw a change in composition of forborne stock during the period. Across other businesses, forbearance levels have been broadly stable, reflecting continued macroeconomic challenges and enduring cost of living pressures on customers, and project-specific issues in our Property business.
An analysis of forborne loans is shown in the table below:
|
31 January 2026 |
31 July 2025 |
|
|
Gross loans and advances to customers (£ million) |
9,486.2 |
9,709.1 |
|
Forborne loans (£ million) |
424.5 |
406.1 |
|
Forborne loans as a percentage of gross loans and advances to customers (%) |
4.5% |
4.2% |
|
Provision on forborne loans (£ million) |
109.7 |
113.8 |
|
Number of customers supported |
16,388 |
15,882 |
The following is a breakdown of forborne loans by segment:
|
31 January 2026 |
31 July 2025 |
|
|
Commercial |
137.6 |
112.9 |
|
Retail |
50.1 |
50.6 |
|
Property |
236.8 |
242.6 |
|
Total |
424.5 |
406.1 |
The following is a breakdown of the number of customers supported by segment:
|
31 January 2026 |
31 July 2025 |
|
|
Commercial |
881 |
948 |
|
Retail |
15,461 |
14,880 |
|
Property |
46 |
54 |
|
Total |
16,388 |
15,882 |
The following is a breakdown of forborne loans by concession type, based on the updated approach:
|
31 January 2026 |
31 July 2025 £ million |
|
|
Grace period/payment moratorium |
120.5 |
136.3 |
|
Extension of maturity/term |
150.2 |
139.5 |
|
Rescheduled payments |
33.0 |
32.7 |
|
Other forbearance measures1 |
120.8 |
97.6 |
|
Total |
424.5 |
406.1 |
|
1. |
Includes £0.3 million of debt forgiveness concessions (31 July 2025: £0.2 million). |
Government lending schemes
Since the pandemic period, following accreditation, customers have been offered facilities under various UK and Irish government-introduced loan schemes, thereby enabling the group to maximise its support to small businesses. At 31 January 2026, there are 3,016 (31 July 2025: 3,350) remaining facilities, with residual balance of £450.6 million (31 July 2025: £461.6 million) following further repayments across the Commercial businesses.
A regular reporting cycle covering these facilities is maintained to monitor performance. To date, a number of claims have been made and payments received under the government guarantee.
18. Interest rate risk
The group recognises three main sources of interest rate risk in the banking book ("IRRBB") which could adversely impact future income or the value of the balance sheet:
|
• |
Repricing risk - the risk presented by assets and liabilities that reprice at different times; |
|
• |
Embedded optionality risk - the risk presented by contractual terms embedded into certain assets and liabilities; and |
|
• |
Basis risk - the risk presented by a mismatch in the reference interest rate for assets and liabilities. |
IRRBB is assessed and measured on a behavioural basis by applying key behavioural and modelling assumptions including, but not limited to, those related to fixed rate loans subject to prepayment risk, the behaviour of non-maturity assets and liabilities, the treatment of own equity, and the expectation of embedded interest rate options. This assessment is performed across a range of regulatory prescribed and internal interest rate shock scenarios approved by the Asset and Liability Committee.
Two measures are used for measuring IRRBB, namely Earnings at Risk ("EaR") and Economic Value ("EV"):
|
• |
EaR measures short-term impacts to earnings, highlighting any earnings sensitivity, should interest rates change unexpectedly. |
|
• |
EV measures longer-term earnings sensitivity due to interest rate changes, highlighting the potential future sensitivity of earnings, and any risk to capital. |
EaR impact
The table below sets out the assessed impact on group net interest income over a 12-month period from interest rate changes. The results shown are for an instantaneous and parallel change in interest rates at 31 January 2026:
|
31 January 2026 |
31 July 2025 |
|
|
0.5% increase |
2.4 |
2.1 |
|
2.5% increase |
11.5 |
10.1 |
|
0.5% decrease |
(2.4) |
(2.1) |
|
2.5% decrease |
(10.0) |
(9.3) |
The EaR measure is a combination of the group's repricing profile and the embedded optionality risk, which is negligible in the current interest rate environment. The group also monitors any potential earning exposure from basis mismatches between its lending and funding activities at a monthly cadence. To provide a clearer assessment of the group's exposure to interest rate changes, basis risk is excluded from the EaR numbers.
The EaR reflects the group's strategy to manage and minimise interest rate risk, to that required to operate efficiently. The group's EaR at 31 January 2026 was managed within the group's risk appetites.
EV impact
The table below sets out the assessed impact on group EV, which measures the potential change in the balance sheet value following an instantaneous and parallel change in interest rates at 31 January 2026:
|
31 January 2026 |
31 July 2025 |
|
|
0.5% increase |
1.1 |
1.0 |
|
2.5% increase |
5.3 |
4.8 |
|
0.5% decrease |
(1.0) |
(0.9) |
|
2.5% decrease |
0.1 |
(0.3) |
The group's EV at 31 January 2026 reflects its policy to ensure exposure to interest rate shocks is managed within the group's risk appetites. The EV measure is a combination of the repricing profile and the embedded optionality to cover interest rate floors within the group's lending and borrowing activities.
19. Related party transactions
Related party transactions, including salary and benefits provided to directors and key management, did not have a material effect on the financial position or performance of the group during the period. There were no changes to the type and nature of the related party transactions disclosed in the 2025 Annual Report that could have a material effect on the financial position and performance of the group in the six months to 31 January 2026.
20. Discontinued operations and assets and liabilities classified as held for sale
At 31 January 2026, the group's discontinued operations comprised Winterflood Securities and Close Brothers Asset Management.
Summary results of discontinued operations
Operating profit/(loss) before tax
|
6 months ended 31 January 2026 £ million |
6 months ended 31 January 2025 £ million |
Year ended 31 July 2025 £ million |
|
|
Winterflood Securities |
1.3 |
(0.8) |
(14.2) |
|
Close Brothers Asset Management |
0.1 |
1.7 |
65.4 |
|
Operating profit/(loss) before tax |
1.4 |
0.9 |
51.2 |
Profit/(loss) after tax
|
6 months ended 31 January 2026 £ million |
6 months ended 31 January 2025 £ million |
Year ended 31 July 2025 £ million |
|
|
Winterflood Securities |
0.7 |
(0.7) |
(14.7) |
|
Close Brothers Asset Management |
0.1 |
0.3 |
63.9 |
|
Profit/(Loss) after tax |
0.8 |
(0.4) |
49.2 |
Winterflood Securities
On 25 July 2025, the group announced that it had entered into an agreement to the sell Winterflood Securities, an execution services and securities business and one of the group's operating segments, to Marex Group plc. The sale was completed on 1 December 2025.
In the group's 2025 Annual Report, the business fulfilled the requirements of IFRS 5 to be classified as discontinued operations in the consolidated income statement with comparative information restated. In addition, the assets and liabilities of the business were presented as held for sale in the consolidated balance sheet.
Assets and liabilities held for sale
The major classes of assets and liabilities classified as held for sale, which exclude intercompany balances eliminated on consolidation, are as follows:
|
31 January 2026 £ million |
31 July 2025 £ million |
|
|
Balance sheet |
||
|
Intangible assets |
- |
10.3 |
|
Property, plant and equipment |
- |
20.2 |
|
Loans and advances to banks |
- |
54.8 |
|
Settlement balances |
- |
726.4 |
|
Equity shares |
- |
28.3 |
|
Debt securities and loans |
- |
32.8 |
|
Other assets |
- |
14.2 |
|
Total assets classified as held for sale |
- |
887.0 |
|
Bank loans and overdrafts |
- |
15.3 |
|
Settlement balances |
- |
698.2 |
|
Equity shares |
- |
10.4 |
|
Debt securities and loans |
- |
14.8 |
|
Accruals and deferred income |
- |
8.5 |
|
Other liabilities |
- |
20.2 |
|
Total liabilities classified as held for sale |
- |
767.4 |
Results of discontinued operations
|
4 months ended 30 November 2025 £ million |
6 months ended 31 January 2025 £ million |
Year ended 31 July 2025 £ million |
|
|
Operating income |
28.9 |
34.6 |
77.3 |
|
Operating expenses |
(28.4) |
(35.4) |
(77.1) |
|
Impairment credit on financial assets |
- |
- |
0.1 |
|
Goodwill impairment recognised on remeasurement of disposal group as held for sale |
- |
- |
(14.5) |
|
Trading profit |
0.5 |
(0.8) |
(14.2) |
|
Gain on disposal |
0.8 |
- |
- |
|
Operating profit/(loss) before tax |
1.3 |
(0.8) |
(14.2) |
|
Tax1 |
(0.6) |
0.1 |
(0.5) |
|
Profit/(Loss) after tax |
0.7 |
(0.7) |
(14.7) |
|
1. |
The tax charge of £0.6 million relates to the trading profit of the business prior to disposal. The gain on disposal is exempt following the application of the Substantial Shareholding Exemption. |
Cash flow from discontinued operations
|
4 months ended 30 November 2025 £ million |
6 months ended 31 January 2025 £ million |
Year ended 31 July 2025 £ million |
|
|
Net cash flow from operating activities |
(2.3) |
11.0 |
(8.3) |
|
Net cash flow from investing activities |
(0.4) |
(1.3) |
0.1 |
|
Net cash flow from financing activities |
(0.2) |
(0.2) |
(0.5) |
Consolidated gain on disposal
|
31 January 2026 £ million |
|
|
Cash consideration received |
103.6 |
|
Disposal transaction costs |
(3.5) |
|
100.1 |
|
|
Net assets on completion date |
(99.3) |
|
Gain on disposal |
0.8 |
Close Brothers Asset Management
On 19 September 2024, the group announced that it had entered into an agreement to sell its wealth management business, Close Brothers Asset Management ("CBAM"), one of the group's operating segments, to funds managed by Oaktree Capital Management, L.P. ("Oaktree"). The sale completed on 28 February 2025.
CBAM related to the group's 100% shareholding in Close Asset Management Holdings Limited ("CAMHL") and its subsidiaries. The business was a well-regarded UK wealth management franchise and the transaction strengthened the group's capital base and enhanced its position to navigate the current uncertain environment.
In the group's 2025 Half Year Results, the business fulfilled the requirements of IFRS 5 to be classified as discontinued operations in the consolidated income statement. In addition, the assets and liabilities of the business were presented as held for sale in the consolidated balance sheet. On completion, the assets and liabilities were derecognised and a gain on disposal was recognised as follows.
Results of discontinued operations
|
Six months ended 31 January 2026 £ million |
Six months ended 31 January 2025 £ million1 |
Seven months ended 28 February 2025 £ million |
|
|
Operating income |
- |
82.4 |
95.4 |
|
Operating expenses2 |
- |
(80.7) |
(90.8) |
|
Trading profit |
- |
1.7 |
4.6 |
|
Gain on disposal |
0.1 |
- |
60.8 |
|
Operating profit before tax |
0.1 |
1.7 |
65.4 |
|
Tax3 |
- |
(1.4) |
(1.5) |
|
Profit after tax |
0.1 |
0.3 |
63.9 |
|
1. |
Restated to include intercompany transactions as discontinued operations in line with the treatment in the group's 2025 Annual Report. |
|
2. |
Operating expenses for the six months ended 31 January 2025 include £2.5 million of directly attributable costs relating to the disposal of CBAM. |
|
3. |
Tax charge relates to the trading profit of the business prior to disposal. The gain on disposal is exempt following the application of the Substantial Shareholding Exemption. |
Cash flow from discontinued operations
|
Six months ended 31 January 2026 £ million |
Six months ended 31 January 2025 £ million |
Seven months ended 28 February 2025 £ million |
|
|
Net cash flow from operating activities |
- |
- |
(1.5) |
|
Net cash flow from investing activities |
- |
(3.0) |
(3.5) |
|
Net cash flow from financing activities |
- |
(1.5) |
(1.7) |
Cash consideration of £146.4 million was received on completion. The contingent deferred consideration is in the form of preference shares, redeemable no later than Oaktree's exit, for an amount of up to £28.0 million plus interest at a rate of 8% per annum, stepping up to 12% after five years.
The contingent deferred consideration is subject to potential deductions, including in relation to retention of key individuals and certain potential regulatory costs and separation cost overruns. The preference shares are measured at fair value through profit or loss under IFRS 9. The fair value is calculated to be £21.1 million (31 July 2025: £21.1 million) based on a discounted expected cash flow method, with the main assumptions relating to the expected time until redemption and the aforementioned potential deductions.
Close Brewery Rentals Limited
As announced on 15 July 2025, the group agreed the sale of its brewery container rentals business, Close Brewery Rentals Limited ("CBRL"), to MML Keystone, a fund managed by MML Capital. The sale completed on 31 August 2025 and a gain on disposal of £6.4 million has been recognised within "other income" in the consolidated income statement. The cash consideration received was £8.1 million.
In the group's 2025 Annual Report, the assets and liabilities of the business were classified as held for sale but did not meet the criteria to be classified as discontinued operations under IFRS 5. The results of CBRL were therefore included within continuing operations.
Assets and liabilities held for sale
The major classes of assets and liabilities classified as held for sale, which exclude intercompany balances eliminated on consolidation, are as follows:
|
31 January 2026 £ million |
31 July 2025 £ million |
|
|
Balance sheet |
||
|
Property, plant and equipment |
- |
42.8 |
|
Loans and advances to banks |
- |
0.2 |
|
Other assets |
- |
4.0 |
|
Total assets classified as held for sale |
- |
47.0 |
|
Accruals and deferred income |
- |
0.7 |
|
Other liabilities |
- |
5.3 |
|
Total liabilities classified as held for sale |
- |
6.0 |
21. Post balance sheet event
In February 2026, the group issued £250 million of 6.125% Subordinated Tier 2 Notes due 2036. These notes will be classified as financial liabilities at amortised cost and measured at fair value less directly attributable transaction costs on initial recognition.
The new issuance was accompanied by a related tender offer of our outstanding £200 million 2.00% Subordinated Tier 2 Notes due 2031, of which £191.4 million was tendered and accepted for purchase by the group. At 31 January 2026, these notes are held on the balance sheet as financial liabilities at amortised cost with a carrying value of £199.2 million.
These transactions are non-adjusting events under the requirements of IAS 10 "Events after the reporting period".
Definitions
Additional Tier 1 ("AT1") capital: Additional regulatory capital that along with CET1 capital makes up a bank's or banking group's Tier 1 regulatory capital. Includes the group's perpetual subordinated contingent convertible securities classified as other equity instruments under IAS 32
Adjusted: Adjusted measures are presented on a basis consistent with prior periods and exclude any exceptional and adjusting items which do not reflect underlying trading performance
Adjusted earnings per share ("AEPS"): Adjusted operating profit less tax and AT1 coupons divided by basic weighted average number of ordinary shares in issue
Applicable requirements: Applicable capital ratio requirements consist of the Pillar 1 requirement as defined by the CRR, the Pillar 2a requirement set by the PRA, and the capital conservation buffer and countercyclical buffer as defined by the PRA Rulebook. Any applicable PRA buffer is excluded
Average maturity of funding allocated to the loan book: Simple weighted average of the applicable funding allocated to the loan book. The applicable funding excludes equity (except AT1 instruments) and deducts funding held for liquidity purposes
Bad debt ratio: (Adjusted) impairment losses in the year as a percentage of average net loans and advances to customers and operating lease assets excluding Vehicle Hire, which is in wind-down, and Brewery Rentals, classified as held for sale on the group's 31 July 2025 balance sheet, now sold
Basic earnings per share ("EPS"): Total profit attributable to ordinary shareholders divided by basic weighted average number of ordinary shares in issue
Basic earnings per share ("EPS") continuing operations: Operating profit from continuing operations less tax and AT1 coupons, divided by basic weighted average number of ordinary shares in issue
Capital Requirements Directive ("CRD"): European Union regulation implementing the Basel III requirements in Europe, alongside CRR II
Capital Requirements Regulation ("CRR"): Regulation 575/2013/EU, as it forms part of the assimilated law of the United Kingdom
CET1 capital ratio: Measure of the group's CET1 capital as a percentage of risk weighted assets, as required by CRR
Common equity tier 1 ("CET1") capital: Measure of capital as defined by the CRR. CET1 capital consists of the highest quality capital including ordinary shares, related share premium account, retained earnings and other reserves, less goodwill and certain intangible assets and other regulatory adjustments
Compensation ratio: Total staff costs as a percentage of adjusted operating income
Consolidated gain on disposal: The profit or loss recognised on the sale of a subsidiary or business, calculated as proceeds received less related costs and the carrying amount of net assets and goodwill disposed
Contingent deferred consideration: A portion of the purchase price on an acquisition that is payable at a future date and is dependent on the occurrence of specified future events or conditions
Cost of funds: Interest expense incurred to support lending activities excluding Vehicle Hire and Brewery Rentals divided by the average net loans and advances to customers and operating lease assets excluding Vehicle Hire and Brewery Rentals
Discounting: The process of determining the present value of future payments
Dividend per share ("DPS"): Comprises the final dividend proposed for the respective year, together with the interim dividend declared and paid in the year
Effective interest rate ("EIR"): The interest rate at which revenue is recognised on loans and discounted to their carrying value over the life of the financial asset
Effective tax rate ("ETR"): Tax on operating profit/(loss) as a percentage of operating profit/(loss) on ordinary activities before tax
Expected credit loss ("ECL"): The unbiased probability-weighted average credit loss determined by evaluating a range of possible outcomes and future economic conditions
Expense/income ratio: (Adjusted) operating expenses divided by (adjusted) operating income
Financial Conduct Authority ("FCA"): A financial regulatory body in the UK, regulating financial firms and maintaining integrity of the UK's financial market
Financial Ombudsman Service ("FOS"): The Financial Ombudsman Service settles complaints between consumers and businesses that provide financial services
Forbearance: Forbearance occurs when a customer is experiencing financial difficulty in meeting their financial commitments and a concession is granted, by changing the terms of the financial arrangement, which would not otherwise be considered
Gross carrying amount: Loan book before expected credit loss provision
Internal ratings based ("IRB") approach: A supervisor-approved method using internal models, rather than standardised risk weightings, to calculate regulatory capital requirements for credit risk
International Accounting Standards ("IAS"): Older set of standards issued by the International Accounting Standards Council, setting up accounting principles and rules for preparation of financial statements. IAS are being superseded by IFRS
International Financial Reporting Standards ("IFRS"): Globally accepted accounting standards issued by the IFRS Foundation and the International Accounting Standards Board
Leverage ratio: Tier 1 capital as a percentage of total balance sheet assets, adjusted for certain capital deductions, including intangible assets, and off-balance sheet exposures
Liquidity coverage ratio ("LCR"): Measure of the group's HQLAs as a percentage of expected net cash outflows over the next 30 days in a stressed scenario
Long-term bad debt ratio: Long-term bad debt ratio calculated using IAS 39 until the change to IFRS 9 in FY19. Long-term average bad debt ratio of 1.2% based on the average bad debt ratio for FY08-FY25, excluding Novitas from FY21 onwards and Rentals businesses from FY24
Net asset value ("NAV") per share: Total assets less total liabilities and AT1, divided by the number of ordinary shares in issue excluding own shares
Net interest margin ("NIM"): (Adjusted) operating income for the lending divisions, divided by average net loans and advances to customers and operating lease assets excluding Vehicle Hire and Brewery Rentals
Net stable funding ratio ("NSFR"): Regulatory measure of the group's weighted funding as a percentage of weighted assets
Probability of default ("PD"): Probability that a customer will default on their loan
Prudential Regulation Authority ("PRA"): A financial regulatory body, responsible for regulating and supervising banks and other financial institutions in the UK
Return on assets: Adjusted operating profit less tax and AT1 coupons divided by average total assets for continuing operations at the balance sheet date and prior year
Return on average tangible equity ("RoTE"): Adjusted operating profit, less tax and AT1 coupons, divided by average total shareholders' equity, excluding intangible assets and AT1, for continuing operations
Return on net loan book ("RoNLB"): Adjusted operating profit for the lending divisions, divided by average net loans and advances to customers and operating lease assets excluding Vehicle Hire and Brewery Rentals
Return on opening equity ("RoE"): Adjusted operating profit less tax and AT1 coupons divided by opening equity for continuing operations, excluding AT1
Risk weighted assets ("RWAs"): A measure of the amount of a bank's exposures, adjusted for risk in line with the CRR. It is used in determining the capital requirement for a financial institution
Significant increase in credit risk ("SICR"): An assessment of whether credit risk has increased significantly since initial recognition of a loan using a range of triggers. Accounts which have experienced a significant increase in credit risk will be allocated to Stage 2
Standardised approach: Generic term for regulator-defined approaches for calculating credit, operational and market risk capital requirements as set out in the CRR
Subordinated debt: Represents debt that ranks below, and is repaid after claims of, other secured or senior debt owed by the issuer
Tangible net asset value ("TNAV") per share: Total assets less total liabilities, AT1 and intangible assets, divided by the number of ordinary shares in issue excluding own shares
Term funding: Funding with a remaining maturity greater than 12 months
Term Funding Scheme for Small and Medium-sized Enterprises ("TFSME"): The Bank of England's Term Funding Scheme with additional incentives for SMEs
Tier 2 capital: Additional regulatory capital that along with Tier 1 capital makes up a bank's total regulatory capital. Includes qualifying subordinated debt
Total funding as percentage of loan book: Total funding divided by net loans and advances to customers and operating lease assets
Cautionary Statement
Certain statements included or incorporated by reference within this announcement may constitute "forward-looking statements" in respect of the group's operations, performance, prospects, financial condition and/or environmental, social and governance ambitions, targets and commitments. All statements other than statements of historical fact are, or may be deemed to be, forward-looking statements. Forward-looking statements are sometimes, but not always, identified by their use of a date in the future or such words as "anticipates", "aims", "due", "could", "may", "will", "should", "expects", "believes", "intends", "plans", "potential", "targets", "goal" or "estimates" and other words and expressions of similar meaning. By their nature, forward-looking statements involve a number of risks, uncertainties and assumptions and actual results or events may differ materially from those expressed or implied by those statements. There are also a number of factors that could cause actual future operations, performance, financial conditions, results or developments to differ materially from the plans, goals and expectations expressed or implied by these forward-looking statements and forecasts. These factors include, but are not limited to, those contained in the Group's annual report (available at: https://www.closebrothers.com/investor-relations). Accordingly, no assurance can be given that any particular expectation will be met and reliance should not be placed on any forward-looking statement. Additionally, forward-looking statements regarding past trends or activities should not be taken as a representation that such trends or activities will continue in the future.
Except as may be required by law or regulation, no responsibility or obligation is accepted to update or revise any forward-looking statement resulting from new information, future events or otherwise. Nothing in this announcement should be construed as a profit forecast. Past performance cannot be relied upon as a guide to future performance and persons needing advice should consult an independent financial adviser.
This announcement does not constitute or form part of any offer or invitation to sell, or any solicitation of any offer to subscribe for or purchase any shares or other securities in the company or any of its group members, nor shall it or any part of it or the fact of its distribution form the basis of, or be relied on in connection with, any contract or commitment or investment decisions relating thereto, nor does it constitute a recommendation regarding the shares or other securities of the company or any of its group members. Statements in this announcement reflect the knowledge and information available at the time of its preparation. Liability arising from anything in this announcement shall be governed by English law. Nothing in this announcement shall exclude any liability under applicable laws that cannot be excluded in accordance with such laws.