

Half Year Results for the Six Months to 31 January 2024
19 March 2024
Adrian Sainsbury, Chief Executive, said:
"Performance in the first half of 2024 reflected continued loan book growth across our businesses in Banking at strong margins, and an improved credit performance. CBAM delivered strong net inflows and whilst Winterflood's performance remains affected by weakness in retail trading activity, it remains well placed for a recovery in investor appetite.
The FCA's review of the motor finance industry is ongoing and it would be premature to predict the outcome or estimate the potential impact on the group. The Board however recognises the paramount importance of preparing the group for a range of outcomes from this review. As part of this, the Board is taking a number of decisive actions to strengthen our capital position materially. These include the difficult decision taken last month not to pay dividends in respect of the current financial year. In addition, we are taking steps to optimise our risk weighted assets and reduce costs.
These steps are being taken whilst continuing to provide excellent service to all our customers and protect our valuable franchise. The distinctive strength of our through-the-cycle business model, our long-term relationships, the deep expertise of our people and our consistent service endure. While we are working through a current period of uncertainty, the Board is taking decisive actions and is confident that the group will emerge well positioned to take advantage of future opportunities."
Key Financials1
|
|
First half 2024 |
First half 2023 |
Change % |
|
Statutory operating profit before tax |
£93.8m |
£11.7m |
702 |
|
Adjusted operating profit2 |
£94.4m |
£12.6m |
649 |
|
Adjusted basic earnings per share3 |
46.3p |
6.1p |
|
|
Basic earnings per share3 |
46.0p |
5.6p |
|
|
Ordinary dividend per share |
- |
22.5p |
|
|
Return on opening equity |
8.4% |
1.1% |
|
|
Return on average tangible equity |
10.1% |
1.3% |
|
|
Net interest margin4 |
7.5% |
8.0% |
|
|
Bad debt ratio4 |
0.9% |
3.6% |
|
|
31 January 2024 |
31 July 2023 |
Change % |
|
|
Loan book5 |
£9.9bn |
£9.5bn |
4 |
|
Total client assets |
£18.5bn |
£17.3bn |
7 |
|
NAV per share |
£11.0 |
£11.0 |
|
|
TNAV per share |
£9.2 |
£9.3 |
|
|
CET1 capital ratio (transitional) |
13.0% |
13.3% |
|
|
Tier 1 capital ratio (transitional) |
15.0% |
13.3% |
|
|
Total capital ratio (transitional) |
16.9% |
15.3% |
Key Financials (Excluding Novitas)
|
|
First half 2024 |
First half 2023 |
Change % |
|
Statutory operating profit before tax |
£93.6m |
£116.6m |
(20) |
|
Adjusted operating profit |
£94.2m |
£117.5m |
(20) |
|
Net interest margin4 |
7.5% |
7.8% |
|
|
Bad debt ratio4 |
0.8% |
1.1% |
|
|
31 January 2024 |
31 July 2023 |
Change % |
|
|
Loan book5 |
£9.8bn |
£9.5bn |
4 |
1. Please refer to definitions on pages 25 to 27.
2. Adjusted operating profit is stated before amortisation of intangible assets on acquisition, goodwill impairment, exceptional items and tax.
3. Refer to note 4 for the calculation of basic and adjusted earnings per share.
4. Net interest margin and bad debt ratio calculated on an annualised basis.
5. Loan book includes operating lease assets.
Financial performance
|
• Resilient operating income of £470.8 million (H1 2023: £474.3 million), down 1%, reflecting growth in Banking and Close Brothers Asset Management, offset by a reduction in Winterflood and higher Group (central functions) net expenses |
|
• Operating expenses up 12% reflecting increases in staff costs and continued investment in Banking |
|
• Statutory operating profit before tax of £93.8 million (H1 2023: £11.7 million), reflecting non-recurrence of prior year impairment charges of £114.6 million related to Novitas. Excluding Novitas, adjusted operating profit reduced to £94.2 million (H1 2023: £117.5 million), reflecting cost growth, a reduction in Winterflood income and higher Group (central functions) net expenses |
|
• Group return on average tangible equity ("RoTE") of 10.1% (H1 2023: 1.3%) |
|
• In Banking, we delivered loan book growth of 4% to £9.9 billion (31 July 2023: £9.5 billion), driven by strong growth in Property and continued good demand in Asset Finance and the UK Motor Finance business, partly offset by the normal seasonal impact seen in the Premium and Invoice Finance businesses. We delivered a strong net interest margin of 7.5% (H1 2023: 8.0%; 2023: 7.7%). Our credit performance improved, with an annualised bad debt ratio of 0.9% (H1 2023: 3.6%) |
|
• Close Brothers Asset Management delivered strong net inflows of 9% annualised, with a significant contribution from our bespoke investment management business. Total managed assets ("AuM") increased 8% to £17.7 billion, driven by net inflows and positive market performance |
|
• In Winterflood, market conditions have remained unfavourable; Winterflood Business Services ("WBS") income was up 24% to £7.8 million and reflected an 11% year-on-year increase in assets under administration ("AuA") to £13.8 billion |
|
• Strong balance sheet position with our Common Equity Tier 1 ("CET1") ratio of 13.0% at 31 January 2024 (31 July 2023: 13.3%), significantly above our applicable requirement of 9.5% |
|
• Decision to suspend dividends in respect of current financial year announced on 15 February 2024 |
Decisive actions to further strengthen capital position
|
• The Board has concluded that no legal or constructive obligation exists at the half year in relation to the FCA review and therefore, no provision has been recognised in the period in accordance with the relevant accounting standards |
|
• There is significant uncertainty about the outcome of the FCA's review at this early stage, and the timing, scope and quantum of any potential financial impact on the group cannot be reliably estimated at present |
|
• The Board considers it prudent for the group to further strengthen its capital position. The group has identified actions which, combined with the decision to not pay any dividend payments in the current financial year, could strengthen the group's available CET1 capital by approximately £200 million. These actions include a combination of significant risk transfer of assets and selective loan book growth to optimise risk weighted assets, supported by additional cost management initiatives. We continue to evaluate a range of other potential management actions which could enhance available CET1 capital by at least another c.£100 million. Additionally, as our business continues to organically generate capital through 2025, the retention of earnings could potentially strengthen the group's capital position by a further £100 million, if required. In all, these measures could strengthen the group's available CET1 capital by approximately £400 million by the end of the 2025 financial year when compared to the group's projected CET1 capital ratio for 31 July 2025, prior to any management actions. The Board is confident that these decisive actions will position the group well to withstand a range of scenarios and potential outcomes |
Update on guidance
In Banking¸ we are encouraged by the performance in the first half, notwithstanding the significant uncertainty in relation to the FCA's review of historical motor finance commission arrangements
• Expect to broadly sustain underlying loan book growth in the second half of the 2024 financial year
• Well positioned to maintain a strong net interest margin, broadly aligned with the reported NIM in the first half
• Continue to expect c.8-10% increase in Banking costs in 2024, excluding costs related to the recently announced acquisition of Bluestone Motor Finance (Ireland)
• We have mobilised additional cost management initiatives which are expected to generate annualised savings of c.£20 million by the 2026 financial year, partly offsetting the adverse impact on the group's income as a result of the management actions
• We remain committed to more closely aligning income and cost growth for the 2025 financial year (excluding any restructuring costs) and delivering positive operating leverage over the medium term
• Expect the bad debt ratio to remain below our long-term average of 1.2% in H2 2024, based on current market conditions
In Close Brothers Asset Management ("CBAM"), we are well placed to consolidate our position and maximise opportunities to accelerate profitability
• Targeting net inflows of 6-10%
• Expect operating margin to increase from 2025 onwards towards a longer-term target of above 20%
In Winterflood, we are well placed to retain our leading market position and benefit when investor appetite returns
• Remain focused on diversifying revenue streams
• Expect to grow AuA in WBS to over £20 billion by 2026
As noted above, we have identified and continue to evaluate a number of management actions to continue to support our customers and protect our valuable franchise. Over the medium term, we remain committed to our previous CET1 capital target of 12% to 13% but expect to operate above this range in the near-term as a result of the identified management actions.
These actions will leave us well positioned to withstand a range of scenarios and potential outcomes and are expected to adversely impact the group's operating profit in the next financial year. An update on our guidance for the 2025 financial year will be provided at our Full-Year results announcement.
Enquiries
|
Sophie Gillingham |
Close Brothers Group plc |
020 3857 6574 |
|
Camila Sugimura |
Close Brothers Group plc |
020 3857 6577 |
|
Kimberley Taylor |
Close Brothers Group plc |
020 3857 6233 |
|
Ingrid Diaz |
Close Brothers Group plc |
020 3857 6088 |
|
Sam Cartwright |
H/Advisors Maitland |
07827 254 561 |
A virtual presentation to analysts and investors will be held today at 9.30 am GMT followed by a Q&A session. A webcast and dial-in facility will be available by registering at https://webcasts.closebrothers.com/results/HalfYearResults2024.
Basis of Presentation
Results are presented both on a statutory and an adjusted basis to aid comparability between periods. Adjusted measures are presented on a basis consistent with prior periods and exclude amortisation of intangible assets on acquisition, to present the performance of the group's acquired businesses consistent with its other businesses; and any exceptional and other adjusting items which do not reflect underlying trading performance. Please refer to note 2 for further details on items excluded from the adjusted performance metrics.
Financial Calendar (Provisional)
The enclosed provisional financial calendar below is updated on a regular basis throughout the year. Please refer to our website www.closebrothers.com for up-to-date details. As announced at the 2023 Preliminary Results, the group has decided to discontinue the issuance of pre-close trading updates in order to align more closely with prevailing market and industry practice.
|
Event |
Date |
|
Third quarter trading update |
22 May 2024 |
|
Financial year end |
31 July 2024 |
|
Preliminary results |
24 September 2024 |
About Close Brothers
Close Brothers is a leading UK merchant banking group providing lending, deposit taking, wealth management services and securities trading. We employ approximately 4,000 people, principally in the United Kingdom and Ireland. Close Brothers Group plc is listed on the London Stock Exchange and is a constituent of the FTSE 250.
Chief Executive's Statement
Performance in the first half of 2024 reflected continued loan book growth across our businesses in Banking at strong margins, and an improved credit performance. CBAM delivered strong net inflows and whilst Winterflood's performance remains affected by weakness in retail trading activity, it remains well placed for a recovery in investor appetite.
This first half has seen a mixed market backdrop. Whilst we have seen some improvement in macroeconomic indicators, economic headwinds remain as interest rates have stabilised at higher levels while inflation persists. Customer demand levels have remained robust in Banking. Our market-facing businesses continued to encounter a challenging market environment, although CBAM attracted new client assets and delivered a good fund performance across asset classes.
Notwithstanding the continued uncertain macroeconomic environment for individuals and SMEs in the UK, we continue to support our nearly three million customers, including c.360,000 SME businesses, through the cycle. In our Banking division, we employ almost 3,000 colleagues across 40 locations throughout the country. Our primary focus is helping customers by offering additional borrowing capacity to acquire essential assets for their personal lives or small businesses.
Financial Performance
Statutory operating profit before tax was £93.8 million (H1 2023: £11.7 million). The increase was mainly driven by the non-recurrence of the prior year impairment charges related to Novitas. In Banking, excluding Novitas, the profit performance reflected good loan book growth of 9% year-on-year, a strong net interest margin of 7.5% and an improved credit performance, with a bad debt ratio of 0.8%. This was more than offset by increased costs due to inflation-related salary rises, new hires and investment in our strategic programmes and cost efficiency initiatives. Our Asset Management division delivered strong net inflows of 9% annualised, although profit reduced, as income growth was more than offset by costs primarily related to wage inflation and new hires. Winterflood's performance has been adversely impacted by continued weakness in investor appetite and market uncertainty, resulting in an operating loss of £2.6 million. We remain confident in the track record of our trading business and are well positioned to retain our market position and benefit when investor appetite returns. WBS continued to see good momentum, with income rising 24% to £7.8 million and an 11% year-on-year increase in AuA to £13.8 billion.
We maintained our strong balance sheet and conservative approach to managing our financial resources in the first half. Our capital position was strong, with our CET1 capital ratio at 13.0% (31 July 2023: 13.3%), significantly above our applicable requirement of 9.5%. Total funding increased 3% to £12.7 billion (31 July 2023: £12.4 billion), with 16% growth in our retail deposit base, demonstrating the strength of our Savings proposition. We maintained our prudent liquidity position, with our Liquidity Coverage Ratio over 1,000%, substantially exceeding regulatory requirements.
Significant uncertainty arising from the FCA's review of the motor finance industry
The FCA recently announced that it is undertaking a review of the motor finance market due to the high number of complaints coming to the Financial Ombudsman Service ("FOS") from customers regarding discretionary commission arrangements in effect prior to the 2021 ban on these models. The FCA aims to communicate a decision on next steps by the end of September 2024. This has caused significant uncertainty for the industry and the group regarding any potential remediation action as a result of the review. Close Brothers Motor Finance ("CBMF") has operated in the motor finance market for a number of years, during which we have sought to comply with the relevant regulatory requirements. There are a range of possible outcomes and therefore, as announced on 15 February, we are implementing actions to further strengthen the group's capital position, with the priority of protecting and sustaining our valuable franchise.
We have a long-term progressive dividend track record and the decision to not pay any dividends for this financial year was not made lightly. It reflects our proactive and prudent approach to managing our financial resources. We have identified actions which, combined with the decision not to pay a dividend in the current financial year, are expected to strengthen the group's available CET1 capital by approximately £200 million. These actions include a combination of significant risk transfer of assets and selective loan book growth to optimise risk weighted assets, supported by additional cost management initiatives which could enhance available CET1 capital by at least another c.£100 million. Additionally, as our business continues to organically generate capital through 2025, the retention of earnings could potentially strengthen the group's capital position by a further £100 million, if required. In all, these measures could strengthen the group's available CET1 capital by approximately £400 million by the end of the 2025 financial year when compared to the group's projected CET1 capital ratio for 31 July 2025, prior to any management actions. The Board is confident that these decisive actions will position the group well to withstand a range of scenarios and potential outcomes.
Continued focus on strengthening our valuable franchise
Notwithstanding the prevailing uncertainty, we remain focused on delivering on our strategy and strengthening our valuable franchise. This means we will continue to review our portfolio of businesses to ensure they each deliver attractive returns. We have mobilised additional cost management initiatives in Banking, which are expected to generate annualised savings of c.£20 million by the 2026 financial year, to support the ongoing profitability of our business.
The distinctive strengths of our through-the-cycle model - our long-term relationships, the deep expertise of our people and our customer-centric approach - endure. We are taking decisive actions to navigate through this period of uncertainty and are confident that the group will emerge well positioned to take advantage of future opportunities.
Adrian Sainsbury
Chief Executive
19 March 2024
FCA's review of historical motor finance commission arrangements
On 11 January 2024, the FCA announced it is using its powers under section 166 of the Financial Services and Markets Act 2000 to review historical motor finance commission arrangements and sales at several firms, following high numbers of complaints from customers. The review follows the FOS publication of its first two decisions upholding customer complaints relating to discretionary commission arrangements ("DCAs") against two other lenders in the market. The FCA aims to communicate a decision on next steps by the end of September 2024.
Overview of commission models operated1
CBMF has operated in the motor finance market for a number of years, during which we have sought to comply with the relevant regulatory requirements.
Prior to 2016, CBMF operated an Upward Difference in Charges ("DIC") model. This allowed the dealer or broker full discretion over the customer rate and the commission earnt on point-of-sale finance, subject to a hard cap on the amount of commission. Under the DIC model, commission, if any, was paid as a percentage of the total interest paid by the customer.
From 2016, CBMF introduced a Downward Scaled Commission ("DSM") model, which capped both the interest charged to the customer and commission paid to the dealer or broker. This meant that CBMF set the headline rate for the customer and the dealers could only reduce this by decreasing their level of commission. Under the DSM model, commission, if any, was paid as a percentage of the loan size.
From 2021 onwards, CBMF introduced a Risk Adjusted Pricing Model which set the rate for the customer and adjusted the rate according to the customer risk profile. Dealer discretion was removed entirely. Under the Risk Adjusted Pricing Model, commission, if any, is paid as a fixed percentage of the loan size.
All historical models included a "hard cap" on the commission amount paid to the broker or dealer. Commission disclosures were also reviewed and enhanced over time.
1 For simplicity, dates shown above assume transition when substantially complete.
Impact on Close Brothers
The FCA review is progressing to determine whether there has been industry-wide failure to comply with regulatory requirements which has caused customers harm and, if so, whether it needs to take any actions. Based on the status at the half year and in accordance with the relevant accounting standards, the Board has concluded that no legal or constructive obligation exists and it is currently not required or appropriate to recognise a provision in relation to this matter. The FCA has indicated there could be a range of outcomes, with one potential outcome being an industry-wide consumer redress scheme. The estimated impact of any redress scheme, if required, is highly dependent on a number of factors including, for example, the time period covered; the DCA models impacted (the group operated a number of different models during the period under review); appropriate reference commission rates set for any redress; and response rates to any redress scheme. As such, at this early stage, the timing, scope and quantum of the potential financial impact on the group, if any, cannot be reliably estimated at present. In addition, it is not practicable at this stage to estimate any potential financial impact arising from this issue.
The group is subject to a number of claims through the courts regarding historical commission arrangements with intermediaries on its motor finance products. As of 29 February 2024, where individual cases were adjudicated in County Court, in the majority of the outcomes for Close Brothers where the courts found that there was no demonstrable customer harm and hence no compensation to pay, albeit there have been a limited number of adjudicated cases at this stage. There are also a number of complaints that have been referred to FOS for a determination. To date no final FOS decisions have been made upholding complaints against Close Brothers.
Since the announcement by the FCA of its review of historical motor finance commission arrangements, we have seen a further increase in complaints. We continue to monitor the impact on our current handling of complaints and are following the playbooks in place to ensure we have the appropriate resources to respond effectively.
Further strengthening our capital base to continue to support customers and protect our valuable franchise
The group has a strong capital, funding and liquidity position. At 31 January 2024, our CET1 and Total capital ratios were 13.0% and 16.9% respectively (31 July 2023: 13.3% and 15.3%), providing significant headroom over the applicable requirements. Our leverage ratio, which is a measure of capital strength not affected by risk weightings, remained strong at 12.7%. Our conservative approach to funding is based on the principle of "borrow long, lend short" and we hold liquidity levels comfortably ahead of both internal risk appetite and regulatory requirements, with a Liquidity Coverage Ratio in excess of 1,000%. As of 29 February 2024, there have been no significant changes in our deposit base and liquidity metrics.
While there is no certainty regarding any potential financial impact as a result of the FCA's review, the Board recognises the need to plan for a range of possible outcomes. It is a long-standing priority of the group to maintain a strong balance sheet and prudent approach to managing its financial resources. To that end, the Board considers it prudent for the group to further strengthen its capital position, while supporting our customers and business franchise.
As previously announced, the group will not pay any dividends on its ordinary shares for the current financial year, and the reinstatement of dividends in 2025 and beyond will be reviewed once the FCA has concluded its process and any financial consequences for the group have been assessed. As a result, we expect to retain c.£100 million of CET1 capital in the 2024 financial year, of which c.£50 million has been reflected in the CET1 capital position at 31 January 2024.
The Board is taking steps to further strengthen the group's capital position by optimising risk weighted assets ("RWAs"). We plan to reduce RWA growth by approximately £1 billion through a combination of selective loan book growth, partnerships and significant risk transfer of assets related to our Motor Finance business through securitisations.
We have also mobilised additional cost management initiatives which are expected to generate annualised savings of c.£20 million by the 2026 financial year, partly offsetting the adverse impact on the group's income as a result of the management actions.
We continue to evaluate a range of other potential management actions which could strengthen the group's capital position over and above our ongoing organic capital generation through 2025. These include potential risk transfer of other portfolios through securitisation, a continued review of our business portfolios and other tactical actions. We estimate this could enhance available CET1 capital by at least another c.£100 million. Additionally, as our business continues to organically generate capital through 2025, the retention of earnings could potentially strengthen the group's capital position by a further £100 million, if required.
Combined with the decision to not pay any dividends in the current financial year, these measures could strengthen the group's available CET1 capital by approximately £400 million by the end of the 2025 financial year (when compared to the group's projected CET1 capital ratio for 31 July 2025, prior to any management actions). The Board is confident that these decisive actions position the group well to withstand a range of scenarios and potential outcomes. Nevertheless, there remains considerable uncertainty regarding the specifics of any potential redress scheme, if required, as well as its timing.
Overview of Financial Performance
Summary Group Income Statement1
|
First half 2024 £ million |
First half 2023 £ million |
Change % |
|
|
Operating income |
470.8 |
474.3 |
(1) |
|
Adjusted operating expenses |
(334.7) |
(299.5) |
12 |
|
Impairment losses on financial assets |
(41.7) |
(162.2) |
(74) |
|
Adjusted operating profit |
94.4 |
12.6 |
649 |
|
Banking |
111.7 |
15.0 |
645 |
|
Commercial |
50.9 |
(33.1) |
254 |
|
Of which: Novitas |
0.2 |
(104.9) |
n/a |
|
Retail |
19.0 |
14.7 |
29 |
|
Property |
41.8 |
33.4 |
25 |
|
Asset Management |
6.3 |
8.6 |
(27) |
|
Winterflood |
(2.6) |
2.4 |
(208) |
|
Group |
(21.0) |
(13.4) |
57 |
|
Amortisation of intangible assets on acquisition |
(0.6) |
(0.9) |
(33) |
|
Statutory operating profit before tax |
93.8 |
11.7 |
702 |
|
Tax |
(25.0) |
(3.3) |
658 |
|
Profit after tax |
68.8 |
8.4 |
719 |
|
Profit attributable to shareholders |
68.8 |
8.4 |
719 |
|
Adjusted basic earnings per share2 |
46.3p |
6.1p |
|
|
Basic earnings per share2 |
46.0p |
5.6p |
|
|
Ordinary dividend per share |
- |
22.5p |
|
|
Return on opening equity |
8.4% |
1.1% |
|
|
Return on average tangible equity |
10.1% |
1.3% |
1. Adjusted measures are presented on a basis consistent with prior periods and exclude amortisation of intangible assets on acquisition, to present the performance of the group's acquired businesses consistent with its other businesses; and any exceptional and other adjusting items which do not reflect underlying trading performance. Further detail on the reconciliation between operating and adjusted measures can be found in note 2.
2. Refer to note 4 for the calculation of basic and adjusted earnings per share.
Financial Performance
Adjusted operating profit and returns
Adjusted operating profit increased to £94.4 million (H1 2023: £12.6 million), driven by the non-recurrence of the significant impairment charges incurred in relation to Novitas in the prior year. Excluding Novitas, adjusted operating profit reduced 20% to £94.2 million (H1 2023: £117.5 million), primarily reflecting cost growth, a reduction in income in Winterflood and an increase in group (central functions) net expenses to reflect the interest rate on the Group bond issued in June 2023, partly offset by lower impairment charges.
Statutory operating profit before tax increased to £93.8 million (H1 2023: £11.7 million). Return on opening equity increased to 8.4% (H1 2023: 1.1%) and return on average tangible equity increased to 10.1% (H1 2023: 1.3%).
Banking adjusted operating profit increased to £111.7 million (H1 2023: £15.0 million), with the prior year including an impairment charge of £114.6 million in relation to Novitas. Excluding Novitas, Banking adjusted operating profit decreased 7% to £111.5 million (H1 2023: £119.9 million), as income growth and lower impairment charges were more than offset by higher costs. In the Asset Management division, adjusted operating profit declined by 27% to £6.3 million (H1 2023: £8.6 million) as growth in income was more than offset by higher costs. Winterflood delivered an operating loss of £2.6 million (H1 2023: operating profit of £2.4 million), primarily reflecting lower trading income. Group net expenses, which include the central functions such as finance, legal and compliance, risk and human resources, increased to £21.0 million (H1 2023: £13.4 million), driven primarily by the interest charges incurred on the Group's £250 million senior unsecured bond issued in June 2023 at an interest rate of 7.75%.
Operating income
Operating income decreased marginally to £470.8 million (H1 2023: £474.3 million), with growth in Asset Management and Banking offset by a decline in Winterflood and net interest expenses from debt issued by the holding company in June 2023. Income in the Banking division increased marginally, reflecting loan book growth and strong margins, with the prior year period benefitting from one-off items related to derivatives outside of a hedge accounting relationship (mark-to-market swaps) and Novitas income. Excluding the impact of these swaps and Novitas, Banking income increased 6%. Income in the Asset Management division increased 7%, reflecting positive net inflows and market movements. Income in Winterflood declined 12%, with the decline in trading income more than offsetting growth in WBS.
Adjusted operating expenses
Adjusted operating expenses rose 12% to £334.7 million (H1 2023: £299.5 million) as we saw increased staff costs across the group, as well as continued investment in Banking. In Banking, costs increased 13% as we incurred higher staff costs and continued to invest in our strategic programmes and cost saving initiatives. Costs rose 12% in Asset Management mainly reflecting new hires and higher staff costs due to inflation-related salary increases. Winterflood's costs increased marginally, primarily driven by inflation-related salary increases and one-off costs incurred by relocating premises, partly offset by lower variable compensation and a reduction in settlement costs.
Overall, the group's expense/income ratio increased to 71% (H1 2023: 63%), whilst the compensation ratio increased to 41% (H1 2023: 36%), reflecting inflation-related wage increases, a normalisation of performance-driven bonuses and new hires.
Impairment charges and IFRS 9 provisioning
Impairment charges decreased significantly to £41.7 million (H1 2023: £162.2 million), corresponding to an annualised bad debt ratio of 0.9% (H1 2023: 3.6% annualised), with the prior year period including a charge of £114.6 million in relation to Novitas. Overall provision coverage increased marginally to 4.1% (31 July 2023: 3.9%).
Excluding Novitas, impairment charges reduced 17% to £39.5 million (H1 2023: £47.6 million), reflecting the improved macroeconomic outlook compared to the prior year period, partly offset by loan book growth and the ongoing review of provisions and coverage across our loan portfolios. The bad debt ratio, excluding Novitas, reduced to 0.8% annualised (H1 2023: 1.1% annualised) and remains below our long-term bad debt ratio of 1.2%1. The coverage ratio remained stable at 2.1% (31 July 2023: 2.1%), excluding Novitas.
Since the previous financial year end, we have updated the macroeconomic scenarios to reflect the latest available information regarding the macroeconomic environment and outlook, although the weightings assigned to them remain unchanged. At 31 January 2024, there was a 30% weighting to the strong upside, 32.5% weighting to the baseline, 20% weighting to the mild downside, 10.5% weighting to the moderate downside and 7% weighting to the protracted downside.
Whilst we have not seen a significant impact on credit performance, we continue to monitor closely the evolving impacts of inflation and cost of living on our customers. We remain confident in the quality of our loan book, which is predominantly secured or structurally protected, prudently underwritten, diverse, and supported by the deep expertise of our people. We continue to expect the bad debt ratio for H2 2024 to remain below our long-term average, based on current market conditions.
Tax expense
The tax expense in the first half of the year was £25.0 million (H1 2023: £3.3 million), which corresponds to an effective tax rate of 26.7% (H1 2023: 28.2%) for the period, representing the best estimate of the annual effective tax rate expected for the full year.
The standard UK corporation tax rate for the financial year is 25.0% (six months ended 31 January 2023: 21.0%; year ended 31 July 2023: 21.0%). The effective tax rate is above the UK corporation tax rate primarily due to disallowable expenditure.
Earnings per share
Adjusted basic earnings per share ("EPS") was 46.3p (H1 2023: 6.1p) and basic EPS was 46.0p (H1 2023: 5.6p).
We anticipate EPS, return on opening equity and return on average tangible equity to be impacted from the second half of 2024 onwards by the payment of the coupon relating to the Fixed Rate Resetting Additional Tier 1 Perpetual Subordinated Contingent Convertible ("AT1") Securities, at a rate of 11.125%, which will be due on 29 May and 29 November each year, commencing on 29 May 2024. Any AT1 coupons paid will be deducted from retained earnings, reducing the profit attributable to ordinary shareholders.
Dividend
As announced on 15 February 2024, given the significant uncertainty regarding the outcome of the FCA's review of historical motor finance commissions arrangements and any potential financial impact as a result, the Board recognises the need to plan for a range of possible outcomes from the review. It is a long-standing priority of the group to maintain a strong balance sheet and prudent approach to managing its financial resources. To that end, the Board considers it prudent for the group to further strengthen its capital position, while supporting our customers and business franchise.
Therefore, the group will not pay any dividends on its ordinary shares for the current financial year, and the reinstatement of dividends in the 2025 financial year and beyond will be reviewed once the FCA has concluded its process and any financial consequences for the group have been assessed.
Summary Group Balance Sheet
|
31 January 2024 £ million |
31 July 2023 £ million |
|
|
Loans and advances to customers and operating lease assets1 |
9,893.0 |
9,526.2 |
|
Treasury assets2 |
2,185.2 |
2,229.4 |
|
Market-making assets3 |
974.3 |
787.6 |
|
Other assets |
985.3 |
1,007.1 |
|
Total assets |
14,037.8 |
13,550.3 |
|
Deposits by customers |
8,264.0 |
7,724.5 |
|
Borrowings4 |
2,492.3 |
2,839.4 |
|
Market-making liabilities3 |
902.3 |
700.7 |
|
Other liabilities |
547.4 |
640.8 |
|
Total liabilities |
12,206.0 |
11,905.4 |
|
Equity5 |
1,831.8 |
1,644.9 |
|
Total liabilities and equity |
14,037.8 |
13,550.3 |
1. Includes operating lease assets of £282.0 million (31 July 2023: £271.2 million).
2. Treasury assets comprise cash and balances at central banks and debt securities held to support the Banking division.
3. Market-making assets and liabilities comprise settlement balances, long and short trading positions and loans to or from money brokers.
4. Borrowings comprise debt securities in issue, loans and overdrafts from banks and subordinated loan capital.
5. Equity includes the group's £200.0 million Fixed Rate Reset Perpetual Subordinated Contingent Convertible Securities (AT1 securities), net of transaction costs, which are classified as an equity instrument under IAS 32.
The group maintained a strong balance sheet and a prudent approach to managing its financial resources. The fundamental structure of the balance sheet remains unchanged, with most of the assets and liabilities relating to our Banking activities. Loans and advances make up the majority of assets. Other items on the balance sheet include treasury assets held for liquidity purposes, and settlement balances in Winterflood. Intangibles, property, plant and equipment, and prepayments are included as other assets. Liabilities are predominantly made up of customer deposits and both secured and unsecured borrowings to fund the loan book.
Total assets increased 4% to £14.0 billion (31 July 2023: £13.6 billion), mainly reflecting growth in the loan book and higher market-making assets. Total liabilities were 3% higher at £12.2 billion (31 July 2023: £11.9 billion), driven primarily by higher customer deposits and market-making liabilities, partly offset by a reduction in borrowings. Both market-making assets and liabilities, which related to trading activity at Winterflood, were higher due to an increase in value traded at the end of the period.
Total equity increased 11% to £1.8 billion (31 July 2023: £1.6 billion), primarily reflecting the issuance of AT1 securities net of transaction costs and profit in the first half, which was partially offset by payments related to the final dividend for the 2023 financial year of £67.1 million (31 January 2023: £65.6 million). The group's return on assets increased to 1.0% (H1 2023: 0.1%).
Group Capital
|
31 January 2024 £ million |
31 July 2023 £ million |
|
|
Common equity tier 1 capital |
1,353.0 |
1,310.8 |
|
Tier 1 capital |
1,553.0 |
1,310.8 |
|
Total capital |
1,753.0 |
1,510.8 |
|
Risk weighted assets |
10,380.2 |
9,847.6 |
|
Common equity tier 1 capital ratio (transitional) |
13.0% |
13.3% |
|
Tier 1 capital ratio (transitional) |
15.0% |
13.3% |
|
Total capital ratio (transitional) |
16.9% |
15.3% |
|
Leverage ratio1 |
12.7% |
11.4% |
1. The leverage ratio is calculated as tier 1 capital as a percentage of total balance sheet assets excluding central bank claims, adjusting for certain capital deductions, including intangible assets, and off-balance sheet exposures, in line with the UK leverage framework under the UK Capital Requirements Regulation.
Movements in Capital and Other Regulatory Metrics
The CET1 capital ratio reduced from 13.3% to 13.0%, mainly driven by loan book growth (-c.60bps), a decrease in IFRS 9 transitional arrangements (-c.20bps) and the Bluestone Motor Finance acquisition (-c.20bps). This was partly offset by capital generation through profit (c.70bps). Following the announcement that the group will not pay any dividends on its ordinary shares for the current financial year, no foreseeable dividend on ordinary shares has been deducted from CET1 capital.
CET1 capital increased 3% to £1,353.0 million (31 July 2023: £1,310.8 million), reflecting capital generation through profit of £68.8 million, partly offset by a decrease in the transitional IFRS 9 add-back to capital of £16.6 million and an increase in intangible assets deducted from capital of £4.9 million.
Tier 1 capital increased 18% to £1,553.0 million (31 July 2023: £1,310.8 million), primarily driven by the issuance of the group's inaugural AT1 in a £200 million transaction to optimise the capital structure and provide further flexibility to grow the business. The transaction strengthened the regulatory capital position by filling the Pillar 1 and Pillar 2A AT1 capacity with the proceeds and was in line with the group's strategy and capital management framework.
Total capital increased 16% to £1,753.0 million (31 July 2023: £1,510.8 million), reflecting the AT1 issuance.
RWAs increased by 5% to £10.4 billion (31 July 2023: £9.8 billion), driven by loan book growth (c.£445 million) primarily in Commercial and Property, and the acquisition of Bluestone Motor Finance (c.£105 million).
At 31 January 2024, CET1, tier 1 and total capital ratios were 13.0% (31 July 2023: 13.3%), 15.0% (31 July 2023: 13.3%) and 16.9% (31 July 2023: 15.3%), respectively.
The CET1, tier 1 and total capital ratio requirements, excluding any applicable Prudential Regulation Authority ("PRA") buffer, were 9.5%, 11.2% and 13.4%, respectively, at 31 January 2024. Accordingly, we continue to have headroom significantly above the requirements of c.350bps in the CET1 capital ratio, c.380bps in the tier 1 capital ratio and c.350bps in the total capital ratio.
The group applies IFRS 9 regulatory transitional arrangements which allow banks to add back to their capital base a proportion of the IFRS 9 impairment charges during the transitional period. Our capital ratios are presented on a transitional basis after the application of these arrangements. On a fully loaded basis, without their application, the CET1, tier 1 and total capital ratios would be 12.9%, 14.8% and 16.8%, respectively.
The leverage ratio, which is a transparent measure of capital strength not affected by risk weightings, increased to 12.7% (31 July 2023: 11.4%).
The PRA published PS 17/23, part one of the near-final rules on the implementation of Basel 3.1 standards, in December 2023. The second part is expected by 30 June 2024, which should provide further clarity regarding the SME supporting factor. The implementation date is set for 1 July 2025. As previously announced, we estimate that if implemented in its current form, it would represent an increase of up to c.10% in the group's RWAs calculated under the standardised approach. This is primarily as a result of the proposed removal of the SME supporting factor, new conversion factor for cancellable facilities and new market risk rules.
As outlined at the Full Year 2023 results, our application to transition to the Internal Ratings Based ("IRB") approach has successfully moved to Phase 2 of the process and engagement with the regulator continues, following our initial application to the PRA in December 2020. Our Motor Finance, Property Finance and Energy portfolios, where the use of models is most mature, were submitted with our initial application.
Further strengthening our capital position
As outlined above, the Board is implementing a range of actions to further strengthen the group's capital position. Additionally, we continue to evaluate other potential management actions which could strengthen the group's available CET1 capital over and above our ongoing organic capital generation through 2025. In all, these measures could strengthen the group's available CET1 capital by approximately £400 million by the end of the 2025 financial year (when compared to the group's projected CET1 capital ratio for 31 July 2025, prior to any management actions). The Board is confident that these decisive actions will position the group well to withstand a range of scenarios and potential outcomes. Nevertheless, there remains considerable uncertainty regarding the specifics of any potential redress scheme, if required, as well as its timing.
Over the medium term, we remain committed to our previous CET1 capital target range of 12% to 13% but expect to operate above this range in the near-term as a result of the identified management actions.
Group Funding1
|
31 January 2024 £ million |
31 July 2023 £ million |
|
|
Customer deposits |
8,264.0 |
7,724.5 |
|
Secured funding |
1,351.3 |
1,676.6 |
|
Unsecured funding2 |
1,227.0 |
1,308.6 |
|
Equity |
1,831.8 |
1,644.9 |
|
Total available funding3 |
12,674.1 |
12,354.6 |
|
Total funding as % of loan book4 |
128% |
130% |
|
Average maturity of funding allocated to loan book5 |
21 months |
21 months |
1. Numbers relate to core funding and exclude working capital facilities at the business level.
2. Unsecured funding excludes £49.0 million (31 July 2023: £44.3 million) of non-facility overdrafts included in borrowings and includes £135.0 million (31 July 2023: £190.0 million) of undrawn facilities.
3. Includes £250 million of funds raised via a senior unsecured bond with a five-year tenor by Close Brothers Group plc, the group's holding company, in June 2023, with proceeds currently used for general corporate purposes.
4. Total funding as a % of loan book includes £282.0 million (31 July 2023: £271.2 million) of operating lease assets in the loan book figure.
5. Average maturity of total available funding, excluding equity and funding held for liquidity purposes.
Our Treasury function is focused on managing funding and liquidity to support the Banking businesses, as well as interest rate risk. This incorporates our Savings business, which provides simple and straightforward savings products to both individuals and businesses, whilst being committed to providing the highest level of customer service.
Our diverse funding sources enable us to adapt our position to changing market conditions and demand. Our conservative approach to funding is based on the principle of "borrow long, lend short", with a spread of maturities over the medium and longer term, comfortably ahead of a shorter average loan book maturity. We have maintained a prudent maturity profile, with the average maturity of funding allocated to the loan book at 21 months (31 July 2023: 21 months), ahead of the average loan book maturity at 16 months (31 July 2023: 16 months).
Our funding draws on a wide range of wholesale and deposit markets including several public debt securities at both group and operating company level, as well as public and private secured funding programmes and a diverse mix of customer deposits. This broad funding base reduces concentration risk and ensures we can adapt our position through the cycle.
We increased total funding in the first half by 3% to £12.7 billion (31 July 2023: £12.4 billion) which accounted for 128% (31 July 2023: 130%) of the loan book at the balance sheet date. The average cost of funding in Banking increased to 5.4% (2023: 3.2%) due to a higher base rate and customer deposit pricing pressure. We took actions to mitigate this pressure by optimising the group's liability mix based on funding needs, customer demand and market pricing, significantly growing our retail deposit base to utilise this lower cost of funding for the group. We are well positioned to continue benefiting from our diverse funding base, and expect cost of funds to be nearing the peak of the current interest rate cycle.
Customer deposits increased 7% to £8.3 billion (31 July 2023: £7.7 billion) overall. Of this, non-retail deposits decreased 3% to £3.4 billion (31 July 2023: £3.5 billion) and retail deposits increased by 16% to £4.9 billion (31 July 2023: £4.2 billion), as we actively sought to grow our retail deposit base. In line with our prudent and conservative approach to funding, our deposits are predominantly term, with only 5% of total deposits available on demand and over 70% having at least three months to maturity. At 31 January 2024, approximately 85% of retail deposits were protected by the Financial Services Compensation Scheme. As of 29 February 2024, there have been no significant changes in our deposit base.
The investment in our customer deposit platform continues to deliver benefits. Deposits held through this platform have grown by c.50% over five years to over £5.6 billion. We continue to drive scalability through an array of funding sources, with both Easy Access and an additional deposit aggregator being introduced over the last year and complementing our existing offering of Notice Accounts and Fixed Rate Cash ISAs. The introduction of Easy Access provides us access to a large potential deposit pool, with Easy Access balances now sitting at c.£250 million. We remain focused on continuing to grow and diversify our retail deposit base and further optimise our cost of funding and maturity profile.
Secured funding decreased 19% to £1.4 billion (31 July 2023: £1.7 billion), with our fifth public Motor Finance securitisation completed in November 2023 more than offset by a £250 million repayment related to our Motor Finance warehouse securitisation and the repayment of £228 million of the Term Funding Scheme for Small and Medium-sized Enterprises ("TFSME") ahead of the scheduled maturity date. This takes our drawings under the scheme to £372 million (31 July 2023: £600 million). Over the next 12 months, £262 million of TFSME will mature, which we expect to replace in line with our diverse funding profile, dependent on market conditions and demand. A further £110 million will mature in October 2025.
Unsecured funding, which includes senior unsecured and subordinated bonds and undrawn committed revolving facilities, reduced 6% to £1.2 billion (31 July 2023: £1.3 billion).
Our credit ratings continue to reflect the group's inherent financial strength, diversified business model and consistent risk appetite. Moody's Investors Services ("Moody's") reaffirmed their rating for Close Brothers Group as "A2/P1" and Close Brothers Limited as "Aa3/P1", in January 2024, whilst downgrading the outlook from "stable" to "negative". Close Brothers Group's subordinated debt rating was also upgraded to A2 from A3 by Moody's. In February 2024, following the end of the first half, Fitch Ratings ("Fitch") downgraded both CBG and CBL long-term Issuer Default Ratings ("IDRs") to BBB+ from A-, and affirmed CBG and CBL short-term IDRs of F2 and "negative" outlook to reflect anticipated lower profitability and risks to earnings from the FCA's motor review.
Group Liquidity
|
31 January 2024 £ million |
31 July 2023 £ million |
|
|
Cash and balances at central banks |
1,658.5 |
1,937.0 |
|
Sovereign and central bank debt1 |
193.3 |
186.1 |
|
Supranational, sub-sovereigns and agency ("SSA") bonds |
145.6 |
- |
|
Covered bonds |
187.8 |
106.3 |
|
Treasury assets |
2,185.2 |
2,229.4 |
1. There was £12 million encumbered sovereign debt and central bank debt and covered bonds at 31 January 2024 (31 July 2023: £nil).
The group continues to adopt a conservative stance on liquidity, ensuring it is comfortably ahead of both internal risk appetite and regulatory requirements.
Maintaining a strong level of liquidity, particularly in light of the significant uncertainty regarding the outcome of the FCA's review, remains a key priority for the group. We have a large, high quality liquid asset portfolio held mainly in cash and government bonds. In the first half, treasury assets were broadly stable at £2.2 billion (31 July 2023: £2.2 billion) and were predominantly held on deposit with the Bank of England.
We regularly assess and stress test the group's liquidity requirements and continue to exceed the liquidity coverage ratio ("LCR") regulatory requirements, with a 12-month average to 31 January 2024 LCR of 1,091% (31 July 2023: 1,143%). In addition to internal measures, we monitor funding risk based on the CRR rules for the net stable funding ratio ("NSFR"). The four-quarter average NSFR to 31 January 2024 was 130.8% (31 July 2023: 126.0%). As of 29 February 2024, there have been no significant changes to these ratios.
Business Review
Banking
Key Financials
|
First half 2024 £ million |
First half 2023 £ million |
Change % |
|
|
Operating income |
365.3 |
363.9 |
0 |
|
Adjusted operating expenses |
(211.8) |
(186.7) |
13 |
|
Impairment losses on financial assets |
(41.8) |
(162.2) |
(74) |
|
Adjusted operating profit |
111.7 |
15.0 |
645 |
|
Adjusted operating profit, pre provisions |
153.5 |
177.2 |
(13) |
|
Net interest margin |
7.5% |
8.0% |
|
|
Expense/income ratio |
58% |
51% |
|
|
Bad debt ratio |
0.9% |
3.6% |
|
|
Return on net loan book |
2.3% |
0.3% |
|
|
Return on opening equity |
12.3% |
1.1% |
|
|
Closing loan book and operating lease assets |
9,893.0 |
9,041.0 |
9 |
Key Financials (Excluding Novitas)
|
First half 2024 £ million |
First half 2023 £ million |
Change % |
|
|
Operating income |
360.3 |
349.9 |
3 |
|
Adjusted operating expenses |
(209.2) |
(182.4) |
15 |
|
Impairment losses on financial assets |
(39.6) |
(47.6) |
(17) |
|
Adjusted operating profit |
111.5 |
119.9 |
(7) |
|
Adjusted operating profit, pre provisions |
151.1 |
167.5 |
(10) |
|
Net interest margin |
7.5% |
7.8% |
|
|
Expense/income ratio |
58% |
51% |
|
|
Bad debt ratio |
0.8% |
1.1% |
|
|
Closing loan book and operating lease assets |
9,830.3 |
8,979.1 |
9 |
Continued demand and loan book growth across our businesses, as we maintained our pricing discipline and improved underlying credit performance
The market backdrop has been mixed in the first half. Whilst we have seen some improvement in macroeconomic indicators, economic headwinds remain as interest rates have stabilised at higher levels and inflation persists. Notwithstanding the uncertainty this creates for individuals and SMEs, we continued to support our customers and lend through the cycle as we consistently applied our prudent underwriting and pricing discipline.
Banking adjusted operating profit increased to £111.7 million (H1 2023: £15.0 million), with the prior year period including an impairment charge of £114.6 million in relation to Novitas. On a pre-provision basis, adjusted operating profit decreased 13% to £153.5 million (H1 2023: £177.2 million).
Excluding Novitas, Banking adjusted operating profit decreased 7% to £111.5 million (H1 2023: £119.9 million), as income growth and lower impairment charges were more than offset by higher costs.
The loan book grew 4% in the first half to £9.9 billion (31 July 2023: £9.5 billion), driven by strong growth in Property and continued good demand in Asset Finance and the UK Motor Finance business, partly offset by the normal seasonal impact seen in the Premium and Invoice Finance businesses.
Excluding the businesses in run-off, Novitas and the legacy Republic of Ireland Motor Finance, the loan book grew 5% to £9.7 billion (31 July 2023: £9.3 billion).
Operating income increased marginally to £365.3 million (H1 2023: £363.9 million), reflecting loan book growth and strong margins, whilst the prior year period benefitted from movements in derivatives outside of a hedge accounting relationship (mark-to-market swaps) (£7 million benefit in H1 2023 versus £4 million adverse impact in H1 2024) and Novitas income (£14 million in H1 2023 versus £5 million income in H1 2024). Excluding the impact of these movements in derivatives and Novitas, operating income grew 6%, driven by loan book growth.
Whilst we remained focused on pricing discipline and optimising the group's liability mix and funding costs in the higher rate environment, the net interest margin decreased to 7.5% (H1 2023: 8.0%, 2023: 7.7%) on a reported basis, primarily reflecting the impact of the derivatives not designed as hedging instruments and Novitas benefitting the prior year period. Excluding the impact of these items, the net interest margin was broadly stable at 7.6% (H1 2023: 7.7%, H2 2023: 7.6%). We are well positioned to maintain a strong net interest margin and pass on higher cost of funds as we remain focused on asset pricing.
Across the Banking division, we have invested to support our relationship-based model and make our experts even more valuable. We have recently completed the Asset Finance transformation programme, which has introduced a single platform across the business, standardising processes, increasing efficiencies and improving customer insights. Through the investment made in the Motor Finance business, we have created the ability to partner with more finance technology providers, such as iVendi and AutoConvert, as well as increasing capability from existing providers, resulting in an uplift in finance proposal volumes and giving us access to a wider pool of motor retailers. We continue to build on the investment made in our Savings business to grow our deposit base and customer numbers. Furthermore, following a programme to implement the requirements of the FCA's Consumer Duty, our focus remains on embedding compliance and implementing Consumer Duty changes for books of business not open to new customers. We continue to see investment through the cycle as vital in protecting our model, enhancing efficiency and future-proofing our income generation capabilities.
Although operating expenses increased 13% to £211.8 million (H1 2023: £186.7 million), when looking at consecutive halves, we incurred a higher rate of cost growth in the second half of the 2023 financial year (9% / £16.3 million increase) compared to the first half of 2024 (4% / £8.8 million increase). This was mainly due to the timing of investment spend over the period.
The overall increase in operating expenses was driven by higher staff costs to reflect inflation-related salary rises and new hires, investment in our strategic programmes and cost saving initiatives, volume and activity-driven growth, and the acquisition of Bluestone Motor Finance. This was partially offset by efficiency savings. We also incurred additional costs related to the handling of heightened complaint volumes in Motor Finance. The expense/income ratio increased to 58% (H1 2023: 51%) and the compensation ratio rose to 32% (H1 2023: 29%), reflecting the normalisation of performance-driven bonuses.
We remain on track to deliver c.8-10% growth in Banking costs in the 2024 financial year, excluding costs related to the recently announced acquisition of Bluestone Motor Finance (Ireland). We expect growth in the Banking cost base over the 2024 financial year to be driven primarily by volume and activity-driven growth, inflationary-related increases and higher resulting compensation, investment spend and c.£10 million of costs related to the heightened volume of complaints in the Motor Finance business regarding historical discretionary commission arrangements. This increase is being partly offset by the progress we have made on our tactical and strategic cost management initiatives. We expect to incur c.£8 million (2023: £8.7 million) of costs related to Novitas as we continue to wind down the business.
In addition to this growth, we expect to incur c.£7 million of costs over the 2024 financial year in relation to the acquisition, integration and running of Bluestone Motor Finance (Ireland), which completed in October 2023.
We have made good progress on our strategic cost management initiatives. Our technology transformation programme, initiated in 2023, aims to simplify our technology estate as well as consolidating and increasing our use of outsourcing. As part of this, we have already removed 83 IT applications, with more in the pipeline, and reduced our headcount by c.100.
In the period we have mobilised further cost management initiatives to support the ongoing profitability of the business, particularly in light of the capital actions and their expected impact on future income. These include rationalising our third party suppliers and property footprint, and adjusting our workforce to drive increased efficiency and effectiveness. We expect these measures to deliver annualised savings of £20 million by the 2026 financial year.
With the benefit of these additional measures, we remain committed to more closely aligning income and cost growth (excluding any restructuring costs) in the 2025 financial year, and delivering positive operating leverage over the medium term.
Impairment charges decreased significantly to £41.8 million (H1 2023: £162.2 million), corresponding to an annualised bad debt ratio of 0.9% (H1 2023: 3.6%), with the prior year period including a charge of £114.6 million in relation to Novitas. Overall provision coverage increased marginally to 4.1% (31 July 2023: 3.9%).
Excluding Novitas, impairment charges reduced 17% to £39.6 million (H1 2023: £47.6 million), mainly driven by the improved macroeconomic outlook compared to the prior year period, partly offset by loan book growth and the ongoing review of provisions and coverage across our loan portfolios. The bad debt ratio, excluding Novitas, reduced to 0.8% annualised (H1 2023: 1.1%) and remains below our long-term bad debt ratio of 1.2%. The coverage ratio remained stable at 2.1% (31 July 2023: 2.1%), excluding Novitas.
Whilst we have not seen a significant impact on credit performance, we continue to monitor closely the evolving impacts of inflation and cost of living on our customers. We remain confident in the quality of our loan book, which is predominantly secured or structurally protected, prudently underwritten, diverse, and supported by the deep expertise of our people. We continue to expect the bad debt ratio for H2 2024 to remain below our long-term average, based on current market conditions.
Progress on resolving issues relating to Novitas
The decision was made to wind down Novitas and withdraw from the legal services financing market following a strategic review in July 2021, which concluded that the overall risk profile of the business was no longer compatible with our long-term strategy and risk appetite. As announced in H1 2023, we have accelerated our efforts to resolve the issues surrounding this business. We continue to pursue formal legal action against one of the After the Event ("ATE") insurers and have entered into a settlement with another smaller ATE insurer.
We recognised impairment charges of £2.2 million in relation to Novitas in the first half, mainly comprising legal costs. While we will continue to review provisioning levels in light of future developments, including the experienced credit performance of the book and the outcome of the group's initiated legal action, we believe the provisions adequately reflect the remaining risk of credit losses for the Novitas loan book (c.£63 million net loan book at 31 January 2024).
In addition, in line with IFRS 9 requirements, a proportion of the expected credit loss is expected to unwind, over the estimated time to recovery period, to interest income. The group remains focused on maximising the recovery of remaining loan balances, either through successful outcome of cases or recourse to the customers' ATE insurers, whilst complying with its regulatory obligations and always focusing on ensuring good customer outcomes. We expect net income related to Novitas to reduce from £18.9 million in 2023 to c.£10 million in 2024.
Loan Book Analysis
|
31 January 2024 |
31 July 2023 |
Change |
|
|
£ million |
£ million |
% |
|
|
Commercial |
5,028.5 |
4,821.3 |
4 |
|
Commercial - Excluding Novitas |
4,965.8 |
4,761.4 |
4 |
|
Asset Finance1 |
3,687.8 |
3,481.3 |
6 |
|
Invoice and Speciality Finance1 |
1,340.7 |
1,340.0 |
- |
|
Invoice and Speciality Finance - Excluding Novitas1 |
1,278.0 |
1,280.1 |
- |
|
Retail |
3,025.9 |
3,001.8 |
1 |
|
Motor Finance2 |
1,984.0 |
1,948.4 |
2 |
|
Premium Finance |
1,041.9 |
1,053.4 |
(1) |
|
Property |
1,838.6 |
1,703.1 |
8 |
|
Closing loan book and operating lease assets3 |
9,893.0 |
9,526.2 |
4 |
|
Closing loan book and operating lease assets - Excluding Novitas |
9,830.3 |
9,466.3 |
4 |
1. The Asset Finance and Invoice and Speciality Finance loan books have been re-presented for 31 July 2023 to reflect the recategorization of Close Brothers Brewery Rentals ("CBBR") from Invoice and Speciality Finance to Asset Finance.
2. The Motor Finance loan book includes £144.5 million (31 July 2023: £206.7million) relating to the Republic of Ireland Motor Finance business, which is in run-off following the cessation of our previous partnership in the Republic of Ireland from 30 June 2022.
3. Includes operating lease assets of £282.0 million (31 July 2023: £271.2 million).
Focus on disciplined growth
During the first half, we remained focused on delivering disciplined growth whilst prioritising our margins and credit quality, with our growth initiatives delivering a significant contribution of loan book growth.
The loan book grew 4% in the six months since 31 July 2023 to £9.9 billion (31 July 2023: £9.5 billion). This reflected strong growth in Property and continued good demand in Asset Finance and the UK Motor Finance business. This was partly offset by the normal seasonal impact seen in the Premium and Invoice Finance businesses, and the run-off of the legacy Republic of Ireland Motor Finance loan book.
Excluding the businesses in run-off, Novitas and the legacy Republic of Ireland Motor Finance business, the loan book grew 5% to £9.7 billion (31 July 2023: £9.3 billion).
The Commercial loan book grew 4% to £5.0 billion (31 July 2023: £4.8 billion), despite the roll-off of government supported lending under schemes such as the Coronavirus Business Interruption Loan Scheme ("CBILS"). Asset Finance delivered loan book growth of 6%, with strong new business volumes in the Leasing business particularly from the Contract Hire, Energy and Materials Handling portfolios. Invoice and Speciality Finance was broadly stable reflecting the normal seasonal impact in the first half, notwithstanding a slight uptick in Invoice Finance utilisation. Excluding Novitas, the Commercial book increased 4% to £5.0 billion (31 July 2023: £4.8 billion).
The Retail loan book grew 1% to £3.0 billion (31 July 2023: £3.0 billion). Motor Finance increased 2%, with growth in the UK Motor Finance business more than offsetting the decline in the legacy Republic of Ireland loan book following the cessation of our previous partnership in June 2022. Following the acquisition of Bluestone Motor Finance (Ireland), which completed in October 2023, the Motor Finance business is re-building its presence in the Republic of Ireland with a loan book of £16 million at 31 January 2024. The Premium Finance loan book has achieved record levels in the first half, with strong demand from customers alongside continued premium inflation. However, the book contracted 1% since 31 July 2023 due to normal seasonality.
The legacy Republic of Ireland Motor Finance business accounted for 7% of the Motor Finance loan book (31 July 2023: 11%) and 1% of the Banking loan book (31 July 2023: 2%).
The Property loan book grew 8% as we saw strong drawdowns from our healthy new business pipeline in the first half, with the stabilisation of interest rates and improving market sentiment.
We expect to broadly sustain underlying loan book growth in the second half of the 2024 financial year.
Banking: Commercial
|
First half 2024 £ million |
First half 2023 £ million |
Change % |
|
|
Operating income |
168.5 |
182.3 |
(8) |
|
Adjusted operating expenses |
(103.0) |
(92.9) |
11 |
|
Impairment losses on financial assets |
(14.6) |
(122.5) |
(88) |
|
Adjusted operating profit |
50.9 |
(33.1) |
(254) |
|
Adjusted operating profit, pre provisions |
65.5 |
89.4 |
(27) |
|
Net interest margin |
6.8% |
8.0% |
|
|
Expense/income ratio |
61% |
51% |
|
|
Bad debt ratio |
0.6% |
5.4% |
|
|
Closing loan book and operating lease assets1 |
5,028.5 |
4,550.3 |
11 |
Commercial key metrics excluding Novitas
|
First half 2024 £ million |
First half 2023 £ million |
Change % |
|
|
Operating income |
163.5 |
168.3 |
(3) |
|
Adjusted operating expenses |
(100.4) |
(88.6) |
13 |
|
Impairment losses on financial assets |
(12.4) |
(7.9) |
57 |
|
Adjusted operating profit |
50.7 |
71.8 |
(29) |
|
Adjusted operating profit, pre provisions |
63.1 |
79.7 |
(21) |
|
Net interest margin |
6.7% |
7.6% |
|
|
Expense/income ratio |
61% |
53% |
|
|
Bad debt ratio |
0.5% |
0.4% |
|
|
Closing loan book and operating lease assets1 |
4,965.8 |
4,488.4 |
11 |
1. Operating lease assets of £282.0 million (31 July 2023: £271.2 million).
Good demand in Commercial as we continued to support our SME customers
The Commercial businesses provide specialist, predominantly secured lending principally to the SME market and include Asset Finance and Invoice and Speciality Finance. We finance a diverse range of sectors, with Asset Finance offering commercial asset financing, hire purchase and leasing solutions across a broad range of assets including commercial vehicles, machine tools, contractors' plant, printing equipment, company car fleets, energy project finance, and aircraft and marine vessels, as well as our Vehicle Hire and Brewery Rentals businesses. The Invoice and Speciality Finance business provides debt factoring, invoice discounting and asset-based lending, and also includes Novitas. As previously announced, Novitas ceased lending to new customers in July 2021.
Despite market uncertainty persisting in the period, the diversity of our offering has resulted in customer demand remaining strong. We reached a significant milestone in the first half, with the Commercial loan book exceeding £5 billion following good new business volumes. Our new initiatives continue to prove successful, with the agricultural equipment and materials handling teams both having written healthy levels of new business, and our second syndication deal completed by Invoice Finance.
Adjusted operating profit for Commercial increased to £50.9 million (H1 2023: loss of £33.1 million), reflecting a significant decrease in impairment charges. On a pre-provision basis, adjusted operating profit reduced 27% to £65.5 million (H1 2023: £89.4 million).
Excluding Novitas, adjusted operating profit decreased 29% to £50.7 million (H1 2023: £71.8 million), mainly driven by cost growth.
Operating income reduced 8% to £168.5 million (H1 2023: £182.3 million) as the benefit from loan book growth was offset by pressure on margin on new business in Asset Finance and a reduction in Novitas income. The net interest margin decreased to 6.8% (H1 2023: 8.0%) as we sought to balance the repricing of new business written in Asset Finance with our focus on maintaining support to our customers impacted by the higher inflationary environment. In addition, loan book growth mix in the first half reflected increased new business levels in some of our portfolios with larger loan sizes and lower margin, such as Energy. Excluding Novitas, the net interest margin decreased to 6.7% (H1 2023: 7.6%).
Operating expenses grew 11% to £103.0 million (H1 2023: £92.9 million), driven by higher staff costs and investment spend as we completed the Asset Finance transformation programme. This was partly offset by lower costs in relation to Novitas. As a result, the expense/income ratio increased to 61% (H1 2023: 51%).
Impairment charges decreased significantly to £14.6 million (H1 2023: £122.5 million), with £114.6 million incurred in relation to Novitas in the prior year period. Provision coverage increased slightly to 5.4% (31 July 2023: 5.2%).
Excluding Novitas, impairment charges rose to £12.4 million (H1 2023: £7.9 million), reflecting loan book growth and the ongoing review of provisions and coverage. This resulted in a bad debt ratio of 0.5% annualised (H1 2023: 0.4%). The coverage ratio remained broadly stable at 1.5% (31 July 2023: 1.4%), excluding Novitas.
Banking: Retail
|
First half 2024 £ million |
First half 2023 £ million |
Change % |
|
|
Operating income |
131.8 |
123.2 |
7 |
|
Operating expenses |
(90.8) |
(79.1) |
15 |
|
Impairment losses on financial assets |
(22.0) |
(29.4) |
(25) |
|
Operating profit |
19.0 |
14.7 |
29 |
|
Operating profit, pre provisions |
41.0 |
44.1 |
(7) |
|
Net interest margin |
8.7% |
8.2% |
|
|
Expense/income ratio |
69% |
64% |
|
|
Bad debt ratio |
1.5% |
1.9% |
|
|
Closing loan book1 |
3,025.9 |
2,970.3 |
2 |
1. The Motor Finance loan book includes £144.5 million (31 July 2023: £206.7 million) relating to the legacy Republic of Ireland Motor Finance business, which is in run-off following the cessation of our previous partnership in the Republic of Ireland from 30 June 2022.
Continued focus on prioritising our margins and underwriting discipline
The Retail businesses provide intermediated finance, through motor dealers, motor finance brokers and insurance brokers. Finance is provided to both individuals and to a broad spectrum of UK businesses.
Although the backdrop remained mixed in the first half, we delivered a good performance overall. In Motor Finance, we saw a significant year-on-year increase in new business volumes as we increased our routes to market through new intermediaries, emerging channels and consumer brands, in line with our ethos of being where the consumer chooses finance. The acquisition of Bluestone Motor Finance is providing a platform for us to re-build our Motor Finance business in the Republic of Ireland. In Premium Finance, we remain focused on providing excellent service levels to both our customers and partners in the purchase of insurance. We continue to enhance our proposition to support our broker partners and their customers, be they individuals or businesses. We have continued to focus on providing insight and capabilities to our partners to aid them in delivering improved outcomes.
Operating profit for Retail increased to £19.0 million (H1 2023: £14.7 million), as income growth and lower impairment charges more than offset higher costs. On a pre-provision basis, operating profit reduced 7% to £41.0 million (H1 2023: £44.1 million).
Operating income increased 7% to £131.8 million (H1 2023: £123.2 million), reflecting growth in the Premium Finance loan book compared to the prior year period and a recovery in the net interest margin to 8.7% (H1 2023: 8.2%) following the absorption of funding increases last year.
Operating expenses rose 15% to £90.8 million (H1 2023: £79.1 million), driven mainly by additional costs related to the handling of heightened complaint volumes in Motor Finance, as well as higher staff costs and the acquisition of Bluestone Motor Finance. As a result, the expense/income ratio increased to 69% (H1 2023: 64%).
As previously outlined, the FCA is conducting a review of historical motor finance commission arrangements and sales at several firms, following high numbers of complaints from customers. The estimated impact of any redress scheme, if required, is highly dependent on a number of factors and as such, at this early stage, the timing, scope and quantum of a potential financial impact on the group, if any, cannot be reliably estimated at present. We continue to monitor the impact on our current handling of complaints and are following the playbooks in place to ensure we have the appropriate resources to respond effectively. We expect to incur costs of c.£10 million in the 2024 financial year in relation to the heightened volume of complaints.
Impairment charges reduced to £22.0 million (H1 2023: £29.4 million), resulting in an annualised bad debt ratio of 1.5% (H1 2023: 1.9%). This was driven primarily by an improvement in the macroeconomic outlook compared to the prior year period, partly offset by model refinements. As reported previously, following an increase in arrears in Motor Finance in the first half of the 2023 financial year, they have since remained stable, albeit at a higher level than pre-pandemic, reflecting cost of living pressures on our customers. The provision coverage ratio remained stable at 2.9% (31 July 2023: 2.9%).
We remain confident in the credit quality of the Retail loan book. The Motor Finance loan book is predominantly secured on second hand vehicles which are less exposed to depreciation or significant declines in value than new cars. Our core Motor Finance product remains hire-purchase contracts, with less exposure to residual value risk associated with Personal Contract Plans ("PCP"), which accounted for c.9% of the Motor Finance loan book at 31 January 2024 (c.9% at 31 July 2023). The Premium Finance loan book benefits from various forms of structural protection including premium refundability and, in most cases, broker recourse for the personal lines product.
Banking: Property
|
First half 2024 £ million |
First half 2023 £ million |
Change % |
|
|
Operating income |
65.0 |
58.4 |
11 |
|
Operating expenses |
(18.0) |
(14.7) |
22 |
|
Impairment losses on financial assets |
(5.2) |
(10.3) |
(50) |
|
Operating profit |
41.8 |
33.4 |
25 |
|
Operating profit, pre provisions |
47.0 |
43.7 |
8 |
|
Net interest margin |
7.3% |
7.8% |
|
|
Expense/income ratio |
28% |
25% |
|
|
Bad debt ratio |
0.6% |
1.4% |
|
|
Closing loan book |
1,838.6 |
1,520.4 |
21 |
Strong drawdowns from our healthy pipeline driving loan book growth
Property comprises Property Finance and Commercial Acceptances. The Property Finance business is focused on specialist residential development finance to established professional developers in the UK. Commercial Acceptances provides bridging loans and loans for refurbishment projects.
This half year has seen some cautious optimism returning to the UK property market, following a slowdown in the prior year. Whilst some economic headwinds remain, a stabilisation of interest rates has led to improved buyer sentiment and is supporting residential developers in making investment decisions. Although we have seen some pressure on our lending margins, we remain focused on retaining our pricing discipline and relationship-led proposition, supporting our clients through-the-cycle. We have continued to see good demand for initiatives including our regional expansion, our enhanced loan-to-value product and our partnership with Travis Perkins, which enables SME housebuilders to access discounted building supplies and materials directly via a credit facility. Our pipeline remains strong at c.£1.1 billion.
Operating profit increased 25% to £41.8 million (H1 2023: £33.4 million), as income growth and a reduction in impairment charges more than offset an increase in operating expenses. On a pre-provision basis, operating profit increased 8% to £47.0 million (H1 2023: £43.7 million).
Operating income rose 11% to £65.0 million (H1 2023: £58.4 million), driven by strong loan book growth, although the net interest margin decreased to 7.3% (H1 2023: 7.8%), mainly reflecting lower fee yields than the prior period.
Operating expenses increased to £18.0 million (H1 2023: £14.7 million), reflecting higher staff costs. As a result, the expense/income ratio increased to 28% (H1 2023: 25%).
Impairment charges decreased to £5.2 million (H1 2023: £10.3 million), resulting in an annualised bad debt ratio of 0.6% (H1 2023: 1.4%). This was driven by lower impairment charges to reflect an improvement in macroeconomic variables and outlook, partly offset by loan book growth and an ongoing review of provisions and coverage, which included increased specific provisions for existing single names. The provision coverage ratio remained broadly stable at 2.5% (31 July 2023: 2.4%).
The Property loan book is conservatively underwritten. We work with experienced, professional developers, predominantly SMEs with a focus on delivering mid-priced family housing, and have minimal exposure to the prime central London market, with our regional loan book making up over 50% of the Property Finance portfolio. Our long track record, expertise and quality of service ensure the business remains resilient to competition and continues to generate high levels of repeat business.
Asset Management
Key Financials1
|
First half 2024 £ million |
First half 2023 £ million |
Change % |
|
|
Investment management |
61.3 |
54.2 |
13 |
|
Advice and other services |
14.0 |
15.7 |
(11) |
|
Other income2 |
1.0 |
1.1 |
(9) |
|
Operating income |
76.3 |
71.0 |
7 |
|
Adjusted operating expenses1 |
(70.0) |
(62.4) |
12 |
|
Impairment losses on financial assets |
- |
- |
- |
|
Adjusted operating profit |
6.3 |
8.6 |
(27) |
|
Revenue margin (bps) |
84 |
83 |
|
|
Operating margin |
8% |
12% |
|
|
Return on opening equity |
7.6% |
13.1% |
1. Adjusted measures are presented on a basis consistent with prior periods and exclude amortisation of intangible assets on acquisition, to present the performance of the group's acquired businesses consistent with its other businesses; and any exceptional and other adjusting items which do not reflect underlying trading performance. Further detail on the reconciliation between operating and adjusted measures can be found in note 2.
2. Other income includes net interest income and expense, income on principal investments and other income.
Well placed to build on successful growth
Close Brothers Asset Management provides personal financial advice and investment management services to private clients in the UK, including full bespoke management, managed portfolios and funds, distributed both directly via our advisers and investment managers, and through third party financial advisers.
Total operating income rose 7% to £76.3 million (H1 2023: £71.0 million), reflecting positive net inflows and market movements, with growth in AuM delivered by our bespoke investment management business resulting in higher investment management income. As a result, the revenue margin increased marginally to 84bps (H1 2023: 83bps).
Adjusted operating expenses increased 12% to £70.0 million (H1 2023: £62.4 million), reflecting higher staff costs mainly due to investment in new hires and inflation-related salary increases. Of this, £5.0 million (H1 2023: £3.3 million) of costs related to the hiring of investment managers and the associated AuM in the bespoke investment management business. The expense/income ratio grew to 92% (H1 2023: 88%), with the compensation ratio also increasing to 63% (H1 2023: 58%). Our previous investments in technology have driven increased efficiency and operational resilience, whilst also improving client experience.
Adjusted operating profit in CBAM decreased 27% to £6.3 million (H1 2023: £8.6 million), as growth in income was more than offset by higher costs. The operating margin reduced to 8% (H1 2023: 12%), corresponding to 15% (H1 2023: 17%) when excluding the costs related to the hiring of investment managers and the associated AuM in the bespoke investment management business. Statutory operating profit before tax was £5.7 million (H1 2023: £7.8 million).
CBAM has a strong track record of growth, with healthy net inflows delivered by successfully serving existing clients and attracting new clients, combined with building new investment teams and acquiring selective IFA businesses. The business remains closely aligned with long-term structural growth opportunity presented by the wealth management industry and continues to be an attractive franchise for both portfolio managers and clients.
We continued to deliver growth in the first half through the hiring of nine bespoke investment managers (H1 2023: five). Following a period of strong growth in our Bespoke business, our priority in this channel is now to consolidate our position and maximise opportunities to accelerate our profitability, shifting our focus to selective bespoke investment management hiring only. In our Wealth Planning business, we announced the acquisition of Bottriell Adams in December 2023.
We have recently completed a refresh of our brand, reflecting CBAM's four values of Clients, People, Integrity, and Excellence. We offer an attractive proposition built around these values, with almost 90 financial planners and over 75 bespoke investment managers across 15 locations around the UK focused on providing excellent service.
Strong net inflows notwithstanding economic uncertainty
Notwithstanding the uncertainty around the economic outlook in the first quarter, we saw an uptick in equity markets and in turn, investor sentiment in the second quarter. Over the period, we saw strong net inflows of £732 million (H1 2023: £474 million) and delivered an annualised net inflow rate of 9% (H1 2023: 6%), with the bespoke investment management business contributing significantly to the overall inflow rate. This momentum has continued since the first half, with the annualised net inflow rate unchanged at 9% at the end of February 2024.
Total managed assets increased 8% to £17.7 billion (31 July 2023: £16.4 billion), driven by strong net inflows and positive market performance. Total client assets, which includes advised and managed assets, also increased by 7% to £18.5 billion (31 July 2023: £17.3 billion).
In December 2023, we announced the acquisition of Bottriell Adams, an IFA business based in Dorset with approximately £220 million of assets. Bottriell Adams' partners, financial planners and support team joined us as part of the acquisition, as CBAM extends its regional presence in the South West. The acquisition completed in March and the associated client assets will be reflected in AuA in the second half of the year.
Whilst substantive compliance with the FCA's Consumer Duty requirements has been achieved, our focus remains on embedding compliance and ensuring the appropriate frameworks and governance are in place to monitor good customer outcomes. We continue to assess the value for money that CBAM's funds provide annually and are comfortable with the current fees payable.
Movement in Client Assets
|
Six months to 31 January 2024 £ million |
12 months to 31 July 2023 £ million |
Six months to 31 January 2023 £ million |
|
|
Opening managed assets |
16,419 |
15,302 |
15,302 |
|
Inflows |
1,621 |
2,729 |
1,155 |
|
Outflows |
(889) |
(1,411) |
(681) |
|
Net inflows |
732 |
1,318 |
474 |
|
Market movements |
524 |
(201) |
(61) |
|
Total managed assets |
17,675 |
16,419 |
15,715 |
|
Advised only assets |
872 |
907 |
1,196 |
|
Total client assets1 |
18,547 |
17,326 |
16,911 |
|
Annualised net flows as % of opening managed assets |
9% |
9% |
6% |
1. Total client assets include £5.0 billion of assets (31 July 2023: £4.9 billion) that are both advised and managed.
Fund performance
Our funds and segregated bespoke portfolios are designed to provide attractive risk-adjusted returns for our clients, consistent with their long-term goals and investment objectives. Fund performance in the first half has been good across asset classes, with all our funds delivering positive absolute returns during the period, and most of our funds outperforming their peer group. Given the uncertain market conditions seen, particularly in the first quarter, these results demonstrate the strength of our investment team.
Our sustainable funds and Net Zero commitment
At CBAM, we believe that sustainability is an important part of achieving excellence and building wealth for our clients. Our approach to responsible investment is to continue to integrate the evaluation of material ESG factors within our investment research process over time, with the goal of widening our information set to evaluate investments risk and financial return.
We continue to explore options for enhancing our sustainable offering, which includes ethical screening, sustainable funds and our Socially Responsible Investment Service. Our Sustainable Select Fixed Income fund, which utilises a sustainable investment methodology to target a reduction in CO2 emissions intensity versus its benchmark, has seen good traction since its creation in March 2023 and we continue to see strong inflows into this product.
We became signatories to the Net Zero Asset Managers initiative in September 2022 and as part of our initial target disclosure, committed to 18% of our AuM being in line with net zero by 2050.
Well positioned to consolidate our position
Following a period of strong growth, our priority is to consolidate our position and maximise opportunities to accelerate our profitability through providing excellent service, building on the strength of our client relationships, and in our Bespoke business by shifting our focus to only selective hiring of bespoke investment managers. We continue to target net inflows in the range of 6-10% and following a period of significant investment, expect our operating margin to increase from 2025 onwards towards a longer-term target of above 20%. We remain confident that our vertically integrated, multi-channel business model positions us well for ongoing demand for our services and the structural growth opportunity presented by the wealth management industry.
Winterflood
Key Financials
|
First half 2024 £ million |
First half 2023 £ million |
Change % |
|
|
Operating income |
34.2 |
39.0 |
(12) |
|
Operating expenses |
(36.9) |
(36.6) |
1 |
|
Impairment gains on financial assets |
0.1 |
- |
n/a |
|
Operating (loss) / profit |
(2.6) |
2.4 |
(208) |
|
Average bargains per day ('000) |
52 |
61 |
|
|
Operating margin |
(8%) |
6% |
|
|
Return on opening equity |
(4.1%) |
3.9% |
|
|
Loss days |
3 |
1 |
|
|
Winterflood Business Services Assets under Administration (billion) |
13.8 |
12.4 |
Uncertain macroeconomic outlook continued to negatively affect trading performance
Winterflood is a leading UK market maker, delivering high quality execution services to platforms, stockbrokers, wealth managers and institutional investors, as well as providing corporate advisory services to investment trusts and outsourced dealing and custody services via Winterflood Business Services ("WBS").
In the first half, the market environment, both domestically and globally, remained challenging as UK macroeconomic factors and geopolitical concerns continued to impact investor confidence. With investors able to achieve equity-like returns from money markets and debt instruments, which have a lower risk profile, we have seen relatively subdued trading and Investment Trusts corporate activity. As a result, Winterflood delivered an operating loss of £2.6 million (H1 2023: operating profit of £2.4 million), with broadly stable costs more than offsetting a decline in income.
Operating income reduced 12% to £34.2 million (H1 2023: £39.0 million), with the decline in trading income more than offsetting growth in WBS.
Trading income decreased 19% to £25.6 million (H1 2023: £31.7 million) reflecting the unfavourable market conditions, particularly in the first quarter, as equity and bond prices declined. Whilst performance improved in the second quarter, as central bank monetary policy began to positively impact inflation, the recent dampening of rate cut expectations in the short-term has weighed on market sentiment. Average daily bargains declined 15% to 52k (H1 2023: 61k) in the first half, although we have maintained our market leading position.
Notwithstanding low issuance and transaction volumes in the period, income from the Investments Trusts corporate business has increased 31% to £1.7 million (H1 2023: £1.3 million). We are exploring growth opportunities which are additive to the business and remain well placed for when market activity returns.
WBS continued to see good momentum, with income rising 24% to £7.8 million (H1 2023: £6.3 million). AuA increased 11% year-on-year to £13.8 billion (H1 2023: £12.4bn, 2023: £12.9 billion), supported by positive market movements and net inflows, as equity markets recovered in the second quarter. WBS remains focused on developing its client relationships and investing in its award-winning proprietary technology to provide highly scalable and bespoke solutions for clients. WBS is well positioned for further growth, both organically and supported by a solid pipeline of clients, having exceeded its original target AuA of £10 billion in the 2023 financial year. We remain confident in the outlook and expect the business to grow AuA to over £20 billion by full year 2026.
Operating expenses increased marginally to £36.9 million (H1 2023: £36.6 million), primarily driven by inflation-related salary increases and one-off costs incurred by relocating premises. This was partly offset by reduced variable compensation and a decline in settlement fees resulting from lower trading activity.
Given ongoing UK economic pressures, we have recently undertaken a cost review to right-size elements of the business, to ensure we are appropriately and efficiently organised to meet current business requirements, whilst remaining scalable for future growth. This cost review will result in annualised fixed cost savings of 5% in 2025. We remain focused on driving efficiencies and optimising organisational resilience, whilst maintaining the strengths of the franchise for when investor activity returns.
Winterflood has a long track record of trading profitably through a range of conditions and remains well placed to retain our market position and benefit when investor appetite returns. We continue to diversify our revenue streams and explore growth opportunities to balance the cyclicality seen in the trading business, with WBS expecting to grow AuA to over £20 billion by 2026.
Definitions
Adjusted: Adjusted measures are presented on a basis consistent with prior periods and exclude amortisation of intangible assets on acquisition, to present the performance of the group's acquired businesses consistent with its other businesses; and any exceptional and other adjusting items which do not reflect underlying trading performance
Additional Tier 1 ("AT1") capital: Additional regulatory capital that along with CET1 capital makes up a bank's Tier 1 regulatory capital. Includes the group's perpetual subordinated contingent convertible securities classified as other equity instruments under IAS 32
Assets under administration: Total assets for which Winterflood Business Services provide custody and administrative services
Bad debt ratio: Impairment losses in the year as a percentage of average net loans and advances to customers and operating lease assets
Bargains per day: Average daily number of Winterflood's trades with third parties
Business as usual ("BAU") costs: Operating expenses excluding depreciation and other costs related to investments
Bounce Back Loan Scheme ("BBLS"): UK government business lending scheme that helped small and medium-sized businesses to borrow between £2,000 and £50,000 (up to a maximum of 25% of their turnover)
Capital Requirements Regulation ("CRR"): Capital Requirements Regulation as implemented in the PRA Rulebook CRR Instrument and the PRA Rulebook CRR Firms: Leverage Instrument (collectively known as "CRR")
CET1 capital ratio: Measure of the group's CET1 capital as a percentage of risk weighted assets, as required by CRR
Common equity tier 1 ("CET1") capital: Measure of capital as defined by the CRR. CET1 capital consists of the highest quality capital including ordinary shares, share premium account, retained earnings and other reserves, less goodwill and certain intangible assets and other regulatory adjustments
Compensation ratio: Total staff costs as a percentage of adjusted operating income
Coronavirus Business Interruption Loan Scheme ("CBILS"): UK government business lending scheme that helped small and medium-sized businesses access loans and other kinds of finance up to £5 million
Coronavirus Large Business Interruption Loan Scheme ("CLBILS"): UK government business lending scheme that helped medium and large-sized businesses access loans and other kinds of finance up to £200 million
Cost of funds: Interest expense incurred to support the lending activities divided by the average net loans and advances to customers and operating lease assets
Credit impaired: Where one or more events that have a detrimental impact on the estimated future cash flows of a loan have occurred. Credit impaired events are more severe than SICR triggers. Accounts which are credit impaired will be allocated to
Stage 3
Discounting: The process of determining the present value of future payments
Dividend per share ("DPS"): Comprises the final dividend proposed for the respective year, together with the interim dividend declared and paid in the year
Earnings per share ("EPS"): Profit attributable to ordinary shareholders divided by number of basic shares
Effective interest rate ("EIR"): The interest rate at which revenue is recognised on loans and discounted to their carrying value over the life of the financial asset
Effective tax rate ("ETR"): Tax on operating profit/(loss) as a percentage of operating profit/(loss) on ordinary activities before tax
Expected credit loss ("ECL"): The unbiased probability-weighted average credit loss determined by evaluating a range of possible outcomes and future economic conditions
Expense/income ratio: Total adjusted operating expenses divided by operating income
Financial Conduct Authority ("FCA"): A financial regulatory body in the UK, regulating financial firms and maintaining integrity of the UK's financial market
Forbearance: Forbearance occurs when a customer is experiencing financial difficulty in meeting their financial commitments and a concession is granted, by changing the terms of the financial arrangement, which would not otherwise be considered
Funding allocated to loan book: Total available funding, excluding equity and funding held for liquidity purposes
Gross carrying amount: Loan book before expected credit loss provision
High quality liquid assets ("HQLAs"): Assets which qualify for regulatory liquidity purposes, including Bank of England deposits and sovereign and central bank debt
Independent financial adviser ("IFA"): Professional offering independent, whole of market advice to clients including investments, pensions, protection and mortgages
Internal ratings based ("IRB") approach: A supervisor-approved method using internal models, rather than standardised risk weightings, to calculate regulatory capital requirements for credit risk
International Financial Reporting Standards ("IFRS"): Globally accepted accounting standards issued by the IFRS Foundation and the International Accounting Standards Board
Investment costs: Includes depreciation and other costs related to investment in multi-year projects, new business initiatives and pilots and cyber resilience. Excludes IFRS 16 depreciation
Leverage ratio: Tier 1 capital as a percentage of total balance sheet assets, adjusted for certain capital deductions, including intangible assets, and off-balance sheet exposures
Liquidity coverage ratio ("LCR"): Measure of the group's HQLAs as a percentage of expected net cash outflows over the next
30 days in a stressed scenario
Loan to value ("LTV") ratio: For a secured or structurally protected loan, the loan balance as a percentage of the total value of the asset
Long-term bad debt ratio: Long-term bad debt ratio is calculated using IAS 39 until the change to IFRS 9 in FY19. Bad debt ratio excluding Novitas only disclosed from FY21 onwards. Long-term average bad debt ratio of 1.2% based on the average bad debt ratio for FY08-H124, excluding Novitas.
Loss day: Where aggregate gross trading book revenues are negative at the end of a trading day
Loss given default ("LGD"): The amount lost on a loan if a customer defaults
Managed assets or assets under management ("AuM"): Total market value of assets which are managed by Close Brothers Asset Management in one of our investment solutions
Modelled expected credit loss provision: ECL = PD x LGD x EAD
Net asset value ("NAV") per share: Total assets less total liabilities and other equity instruments, divided by the number of ordinary shares in issue excluding own shares
Net carrying amount: Loan book value after expected credit loss provision
Net flows: Net flows as a percentage of opening managed assets calculated on an annualised basis
Net interest margin ("NIM"): Operating income generated by lending activities, including interest income net of interest expense, fees and commissions income net of fees and commissions expense, and operating lease income net of operating lease expense, less depreciation on operating lease assets, divided by average net loans and advances to customers and operating lease assets
Net stable funding ratio ("NSFR"): Regulatory measure of the group's weighted funding as a percentage of weighted assets
Net zero: Target of completely negating the amount of greenhouse gases produced by reducing emissions or implementing methods for their removal
Operating margin: Adjusted operating profit divided by operating income
Personal Contract Plan ("PCP"): PCP is a form of vehicle finance where the customer defers a significant portion of credit to the final repayment at the end of the agreement, thereby lowering the monthly repayments compared to a standard hire-purchase arrangement. At the final repayment date, the customer has the option to: (a) pay the final payment and take the ownership of the vehicle; (b) return the vehicle and not pay the final repayment; or (c) part-exchange the vehicle with any equity being put towards the cost of a new vehicle
Probability of default ("PD"): Probability that a customer will default on their loan
Prudential Regulation Authority ("PRA"): A financial regulatory body, responsible for regulating and supervising banks and other financial institutions in the UK
Recovery Loan Scheme: Launched in April 2021 as a replacement to CBILS. Under the terms of the scheme, businesses of any size that have been adversely impacted by the Covid-19 pandemic can apply to borrow up to £10 million, with accredited lenders receiving a government-backed guarantee of 80% on losses that may arise
Return on assets: Adjusted operating profit attributable to shareholders divided by total closing assets at the balance sheet date
Return on average tangible equity ("RoTE"): Adjusted operating profit attributable to ordinary shareholders divided by average total shareholder's equity, excluding intangible assets and other equity instruments
Return on net loan book ("RoNLB"): Adjusted operating profit from lending activities divided by average net loans and advances to customers and operating lease assets
Return on opening equity ("RoE"): Adjusted operating profit attributable to ordinary shareholders divided by opening equity, excluding non-controlling interests and other equity instruments
Revenue margin: Income from advice, investment management and related services divided by average total client assets. Average total client assets calculated as a two-point average
Risk weighted assets ("RWAs"): A measure of the amount of a bank's assets, adjusted for risk in line with the CRR. It is used in determining the capital requirement for a financial institution
Secured debt: Debt backed or secured by collateral
Senior debt: Represents the type of debt that takes priority over other unsecured or more junior debt owed by the issuer. Senior debt is first to be repaid ahead of other lenders or creditors
Significant increase in credit risk ("SICR"): An assessment of whether credit risk has increased significantly since initial recognition of a loan using a range of triggers. Accounts which have experienced a significant increase in credit risk will be allocated to Stage 2
Standardised approach: Generic term for regulator-defined approaches for calculating credit, operational and market risk capital requirements as set out in the CRR
Subordinated debt: Represents debt that ranks below, and is repaid after claims of, other secured or senior debt owed by the issuer
Tangible net asset value ("TNAV") per share: Total assets less total liabilities, other equity instruments and intangible assets, divided by the number of ordinary shares in issue excluding own shares
Task Force on Climate-related Financial Disclosures ("TCFD"): Regulatory framework to improve and increase reporting of climate-related financial information, including more effective and consistent disclosure of climate-related risks and opportunities
Term funding: Funding with a remaining maturity greater than 12 months
Term Funding Scheme for Small and Medium-sized Enterprises ("TFSME"): The Bank of England's Term Funding Scheme with additional incentives for SMEs
Tier 2 capital: Additional regulatory capital that along with Tier 1 capital makes up a bank's total regulatory capital. Includes qualifying subordinated debt
Total client assets ("TCA"): Total market value of all client assets including both managed assets and assets under advice and/or administration in the Asset Management division
Total funding as % of loan book: Total funding divided by net loans and advances to customers and operating lease assets
Watch list: Internal risk management process for heightened monitoring of exposures that are showing increased credit risk
Principal Risks and Uncertainties
The group faces a number of risks in the normal course of business. To manage these effectively, a consistent approach is adopted based on a set of overarching principles, namely:
· adhering to our established and proven business model;
· implementing an integrated risk management approach based on the concept of "three lines of defence"; and
· setting and operating within clearly defined risk appetites, monitored with defined metrics and limits.
At the core of the group's risk management framework are the group's principal risks which are the risks that have been identified as those most material in the delivery of the group's strategic objectives. A detailed description of each, including an overview of our risk management and mitigation approach, is disclosed on pages 90 to 130 of the 2023 Annual Report. The Annual Report can be accessed via the Investor Relations home page on the group's website at www.closebrothers.com.
The principal risks are listed below and are subject to ongoing review to ensure that the framework remains aligned to the prevailing risk environment. In the current macroeconomic and operating environment, we remain vigilant to developments in our principal risk profile, as well as proactive monitoring via an established framework of a suite of emerging risk which reflect broader market uncertainties.
A summary of the group's principal risks are detailed below:
Business and strategic risk - The group operates in an environment where it is exposed to an array of independent influencing factors. Its profitability can be impacted by: the broader UK economic climate; front-line sales performance; changes in technology; regulation and customer behaviour; cost movements; and competition from traditional and new players. All of these can vary in both nature and extent across its divisions. Changes in these factors may affect the Banking division's ability to write loans as it seeks to maintain its desired risk and reward criteria, result in lower new business volumes in Asset Management, impact levels of trading activity at Winterflood, or result in additional investment requirements and higher costs of operation. Notwithstanding the uncertainty arising from the FCA review and associated management actions, our current outlook on Business and Strategic Risk remains broadly unchanged since the last reporting period.
Capital risk - The group is required to hold sufficient regulatory capital (including equity and other loss-absorbing debt instruments) to enable it to operate effectively. This includes meeting minimum regulatory requirements, operating within risk appetites set by the board and supporting its strategic goals. During the period, the group successfully issued £200 million of Additional Tier 1 capital ('AT1') to boost its overall capital strength and diversify its sources of capital, thereby opening access to previously unused capital markets. As explained above, the group is experiencing headwinds that may impact on its capital position in the future. The group has identified actions which seek to mitigate these risks including, but not limited to, the decision to not pay any dividend payments in the current financial year, optimising RWA growth, and significant risk transfer of assets. As recently announced, the group's board has decided it will not pay dividends relating to the 2024 financial year, and the reinstatement of dividends in the 2025 financial year and beyond will be reviewed once the FCA concludes its review on historical motor finance commission arrangements and the financial consequences for the group have been assessed. This decision will ensure that capital is retained in the group.
Conduct risk - The group's behaviours, or those of its colleagues, whether intentional or unintentional, could result in poor outcomes for our customers or the markets in which the group operates. The group recognises the importance of delivering good customer outcomes and seeks to reasonably avoid customer detriment and foreseeable harm resulting from inappropriate judgements or behaviours in the execution of business activities. To support this, the group strives to maintain a culture aligned to its values and places the customer at the heart of the business model. This is achieved by acting in good faith towards customers, taking steps to proactively avoid causing foreseeable harm and supporting customers to pursue their financial objectives. This approach is founded in customers being central to our purpose and this ethos is embedded within our culture. Reporting on, and monitoring of, conduct risk is a key aspect of risk management activities and is aligned to the Financial Conduct Authority's ("FCA") Consumer Duty regulatory obligations for retail customers. The approach to monitoring conduct risk is expected to further evolve as additional insights are garnered and considered as part of continuous improvement. Closed-book implementation activities for Consumer Duty are well progressed in line with the FCA's implementation deadline of 31 July 2024.
Conduct risk considerations of the above-mentioned FCA review of historical motor finance commission arrangements will be kept under review as the situation develops.
Credit risk - As a lender to businesses and individuals, the bank is primarily exposed to credit losses if customers are unable to repay loans and outstanding interest and fees. The group also has exposure to counterparties including those with which it places deposits or trades, and a small number of derivative contracts to hedge interest rate and foreign exchange exposures.
Whilst we have not seen a significant impact on credit performance, we continue to monitor closely the evolving impacts of rising inflation and cost of living on our customers. We remain confident in the quality of our loan book, which is predominantly secured, prudently underwritten, diverse, and supported by the deep expertise of our people.
Funding and liquidity risk - The Banking division's access to funding remains key to support our lending activities and the liquidity requirements of the group. Funding and liquidity are measured and monitored on a daily basis with issues escalated as appropriate. During this period the bank has closely monitored how events have impacted its funding and liquidity position. The bank's 'borrow long, lend short' funding approach provides significant resilience against short- to medium-term liquidity shocks and accordingly there has been minimal impacts to the bank's liquidity position. In addition to its prudent funding model, the bank holds significant amounts of liquid assets to ensure it is well positioned to manage through any liquidity pressure should it arise in the future.
Legal and regulatory risk - The group is subject to the laws and regulations of the various jurisdictions in which it operates. Failure to comply with existing legal or regulatory requirements, or to adapt to changes in these requirements in a timely fashion, may have negative consequences for the group. Similarly, changes to regulation can impact our financial performance, capital, liquidity, and the markets in which we operate. Whilst the inherent risk exposure for the group continues to increase across the jurisdictions in which it operates, the group remains attuned to the developing regulatory requirements, and horizon scanning activities which helps ensure all legal and regulatory risks are considered at the earliest opportunity.
On 11 January, the FCA announced they would be carrying out a review to assess whether the historical use of discretionary commission arrangements between lenders and credit brokers in the motor finance market may have caused customer harm. Currently there is significant uncertainty about the outcome of the FCA's review, and the timing, scope and quantum of any potential financial impact on the group cannot be reliably estimated at present. In accordance with the relevant accounting standards, the Board has concluded that it is currently not required or appropriate to recognise a provision in relation to this matter. In addition, it is not practicable at this early stage to estimate any potential financial impact arising from this issue.
Non-traded market risk - Changes in market prices such as interest rates, credit spreads and foreign exchange rates have the potential to impact the value of assets or liabilities outside the trading book. Our current outlook on non-traded market risk remains broadly unchanged since the last reporting period.
Operational risk -The group is exposed to various operational risks through its day-to-day operations, all of which have the potential to result in financial loss or adverse impact. Losses typically crystallise as a result of inadequate or failed internal processes, people, models and systems, or as a result of external factors, including but not limited to Cyber and Information Security. Impacts to the business, customers, third parties and the markets in which the group operates are considered within a maturing framework for resilient delivery of important business services.
The outlook for operational risk remains stable. Scenario analysis is used to assess how severe but plausible operational risks will affect the group, providing a forward-looking basis for evaluating and managing operational risk exposures. Notwithstanding, close monitoring continues on external factors and impacts which could arise from geo-political impacts and the legal and regulatory environment.
Reputational risk - Protection and effective stewardship of the group's reputation are fundamental to its long-term success. Detrimental stakeholder perception could lead to impairment of the group's current business and future goals. This could arise in the course of the group's usual activities, such as through employee, supplier or intermediary conduct, the provision of products and services, crystallisation of another risk type, or as a result of changes outside of its influence.
Given the uncertainty associated with the FCA's market-wide review of historic discretionary commission arrangements, reputational risk is heightened. We continue to monitor this closely for all stakeholder groups. The FCA's intervention has led to increased media speculation about the impact to the market as well as the impact to the group as referred to on page 28 above.
Traded market risk - A change in the value of an underlying market variable could give rise to an adverse movement in the value of the group's assets. Our current outlook on traded market risk remains broadly unchanged since the last reporting period.
Climate risk - Running alongside the suite of principal risks is climate risk, which the group categorises as a cross-cutting risk, as the impacts arising from climate change have the ability to impact across the spectrum of principal risks. Climate risk represents a continued area of focus and the group continues to closely monitor government and regulatory developments in parallel to managing its own carbon footprint and supporting its customers to manage their climate risk impacts. Climate risk is embedded within the group's risk management framework, ensuring effective oversight. Climate disclosures are disclosed on pages 38 to 64 of the 2023 Annual Report, in line with the recommendations of the Taskforce for Climate-related Financial Disclosures ("TCFD").
Emerging and evolving risks
In addition to day-to-day management of its principal risks, the group utilises an established framework to monitor its portfolio for emerging risks, consider broader market uncertainties, and support its organisational readiness to respond. Group-level emerging risks are monitored by the Group Risk and Compliance Committee on an ongoing basis, with key themes and patterns of deterioration monitored via several sub-risks.
Current group level emerging risks include economic and geopolitical uncertainty, medium to long-term transitional climate risks, economic uncertainty, legal and regulatory change, supply chain risks, change execution risk and strategic disruption.
Directors' Responsibility Statement
Each of the Directors confirms that, to the best of their knowledge:
|
· the condensed consolidated interim financial statements ("interim financial statements") have been prepared in accordance with International Accounting Standard 34 "Interim Financial Reporting" as contained in UK-adopted International Accounting Standards ("IAS"); |
|
· the half year results include a fair review of the information required by Disclosure and Transparency Rule 4.2.7R (indication of important events during the first six months of the financial year and their impact on the interim financial statements, and a description of principal risks and uncertainties for the remaining six months of the financial year); and |
|
· the half year results include a fair review of the information required by Disclosure and Transparency Rule 4.2.8R (disclosure of related parties transactions that have taken place during the first six months of the current financial year and that have materially affected the financial position or performance of the company, and any changes in the related parties transactions described in the last Annual Report that could do so). |
The Directors of Close Brothers Group plc as at the date of this report are as listed on pages 138 to 140 of the company's 2023 Annual Report, subject to the following changes: Oliver Corbett and Peter Duffy ceased to be directors of the company on 16 November 2023 and 15 February 2024 respectively. A list of current Directors is maintained on the company's website www.closebrothers.com.
On behalf of the board
|
Michael N. Biggs Chairman |
Adrian J. Sainsbury Chief Executive |
19 March 2024
Independent review report to Close Brothers Group plc
Report on the condensed consolidated interim financial statements
Our conclusion
We have reviewed Close Brothers Group plc's condensed consolidated interim financial statements (the "interim financial statements") in the Half Year Results of Close Brothers Group plc for the 6 month period ended 31 January 2024 (the "period").
Based on our review, nothing has come to our attention that causes us to believe that the interim financial statements are not prepared, in all material respects, in accordance with UK adopted International Accounting Standard 34, 'Interim Financial Reporting' and the Disclosure Guidance and Transparency Rules sourcebook of the United Kingdom's Financial Conduct Authority.
The interim financial statements comprise:
● the consolidated balance sheet as at 31 January 2024;
● the consolidated income statement and consolidated statement of comprehensive income for the period then ended;
● the consolidated statement of changes in equity for the period then ended
● the consolidated cash flow statement for the period then ended; and
● the explanatory notes to the interim financial statements.
The interim financial statements included in the Half Year Results of Close Brothers Group plc have been prepared in accordance with UK adopted International Accounting Standard 34, 'Interim Financial Reporting' and the Disclosure Guidance and Transparency Rules sourcebook of the United Kingdom's Financial Conduct Authority.
Basis for conclusion
We conducted our review in accordance with International Standard on Review Engagements (UK) 2410, 'Review of Interim Financial Information Performed by the Independent Auditor of the Entity' issued by the Financial Reporting Council for use in the United Kingdom ("ISRE (UK) 2410"). A review of interim financial information consists of making enquiries, primarily of persons responsible for financial and accounting matters, and applying analytical and other review procedures.
A review is substantially less in scope than an audit conducted in accordance with International Standards on Auditing (UK) and, consequently, does not enable us to obtain assurance that we would become aware of all significant matters that might be identified in an audit. Accordingly, we do not express an audit opinion.
We have read the other information contained in the Half Year Results and considered whether it contains any apparent misstatements or material inconsistencies with the information in the interim financial statements.
Conclusions relating to going concern
Based on our review procedures, which are less extensive than those performed in an audit as described in the Basis for conclusion section of this report, nothing has come to our attention to suggest that the directors have inappropriately adopted the going concern basis of accounting or that the directors have identified material uncertainties relating to going concern that are not appropriately disclosed. This conclusion is based on the review procedures performed in accordance with ISRE (UK) 2410. However, future events or conditions may cause the group to cease to continue as a going concern.
Responsibilities for the interim financial statements and the review
Our responsibilities and those of the directors
The Half Year Results, including the interim financial statements, is the responsibility of, and has been approved by the directors. The directors are responsible for preparing the Half Year Results in accordance with the Disclosure Guidance and Transparency Rules sourcebook of the United Kingdom's Financial Conduct Authority. In preparing the Half Year Results, including the interim financial statements, the directors are responsible for assessing the group's ability to continue as a going concern, disclosing, as applicable, matters related to going concern and using the going concern basis of accounting unless the directors either intend to liquidate the group or to cease operations, or have no realistic alternative but to do so.
Our responsibility is to express a conclusion on the interim financial statements in the Half Year Results based on our review. Our conclusion, including our Conclusions relating to going concern, is based on procedures that are less extensive than audit procedures, as described in the Basis for conclusion paragraph of this report. This report, including the conclusion, has been prepared for and only for the company for the purpose of complying with the Disclosure Guidance and Transparency Rules sourcebook of the United Kingdom's Financial Conduct Authority and for no other purpose. We do not, in giving this conclusion, accept or assume responsibility for any other purpose or to any other person to whom this report is shown or into whose hands it may come save where expressly agreed by our prior consent in writing.
PricewaterhouseCoopers LLP
Chartered Accountants
London
19 March 2024
Consolidated Income Statement
for the six months ended 31 January 2024
|
Six months ended 31 January |
Year ended 31 July |
||||
|
Note |
2024 Unaudited |
2023 Unaudited £ million |
2023 Audited |
||
|
Interest income |
569.3 |
414.4 |
897.5 |
||
|
Interest expense |
(272.6) |
(117.0) |
(304.9) |
||
|
Net interest income |
296.7 |
297.4 |
592.6 |
||
|
Fee and commission income |
132.8 |
130.1 |
262.9 |
||
|
Fee and commission expense |
(11.3) |
(8.7) |
(17.9) |
||
|
Gains less losses arising from dealing in securities |
25.2 |
31.9 |
58.6 |
||
|
Other income |
67.3 |
61.8 |
114.2 |
||
|
Depreciation of operating lease assets and other direct costs |
(39.9) |
(38.2) |
(77.8) |
||
|
Non-interest income |
174.1 |
176.9 |
340.0 |
||
|
Operating income |
2 |
470.8 |
474.3 |
932.6 |
|
|
Administrative expenses |
(334.7) |
(299.5) |
(615.0) |
||
|
Impairment losses on financial assets |
6 |
(41.7) |
(162.2) |
(204.1) |
|
|
Total operating expenses before amortisation of intangible assets on acquisition |
(376.4) |
(461.7) |
(819.1) |
||
|
Operating profit before amortisation of intangible assets on acquisition |
94.4 |
12.6 |
113.5 |
||
|
Amortisation of intangible assets on acquisition |
(0.6) |
(0.9) |
(1.5) |
||
|
Operating profit before tax |
93.8 |
11.7 |
112.0 |
||
|
Tax |
3 |
(25.0) |
(3.3) |
(30.9) |
|
|
Profit after tax |
68.8 |
8.4 |
81.1 |
||
|
Profit attributable to shareholders |
68.8 |
8.4 |
81.1 |
||
|
Basic earnings per share |
4 |
46.0p |
5.6p |
54.3p |
|
|
Diluted earnings per share |
4 |
46.0p |
5.6p |
54.2p |
|
|
Ordinary dividend per share |
5 |
- |
22.5p |
67.5p |
|
Consolidated Statement of Comprehensive Income
for the six months ended 31 January 2024
|
Six months ended 31 January |
Year ended 31 July |
||
|
2024 Unaudited |
2023 Unaudited £ million |
2023 Audited |
|
|
Profit after tax |
68.8 |
8.4 |
81.1 |
|
Items that may be reclassified to income statement |
|||
|
Currency translation (losses)/gains |
(0.2) |
1.0 |
0.7 |
|
(Losses)/gains on cash flow hedging |
(14.0) |
18.7 |
17.6 |
|
Losses on financial instruments classified at fair value through other comprehensive income |
(2.5) |
(4.7) |
(3.9) |
|
Tax relating to items that may be reclassified |
4.6 |
(3.9) |
(4.3) |
|
(12.1) |
11.1 |
10.1 |
|
|
Items that will not be reclassified to income statement |
|||
|
Defined benefit pension scheme gains/(losses) |
0.1 |
(5.5) |
(5.7) |
|
Tax relating to items that will not be reclassified |
- |
1.5 |
1.6 |
|
0.1 |
(4.0) |
(4.1) |
|
|
Other comprehensive income, net of tax |
(12.0) |
7.1 |
6.0 |
|
Total comprehensive income |
56.8 |
15.5 |
87.1 |
|
Attributable to |
|||
|
Shareholders |
56.8 |
15.5 |
87.1 |
Consolidated Balance Sheet
at 31 January 2024
|
Note |
31 January 2024 Unaudited |
31 July Audited |
|
|
Assets |
|||
|
Cash and balances at central banks |
1,658.5 |
1,937.0 |
|
|
Settlement balances |
913.5 |
707.0 |
|
|
Loans and advances to banks |
275.6 |
330.3 |
|
|
Loans and advances to customers |
6 |
9,611.0 |
9,255.0 |
|
Debt securities |
7 |
550.3 |
307.6 |
|
Equity shares |
8 |
26.6 |
29.3 |
|
Loans to money brokers against stock advanced |
20.6 |
37.6 |
|
|
Derivative financial instruments |
85.0 |
88.5 |
|
|
Intangible assets |
9 |
268.5 |
263.7 |
|
Property, plant and equipment |
10 |
365.1 |
357.1 |
|
Current tax assets |
52.0 |
42.3 |
|
|
Deferred tax assets |
13.7 |
10.8 |
|
|
Prepayments, accrued income and other assets |
197.4 |
184.1 |
|
|
Total assets |
14,037.8 |
13,550.3 |
|
|
Liabilities |
|||
|
Settlement balances and short positions |
11 |
886.4 |
695.9 |
|
Deposits from banks |
12 |
131.9 |
141.9 |
|
Deposits from customers |
12 |
8,264.0 |
7,724.5 |
|
Loans and overdrafts from banks |
12 |
437.8 |
651.9 |
|
Debt securities in issue |
12 |
1,870.1 |
2,012.6 |
|
Loans from money brokers against stock advanced |
15.9 |
4.8 |
|
|
Derivative financial instruments |
145.5 |
195.9 |
|
|
Accruals, deferred income and other liabilities |
270.0 |
303.0 |
|
|
Subordinated loan capital |
12 |
184.4 |
174.9 |
|
Total liabilities |
12,206.0 |
11,905.4 |
|
|
Equity |
|||
|
Called up share capital |
38.0 |
38.0 |
|
|
Retained earnings |
1,610.4 |
1,608.5 |
|
|
Other equity instrument |
13 |
197.6 |
- |
|
Other reserves |
(14.2) |
(1.6) |
|
|
Total shareholders' and other owners' equity |
1,831.8 |
1,644.9 |
|
|
Total equity |
1,831.8 |
1,644.9 |
|
|
Total equity and liabilities |
14,037.8 |
13,550.3 |
Consolidated Statement of Changes in Equity
for the six months ended 31 January 2024
|
Other reserves |
|||||||||
|
Called up share capital |
Retained earnings |
Other equity instrument |
FVOCI reserve |
Share- |
Exchange movements reserve |
Cash flow hedging reserve |
Total attributable to equity holders |
Total |
|
|
At 1 August 2022 (audited) |
38.0 |
1,628.4 |
- |
0.1 |
(29.2) |
(1.5) |
21.7 |
1,657.5 |
1,657.5 |
|
Profit for the period |
- |
8.4 |
- |
- |
- |
- |
- |
8.4 |
8.4 |
|
Other comprehensive income/(expense) |
- |
(4.0) |
- |
(3.4) |
- |
1.0 |
13.5 |
7.1 |
7.1 |
|
Total comprehensive income for the period |
- |
4.4 |
- |
(3.4) |
- |
1.0 |
13.5 |
15.5 |
15.5 |
|
Dividends paid (note 5) |
- |
(65.6) |
- |
- |
- |
- |
- |
(65.6) |
(65.6) |
|
Shares purchased |
- |
- |
- |
- |
(5.1) |
- |
- |
(5.1) |
(5.1) |
|
Shares released |
- |
- |
- |
- |
3.8 |
- |
- |
3.8 |
3.8 |
|
Other movements |
- |
1.2 |
- |
- |
(0.9) |
- |
- |
0.3 |
0.3 |
|
Income tax |
- |
(0.3) |
- |
- |
- |
- |
- |
(0.3) |
(0.3) |
|
At 31 January 2023 (unaudited) |
38.0 |
1,568.1 |
- |
(3.3) |
(31.4) |
(0.5) |
35.2 |
1,606.1 |
1,606.1 |
|
Profit for the period |
- |
72.7 |
- |
- |
- |
- |
- |
72.7 |
72.7 |
|
Other comprehensive (expense)/income |
- |
(0.1) |
- |
0.6 |
- |
(0.8) |
(0.8) |
(1.1) |
(1.1) |
|
Total comprehensive income for the period |
- |
72.6 |
- |
0.6 |
- |
(0.8) |
(0.8) |
71.6 |
71.6 |
|
Dividends paid (note 5) |
- |
(33.5) |
- |
- |
- |
- |
- |
(33.5) |
(33.5) |
|
Shares purchased |
- |
- |
- |
- |
0.1 |
- |
- |
0.1 |
0.1 |
|
Shares released |
- |
- |
- |
- |
1.8 |
- |
- |
1.8 |
1.8 |
|
Other movements |
- |
1.1 |
- |
- |
(2.5) |
- |
- |
(1.4) |
(1.4) |
|
Income tax |
- |
0.2 |
- |
- |
- |
- |
- |
0.2 |
0.2 |
|
At 31 July 2023 (audited) |
38.0 |
1,608.5 |
- |
(2.7) |
(32.0) |
(1.3) |
34.4 |
1,644.9 |
1,644.9 |
|
Profit for the period |
- |
68.8 |
- |
- |
- |
- |
- |
68.8 |
68.8 |
|
Other comprehensive income/(expense) |
- |
0.1 |
- |
(1.8) |
- |
(0.2) |
(10.1) |
(12.0) |
(12.0) |
|
Total comprehensive income for the period |
- |
68.9 |
- |
(1.8) |
- |
(0.2) |
(10.1) |
56.8 |
56.8 |
|
Dividends paid (note 5) |
- |
(67.1) |
- |
- |
- |
- |
- |
(67.1) |
(67.1) |
|
Shares purchased |
- |
- |
- |
- |
(3.6) |
- |
- |
(3.6) |
(3.6) |
|
Shares released |
- |
- |
- |
- |
3.6 |
- |
- |
3.6 |
3.6 |
|
Other movements (note 13) |
- |
0.1 |
197.6 |
- |
(0.5) |
- |
- |
197.2 |
197.2 |
|
Income tax |
- |
- |
- |
- |
- |
- |
- |
- |
- |
|
At 31 January 2024 (unaudited) |
38.0 |
1,610.4 |
197.6 |
(4.5) |
(32.5) |
(1.5) |
24.3 |
1,831.8 |
1,831.8 |
Consolidated Cash Flow Statement
for the six months ended 31 January 2024
|
Six months ended 31 January |
Year ended 31 July |
|||
|
Note |
2024 Unaudited |
2023 Unaudited £ million |
2023 Audited |
|
|
Net cash (outflow)/inflow from operating activities |
18(a) |
(394.0) |
833.1 |
1,021.4 |
|
Net cash (outflow)/inflow from investing activities |
||||
|
Purchase of: |
||||
|
Property, plant and equipment |
(8.4) |
(5.1) |
(8.7) |
|
|
Intangible assets - software |
(15.7) |
(27.0) |
(53.2) |
|
|
Subsidiaries, net of cash acquired |
18(b) |
(11.2) |
(0.5) |
(0.5) |
|
Sale of: |
||||
|
Subsidiaries |
18(c) |
0.2 |
0.5 |
- |
|
(35.1) |
(32.1) |
(62.4) |
||
|
Net cash (outflow)/inflow before financing activities |
(429.1) |
801.0 |
959.0 |
|
|
Financing activities |
||||
|
Purchase of own shares for employee share award schemes |
(3.6) |
(5.1) |
(5.0) |
|
|
Equity dividends paid |
(67.1) |
(65.6) |
(99.1) |
|
|
Interest paid on subordinated loan capital and debt financing |
(11.7) |
(5.4) |
(10.9) |
|
|
Payment of lease liabilities |
(7.9) |
(7.6) |
(16.2) |
|
|
Issuance of senior bond |
- |
- |
248.5 |
|
|
Redemption of senior bond |
- |
- |
(250.0) |
|
|
Issuance of Additional Tier 1 ("AT1") capital securities |
200.0 |
- |
- |
|
|
Costs arising on issuance of AT1 |
(2.4) |
- |
- |
|
|
Net (decrease)/increase in cash |
(321.8) |
717.3 |
826.3 |
|
|
Cash and cash equivalents at beginning of year |
2,209.3 |
1,383.0 |
1,383.0 |
|
|
Cash and cash equivalents at end of year |
18(d) |
1,887.5 |
2,100.3 |
2,209.3 |
The Notes
1. Basis of Preparation and Accounting Policies
The half year results have been prepared in accordance with the Disclosure Guidance and Transparency Rules of the Financial Conduct Authority and the condensed consolidated interim financial statements ("interim financial statements") have been prepared in accordance with UK-adopted International Accounting Standards. These include International Accounting Standard ("IAS") 34 'Interim Financial Reporting', which specifically addresses the contents of interim financial statements. The interim financial statements incorporate the individual financial statements of Close Brothers Group plc and the entities it controls, using the acquisition method of accounting.
The half year results are unaudited and do not constitute statutory accounts within the meaning of Section 434 of the Companies Act 2006. However, the information has been reviewed by the group's auditor, PricewaterhouseCoopers LLP, and their report appears above.
The financial information for the year ended 31 July 2023 contained within this half year report does not constitute statutory accounts as defined in Section 434 of the Companies Act 2006. A copy of those statutory accounts, which have been prepared in accordance with international accounting standards in conformity with the requirements of the Companies Act 2006, has been delivered to the Registrar of Companies. PricewaterhouseCoopers LLP has reported on those accounts. The report of the auditor on those statutory accounts was unqualified, did not contain an emphasis of matter paragraph and did not contain a statement under Section 498(2) or (3) of the Companies Act 2006.
The directors have a reasonable expectation that the company and the group as a whole have adequate resources to continue in operational existence for the foreseeable future, a period of not less than 12 months from the date of this report. For this reason, they continue to adopt the going concern basis in preparing the condensed consolidated half year financial statements.
The accounting policies applied are consistent with those set out on pages 211 to 216 of the 2023 Annual Report, except for an additional policy in relation to the group's issuance of Additional Tier 1 capital securities, which are classified as an equity instrument under IAS 32 'Financial Instruments: Presentation', and an update to the estimated useful lives of computer software classified as intangible assets on page 215 of the 2023 Annual Report.
Financial instruments are classified as equity when there is no contractual obligation to deliver cash, another financial asset, or a variable number of the group's own equity instruments to another entity. The instrument is measured at cost less transaction costs and distributions are recognised as a deduction from retained earnings when they become irrevocable. Please see note 13 for more information.
The estimated useful lives of computer software have been updated from a range of 3 to 5 years to a range of 3 to 10 years reflecting the longer useful lives of new core software platforms within the group.
Critical accounting judgements and estimates
The reported results of the group are sensitive to the judgements, estimates and assumptions that underlie the application of its accounting policies and preparation of its financial statements. The group's estimates and assumptions are based on historical experience and reasonable expectations of future events and are reviewed on an ongoing basis. Actual results in the future may differ from the amounts estimated due to the inherent uncertainty. The group's critical accounting judgements and key sources of estimation uncertainty, set out below, are unchanged from those identified in the 2023 Annual Report except for an additional critical judgement in relation to Motor Finance commission arrangements.
Critical accounting judgements
Motor Finance commission arrangements
The group continues to receive a high number of complaints, many of which are now with the Financial Ombudsman Service ("FOS"), regarding historic Discretionary Commission Arrangements ("DCAs") with intermediaries on its Motor Finance products. Judgement is required in determining that the criteria for the recognition of a provision under IAS 37 'Provisions, Contingent Liabilities and Contingent Assets' have not been met. This matter has been disclosed as a contingent liability. Please see note 16 for more information.
Expected credit losses
At 31 January 2024, the group's expected credit loss provision was £408.0 million (31 July 2023: £380.6 million). The calculation of the group's expected credit loss provision under IFRS 9 requires the group to make a number of judgements, assumptions and estimates, which have a material impact on the accounts. The assessment is unbiased, probability weighted and uses historical, current and forward-looking information. These judgements are consistent with those set out in the 2023 Annual Report and the most significant judgements are set out below.
Significant increase in credit risk
Assets are transferred from Stage 1 to Stage 2 when there has been a significant increase in credit risk since initial recognition. Typically, the group assesses whether a significant increase in credit risk has occurred based on a quantitative and qualitative assessment, with a "30 days past due" backstop. Due to the diverse nature of the group's lending businesses, the specific indicators of a significant increase in credit risk vary by business and may include some or all of the following factors:
• Quantitative assessment: the lifetime probability of default ("PD") has increased by more than an agreed threshold relative to the equivalent at origination. Thresholds are based on a fixed number of risk grade movements which are bespoke to each business to ensure that the increased risk since origination is appropriately captured;
• Qualitative assessment: events or observed behaviour that indicate credit deterioration. This includes a wide range of information that is reasonably available including individual credit assessments of the financial performance of borrowers as appropriate during routine reviews, plus forbearance and watch list information; or
• Backstop criteria: the "30 days past due" backstop is met.
Definition of default
The definition of default is an important building block for expected credit loss models and is considered a key judgement. A default is considered to have occurred if any unlikeliness to pay criterion is met or when a financial asset meets a "90 days past due" backstop. While some criteria are factual (e.g. administration, insolvency or bankruptcy), others require a judgemental assessment of whether the borrower has financial difficulties which are expected to have a detrimental impact on their ability to meet contractual obligations. A change in the definition of default may have a material impact on the expected credit loss provision.
Key sources of estimation uncertainty
The key sources of estimation uncertainty of the group relate to expected credit loss provisions and goodwill and are as follows:
• Two key model estimates, being time to recover periods and recovery rates, underpinning the expected credit loss provision of Novitas;
• Forward-looking macroeconomic information incorporated into expected credit loss models. This was also a key estimate in the prior year;
• Adjustments by management to model calculated expected credit losses due to limitations in the group's expected credit loss models or input data, which may be identified through ongoing model monitoring and validation of models; and
• Estimate of future cash flow forecasts in the calculation of value in use for the testing of goodwill for impairment in relation to the Winterflood Securities cash generating unit.
More information on these key sources of estimation uncertainty is below except adjustments and goodwill which can be found in note 6(c) and note 9 respectively.
Novitas loans
Novitas provided funding to individuals who wished to pursue legal cases. The majority of the Novitas portfolio, and therefore provision, relates to civil litigation cases. To protect customers in the event that their case failed, it was a condition of the Novitas loan agreements that an individual purchased an After the Event ("ATE") insurance policy which covered the loan.
As previously announced, following a strategic review, in July 2021 the group decided to cease permanently the approval of lending to new customers across all of the products offered by Novitas and withdraw from the legal services financing market. Since that time, the Novitas loan book has been in run-off, and the business has continued to work with solicitors and insurers, with a focus on supporting existing customers and managing the existing book to ensure good customer outcomes, where it is within Novitas' ability to do so.
In the first half of the financial year under review, management has maintained its assumptions for expected case failure rates, expected time to recover periods and expected recovery rates which continue to appropriately reflect experienced credit performance and ongoing dialogue with customers' insurers. Since 31 July 2023, expected credit loss provisions have increased by £16.0 million to £200.1 million (31 July 2023: £184.1 million). The increase to the expected credit loss provision is a result of interest accrual on Civil Litigation accounts, for which a full loss provision is applied.
Based on the current position, the majority of loans in the portfolio continue to be assessed as credit-impaired and are considered Stage 3. Expected credit losses for the portfolio have been calculated by comparing the gross loan balance to expected cash flows discounted at the original effective interest rate, over an appropriate time to recovery period. In line with IFRS 9, a proportion of the expected credit loss is expected to unwind, over the estimated time to recover period, to interest income, which reflects the requirement to recognise interest income on Stage 3 loans on a net basis.
Given that the majority of the Novitas portfolio is in Stage 3, the key sources of estimation uncertainty for the portfolio's expected credit loss provision are time to recover periods and recovery rates for the Civil Litigation portfolio. On this basis management have assessed and completed sensitivity analysis when compared to the expected credit loss provision for Novitas of £200.1 million (31 July 2023: £184.1 million). At 31 January 2024, a 10% absolute deterioration or improvement in recovery rates would increase or decrease the ECL provision by £13.4 million. Separately, a 12-month improvement in the time to recover period will reduce the ECL provision by £13.4 million, while a 12-month delay in the time to recover period will increase the ECL provision by £10.9 million.
Forward-looking information
Determining expected credit losses under IFRS 9 requires the incorporation of forward-looking macroeconomic information that is reasonable, supportable and includes assumptions linked to economic variables that impact losses in each portfolio. The introduction of macroeconomic information introduces additional volatility to provisions.
In order to calculate forward-looking provisions, economic scenarios are sourced from Moody's Analytics. These scenarios cover a range of plausible economic conditions that are then used to project potential credit outcomes for each portfolio. An overview of these scenarios using key macroeconomic indicators is provided below. Ongoing benchmarking of the scenarios to other economic providers is carried out monthly to provide management with comfort on Moody's Analytics scenario paths.
Five different projected economic scenarios are currently considered to cover a range of possible outcomes. These include a baseline scenario, which reflects the best view of future economic events. In addition, one upside scenario and three downside scenario paths are defined relative to the baseline. Management assigns the scenarios a probability weighting to reflect the likelihood of specific scenarios, and therefore loss outcomes, materialising, using a combination of quantitative analysis and expert judgement.
The impact of forward-looking information varies across the group's lending businesses because of the differing sensitivity of each portfolio to specific macroeconomic variables. This is reflected through the development of bespoke macroeconomic models that recognise the specific response of each business to the macroeconomic environment.
The modelled impact of macroeconomic scenarios and their respective weightings is reviewed by business experts in relation to stage allocation and coverage ratios at the individual and portfolio level, incorporating management's experience and knowledge of customers, the sectors in which they operate, and the assets financed.
This includes assessment of the reaction of the ECL in the context of the prevailing and forecast economic conditions, for example where currently higher interest rates and inflationary conditions exist compared to recent periods.
Economic forecasts have evolved over the course of 2023 and beginning of 2024 and reflect the continued economic challenges and uncertainty. Forecasts deployed in IFRS 9 macroeconomic models are updated on a monthly basis. At 31 January 2024, the latest baseline scenario forecasts GDP growth of 0.3% in calendar year 2024 and an average base rate of 5.0% across calendar year 2024. CPI is forecast to be 2.4% in calendar year 2024 and 2.1% in calendar year 2025 in the baseline scenario.
At 31 January 2024, the scenario weightings were: 30% strong upside, 32.5% baseline, 20% mild downside, 10.5% moderate downside and 7% protracted downside. As economic forecasts are considered to continue to appropriately reflect the uncertainty in the macroeconomic environment, no change has been made to the weightings ascribed to the scenarios since 31 July 2023.
Given the ongoing economic uncertainty, further analysis has been undertaken to assess the appropriateness of the five scenarios used. This included benchmarking the baseline scenario to consensus economic views, as well as consideration of an additional forecast related to stagflation, which could be considered as an alternative downside scenario.
Compared to the scenarios in use in the expected credit losses calculation, the stagflation scenario includes a longer period of higher interest rates coupled with a shallower but extended impact on GDP. Due to the relatively short tenor of the portfolios the stagflation scenario is considered to be of less relevance than those deployed. This is supported by the fact that, due to the higher severity of recessionary factors in the existing scenarios, using the stagflation scenario instead of the moderate or protracted downside scenario would result in lower expected credit losses.
The final scenarios deployed reflect relative stability in the UK economic outlook compared to 31 July 2023. Under the baseline scenario, UK headline CPI inflation continues to fall following impacts of sustained base rate increases and eased supply chain pressures. House price outlook includes contraction across all scenarios; however, to a lesser extent than previously anticipated. Unemployment rate forecasts have marginally deteriorated compared to 31 July 2023.
FY 2024 and FY 2025 scenario forecasts and weights
|
Baseline |
Upside (strong) |
Downside (mild) |
Downside (moderate) |
Downside (protracted) |
||||||
|
2024 |
2025 |
2024 |
2025 |
2024 |
2025 |
2024 |
2025 |
2024 |
2025 |
|
|
At 31 January 2024 |
||||||||||
|
UK GDP Growth |
0.3% |
0.8% |
2.8% |
2.0% |
(2.1%) |
0.3% |
(3.5%) |
(1.9%) |
(4.3%) |
(3.6%) |
|
UK Unemployment |
4.5% |
4.7% |
4.1% |
3.9% |
4.9% |
5.0% |
5.6% |
7.3% |
6.3% |
8.5% |
|
UK HPI Growth |
(1.8%) |
3.1% |
12.0% |
6.3% |
(8.9%) |
2.3% |
(12.6%) |
(6.3%) |
(18.5%) |
(10.3%) |
|
BoE Base Rate |
5.0% |
3.3% |
5.2% |
3.4% |
4.7% |
2.5% |
4.3% |
1.7% |
3.8% |
1.3% |
|
Consumer Price Index |
2.4% |
2.1% |
2.0% |
2.1% |
0.7% |
1.2% |
(1.1%) |
0.7% |
(3.9%) |
(0.3%) |
|
Weighting |
32.5% |
30% |
20% |
10.5% |
7% |
|||||
|
Baseline |
Upside (strong) |
Downside (mild) |
Downside (moderate) |
Downside (protracted) |
||||||
|
2023 |
2024 |
2023 |
2024 |
2023 |
2024 |
2023 |
2024 |
2023 |
2024 |
|
|
At 31 July 2023 |
||||||||||
|
UK GDP Growth |
0.5% |
0.3% |
1.3% |
3.0% |
(0.2%) |
(2.3%) |
(0.6%) |
(4.8%) |
(0.8%) |
(6.2%) |
|
UK Unemployment |
4.1% |
4.4% |
3.9% |
3.9% |
4.2% |
4.8% |
4.4% |
6.5% |
4.5% |
7.7% |
|
UK HPI Growth |
(6.3%) |
(1.4%) |
(0.4%) |
8.3% |
(9.1%) |
(6.9%) |
(10.8%) |
(13.2%) |
(12.6%) |
(20.1%) |
|
BoE Base Rate |
4.9% |
5.5% |
4.9% |
5.7% |
4.8% |
4.8% |
4.7% |
4.2% |
4.5% |
3.6% |
|
Consumer Price Index |
5.2% |
2.2% |
4.8% |
2.2% |
3.8% |
1.2% |
3.0% |
(0.3%) |
1.5% |
(2.3%) |
|
Weighting |
32.5% |
30% |
20% |
10.5% |
7% |
|||||
Notes:
UK GDP growth: National Accounts Annual Real Gross Domestic Product, Seasonally Adjusted - year-on-year change (%)
UK unemployment: ONS Labour Force Survey, Seasonally Adjusted - Average (%)
UK HPI growth: Average nominal house prices, Land Registry, Seasonally Adjusted - Q4-to-Q4 change (%)
BoE base rate: Bank of England base rate - Average (%)
Consumer Price Index: ONS, All items, annual inflation - Q4-to-Q4 change (%)
|
Five-year average (calendar year 2024 - 2028) |
|||||
|
Baseline |
Upside (strong) |
Downside (mild) |
Downside (moderate) |
Downside (protracted) |
|
|
At 31 January 2024 |
|||||
|
UK GDP Growth |
1.1% |
1.9% |
0.7% |
0.2% |
0.1% |
|
UK Unemployment |
4.7% |
4.1% |
4.9% |
6.8% |
7.8% |
|
UK HPI Growth |
2.0% |
3.5% |
0.3% |
(1.2%) |
(3.8%) |
|
BoE Base Rate |
3.1% |
3.1% |
2.7% |
2.0% |
1.4% |
|
Consumer Price Index |
2.1% |
2.0% |
1.6% |
1.0% |
0.1% |
|
Weighting |
32.5% |
30% |
20% |
10.5% |
7% |
|
Five-year average (calendar year 2023 - 2027) |
|||||
|
Baseline |
Upside (strong) |
Downside (mild) |
Downside (moderate) |
Downside (protracted) |
|
|
At 31 July 2023 |
|||||
|
UK GDP Growth |
0.9% |
1.7% |
0.5% |
0.0% |
(0.1%) |
|
UK Unemployment |
4.4% |
3.9% |
4.6% |
6.4% |
7.3% |
|
UK HPI Growth |
0.5% |
2.1% |
(1.1%) |
(2.9%) |
(5.4%) |
|
BoE Base Rate |
3.8% |
3.8% |
3.5% |
2.8% |
2.3% |
|
Consumer Price Index |
2.6% |
2.6% |
2.1% |
1.6% |
0.7% |
|
Weighting |
32.5% |
30% |
20% |
10.5% |
7% |
Notes:
UK GDP growth: National Accounts Annual Real Gross Domestic Product, Seasonally Adjusted - CAGR (%)
UK unemployment: ONS Labour Force Survey, Seasonally Adjusted - Average (%)
UK HPI growth: Average nominal house prices, Land Registry, Seasonally Adjusted - CAGR (%)
BoE base rate: Bank of England base rate - Average (%)
Consumer Price Index: ONS, All items, annual inflation - CAGR (%)
The tables above show economic assumptions within each scenario, and the weighting applied to each at 31 January 2024. The metrics shown are key UK economic indicators, chosen to describe the economic scenarios. These are the main metrics used to set scenario paths, which then influence a wide range of additional metrics that are used in expected credit loss models. The first tables show the forecasts of the key metrics for the scenarios utilised for calendar years 2024 and 2025. The subsequent tables show averages and peak-to-trough ranges for the same key metrics over the five-year period from 2024 to 2028.
These periods have been included as they demonstrate the short-, medium- and long-term outlooks for the key macroeconomic indicators which form the basis of the scenario forecasts. The portfolio has an average residual maturity of 16 months, with c.99% of loan value having a maturity of five years or less.
The tables below provide a summary for the five-year period (calendar year 2024 - 2028) of the peak to trough range of values of the key UK economic variables used within the economic scenarios at 31 January 2024 and 31 July 2023:
Five-year period (calendar year 2024 - 2028)
|
Baseline |
Upside (strong) |
Downside (mild) |
Downside (moderate) |
Downside (protracted) |
||||||
|
Peak |
Trough |
Peak |
Trough |
Peak |
Trough |
Peak |
Trough |
Peak |
Trough |
|
|
At 31 January 2024 |
||||||||||
|
UK GDP Growth |
5.9% |
0.1% |
10.0% |
1.2% |
3.7% |
(3.3%) |
1.0% |
(6.1%) |
0.4% |
(8.1%) |
|
UK Unemployment |
4.9% |
4.4% |
4.5% |
3.8% |
5.1% |
4.7% |
7.5% |
4.7% |
8.7% |
4.9% |
|
UK HPI Growth |
10.4% |
(1.8%) |
21.5% |
1.2% |
1.7% |
(9.7%) |
(2.3%) |
(18.1%) |
(3.1%) |
(26.9%) |
|
BoE Base Rate |
5.3% |
2.3% |
5.4% |
2.3% |
5.2% |
1.9% |
5.1% |
0.9% |
5.1% |
0.4% |
|
Consumer Price Index |
3.4% |
1.7% |
3.0% |
1.7% |
2.2% |
0.6% |
2.0% |
(1.1%) |
1.9% |
(3.9%) |
|
Weighting |
32.5% |
30% |
20% |
10.5% |
7% |
|||||
Five-year period (calendar year 2023 - 2027)
|
Baseline |
Upside (strong) |
Downside (mild) |
Downside (moderate) |
Downside (protracted) |
||||||
|
Peak |
Trough |
Peak |
Trough |
Peak |
Trough |
Peak |
Trough |
Peak |
Trough |
|
|
At 31 July 2023 |
||||||||||
|
UK GDP Growth |
4.6% |
0.1% |
8.7% |
0.1% |
2.5% |
(3.0%) |
0.3% |
(5.9%) |
0.3% |
(8.1%) |
|
UK Unemployment |
4.6% |
3.9% |
4.1% |
3.7% |
4.9% |
3.9% |
7.3% |
3.9% |
8.5% |
3.9% |
|
UK HPI Growth |
2.6% |
(7.8%) |
12.9% |
(3.1%) |
(0.5%) |
(15.4%) |
(0.5%) |
(24.0%) |
(0.5%) |
(32.1%) |
|
BoE Base Rate |
5.8% |
2.3% |
5.9% |
2.3% |
5.4% |
2.2% |
5.2% |
1.3% |
5.2% |
0.6% |
|
Consumer Price Index |
10.2% |
1.8% |
10.2% |
1.8% |
10.2% |
0.8% |
10.2% |
(1.0%) |
10.2% |
(3.8%) |
|
Weighting |
32.5% |
30% |
20% |
10.5% |
7% |
|||||
Notes:
UK GDP growth: Maximum and minimum quarterly GDP as a percentage change from start of period (%)
UK unemployment: Maximum and minimum unemployment rate (%)
UK HPI growth: Maximum and minimum average nominal house price as a percentage change from start of period (%)
BoE base rate: Maximum and minimum Bank of England base rate (%)
Consumer Price Index: Maximum and minimum inflation rate over the five-year period (%).
The following charts below represent the quarterly forecast data included in the above tables incorporating actual metrics up to 31 January 2024. The dark blue line shows the baseline scenario, while the other lines represent the various upside and downside scenarios.
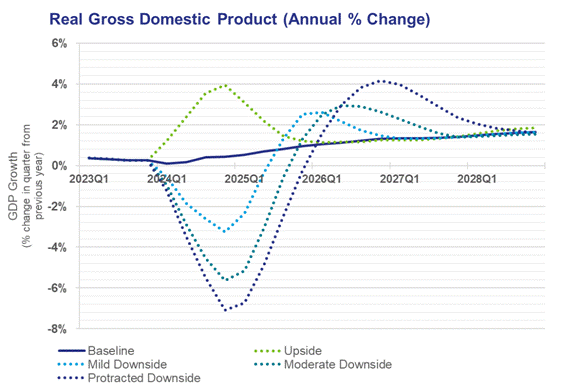
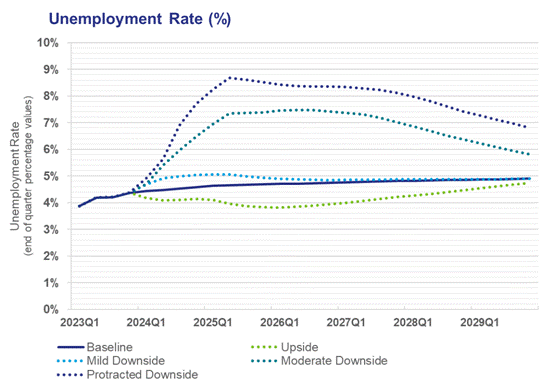
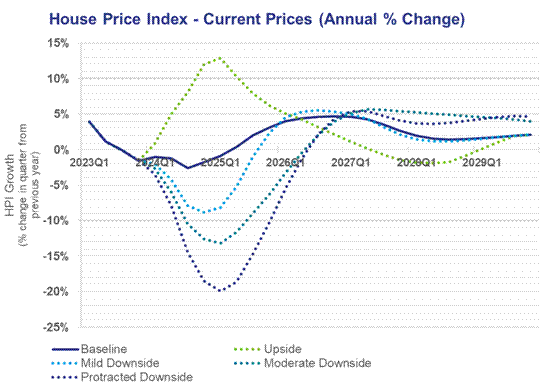
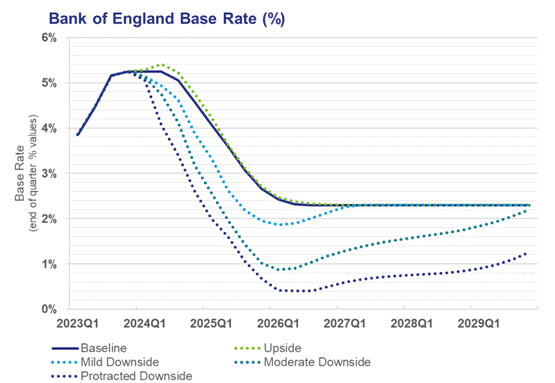
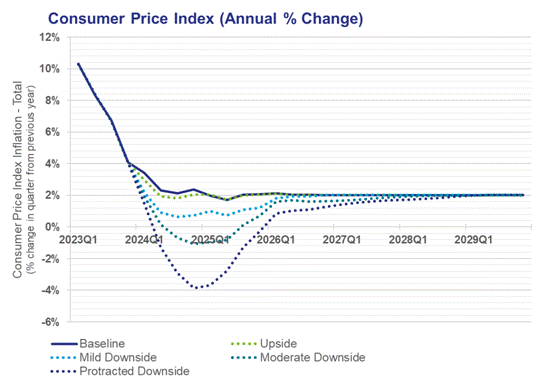
Scenario sensitivity analysis
The expected credit loss provision is sensitive to judgement and estimations made with regard to the selection and weighting of multiple economic scenarios. As a result, management has assessed and considered the sensitivity of the provision as follows:
For the majority of the portfolios, the modelled expected credit loss provision has been recalculated under the upside strong and downside protracted scenarios described above, applying a 100% weighting to each scenario in turn. The change in provision requirement is driven by the movement in risk metrics under each scenario and resulting impact on stage allocation. The key considerations applied in performing the sensitivity analysis are consistent with those set out on page 113 of the 2023 Annual Report.
Based on the above analysis, at 31 January 2024, application of 100% weighting to the upside strong scenario would decrease the expected credit loss by £17.4 million whilst application of 100% weighting to the downside protracted scenario would increase the expected credit loss by £31.3 million, driven by the aforementioned changes in risk metrics and stage allocation of the portfolios.
When performing sensitivity analysis there is a high degree of estimation uncertainty. On this basis, 100% weighted expected credit loss provisions presented for the upside and downside scenarios should not be taken to represent the lower or upper range of possible and actual expected credit loss outcomes. The recalculated expected credit loss provision for each of the scenarios should be read in the context of the sensitivity analysis as a whole and in conjunction with the narrative disclosures provided in note 6. The modelled impact presented is based on gross loans and advances to customers at 31 January 2024; it does not incorporate future changes relating to performance, growth or credit risk. In addition, given the change in the macroeconomic conditions, underlying modelled provisions and methodology, and refined approach to adjustments, comparison between the sensitivity results at 31 January 2024 and 31 July 2023 is not appropriate.
The economic environment remains uncertain and future impairment charges may be subject to further volatility, including from changes to macroeconomic variable forecasts impacted by geopolitical tensions and sustained cost of living pressures.
2. Segmental Analysis
The directors manage the group by class of business and present the segmental analysis on that basis. The group's activities are presented in five (2023: five) operating segments: Commercial, Retail, Property, Asset Management and Securities.
In the segmental reporting information that follows, Group consists of central functions as well as various non-trading head office companies and consolidation adjustments and is set out in order that the information presented reconciles to the consolidated income statement. The Group balance sheet primarily includes treasury assets and liabilities comprising cash and balances at central banks, debt securities, customer deposits and other borrowings.
Divisions continue to charge market prices for the limited services rendered to other parts of the group. Funding charges between segments take into account commercial demands. More than 90% of the group's activities, revenue and assets are located in the UK.
Summary income statement for the six months ended 31 January 2024
|
Banking |
|||||||
|
Commercial |
Retail |
Property |
Asset |
Securities |
Group |
Total |
|
|
Summary income statement |
|||||||
|
Net interest income/(expense) |
115.6 |
117.3 |
63.2 |
5.5 |
0.1 |
(5.0) |
296.7 |
|
Non-interest income |
52.9 |
14.5 |
1.8 |
70.8 |
34.1 |
- |
174.1 |
|
Operating income/(expense) |
168.5 |
131.8 |
65.0 |
76.3 |
34.2 |
(5.0) |
470.8 |
|
Administrative expenses |
(90.9) |
(80.4) |
(15.7) |
(67.0) |
(34.0) |
(14.8) |
(302.8) |
|
Depreciation and amortisation |
(12.1) |
(10.4) |
(2.3) |
(3.0) |
(2.9) |
(1.2) |
(31.9) |
|
Impairment losses on financial assets |
(14.6) |
(22.0) |
(5.2) |
- |
0.1 |
- |
(41.7) |
|
Total operating expenses before amortisation of intangible assets on acquisition |
(117.6) |
(112.8) |
(23.2) |
(70.0) |
(36.8) |
(16.0) |
(376.4) |
|
Adjusted operating profit/(loss)1 |
50.9 |
19.0 |
41.8 |
6.3 |
(2.6) |
(21.0) |
94.4 |
|
Amortisation of intangible assets on acquisition |
- |
- |
- |
(0.6) |
- |
- |
(0.6) |
|
Operating profit/(loss) before tax |
50.9 |
19.0 |
41.8 |
5.7 |
(2.6) |
(21.0) |
93.8 |
|
External operating income/(expense) |
257.9 |
187.0 |
109.4 |
75.8 |
34.2 |
(193.5) |
470.8 |
|
Inter segment operating (expense)/income |
(89.4) |
(55.2) |
(44.4) |
0.5 |
- |
188.5 |
- |
|
Segment operating income/(expense) |
168.5 |
131.8 |
65.0 |
76.3 |
34.2 |
(5.0) |
470.8 |
1. Adjusted operating profit/(loss) is stated before amortisation of intangible assets on acquisition and tax.
The Commercial operating segment above includes Novitas, which ceased lending to new customers in July 2021 following a strategic review. In the period ended 31 January 2024, Novitas recorded an operating gain of £0.2 million (six months ended 31 January 2023: loss of £104.9 million; year ended 31 July 2023: loss of £84.2 million), with impairment losses of £2.2 million (six months ended 31 January 2023: £114.6 million; year ended 31 July 2023: £116.8 million).
Novitas' income for the period was £5.0 million (six months ended 31 January 2023: £14.0 million; year ended 31 July 2023: £18.9 million) and expenses were £2.6 million (six months ended 31 January 2023: £4.3 million; year ended 31 July 2023: £8.7 million). In line with IFRS 9's requirement to recognise interest income on Stage 3 loans on a net basis, income includes the partial unwinding over time of the expected credit loss previously recognised.
Summary balance sheet information at 31 January 2024
|
Banking |
|||||||
|
Commercial |
Retail |
Property |
Asset Management £ million |
Securities £ million |
Group2 |
Total |
|
|
Summary balance sheet information at |
|||||||
|
Total assets1 |
5,028.5 |
3,025.9 |
1,838.6 |
171.1 |
1,069.9 |
2,903.8 |
14,037.8 |
|
Total liabilities |
- |
- |
- |
53.2 |
979.2 |
11,173.6 |
12,206.0 |
1. Total assets for the Banking operating segments comprise the loan book and operating lease assets only. The Commercial operating segment includes the net loan book of Novitas of £62.7 million.
2. Balance sheet includes £2,906.6 million assets and £11,114.0 million liabilities attributable to the Banking division primarily comprising the treasury balances described in the second paragraph of this note.
Equity is allocated across the group as set out below. Banking division equity, which is managed as a whole rather than on a segmental basis, reflects loan book and operating lease assets of £9,893.0 million, in addition to assets and liabilities of £2,906.6 million and £11,114.0 million respectively primarily comprising treasury balances which are included within the Group column above.
|
Banking £ million |
Asset Management £ million |
Securities £ million |
Group £ million |
Total £ million |
|
|
Equity |
1,685.6 |
117.9 |
90.7 |
(62.4) |
1,831.8 |
Summary income statement for the six months ended 31 January 2023
|
Banking |
|||||||
|
Commercial |
Retail |
Property |
Asset Management £ million |
Securities £ million |
Group |
Total £ million |
|
|
Summary income statement |
|||||||
|
Net interest income/(expense) |
130.9 |
107.2 |
57.3 |
1.6 |
- |
0.4 |
297.4 |
|
Non-interest income |
51.4 |
16.0 |
1.1 |
69.4 |
39.0 |
- |
176.9 |
|
Operating income/(expense) |
182.3 |
123.2 |
58.4 |
71.0 |
39.0 |
0.4 |
474.3 |
|
Administrative expenses |
(81.8) |
(68.4) |
(12.6) |
(59.8) |
(34.6) |
(12.7) |
(269.9) |
|
Depreciation and amortisation |
(11.1) |
(10.7) |
(2.1) |
(2.6) |
(2.0) |
(1.1) |
(29.6) |
|
Impairment losses on financial assets |
(122.5) |
(29.4) |
(10.3) |
- |
- |
- |
(162.2) |
|
Total operating expenses before amortisation of intangible assets on acquisition |
(215.4) |
(108.5) |
(25.0) |
(62.4) |
(36.6) |
(13.8) |
(461.7) |
|
Adjusted operating profit/(loss)1 |
(33.1) |
14.7 |
33.4 |
8.6 |
2.4 |
(13.4) |
12.6 |
|
Amortisation of intangible assets on acquisition |
(0.1) |
- |
- |
(0.8) |
- |
- |
(0.9) |
|
Operating profit/(loss) before tax |
(33.2) |
14.7 |
33.4 |
7.8 |
2.4 |
(13.4) |
11.7 |
|
External operating income/(expense) |
221.4 |
146.7 |
77.0 |
70.7 |
39.0 |
(80.5) |
474.3 |
|
Inter segment operating (expense)/income |
(39.1) |
(23.5) |
(18.6) |
0.3 |
- |
80.9 |
- |
|
Segment operating income/(expense) |
182.3 |
123.2 |
58.4 |
71.0 |
39.0 |
0.4 |
474.3 |
1. Adjusted operating profit/(loss) is stated before amortisation of intangible assets on acquisition and tax.
Summary income statement for the year ended 31 July 2023
|
Banking |
|||||||
|
Commercial |
Retail |
Property |
Asset |
Securities |
Group |
Total |
|
|
Summary income statement |
|||||||
|
Net interest income/(expense) |
251.2 |
218.4 |
117.1 |
6.7 |
0.5 |
(1.3) |
592.6 |
|
Non-interest income |
96.6 |
29.7 |
0.8 |
138.1 |
74.8 |
- |
340.0 |
|
Operating income/(expense) |
347.8 |
248.1 |
117.9 |
144.8 |
75.3 |
(1.3) |
932.6 |
|
Administrative expenses |
(171.5) |
(142.8) |
(26.5) |
(123.3) |
(67.5) |
(22.2) |
(553.8) |
|
Depreciation and amortisation |
(22.9) |
(21.6) |
(4.4) |
(5.5) |
(4.3) |
(2.5) |
(61.2) |
|
Impairment losses on financial assets |
(137.5) |
(49.0) |
(17.5) |
(0.1) |
- |
- |
(204.1) |
|
Total operating expenses before amortisation of intangible assets on acquisition |
(331.9) |
(213.4) |
(48.4) |
(128.9) |
(71.8) |
(24.7) |
(819.1) |
|
Adjusted operating profit/(loss)1 |
15.9 |
34.7 |
69.5 |
15.9 |
3.5 |
(26.0) |
113.5 |
|
Amortisation of intangible assets on acquisition |
- |
- |
- |
(1.5) |
- |
- |
(1.5) |
|
Operating profit/(loss) before tax |
15.9 |
34.7 |
69.5 |
14.4 |
3.5 |
(26.0) |
112.0 |
|
External operating income/(expense) |
451.1 |
308.6 |
170.3 |
144.2 |
75.3 |
(216.9) |
932.6 |
|
Inter segment operating (expense)/income |
(103.3) |
(60.5) |
(52.4) |
0.6 |
- |
215.6 |
- |
|
Segment operating income/(expense) |
347.8 |
248.1 |
117.9 |
144.8 |
75.3 |
(1.3) |
932.6 |
1. Adjusted operating profit/(loss) is stated before amortisation of intangible assets on acquisition and tax.
Summary balance sheet information at 31 July 2023
|
Banking |
|||||||
|
Commercial |
Retail |
Property |
Asset |
Securities £ million |
Group2 £ million |
Total £ million |
|
|
Summary balance sheet information at 31 July 2023 |
|||||||
|
Total assets1 |
4,821.3 |
3,001.8 |
1,703.1 |
177.9 |
870.5 |
2,975.7 |
13,550.3 |
|
Total liabilities |
- |
- |
- |
64.1 |
778.1 |
11,063.2 |
11,905.4 |
1. Total assets for the Banking operating segments comprise the loan book and operating lease assets only. The Commercial operating segment includes the net loan book of Novitas of £59.9 million at 31 July 2023.
2. Balance sheet includes £2,977.4 million assets and £11,151.9 million liabilities attributable to the Banking division primarily comprising the treasury balances described in the second paragraph of this note.
Equity is allocated across the group as set out below. Banking division equity, which is managed as a whole rather than on a segmental basis, reflects loan book and operating lease assets of £9,526.2 million, in addition to assets and liabilities of £2,977.4 million and £11,151.9 million respectively primarily comprising treasury balances which are included within the Group column above.
|
Banking £ million |
Asset £ million |
Securities £ million |
Group £ million |
Total £ million |
|
|
Equity |
1,351.7 |
113.8 |
92.4 |
87.0 |
1,644.9 |
3. Taxation
|
Six months ended 31 January |
Year ended 31 July |
||
|
2024 |
2023 £ million |
2023 |
|
|
Tax charged/(credited) to the income statement |
|||
|
Current tax: |
|||
|
UK corporation tax |
21.6 |
(2.1) |
18.1 |
|
Foreign tax |
0.8 |
0.8 |
2.3 |
|
Adjustments in respect of previous years |
- |
- |
(8.2) |
|
22.4 |
(1.3) |
12.2 |
|
|
Deferred tax: |
|||
|
Deferred tax charge for the current year |
2.6 |
4.6 |
11.4 |
|
Adjustments in respect of previous years |
- |
- |
7.3 |
|
25.0 |
3.3 |
30.9 |
|
|
Tax on items not (credited)/charged to the income statement |
|||
|
Current tax relating to: |
|||
|
Share-based payments |
- |
- |
(0.2) |
|
Deferred tax relating to: |
|||
|
Cash flow hedging |
(3.9) |
5.2 |
4.9 |
|
Defined benefit pension scheme |
- |
(1.5) |
(1.6) |
|
Financial instruments classified as fair value through other comprehensive income |
(0.7) |
(1.3) |
(1.1) |
|
Share-based payments |
- |
0.3 |
0.3 |
|
Currency translation gains |
- |
- |
0.5 |
|
(4.6) |
2.7 |
2.8 |
|
|
Reconciliation to tax expense |
|||
|
UK corporation tax for the period at 25.0% (2023: 21.0%) on operating profit before tax |
23.5 |
2.5 |
23.5 |
|
Effect of different tax rates in other jurisdictions |
- |
- |
(0.3) |
|
Disallowable items and other permanent differences |
1.2 |
0.2 |
1.6 |
|
Banking surcharge |
0.3 |
0.6 |
6.2 |
|
Deferred tax impact of decreased tax rates |
- |
- |
0.8 |
|
Prior year tax provision |
- |
- |
(0.9) |
|
25.0 |
3.3 |
30.9 |
|
The effective tax rate for the period is 26.7% (six months ended 31 January 2023: 28.2%; year ended 31 July 2023: 27.6%), representing the best estimate of the annual effective tax rate expected for the full year.
The standard UK corporation tax rate for the financial year is 25.0% (six months ended 31 January 2023: 21.0%; year ended 31 July 2023: 21.0%). The effective tax rate is above the UK corporation tax rate primarily due to disallowable expenditure.
The UK government has implemented the Pillar Two global minimum tax rate of 15% and a UK domestic minimum top-up tax with effect from the group's financial year commencing 1 August 2024. Other jurisdictions have or are expected to introduce their own domestic minimum top-up tax regimes. The jurisdictions in relation to which Pillar Two tax liabilities are expected to potentially arise for the group are the Republic of Ireland, Jersey and Guernsey, however the impact is expected to be immaterial.
4. Earnings per Share
The calculation of basic earnings per share is based on the profit attributable to shareholders and the number of basic weighted average shares. When calculating the diluted earnings per share, the weighted average number of shares in issue is adjusted for the effects of all dilutive share options and awards.
|
Six months ended 31 January |
Year ended 31 July |
||
|
2024 |
2023 |
2023 |
|
|
Basic |
46.0p |
5.6p |
54.3p |
|
Diluted |
46.0p |
5.6p |
54.2p |
|
Adjusted basic1 |
46.3p |
6.1p |
55.1p |
|
Adjusted diluted1 |
46.3p |
6.1p |
55.0p |
1. Excludes amortisation of intangible assets on acquisition and tax.
|
Six months ended 31 January |
Year ended 31 July |
||
|
2024 |
2023 |
2023 £ million |
|
|
Profit attributable to shareholders |
68.8 |
8.4 |
81.1 |
|
Adjustments: |
|||
|
Amortisation of intangible assets on acquisition |
0.6 |
0.9 |
1.5 |
|
Tax effect of adjustments |
(0.1) |
(0.2) |
(0.3) |
|
Adjusted profit attributable to shareholders |
69.3 |
9.1 |
82.3 |
|
Six months ended 31 January |
Year ended 31 July |
||
|
2024 million |
2023 million |
2023 million |
|
|
Average number of shares |
|||
|
Basic weighted |
149.6 |
149.4 |
149.4 |
|
Effect of dilutive share options and awards |
- |
0.7 |
0.2 |
|
Diluted weighted |
149.6 |
150.1 |
149.6 |
5. Dividends
|
Six months ended 31 January |
Year ended 31 July |
||
|
2024 £ million |
2023 £ million |
2023 £ million |
|
|
For each ordinary share |
|||
|
Interim dividend for previous financial year paid in April 2023: 22.5p |
- |
- |
33.5 |
|
Final dividend for previous financial year paid in November 2023: 45.0p (November 2022: 44.0p) |
67.1 |
65.6 |
65.6 |
|
67.1 |
65.6 |
99.1 |
|
As disclosed on 15 February 2024 in a trading update and dividend announcement, the group will not pay any dividends on its ordinary shares for the current financial year ending 31 July 2024.
6. Loans and Advances to Customers
(a) Maturity analysis of loans and advances to customers
The following table sets out a maturity analysis of loans and advances to customers. At 31 January 2024 loans and advances to customers with a maturity of two years or less was £7,464.1 million (31 July 2023: £7,158.8 million) representing 74.5% (31 July 2023: 74.3%) of total gross loans and advances to customers:
|
On demand £ million |
Within three months £ million |
Between three months and one year £ million |
Between one and two years £ million |
Between two and five years £ million |
After £ million |
Total gross loans and advances to customers £ million |
Impairment provisions £ million |
Total net loans and advances to customers £ million |
|
|
At 31 January 2024 |
81.8 |
2,741.5 |
2,664.3 |
1,976.5 |
2,412.6 |
142.3 |
10,019.0 |
(408.0) |
9,611.0 |
|
At 31 July 2023 |
76.5 |
2,597.8 |
2,636.5 |
1,848.0 |
2,337.2 |
139.6 |
9,635.6 |
(380.6) |
9,255.0 |
(b) Loans and advances to customers and impairment provisions by stage
Gross loans and advances to customers by stage and the corresponding impairment provisions and provision coverage ratios are set out below:
|
Stage 2 |
||||||
|
Stage 1 |
Less than 30 days past due |
Greater than or equal to 30 days past due |
Total |
Stage 3 £ million |
Total £ million |
|
|
At 31 January 2024 |
||||||
|
Gross loans and advances to customers |
||||||
|
Commercial |
3,831.4 |
751.7 |
53.1 |
804.8 |
381.2 |
5,017.4 |
|
Of which: Commercial excluding Novitas |
3,830.9 |
750.7 |
53.1 |
803.8 |
119.9 |
4,754.6 |
|
Of which: Novitas |
0.5 |
1.0 |
- |
1.0 |
261.3 |
262.8 |
|
Retail |
2,837.8 |
183.0 |
11.7 |
194.7 |
83.9 |
3,116.4 |
|
Property |
1,598.5 |
7.8 |
101.7 |
109.5 |
177.2 |
1,885.2 |
|
8,267.7 |
942.5 |
166.5 |
1,109.0 |
642.3 |
10,019.0 |
|
|
Impairment provisions |
||||||
|
Commercial |
24.4 |
13.4 |
4.5 |
17.9 |
228.6 |
270.9 |
|
Of which: Commercial excluding Novitas |
24.2 |
12.5 |
4.5 |
17.0 |
29.6 |
70.8 |
|
Of which: Novitas |
0.2 |
0.9 |
- |
0.9 |
199.0 |
200.1 |
|
Retail |
27.1 |
12.4 |
2.6 |
15.0 |
48.4 |
90.5 |
|
Property |
3.9 |
0.7 |
3.1 |
3.8 |
38.9 |
46.6 |
|
55.4 |
26.5 |
10.2 |
36.7 |
315.9 |
408.0 |
|
|
Provision coverage ratio |
||||||
|
Commercial |
0.6% |
1.8% |
8.5% |
2.2% |
60.0% |
5.4% |
|
Within which: Commercial excluding Novitas |
0.6% |
1.7% |
8.5% |
2.1% |
24.7% |
1.5% |
|
Within which: Novitas |
40.0% |
90.0% |
- |
90.0% |
76.2% |
76.1% |
|
Retail |
1.0% |
6.8% |
22.2% |
7.7% |
57.7% |
2.9% |
|
Property |
0.2% |
9.0% |
3.0% |
3.5% |
22.0% |
2.5% |
|
0.7% |
2.8% |
6.1% |
3.3% |
49.2% |
4.1% |
|
|
Stage 2 |
||||||
|
Stage 1 |
Less than 30 days past due |
Greater than or equal to 30 days past due |
Total |
Stage 3 £ million |
Total £ million |
|
|
At 31 July 2023 |
||||||
|
Gross loans and advances to customers |
||||||
|
Commercial |
3,686.1 |
750.9 |
23.2 |
774.1 |
339.4 |
4,799.6 |
|
Of which: Commercial excluding Novitas |
3,685.1 |
749.6 |
23.2 |
772.8 |
97.7 |
4,555.6 |
|
Of which: Novitas |
1.0 |
1.3 |
- |
1.3 |
241.7 |
244.0 |
|
Retail |
2,839.1 |
159.1 |
18.4 |
177.5 |
74.6 |
3,091.2 |
|
Property |
1,465.0 |
85.7 |
24.7 |
110.4 |
169.4 |
1,744.8 |
|
7,990.2 |
995.7 |
66.3 |
1,062.0 |
583.4 |
9,635.6 |
|
|
Impairment provisions |
||||||
|
Commercial |
25.1 |
13.9 |
2.4 |
16.3 |
208.1 |
249.5 |
|
Of which: Commercial excluding Novitas |
24.9 |
13.6 |
2.4 |
16.0 |
24.5 |
65.4 |
|
Of which: Novitas |
0.2 |
0.3 |
- |
0.3 |
183.6 |
184.1 |
|
Retail |
27.9 |
11.6 |
2.6 |
14.2 |
47.3 |
89.4 |
|
Property |
5.1 |
1.4 |
0.3 |
1.7 |
34.9 |
41.7 |
|
58.1 |
26.9 |
5.3 |
32.2 |
290.3 |
380.6 |
|
|
Provision coverage ratio |
||||||
|
Commercial |
0.7% |
1.9% |
10.3% |
2.1% |
61.3% |
5.2% |
|
Within which: Commercial excluding Novitas |
0.7% |
1.8% |
10.3% |
2.1% |
25.1% |
1.4% |
|
Within which: Novitas |
20.0% |
23.1% |
- |
23.1% |
76.0% |
75.5% |
|
Retail |
1.0% |
7.3% |
14.1% |
8.0% |
63.4% |
2.9% |
|
Property |
0.3% |
1.6% |
1.2% |
1.5% |
20.6% |
2.4% |
|
0.7% |
2.7% |
8.0% |
3.0% |
49.8% |
3.9% |
|
In Commercial, the impairment coverage ratio increased to 5.4% (31 July 2023: 5.2%), reflecting Novitas Stage 3 interest accrual. This is in line with the requirement under IFRS 9 to recognise interest on a net basis. Excluding Novitas, the Commercial provision coverage ratio increased to 1.5% (31 July 2023: 1.4%) as a result of slight deterioration in staging profile.
In Retail, the provision coverage ratio was unchanged at 2.9% (31 July 2023: 2.9%), reflecting stable performance against sustained macroeconomic uncertainty and cost of living pressures on customers.
In Property, the provision coverage ratio increased to 2.5% (31 July 2023: 2.4%), with strong levels of new business offset by uplifts in provisions against existing single names.
(c) Adjustments
By their nature, limitations in the group's expected credit loss models or input data may be identified through ongoing model monitoring and validation of models. In certain circumstances, management make appropriate adjustments to model-calculated expected credit losses. Adjustments have been identified as a key source of estimation uncertainty.
During the previous financial year, adjustments were applied in response to improvements in macroeconomic forecasts that resulted in releases in modelled provisions. A number of these releases were considered premature or counterintuitive by management and adjustments were made as a result. These adjustments recognise the ongoing uncertainty associated with the current environment and accordingly have been maintained during the first half of the financial year under review. The adjustments have been reassessed at 31 January 2024 and have reduced in line with emerging trends in the portfolios. This relationship between the adjustments and credit performance will continue to be assessed at each reporting period, with the value of the adjustments expected to reduce over time.
At 31 January 2024, £11.3 million (31 July 2023: £17.0 million) of the expected credit loss provision was attributable to adjustments.
(d) Reconciliation of loans and advances to customers and impairment provisions
Reconciliations of gross loans and advances to customers and associated impairment provisions are set out below.
New financial assets originate in Stage 1 only, and the amount presented represents the value at origination.
Subsequently, a loan may transfer between stages, and the presentation of such transfers is based on a comparison of the loan at the beginning of the year (or at origination if this occurred during the year) and the end of the year (or just prior to final repayment or write off).
Repayments relating to loans which transferred between stages during the year are presented within the transfers between stages lines. Such transfers do not represent overnight reclassification from one stage to another. All other repayments are presented in a separate line.
ECL model methodologies may be updated or enhanced from time to time and the impacts of such changes are presented on a separate line. During the previous year, a number of enhancements were made to the models in the Premium business. The enhancements were made to address known model limitations and to ensure modelled provisions better reflect future loss emergence.
Enhancements to our model suite are a contributory factor to ECL movements and such factors have been taken into consideration when assessing any required adjustments to modelled output and ensuring appropriate provision coverage levels.
A loan is written off when there is no reasonable expectation of further recovery following realisation of all associated collateral and available recovery actions against the customer.
|
Stage 1 |
Stage 2 |
Stage 3 £ million |
Total £ million |
|
|
Gross loans and advances to customers |
||||
|
At 1 August 2023 |
7,990.2 |
1,062.0 |
583.4 |
9,635.6 |
|
New financial assets originated |
3,447.4 |
- |
- |
3,447.4 |
|
Transfers to Stage 1 |
172.1 |
(213.5) |
(9.1) |
(50.5) |
|
Transfers to Stage 2 |
(723.9) |
656.9 |
(5.2) |
(72.2) |
|
Transfers to Stage 3 |
(107.2) |
(80.9) |
153.4 |
(34.7) |
|
Net transfers between stages and repayments1 |
(659.0) |
362.5 |
139.1 |
(157.4) |
|
Repayments while stage remained unchanged and final repayments |
(2,510.5) |
(315.3) |
(56.6) |
(2,882.4) |
|
Changes to model methodologies |
- |
- |
- |
- |
|
Write offs |
(0.4) |
(0.2) |
(23.6) |
(24.2) |
|
At 31 January 2024 |
8,267.7 |
1,109.0 |
642.3 |
10,019.0 |
1. Repayments relate only to financial assets which transferred between stages during the year. Other repayments are shown in the line below.
|
Stage 1 |
Stage 2 |
Stage 31 £ million |
Total £ million |
|
|
Gross loans and advances to customers |
||||
|
At 1 August 2022 |
7,627.0 |
1,158.9 |
358.6 |
9,144.5 |
|
New financial assets originated |
6,604.0 |
- |
- |
6,604.0 |
|
Transfers to Stage 1 |
276.2 |
(373.2) |
(6.8) |
(103.8) |
|
Transfers to Stage 2 |
(1,068.6) |
878.6 |
(16.1) |
(206.1) |
|
Transfers to Stage 3 |
(303.6) |
(194.4) |
421.5 |
(76.5) |
|
Net transfers between stages and repayments2 |
(1,096.0) |
311.0 |
398.6 |
(386.4) |
|
Repayments while stage remained unchanged and final repayments |
(5,118.8) |
(403.5) |
(100.4) |
(5,622.7) |
|
Changes to model methodologies |
(25.6) |
(4.0) |
29.6 |
- |
|
Write offs |
(0.4) |
(0.4) |
(103.0) |
(103.8) |
|
At 31 July 2023 |
7,990.2 |
1,062.0 |
583.4 |
9,635.6 |
1. A significant proportion of the Stage 3 movements is driven by Novitas with £174.4 million of transfers to Stage 3 and £37.4 million of write-offs. In addition, £49.2 million of Novitas movements are included within 'Repayments while stage remained unchanged and final repayments', comprising largely of accrued interest. The accrued interest is partly offset by ECL increases included within the adjacent ECL reconciliation, in line with IFRS 9's requirement to recognise interest income on Stage 3 loans on a net basis.
2. Repayments relate only to financial assets which transferred between stages during the year. Other repayments are shown in the line below.
|
Stage 1 |
Stage 2 |
Stage 3 £ million |
Total £ million |
|
|
Impairment provisions on loans and advances to customers |
||||
|
At 1 August 2023 |
58.1 |
32.2 |
290.3 |
380.6 |
|
New financial assets originated |
26.8 |
- |
- |
26.8 |
|
Transfers to Stage 1 |
1.1 |
(4.0) |
(0.4) |
(3.3) |
|
Transfers to Stage 2 |
(8.0) |
24.5 |
(0.6) |
15.9 |
|
Transfers to Stage 3 |
(2.0) |
(7.9) |
42.3 |
32.4 |
|
Net remeasurement of expected credit losses arising from transfers between stages and repayments1 |
(8.9) |
12.6 |
41.3 |
45.0 |
|
Repayments and ECL movements while stage remained unchanged and final repayments |
(20.2) |
(7.9) |
4.7 |
(23.4) |
|
Changes to model methodologies |
- |
- |
- |
- |
|
Charge to the income statement |
(2.3) |
4.7 |
46.0 |
48.4 |
|
Write offs |
(0.4) |
(0.2) |
(20.4) |
(21.0) |
|
At 31 January 2024 |
55.4 |
36.7 |
315.9 |
408.0 |
1. Repayments relate only to financial assets which transferred between stages during the year. Other repayments are shown in the line below.
|
Stage 1 |
Stage 2 |
Stage 31 £ million |
Total £ million |
|
|
Impairment provisions on loans and advances to customers |
||||
|
At 1 August 2022 |
50.3 |
78.3 |
157.0 |
285.6 |
|
New financial assets originated |
46.7 |
- |
- |
46.7 |
|
Transfers to Stage 1 |
1.2 |
(7.7) |
(1.0) |
(7.5) |
|
Transfers to Stage 2 |
(8.7) |
27.7 |
(5.7) |
13.3 |
|
Transfers to Stage 3 |
(11.2) |
(53.3) |
227.2 |
162.7 |
|
Net remeasurement of expected credit losses arising from transfers between stages and repayments2 |
(18.7) |
(33.3) |
220.5 |
168.5 |
|
Repayments and ECL movements while stage remained unchanged and final repayments |
(17.8) |
(10.7) |
(20.0) |
(48.5) |
|
Changes to model methodologies |
(2.2) |
(1.9) |
2.3 |
(1.8) |
|
Charge to the income statement |
8.0 |
(45.9) |
202.8 |
164.9 |
|
Write offs |
(0.2) |
(0.2) |
(69.5) |
(69.9) |
|
At 31 July 2023 |
58.1 |
32.2 |
290.3 |
380.6 |
1. A significant proportion of the Stage 3 movements is driven by Novitas with £147.6 million of transfers to Stage 3 and £11.9 million of write-offs.
2. Repayments relate only to financial assets which transferred between stages during the year. Other repayments are shown in the line below.
|
Six months ended 31 January |
Year ended 31 July |
||
|
2024 £ million |
2023 £ million |
2023 £ million |
|
|
Impairment losses relating to loans and advances to customers: |
|||
|
Charge to income statement arising from movement in impairment provisions |
48.4 |
131.0 |
164.9 |
|
Amounts written off directly to income statement, net of recoveries and other costs1 |
(7.4) |
31.4 |
39.4 |
|
41.0 |
162.4 |
204.3 |
|
|
Impairment losses/(gains) relating to other financial assets |
0.7 |
(0.2) |
(0.2) |
|
Impairment losses on financial assets recognised in income statement |
41.7 |
162.2 |
204.1 |
1. In line with IFRS 9's requirement to recognise interest income on Stage 3 loans on a net basis, this includes £(16.3) million (six months ended 31 January 2023: £nil; year ended 31 July 2023: £nil) in Novitas relating to the partial unwinding over time of the expected credit loss recognised previously.
Impairment losses on financial assets of £41.7 million (six months ended 31 January 2023: £162.2 million; year ended 31 July 2023: £204.1 million) include £2.2 million in relation to Novitas (six months ended 31 January 2023: £114.6 million; year ended 31 July 2023: £116.8 million).
7. Debt Securities
|
Fair value through profit or loss £ million |
Fair value through other comprehensive £ million |
Amortised cost £ million |
Total £ million |
|
|
Sovereign and central bank debt |
- |
193.3 |
- |
193.3 |
|
Supranational, sub-sovereigns and agency ("SSA") bonds |
- |
145.6 |
- |
145.6 |
|
Covered bonds |
- |
187.8 |
- |
187.8 |
|
Long trading positions in debt securities |
15.6 |
- |
- |
15.6 |
|
Other debt securities |
1.2 |
- |
6.8 |
8.0 |
|
At 31 January 2024 |
16.8 |
526.7 |
6.8 |
550.3 |
|
Fair value £ million |
Fair value comprehensive income £ million |
Amortised £ million |
Total £ million |
|
|
Sovereign and central bank debt |
- |
186.1 |
- |
186.1 |
|
SSA bonds |
- |
- |
- |
- |
|
Covered bonds |
- |
106.3 |
- |
106.3 |
|
Long trading positions in debt securities |
15.2 |
- |
- |
15.2 |
|
Other debt securities |
- |
- |
- |
- |
|
At 31 July 2023 |
15.2 |
292.4 |
- |
307.6 |
Movements on the book value of sovereign and central bank debt comprise:
|
Six months ended 31 January 2024 £ million |
Year ended 31 July 2023 £ million |
|
|
Sovereign and central bank debt at 1 August |
186.1 |
415.4 |
|
Additions |
- |
269.7 |
|
Redemptions/disposals |
- |
(459.2) |
|
Currency translation differences |
(0.6) |
(0.3) |
|
Movement in value |
7.8 |
(39.5) |
|
Sovereign and central bank debt at end of period |
193.3 |
186.1 |
Movements on the book value of SSA bonds comprise:
|
Six months ended 31 January 2024 £ million |
Year ended 31 July 2023 £ million |
|
|
SSA bonds at 1 August |
- |
- |
|
Additions |
140.9 |
- |
|
Currency translation differences |
(0.1) |
- |
|
Movement in value |
4.8 |
- |
|
SSA bonds at end of period |
145.6 |
- |
Movements on the book value of covered bonds comprise:
|
Six months ended 31 January 2024 £ million |
Year ended 31 July 2023 £ million |
|
|
Covered bonds at 1 August |
106.3 |
- |
|
Additions |
139.8 |
105.4 |
|
Redemptions/disposals |
(59.0) |
- |
|
Currency translation differences |
(0.1) |
- |
|
Movement in value |
0.8 |
0.9 |
|
Covered bonds at end of period |
187.8 |
106.3 |
8. Equity Shares
|
31 January 2024 £ million |
31 July 2023 £ million |
|
|
Long trading positions |
24.6 |
27.8 |
|
Other equity shares |
2.0 |
1.5 |
|
26.6 |
29.3 |
9. Intangible Assets
|
Goodwill £ million |
Software £ million |
Intangible assets on acquisition £ million |
Group total £ million |
||
|
Cost |
|||||
|
At 1 August 2022 |
142.6 |
299.5 |
51.0 |
493.1 |
|
|
Additions |
- |
27.1 |
- |
27.1 |
|
|
Disposals |
(0.1) |
(1.7) |
(0.6) |
(2.4) |
|
|
At 31 January 2023 |
142.5 |
324.9 |
50.4 |
517.8 |
|
|
Additions |
- |
23.4 |
- |
23.4 |
|
|
Disposals |
- |
(15.1) |
- |
(15.1) |
|
|
At 31 July 2023 |
142.5 |
333.2 |
50.4 |
526.1 |
|
|
Additions |
8.0 |
16.1 |
- |
24.1 |
|
|
Disposals |
- |
(6.1) |
- |
(6.1) |
|
|
At 31 January 2024 |
150.5 |
343.2 |
50.4 |
544.1 |
|
|
Amortisation |
|||||
|
At 1 August 2022 |
47.9 |
147.4 |
45.8 |
241.1 |
|
|
Amortisation charge for the period |
- |
17.3 |
0.9 |
18.2 |
|
|
Disposals |
- |
(1.1) |
(0.6) |
(1.7) |
|
|
At 31 January 2023 |
47.9 |
163.6 |
46.1 |
257.6 |
|
|
Amortisation charge for the period |
- |
18.8 |
0.6 |
19.4 |
|
|
Disposals |
- |
(14.6) |
- |
(14.6) |
|
|
At 31 July 2023 |
47.9 |
167.8 |
46.7 |
262.4 |
|
|
Additions |
- |
18.6 |
0.6 |
19.2 |
|
|
Disposals |
- |
(6.0) |
- |
(6.0) |
|
|
At 31 January 2024 |
47.9 |
180.4 |
47.3 |
275.6 |
|
|
Net book value at 31 January 2024 |
102.6 |
162.8 |
3.1 |
268.5 |
|
|
Net book value at 31 July 2023 |
94.6 |
165.4 |
3.7 |
263.7 |
|
|
Net book value at 31 January 2023 |
94.6 |
161.3 |
4.3 |
260.2 |
|
|
Net book value at 1 August 2022 |
94.7 |
152.1 |
5.2 |
252.0 |
Goodwill addition of £8.0 million (six months ended 31 January 2023: £nil; year ended 31 July 2023: £nil) relates to the group's acquisition of the 100% shareholding of Bluestone Motor Finance (Ireland) DAC, a provider of motor finance in Ireland, for cash consideration of €17.2 million. Net assets acquired largely comprised loans and advances to customers, cash, debt securities and borrowings. The goodwill includes intangible assets on acquisition and the valuation of this is expected to be finalised within one year of the acquisition date in line with IFRS 3 'Business Combinations'. The acquisition was completed on 31 October 2023 as announced in the group's scheduled trading update on 16 November 2023. Following this acquisition, the Motor Finance business is re-building its presence in the Republic of Ireland and Bluestone had a loan book of £16 million at 31 January 2024.
Intangible assets on acquisition relate to broker and customer relationships and are amortised over a period of eight to 20 years. In the six months ended 31 January 2024, £0.6 million (six months ended 31 January 2023: £0.9 million; year ended 31 July 2023: £1.5 million) of the amortisation charge is included in amortisation of intangible assets on acquisition and £18.6 million (six months ended 31 January 2023: £17.3 million; year ended 31 July 2023: £36.1 million) of the amortisation charge is included in administrative expenses shown in the consolidated income statement.
Impairment tests for goodwill
At 31 January 2024, goodwill has been allocated to eight (31 July 2023: eight) individual cash generating units ("CGUs"). Six are within the Banking division (31 July 2023: six), one is the Asset Management division (31 July 2023: one) and one is Winterflood in the Securities division (31 July 2023: one). Goodwill impairment reviews have been carried out and no impairment has been identified at 31 January 2024. The methodologies used in the impairment reviews are consistent with those described in note 14 of the 2023 Annual Report.
Winterflood recorded lower profits in the period with a lower value in use driven by difficult market conditions. The business has a long track record of trading profitably in a range of conditions and is well placed to take advantage when investor confidence recovers. Nevertheless, future market conditions remain uncertain and as such, consistent with the prior year, the value in use calculation for this CGU has been identified as a key source of estimation uncertainty as set out in note 1 'Critical Accounting Judgements and Estimates'. The most significant uncertainty within the Winterflood value in use calculation relates to the expected future cash flows, where certain scenarios considered less probable by management, for example a decrease in the annual growth rate to 0%, would lead to the carrying value of the CGU equalling or exceeding the recoverable value.
10. Property, Plant and Equipment
|
Leasehold property £ million |
Fixtures, fittings and equipment £ million |
Assets held under operating leases £ million |
Motor vehicles £ million |
Right of use assets1 £ million |
Total £ million |
|
|
Cost |
||||||
|
At 1 August 2022 |
20.9 |
62.6 |
398.2 |
0.2 |
78.5 |
560.4 |
|
Additions |
- |
5.1 |
41.7 |
- |
5.7 |
52.5 |
|
Disposals |
(0.1) |
(1.2) |
(11.7) |
- |
(3.3) |
(16.3) |
|
At 31 January 2023 |
20.8 |
66.5 |
428.2 |
0.2 |
80.9 |
596.6 |
|
Additions |
1.0 |
2.4 |
51.4 |
0.2 |
19.0 |
74.0 |
|
Disposals |
(0.3) |
(3.4) |
(30.5) |
- |
(5.9) |
(40.1) |
|
At 31 July 2023 |
21.5 |
65.5 |
449.1 |
0.4 |
94.0 |
630.5 |
|
Additions |
0.3 |
8.1 |
41.6 |
- |
3.5 |
53.5 |
|
Disposals |
- |
(5.0) |
(25.2) |
- |
(4.1) |
(34.3) |
|
At 31 January 2024 |
21.8 |
68.6 |
465.5 |
0.4 |
93.4 |
649.7 |
|
Depreciation and impairment |
||||||
|
At 1 August 2022 |
13.0 |
36.9 |
158.2 |
0.2 |
29.6 |
237.9 |
|
Depreciation and impairment charges for the period |
1.0 |
4.2 |
21.2 |
- |
7.1 |
33.5 |
|
Disposals |
(0.1) |
(1.4) |
(7.5) |
- |
(1.8) |
(10.8) |
|
At 31 January 2023 |
13.9 |
39.7 |
171.9 |
0.2 |
34.9 |
260.6 |
|
Depreciation and impairment charges for the period |
1.4 |
4.1 |
24.3 |
- |
7.3 |
37.1 |
|
Disposals |
(0.3) |
(2.9) |
(18.3) |
- |
(2.8) |
(24.3) |
|
At 31 July 2023 |
15.0 |
40.9 |
177.9 |
0.2 |
39.4 |
273.4 |
|
Depreciation and impairment charges for the period |
1.1 |
4.4 |
21.6 |
- |
7.8 |
34.9 |
|
Disposals |
- |
(5.1) |
(16.0) |
- |
(2.6) |
(23.7) |
|
At 31 January 2024 |
16.1 |
40.2 |
183.5 |
0.2 |
44.6 |
284.6 |
|
Net book value at 31 January 2024 |
5.7 |
28.4 |
282.0 |
0.2 |
48.8 |
365.1 |
|
Net book value at 31 July 2023 |
6.5 |
24.6 |
271.2 |
0.2 |
54.6 |
357.1 |
|
Net book value at 31 January 2023 |
6.9 |
26.8 |
256.3 |
- |
46.0 |
336.0 |
|
Net book value at 1 August 2022 |
7.9 |
25.7 |
240.0 |
- |
48.9 |
322.5 |
1. Right of use assets primarily relate to the group's leasehold properties.
11. Settlement Balances and Short Positions
|
31 January 2024 |
31 July 2023 |
|
|
Settlement balances |
875.1 |
686.0 |
|
Short positions in: |
||
|
Debt securities |
4.5 |
3.5 |
|
Equity shares |
6.8 |
6.4 |
|
11.3 |
9.9 |
|
|
886.4 |
695.9 |
12. Financial Liabilities
|
On demand £ million |
Within three months £ million |
Between three months and one year £ million |
Between one and £ million |
Between two and £ million |
After more than five years £ million |
Total £ million |
|
|
Deposits by banks |
0.9 |
43.5 |
87.5 |
- |
- |
- |
131.9 |
|
Deposits by customers |
436.3 |
1,932.8 |
3,704.6 |
1,537.4 |
652.9 |
- |
8,264.0 |
|
Loans and overdrafts from banks |
31.5 |
24.2 |
272.1 |
110.0 |
- |
- |
437.8 |
|
Debt securities in issue |
- |
43.4 |
135.3 |
175.9 |
1,188.6 |
326.9 |
1,870.1 |
|
Subordinated loan capital1 |
- |
1.6 |
- |
- |
- |
182.8 |
184.4 |
|
At 31 January 2024 |
468.7 |
2,045.5 |
4,199.5 |
1,823.3 |
1,841.5 |
509.7 |
10,888.2 |
1. Comprises issuances of £200.0 million with contractual maturity date of 2031 and optional prepayment date of 2026.
|
On demand £ million |
Within three months £ million |
Between £ million |
Between £ million |
Between two and five years £ million |
After £ million |
Total £ million |
|
|
Deposits by banks |
10.3 |
43.6 |
88.0 |
- |
- |
- |
141.9 |
|
Deposits by customers |
175.1 |
1,836.4 |
3,745.9 |
1,305.0 |
662.1 |
- |
7,724.5 |
|
Loans and overdrafts from banks |
31.8 |
20.1 |
228.0 |
262.0 |
110.0 |
- |
651.9 |
|
Debt securities in issue |
- |
30.4 |
228.7 |
197.8 |
1,261.8 |
293.9 |
2,012.6 |
|
Subordinated loan capital1 |
- |
1.6 |
- |
- |
- |
173.3 |
174.9 |
|
At 31 July 2023 |
217.2 |
1,932.1 |
4,290.6 |
1,764.8 |
2,033.9 |
467.2 |
10,705.8 |
1. Comprises issuances of £200.0 million with contractual maturity date of 2031 and optional prepayment date of 2026.
Assets pledged and received as collateral
The group pledges assets for repurchase agreements and securities borrowing agreements which are generally conducted under terms that are customary to standard borrowing contracts.
At 31 January 2024, the group was a participant of the Bank of England's Term Funding Scheme with Additional Incentives for SMEs ("TFSME") and the Indexed Long term Repo ("ILTR"). Under these schemes, asset finance loan receivables of £578.2 million (31 July 2023: £863.4 million), UK gilts with a market value of £12.0 million (31 July 2023: £nil) and retained notes relating to Motor Finance loan receivables of £57.3 million (31 July 2023: £83.4 million) were positioned as collateral with the Bank of England, against which £372.0 million (31 July 2023: £600.0 million) of cash was drawn from the TFSME and £10.0 million (31 July 2023: £5.0 million) from the ILTR. During the period ended 31 January 2024, the group early repaid £228.0m (31 July 2023: £nil) of TFSME drawdowns.
The term of the TFSME transactions is four years from the date of each drawdown but the group may choose to repay earlier at its discretion. The term of the ILTR transaction is six months and cannot be repaid earlier. The risks and rewards of the loan receivables remain with the group and continue to be recognised in loans and advances to customers on the consolidated balance sheet.
The group has securitised without recourse and restrictions £1,760.1 million (31 July 2023: £1,436.3 million) of its insurance premium and motor loan receivables in return for cash and asset-backed securities in issue of £1,546.4 million (31 July 2023: £1,187.4 million). This includes the £57.3 million (31 July 2023: £83.4 million) retained notes positioned as collateral with the Bank of England. As the group has retained exposure to substantially all the credit risk and rewards of the residual benefit of the underlying assets it continues to recognise these assets in loans and advances to customers in its consolidated balance sheet.
13. Other Equity Instrument
Other equity instrument comprises the group's £200.0 million Fixed Rate Reset Perpetual Subordinated Contingent Convertible Securities, or Additional Tier 1 capital ("AT1"), issued on 29 November 2023. These AT1 securities are classified as an equity instrument under IAS 32 'Financial Instruments: Presentation' with the proceeds recognised in equity net of transaction costs of £2.4 million.
These securities carry a coupon of 11.125%, payable semi-annually on 29 May and 29 November of each year, commencing on 29 May 2024, and have a first reset date on 29 May 2029. The securities include, among other things, a conversion trigger of 7.0% Common Equity Tier 1 capital ratio and are callable any time in the six-month period prior to and including the first reset date or on each reset date occurring every 5 years thereafter.
14. Capital
|
31 January |
31 July |
|
|
2024 |
2023 |
|
|
£ million |
£ million |
|
|
CET1 capital |
||
|
Total equity per balance sheet |
1,831.8 |
1,644.9 |
|
Adjustments to CET1 capital |
||
|
Contingent convertible securities recognised as AT1 capital1 |
(197.6) |
- |
|
Intangible assets, net of associated deferred tax liabilities |
(267.7) |
(262.8) |
|
Foreseeable dividends and charges2 |
(2.9) |
(67.0) |
|
Cash flow hedging reserve |
(24.3) |
(34.4) |
|
Pension asset, net of associated deferred tax liabilities |
(0.9) |
(1.0) |
|
Prudent valuation adjustment |
(0.6) |
(0.4) |
|
Insufficient coverage for non-performing exposures3 |
- |
(0.4) |
|
IFRS 9 transitional arrangements4 |
15.2 |
31.9 |
|
CET1 capital5 |
1,353.0 |
1,310.8 |
|
AT1 capital |
200.0 |
- |
|
Tier 1 capital5 |
1,553.0 |
1,310.8 |
|
Tier 2 capital - subordinated debt |
200.0 |
200.0 |
|
Total regulatory capital5 |
1,753.0 |
1,510.8 |
|
RWAs (notional) |
||
|
Credit and counterparty credit risk |
9,197.9 |
8,655.4 |
|
Operational risk6 |
1,084.0 |
1,084.0 |
|
Market risk6 |
98.3 |
108.2 |
|
10,380.2 |
9,847.6 |
|
|
CET1 capital ratio5 |
13.0% |
13.3% |
|
Tier 1 capital ratio5 |
15.0% |
13.3% |
|
Total capital ratio5 |
16.9% |
15.3% |
1. The contingent convertible securities are classified as an equity instrument for accounting but treated as AT1 for regulatory capital purposes.
2. Under CRR Article 26, a deduction has been recognised at 31 January 2024 and 31 July 2023 for foreseeable dividends and charges. At 31 July 2023 this reflected the proposed final dividend for the year ended 31 July 2023. At 31 January 2024 the deduction reflected a foreseeable charge for the coupon on the group's contingent convertible securities. No foreseeable dividend on ordinary shares has been recognised at 31 January 2024 following the group's announcement on 15 February 2024 that no dividend will be paid for the year ended 31 July 2024.
3. The deduction for non-performing exposures is not required at 31 January 2024, in line with policy statement PS14/23 effective on 14 November 2023.
4. The group has elected to apply IFRS 9 transitional arrangements for 31 January 2024, which allow the capital impact of expected credit losses to be phased in over the transitional period.
5. Shown after applying IFRS 9 transitional arrangements and the CRR transitional and qualifying own funds arrangements in force at the time. Without their application, at 31 January 2024 the CET1 capital ratio would be 12.9%, the tier 1 capital ratio 14.8% and total capital ratio 16.8% (31 July 2023: CET1 capital ratio 13.0%, tier 1 capital ratio 13.0%, and total capital ratio 15.1%).
6. Operational and market risk include an adjustment at 8% in order to determine notional RWAs.
The following table shows the movement in CET1 capital during the period:
|
Six months ended 31 January |
Year ended 31 July |
|||
|
2024 |
2023 |
2023 |
||
|
£ million |
£ million |
£ million |
||
|
CET1 capital at 1 August |
1,310.8 |
1,396.7 |
1,396.7 |
|
|
Profit in the period attributable to shareholders |
68.8 |
8.4 |
81.1 |
|
|
Dividends paid and foreseen |
(3.0) |
(33.5) |
(100.5) |
|
|
IFRS 9 transitional arrangements |
(16.6) |
(49.0) |
(51.1) |
|
|
(Increase)/decrease in intangible assets, net of associated deferred tax liabilities |
(4.9) |
(8.4) |
(12.1) |
|
|
Other movements in reserves recognised for CET1 capital |
(2.4) |
(6.5) |
(7.3) |
|
|
Other movements in adjustments from CET1 capital |
0.3 |
3.0 |
4.0 |
|
|
CET1 capital at end of period |
1,353.0 |
1,310.7 |
1,310.8 |
|
This note does not form a part of the interim financial statements referred to by PwC in its independent review report.
15. Defined Benefit Pension Scheme
During the previous year, the group's only defined benefit pension scheme ("the scheme") entered into a buy-in transaction with an insurance company covering all members of the scheme. A buy-in is a bulk annuity policy that matches the scheme's assets and liabilities. It represents a significant de-risking of the investment portfolio and hence a significant reduction in the group's long-term exposure to pension funding risk.
As a result of this transaction, the pension surplus on the group's balance sheet decreased to £1.3 million at 31 July 2023 relating to the cash held by the scheme, with the fair value of the insurance policy matched to the fair value of the scheme's liabilities, which remains subject to changes in actuarial valuations. The loss of the pension surplus represents the one-off premium paid for the insurance policy and was recognised within other comprehensive income in the six months ended 31 January 2023. There are no significant movements in the pension surplus in the current period ended 31 January 2024.
16. Contingent Liabilities
Motor Finance commission arrangements
As disclosed in previous periods, the group continues to receive a high number of complaints, many of which are now with the Financial Ombudsman Service ("FOS"), and is subject to a number of claims through the courts regarding historic Discretionary Commission Arrangements ("DCAs") with intermediaries on its Motor Finance products. This follows the FCA's Motor Market Review in 2019.
On 11 January 2024, the FOS published its first two decisions upholding customer complaints relating to DCAs against two other lenders in the market and instructed them to pay compensation to the complainants if they accepted the outcome. On the same day, recognising that these decisions were likely to significantly increase the number of complaints to motor finance providers and the FOS, risking disorderly and inconsistent outcomes as well as market instability, the FCA released policy statement PS 24/1 which introduced temporary changes to handling rules for motor finance complaints until at least September 2024. This means that firms will not have to respond to these complaints within the normal time limits. This was to allow the FCA time to carry out diagnostic work to determine whether or not there has been widespread failure to comply with regulatory requirements which has caused customers harm and, if so, whether it needs to take any action. The FCA has indicated that such steps could include establishing an industry-wide consumer redress scheme and/or applying to the Financial Markets Test Case Scheme, to help resolve any contested legal issues of general importance. The FCA aims to communicate a decision on next steps by the end of September 2024.
As set out in our trading update on 15 February 2024, there is significant uncertainty about the outcome of the FCA's review at this early stage. The FCA has indicated there could be a range of outcomes, with one potential outcome being an industry-wide consumer redress scheme. The estimated impact of any redress scheme, if required, is highly dependent on a number of factors such as: the time period covered; the DCA models impacted (the group operated a number of different models during the period under review); appropriate reference commission rates set for any redress; and response rates to any redress scheme. As such, at this early stage, the timing, scope and quantum of any potential financial impact on the group cannot be reliably estimated at present.
Based on the status at the half year and in accordance with the relevant accounting standards, the Board has concluded that no legal nor constructive obligation exists and it is currently not required or appropriate to recognise a provision in the group's Half-Year 2024 results. In addition, it is not practicable at this early stage to estimate any potential financial impact arising from this issue.
In the normal course of the group's business, there may be other contingent liabilities relating to complaints, legal proceedings or regulatory reviews. These cases are not currently expected to have a material impact on the group.
17. Related Party Transactions
Related party transactions, including salary and benefits provided to directors and key management, did not have a material effect on the financial position or performance of the group during the period. There were no changes to the type and nature of the related party transactions disclosed in the 2023 Annual Report that could have a material effect on the financial position and performance of the group in the six months to 31 January 2024.
18. Consolidated Cash Flow Statement Reconciliation
|
Six months ended 31 January |
Year ended 31 July |
||
|
2024 |
2023 |
2023 £ million |
|
|
(a) Reconciliation of operating profit before tax to net cash inflow from operating activities |
|||
|
Operating profit before tax |
93.8 |
11.7 |
112.0 |
|
Tax (paid)/refunded |
(31.9) |
1.9 |
(7.4) |
|
Depreciation, amortisation and impairment |
54.1 |
51.7 |
108.2 |
|
Impairment losses on financial assets |
41.7 |
162.2 |
204.1 |
|
Amortisation of de-designated cash flow hedges |
(15.4) |
- |
- |
|
(Increase)/decrease in: |
|||
|
Interest receivable and prepaid expenses |
(6.3) |
(14.7) |
(6.8) |
|
Net settlement balances and trading positions |
(13.2) |
(31.1) |
(11.4) |
|
Net loans from money brokers against stock advanced |
28.1 |
22.0 |
15.6 |
|
Decrease in interest payable and accrued expenses |
(21.7) |
(45.2) |
(16.5) |
|
Net cash inflow from trading activities |
129.2 |
158.5 |
397.8 |
|
Cash (outflow)/inflow arising from changes in: |
|||
|
Loans and advances to banks not repayable on demand |
11.2 |
(9.8) |
(21.1) |
|
Loans and advances to customers |
(401.1) |
(54.1) |
(584.3) |
|
Assets held under operating leases |
(31.8) |
(36.8) |
(73.2) |
|
Certificates of deposit |
- |
134.4 |
185.0 |
|
Sovereign and central bank debt |
- |
205.0 |
191.2 |
|
SSA bonds |
(140.9) |
- |
- |
|
Covered bonds |
(80.8) |
- |
(105.4) |
|
Deposits by banks |
(9.2) |
(8.3) |
(22.1) |
|
Deposits by customers |
542.1 |
462.4 |
942.5 |
|
Loans and overdrafts from banks |
(220.0) |
30.5 |
29.2 |
|
Debt securities in issue (net) |
(181.5) |
(38.7) |
14.4 |
|
Derivative financial instruments (net) |
- |
- |
70.4 |
|
Other assets less other liabilities |
(11.2) |
(10.0) |
(3.0) |
|
Net cash (outflow)/inflow from operating activities |
(394.0) |
833.1 |
1,021.4 |
|
(b) Analysis of net cash outflow in respect of the purchase of subsidiaries |
|||
|
Purchase of subsidiaries, net of cash acquired |
(11.2) |
(0.5) |
(0.5) |
|
(c) Analysis of net cash inflow in respect of the sale of subsidiaries |
|||
|
Cash consideration received |
0.2 |
0.5 |
- |
|
(d) Analysis of cash and cash equivalents1 |
|||
|
Cash and balances at central banks |
1,641.7 |
1,858.4 |
1,918.4 |
|
Loans and advances to banks |
245.8 |
241.9 |
290.9 |
|
1,887.5 |
2,100.3 |
2,209.3 |
|
1. Excludes £46.6 million (31 January 2023: £47.6 million; 31 July 2023: £58.0 million) of Bank of England and other cash reserve accounts and cash held in trust.
During the period ended 31 January 2024, the non-cash changes on debt financing amounted to £21.4 million (31 January 2023: £5.9 million; 31 July 2023: £0.9 million) arising largely from interest accretions and fair value hedging movements.
19. Fair Value of Financial Assets and Liabilities
The fair values of the group's subordinated loan capital and debt securities in issue are set out below.
|
31 January 2024 |
31 July 2023 |
||||
|
Fair value |
Carrying value |
Fair value |
Carrying value |
||
|
Subordinated loan capital |
171.5 |
184.4 |
165.8 |
174.9 |
|
|
Debt securities in issue |
1,877.1 |
1,870.1 |
2,008.0 |
2,012.6 |
|
The fair value of gross loans and advances to customers at 31 January 2024 is estimated to be £9,450.1 million (31 July 2023: £9,046.2 million), with a carrying value of £9,611.0 million (31 July 2023: £9,255.0 million). The fair value of deposits by customers is estimated to be £8,260.7 million (31 July 2023: £7,668.7 million), with a carrying value: £8,264.0 million (31 July 2023: £7,724.5 million). These estimates are based on highly simplified assumptions and inputs and may differ to actual amounts received or paid. The differences between fair value and carrying value are not considered to be significant, and are consistent with management's expectations given the nature of the Banking business and the short average tenor of the instruments.
The group holds financial instruments that are measured at fair value subsequent to initial recognition. Each instrument has been categorised within one of three levels using a fair value hierarchy that reflects the significance of the inputs used in making the measurements. These levels are based on the degree to which the fair value is observable and are defined in note 26 "Financial risk management" of the 2023 Annual Report. The table below shows the classification of financial instruments held at fair value into the valuation hierarchy:
|
Level 1 |
Level 2 |
Level 3 |
Total |
|
|
At 31 January 2024 |
||||
|
Assets |
||||
|
Debt securities: |
||||
|
Sovereign and central bank debt |
193.3 |
- |
- |
193.3 |
|
SSA bonds |
145.6 |
- |
- |
145.6 |
|
Covered bonds |
187.8 |
- |
- |
187.8 |
|
Long trading positions in debt securities |
13.4 |
2.2 |
- |
15.6 |
|
Equity shares |
4.7 |
21.4 |
0.5 |
26.6 |
|
Derivative financial instruments |
- |
73.2 |
11.8 |
85.0 |
|
Contingent consideration |
- |
- |
1.8 |
1.8 |
|
Other assets |
- |
- |
1.2 |
1.2 |
|
544.8 |
96.8 |
15.3 |
656.9 |
|
|
Liabilities |
||||
|
Short positions: |
||||
|
Debt securities |
3.5 |
1.0 |
- |
4.5 |
|
Equity shares |
1.6 |
5.2 |
- |
6.8 |
|
Derivative financial instruments |
- |
133.3 |
12.2 |
145.5 |
|
Contingent consideration |
- |
- |
- |
- |
|
5.1 |
139.5 |
12.2 |
156.8 |
|
Level 1 |
Level 2 |
Level 3 |
Total |
|
|
At 31 July 2023 |
||||
|
Assets |
||||
|
Debt securities: |
||||
|
Sovereign and central bank debt |
186.1 |
- |
- |
186.1 |
|
SSA bonds |
- |
- |
- |
- |
|
Covered bonds |
106.3 |
- |
- |
106.3 |
|
Long trading positions in debt securities |
13.6 |
1.6 |
- |
15.2 |
|
Equity shares |
3.9 |
25.1 |
0.3 |
29.3 |
|
Derivative financial instruments |
- |
77.4 |
11.1 |
88.5 |
|
Contingent consideration |
- |
- |
2.0 |
2.0 |
|
Other assets |
- |
- |
- |
- |
|
309.9 |
104.1 |
13.4 |
427.4 |
|
|
Liabilities |
||||
|
Short positions: |
||||
|
Debt securities |
2.3 |
1.2 |
- |
3.5 |
|
Equity shares |
1.7 |
4.6 |
0.1 |
6.4 |
|
Derivative financial instruments |
- |
184.7 |
11.2 |
195.9 |
|
Contingent consideration |
- |
- |
2.8 |
2.8 |
|
4.0 |
190.5 |
14.1 |
208.6 |
There is no significant change to the valuation methodologies relating to Level 2 and 3 financial instruments disclosed in note 26 "Financial risk management" of the 2023 Annual Report. Instruments classified as Level 3 predominantly comprise over-the-counter derivatives.
The valuation of Level 3 derivatives is similar to Level 2 derivatives and includes the use of discounted future cash flow models, with the most significant input into these models being interest rate yield curves developed from quoted rates. The fair value of contingent consideration is determined on a discounted expected cash flow basis. The group believes that there is no reasonably possible change to inputs used in the valuation of these positions which would have a material effect on the group's consolidated income statement.
During the period, £0.3 million of equity shares were transferred from Level 2 to 3. In 2023, £1.6 million of derivative financial assets and £1.8 million of derivative financial liabilities were transferred from Level 2 to 3.
Movements in financial instruments categorised as Level 3 were:
|
Derivative financial assets £ million |
Derivative financial liabilities £ million |
Equity shares £ million |
Contingent consideration £ million |
Other assets £ million |
Total £ million |
|
|
At 1 August 2022 |
- |
- |
0.2 |
(1.3) |
- |
(1.1) |
|
Total gains recognised in the consolidated income statement |
- |
- |
- |
0.2 |
- |
0.2 |
|
Purchases, issues and transfers in |
- |
- |
- |
0.5 |
- |
0.5 |
|
Sales, settlements and transfers out |
- |
- |
- |
- |
- |
- |
|
At 31 January 2023 (unaudited) |
- |
- |
0.2 |
(0.6) |
- |
(0.4) |
|
Total gains/(losses) recognised in the consolidated income statement |
9.5 |
(9.4) |
- |
(0.3) |
- |
(0.2) |
|
Purchases, issues and transfers in |
1.6 |
(1.8) |
- |
0.1 |
- |
(0.1) |
|
Sales, settlements and transfers out |
- |
- |
- |
- |
- |
- |
|
At 31 July 2023 |
11.1 |
(11.2) |
0.2 |
(0.8) |
- |
(0.7) |
|
Total gains/(losses) recognised in the consolidated income statement |
0.7 |
(1.0) |
- |
0.4 |
- |
0.1 |
|
Purchases, issues and transfers in |
- |
- |
0.3 |
- |
1.2 |
1.5 |
|
Sales, settlements and transfers out |
- |
- |
- |
2.2 |
- |
2.2 |
|
At 31 January 2024 |
11.8 |
(12.2) |
0.5 |
1.8 |
1.2 |
3.1 |
The loss recognised in the consolidated income statement relating to level 3 instruments held at 31 January 2024 amounted to £0.3 million (31 January 2023: £0.2 million gain, 31 July 2023: £nil).
20. Additional Support for Customers
Forbearance
Forbearance occurs when a customer is experiencing difficulty in meeting their financial commitments and a concession is granted, by changing the terms of the financial arrangement, which would not otherwise be considered. This arrangement can be temporary or permanent depending on the customer's circumstances.
The Banking division reports on forborne exposures as either performing or non-performing in line with regulatory requirements. A forbearance policy is maintained to ensure the necessary processes are in place to enable consistently fair treatment of all customers and that each is managed based on their individual circumstances. The arrangements agreed with customers will aim to create a sustainable and affordable financial position, thereby reducing the likelihood of suffering a credit loss. The forbearance policy is periodically reviewed to ensure it remains effective.
The Banking division offers a range of concessions to support customers which vary depending on the product and the customer's status. Such concessions include an extension outside terms (for example a higher LTV or overpayments) and refinancing, which may incorporate an extension of the loan tenor and capitalisation of arrears. Furthermore, other forms of forbearance such as moratorium, covenant waivers and rate concessions are also offered.
Forbearance analysis
At 31 January 2024 the gross carrying amount of exposures with forbearance measures was £255.4 million (31 July 2023: £214.6 million). The key driver of this value increase has been Asset Finance, reflecting continued efforts to support customers via provision of concessions reflective of their circumstances. The increase in volumes is mainly driven by Premium Finance, however this has a limited impact on overall forborne balances due to the low average loan size. This has been partly offset by reducing volumes across other businesses.
An analysis of forborne loans is shown in the table below:
|
Gross loans and advances to customers |
Forborne loans |
Forborne loans as a percentage of gross loans and advances to customers |
Provision on forborne loans |
Number of customers supported |
||
|
£ million |
£ million |
% |
£ million |
|||
|
31 January 2024 |
10,019.0 |
255.4 |
2.5% |
62.1 |
8,988 |
|
|
31 July 2023 |
9,635.6 |
214.6 |
2.2% |
56.1 |
6,996 |
|
The following is a breakdown of forborne loans by segment:
|
31 January 2024 |
31 July 2023 |
||
|
£ million |
£ million |
||
|
Commercial |
70.4 |
38.0 |
|
|
Retail |
34.1 |
28.8 |
|
|
Property |
150.9 |
147.8 |
|
|
255.4 |
214.6 |
The following is a breakdown of the number of customers supported by segment:
|
31 January 2024 Number of customers supported |
31 July 2023 Number of customers supported |
||
|
Commercial |
289 |
243 |
|
|
Retail |
8,652 |
6,700 |
|
|
Property |
47 |
53 |
|
|
8,988 |
6,996 |
The following is a breakdown of forborne loans by concession type:
|
31 January 2024 |
31 July 20231 |
||
|
£ million |
£ million |
||
|
Extension outside terms |
107.6 |
105.8 |
|
|
Refinancing |
33.3 |
10.4 |
|
|
Moratorium |
82.2 |
66.1 |
|
|
Deferring collections/recoveries activities |
28.7 |
29.8 |
|
|
Other modifications |
3.6 |
2.5 |
|
|
255.4 |
214.6 |
1. Comparatives have been updated to present deferring collections/recoveries activities category in a separate line.
Government lending schemes
Over the pandemic period, following accreditation, customers' facilities were offered under the UK government-introduced Coronavirus Business Interruption Loan Scheme ("CBILS"), the Coronavirus Large Business Interruption Loan Scheme ("CLBILS") and the Bounce Back Loan Scheme ("BBLS"), thereby enabling the Banking division to maximise its support to small businesses. At 31 January 2024, there are 3,642 (31 July 2023: 4,364) remaining facilities, with a residual balance of £311.7 million (31 July 2023: £456.3 million) as repayments continue to be made across the Asset Finance & Leasing and Invoice & Speciality Finance businesses.
The Banking division also received accreditation to offer products under the Recovery Loan Scheme ("RLS"), and schemes in the Republic of Ireland. Applications for facilities under phase 2 of the RLS closed in June 2022 and subsequently facilities have been offered under the new RLS phase 3. At 31 January 2024, there are 1,117 (31 July 2023: 943) live facilities, with balances of £289.0 million (31 July 2023: £276.2 million), and a further 59 (31 July 2023: 58) approved facilities with limits of £14.8 million (31 July 2023: £14.3 million)
The Banking division maintains a regular reporting cycle of these facilities to monitor performance. To date, a number of claims have been made and payments received under the government guarantee.
21. Interest Rate Risk
The group recognises three main sources of interest rate risk in the banking book ("IRRBB") which could adversely impact future income or the value of the balance sheet:
• repricing risk - the risk presented by assets and liabilities that reprice at different times and rates;
• embedded optionality risk - the risk presented by contract terms embedded into certain assets and liabilities; and
• basis risk - the risk presented by a mismatch in the reference interest rate for assets and liabilities.
IRRBB is assessed and measured by applying key behavioural and modelling assumptions including, but not limited to, those related to fixed rate loans subject to prepayment risk, the behaviour of non-maturity assets and liabilities, the treatment of own equity and the expectation of embedded interest rate options. This assessment is performed across a range of regulatory prescribed and internal interest rate shock scenarios approved by the bank's Asset and Liability Committee.
Two measures are used for measuring IRRBB, namely Earnings at Risk ("EaR") and Economic Value ("EV"):
• EaR measures short-term impacts to earnings, highlighting any earnings sensitivity should rates change unexpectedly.
• EV measures longer-term earnings sensitivity due to rate changes, highlighting the potential future sensitivity of earnings, and any risk to capital.
No material IRRBB exposure exists in the other parts of the group, and accordingly the analysis below relates to the Banking division and company.
EaR impact
The table below sets out the assessed impact on net interest income over a 12-month period from interest rate changes. The results shown are for an instantaneous and parallel change in interest rates at 31 January 2024:
|
31 January |
31 July |
||
|
2024 |
2023 |
||
|
£ million |
£ million |
||
|
0.5% increase |
1.9 |
4.5 |
|
|
2.5% increase |
9.5 |
22.6 |
|
|
0.5% decrease |
(1.9) |
(4.5) |
|
|
2.5% decrease |
(9.7) |
(22.8) |
The group's EaR at 31 January 2024 reflects its policy to ensure exposure to interest rate shocks is managed within the group's risk appetites. As BoE held rates constant since 3rd August 2023 the group reduced its exposure to short term rate movements resulting in a decrease in its EaR sensitivity compared to 31 July 2023.
EV impact
The table below sets out the assessed impact on our base case EV, which measures the impact on equity value of an instantaneous and parallel change in interest rates at 31 January 2024:
|
31 January |
31 July |
||
|
2024 |
2023 |
||
|
£ million |
£ million |
||
|
0.5% increase |
4.5 |
4.4 |
|
|
2.5% increase |
22.3 |
21.5 |
|
|
0.5% decrease |
(4.4) |
(4.4) |
|
|
2.5% decrease |
(19.3) |
(21.9) |
The group's EV at 31 January 2024 reflects its policy to ensure exposure to interest rate shocks is managed within the group's risk appetites. In a rising rate environment, the distance to the interest rate floors increases and so the benefit of the floors on the group's lending decreases. The EV measure is a combination of our repricing profile, which is positively correlated to rising rates, offset partially by embedded optionality to cover interest rate floors within the bank's lending and borrowing activities.
22. Post Balance Sheet Event
In December 2023, the group announced the acquisition of Bottriell Adams, an IFA business based in Dorset with approximately £220 million of client assets, as the Asset Management division extends its regional presence in the South West. The acquisition was completed in March 2024.
Cautionary Statement
Certain statements included or incorporated by reference within this announcement may constitute "forward-looking statements" in respect of the group's operations, performance, prospects and/or financial condition. All statements other than statements of historical fact are, or may be deemed to be, forward-looking statements. Forward-looking statements are sometimes, but not always, identified by their use of a date in the future or such words as "anticipates", "aims", "due", "could", "may", "will", "should", "expects", "believes", "intends", "plans", "potential", "targets", "goal" or "estimates". By their nature, forward-looking statements involve a number of risks, uncertainties and assumptions and actual results or events may differ materially from those expressed or implied by those statements. There are also a number of factors that could cause actual future operations, performance, financial conditions, results or developments to differ materially from the plans, goals and expectations expressed or implied by these forward-looking statements and forecasts. These factors include, but are not limited to, those contained in the Group's annual report (available at: https://www.closebrothers.com/investor-relations). Accordingly, no assurance can be given that any particular expectation will be met and reliance should not be placed on any forward-looking statement. Additionally, forward-looking statements regarding past trends or activities should not be taken as a representation that such trends or activities will continue in the future.
Except as may be required by law or regulation, no responsibility or obligation is accepted to update or revise any forward-looking statement resulting from new information, future events or otherwise. Nothing in this announcement should be construed as a profit forecast. Past performance cannot be relied upon as a guide to future performance and persons needing advice should consult an independent financial adviser.
This announcement does not constitute or form part of any offer or invitation to sell, or any solicitation of any offer to subscribe for or purchase any shares or other securities in the company or any of its group members, nor shall it or any part of it or the fact of its distribution form the basis of, or be relied on in connection with, any contract or commitment or investment decisions relating thereto, nor does it constitute a recommendation regarding the shares or other securities of the company or any of its group members. Statements in this announcement reflect the knowledge and information available at the time of its preparation. Liability arising from anything in this announcement shall be governed by English law. Nothing in this announcement shall exclude any liability under applicable laws that cannot be excluded in accordance with such laws.