
|
31 July 2025 - Press Release/Interim Results |
|
|
British American Tobacco p.l.c. |
|
|
Half-Year Report for the six months to 30 June 2025 |
|
|
On Track for Full-Year Guidance led by the U.S. and Velo's global growth |

Half-Year Summary
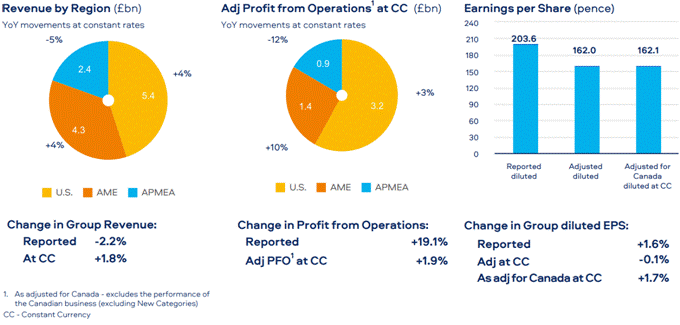
- Revenue down 2.2% (due to currency headwinds), up 1.8% at constant FX, driven by a return to growth in the U.S. (led by combustibles and Velo Plus), continued growth in AME, partly offset by APMEA
- New Categories revenue in line with 2024 at £1,651 million - an increase of 2.4% at constant FX
- Smokeless products now 18.2% of Group revenue, up 70 bps vs FY24
- Phased roll-out of innovations is expected to drive an accelerated H2 New Category performance
- New Categories contribution margin increased by 2.8 ppts to 10.6% at constant FX
- Improved combustibles financial performance (at constant FX), driven by price/mix
- Reported profit from operations up 19.1% (with reported operating margin up 7.5 ppts to 42.0%), partly due to the update of the Canadian settlement provision while the prior year was negatively impacted by non-repeating impairment charges
- Adjusted profit from operations (as adjusted for Canada) up 1.9% at constant FX, adjusted operating margin (as adjusted for Canada and at constant FX) flat at 43.2%
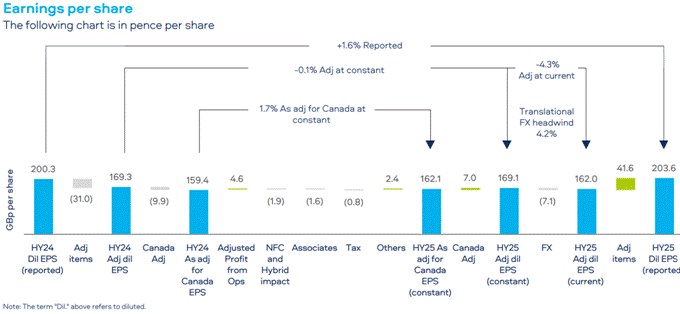
- Reported diluted EPS up 1.6% to 203.6p, with adjusted diluted EPS (as adjusted for Canada) up 1.7% at constant FX
- Increased 2025 share buy-back programme by £200 million to £1.1 billion
Tadeu Marroco, Chief Executive
"Our H1 performance is slightly ahead of expectations. 2025 is a deployment year and we are firmly on track to deliver our FY guidance.
We added 1.4 million consumers (to 30.5 million) of our smokeless brands. Our smokeless portfolio now accounts for 18.2% of Group revenue, an increase of 70 bps vs FY24.
I am very pleased with our performance in the U.S. Revenue and profit are both up for the first time since 2022 and, alongside the successful launch of Velo Plus, our combustibles volume and value share performance have returned to growth. AME continued to perform strongly, while our performance in APMEA has been impacted by fiscal and regulatory challenges in Bangladesh and Australia.
Velo continues to go from strength-to-strength in the fastest growing New Category. Our Quality Growth focus, prioritising investment in the largest profit pools, delivered higher returns, with New Category contribution up 38.6% at £179 million at constant FX, and further improvement expected for the FY.
Our continued strong cash conversion and the recent partial monetisation of our ITC stake has enhanced our capital flexibility, whilst further financial discipline will drive additional cost savings and smart re-investment.
I am confident that the investments we have made and actions we are taking, will drive a return to our mid-term algorithm in 2026. Alongside rewarding shareholders through strong cash returns, I am committed to delivering sustainable value for our shareholders."
Summary Information
|
Performance highlights |
Reported |
Adjusted2 |
Adjusted for Canada3 |
||||
|
For six months to 30 June 2025 |
Current |
vs 2024 |
Current |
vs 2024 |
vs 2024 |
||
|
rates |
(current) |
rates |
(constant) |
(constant) |
|||
|
Cigarette and HP volume share |
-20 bps |
||||||
|
Cigarette and HP value share |
-10 bps |
||||||
|
Consumers of smokeless products1 |
30.5m |
+1.4m |
|||||
|
Revenue (£m) |
£12,069m |
-2.2% |
£12,069m |
+1.8% |
+1.8% |
||
|
Revenue from New Categories (£m) |
£1,651m |
flat |
£1,651m |
+2.4% |
+2.4% |
||
|
Smokeless revenue as % of total revenue (%)4 |
18.2% |
+70 bps |
|||||
|
Profit from operations (£m) |
£5,069m |
+19.1% |
£5,394m |
+0.6% |
+1.9% |
||
|
Adjusted gross profit growth (%) |
-1.6% |
+2.1% |
+3.0% |
||||
|
Category contribution - New Categories (£m) |
£174m |
+38.6% |
+38.6% |
||||
|
Category contribution margin - New Categories (%) |
10.6% |
+2.8 ppts |
+2.8 ppts |
||||
|
Operating margin (%) |
42.0% |
+7.5 ppts |
44.7% |
-60 bps |
flat |
||
|
Diluted EPS (pence) |
203.6p |
+1.6% |
162.0p |
-0.1% |
+1.7% |
||
|
Net cash generated from operating activities (£m) |
£2,309m |
-27.0% |
|||||
|
Free cash pre-dividend (£m) |
£1,234m |
-42.1% |
|||||
|
Adjusted cash generated from operations (£m) |
£1,483m |
-32.3% |
|||||
|
Cash conversion (%) |
45.6% |
-28.7 ppts |
74.6% |
-4.5 ppts |
|||
|
Borrowings including lease liabilities (£m) |
£35,208m |
-12.3% |
|||||
|
Adjusted net debt (£m) |
£29,749m |
-5.1% |
|||||
The use of non-GAAP measures, including adjusting items and constant currencies, are further discussed from page 49, with reconciliation from the most comparable IFRS measure provided.
Notes:
1. Internal estimate. 2. See page 25 for discussion on adjusting items. 3. As adjusted for Canada excludes the performance of the Canadian business (excluding New Categories) given the requirement to use the profits earned to settle the litigation liability - see page 13. There is no adjustment to revenue. 4. Movement in smokeless revenue as a % of total revenue compared to full year 2024.
On Track for Full-Year 2025 Guidance
- Global tobacco industry volume expected to be down c.2%.
- Revenue growth at the top end of 1.0-2.0% guidance range*, with mid-single digit New Category revenue growth*.
- 1.5-2.5% adjusted profit from operations growth (adj. for Canada)* including an expected c.1.0-1.5% transactional FX headwind.
- We expect a translational FX headwind of c.4% on adjusted profit from operations (adj. for Canada).
- Net finance costs expected to be c.£1.8 billion (adj. for Canada)*, subject to interest rate volatility.
- Gross capital expenditure in 2025 of approximately £650 million.
- Operating cash flow conversion conversion that exceeds 90%.
- Continue to deleverage to our 2.0-2.5x adjusted net debt/adjusted EBITDA (adj. for Canada)* corridor by 2026.
- Commitment to dividend growth in sterling terms and £1.1 billion share buy-back.
* at constant rates of exchange
Enquiries
|
For more information, please contact Investor Relations: Victoria Buxton +44 (0)20 7845 2012 Amy Chamberlain +44 (0)20 7845 1124 John Harney+44 (0)20 7845 1263 BAT IR TeamIR_Team@bat.com |
Press Office: +44 (0)20 7845 2888 | @BATplc BAT Media Team |
Webcast and Q&A session:
BAT will hold a live webcast for investors and analysts at 9.30am (BST) on 31 July 2025, hosted by Tadeu Marroco, Chief Executive, and Soraya Benchikh, Chief Financial Officer. The presentation will be followed by a Q&A session.
The webcast and presentation slides will be available to view on our website at www.bat.com/latestresults.
If you prefer to listen via conference call, please use the following dial-in details (participant passcode: BAT - HY25).
|
Standard International: +44 (0) 20 3147 4669 |
SA (toll free): 0 800 981 672 |
|
UK (toll free): 0808 238 9062 |
U.S. (toll free): + 1 877 269 7600 |
Video: Chief Executive and CFO's take on Half-Year 2025 Results: To watch highlights of this year's results, please visit: www.bat.com/highlights-video-hy25
Group Operating Review
Total Group volume and revenue
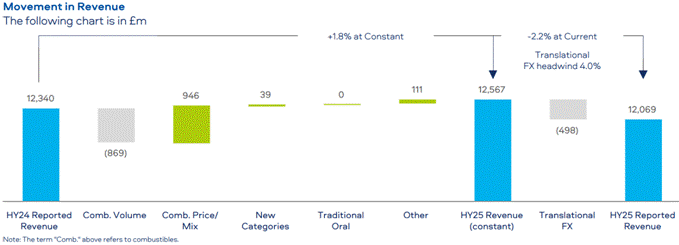
Reported revenue decreased 2.2% to £12,069 million, negatively impacted by a translational foreign exchange headwind of 4.0%.
On a constant currency basis, revenue grew by 1.8%, as:
- The U.S. grew revenue (up 3.7%) driven by combustibles price/mix (up 11.4%) and the success of the Velo Plus launch (with revenue of Modern Oral up 384% to £105 million). These more than offset lower combustibles volume (down 7.6%);
- AME increased by 3.5% led by combustibles price/mix (+6.8%) and the growth of Modern Oral (16.5% higher), which drove New Categories revenue up 1.3%; and
- APMEA (down 4.8%) faced regulatory and fiscal challenges in Australia and Bangladesh, which more than offset higher revenue in the remainder of the region, notably in Pakistan, Nigeria and Indonesia.
New Categories continued to grow, with revenue up 2.4% on a constant rates basis driven by Modern Oral (up 40.6%) and HP (up 3.1%). However, Vapour declined 13.0% due to the continued impact of illicit products in the U.S. and Canada and evolving market dynamics (in the UK and France). Our New Categories performance is expected to accelerate in the second half of 2025, driven by the phasing of innovation launches.
Group cigarette volume share declined 10 bps, with value share down 10 bps despite improvement in the U.S. where the Group volume share grew 10 bps and value share grew 20 bps.
Please refer to pages 5 to 7 for discussion on regional performance and pages 8 to 9 for a further discussion on the performance by category.
Profit from operations, operating margin and category contribution
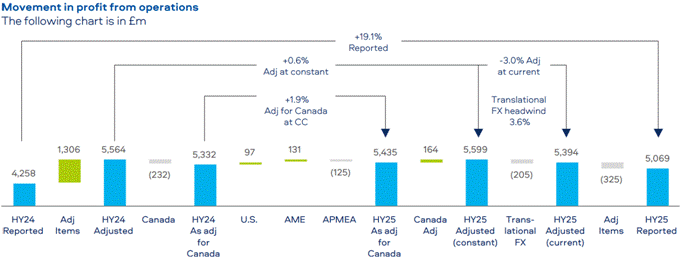
Profit from operations on a reported basis was up 19.1%, with reported operating margin up 7.5 ppts to 42.0%. These were driven by lower adjusting items of £325 million (compared to £1,306 million in 2024). This was largely due to a net credit of £575 million as the provision recognised in relation to the Canadian litigation settlement was updated following a change to the forecasted Canadian combustibles industry performance impacting the present value of the future liability described on page 13. Furthermore, the prior year included impairment charges that did not repeat (as discussed on page 25).
This was partly offset by a translational foreign exchange headwind of 3.6% or £205 million.
On an adjusted, constant currency basis and also as adjusted for Canada, profit from operations increased by 1.9% to £5,435 million. Despite inflation on our product costs estimated to be 6.2% (or £166 million), this improvement was largely due to:
- An increase in New Categories contribution by £50 million to £179 million; and
- The U.S., which grew by 3.2%, and AME, up 10.4%. These partially offset APMEA which was down 12.3%, with the regional performance largely driven by the respective revenue performance discussed above.
Adjusted operating margin declined 60 bps to 44.5% at constant rates of exchange, and flat at 43.2% when adjusted for Canada.
For a full discussion on the performance by region, please see pages 5 to 7.
Group Operating Review
Continued
- A gain of £333 million in respect of the demerger of the hotels division of the Group's Indian associate ITC described on page 28 and offset by:
- A lower provisional gain arising on the partial sale of the Group's investment in ITC in 2025 (£904 million) compared to
£1,361 million in 2024 due to a lower number of shares disposed of (2025: 313.0 million shares; 2024: 436.9 million shares) as discussed on page 28; and
- A credit in 2024, that did not repeat in 2025, of £590 million related to the debt liability management exercise (see page 27).
Basic earnings per share were also positively impacted by the reduction in the number of shares due to the cumulative effect of the 2024 and 2025 share buy-back programme, with 14,075,158 ordinary shares repurchased and cancelled in the six months ended 30 June 2025.
Before adjusting items, the impact of translational foreign exchange and including the dilutive effect of employee share schemes, adjusted diluted earnings per share, at constant rates, declined 0.1% to 169.1p (30 June 2024: 169.3p).
Adjusting for the profit1 performance of Canada, which will largely be paid to the claimants in the settlement arrangement discussed on page 13 and does not form part of Management's assessment of the underlying performance of the Group, adjusted diluted earnings per share (as adjusted for Canada) and at constant rates of exchange were 1.7% higher at 162.1p (30 June 2024: 159.4p).
For a full reconciliation of diluted earnings per share to adjusted diluted earnings per share and adjusted diluted earnings per share (as adjusted for Canada), both at constant rates, see page 56.
1. The adjustment in respect of Canada is discussed on page 13, and is based upon the profit after interest and tax from all sources, excluding New Categories, in Canada.
Analysis of profit from operations and diluted earnings per share by segment
Prior year data is provided in the table on page 47.
|
For six months to 30 June 2025 |
Reported |
vs 2024 |
Adj Items1 |
Adjusted |
vs 2024 |
Exch. |
Adjusted at CC2 |
vs 2024 |
vs 2024 (Adjusted for Canada3 at CC2) |
|
|
£m |
% |
£m |
£m |
% |
£m |
£m |
% |
% |
||
|
Profit from Operations |
||||||||||
|
U.S. |
2,255 |
+27.1% |
808 |
3,063 |
+0.3% |
87 |
3,150 |
+3.2% |
+3.2% |
|
|
AME |
1,969 |
+33.6% |
(495) |
1,474 |
-0.9% |
76 |
1,550 |
+4.3% |
+10.4% |
|
|
APMEA |
845 |
-16.3% |
12 |
857 |
-16.3% |
42 |
899 |
-12.3% |
-12.3% |
|
|
Total Region |
5,069 |
+19.1% |
325 |
5,394 |
-3.0% |
205 |
5,599 |
+0.6% |
+1.9% |
|
|
Net finance costs |
(969) |
+218% |
98 |
(871) |
+6.1% |
(14) |
(885) |
+7.8% |
+4.8% |
|
|
Associates and joint ventures |
1,474 |
-10.5% |
(1,242) |
232 |
-17.1% |
13 |
245 |
-12.7% |
-12.7% |
|
|
Profit before tax |
5,574 |
-0.5% |
(819) |
4,755 |
-5.3% |
204 |
4,959 |
-1.3% |
+0.5% |
|
|
Taxation |
(1,009) |
-3.1% |
(95) |
(1,104) |
-4.6% |
(47) |
(1,151) |
-0.5% |
+1.7% |
|
|
Non-controlling interests |
(53) |
-20.9% |
(3) |
(56) |
-16.4% |
(1) |
(57) |
-15.7% |
-15.7% |
|
|
Coupons relating to hybrid bonds net of tax |
(22) |
+4.3% |
- |
(22) |
+4.3% |
- |
(22) |
+4.3% |
+4.3% |
|
|
Profit attributable to shareholders |
4,490 |
+0.4% |
(917) |
3,573 |
-5.5% |
156 |
3,729 |
-1.3% |
+0.4% |
|
|
Diluted number of shares (m) |
2,205 |
-1.2% |
2,205 |
-1.2% |
2,205 |
-1.2% |
-1.2% |
|||
|
Diluted earnings per share (pence) |
203.6 |
+1.6% |
162.0 |
-4.3% |
169.1 |
-0.1% |
+1.7% |
1. Adjusting items represent certain items which the Group considers distinctive based upon their size, nature or incidence - see pages 25 to 28.
2. CC: constant currency - measures are calculated based upon a re-translation, at the prior year's exchange rates, of the current year's results of the Group and, where applicable, its segments.
3. As adjusted for Canada excludes the performance of the Canadian business (excluding New Categories).
Regional Review
The performances of the regions are discussed below. The following discussion is based upon the Group's internal reporting structure.
All references to volume share or value share movement in the following discussion are compared to FY 2024. See page 40 for a discussion on the use of these measures.
Our products as sold in the U.S., including Vuse, Velo, Grizzly, Kodiak, and Camel Snus, are subject to FDA regulation and no reduced-risk claims will be made as to these products without agency clearance.
United States (U.S.):
- Reported revenue up 1.0%, being an increase of 3.7% at constant rates.
- Velo category volume share up 6.8 ppts to 13.2%, with Velo Plus driving strong revenue growth in Modern Oral, up 372%.
- Vuse maintained value share leadership in tracked channels - despite a 14.5% decline in revenue, being a decrease of 12.3% at constant rates of exchange, mainly driven by lower volume due to the continued impact of illicit single-use vapour products.
- Combustibles revenue up 1.1% (up 3.8% at constant rates) as price/mix more than offset a 7.6% decline in volume which benefited from a lower comparator. Volume share grew 10 bps with value share up 20 bps.
- Smokeless now represents 19.5% of total revenue.
Volume/Revenue
Please see page 51 for a full reconciliation to constant currency metrics, including prior year data.
|
For six months to 30 June 2025 |
Volume |
Revenue |
||||||
|
Reported |
Reported |
|||||||
|
Current |
Exchange |
Constant |
||||||
|
Unit |
vs 2024 |
£m |
vs 2024 |
£m |
£m |
vs 2024 |
||
|
New Categories |
536 |
+1.3% |
14 |
550 |
+3.9% |
|||
|
Vapour (units mn) |
123 |
-13.8% |
434 |
-14.5% |
11 |
445 |
-12.3% |
|
|
HP (sticks bn) |
- |
-% |
- |
-% |
- |
- |
-% |
|
|
Modern Oral (pouches bn) |
1.1 |
+206% |
102 |
+372% |
3 |
105 |
+384% |
|
|
Traditional Oral (stick eq bn) |
2.5 |
-9.5% |
521 |
-2.9% |
14 |
535 |
-0.4% |
|
|
Total Smokeless |
1,057 |
-0.8% |
28 |
1,085 |
+1.8% |
|||
|
Total Combustibles (bn sticks) |
21 |
-7.6% |
4,328 |
+1.1% |
114 |
4,442 |
+3.8% |
|
|
Other |
47 |
+52.5% |
1 |
48 |
+57.1% |
|||
|
Total |
5,432 |
+1.0% |
143 |
5,575 |
+3.7% |
|||
Constant currency measures are calculated based upon a re-translation, at the prior year's exchange rates, of the current year's results of the Group and, where applicable, its segments.
See page 44 for a discussion on the preparation of the U.S. financial information, initially based on U.S. GAAP as the primary financial record and converted to IFRS for the purpose of consolidation within the results of the Group.
Reported revenue increased 1.0%, despite a translational foreign exchange headwind, negatively impacting revenue by 2.7%.
On a constant currency basis, revenue increased 3.7%. This was driven by the performance in:
- Combustibles, where revenue increased 3.8%, as price/mix (+11.4%) more than offset a 7.6% reduction in volume. While this was marginally lower than the industry volume decline of 8%, our volume was negatively impacted in 2024 by the phasing of wholesaler inventory. Our volume share was up 10 bps and value share was up 20 bps following the actions taken in 2024 to improve performance;
- Vapour, where the U.S. is the world's largest Vapour market. The Group maintained leadership in value share (of Vapour closed systems consumables in tracked channels) despite a decline in value share of 20 bps to 49.5%. Revenue was down 12.3%, as price/mix (+1.5%) was offset by a 13.8% decline in consumables volume mainly due to the continued impact of illicit single-use vapes which we estimate to be more than 50% of the total Vapour market;
- Modern Oral, where revenue increased by 384%, driven by higher volume (up 206%) following the successful national roll-out of Velo Plus, with Velo category volume share almost doubling, up 6.8 ppts to 13.2%1; and
- Traditional Oral, where revenue declined 0.4%, as price/mix (+9.1%) was more than offset by lower volume (down 9.5%) due to the continued cross-category use of Modern Oral.
1. Please refer to page 40.
Profit from operations and operating margin
Please see page 47 for a full reconciliation to constant currency metrics, including prior year data.
|
For six months to 30 June 2025 |
Reported |
Adj. |
Exchange |
Adjusted |
|||
|
Current |
Constant |
||||||
|
£m |
vs 2024 |
£m |
£m |
£m |
vs 2024 |
||
|
Profit from Operations |
2,255 |
+27.1% |
808 |
87 |
3,150 |
+3.2% |
|
|
Operating Margin |
41.5% |
+8.5 ppts |
56.5% |
-30 bps |
|||
Constant currency measures are calculated based upon a re-translation, at the prior year's exchange rates, of the current year's results of the Group and, where applicable, its segments.
Reported profit from operations increased by 27.1%, as both an impairment charge of £472 million in respect of Camel Snus (see page 25) and income (£132 million) related to Fox River recognised in 2024 did not repeat. Accordingly, reported operating margin was up 8.5 ppts to 41.5%.
Excluding adjusting items (largely in respect of amortisation and impairment charges and income related to Fox River recognised in 2024) and a translational foreign exchange headwind of £87 million, our performance was positively impacted by the growth in revenue (described above).
Adjusted profit from operations, at constant rates of exchange was up 3.2% to £3,150 million.
Regional Review
Continued
Americas and Europe (AME):
- Reported revenue down 2.2%, up 3.5% at constant rates.
- New Category revenue declined 0.8%, but up 1.3% at constant rates of exchange.
- Resilient combustibles revenue performance - down 3.5% due to currency, being an increase of 2.8% at constant rates of exchange driven by price/mix.
- Combustibles volume share down 30 bps and value share down 80 bps.
- Multi-category region with smokeless now representing 19.9% of revenue.
Volume/Revenue
Please see page 51 for a full reconciliation to constant currency metrics, including prior year data.
|
For six months to 30 June 2025 |
Volume |
Revenue |
||||||
|
Reported |
Reported |
|||||||
|
Current |
Exchange |
Constant |
||||||
|
Unit |
vs 2024 |
£m |
vs 2024 |
£m |
£m |
vs 2024 |
||
|
New Categories |
832 |
-0.8% |
17 |
849 |
+1.3% |
|||
|
Vapour (units mn) |
112 |
-7.3% |
267 |
-11.4% |
7 |
274 |
-9.1% |
|
|
HP (sticks bn) |
3.9 |
-8.3% |
218 |
-7.4% |
5 |
223 |
-4.8% |
|
|
Modern Oral (pouches bn) |
3.3 |
+24.9% |
347 |
+14.7% |
5 |
352 |
+16.5% |
|
|
Traditional Oral (stick eq bn) |
0.3 |
-16.8% |
21 |
+11.4% |
(1) |
20 |
+10.1% |
|
|
Total Smokeless |
853 |
-0.6% |
16 |
869 |
+1.5% |
|||
|
Total Combustibles (bn sticks) |
115 |
-4.0% |
3,216 |
-3.5% |
211 |
3,427 |
+2.8% |
|
|
Other |
212 |
+15.2% |
22 |
234 |
+26.4% |
|||
|
Total |
4,281 |
-2.2% |
249 |
4,530 |
+3.5% |
|||
Constant currency measures are calculated based upon a re-translation, at the prior year's exchange rates, of the current year's results of the Group and, where applicable, its segments.
Reported revenue was down 2.2% due to a translational foreign exchange headwind of 5.7%.
On a constant currency basis, which we believe reflects the operational performance, revenue increased by 3.5% to £4,530 million, driven by:
- Higher revenue from combustibles (up 2.8%), largely driven by higher volume and pricing in both Brazil and Türkiye. These factors combined with robust pricing in Romania and Poland to more than offset a reduction in revenue in Canada; and
- Modern Oral, where we are category leaders, with volume up 24.9%. Revenue grew 16.5%, while volume share of the Modern Oral category was down 30 bps.
The volume and revenue growth reflects the strength of our portfolio in both established oral markets across Scandinavia and markets that are more recent adopters of Modern Oral, such as the UK, Austria and Switzerland.
These more than offset:
- Lower revenue from Vapour (down 9.1%), largely driven by lower revenue in Canada (due to the continued lack of enforcement against illegal flavoured vapour products) and evolving market dynamics (in the UK and France). Our value share leadership was up 30 bps with gains in Europe partly offset by value share loss in Canada; and
- HP (down 4.8%), as higher revenue in Poland and Portugal was more than offset by declines in the Czech Republic, Germany and Romania partly due to the prioritisation of resource allocation ahead of the wider roll-out of glo Hilo.
Profit from operations and operating margin
Please see page 47 for a full reconciliation to constant currency and as adjusted for Canada metrics, including prior year data.
|
For six months to 30 June 2025 |
Reported |
Adj. |
Exchange |
Adjusted |
Adjusted for Canada1 |
||||
|
Current |
Constant |
Constant |
|||||||
|
£m |
vs 2024 |
£m |
£m |
£m |
vs 2024 |
vs 2024 |
|||
|
Profit from Operations |
1,969 |
+33.6% |
-495 |
76 |
1,550 |
+4.3% |
+10.4% |
||
|
Operating Margin |
46.0% |
+12.3 ppts |
34.2% |
+20 bps |
+1.9 ppts |
||||
Constant currency measures are calculated based upon a re-translation, at the prior year's exchange rates, of the current year's results of the Group and, where applicable, its segments.
1. Adjusted for Canada excludes the performance of the Canadian business (excluding New Categories)
Reported profit from operations increased by 33.6% mainly due to a net credit of £575 million as the provision recognised in relation to the Canadian litigation settlement was updated following a change to the forecasted Canadian combustibles industry performance impacting the present value of the future liability described on page 13. H1 2025 was also impacted by a translational foreign exchange headwind.
Excluding the impact of foreign exchange, adjusting items and also adjusting for the performance of Canada, adjusted profit from operations was up 10.4% to £1,386 million, driven by an improved financial performance in:
- Brazil, due to combustibles with higher volume and pricing;
- Romania, due to pricing in combustibles;
- Türkiye, due to the revenue performance in combustibles; and
- An improved financial performance across our New Categories, notably in Modern Oral (driven by Sweden, the UK, Switzerland and Norway), and a reduction in losses in HP (in Germany, Switzerland and Poland) driven by resource allocation.
Regional Review
Continued
Asia-Pacific, Middle East and Africa (APMEA):
- Reported revenue declined 8.9%, being a decrease of 4.8% at constant rates.
- New Category revenue up 0.4%, or 2.5% at constant rates of exchange, driven by HP in Japan.
- Headwinds to volume and financial performance due to regulatory and fiscal challenges in Australia and Bangladesh.
- Combustibles value share down 20 bps with volume share down 10 bps..
- Smokeless now represents 12.0% of total revenue.
Volume/Revenue
Please see page 51 for a full reconciliation to constant currency metrics, including prior year data.
|
For six months to 30 June 2025 |
Volume |
Revenue |
||||||
|
Reported |
Reported |
|||||||
|
Current |
Exchange |
Constant |
||||||
|
Unit |
vs 2024 |
£m |
vs 2024 |
£m |
£m |
vs 2024 |
||
|
New Categories |
283 |
+0.4% |
7 |
290 |
+2.5% |
|||
|
Vapour (units mn) |
18 |
-33.4% |
36 |
-40.5% |
1 |
37 |
-38.4% |
|
|
HP (sticks bn) |
6.2 |
+8.7% |
226 |
+10.1% |
5 |
231 |
+12.3% |
|
|
Modern Oral (pouches bn) |
0.6 |
+15.1% |
21 |
+29.7% |
1 |
22 |
+32.7% |
|
|
Traditional Oral (stick eq bn) |
- |
-% |
- |
-% |
- |
- |
-% |
|
|
Total Smokeless |
283 |
+0.4% |
7 |
290 |
+2.5% |
|||
|
Total Combustibles (bn sticks) |
98 |
-14.1% |
1,971 |
-12.0% |
93 |
2,064 |
-7.9% |
|
|
Other |
102 |
+63.1% |
6 |
108 |
+73.0% |
|||
|
Total |
2,356 |
-8.9% |
106 |
2,462 |
-4.8% |
|||
Constant currency measures are calculated based upon a re-translation, at the prior year's exchange rates, of the current year's results of the Group and, where applicable, its segments.
Reported revenue declined 8.9% largely due to the regulatory and fiscal challenges in Australia and Bangladesh, which more than offset higher revenue in the remainder of the region, notably in Pakistan, Nigeria and Indonesia. Translational foreign exchange was a further headwind of 4.1%.
On a constant currency basis, which we believe reflects the operational performance, revenue was down 4.8%.
However, New Categories increased by 2.5% at constant rates, driven by:
- HP, largely driven by Japan and Kazakhstan; and
- Modern Oral, fuelled by robust growth from Global Travel Retail and a performance that further demonstrates Modern Oral's potential in Emerging Markets.
This was offset by lower revenue in Vapour, as volume declined 33.4%, leading to a 40.5% reduction in revenue (being down 38.4% at constant rates), largely driven by the Group exiting the category in a number of markets (including Malaysia, Japan and Saudi Arabia) and a change in competitive dynamics in other markets (such as South Africa and New Zealand).
Profit from operations and operating margin
Please see page 47 for a full reconciliation to constant currency metrics, including prior year data.
|
For six months to 30 June 2025 |
Reported |
Adj. |
Exchange |
Adjusted |
|||
|
Current |
Constant |
||||||
|
£m |
vs 2024 |
£m |
£m |
£m |
vs 2024 |
||
|
Profit from Operations |
845 |
-16.3% |
12 |
42 |
899 |
-12.3% |
|
|
Operating Margin |
35.9% |
-3.2 ppts |
36.5% |
-3.1 ppts |
|||
Constant currency measures are calculated based upon a re-translation, at the prior year's exchange rates, of the current year's results of the Group and, where applicable, its segments.
Profit from operations was 16.3% lower, including a translational foreign exchange headwind of 4.0%.
Excluding adjusting items and translational foreign exchange, adjusted profit from operations at constant rates was down 12.3% to £899 million driven by:
- Australia due to continued increases in the illicit segment which we estimate now accounts for more than 50% of the combustibles industry volume, with the duty paid combustibles industry volume down more than 30% in 2025; and
- Bangladesh, driven by the increase in excise and minimum price in January 2025, necessitating an increase in consumer prices by 20-30%, which has resulted in a reduction in the duty paid combustibles industry volume by an estimated 27%.
However, these were partly offset by an increase in Pakistan (led by the growth of Modern Oral and pricing in combustibles), Nigeria (driven by higher combustibles volume and improved combustibles pricing) and Indonesia where combustibles volume was up.
Category Performance Review
Vapour
- Continued value share* leadership (in tracked channels) despite flat performance.
- Vapour revenue down 15.3% or 13.0% (at constant rates), with volume down 12.9%, impacted by illicit products in the U.S. and Canada and evolving market dynamics (in the UK and France).
- In Europe, Vapour value share up 30 bps, with industry rechargeable closed systems back in growth.
- Vuse Ultra, our new premium product, continues to be rolled out in H2 2025, with expected acceleration in vapour revenue.
Group Vapour performance was negatively impacted by:
- The U.S., the world's largest Vapour market, where Group volume was down 13.8% mainly due to the continued proliferation of illicit single-use vapes and inventory movements. Accordingly, revenue was down 14.5% (or 12.3% on a constant currency basis). The Group maintained leadership in value share (of Vapour closed systems consumables in tracked channels) despite a decline in value share of 20 bps to 49.5%.
- AME, where revenue declined 11.4% (or 9.1% on a constant currency basis), largely driven by lower revenue in Canada (due to the continued lack of enforcement against illegal flavoured vapour products) and evolving market dynamics (in the UK and France). Our value share leadership was up 30 bps with gains in Europe partly offset by value share loss in Canada; and
- APMEA, where volume declined 33.4%, leading to a 40.5% reduction in revenue (being down 38.4% at constant rates), largely driven by the Group exiting the category in a number of markets (including Malaysia, Japan and Saudi Arabia) and a change in competitive dynamics in other markets (such as South Africa and New Zealand).
Our new premium innovation, Vuse Ultra, offers consumers a highly differentiated, connected and customisable experience. We are encouraged by the early performance in Canada and will continue the roll-out in a targeted way through H2 2025.
*Based on Vuse estimated value share in measured retail for Vapour (i.e., value share of rechargeable closed systems consumables and disposables sales in retail) in the Top global markets**.
**Top Vapour markets are defined as the Top markets by industry revenue, being the U.S., Canada, the UK, France, Germany, Poland and Spain. These Top markets account for c.80% of total industry vapour revenue (rechargeable closed systems consumables and disposables in tracked channels) in 2024.
Heated Products (HP)
- Revenue up 0.8%, or 3.1% at constant rates, driven by Quality Growth focus in largest profit pools.
- Volume share ***, down 70 bps, impacted by competitive pressure in Japan and phase-out of legacy super-slims.
- AME volume share down 10 bps with growth in Poland and the Czech Republic, stable share in Italy more than offset by Germany and Romania.
- Momentum building with successful pilot of glo Hilo ahead of phased roll-out in key markets in H2 2025, with expected acceleration in revenue.
In APMEA, volume was up 8.7%, with revenue up 10.1%, or 12.3% at constant rates, largely driven by Japan and Kazakhstan.
In AME, volume was down 8.3%, with revenue down 7.4% (being a decline of 4.8% at constant rates), as higher revenue in Poland and Portugal was more than offset by declines in the Czech Republic, Germany and Romania partly due to the prioritisation of resource allocation ahead of the wider roll-out of glo Hilo.
Our new premium connected device, glo Hilo, offers superior heating technology and an integrated display combined with a new consumables range, Virto and tobacco-free Rivo. We will continue the roll-out through H2 2025 in a targeted way focused on the largest profit pools.
***Volume share is based upon the Top HP markets which are defined as the Top markets by industry revenue. Top markets are Japan, South Korea, Italy, Germany, Greece, Poland, Romania, the Czech Republic, Spain and Portugal. These Top markets account for c.80% of total industry HP revenue in 2024.
Modern Oral
- Revenue up 38.1%, or 40.6% at constant rates, with volume growth of 42.2%.
- Growth in volume share* up 3.3 ppts in Total Oral and up 4.4 ppts in Modern Oral.
- AME volume share leadership maintained, with strong financial performances in Scandinavia and the UK.
- Triple-digit volume and revenue growth in the U.S. following the national roll-out of Velo Plus.
In AME, we are category leaders, with volume up 24.9%. Revenue grew 14.7% (or 16.5% at constant rates) while volume share of the Modern Oral category was down 30 bps.
The volume and revenue growth reflects the strength of our portfolio in both established oral markets across Scandinavia and markets that are more recent adopters of Modern Oral, such as the UK, Austria and Switzerland.
In the U.S., revenue increased by 372% (or 384% at constant rates), driven by higher volume (up 206%) following the successful national roll-out of Velo Plus, with Velo category volume share almost doubling, up 6.8 ppts to 13.2%.
In APMEA, our volume grew 15.1% and our revenue grew 29.7% (or 32.7% at constant rates), fuelled by robust growth from Global Travel Retail and a performance that further demonstrates Modern Oral's potential in Emerging Markets.
*Volume share is based uoon the Top Oral and Modern Oral markets which are defined as the Top markets by industry revenue, being the U.S., Sweden, Denmark, Norway, Switzerland, UK and Poland, accounting for c.90% of total industry Modern Oral revenue in 2024.
Category Performance Review
Continued
Combustibles
- Volume and value share down 10 bps*, growth in the U.S. more than offset by AME and APMEA.
- Excluding currency, positive revenue and category contribution growth driven by the U.S. and AME.
- Return to growth in the U.S., with revenue up 1.1% (or 3.8% at constant rates) as price/mix more than offset volume decline.
- Resilient AME performance with revenue down 3.5%, or up 2.8% at constant rates, driven by Brazil, Türkiye and Romania.
- APMEA revenue declined 12.0%, or 7.9% at constant rates, impacted by Australia and Bangladesh with volume down 14.1%.
Group cigarette volume was down 8.7% to 229 billion sticks as volume growth in Brazil and Türkiye was more than offset by lower volume in a number of markets, mainly driven by Bangladesh, the U.S. and Poland and market exits (including Mali).
Revenue from combustibles declined 3.5% to £9,515 million. Our performance was negatively impacted by a translational foreign exchange headwind, with revenue up 0.8% at constant rates as continued robust price/mix of 9.6% was partly offset by the lower volume (down 8.8%).
Excluding the impact of translational foreign exchange:
- In the U.S., revenue increased 3.8%, as price/mix (+11.4%) more than offset a 7.6% reduction in volume. While this was marginally lower than the industry volume decline of 8.3%, our volume was negatively impacted in 2024 by the phasing of wholesaler inventory. Our volume share was up 10 bps and value share was up 20 bps following the actions taken in 2024 to improve performance;
- In AME, higher revenue (up 2.8%) was largely driven by higher volume and pricing in both Brazil and Türkiye. These factors combined with robust pricing in Romania and Poland to more than offset a reduction in revenue in Canada; and
- In APMEA, revenue declined 7.9% due to fiscal and regulatory headwinds in Australia and Bangladesh, which more than offset higher revenue in the remainder of the region, notably in Pakistan, Nigeria and Indonesia.
*Volume and value share are based upon the Top cigarette markets which are defined as the Top cigarette markets by industry revenue, being the U.S., Japan, Brazil, Germany, Pakistan, Mexico and Romania, accounting for c.60% of total industry cigarettes revenue in 2024.
Traditional Oral
Group volume declined 10.4% to 2.8 billion stick equivalents. Total revenue was £542 million, down 2.4% but flat at constant rates.
In the U.S., which accounts for 96% of the Group's revenue from the category, revenue declined 0.4% at constant rates, as price/mix (+9.1%) was more than offset by lower volume (down 9.5%) due to the continued cross-category use of Modern Oral.
Value share in Traditional Oral decreased 40 bps, with volume share down 20 bps.
Beyond Nicotine
Btomorrow Ventures has completed 29 investments since its launch in 2020 and continues to invest in innovative, consumer-led brands, new science and technologies.
The Group has continued its exploration in the Wellbeing and Stimulation category with Ryde: functional shots now selling in the U.S. on Amazon and in Texas retailers in addition to Australia and Canada.
Other Financial Information
Cash flow
We continue to make good progress on de-leveraging our balance sheet and we expect to be within our narrowed leverage target range of 2.0-2.5x adjusted net debt/adjusted EBITDA (as adjusted for Canada) by the end of 2026, driven by continued strong cash generation.
Cash flow is typically weighted to the second half of the year. We are on track to meet or exceed our operating cash conversion guidance of 90%.
We continue to expect the Group to generate c.£50 billion of free cash flow before dividends between 2024 and 2030 (inclusive). To date we have generated £9.1 billion.
Our active capital allocation framework considers the continued investment in our transformation, the macro-environment, and potential future litigation and regulatory outcomes.
We understand the importance of cash returns to shareholders, and remain committed to our progressive dividend based upon 65% of long-term sustainable earnings.
Subsequent to recognising the dilutive effect of share issuances under the Company's Employee Share Option Scheme, which reduced BAT's shareholding from 25.45% (31 December 2024) to 25.43%, in May 2025, we monetised a further portion of our ITC stake (further lowering our holding from 25.43% to 22.93% at 30 June 2025), realising £1.1 billion and enabling an increase in our sustainable share buy-back for 2025 from £0.9 billion to £1.1 billion.
|
For six months to 30 June |
|||
|
2025 |
2024 |
Change |
|
|
£m |
£m |
% |
|
|
Net cash generated from operating activities |
2,309 |
3,165 |
-27.0% |
|
Operating cash flow conversion |
75% |
78% |
|
|
Free cash flow - before payment of dividends |
1,234 |
2,129 |
-42.1% |
|
Free cash flow - after payment of dividends |
(1,375) |
(476) |
189% |
|
As at 30 June |
|||
|
2025 |
2024 |
Change |
|
|
£m |
£m |
% |
|
|
Borrowings (including lease liabilities) |
35,208 |
40,158 |
-12.3% |
|
Adjusted net debt |
29,749 |
32,973 |
-9.8% |
In the Group's cash flow statement, prepared in accordance with IFRS and presented on page 22, net cash generated from operating activities declined by 27.0% to £2,309 million. This was largely due to the previously announced:
- deferral of £700 million (US$895 million) of tax payments in the U.S. from 2024 to 2025, partly offset by a deferral in 2025 from the first half of the year to the second half (£209 million / US$271 million); and
- payment related to the Franked Investment Income Group Litigation Order (FII GLO) of £368 million. The Group will make a further payment in H2 2025 of £111 million, followed by payments of £222 million in 2026 and £43 million in 2027 (see page 36).
These were partly offset by payments in the first half of 2024 in respect of the DOJ and OFAC (£267 million) that did not repeat.
Operating cash conversion and free cash flow (before and after dividends paid to shareholders)
The Group's operating cash conversion rate (based upon adjusted profit from operations and defined on page 58) was largely in line with the prior period, at 75% (30 June 2024: 78%).
We expect our operating cash conversion in 2025 to meet or exceed our target of at least 90%, demonstrating the ongoing strength of the Group in turning operating performance into cash.
Free cash flow (before the payment of dividends), as defined on page 58, was £1,234 million for the six months ended 30 June 2025 (30 June 2024: £2,129 million), a decrease of 42.1%. This was driven by the decline in net cash generated from operations discussed above, an increase in net capital expenditure (30 June 2025: £119 million; 30 June 2024: £96 million) and higher net interest paid (30 June 2025: £889 million; 30 June 2024: £877 million).
The Group expects its gross capital expenditure in 2025 to be approximately £650 million mainly related to the ongoing investment in the Group's operational infrastructure, including the expansion of our New Categories portfolio and enhancements to our Modern Oral capacity.
After paying dividends of £2,609 million (30 June 2024: £2,605 million), free cash flow (after dividends paid to shareholders), as defined on page 58, was an outflow of £1,375 million for the six months ended 30 June 2025 (30 June 2024: £476 million outflow).
For a full reconciliation of net cash generated from operating activities to free cash flow before and after dividends, see page 58.
Other Financial Information
Continued
Borrowings and net debt
Borrowings (which includes lease liabilities) were £35,208 million at 30 June 2025, a decrease of 12.3% compared to £40,158 million at 30 June 2024 (31 December 2024 : £36,950 million).
The Group remains confident of its ability to access the debt capital markets successfully and reviews its options on a continuing basis.
The Group's average centrally managed debt maturity was 10.0 years at 30 June 2025 (30 June 2024: 9.2 years; 31 December 2024: 9.5 years), and the highest proportion of centrally managed debt maturing in a single rolling 12-month period was 15.3% (30 June 2024: 15.6%; 31 December 2024: 14.8%).
The Group defines net debt as borrowings (including related derivatives and lease liabilities), less cash and cash equivalents (including restricted cash) and current investments held at fair value. Closing net debt was £30,342 million at 30 June 2025 (30 June 2024: £33,658 million; 31 December 2024: £31,253 million).
A reconciliation of borrowings to net debt is provided below.
|
As at 30 June |
As at 31 December |
||||
|
2025 |
2024 |
Change |
2024 |
||
|
£m |
£m |
% |
£m |
||
|
Borrowings (including lease liabilities) |
(35,208) |
(40,158) |
-12.3% |
(36,950) |
|
|
Derivatives in respect of net debt |
(27) |
(130) |
-79.2% |
(113) |
|
|
Cash and cash equivalents |
4,404 |
5,934 |
-25.8% |
5,297 |
|
|
Current investments held at fair value |
489 |
696 |
-29.7% |
513 |
|
|
Net debt |
(30,342) |
(33,658) |
-9.9% |
(31,253) |
|
|
Maturity profile of net debt: |
|||||
|
Net debt due within one year |
1,573 |
(686) |
n/m |
1,545 |
|
|
Net debt due beyond one year |
(31,915) |
(32,972) |
-3.2% |
(32,798) |
|
|
Net debt |
(30,342) |
(33,658) |
-9.9% |
(31,253) |
|
n/m not meaningful
The movement in net debt includes the free cash outflow, after payment of dividends to shareholders, of £1,375 million (30 June 2024: £476 million outflow), as described on page 59. Also impacting the carrying value of net debt are:
- Cash payments related to share schemes and investing activities of £47 million (30 June 2024: £103 million);
- £1,052 million (30 June 2024: £1,577 million) net proceeds from the partial monetisation of our investment in ITC;
- The purchase of £450 million (30 June 2024: £366 million) of own shares under the Group's 2025 share buy-back programme;
- Other non-cash movements of £120 million (30 June 2024: £619 million) with the prior year impacted by the repurchase of series of bonds in May 2024 as part of the Group's debt liability management exercise; and
- Foreign exchange impacts related to the revaluation of foreign currency denominated net debt balances being a net tailwind of £1,611 million (30 June 2024: £269 million headwind).
Investments held at fair value through profit and loss above include restricted amounts of £427 million (31 December 2024: £437 million) due to investments held by subsidiaries in CCAA protection, as well as £17 million (31 December 2024: £60 million) subject to potential exchange control restrictions.
Cash and cash equivalents include restricted amounts of £2,047 million (31 December 2024: £2,072 million) due to subsidiaries in CCAA protection, as well as £255 million (31 December 2024: £339 million) principally due to exchange control restrictions.
Adjusted net debt
The Group also adjusts net debt for items held-for-sale and for the purchase price allocation adjustment to the debt, included within borrowings, acquired as part of the acquisition of Reynolds American Inc. This is an accounting adjustment and does not reflect the enduring repayment of the instrument. The Group Management Board believes that this additional measure, which is used internally to assess the Group's financial capacity, is useful to the users of the financial statements in helping them to see how the Group's financial capacity has changed over the year. The adjusted net debt position is provided below:
|
As at 30 June |
As at 31 December |
||||
|
2025 |
2024 |
Change |
2024 |
||
|
£m |
£m |
% |
£m |
||
|
Net debt |
(30,342) |
(33,658) |
-9.9% |
(31,253) |
|
|
Purchase price allocation (PPA) adjustment to acquired debt |
593 |
685 |
-13.5% |
670 |
|
|
Adjusted net debt |
(29,749) |
(32,973) |
-9.8% |
(30,583) |
|
|
Exchange |
(1,535) |
||||
|
Adjusted net debt translated at 2024 exchange rates |
(31,284) |
(32,973) |
-5.1% |
(30,583) |
|
Other Financial Information
Continued
Foreign currencies
The principal exchange rates used to convert the results of the Group's foreign operations to pounds sterling for the purposes of inclusion and consolidation within the Group's financial statements are indicated in the table below. Where the Group has provided results "at constant rates of exchange" this refers to the translation of the results from the foreign operations at rates of exchange prevailing in the prior period - thereby eliminating the potentially distorting impact of the movement in foreign exchange on the reported results.
The principal exchange rates used were as follows:
|
Average for the period ended |
As at |
||||||||
|
30 June |
31 December |
30 June |
31 December |
||||||
|
2025 |
2024 |
2024 |
2025 |
2024 |
2024 |
||||
|
Australian dollar |
2.045 |
1.922 |
1.937 |
2.091 |
1.893 |
2.023 |
|||
|
Bangladeshi taka |
158.273 |
141.684 |
147.803 |
168.176 |
149.132 |
149.662 |
|||
|
Brazilian real |
7.468 |
6.431 |
6.893 |
7.479 |
7.021 |
7.737 |
|||
|
Canadian dollar |
1.828 |
1.718 |
1.751 |
1.870 |
1.730 |
1.801 |
|||
|
Chilean peso |
1,238.902 |
1,190.267 |
1,206.394 |
1,279.119 |
1,193.216 |
1,245.543 |
|||
|
Euro |
1.187 |
1.170 |
1.181 |
1.167 |
1.179 |
1.209 |
|||
|
Indian rupee |
111.763 |
105.275 |
106.952 |
117.521 |
105.410 |
107.223 |
|||
|
Japanese yen |
192.489 |
192.515 |
193.583 |
197.940 |
203.343 |
196.827 |
|||
|
Romanian leu |
5.939 |
5.821 |
5.877 |
5.929 |
5.870 |
6.018 |
|||
|
South African rand |
23.859 |
23.692 |
23.423 |
24.353 |
23.082 |
23.633 |
|||
|
Swiss franc |
1.118 |
1.125 |
1.125 |
1.091 |
1.136 |
1.135 |
|||
|
US dollar |
1.298 |
1.265 |
1.278 |
1.370 |
1.264 |
1.252 |
|||
Other Information
Risks and uncertainties
The Board carried out a robust assessment of the Principal Risks and uncertainties facing the Group for the period, including those that would threaten its business model, future performance, solvency, liquidity and viability. The Board also maintained close oversight of the Group's response to critical external uncertainties, recognising current macro-economic and geopolitical challenges.
All Group risks are reviewed biannually by the Audit Committee and annually by the Board. During the period, the risk related to "Litigation" was renamed "Litigation and external investigations" and the risk related to "Circular economy" was renamed "Circularity", reflecting the nature of the risk. There were no changes to the underlying risks.
Sustainability is core to the Group's long-term business strategy and sustainability risk factors are embedded across the Group's risks in accordance with the Group's Risk Management Framework.
The Principal Risks facing the Group are summarised under the headings of:
- Competition from illicit trade;
- Geopolitical tensions;
- Tobacco, New Categories and other regulation interrupts the growth strategy;
- Supply chain disruption;
- Litigation and external investigations;
- Significant increases or structural changes in tobacco, nicotine and New Categories related taxes;
- Inability to develop, commercialise and deliver the New Categories strategy;
- Disputed taxes, interest and penalties;
- Injury, illness or death in the workplace;
- Solvency and liquidity;
- Foreign exchange rate exposures;
- Climate change;
- Circularity; and
- Cyber security.
A summary of all the risk factors (including the Principal Risks) which are monitored by the Board through the Group's risk register are set out on pages 414 to 435 of the Group's Annual Report and Accounts and Form 20-F for the year ended 31 December 2024. All the Group's risks should be read in the context of the forward-looking statements on page 44 of this Half-Year Report.
Other Information
Continued
Update on Quebec class action, CCAA and the Proposed Plans in Canada
As previously announced, on 17 October 2024, the court-appointed Mediator's and Monitor's plan of compromise and arrangement was filed in the Ontario Superior Court of Justice. Substantially similar proposed plans were also filed for Rothmans, Benson & Hedges Inc. (RBH, a subsidiary of Philip Morris International Inc.) and JTI-Macdonald Corp. (JTIM, a subsidiary of Japan Tobacco International) (collectively, the Proposed Plans).
Under the Proposed Plans, ITCAN, RBH and JTIM (the Companies) would pay an aggregate settlement amount of CAD$32.5 billion (approximately £17.4 billion). This amount would be funded by:
- an upfront payment equal to all the Companies' cash and cash equivalents on hand (including investments held at fair value) plus certain court deposits (subject to an aggregate industry withholding of CAD$750 million (approximately £401 million)) plus 85% of any cash tax refunds that may be received by the Companies on account of the upfront payments; and
- annual payments based on a percentage (initially 85%, reducing over time) of each of the Companies' net income after taxes, based on amounts generated from all sources, excluding New Categories, until the aggregate settlement amount is paid.
On 31 October 2024, the court granted certain orders pursuant to which the Proposed Plans were accepted for filing. On 12 December 2024, the Proposed Plans were approved by the requisite majorities of the creditors. On 6 March 2025, the Court sanctioned an amended version of the Proposed Plans (hereinafter referred to as the Approved Plans), wherein the aggregate industry withholding of CAD$750 million was allocated to RBH. In this sanction order, the Court has also extended the stays of litigation up to the implementation date of the Approved Plans.
The Approved Plans resolve all Canadian tobacco litigation and provide a full and comprehensive release to ITCAN, BAT p.l.c. and all related companies for all past, present and future tobacco claims in Canada.
In line with IFRS 10 Consolidated Financial Statements, ITCAN is consolidated in the Group's results.
Under IAS 37 Provisions, Contingent Liabilities and Contingent Assets, when there is an expected future economic outflow, arising from a past event, the value of which can be reasonably estimated, a provision should be recognised. A provision of £6.2 billion was recognised in 2024.
It is expected that approximately £2.6 billion will be paid in the second half of 2025 in relation to the upfront payment.
In the six months to 30 June 2025, the Group's estimated share of the undiscounted future liability has not materially changed. However, the Group has recognised a net credit of £575 million as the provision recognised in relation to the Canadian litigation settlement was updated in line with the latest forecast of the Canadian combustibles industry performance, impacting the present value of the future liability described on page 26. The update was, in particular, in respect of pricing and volume decline assumptions, The net credit has been treated as an adjusting item.
At 30 June 2025, restricted cash in ITCAN was £2,047 million and restricted investments held at fair value were £427 million, with goodwill recognised on the balance of the Group at £2,148 million.
Please refer to "Contingent Liabilities and Financial Commitments" below (page 34) and the Group's Annual Report and Accounts and Form 20-F for the year ended 31 December 2024 (note 12 Intangible Assets and note 31 Contingent Liabilities and Financial Commitments) for a full discussion of the case and the assessment of goodwill.
There has been no trigger to further reassess goodwill for impairment at 30 June 2025.
Adjusted performance:
As the Chief Operating Decision Maker, the Management Board (from 1 January 2025) assesses the performance of the Group by reviewing adjusted profit from operations as adjusted for Canada using the prior year translational exchange rate (constant rate) to evaluate segment performance and allocate resources to the overall business on a regional basis.
This new measure, being adjusted profit from operations as adjusted for Canada, at constant rates, recognises a charge calculated in line with the Approved Plans - based on a percentage of Imperial Tobacco Canada Limited's and Imperial Tobacco Company Limited's (together ITCAN) adjusted profit from operations from all sources in Canada, excluding New Categories. This charge will continue until the aggregate settlement amount is paid. This is reflected in the adjusted performance of the Group and is referred to as "as adjusted for Canada". This approach presents the economic delivery from the AME region in a manner comparable to that of the other regions in the Group.
Due to the uncertain nature of the timing of the implementation of the settlement on the Group's 2025 results, for the purposes of 2025 versus 2024 this charge is 100% of the adjusted profit from operations from all sources in Canada, excluding New Categories.
From 2026 (assuming the Approved Plans as sanctioned by the Court on 6 March 2025 have been implemented in 2025), this charge will (following the underlying terms of the Approved Plans) be 85% of the adjusted profit from operations earned in Canada from all sources, excluding New Categories, reducing in future periods in line with the Approved Plans.
Also from 1 January 2025, the Group has recognised an adjusting charge in net finance costs in respect of interest earned on the restricted cash held in Canada that will be paid as part of the upfront settlement payment. This is adjusted out from the current year and comparator performance, as the interest income is not representative of the ongoing business.
Update on investigations and other proceedings
The Group investigates, and becomes aware of governmental authorities' investigations into, allegations of misconduct, including alleged breaches of sanctions and allegations of corruption at Group companies. Some of these allegations are currently being investigated. The Group cooperates with the authorities, where appropriate.
In addition, the Group is, and may in the future be, subject to investigations or legal proceedings in relation to, among other things, its marketing, promotion or distribution activities in respect of its products. As such, the Group or Group companies, could be subject to liability and costs associated with any damages, fines, or penalties brought in connection with these allegations.
Other Information
Continued
Operational and process review
To further support our transformation and underpin investment initiatives to drive long-term sustainable profit and cash flow growth, we have started a structured time-bound programme to review processes and ways of working which will generate efficiencies and facilitate faster, more agile and effective decision making.
This programme includes a comprehensive review of our overhead optimisation opportunities, route to market and digitalisation, in order to deliver more effective, data-driven digital ways of working.
It is expected to generate annualised cost efficiencies and cash flow of c.£500 million by the end of 2028 which will be re-invested to support further sustainable growth initiatives. These savings are in addition to the £2 billion of targeted savings between 2026 and 2030 announced at our Capital Markets Day in 2024.
We expect associated one-off costs of £500 million, which as a one-off time bound programme and, to aid comparison of performance, c.£350 million will be treated as adjusting items having commenced in H1 2025 and which are expected to complete in 2027.
Changes to the Main Board and Management Board
As previously disclosed, the following Board changes have taken place:
- Karen Guerra joined the Remuneration Committee and stepped down from the Audit Committee with effect from 10 February 2025;
- Uta Kemmerich-Keil joined the Board as an independent Non-Executive Director and member of the Audit and Nominations Committees with effect from 17 February 2025; and
- Murray S. Kessler stepped down from the Board with effect from 17 February 2025 and did not stand for re-election at the Annual General Meeting in April 2025.
As announced on 14 July 2025, the following Management Board changes will take place:
- Michael Dijanosic, Regional Director, Asia Pacific, Middle East and Africa (APMEA) will step down from his role and from the Management Board on 31 December 2025; and
- Pascale Meulemeester will be appointed as Regional Director Designate (APMEA), with effect from 1 September 2025 and then as Regional Director, APMEA, and a member of the Management Board with effect from 1 January 2026.
Going concern
A description of the Group's business activities, its financial position, cash flows, liquidity position, facilities and borrowings position, together with the factors likely to affect its future development, performance and position, as well as risks associated with the business, are set out in the Strategic Report and in the Notes on the Accounts, all of which are included in the Group's Annual Report and Accounts and Form 20-F for the year ended 31 December 2024, and available on the Group's website, www.bat.com.
This Half-Year Report provides updated information regarding the business activities, including cash flow, for the six months to 30 June 2025 and of the financial position and liquidity position at 30 June 2025.
The Group has, at the date of this announcement, sufficient existing financing available for its estimated requirements for at least 12 months from the date of approval of this condensed consolidated financial information. This, together with the ability to generate cash from trading activities, the performance of the Group's Strategic Portfolio, its leading market positions in a number of countries and its broad geographical spread, as well as numerous contracts with established customers and suppliers across different geographical areas and industries, provides the Directors with the confidence that the Group is well placed to manage its business risks successfully through the ongoing uncertainty, the current macro-economic financial conditions and the general outlook in the global economy.
After reviewing the Group's forecast financial performance and financing arrangements, the Directors consider that the Group has adequate resources to continue operating for at least 12 months from the date of approval of this condensed consolidated financial information and that it is therefore appropriate to continue to adopt the going concern basis in preparing this Half-Year Report.
Directors' Responsibility Statement
The Directors confirm that, to the best of their knowledge, this condensed consolidated financial information has been prepared in accordance with IAS 34 Interim Financial Reporting as adopted for use in the UK and as issued by the International Accounting Standards Board (IASB), and that this Half-Year Report includes a fair review of the information required by both DTR 4.2.7R and DTR 4.2.8R of the Disclosure Guidance and Transparency Rules of the Financial Conduct Authority.
The Directors of British American Tobacco p.l.c. are as listed on pages 166 to 169 in the British American Tobacco Annual Report and Form 20-F for the year ended 31 December 2024, with the exceptions of Murray S. Kessler who stepped down on 17 February 2025 and Uta Kemmerich-Keil who was appointed as a Non-Executive Director with effect from 17 February 2025.
Details of all the current Directors of British American Tobacco p.l.c. are maintained on www.bat.com.
For and on behalf of the Board of Directors:
|
Luc Jobin Chair 30 July 2025 |
Soraya Benchikh Chief Financial Officer 30 July 2025 |
Independent Review Report to British American Tobacco p.l.c.
Conclusion
We have been engaged by British American Tobacco p.l.c. (the "Company") to review the condensed consolidated financial information in the Half-Year Report for the six months ended 30 June 2025 which comprises the Group Income Statement, the Group Statement of Comprehensive Income, the Group Statement of Changes in Equity, the Group Balance Sheet, the Group Cash Flow Statement and the related explanatory notes.
Based on our review, nothing has come to our attention that causes us to believe that the condensed consolidated financial information in the Half-Year Report for the six months ended 30 June 2025 is not prepared, in all material respects, in accordance with IAS 34 Interim Financial Reporting as adopted for use in the UK and the Disclosure Guidance and Transparency Rules (the "DTR") of the UK's Financial Conduct Authority (the "UK FCA").
Basis for conclusion
We conducted our review in accordance with International Standard on Review Engagements (UK) 2410 Review of Interim Financial Information Performed by the Independent Auditor of the Entity ("ISRE (UK) 2410") issued for use in the UK. A review of interim financial information consists of making enquiries, primarily of persons responsible for financial and accounting matters, and applying analytical and other review procedures. We read the other information contained in the Half-Year Report and consider whether it contains any apparent misstatements or material inconsistencies with the information in the condensed consolidated financial information.
A review is substantially less in scope than an audit conducted in accordance with International Standards on Auditing (UK) and consequently does not enable us to obtain assurance that we would become aware of all significant matters that might be identified in an audit. Accordingly, we do not express an audit opinion.
Conclusions relating to going concern
Based on our review procedures, which are less extensive than those performed in an audit as described in the Basis for conclusion section of this report, nothing has come to our attention that causes us to believe that the directors have inappropriately adopted the going concern basis of accounting, or that the directors have identified material uncertainties relating to going concern that have not been appropriately disclosed.
This conclusion is based on the review procedures performed in accordance with ISRE (UK) 2410. However, future events or conditions may cause the Group to cease to continue as a going concern, and the above conclusions are not a guarantee that the Group will continue in operation.
Directors' responsibilities
The Half-Year Report is the responsibility of, and has been approved by, the directors. The directors are responsible for preparing the Half-Year Report in accordance with the DTR of the UK FCA.
As disclosed in the Accounting Policies and Basis of Preparation note, the annual financial statements of the Group are prepared in accordance with International Financial Reporting Standards (IFRS) as issued by the International Accounting Standards Board (IASB), and UK-adopted international accounting standards.
The directors are responsible for preparing the condensed consolidated financial information included in the Half-Year Report in accordance with IAS 34 as adopted for use in the UK and as issued by the IASB.
In preparing the condensed consolidated financial information, the directors are responsible for assessing the Group's ability to continue as a going concern, disclosing, as applicable, matters related to going concern and using the going concern basis of accounting unless the directors either intend to liquidate the Group or to cease operations, or have no realistic alternative but to do so.
Our responsibility
Our responsibility is to express to the Company a conclusion on the condensed consolidated financial information in the Half-Year Report based on our review. Our conclusion, including our conclusions relating to going concern, are based on procedures that are less extensive than audit procedures, as described in the Basis for conclusion section of this report.
The purpose of our review work and to whom we owe our responsibilities
This report is made solely to the Company in accordance with the terms of our engagement to assist the Company in meeting the requirements of the DTR of the UK FCA. Our review has been undertaken so that we might state to the Company those matters we are required to state to it in this report and for no other purpose. To the fullest extent permitted by law, we do not accept or assume responsibility to anyone other than the Company for our review work, for this report, or for the conclusions we have reached.
Philip Smart
for and on behalf of KPMG LLP
Chartered Accountants
15 Canada Square, London E14 5GL
30 July 2025
Contents
|
Page |
|
|
Financial Statements: |
|
|
Group Income Statement |
17 |
|
Group Statement of Comprehensive Income |
18 |
|
Group Statement of Changes in Equity |
19 |
|
Group Balance Sheet |
21 |
|
Group Cash Flow Statement |
22 |
|
Notes to the Unaudited Interim Financial Statements |
23 |
|
Other Information |
40 |
|
Data Lake and Reconciliations |
47 |
Interim Financial Statements (unaudited)
Group Income Statement
|
Six months ended 30 June |
||
|
2025 |
2024 |
|
|
£m |
£m |
|
|
Revenue1 |
12,069 |
12,340 |
|
Raw materials and consumables used |
(2,166) |
(2,304) |
|
Changes in inventories of finished goods and work in progress |
185 |
140 |
|
Employee benefit costs |
(1,463) |
(1,375) |
|
Depreciation, amortisation and impairment costs |
(1,192) |
(1,620) |
|
Other operating income |
54 |
223 |
|
Loss on reclassification from amortised cost to fair value |
(5) |
(4) |
|
Other operating expenses |
(2,413) |
(3,142) |
|
Profit from operations |
5,069 |
4,258 |
|
Net finance costs |
(969) |
(305) |
|
Share of post-tax results of associates and joint ventures |
1,474 |
1,647 |
|
Profit before taxation |
5,574 |
5,600 |
|
Taxation on ordinary activities |
(1,009) |
(1,041) |
|
Profit for the period |
4,565 |
4,559 |
|
Attributable to: |
||
|
Owners of the parent |
4,512 |
4,492 |
|
Non-controlling interests |
53 |
67 |
|
4,565 |
4,559 |
|
|
Earnings per share |
||
|
Basic |
204.6p |
201.1p |
|
Diluted |
203.6p |
200.3p |
All of the activities during both years are in respect of continuing operations.
The accompanying notes on pages 23 to 39 form an integral part of this condensed consolidated financial information.
1. Revenue is net of duty, excise and other taxes of £15,515 million and £16,509 million for the six months ended 30 June 2025 and 30 June 2024, respectively.
Interim Financial Statements (unaudited)
Continued
Group Statement of Comprehensive Income
|
Six months ended 30 June |
||
|
2025 |
2024 |
|
|
£m |
£m |
|
|
Profit for the period (page 17) |
4,565 |
4,559 |
|
Other comprehensive income |
||
|
Items that may be reclassified subsequently to profit or loss: |
(4,255) |
(19) |
|
Foreign currency translation and hedges of net investments in foreign operations |
||
|
- differences on exchange from translation of foreign operations |
(4,360) |
(123) |
|
- net investment hedges - net fair value gains/(losses) on derivatives |
221 |
(7) |
|
- net investment hedges - differences on exchange on borrowings |
(13) |
8 |
|
Cash flow hedges |
||
|
- net fair value (losses)/gains |
(45) |
51 |
|
- reclassified and reported in profit for the period |
23 |
17 |
|
- tax on net fair value (losses)/gains in respect of cash flow hedges |
7 |
(23) |
|
Associates |
||
|
- share of OCI, net of tax |
(135) |
15 |
|
- differences on exchange reclassified to profit or loss |
47 |
43 |
|
Items that will not be reclassified subsequently to profit or loss: |
(6) |
50 |
|
Retirement benefit schemes |
||
|
- net actuarial (losses)/gains |
(37) |
21 |
|
- movements in surplus restrictions |
(39) |
(24) |
|
- tax on actuarial (losses)/gains and movements in surplus restrictions |
5 |
1 |
|
Investments held at fair value |
||
|
- net fair value gains |
70 |
- |
|
Associates - share of OCI, net of tax |
(5) |
52 |
|
Total other comprehensive (expense)/income for the period, net of tax |
(4,261) |
31 |
|
Total comprehensive income for the period, net of tax |
304 |
4,590 |
|
Attributable to: |
||
|
Owners of the parent |
279 |
4,526 |
|
Non-controlling interests |
25 |
64 |
|
304 |
4,590 |
|
The accompanying notes on pages 23 to 39 form an integral part of this condensed consolidated financial information.
Interim Financial Statements (unaudited)
Continued
Group Statement of Changes in Equity
|
At 30 June 2025 |
Attributable to owners of the parent |
|||||||
|
Share capital |
Share premium, capital redemption and merger reserves |
Other reserves |
Retained earnings |
Total attributable to owners of parent |
Perpetual hybrid bonds |
Non-controlling interests |
Total equity |
|
|
£m |
£m |
£m |
£m |
£m |
£m |
£m |
£m |
|
|
Balance at 1 January 2025 |
585 |
26,665 |
(902) |
21,610 |
47,958 |
1,685 |
352 |
49,995 |
|
Total comprehensive (expense)/income for the period comprising: (page 18) |
- |
- |
(4,160) |
4,439 |
279 |
- |
25 |
304 |
|
Profit for the period (page 17) |
- |
- |
- |
4,512 |
4,512 |
- |
53 |
4,565 |
|
Other comprehensive expense for the period (page 18) |
- |
- |
(4,160) |
(73) |
(4,233) |
- |
(28) |
(4,261) |
|
Other changes in equity |
||||||||
|
Cash flow hedges reclassified and reported in total assets |
- |
- |
5 |
- |
5 |
- |
- |
5 |
|
Employee share options |
||||||||
|
- value of employee services |
- |
- |
- |
35 |
35 |
- |
- |
35 |
|
- proceeds from new shares issued |
- |
1 |
- |
- |
1 |
- |
- |
1 |
|
- treasury shares used for share option schemes |
- |
1 |
- |
(1) |
- |
- |
- |
- |
|
Dividends and other appropriations |
||||||||
|
- ordinary shares |
- |
- |
- |
(2,609) |
(2,609) |
- |
- |
(2,609) |
|
- to non-controlling interests |
- |
- |
- |
- |
- |
- |
(74) |
(74) |
|
Purchase of own shares |
||||||||
|
- held in employee share ownership trusts |
- |
- |
- |
(61) |
(61) |
- |
- |
(61) |
|
- share buy-back programme and cancelled shares |
(4) |
4 |
- |
(450) |
(450) |
- |
- |
(450) |
|
Other movements |
- |
- |
- |
31 |
31 |
- |
- |
31 |
|
Balance at 30 June 2025 |
581 |
26,671 |
(5,057) |
22,994 |
45,189 |
1,685 |
303 |
47,177 |
|
At 30 June 2024 |
Attributable to owners of the parent |
|||||||
|
Share capital |
Share premium, capital redemption and merger reserves |
Other reserves |
Retained earnings |
Total attributable to owners of parent |
Perpetual hybrid bonds |
Non-controlling interests |
Total equity |
|
|
£m |
£m |
£m |
£m |
£m |
£m |
£m |
£m |
|
|
Balance at 1 January 2024 |
614 |
26,630 |
(894) |
24,531 |
50,881 |
1,685 |
368 |
52,934 |
|
Total comprehensive income for the period comprising: (page 18) |
- |
- |
36 |
4,490 |
4,526 |
- |
64 |
4,590 |
|
Profit for the period (page 17) |
- |
- |
- |
4,492 |
4,492 |
- |
67 |
4,559 |
|
Other comprehensive income/(expense) for the period (page 18) |
- |
- |
36 |
(2) |
34 |
- |
(3) |
31 |
|
Other changes in equity |
||||||||
|
Cash flow hedges reclassified and reported in total assets |
- |
- |
11 |
- |
11 |
- |
- |
11 |
|
Employee share options |
||||||||
|
- value of employee services |
- |
- |
- |
30 |
30 |
- |
- |
30 |
|
- proceeds from new shares issued |
- |
4 |
- |
- |
4 |
- |
- |
4 |
|
Dividends and other appropriations |
||||||||
|
- ordinary shares |
- |
- |
- |
(2,603) |
(2,603) |
- |
- |
(2,603) |
|
- to non-controlling interests |
- |
- |
- |
- |
- |
- |
(74) |
(74) |
|
Purchase of own shares |
||||||||
|
- held in employee share ownership trusts |
- |
- |
- |
(93) |
(93) |
- |
- |
(93) |
|
- share buy-back programme and cancelled shares, including treasury shares |
(25) |
25 |
- |
(366) |
(366) |
- |
- |
(366) |
|
Other movements |
- |
- |
- |
36 |
36 |
- |
- |
36 |
|
Balance at 30 June 2024 |
589 |
26,659 |
(847) |
26,025 |
52,426 |
1,685 |
358 |
54,469 |
The accompanying notes on pages 23 to 39 form an integral part of this condensed consolidated financial information.
Interim Financial Statements (unaudited)
Continued
Group Balance Sheet
|
As at 30 June |
As at 31 December |
|||
|
2025 |
2024 |
2024 |
||
|
£m |
£m |
£m |
||
|
Assets |
||||
|
Intangible assets |
86,223 |
94,700 |
94,276 |
|
|
Property, plant and equipment |
4,159 |
4,427 |
4,379 |
|
|
Investments in associates and joint ventures |
1,533 |
1,937 |
1,902 |
|
|
Retirement benefit assets |
841 |
940 |
937 |
|
|
Deferred tax assets |
2,434 |
953 |
2,573 |
|
|
Trade and other receivables |
283 |
318 |
282 |
|
|
Investments held at fair value |
737 |
122 |
146 |
|
|
Derivative financial instruments |
141 |
100 |
110 |
|
|
Total non-current assets |
96,351 |
103,497 |
104,605 |
|
|
Inventories |
5,088 |
5,334 |
4,616 |
|
|
Income tax receivable |
108 |
100 |
67 |
|
|
Trade and other receivables |
3,475 |
3,637 |
3,604 |
|
|
Investments held at fair value |
489 |
696 |
513 |
|
|
Derivative financial instruments |
302 |
159 |
186 |
|
|
Cash and cash equivalents |
4,404 |
5,934 |
5,297 |
|
|
13,866 |
15,860 |
14,283 |
||
|
Assets classified as held-for-sale |
9 |
12 |
11 |
|
|
Total current assets |
13,875 |
15,872 |
14,294 |
|
|
Total assets |
110,226 |
119,369 |
118,899 |
|
|
Equity - capital and reserves |
||||
|
Share capital |
581 |
589 |
585 |
|
|
Share premium, capital redemption and merger reserves |
26,671 |
26,659 |
26,665 |
|
|
Other reserves |
(5,057) |
(847) |
(902) |
|
|
Retained earnings |
22,994 |
26,025 |
21,610 |
|
|
Owners of the parent |
45,189 |
52,426 |
47,958 |
|
|
Perpetual hybrid bonds |
1,685 |
1,685 |
1,685 |
|
|
Non-controlling interests |
303 |
358 |
352 |
|
|
Total equity |
47,177 |
54,469 |
49,995 |
|
|
Liabilities |
||||
|
Borrowings |
31,904 |
32,852 |
32,638 |
|
|
Retirement benefit liabilities |
769 |
852 |
820 |
|
|
Deferred tax liabilities |
10,432 |
11,878 |
11,679 |
|
|
Other provisions for liabilities |
3,212 |
271 |
4,071 |
|
|
Trade and other payables |
586 |
788 |
685 |
|
|
Derivative financial instruments |
150 |
217 |
268 |
|
|
Total non-current liabilities |
47,053 |
46,858 |
50,161 |
|
|
Borrowings |
3,304 |
7,306 |
4,312 |
|
|
Income tax payable |
1,172 |
1,184 |
1,681 |
|
|
Other provisions for liabilities |
3,089 |
416 |
3,044 |
|
|
Trade and other payables |
8,243 |
9,017 |
9,550 |
|
|
Derivative financial instruments |
188 |
119 |
156 |
|
|
Total current liabilities |
15,996 |
18,042 |
18,743 |
|
|
Total equity and liabilities |
110,226 |
119,369 |
118,899 |
|
The accompanying notes on pages 23 to 39 form an integral part of this condensed consolidated financial information.
Interim Financial Statements (unaudited)
Continued
Group Cash Flow Statement
|
Six months ended 30 June |
||
|
2025 |
2024 |
|
|
£m |
£m |
|
|
Cash flows from operating activities |
||
|
Cash generated from operating activities (page 31) |
3,717 |
4,122 |
|
Dividends received from associates |
168 |
196 |
|
Tax paid |
(1,576) |
(1,153) |
|
Net cash generated from operating activities |
2,309 |
3,165 |
|
Cash flows from investing activities |
||
|
Interest received |
85 |
84 |
|
Purchases of property, plant and equipment |
(103) |
(116) |
|
Proceeds on disposal of property, plant and equipment |
21 |
50 |
|
Purchases of intangibles |
(42) |
(31) |
|
Proceeds on disposal of intangibles |
8 |
- |
|
Purchases of investments |
(59) |
(206) |
|
Proceeds on disposals of investments |
73 |
99 |
|
Investment in associates and acquisitions of other subsidiaries net of cash acquired |
(23) |
(24) |
|
Net proceeds from disposal of shares in associate, net of tax |
1,052 |
1,577 |
|
Net cash generated from investing activities |
1,012 |
1,433 |
|
Cash flows from financing activities |
||
|
Interest paid on borrowings and financing related activities |
(879) |
(889) |
|
Interest element of lease liabilities |
(21) |
(18) |
|
Capital element on lease liabilities |
(95) |
(83) |
|
Proceeds from increases in and new borrowings |
3,552 |
2,370 |
|
Reductions in and repayments of borrowings |
(3,047) |
(1,502) |
|
Outflows relating to derivative financial instruments |
(445) |
(115) |
|
Purchases of own shares - share buy-back programme |
(450) |
(366) |
|
Purchases of own shares held in employee share ownership trusts |
(61) |
(93) |
|
Dividends paid to owners of the parent |
(2,609) |
(2,605) |
|
Dividends paid to non-controlling interests |
(63) |
(62) |
|
Other |
1 |
5 |
|
Net cash used in financing activities |
(4,117) |
(3,358) |
|
Net cash flows (used in)/generated from operating, investing and financing activities |
(796) |
1,240 |
|
Differences on exchange |
(144) |
(63) |
|
(Decrease)/increase in net cash and cash equivalents in the year |
(940) |
1,177 |
|
Net cash and cash equivalents at 1 January |
5,104 |
4,517 |
|
Net cash and cash equivalents at period end |
4,164 |
5,694 |
|
Cash and cash equivalents per balance sheet |
4,404 |
5,934 |
|
Overdrafts and accrued interest |
(240) |
(240) |
|
Net cash and cash equivalents at period end |
4,164 |
5,694 |
The accompanying notes on pages 23 to 39 form an integral part of this condensed consolidated financial information.
The net cash flows relating to the adjusting items within profit from operations on pages 25 to 26, included in the above, are an outflow of £430 million (30 June 2024: £339 million).
Notes to the Unaudited Interim Financial Statements
1. Accounting policies and basis of preparation
The condensed consolidated financial information comprises the unaudited interim financial information for the six months to 30 June 2025. The condensed consolidated financial information has been prepared in accordance with IAS 34 Interim Financial Reporting as adopted for use in the UK and as issued by the International Accounting Standards Board (IASB), and the Disclosure Guidance and Transparency Rules issued by the Financial Conduct Authority. The interim condensed consolidated financial information is unaudited but has been reviewed by the auditor and its review report is set out on page 15.
This condensed consolidated financial information does not constitute statutory accounts within the meaning of Section 434 of the Companies Act 2006 and should be read in conjunction with the Group's Annual Report and Accounts and Form 20-F for the year ended 31 December 2024, including the audited financial statements for the year ended 31 December 2024, which were prepared in accordance with International Financial Reporting Standards (IFRS) as issued by the International Accounting Standards Board (IASB) and UK-adopted international accounting standards, and in accordance with the provisions of the UK Companies Act 2006. UK-adopted international accounting standards differ in certain respects from IFRS as issued by the IASB. The differences have no impact on the Group's consolidated financial statements for the periods presented.
The Group's Annual Report and Accounts and Form 20-F for the year ended 31 December 2024 represent the statutory accounts for that year and have been filed with the Registrar of Companies. The auditor's report on those statements was unmodified and did not contain an emphasis of matter paragraph and did not contain any statement under Section 498 (2) or (3) of the Companies Act 2006.
These condensed consolidated financial statements have been prepared under the historical cost convention, except in respect of certain financial instruments. They are prepared on a basis consistent with the IFRS accounting policies as set out in the Group's Annual Report and Form 20-F for the year ended 31 December 2024.
The preparation of these condensed consolidated financial statements requires management to make estimates and assumptions that affect the reported amounts of revenues, expenses, assets and liabilities and the disclosure of contingent liabilities at the date of these condensed consolidated financial statements. Such estimates and assumptions are based on historical experience and various other factors that are believed to be reasonable in the circumstances and constitute management's best judgement at the date of the condensed consolidated financial statements. Other than in respect of certain assumptions related to the assessment of the carrying value of goodwill and intangible assets, the key estimates and assumptions were the same as those that applied to the consolidated financial information for the year ended 31 December 2024, apart from updating the assumptions used to determine the carrying value of liabilities for retirement benefit schemes. As described on page 26, the Group has assessed whether there are any impairment triggers related to the carrying value of the significant investments of goodwill and intangibles. Other than as described on page 26 in relation to the Peru cash-generating unit (CGU), no other impairment is required. In the future, actual experience may deviate from these estimates and assumptions, which could affect these condensed consolidated financial statements as the original estimates and assumptions are modified, as appropriate, in the period in which the circumstances change.
As discussed on page 14, after reviewing the Group's forecast financial performance and financing arrangements, the Directors consider that the Group has adequate resources to continue operating for at least 12 months from the date of approval of this condensed consolidated financial information and that it is therefore appropriate to continue to adopt the going concern basis in preparing this Half-Year Report.
2. Segmental analyses
New measure in 2025
As the Chief Operating Decision Maker, the Management Board (from 1 January 2025) assesses the performance of the Group by reviewing adjusted profit from operations as adjusted for Canada using the prior year translational exchange rate (constant rate) to evaluate segment performance and allocate resources to the overall business on a regional basis.
This new measure, being adjusted profit from operations as adjusted for Canada, at constant rates, recognises a charge calculated in line with the Approved Plans - based on a percentage of Imperial Tobacco Canada Limited's and Imperial Tobacco Company Limited's (together ITCAN) adjusted profit from operations from all sources in Canada, excluding New Categories. This charge will continue until the aggregate settlement amount is paid. This is reflected in the adjusted performance of the Group and is referred to as "as adjusted for Canada". This approach presents the economic delivery from the AME region in a manner comparable to that of the other regions in the Group.
Due to the uncertain nature of the timing of the implementation of the settlement on the Group's 2025 results, for the purposes of 2025 versus 2024 this charge is 100% of the adjusted profit from operations from all sources in Canada, excluding New Categories.
From 2026 (assuming the Approved Plans as sanctioned by the Court on 6 March 2025 have been implemented in 2025), this charge will (following the underlying terms of the Approved Plans) be 85% of the adjusted profit from operations earned in Canada from all sources, excluding New Categories, reducing in future periods in line with the Approved Plans.
Please refer to page 35 for a definition of Approved Plans and an update on the Canadian Litigation.
Notes to the Unaudited Interim Financial Statements (continued)
2. Segmental analyses (continued)
Revenue by segment
The following table shows 2025 revenue at 2025 rates of exchange, and 2025 revenue translated using 2024 rates of exchange. The 2024 figures are stated at the 2024 rates of exchange.
|
Six months ended 30 June |
2025 |
2024 |
|||||||
|
Reported |
Exchange |
Reported at CC2 |
Reported |
||||||
|
Revenue1 |
£m |
£m |
£m |
£m |
|||||
|
U.S. |
5,432 |
143 |
5,575 |
5,378 |
|||||
|
AME |
4,281 |
249 |
4,530 |
4,376 |
|||||
|
APMEA |
2,356 |
106 |
2,462 |
2,586 |
|||||
|
Total Region |
12,069 |
498 |
12,567 |
12,340 |
|||||
Notes to the analysis of revenue above:
1. There are no adjusting items within revenue.
2. CC: constant currency - measures are calculated based upon a re-translation, at the prior year's exchange rates, of the current year's results of the Group and, where applicable, its segments.
Profit from operations by segment
The following table shows 2025 profit from operations and adjusted profit from operations at 2025 rates of exchange, and 2025 adjusted profit from operations as adjusted for Canada3 translated using 2024 rates of exchange.
The 2024 figures are stated at the 2024 rates of exchange.
|
Six months ended 30 June |
2025 |
||||||
|
Reported |
Adj Items1 |
Adjusted |
Exchange |
Adjusted at CC2 |
Canada at CC2 |
As adj. for Canada3 at CC2 |
|
|
£m |
£m |
£m |
£m |
£m |
£m |
£m |
|
|
Profit from Operations |
|||||||
|
U.S. |
2,255 |
808 |
3,063 |
87 |
3,150 |
- |
3,150 |
|
AME |
1,969 |
(495) |
1,474 |
76 |
1,550 |
(164) |
1,386 |
|
APMEA |
845 |
12 |
857 |
42 |
899 |
- |
899 |
|
Total Region |
5,069 |
325 |
5,394 |
205 |
5,599 |
(164) |
5,435 |
|
Net finance costs |
(969) |
||||||
|
Associates and joint ventures |
1,474 |
||||||
|
Profit before tax |
5,574 |
||||||
|
Taxation |
(1,009) |
||||||
|
Profit for the period |
4,565 |
||||||
|
Six months ended 30 June |
2024 |
||||||
|
Reported |
Adj Items1 |
Adjusted |
Adj for Canada3 |
As adjusted for Canada3 |
|||
|
£m |
£m |
£m |
£m |
£m |
|||
|
Profit from Operations |
|||||||
|
U.S. |
1,775 |
1,278 |
3,053 |
- |
3,053 |
||
|
AME |
1,473 |
14 |
1,487 |
(232) |
1,255 |
||
|
APMEA |
1,010 |
14 |
1,024 |
- |
1,024 |
||
|
Total Region |
4,258 |
1,306 |
5,564 |
(232) |
5,332 |
||
|
Net finance costs |
(305) |
||||||
|
Associates and joint ventures |
1,647 |
||||||
|
Profit before tax |
5,600 |
||||||
|
Taxation |
(1,041) |
||||||
|
Profit for the period |
4,559 |
||||||
Notes to the analysis of profit from operations above:
1. Adjusting items represent certain items which the Group considers distinctive based upon their size, nature or incidence.
2. CC: constant currency - measures are calculated based upon a re-translation, at the prior year's exchange rates, of the current year's results of the Group and, where applicable, its segments.
3. As adjusted for Canada excludes the performance of the Canadian business (excluding New Categories).
Notes to the Unaudited Interim Financial Statements (continued)
3. Adjusting Items
Adjusting items are significant items of income or expense in profit from operations, net finance costs, taxation and the Group's share of the post-tax results of associates and joint ventures which individually or, if of a similar type, in aggregate, are relevant to an understanding of the Group's underlying financial performance because of their size, nature or incidence. In identifying and quantifying adjusting items, the Group consistently applies a policy that defines criteria that are required to be met for an item to be classified as adjusting. These items are separately disclosed in the segmental analyses or in the notes to the accounts as appropriate.
The Group believes that these items are useful to users of the Group financial statements in helping them to understand the underlying business performance and are used to derive the Group's non-GAAP measures of New Categories revenue, smokeless revenue as a proportion of total revenue, adjusted gross profit, adjusted gross margin, adjusted EBITDA, adjusted profit from operations, adjusted operating margin, New Categories contribution, New Categories contribution margin, adjusted diluted earnings per share, adjusted net finance costs, adjusted taxation, operating cash flow conversion ratio, adjusted cash generated from operations, free cash flow (before dividends paid to shareholders), free cash flow (after dividends paid to shareholders) and adjusted net debt, all of which are before the impact of adjusting items and which are reconciled from revenue, profit from operations, diluted earnings per share, net finance costs and taxation, cash conversion ratio, net cash generated from operating activities and net debt.
In addition, the non-GAAP measures of adjusted gross profit, adjusted gross margin, adjusted profit from operations, adjusted operating margin, New Categories contribution, New Categories contribution margin, adjusted diluted earnings per share, adjusted net finance costs and adjusted taxation are presented with the additional adjustment to reflect the settlement of the Canadian litigation, and are referred to as "as adjusted for Canada" (as discussed above). Such measures are also reconciled from revenue, profit from operations, diluted earnings per share, net finance costs and taxation. Along with operating cash flow conversion ratio, adjusted cash generated from operations, free cash flow (before dividends paid to shareholders) and free cash flow (after dividends paid to shareholders) referred to above these are collectively the Group's principal non-GAAP measures.
Adjusting items included in profit from operations
Adjusting items are significant items in the profit from operations that individually or, if of a similar type, in aggregate, are relevant to an understanding of the Group's underlying financial performance.
In summary, in the six months ended 30 June 2025, the Group incurred £325 million (30 June 2024: £1,306 million) of adjusting items within profit from operations:
|
Six months ended 30 June |
||
|
2025 |
2024 |
|
|
£m |
£m |
|
|
(a) Restructuring and integration costs |
13 |
- |
|
(b) Amortisation and impairment of trademarks and similar intangibles |
804 |
1,295 |
|
(b) Impairment of goodwill |
72 |
- |
|
(c) Romania other taxes |
(22) |
- |
|
(c) Credit in respect of settlement of historical litigation in relation to the Fox River |
- |
(132) |
|
(c) Charges in respect of DOJ and OFAC investigations |
- |
4 |
|
(c) Other adjusting items (including Engle) |
30 |
133 |
|
(d) Changes in provision in relation to Canada Approved Plans |
(575) |
- |
|
Charges in connection with disposal of an associate |
3 |
6 |
|
Total adjusting items included in profit from operations |
325 |
1,306 |
(a) Restructuring and integration costs
To further support our transformation and underpin investment initiatives to drive long-term sustainable profit and cash flow growth, we have started a structured time-bound programme to review processes and ways of working which will generate efficiencies and facilitate faster, more agile and effective decision making.
This programme includes a comprehensive review of our overhead optimisation opportunities, route to market and digitalisation, in order to deliver more effective, data-driven digital ways of working.
We expect associated one-off costs of £500 million, which as a one-off time bound programme and, to aid comparison of performance, c.£350 million will be treated as adjusting items having commenced in H1 2025 and which are expected to complete in 2027.
(b) Amortisation and impairment of trademarks and similar intangibles
(b)(i) Amortisation
Acquisitions in previous years have resulted in the capitalisation of trademarks and similar intangibles including those which are amortised over their expected useful lives, which do not exceed 30 years. The amortisation and impairment charge of £804 million (30 June 2024: £1,295 million) is included in depreciation, amortisation and impairment costs in the income statement.
The reduction in charge in the first six months of 2025, compared to 2024, reflects an impairment charge in respect of Camel Snus (£472 million) that was recognised in the prior period and did not repeat.
Notes to the Unaudited Interim Financial Statements (continued)
3. Adjusting Items (continued)
Adjusting items included in profit from operations (continued)
(b)(ii) Ongoing impairment review of trademarks and similar assets
The Group reviews and monitors the performance of its non-financial assets (including goodwill) in line with the requirements of IAS 36 Impairment of Assets. In preparing the Half-Year Report for the six months ended 30 June 2025, the Group has assessed if any impairment indicators exist requiring a further detailed impairment assessment to be undertaken.
Subsequent to the FDA announcement on 28 April 2022 of a proposed product standard to prohibit menthol as a characterising flavour in cigarettes, the FDA formally submitted the final product standard to the Office of Management and Budget on 18 October 2023 for review. Following delays, in January 2025, the Trump administration formally withdrew the product standard from consideration by the Office of Management and Budget. Management notes that the timetable for any final product standard remains uncertain.
On 21 June 2022, the FDA announced plans to develop a proposed product standard that would establish a maximum nicotine level in cigarettes and certain other combustible tobacco products to reduce addictiveness. On 15 January 2025, in the final days of the outgoing Biden administration, the FDA issued a proposed product standard whereby the agency would limit nicotine levels in cigarettes following a two-year effective date from publication of any final rule. The proposed product standard is currently open to public comment until 15 September 2025.
Management notes that the FDA proposed product standard does not itself constitute a restriction on nicotine levels in cigarettes, and any proposed product standard must still go through the established comprehensive U.S. rule-making process, the timetable and outcome of which remains uncertain. Management also notes that it is not known whether or when this proposed product standard will be finalised, and whether the final product standard will be the same as or similar to the proposed product standard.
No further changes have occurred in the legislative environment, nor in the macro-economic environment, during the six months ended 30 June 2025 that present an indicator of a potential impairment for either Reynolds American goodwill or for the definite- or indefinite-lived brands.
As part of the standard year-end impairment process, a detailed impairment review will be undertaken for all trademarks in line with IAS 36 Impairment of Assets. This will include the entire Reynolds American portfolio to ensure the book values remain supportable.
For the Canadian CGU, no indicators of impairment have been identified as part of the half-year reporting. However, the Group will continue to closely monitor key performance drivers of the business as part of the annual impairment review for the year ending 2025.
(b)(iii) Impairment of goodwill
An impairment trigger was identified in respect of the Peru CGU driven by persistent market deterioration caused by the growth in illicit volume in the combustibles market. Consequently, a full impairment review has been undertaken, where the recoverable amount of the CGU has been determined using the value-in-use basis.
The value-in-use calculation uses cash flows based on detailed financial budgets prepared by Management covering a one-year period extrapolated over a five-year horizon with the terminal value decline rate of 4% and pre-tax discount rate of 16.3%. As a result of market deterioration, goodwill associated with the Peru CGU has been fully impaired by £72 million.
(c) Other
In the six months ended 30 June 2025, the Group incurred a net charge of £8 million (30 June 2024: £5 million) of other adjusting items. These included:
- A credit of £22 million (30 June 2024: £nil million) in respect of the partial release of a provision recognised in December 2024 in relation to an excise assessment of activities undertaken in the Ploiesti factory in Romania; and
- Other costs of £30 million (30 June 2024: £133 million), mainly related to litigation costs including Engle progeny cases.
In the six months ended 30 June 2024, the Group also benefited from a credit of £132 million in respect of the settlement of historical litigation related to the Fox River in the U.S. More information on the historical litigation related to the clean up costs of the Fox River can be found in Note 31 to the 2024 Annual Report and Accounts and Form 20-F.
Also, in 2024, a charge of £4 million was recognised in respect of interest accruing on the settlement due to the DOJ and OFAC regarding investigations into alleged historical breaches of sanctions.
(d) Changes in provision in relation to Canada Approved Plans
A net credit of £575 million was recognised in relation to the Approved Plans in Canada. The Group's estimated share of the undiscounted future liability has not materially changed, however the Group has recognised a credit to the income statement as the provision recognised in respect of the Canadian litigation settlement was updated in line with the latest forecast of the Canadian combustibles industry performance, impacting the present value of the future liability. The update was, in particular, in respect of pricing and volume decline assumptions. Based on our current estimate, it is expected that payments in respect of our estimated share of the future liability will continue for at least 40 years. The pre-tax discount rate increased from 3.27% at 31 December 2024 to 3.62% at 30 June 2025. This credit was partially offset by the change in the industry holdback associated with the upfront payment. At 30 June 2025, net of translational FX movements, unwinding of discount and the above factors, the current provision for the upfront payment is £2,573 million (31 December 2024: £2,456 million) and the non-current provision for the future payments is £2,897 million (31 December 2024: £3,747 million). Refer to note 4 for the unwinding of the discount in the six months to 30 June 2025 and refer to note 14 for further information on the Approved Plans.
Management uses judgement to determine the key assumptions used to calculate the present value of the provision. Changes to key assumptions can significantly impact the amount expected to be paid and the years over which payments are expected to be made. The key assumptions used to calculate the provision are the rate at which volumes will decline and future pricing plans. The impact of reasonably possible changes to these key assumptions are assessed on an individual basis and have therefore been considered in isolation. If the rate at which volumes will decline is lower by 3% (less volume decline than expected) compared to the base assumptions, the provision would increase by £338 million.
Notes to the Unaudited Interim Financial Statements (continued)
3. Adjusting Items (continued)
(d) Changes in provision in relation to Canada Approved Plans (continued)
The delivery of ITCAN's future pricing plans is subject to competitive actions and the relative pricing position of brands and may therefore vary depending on the competitive market conditions. If ITCAN's pricing delivery is 120% of the base assumptions, the provision would increase by £83 million.
Assuming that there is no change to ITCAN's estimated share of the liability, if the performance of the combustibles industry declines, as has been the case during the first half of 2025, whilst the undiscounted liability does not change, the present value of the provision will decrease as the payment period extends further. A combination of changes in several assumptions, including the future financial performance (excluding New Categories) of ITCAN and each of the other Companies, as defined in note 14, and the performance of the combustibles industry as a whole, may materially impact the provision.
4. Net finance costs
Net finance costs were a charge of £969 million, compared to a charge of £305 million in the same period in 2024.
2025 was impacted by a translational foreign exchange tailwind due to the relative movement of sterling of 1.7%.
The performance in 2025 included a charge of £59 million related to the discounting of the provision associated with the Approved Plans in Canada and £10 million interest on unaffected claims settled post sanctioning of the Approved Plans, treated as adjusting items.
2024 included a net credit of £590 million that did not repeat, related to a previously disclosed capped cash debt tender offer under which the Group repurchased bonds prior to their maturity in a principal amount of £1.8 billion, completed in May 2024 and, including other costs of £3 million, treated as an adjusting item.
The first six months of 2025 included a fair value loss of £4 million (30 June 2024: £23 million) on embedded derivatives related to associates, a charge of £3 million (30 June 2024: £15 million) in relation to a tax case in Brazil and interest charges of £3 million (30 June 2024: £5 million) in respect of a tax provision in the Netherlands. These are treated as adjusting items.
The Group's performance was also impacted by finance costs related to the Franked Investment Income Group Litigation Order (FII GLO) of £19 million (30 June 2024: £31 million).
On an adjusted, constant currency basis, net finance costs were £885 million, an increase of 7.8% (30 June 2024: £821 million). This was driven by:
- Transactional foreign exchange losses arising from revaluation of locally held cash balances and dividend receivables, as well as fair value movements in respect of derivatives and investments;
- Partially offset by higher interest expense. The Group's average cost of debt has increased to 5.1% (compared to 4.9% at 30 June 2024; excluding adjusting items, being a £28 million fair value loss on debt-related derivatives, the average cost of debt was 5.3% in 2024); and
- Higher interest income, driven by higher local deposits and higher interest rates in Brazil and Türkiye, partially offset by the impact of reduced interest rates on interest income earned on cash held in Canada.
Also in 2025, in line with IAS 33 Earnings Per Share, £22 million (30 June 2024: £21 million), net of tax, has been recognised as a deduction to EPS related to the perpetual hybrid bonds issued in 2021, as the coupons paid on such instruments are recognised in equity rather than as a charge to the income statement in net finance costs.
For a full reconciliation of net finance costs to adjusted net finance costs at constant rates, see page 54.
All of the adjustments noted above have been included in the adjusted earnings per share calculation on page 30.
5. Taxation
The tax rate in the income statement was a charge of 18.1% for the six months to 30 June 2025 (30 June 2024: 18.6%). The Group's tax rate is affected by the impact of the adjusting items referred to on pages 25 to 28 and by the inclusion of the share of associates and joint ventures post-tax profit in the Group's pre-tax results.
Adjusting items in the six months ended 30 June 2025 included £66 million (30 June 2024: £36 million) mainly reflecting the revaluation of deferred tax liabilities arising on trademarks recognised in the Reynolds American acquisition in 2017 due to changes in applicable U.S. state tax rates and apportionment factors.
The adjusting tax item also includes £29 million (30 June 2024: £151 million) in respect of the taxation on other adjusting items, which are described on pages 25 to 28.
Refer to page 36 for the FII GLO update.
As the above items are not reflective of the ongoing business, they have been recognised as adjusting items within taxation. All of the adjustments noted above have been included in the adjusted earnings per share calculation on page 30.
Excluding these, the Group's underlying tax rate for subsidiaries reflected in the adjusted earnings per share on page 30 was 24.4% for the six months to 30 June 2025 (30 June 2024: 24.4%).
A full reconciliation from taxation on ordinary activities to the underlying tax rate is provided on page 56.
The Group has applied the mandatory exemption to recognising and disclosing information about deferred tax assets and liabilities related to Pillar Two income taxes in accordance with IAS 12 Income Taxes.
Notes to the Unaudited Interim Financial Statements (continued)
6. Results of associates and joint ventures
In the six months to 30 June, the Group's share of post-tax results of associates and joint ventures decreased from £1,647 million in 2024 to £1,474 million in 2025.
An adjusting gain of £3 million has been recognised, being a deemed gain as the Group's interest in its associate ITC Ltd (ITC) in India decreased from 25.45% (31 December 2024) to 25.43% as a result of ITC issuing ordinary shares under the company's Employees Share Option Scheme.
Both periods included an adjusting credit in respect of the sale of ordinary shares held in ITC. On 28 May 2025, the Group disposed of 313,000,000 shares resulting in a provisional gain of £904 million in the first six months of 2025. The sale represents 2.5% of ITC's ordinary shares. Following this sale, the Group's shareholding in ITC decreased further from 25.43% to 22.93% at 30 June 2025. As permitted by IAS 28 Investments in associates and joint ventures, results up to 31 March 2025 have been used in applying the equity method.
On 13 March 2024, the Group announced the completion of the disposal of 436,851,457 ordinary shares representing c.3.5% of ITC's total issued ordinary share capital and roughly 12% of BAT's investment, resulting in a gain of £1,361 million.
Additionally, on 1 January 2025, ITC completed the demerger of its hotels business through a scheme of arrangement. Under this scheme, 60% of the equity in the newly incorporated entity, ITC Hotels Limited (ITC Hotels), was directly allocated to ITC's shareholders in proportion to their existing shareholding in ITC as of that date. As a result, the Group now holds a direct stake of 15% in ITC Hotels, presented as a non-current investment on the balance sheet and held at fair value.
As part of the demerger accounting, ITC recognised the excess of the fair value over the carrying value of the hotels business as an adjusting item. The Group's share of this adjusted gain amounted to £333 million (net of tax).
Organigram Holdings Inc (Organigram) acquired Motifs Lab Ltd on 6 December 2024 and the consideration included CAD$40 million of common shares in Organigram which diluted BAT's ownership from 35.09% to 30.6% and resulted in a loss on dilution of £1 million.
On 28 February 2025, BAT made the third tranche investment of CAD$42 million (£23 million) acquiring 5,330,728 preferred shares and 7,562,447 common shares in Organigram at a price of CAD$3.22 per share. As a result of this investment, BAT's ownership in Organigram increased to 36.7%.
One of our associates, VST Industries Limited, recognised an adjusting gain in relation to a sale of land and buildings. The Group's share of this gain is £3 million.
Excluding these adjusting items and the impact of translational foreign exchange, on an adjusted constant currency basis, the Group's share of post-tax results from associates and joint ventures was lower than in the first half of 2024, down 12.7% to £245 million, partly as a result of the reduction in the Group's shareholding in ITC.
The share of post-tax results of associates and joint ventures is after the adjusting items noted above, which are excluded from the calculation of adjusted earnings per share as set out on page 30.
For a full reconciliation of the Group's share of post-tax results of associates and joint ventures to adjusted share of post-tax results of associates and joint ventures, at constant rates of exchange, see page 55.
Notes to the Unaudited Interim Financial Statements (continued)
7. Earnings per share
Basic earnings per share were up 1.7% to 204.6p (30 June 2024: 201.1p) partly driven by higher profit from operations and by:
- A gain of £333 million in respect of the demerger of the hotels division of the Group's Indian associate ITC described on page 28 and offset by:
- A lower provisional gain arising on the partial sale of the Group's investment in ITC in 2025 (£904 million) compared to £1,361 million in 2024 due to a lower number of shares disposed of (2025: 313.0 million shares; 2024: 436.9 million shares) as discussed on page 28; and
- A credit in 2024, that did not repeat in 2025 of £590 million related to the debt liability management exercise (see page 27).
Basic earnings per share were also positively impacted by the reduction in the number of shares due to the cumulative effect of the 2024 and 2025 share buy-back programme, with 14,075,158 ordinary shares repurchased and cancelled in the six months ended 30 June 2025.
Before adjusting items, the impact of translational foreign exchange and including the dilutive effect of employee share schemes, adjusted diluted earnings per share, at constant rates, declined 0.1% to 169.1p (30 June 2024: 169.3p).
For a full reconciliation of diluted earnings per share to adjusted diluted earnings per share at constant rates, see page 56.
Earnings used in the basic, diluted and headline earnings per share calculation represent the profit attributable to the ordinary equity shareholders after deducting amounts representing the coupon on perpetual hybrid bonds on a pro-rata basis regardless of whether or not coupons have been declared and paid in the period. In 2025, this was £22 million (30 June 2024: £21 million), net of tax.
|
Six months ended 30 June |
||
|
2025 |
2024 |
|
|
£m |
£m |
|
|
Earnings attributable to owners of the parent |
4,512 |
4,492 |
|
Coupon on perpetual hybrid bonds |
(29) |
(28) |
|
Tax on coupon on perpetual hybrid bonds |
7 |
7 |
|
Earnings |
4,490 |
4,471 |
Basic earnings per share are based on the profit for the period attributable to ordinary shareholders and the weighted average number of ordinary shares in issue during the period (excluding treasury shares). For the calculation of the diluted earnings per share, the weighted average number of shares reflects the potential dilutive effect of employee share schemes.
Earnings per share calculations are based upon the following :
|
Reported |
Adjusted |
Headline |
|||||||
|
Basic |
Diluted |
Basic |
Diluted |
Basic |
Diluted |
||||
|
Six months to 30 June 2025 |
|||||||||
|
- Earnings |
£m |
4,490 |
4,490 |
3,573 |
3,573 |
3,698 |
3,698 |
||
|
- Shares |
m |
2,194 |
2,205 |
2,194 |
2,205 |
2,194 |
2,205 |
||
|
- Per share |
p |
204.6 |
203.6 |
162.9 |
162.0 |
168.5 |
167.7 |
||
|
Six months to 30 June 2024 |
|||||||||
|
- Earnings |
£m |
4,471 |
4,471 |
3,779 |
3,779 |
3,500 |
3,500 |
||
|
- Shares |
m |
2,223 |
2,232 |
2,223 |
2,232 |
2,223 |
2,232 |
||
|
- Per share |
p |
201.1 |
200.3 |
170.0 |
169.3 |
157.5 |
156.8 |
||
Notes to the Unaudited Interim Financial Statements (continued)
7. Earnings per share (continued)
Adjusted diluted earnings per share are calculated by taking the following adjustments into account (see pages 25 to 28):
Items presented below are net of tax and non-controlling interests, when applicable.
|
Six months ended 30 June |
||
|
2025 |
2024 |
|
|
pence |
pence |
|
|
Diluted earnings per share |
203.6 |
200.3 |
|
Effect of amortisation and impairment of goodwill, trademarks and similar intangibles |
31.4 |
44.5 |
|
Effect of settlement of historical litigation in relation to the Fox River |
- |
(5.0) |
|
Effect of the changes in provision in relation to the Approved Plans in Canada |
(19.1) |
- |
|
Effect of partial disposal of an associate |
0.1 |
0.3 |
|
Effect of Romania other taxes |
(1.0) |
- |
|
Effect of charges in respect of DOJ and OFAC investigations |
- |
0.2 |
|
Effect of restructuring and integration costs |
0.2 |
- |
|
Effect of other adjusting items in operating profit |
1.2 |
4.6 |
|
Effect of adjusting items in net finance costs |
3.4 |
(17.4) |
|
Effect of gains related to the partial divestment of shares held in ITC1 |
(41.0) |
(61.1) |
|
Tax associated with the partial divestment of shares held in ITC and hotels business demerger1 |
1.6 |
1.6 |
|
Effect of associates' adjusting items |
(15.3) |
(0.3) |
|
Effect of adjusting items in respect of deferred taxation |
(2.8) |
(5.9) |
|
Adjusting items in tax |
(0.3) |
7.5 |
|
Adjusted diluted earnings per share |
162.0 |
169.3 |
|
Impact of translational foreign exchange |
7.1 |
- |
|
Adjusted diluted earnings per share translated at 2024 exchange rates |
169.1 |
169.3 |
1. The 2025 values of the gains related to the partial divestment of shares held in ITC and associated tax are provisional.
The presentation of headline earnings per share, as an alternative measure of earnings per share, is mandated under the JSE Listing Requirements. It is calculated in accordance with Circular 1/2023 'Headline Earnings' as issued by the South African Institute of Chartered Accountants.
Diluted headline earnings per share are calculated by taking the following adjustments into account:
|
Six months ended 30 June |
||
|
2025 |
2024 |
|
|
pence |
pence |
|
|
Diluted earnings per share |
203.6 |
200.3 |
|
Effect of impairment of intangibles, property, plant and equipment, associates and held-for-sale assets (net of tax) |
3.0 |
16.8 |
|
Effect of gains on disposal of property, plant and equipment, trademarks, held-for-sale assets, partial/full termination of IFRS 16 leases, and sale and leaseback (net of tax) |
(0.8) |
(1.4) |
|
Issue of shares and change in shareholding of an associate |
(0.1) |
(0.3) |
|
Gain on partial disposal of an associate and associated capital gains tax, including foreign exchange recycled |
(38.0) |
(58.6) |
|
Diluted headline earnings per share |
167.7 |
156.8 |
The following is a reconciliation of earnings to headline earnings, in accordance with the JSE Listing Requirements:
|
Six months ended 30 June |
||
|
2025 |
2024 |
|
|
£m |
£m |
|
|
Earnings |
4,490 |
4,471 |
|
Effect of impairment of intangibles, property, plant and equipment, associates and held-for-sale assets (net of tax) |
68 |
373 |
|
Effect of gains on disposal of property, plant and equipment, trademarks, held-for-sale assets, partial/full termination of IFRS 16 leases, and sale and leaseback (net of tax) |
(17) |
(31) |
|
Issue of shares and change in shareholding of an associate |
(2) |
(6) |
|
Gain on partial disposal of an associate and associated capital gains tax, including foreign exchange recycled |
(841) |
(1,307) |
|
Headline earnings |
3,698 |
3,500 |
Notes to the Unaudited Interim Financial Statements (continued)
8. Cash Flow
Net cash generated from operating activities
Net cash generated from operating activities in the IFRS cash flows on page 22 includes the following items:
|
Six months ended 30 June |
||
|
2025 |
2024 |
|
|
£m |
£m |
|
|
Profit for the period |
4,565 |
4,559 |
|
Taxation on ordinary activities |
1,009 |
1,041 |
|
Share of post-tax results of associates and joint ventures |
(1,474) |
(1,647) |
|
Net finance costs |
969 |
305 |
|
Profit from operations |
5,069 |
4,258 |
|
Adjustments for: |
||
|
- depreciation, amortisation and impairment costs |
1,192 |
1,620 |
|
- increase in inventories |
(696) |
(606) |
|
- increase in trade and other receivables |
(1) |
(268) |
|
- decrease in Master Settlement Agreement payable |
(633) |
(868) |
|
- (decrease)/increase in trade and other payables |
(565) |
321 |
|
- decrease in retirement benefit liabilities |
(27) |
(17) |
|
- decrease in other provisions for liabilities |
(634) |
(302) |
|
- other non-cash items |
12 |
(16) |
|
Cash generated from operating activities |
3,717 |
4,122 |
|
Dividends received from associates |
168 |
196 |
|
Tax paid |
(1,576) |
(1,153) |
|
Net cash generated from operating activities |
2,309 |
3,165 |
Net cash generated from operating activities declined by £856 million. The reduction was due to the payment in 2025 related to FII GLO of £368 million and due to higher taxes paid as a deferral from 2024 in the U.S. was paid in 2025 although this was partly offset by a deferral in 2025 from the first half of the year to the second half (£209 million / US$271 million).
Also included within net cash generated from operating activities were litigation payments of £410 million (30 June 2024: £298 million) which included, in both 2025 and 2024, payments in respect of Engle progeny cases (see page 35 for further details).
Expenditure on research and development was approximately £174 million for the six months to 30 June 2025 (30 June 2024: £168 million) with a focus on products that could potentially reduce the risk associated with smoking conventional cigarettes.
The Group's customer factoring arrangements and supplier financing arrangements were disclosed on pages 311 and 329 to 330, respectively, in the 2024 Annual Report and Accounts and Form 20-F for the year ended 31 December 2024. There have been no material changes in these underlying arrangements.
At 30 June 2025, the total amount factored under customer factoring arrangements were £674 million. In addition, where the Group acts as a collection agent for the banks and other financial institutions, the cash collected that has not yet been remitted amounted to £122 million.
Net cash from investing activities
Net cash from investing activities was an inflow of £1,012 million, a decline of £421 million from the same period last year when it was an inflow of £1,433 million. The decline was:
- largely due to lower net proceeds from the partial monetisation of our investment in ITC (30 June 2025: £1,052 million; 30 June 2024: £1,577 million);
- partly offset by a net inflow of £14 million (compared to a net outflow of £107 million in the six months ended 30 June 2024) from short-term investment products, including treasury bills.
Purchases of property, plant and equipment were largely in line with 2024, at £103 million (30 June 2024: £116 million).
Included within investing activities is gross capital expenditure. This includes the investment in the Group's global operational infrastructure (including, but not limited to, the manufacturing network, trade marketing and IT systems). In 2025, the Group invested £140 million, a decrease of 4.4% on the prior year (30 June 2024: £146 million). The Group expects its gross capital expenditure in 2025 to be approximately £650 million mainly related to the ongoing investment in the Group's operational infrastructure, including the expansion of our New Categories portfolio and enhancements to our Modern Oral capacity.
Net cash used in financing activities
Net cash used in financing activities was an outflow of £4,117 million in 2025 (30 June 2024: £3,358 million outflow). The total outflow includes:
- The payment of the dividend of £2,609 million (30 June 2024: £2,605 million);
- Interest paid in the period of £879 million (30 June 2024: £889 million), as higher interest charges in line with the increase in the Group's average cost of debt were offset by lower net borrowings and foreign exchange tailwinds;
- The lower net inflow from issuance of borrowings in 2025 of £505 million (30 June 2024: £868 million);
- An outflow of £445 million related to derivatives (30 June 2024: outflow of £115 million); and
- An outflow of £450 million (30 June 2024: £366 million) in respect of the share buy-back programme.
Notes to the Unaudited Interim Financial Statements (continued)
9. Supplier Financing Arrangements
The Group has certain supplier financing arrangements or 'reverse factoring' arrangements in place. The principal purpose of these arrangements is to provide the supplier with the option to access liquidity earlier through the sale of its receivables due from the Group to a bank or other financial institution prior to their due date. Management has determined that the Group's payables to these suppliers have neither been extinguished nor have the liabilities been significantly modified by these arrangements. The value of amounts payable, invoice due dates and other terms and conditions applicable, from the Group's perspective, remain unaltered, with only the ultimate payee being changed. Non-cash movements were immaterial. The cash outflows in respect of these arrangements have been recognised within operating cash flows.
|
As at 30 June |
As at 31 December |
||||
|
2025 |
2024 |
2024 |
|||
|
£m |
£m |
£m |
|||
|
Supplier Financing Arrangements |
|||||
|
Total |
Amounts available for financing reported within trade payables |
115 |
180 |
||
|
Amounts accepted by financial institutions for early financing |
100 |
179 |
|||
|
Amounts for which suppliers have received payment |
80 |
157 |
|||
|
Analysed as: |
|||||
|
Leaf payables |
Amounts available for financing reported within trade payables |
- |
90 |
||
|
Amounts accepted by financial institution for early financing |
- |
90 |
|||
|
Amounts for which suppliers have received payment |
- |
84 |
|||
|
Other payables |
Amounts available for financing reported within trade payables |
115 |
90 |
||
|
Amounts accepted by financial institution for early financing |
100 |
89 |
|||
|
Amounts for which suppliers have received payment |
80 |
73 |
|||
There has been no significant change in the supplier due dates that were disclosed in note 25 on page 330 in the Annual Report and Accounts and Form 20-F for the year ended 31 December 2024.
The Group applied transitional relief available under Supplier Finance Arrangements - Amendments to IAS 7 and IFRS 7 and has not provided comparative information (for 30 June 2024) in the first year of adoption.
10. Liquidity
The Treasury function is responsible for raising finance for the Group, managing the Group's cash resources and the financial risks arising from underlying operations. All these activities are carried out under defined policies, procedures and limits, reviewed and approved by the Board, delegating oversight to the Finance Director and Treasury function. The Group has targeted an average centrally managed bond maturity of at least five years with no more than 20% of centrally managed debt maturing in a single rolling 12-month period.
As at 30 June 2025, the average centrally managed debt maturity of bonds was 10 years (30 June 2024: 9.2 years; 31 December 2024: 9.5 years) and the highest proportion of centrally managed debt maturing in a single rolling 12-month period was 15.3% (30 June 2024: 15.6%; 31 December 2024: 14.8%).
The Group continues to maintain investment-grade credit ratings, with ratings from Moody's, S&P and Fitch at Baa1 (stable outlook), BBB+ (stable outlook) and BBB+ (stable outlook), respectively, with a medium-term target of Baa1, BBB+ and BBB+. The strength of the ratings has underpinned debt issuance and the Group is confident of its ability to continue to successfully access the debt capital markets. A credit rating is not a recommendation to buy, sell or hold securities. A credit rating may be subject to withdrawal or revision at any time. Each rating should be evaluated separately of any other rating.
In order to manage its interest rate risk, the Group maintains both floating and fixed rate debt. The Group sets targets (within overall guidelines) for the desired ratio of floating to fixed rate debt on a net basis (at least 50% fixed on a net basis in the short to medium term). At 30 June 2025, the relevant ratio of floating to fixed rate borrowings after the impact of derivatives was 26:74 (30 June 2024: 16:84; 31 December 2024: 22:78). Excluding cash and other liquid assets in Canada, which are subject to certain restrictions under CCAA protection, the ratio of floating to fixed rate borrowings was 20:80 (30 June 2024: 5:95; 31 December 2024: 13:87).
Available facilities
It is Group policy that short-term sources of funds (including drawings under both the US$4 billion U.S. commercial paper programme and £3 billion euro commercial paper programme) are backed by undrawn committed lines of credit and cash. As at 30 June 2025, commercial paper of £700 million was outstanding (30 June 2024: £nil; 31 December 2024: £nil). Cash flows relating to commercial paper issuances with maturity periods of three months or less are presented on a net basis in the Group's cash flow statement.
At 30 June 2025, the Group had access to a £5.2 billion revolving credit facility. This facility was undrawn at 30 June 2025. In March 2025, the Group exercised the second of the one-year extension options on the £2.5 billion 364-day tranche of the revolving credit facility. Additionally, £2.7 billion of the five-year tranche remains available until March 2026 reducing to £2.5 billion thereafter and maturing in March 2027.
During the first six months of 2025, the Group refinanced or extended short-term bilateral facilities totalling £1.35 billion. As at 30 June 2025, £100 million was drawn on a short-term basis with £2.6 billion undrawn and still available under such bilateral facilities. Cash flows relating to bilateral facilities that have maturity periods of three months or less are presented on a net basis in the Group's cash flow statement.
In January 2025, the Group entered into a term loan facility of £460 million (equivalent), which was fully drawn as at 30 June 2025.
Issuance, drawdowns and repayments in the period
- In March 2025, the Group repaid a €650 million bond at maturity and accessed the US dollar market under the SEC Shelf Programme, raising a total of US$2.5 billion across three tranches; and
- In June 2025, the Group repaid two bonds totalling an aggregate amount of US$3.0 billion at maturity.
Notes to the Unaudited Interim Financial Statements (continued)
11. Fair value measurements and valuation processes
The Group held certain financial instruments at fair value at 30 June 2025. The definitions and valuation techniques employed for these as at 30 June 2025 are consistent with those used at 31 December 2024 and disclosed in Note 26 on pages 331 to 335 of the Group's Annual Report and Accounts and Form 20-F for the year ended 31 December 2024:
- Level 1 financial instruments are traded in an active market and fair value is based on quoted prices at the period end.
- Level 2 financial instruments are not traded in an active market, but the fair values are based on quoted market prices, broker/dealer quotations, or alternative pricing sources with reasonable levels of price transparency. The Group's level 2 financial instruments include OTC derivatives.
- The fair values of level 3 financial instruments have been determined using a valuation technique where at least one input (which could have a significant effect on the instrument's valuation) is not based on observable market data. The Group's level 3 financial instruments primarily consist of an equity investment in an unquoted entity, interest free loans and other treasury products which are valued using the discounted cash flows of estimated future cash flows.
The values of assets and liabilities at fair value have changed since 31 December 2024, mainly due to the ITC Hotels demerger from ITC which, as discussed on page 27, resulted in the recognition of a new investment in ITC Hotels. The categorisation of these assets and liabilities in accordance with the disclosure requirements of IFRS 7 Financial Instruments has not materially changed. The values of level 1 assets and level 3 assets are £1,069 million and £157 million, respectively, at 30 June 2025 (30 June 2024: £583 million and £235 million, respectively, and 31 December 2024: £447 million and £212 million, respectively).
Level 2 assets and liabilities are shown below.
|
As at 30 June |
As at 31 December |
|||
|
2025 |
2024 |
2024 |
||
|
£m |
£m |
£m |
||
|
Assets at fair value |
||||
|
Derivatives relating to |
||||
|
- interest rate swaps |
59 |
5 |
11 |
|
|
- cross-currency swaps |
110 |
93 |
100 |
|
|
- forward foreign currency contracts |
274 |
161 |
185 |
|
|
Assets at fair value |
443 |
259 |
296 |
|
|
Liabilities at fair value |
||||
|
Derivatives relating to |
||||
|
- interest rate swaps |
117 |
227 |
270 |
|
|
- cross-currency swaps |
14 |
10 |
16 |
|
|
- forward foreign currency contracts |
207 |
82 |
131 |
|
|
- embedded derivative relating to associates |
- |
17 |
7 |
|
|
Liabilities at fair value |
338 |
336 |
424 |
|
Borrowings are carried at amortised cost. The fair value of borrowings is estimated to be £33,495 million (30 June 2024: £37,031 million; 31 December 2024: £34,596 million). The value of other assets and liabilities held at amortised cost are not materially different from their fair values.
12. Related party disclosures
The Group's related party transactions and relationships for 2024 were disclosed on pages 341 and 342 of the Annual Report and Accounts and Form 20-F for the year ended 31 December 2024.
In the six months ended 30 June 2025, apart from the partial sale of the Group's investment in ITC, the demerger of ITC's hotel business (refer to page 28) and the investment in and collaboration with Organigram, there were no material changes in related parties or related party transactions to be reported.
In the six months ended 30 June 2024, apart from the partial sale of the Group's investment in ITC and the investment in and collaboration with Organigram, there were no material changes in related parties or related party transactions to be reported.
13. Retirement benefit schemes
The Group's subsidiary undertakings operate various funded and unfunded defined benefit schemes, including pension and post-retirement healthcare schemes, and defined contribution schemes in various jurisdictions, with its most significant arrangements being in the U.S., the UK, Canada, Germany, Switzerland and the Netherlands. Together, schemes in these territories account for over 90% of the total underlying obligations of the Group's defined benefit arrangements and over 60% of the current service cost. Benefits provided through defined contribution schemes are charged as an expense as payments fall due. The liabilities arising in respect of defined benefit schemes are determined in accordance with the advice of independent, professionally qualified actuaries, using the projected unit credit method. It is Group policy that all schemes are formally valued at least every three years. The overall net asset for all pension and healthcare schemes in Group subsidiaries amounted to £72 million at 30 June 2025, compared to a net asset of £117 million at 31 December 2024 (30 June 2024: £88 million).
The Group continues to explore opportunities for risk management exercises in relation to retirement benefit arrangements and, in May 2025, de-risked certain liabilities of its arrangements in the Netherlands through a buy-in contract fully funded by the assets of the relevant scheme.
Notes to the Unaudited Interim Financial Statements (continued)
14. Contingent liabilities and financial commitments
The Group has contingent liabilities in respect of litigation, taxes and guarantees in various countries. These are described below, are further described in Note 31 to the 2024 Annual Report and Accounts and Form 20-F and will be included in the 2025 Annual Report and Accounts and Form 20-F. The Group is subject to contingencies pursuant to requirements that it complies with relevant laws, regulations and standards. Failure to comply could result in restrictions in operations, damages, fines, increased tax, increased cost of compliance, interest charges, reputational damage or other sanctions. These matters are inherently difficult to quantify.
In cases where the Group has an obligation as a result of a past event existing at the balance sheet date, it is probable that an outflow of economic resources will be required to settle the obligation and the amount of the obligation can be reliably estimated, a provision will be recognised based on best estimates and management judgement. There are, however, contingent liabilities in respect of litigation, taxes in some countries and guarantees for which no provisions have been made. While the amounts that may be payable or receivable could be material to the results or cash flows of the Group in the period in which they are recognised, the Board does not expect these amounts to have a material effect on the Group's financial condition.
Taxes
The Group has exposures in respect of the payment or recovery of a number of taxes. The Group is and has been subject to a number of tax audits covering, among others, excise tax, value-added taxes, sales taxes, corporate taxes, overseas withholding taxes and payroll taxes. The estimated costs of known tax obligations have been provided in these accounts in accordance with the Group's accounting policies. In some countries, tax law requires that full or part payment of disputed tax assessments be made pending resolution of the dispute. To the extent that such payments exceed the estimated obligation, they would not be recognised as an expense.
There are disputes that are in or may proceed to litigation in a number of countries, including Brazil and the Netherlands. In Brazil, Souza Cruz, the Group's Brazilian subsidiary, successfully filed a bank guarantee in respect of the disputed amount in the 2007-2008 tax case where the Brazilian Federal Tax Authority is seeking to subject the profits of overseas subsidiaries to corporate income tax and social contribution tax.
In June 2025, British-American Tobacco (Romania) Investment S.R.L. received a negative decision in respect of its administrative appeal with the Romanian Tax Authority in respect of the findings of the excise audit and is considering further judicial appeal.
Group litigation
Group companies, as well as other leading cigarette manufacturers, are defendants in a number of product liability cases. In a number of the cases, the amounts of compensatory and punitive damages sought are significant. While it is impossible to be certain of the outcome of any particular case or of the amount of any possible adverse verdict, the Group believes that the defences of the Group's companies to all these various claims are meritorious on both the law and the facts, and a vigorous defence is being made everywhere. If an adverse judgment is entered against any of the Group's companies in any case, avenues of appeal will be pursued as necessary. Such appeals could require the appellants to post appeal bonds or substitute security in amounts that could in some cases equal or exceed the amount of the judgment. At least in the aggregate, and despite the quality of defences available to the Group, it is not impossible that the Group's results of operations or cash flows in a particular period could be materially affected by this and by the final outcome of any particular litigation.
Canada
In Canada, following the implementation of legislation enabling provincial governments to recover healthcare costs directly from tobacco manufacturers, ten actions for recovery of healthcare costs arising from the treatment of smoking and health-related diseases were commenced in ten provinces (the Provincial Actions). Damages sought have not yet been quantified by all ten provinces; however, in respect of five provinces, the damages quantified in each of the provinces range between CAD$10 billion (£5.3 billion) and CAD$118 billion ( £63.1 billion), and the province of Ontario delivered an expert report quantifying its damages in the range of CAD$280 billion ( £149.7 billion) and CAD$630 billion (£336.9 billion) in 2016/2017 dollars. Ontario has amended its Statement of Claim to claim damages of CAD$330 billion ( £176.5 billion). On 31 January 2019, the Province delivered a further expert report claiming an additional CAD$9.4 billion ( £5.0 billion) and CAD$10.9 billion in damages (£5.8 billion) in respect of environmental tobacco smoke.
In addition to the actions commenced by the provincial governments, there are numerous class actions outstanding against Group companies. As set out below, all of these actions are currently subject to stays of proceedings. On 1 March 2019, the Quebec Court of Appeal handed down a judgment in the Quebec class actions. Imperial Tobacco Canada Limited's (ITCAN) share of the judgment is approximately CAD$9.2 billion (£4.9 billion). As a result of this judgment, there were attempts by the Quebec plaintiffs to obtain payment out of the CAD$758 million (£405 million) on deposit with the court. JTI-MacDonald Corp ((JTIM) a subsidiary of Japan Tobacco International (JTI) and a co-defendant in the cases) filed for creditor protection under the Companies' Creditors Arrangement Act (CCAA) on 8 March 2019. A court order to stay all tobacco litigation in Canada against all defendants (including R. J. Reynolds Tobacco Company (RJRT) and its affiliate R.J. Reynolds Tobacco International Inc.) until 4 April 2019 was obtained, and the need for a mediation process to resolve all of the outstanding litigation across the country was recognised.
On 12 March 2019, ITCAN also filed for CCAA protection. In its application, ITCAN asked the Ontario Superior Court to stay all pending or contemplated litigation against ITCAN, certain of its subsidiaries and all other Group companies that were defendants in the Canadian tobacco litigation, including British American Tobacco p.l.c. (BAT plc), British American Tobacco (Investments) Limited, B.A.T. Industries p.l.c. and Carreras Rothmans Limited. On 22 March 2019, Rothmans, Benson & Hedges Inc. ((RBH) a subsidiary of Philip Morris International Inc.) also filed for CCAA protection and obtained a stay of proceedings (together with the other two stays, the Stays).
Notes to the Unaudited Interim Financial Statements (continued)
14. Contingent liabilities and financial commitments (continued)
Canada (continued)
On 17 October 2024, the court-appointed mediator and monitor filed a proposed plan of compromise and arrangement for ITCAN in the Ontario Superior Court of Justice. Substantially similar proposed plans were also filed for RBH and JTIM (collectively, the Proposed Plans).
Under the Proposed Plans, ITCAN, RBH and JTIM (the Companies) would pay an aggregate settlement amount of CAD$32.5 billion (approximately £17.4 billion), which would settle and resolve all claims and litigation relating to tobacco in Canada, including, the Quebec class actions, the Provincial Actions, other outstanding class actions and individual actions, and provide a full release to ITCAN, BAT plc and all related companies for all tobacco claims in Canada.
On 3 March 2025, a motion was made by the Companies' monitors to amend the Proposed Plans to include the agreement between the Companies to allocate all of a CAD$750 million industry holdback from the payment of the upfront cash contributions described below. All of the holdback will be allocated to RBH. The Order amending the Proposed Plans to include this term was issued on 3 March 2025.
On 6 March 2025, following creditor approval of the Proposed Plans on 12 December 2024 and a Sanction Hearing between 29-31 January 2025, the Court issued an order finding each of the Proposed Plans fair, reasonable, and in the public interest, and sanctioned the Proposed Plans (hereinafter referred to as the Approved Plans) as amended on 3 March 2025. The Stays of proceedings have been extended to the date of the Approved Plans' implementation. While the Stays are in place, no steps are to be taken in connection with the Canadian tobacco litigation with respect to any of the defendants. On implementation, ITCAN will be required to pay into the settlement fund cash and cash equivalents on hand (including investments held at fair value) (other than in the case of RBH, the holdback) plus certain court deposits and 85% of any cash tax refunds that it may receive on account of the upfront payment. ITCAN and the other Companies will be required to make annual payments based on a percentage (initially 85%, reducing over time) of net income after tax based on amounts generated from all sources, excluding New Categories, until they settle the liability (CAD$32.5 billion) in full.
The Group has recognised a provision to reflect management's best estimate of ITCAN's total payment obligations under the Approved Plans (see note 3).
U.S. - Engle
As at 30 June 2025, the Group's subsidiaries, RJRT, Lorillard Tobacco Company (Lorillard Tobacco) and Brown & Williamson Holdings, Inc., had collectively been served in 76 pending Engle progeny cases filed on behalf of approximately 96 individual plaintiffs. Many of these are in active discovery or nearing trial. In the first half of 2025, RJRT or Lorillard Tobacco paid judgments in three Engle progeny cases. Those payments totalled approximately US$6.3 million (approximately £4.6 million) in compensatory or punitive damages. Additional costs were paid in respect of attorneys' fees and statutory interest.
In addition, from 1 January 2023 to 30 June 2025, outstanding jury verdicts in favour of the Engle progeny plaintiffs had been entered against RJRT or Lorillard Tobacco for US$32.5 million (approximately £23.7 million) in compensatory damages (as adjusted) and US$25.7 million (approximately £18.8 million) in punitive damages. A majority of these verdicts are in various stages in the appellate process and have been bonded as required by Florida law under the US$200 million (approximately £145.9 million) bond cap passed by the Florida legislature in 2009. Although the Group cannot currently predict when or how much it may be required to bond and pay, the Group's subsidiaries will likely be required to bond and pay additional judgments as the litigation proceeds.
Kalamazoo
Georgia-Pacific, a designated Potentially Responsible Party (PRP) in respect of the Kalamazoo River in Michigan, pursued NCR Corporation in relation to remediation costs caused by PCBs released into that river. On 26 September 2013, the United States District Court, Michigan held that NCR was liable as a PRP on the basis that it had arranged for the disposal of hazardous material for the purposes of the Comprehensive Environmental Response, Compensation and Liability Act (CERCLA).
Following further litigation, on 11 December 2019, NCR announced that it had entered into a Consent Decree with the U.S. Government and the State of Michigan (subsequently approved by the Michigan Court on 2 December 2020), pursuant to which it assumed liability for certain remediation work at the Kalamazoo River. The payments to be made on the face of the Consent Decree in respect of such work total approximately US$245 million (approximately £178.8 million). The Consent Decree also provides for the payment by NCR of an outstanding judgment against it of approximately US$20 million (approximately £14.6 million) to Georgia-Pacific.
The quantum of the clean-up costs for the Kalamazoo River is presently unclear. It seems likely to well exceed the amounts payable on the face of the Consent Decree.
On 10 February 2023, NCR filed a complaint in the United States District Court for the Southern District of New York against Industries, seeking a declaration that Industries must compensate NCR for 60% of costs NCR incurred and incurs relating to the Kalamazoo River site on the asserted basis that the Kalamazoo River constitutes a 'Future Site' for the purposes of a 1998 Settlement Agreement between it, Appvion and Industries. On 23 June 2023, Industries filed its defence and counterclaims in the proceedings. On 2 October 2023, NCR filed a motion for declaratory judgment on its complaint and to strike out Industries' affirmative defences and counterclaims. Industries filed its reply to this motion.
On 14 September 2024, the court issued a judgment in respect of the motion, striking out one of Industries' eight affirmative defences and dismissing three of Industries' five counterclaims. A pre-trial conference occurred on 30 October 2024, following which a case management order was issued and subsequently updated. The parties are scheduled to complete all fact discovery by 15 October 2025.
Notes to the Unaudited Interim Financial Statements (continued)
14. Contingent liabilities and financial commitments (continued)
Investigations
The Group investigates, and becomes aware of governmental authorities' investigations into, allegations of misconduct, including alleged breaches of sanctions and allegations of corruption at Group companies. Some of these allegations are currently being investigated. The Group cooperates with the authorities, where appropriate.
There are instances where the Group investigates or where Group companies are cooperating with relevant national competition authorities in relation to competition law investigations and/or engaged in legal proceedings at the appellate level, including (amongst others) in Belgium and Brazil.
In addition, the Group is, and may in the future be, subject to investigations or legal proceedings in relation to, among other things, its marketing, promotion or distribution activities in respect of its products. This includes, but is not limited to, allegations that such activities, whether undertaken through traditional channels, digital platforms, third parties, or distribution applications, do not comply with applicable laws or regulations. As such, the Group or Group companies, could be subject to liability and costs associated with any damages, fines, or penalties brought in connection with these allegations.
Group litigation summary
Having regard to all these matters, with the exception of Canada, the Group does not consider it appropriate to make any provision or accrual in respect of any pending litigation. The Group does not believe that the ultimate outcome of this litigation will significantly impair the Group's financial condition. If the facts and circumstances change, then there could be a material impact on the financial statements of the Group. In addition, the Group accrues for damages, attorneys' fees and/or statutory interest, including in respect of certain Engle progeny cases, certain U.S. individual smoking and health cases and the DOJ medical reimbursement/corrective statement case.
Full details of the litigation against Group companies and tax disputes as at 30 June 2025 will be included in the Annual Report and Accounts and Form 20-F for the year ended 31 December 2025. Whilst there has been some movement on new and existing cases against Group companies, there have been, except as otherwise stated, no material developments to date in 2025 that would impact the financial position of the Group.
15. Franked investment income litigation order
The Group is the principal test claimant in an action in the United Kingdom against HM Revenue and Customs (HMRC) in the FII GLO. There were 15 corporate groups in the FII GLO as at 30 June 2025. The case concerns the treatment for UK corporate tax purposes of profits earned overseas and distributed to the UK. The Supreme Court heard appeals in two separate trials during 2020. The judgment in the first hearing was handed down in November 2020 and concerned the time limit for bringing claims. The Supreme Court remitted that matter to the High Court to determine whether the claim is within time on the facts. The judgment from the second hearing was handed down in July 2021 and concerned issues relating to the type of claims BAT is entitled to bring. Applying that judgment reduces the value of the FII GLO claim to approximately £0.3 billion, mainly as the result of the application of simple interest and the limitation to claims for advance corporation tax offset against lawful corporation tax charges, which is subject to the determination of the timing issue by the High Court and any subsequent appeal.
The High Court hearing on time limits was heard in late November 2023 with judgment handed down in February 2024. The High Court determined that claims should have been filed within 6 years of June 2000 meaning that BAT's claims are in time. HMRC appealed the judgment, and the appeal was heard in the Court of Appeal in May 2025. There is no confirmed date when the judgement will be handed down. The final resolution of all issues in the litigation is likely to take several more years.
During 2015, HMRC paid to the Group a gross amount of £1.2 billion in two separate payments, less a deduction (withheld by HMRC) of £0.3 billion. The payments made by HMRC have been made without any admission of liability and are subject to refund were HMRC to succeed on appeal. Due to the uncertainty of the amounts and eventual outcome the Group has not recognised any impact in the income statement in the current or prior period in respect of the receipt (being net £0.9 billion) which is held within trade and other payables. Any future recognition as income will be treated as an adjusting item, due to the size of the order, with interest of £19 million for the six months ended 30 June 2025 (30 June 2024: £31 million) accruing on the balance, which was also treated as an adjusting item.
The Group made interim repayments to HMRC of £50 million in 2024, 2023 and 2022 and during 2024, the Group has agreed to repay £0.8 billion to HMRC (being the difference between the amounts received (£0.9 billion net of tax) plus accrued interest and the amount determined in the July 2021 judgment (£0.3 billion)). The repayment schedule is:
- £479 million in 2025 (of which £368 million was paid in the first six months of 2025);
- £222 million in 2026; and
- £43 million in 2027.
Further information on FII GLO is described in Note 10 to the Group's Annual Report and Accounts and Form 20-F for the year ended 31 December 2024, pages 287 and 288.
Notes to the Unaudited Interim Financial Statements (continued)
16. Summarised financial information
The following summarised financial information is required by the rules of the Securities and Exchange Commission and has been prepared in accordance with Section 3-10 of Regulation S-X in respect of the guarantees of:
- US$6.89 billion of outstanding bonds issued by B.A.T Capital Corporation (BATCAP) in connection with the acquisition of Reynolds American, including registered bonds issued in exchange for the initially issued bonds (the 2017 Bonds);
- US$10.12 billion of outstanding bonds issued by BATCAP pursuant to the Shelf Registration Statement on Form F-3 filed on 17 July 2019, and US$8.80 billion of outstanding bonds issued by BATCAP pursuant to the Shelf Registration Statement on Form F-3 filed on 1 July 2022 pursuant to which BATCAP, BATIF or the Company may issue an indefinite amount of debt securities; and
- US$2.50 billion of outstanding bonds issued by BATIF pursuant to the Shelf Registration Statement on Form F-3 filed on 17 July 2019, and US$1.00 billion of outstanding bonds issued by BATIF pursuant to the Shelf Registration Statement on Form F-3 filed on 1 July 2022 pursuant to which BATCAP, BATIF or the Company may issue an indefinite amount of debt securities.
As of 28 July 2020, all relevant Group entities suspended their reporting obligations with respect to the US$4.65 billion (30 June 2024 and 31 December 2024: US$6.68 billion) of RAI unsecured notes and US$22.12 million (30 June 2024 and 31 December 2024: US$22.12 million) of Lorillard unsecured notes. As such, no summarised financial information is provided with respect to these securities.
The SEC Shelf registration was renewed in July 2025 and is valid for three years.
As described below, Reynolds American Inc. (Reynolds American/RAI) is a subsidiary guarantor of all outstanding series of BATCAP and BATIF bonds. Under the terms of the indentures governing such notes, any subsidiary guarantor (including Reynolds American) other than BATCAP or BATIF, as applicable, BATNF and BATHTN (as defined below), will automatically and unconditionally be released from all obligations under its guarantee, and such guarantee shall thereupon terminate and be discharged and of no further force or effect, in the event that (1) its guarantee of all then outstanding notes issued under the Group's EMTN Programme is released or (2) at substantially the same time its guarantee of the debt securities is terminated, such subsidiary guarantor is released from all obligations in respect of indebtedness for borrowed money for which such subsidiary guarantor is an obligor (as a guarantor or borrower). Under the EMTN Programme, Reynolds American's guarantee is released if at any time the aggregate amount of indebtedness for borrowed money, subject to certain exceptions, for which Reynolds American is an obligor, does not exceed 10% of the outstanding long-term debt of BAT as reflected in the balance sheet included in BAT's most recent publicly released interim or annual consolidated financial statements.
Reynolds American's guarantee may be released notwithstanding Reynolds American guaranteeing other indebtedness, provided Reynolds American's guarantee of outstanding notes issued under the EMTN Programme is released. If Reynolds American's guarantee is released, BAT is not required to replace such guarantee, and the debt securities will have the benefit of fewer subsidiary guarantees for the remaining maturity of the debt securities.
Note: The following summarised financial information reports the unconsolidated contribution of each applicable company to the Group's consolidated results and not the separate financial statements for each applicable company as local financial statements are prepared in accordance with local legislative requirements and may differ from the financial information provided below. In particular, in respect of the United States region, all financial statements and financial information provided by or with respect to the U.S. business or RAI (and/or RAI and its subsidiaries (collectively, the Reynolds Group)) are prepared on the basis of U.S. GAAP and constitute the primary financial statements or financial information of the U.S. business or RAI (and/or the Reynolds Group). Solely for the purpose of consolidation within the results of BAT p.l.c. and the BAT Group, this financial information is then converted to IFRS. To the extent any such financial information provided in these financial statements relates to the U.S. business or RAI (and/or the Reynolds Group), it is provided as an explanation of the U.S. business's or RAI's (and/or the Reynolds Group's) primary U.S. GAAP-based financial statements and information.
The subsidiaries disclosed below are wholly-owned and the guarantees provided are full and unconditional, and joint and several:
a. British American Tobacco p.l.c. (as the parent guarantor), referred to as 'BAT p.l.c.' in the financials below;
b. B.A.T Capital Corporation (as an issuer or a subsidiary guarantor, as the case may be), referred to as 'BATCAP' in the financials below;
c. B.A.T. International Finance p.l.c. (as an issuer or a subsidiary guarantor, as the case may be), referred to as 'BATIF' in the financials below;
d. B.A.T. Netherlands Finance B.V. (as a subsidiary guarantor), referred to as 'BATNF' in the financials below;
e. Reynolds American Inc. (as a subsidiary guarantor), referred to as 'RAI' in the financials below; and
f. British American Tobacco Holdings (The Netherlands) B.V. (as a subsidiary guarantor of the 2017 Bonds only), referred to as 'BATHTN' in the financials below.
In accordance with Section 13-01 of Regulation S-X, information in respect of investments in subsidiaries that are not issuers or guarantors has been excluded from non-current assets as shown in the balance sheet table below. The "BATHTN" column in the summarised financial information is only applicable in the context of the 2017 Bonds. British American Tobacco Holdings (The Netherlands) B.V. ('BATHTN') is not an issuer nor a guarantor of any of the other securities referenced in this note. None of the issuers or other guarantors has material balances with or an investment in BATHTN. Investments in subsidiaries represent share capital acquired in relation to or issued by subsidiary undertakings.
In the case of debt securities that may be issued by BAT p.l.c., BATCAP or BATIF under an indenture to be entered into (the "2022 Indenture") and referred to in the registration statement in Form F-3 (Registration No. 333-288488)), one or more of BATCAP, BATIF, BATNF and RAI may guarantee such debt securities to the extent specified in the applicable supplemental indenture to the 2022 Indenture. In addition, BAT p.l.c. will be a parent guarantor in respect of any debt securities issued by BATCAP or BATIF under the 2022 Indenture.
Notes to the Unaudited Interim Financial Statements (continued)
16. Summarised financial information (continued)
|
Six months ended 30 June 2025 |
BAT p.l.c. |
BATCAP |
BATIF |
BATNF |
RAI |
BATHTN |
|
£m |
£m |
£m |
£m |
£m |
£m |
|
|
Income Statement |
||||||
|
Revenue |
- |
- |
- |
- |
- |
- |
|
(Loss)/profit from operations |
(11) |
(1) |
3 |
- |
- |
2 |
|
Dividend income |
- |
- |
1 |
- |
3,441 |
- |
|
Net finance income/(costs) |
249 |
(22) |
128 |
- |
(289) |
(2) |
|
Profit/(loss) before taxation |
238 |
(23) |
132 |
- |
3,152 |
- |
|
Taxation on ordinary activities |
- |
6 |
2 |
- |
67 |
1 |
|
Profit/(loss) for the period |
238 |
(17) |
134 |
- |
3,219 |
1 |
|
Intercompany transactions - Income Statement |
||||||
|
Transactions with non-issuer/non-guarantor subsidiaries (expense)/income |
(12) |
- |
- |
- |
17 |
- |
|
Transactions with non-issuer/non-guarantor subsidiaries net finance income |
170 |
394 |
442 |
- |
11 |
- |
|
Dividend income from non-issuer/non-guarantor subsidiaries |
- |
- |
- |
- |
3,441 |
- |
|
Six months ended 30 June 2024 |
BAT p.l.c. |
BATCAP |
BATIF |
BATNF |
RAI |
BATHTN |
|
£m |
£m |
£m |
£m |
£m |
£m |
|
|
Income Statement |
||||||
|
Revenue |
- |
- |
- |
- |
- |
- |
|
(Loss)/profit from operations |
(10) |
(1) |
(12) |
- |
(1) |
1 |
|
Dividend income |
- |
- |
- |
- |
2,519 |
- |
|
Net finance income/(costs) |
285 |
(19) |
794 |
- |
(233) |
(32) |
|
Profit/(loss) before taxation |
275 |
(20) |
782 |
- |
2,285 |
(31) |
|
Taxation on ordinary activities |
- |
(26) |
(6) |
- |
55 |
(90) |
|
Profit/(loss) for the period |
275 |
(46) |
776 |
- |
2,340 |
(121) |
|
Intercompany transactions - Income Statement |
||||||
|
Transactions with non-issuer/non-guarantor subsidiaries (expense)/income |
(3) |
- |
- |
- |
11 |
- |
|
Transactions with non-issuer/non-guarantor subsidiaries net finance income |
187 |
161 |
739 |
- |
12 |
- |
|
Dividend income from non-issuer/non-guarantor subsidiaries |
- |
- |
- |
- |
2,519 |
- |
Notes to the Unaudited Interim Financial Statements (continued)
16. Summarised financial information (continued)
|
As at 30 June 2025 |
BAT p.l.c. |
BATCAP |
BATIF |
BATNF |
RAI |
BATHTN |
|
£m |
£m |
£m |
£m |
£m |
£m |
|
|
Balance Sheet |
||||||
|
Non-current assets |
1,917 |
19,206 |
2,200 |
1,408 |
252 |
6 |
|
Current assets |
6,926 |
18,602 |
45,669 |
19 |
1,025 |
10 |
|
Non-current liabilities |
1,576 |
18,753 |
10,744 |
1,408 |
8,584 |
1 |
|
Non-current borrowings |
1,571 |
18,646 |
10,536 |
1,408 |
8,540 |
- |
|
Other non-current liabilities |
5 |
107 |
208 |
- |
44 |
1 |
|
Current liabilities |
68 |
19,060 |
33,016 |
18 |
1,377 |
130 |
|
Current borrowings |
33 |
19,033 |
32,533 |
18 |
115 |
3 |
|
Other current liabilities |
35 |
27 |
483 |
- |
1,262 |
127 |
|
Intercompany transactions - Balance Sheet |
||||||
|
Amounts due from non-issuer/non-guarantor subsidiaries |
6,823 |
14,036 |
50,122 |
- |
1,232 |
11 |
|
Amounts due to non-issuer/non-guarantor subsidiaries |
4 |
1,810 |
34,142 |
- |
1 |
2 |
|
Investment in subsidiaries (that are not issuers or guarantors) |
27,234 |
- |
718 |
- |
23,451 |
1,519 |
|
As at 31 December 2024 |
BAT p.l.c. |
BATCAP |
BATIF |
BATNF |
RAI |
BATHTN |
|
£m |
£m |
£m |
£m |
£m |
£m |
|
|
Balance Sheet |
||||||
|
Non-current assets |
1,917 |
18,996 |
2,292 |
1,358 |
292 |
77 |
|
Current assets |
9,736 |
18,504 |
46,197 |
48 |
1,221 |
15 |
|
Non-current liabilities |
1,577 |
18,503 |
11,526 |
1,358 |
7,707 |
20 |
|
Non-current borrowings |
1,571 |
18,257 |
11,227 |
1,358 |
7,657 |
- |
|
Other non-current liabilities |
6 |
246 |
299 |
- |
50 |
20 |
|
Current liabilities |
72 |
19,010 |
32,984 |
47 |
3,257 |
129 |
|
Current borrowings |
37 |
18,967 |
32,708 |
46 |
1,751 |
1 |
|
Other current liabilities |
35 |
43 |
276 |
1 |
1,506 |
128 |
|
Intercompany transactions - Balance Sheet |
||||||
|
Amounts due from non-issuer/non-guarantor subsidiaries |
9,690 |
15,082 |
50,595 |
- |
1,478 |
15 |
|
Amounts due to non-issuer/non-guarantor subsidiaries |
2 |
3,942 |
32,707 |
- |
2 |
1 |
|
Investment in subsidiaries (that are not issuers or guarantors) |
27,234 |
- |
718 |
- |
25,659 |
1,466 |
In 2021, BAT p.l.c. issued two €1 billion of perpetual hybrid bonds which were classified as equity as there is no contractual obligation to either repay the principal or make payments of interest. Further information on perpetual hybrid bonds is described in note 22 of the Group's Annual Report and Accounts and Form 20-F for the year ended 31 December 2024, page 323. BAT p.l.c.'s unconsolidated contribution to the Group's consolidated equity results is shown below:
|
As at 30 June |
As at 31 December |
|||
|
2025 |
2024 |
2024 |
||
|
£m |
£m |
£m |
||
|
Total Equity |
34,433 |
33,665 |
37,238 |
|
|
Share capital |
581 |
589 |
585 |
|
|
Share premium |
123 |
119 |
121 |
|
|
Perpetual hybrid bonds |
1,685 |
1,685 |
1,685 |
|
|
Other Equity |
32,044 |
31,272 |
34,848 |
|
Other Information
Non-financial Key Performance Indicators (KPIs)
Volume
The Group reports volumes as additional information. This is done, where appropriate, with cigarette sticks as the basis, with usage levels applied to other products to calculate the equivalent number of cigarette units. Volume is defined as the number of units sold. Units may vary between categories.
The conversion rates that are applied:
|
Equivalent to one cigarette |
|
|
Factory-made cigarettes (FMC) |
1 stick |
|
Heated sticks |
1 heat stick |
|
Cigars |
1 cigar (regardless of size) |
|
Oral |
|
|
- Pouch |
1 pouch |
|
- Moist Snuff |
2.8 grams |
|
- Dry Snuff |
2.0 grams |
|
- Loose leaf, plug, twist |
7.1 grams |
|
Pipe tobacco |
0.8 grams |
|
Roll-your-own |
0.8 grams |
|
Make-your-own |
|
|
- Expanded tobacco |
0.5 grams |
|
- Optimised tobacco |
0.7 grams |
|
Vapour |
No conversion to a stick equivalent |
Roll-your-own (RYO)
Loose tobacco designed for hand rolling, normally a finer cut with higher moisture, compared to cigarette tobacco.
Make-your-own (MYO)
MYO expanded tobacco; also known as volume tobacco.
Loose cigarette tobacco with enhanced filling properties - to allow higher yields of cigarettes/kg - designed for use with cigarette tubes and filled via a tobacco tubing machine.
MYO non-expanded tobacco; also known as optimised tobacco
Loose cigarette tobacco designed for use with cigarette tubes and filled via a tobacco tubing machine.
Vapour
Vapour is shown in units being pods, bottles and disposable units. There is no conversion to a stick equivalent.
Volume share
Volume share is the estimated number of units bought by adult consumers of a specific brand or combination of brands, as a proportion of the total estimated units bought by adult consumers in the industry, category or other sub-category. Sub-categories include, but are not limited to, HP, Modern Oral, Traditional Oral, Total Oral or Cigarettes. Except when referencing particular markets, volume share is based on our Top markets. Top markets are those markets that management determines are strategic in each category, with reliable share data from third parties. Management notes that the markets that form the definition of Top markets may change between periods as this will reflect the development of the category within markets including their relative revenue sizes. Please refer to page 46 for a list of the Top markets.
Where possible, the Group utilises data provided by third-party organisations, including NielsenIQ, based upon retail audit of sales to adult consumers. In certain markets, where such data is not available, other measures are employed which assess volume share based upon other movements within the supply chain, such as sales to retailers. This may depend on the provision of data by customers including distributors/wholesalers.
Volume share is used by management to assess the relative performance of the Group and its brands against the performance of its competitors in the categories and geographies in which the Group operates. Management notes that this measure is useful to investors to understand the relative performance of the Group and its brands against the performance of its competitors in the categories and geographies in which the Group operates. This measure is also useful to understand the Group's performance when seeking to grow scale within a market or category from which future financial returns can be realised. Volume share provides an indicator of the Group's relative performance in unit terms versus competitors.
Volume share in each period compares the average volume share in the period with the average volume share in the prior year. This is a more robust measure of performance, removing short-term volatility that may arise at a point in time. Due to the timing of available information, volume share for 2025 is year-to-date May 2025 unless otherwise stated.
However, in certain circumstances, related to periods of introduction to a market, in order to illustrate the latest performance, data may be provided as at the end of the period rather than the average in that period. In these instances, the Group states these at a specific date (for instance, May 2025).
Other Information (continued)
Non-financial Key Performance Indicators (KPIs) (continued)
Value share
Value share is the estimated retail value of units bought by adult consumers of a particular brand or combination of brands, as a proportion of the total estimated retail value of units bought by adult consumers in the industry, category or other sub-category in discussion. Except when referencing particular markets, value share is based on our Top markets. Top markets are those markets that management determines are strategic in each category, with reliable share data from third parties. Management notes that the markets that form the definition of Top markets may change between periods as this will reflect the development of the category within markets including their relative revenue sizes.
Where possible, the Group utilises data provided by third-party organisations, including NielsenIQ, based upon retail audit of sales to adult consumers. In certain markets, where such data is not available, other measures are employed which assess value share based upon other movements within the supply chain, such as sales to retailers. This may depend on the provision of data by customers (including distributors and wholesalers).
Value share is used by management to assess the relative performance of the Group and its brands against the performance of its competitors in the categories and geographies in which the Group operates, specifically indicating the Group's ability to realise value relative to the market. The measure is particularly useful when the Group's products and/or the relevant category in the market in which they are sold has developed or achieved scale from which value can be realised. Management notes that this measure is useful to investors to comprehend the relative performance of the Group and its brands against the performance of its competitors in the categories and geographies in which the Group operates, specifically indicating the Group's ability to realise value relative to the market.
Value share in each period compares the average value share in the period with the average value share in the prior year. This is a more robust measure of performance, removing short-term volatility that may arise at a point of time. Due to the timing of available information, value share for 2025 is year-to-date May 2025 unless otherwise stated.
However, in certain circumstances, related to periods of introduction to a market, in order to illustrate the latest performance, data may be provided as at the end of the period rather than the average in that period. In these instances the Group states these at a specific date (for instance, May 2025).
Price/mix
Price/mix is a term used by management and investors to explain the movement in revenue between periods. Revenue is affected by the volume (how many units are sold) and the value (how much is each unit sold for). Price/mix is used to explain the value component of the sales as the Group sells each unit for a value (price) but may also achieve a movement in revenue due to the relative proportions of higher value volume sold compared to lower value volume sold (mix).
This term is used to explain the Group's relative performance between periods only. It is calculated as the difference between the movement in revenue (between periods) and volume (between periods). For instance, in the six months to June 2025 (compared to the same period in the prior year) the increase in combustibles revenue (excluding translational foreign exchange movements) of 0.8%, with a decline in combustibles volume of 8.8%, leads to a price/mix of 9.6%. No assumptions underlie this metric as it utilises the Group's own data.
We also show (see page 3) the impact on revenue from the movement in combustibles volume (being the movement in volume between periods multiplied by the average combustibles revenue per thousand from the prior period) and the impact from the combustibles price/mix effect (see page 3), which is revenue (from combustibles at constant rates) less the volume effect from the movement in combustibles.
Consumers of smokeless products
The number of consumers of smokeless products is defined as the estimated number of Legal Age (minimum 18 years) consumers of the Group's smokeless products - which does not necessarily mean these users are solus consumers of these products. In markets where regular consumer tracking is in place, this estimate is obtained from adult consumer tracking studies conducted by third parties (including Kantar). In markets where regular consumer tracking is not in place, the number of consumers of smokeless products is derived from volume sales of consumables and devices in such markets, using consumption patterns obtained from other similar markets with adult consumer tracking (utilising studies conducted by third parties, including Kantar). The number of consumers is adjusted for those identified (as part of the consumer tracking studies undertaken) as using more than one BAT Brand - referred to as "poly users".
The number of smokeless products consumers is used by management to assess the number of consumers using the Group's New Categories products as the increase in smokeless products is a key pillar of the Group's ESG ambition and is integral to the sustainability of our business.
The Group's management believes that this measure is useful to investors given the Group's ESG ambition and alignment to the sustainability of the business with respect to the smokeless portfolio.
Periodically, in line with standard practice, enhancements to the adult consumer tracking studies may be required to more accurately capture market trends across categories and as markets perform with respect to the development of the categories. In the event of a change being applied, to ensure that the data is comparable between periods, historical data will be back-trended to ensure there is no trend break. There were no amendments or enhancements in the first six months of 2025.
Other Information (continued)
Dividends
On 13 February 2025, the Board declared an interim dividend of 240.24p per ordinary share of 25p, for the year ended 31 December 2024, payable in four equal quarterly instalments of 60.06p per ordinary share in May 2025, August 2025, November 2025 and February 2026. The May 2025 quarterly dividend was paid to shareholders on the UK main register and South Africa branch register on 7 May 2025 and to holders of American Depositary Shares (ADSs) on 12 May 2025. The three remaining quarterly dividends will be paid to shareholders on the applicable record dates set out below.
Under IFRS, the interim dividend is recognised in the period that it is paid. The results for the six months ended 30 June 2025 reflect the fourth quarterly dividend of 58.88p per ordinary share declared on 8 February 2024 and paid in February 2025, and the first quarterly dividend of 60.06p per ordinary share declared on 13 February 2025 and paid in May 2025.
|
Dividends paid |
For the six months to 30 June 2025 |
|
|
Pence per share |
US$ per ADS |
|
|
Quarterly Payment paid February 2025 |
58.88 |
0.7304350 |
|
Quarterly Payment paid May 2025 |
60.06 |
0.8022210 |
|
118.94 |
1.5326560 |
|
Holders of ADSs on the New York Stock (NYSE) and South Africa Branch register
For holders of NYSE-listed ADSs, the record dates and payment dates are set out below. The equivalent quarterly dividends in US dollars are determined by the exchange rate on the applicable payment date. Citibank, N.A. as depositary bank for the BAT American Depositary Receipt Programme charges US$0.01 per ADS each quarterly dividend payment.
In accordance with the JSE Limited (JSE) Listing Requirements, the finalisation information relating to shareholders on the South Africa branch register will be published on the dates below, with South Africa dividends tax information. For South Africa dividends tax purposes, the quarterly dividends are considered 'foreign dividends'. The United Kingdom is identified as the source of income for tax purposes.
Key dividend dates
In accordance with London Stock Exchange (LSE), the NYSE and Strate requirements, the following dates for the quarterly dividends payments apply.
|
Event |
Payment No. 2 |
Payment No. 3 |
Payment No. 4 |
|
Preliminary announcement (includes declaration data required for JSE purposes) |
13 February |
||
|
Publication of finalisation information (JSE) |
17 June |
22 September |
15 December |
|
No removal requests permitted (in either direction) between the UK main register and the South Africa branch register |
17-27 June |
22 September- 3 October |
15-30 December |
|
Last Day to Trade (LDT) cum-dividend (JSE) |
24 June |
30 September |
23 December |
|
Shares commence trading ex-dividend (JSE) |
25 June |
1 October |
24 December |
|
No transfers permitted between the UK main register and the South Africa branch register |
25-27 June |
1-3 October |
24-30 December |
|
No shares may be dematerialised or rematerialised on the South Africa branch register |
25-27 June |
1-3 October |
24-30 December |
|
Shares commence trading ex-dividend (LSE) |
26 June |
2 October |
29 December |
|
Shares commence trading ex-dividend (NYSE) |
27 June |
3 October |
30 December |
|
Record date (JSE, LSE and NYSE) |
27 June |
3 October |
30 December |
|
Last date for receipt of Dividend Reinvestment Plan (DRIP) |
11 July |
17 October |
14 January 2026 |
|
Payment date (LSE and JSE) |
1 August |
7 November |
4 February 2026 |
|
ADS payment date (NYSE) |
6 August |
13 November |
9 February 2026 |
Notes:
1. All dates are 2025, unless otherwise stated.
2. The dates set out above may be subject to any changes to public holidays arising and changes or revisions to the LSE, JSE and NYSE timetables. Any confirmed changes to the dates will be announced.
3. JSE finalisation information published on 17 June 2025 can be found on the BAT website, www.bat.com.
Proposed dates for quarterly dividend payments for the year ending 31 December 2025
|
Event |
Payment No. 1 |
Payment No. 2 |
Payment No. 3 |
Payment No. 4 |
|
Last Day to Trade (LDT) cum-dividend (JSE) |
24 March |
7 July |
29 September |
24 December |
|
Shares commence trading ex-dividend (JSE) |
25 March |
8 July |
30 September |
28 December |
|
Shares commence trading ex-dividend (LSE) |
26 March |
9 July |
1 October |
29 December |
|
Shares commence trading ex-dividend (NYSE) |
27 March |
10 July |
2 October |
30 December |
|
Record date (JSE, LSE and NYSE) |
27 March |
10 July |
2 October |
30 December |
|
Payment date (LSE and JSE) |
7 May |
14 August |
6 November |
4 February 2027 |
|
ADS payment date (NYSE) |
12 May |
19 August |
12 November |
9 February 2027 |
Notes:
1. All dates are 2026, unless otherwise stated.
2. A complete timetable for the quarterly dividend payments for the year ending 31 December 2025 and the declared amount will be included in the Preliminary Results Announcement in February 2026.
3. The dates set out above may be subject to any changes to public holidays arising and changes or revisions to the LSE, JSE and NYSE timetables. Any confirmed changes to the dates will be announced.
Other Information (continued)
Shareholder Information
Financial calendar
|
Event |
|
|
Pre-close Trading Update |
December 2025 |
|
Preliminary Statement 2025 |
12 February 2026 |
Additional information
British American Tobacco is one of the world's leading consumer products businesses, with brands sold across the world. We have strategic combustibles and HP brands - including Dunhill, Kent, Lucky Strike, Pall Mall, Rothmans, glo, Newport (in the U.S.), Camel (in the U.S.) and Natural American Spirit (in the U.S.) - and over 200 brands in our portfolio, including a growing portfolio of reduced-risk products*†. We hold robust market positions in each of our regions and have leadership positions in more than 50 markets.
References in this document to information on websites, including the web address of BAT, have been included as inactive textual references only. These websites and the information contained therein or connected thereto are not intended to be incorporated into or to form part of this report.
*Based on the weight of evidence and assuming a complete switch from cigarette smoking. These products are not risk free and are addictive.
†Our products as sold in the US, including Vuse, Velo, Grizzly, Kodiak, and Camel Snus, are subject to FDA regulation and no reduced-risk claims will be made as to these products without agency clearance.
Publication of Half-Year Report
This Half-Year Report is released or otherwise made available or notified to the London Stock Exchange, the JSE Limited and the New York Stock Exchange and filed in accordance with applicable regulations. It may be viewed and downloaded from our website www.bat.com.
Copies of the announcement may also be obtained by contacting: (1) the Company's registered office; (2) the Company's representative office in South Africa; (3) British American Tobacco Publications; or (4) Citibank Shareholder Services. Contact details are set out on page 45.
Annual Report: Statutory accounts
The information contained within this report for the year ended 31 December 2024 does not constitute statutory accounts as defined in Section 434 of the Companies Act 2006. A copy of the statutory accounts for the year 2024 has been delivered to the Registrar of Companies. The auditor's report on the 2024 accounts was unmodified, did not draw attention to any matters by way of emphasis and did not contain statements under Section 498(2) or (3) of the Companies Act 2006.
Other Information (continued)
Forward-looking statements and other matters
This announcement contains certain forward-looking statements, including "forward-looking" statements made within the meaning of the U.S. Private Securities Litigation Reform Act of 1995.
In particular, these forward-looking statements include, among other statements, statements regarding the Group's future financial performance, planned product launches and future regulatory developments and business objectives (including with respect to sustainability and other environmental, social and governance matters), as well as: (i) certain statements in the Half-Year Summary and in the Chief Executive statement (both on page 1), including the Group's expectations of being on track to deliver full-year guidance, an accelerated Group performance, including further improvements in New Category contribution margin, in the second half of the financial year ending 31 December 2025 and a return to the Group's mid-term algorithm in 2026; (ii) the statements under On Track for Full-Year 2025 Guidance (page 2); (iii) statements in the Group Operating Review and the Category Performance Review sections (pages 3 to 4 and pages 8 to 9) with respect to the Group's expectations of an accelerated New Categories performance and a continuing roll-out of Vuse Ultra and glo Hilo in the second half of the financial year ending 31 December 2025; (iv) certain statements in the Other Financial Information section (pages 10 to 12), including the Group's expectations of being within its narrowed leverage range of 2.0-2.5x adjusted net debt/adjusted EBITDA (as adjusted for Canada) by the end of 2026, meeting or exceeding the operating cash conversion guidance of 90%, generating approximately £50 billion of free cash flow before dividends between 2024 and 2030, gross capital expenditure of approximately £650 million in 2025, its commitment to a progressive dividend based upon 65% of long-term sustainable earnings and second-half weighted cash flow; (v) statements in the Other Information section (pages 12 to 14) regarding the implementation of the Approved Plans in Canada, the related expectations of the Group to make an upfront payment of £2.6 billion in the second half of 2025, the Group's going concern assessment and the generation of annualised cost efficiencies and cash flow of approximately £500 million by the end of 2028 in addition to £2 billion of targeted savings between 2026 and 2030; (vi) the statement in the Other Information section (page 14) and in the Notes to the Unaudited Interim Financial Statements section (page 25) referring to one-off costs of £500 million over two years; and (vii) statements in the Notes to the Unaudited Interim Financial Statements section (pages 23 to 39) referring to the expected gross capital expenditure of £650 million in 2025, the Group's expectation that payments in respect of its estimated share of the future liability under the Approved Plans will continue for at least 40 years, the Group's target of an average centrally managed bond maturity of at least five years with no more than 20% of centrally managed debt maturing in a single rolling 12-month period and its medium-target credit rating of Baa1, BBB+ and BBB+ from Moody's, S&P and Fitch, respectively, the Group's expectations and underlying assumptions with respect to contingent liabilities and its repayment schedule under the Franked investment income litigation order.
These statements are often, but not always, made through the use of words or phrases such as "believe," "anticipate," "could," "may," "would," "should," "intend," "plan," "potential," "predict," "will," "expect," "estimate," "project," "positioned," "strategy," "outlook," "target" "being confident" and similar expressions. These include statements regarding our intentions, beliefs or current expectations concerning, amongst other things, our results of operations, financial condition, liquidity, prospects, growth, strategies and the economic and business circumstances occurring from time to time in the countries and markets in which the British American Tobacco Group (the "Group") operates.
All such forward-looking statements involve estimates and assumptions that are subject to risks, uncertainties and other factors. It is believed that the expectations reflected in this announcement are reasonable, but they may be affected by a wide range of variables that could cause actual results and performance to differ materially from those currently anticipated. Among the key factors that could cause actual results to differ materially from those projected in the forward-looking statements are uncertainties related to the following: the impact of competition from illicit trade; the impact of adverse domestic or international legislation and regulation; the inability to develop, commercialise and deliver the Group's New Categories strategy; the impact of supply chain disruptions; adverse litigation, external investigations and dispute outcomes and the effect of such outcomes on the Group's financial condition; the impact of significant increases or structural changes in tobacco, nicotine and New Categories related taxes; translational and transactional foreign exchange rate exposure; changes or differences in domestic or international economic or political conditions; the ability to maintain credit ratings and to fund the business under the current capital structure; the impact of serious injury, illness or death in the workplace; adverse decisions by domestic or international regulatory bodies; direct and indirect adverse impacts associated with Climate Change; direct and indirect adverse impacts associated with Circularity; and Cyber Security caused by the heightened cyber-threat landscape, the increased digital interactions with consumers and changes to regulation.
A review of the reasons why actual results and developments may differ materially from the expectations disclosed or implied within forward-looking statements can be found by referring to the information contained under the headings "Cautionary statement", "Group Principal Risks" and "Group Risk Factors" in the 2024 Annual Report and Accounts and Form 20-F of British American Tobacco p.l.c. (BAT). Additional information concerning these and other factors can be found in BAT's filings with the U.S. Securities and Exchange Commission (SEC), including the Annual Report on Form 20-F and Current Reports on Form 6-K, which may be obtained free of charge at the SEC's website, http://www.sec.gov and the BAT website, http://www.bat.com.
No statement in this announcement is intended to be a profit forecast and no statement in this communication should be interpreted to mean that earnings per share of BAT for the current or future financial years would necessarily match or exceed the historical published earnings per share of BAT. Past performance is no guide to future performance and persons needing advice should consult an independent financial adviser. The forward-looking statements reflect knowledge and information available at the date of preparation of this announcement and BAT undertakes no obligation to update or revise these forward-looking statements, whether as a result of new information, future events or otherwise. Readers are cautioned not to place undue reliance on such forward-looking statements.
All financial statements and financial information provided by or with respect to the U.S. or Reynolds American are initially prepared on the basis of U.S. GAAP and constitute the primary financial statements or financial records of the U.S./Reynolds American. This financial information is then converted to International Financial Reporting Standards as issued by the IASB and as adopted for use in the UK (IFRS) for the purpose of consolidation within the results of the Group. To the extent any such financial information provided in this announcement relates to the U.S. or Reynolds American it is provided as an explanation of, or supplement to, Reynolds American's primary U.S. GAAP based financial statements and information.
Our products as sold in the U.S., including Vuse, Velo, Grizzly, Kodiak, and Camel Snus are subject to FDA regulation and no reduced-risk claims will be made as to these products without agency clearance.
C Ferland
Secretary
30 July 2025
Other Information (continued)
Corporate information
British American Tobacco p.l.c. is a public limited company which is listed on the London Stock Exchange, New York Stock Exchange and the JSE Limited in South Africa. British American Tobacco p.l.c. is incorporated in England and Wales (No. 3407696) and domiciled in the UK.
Registered office
Globe House, 4 Temple Place, London, WC2R 2PG, UK
tel: +44 20 7845 1000
Primary listing
London Stock Exchange (Share Code: BATS; ISIN: GB0002875804)
Computershare Investor Services PLC
The Pavilions, Bridgwater Road, Bristol BS99 6ZZ, UK
tel: 0800 408 0094; +44 370 889 3159
Your account: www.computershare.com/uk/investor/bri
Share dealing: www.computershare.com/dealing/uk
Web-based enquiries: www.investorcentre.co.uk/contactus
Secondary listing
JSE Limited (Share Code: BTI)
Shares are traded in electronic form only and transactions are settled electronically through Strate.
Computershare Investor Services Proprietary Limited
Private Bag X9000, Saxonwold 2132, South Africa
tel: 0861 100 634; +27 11 870 8216
email enquiries: web.queries@computershare.co.za
Sponsor for the purpose of the JSE listing
Merrill Lynch South Africa (Pty) Ltd t/a BofA Securities
Representative office in South Africa
Waterway House South
No 3 Dock Road, V&A Waterfront, Cape Town 8000, South Africa
PO Box 631, Cape Town 8000, South Africa
tel: +27 21 003 6712
American Depositary Receipts (ADRs)
NYSE (Symbol: BTI; CUSIP Number: 110448107)
BAT's shares are listed on the NYSE in the form of American Depositary Shares (ADSs) and these are evidenced by American Depositary Receipts (ADRs), each one of which represents one ordinary share of British American Tobacco p.l.c. Citibank, N.A. is the depositary bank for the sponsored ADR programme.
Citibank Shareholder Services
PO Box 43077, Providence, Rhode Island 02940-3077, USA
tel: +1 888 985 2055 (toll-free) or +1 781 575 4555
email enquiries: citibank@shareholders-online.com
website: www.citi.com/dr
Publications
British American Tobacco Publications
Unit 80, London Industrial Park, Roding Road, London E6 6LS, UK
tel: +44 20 7511 7797
e-mail enquiries: bat@team365.co.uk
If you require publications and are located in South Africa, please contact the Company's representative office in South Africa using the contact details shown above.
Glossary and Definitions
The following is a summary of the key terms used within this report:
|
Term |
Definition |
|
AME |
Americas (excluding U.S.) and Europe. |
|
APMEA |
Asia Pacific, Middle East and Africa. |
|
British American Tobacco, BAT, Group, we, us and our |
When the reference denotes an opinion, this refers to British American Tobacco p.l.c. and when the reference denotes business activity, this refers to British American Tobacco Group operating companies, either collectively or individually, as the case may be. |
|
Cigarette |
Factory-made cigarettes (FMC) and products that have similar characteristics and are manufactured in the same manner, but due to specific features may not be recognised as cigarettes for regulatory, duty or similar reasons. |
|
Circular Economy |
The circular economy is a model of production and consumption, which involves sharing, leasing, reusing, repairing, refurbishing and recycling existing materials and products as long as possible. |
|
Combustibles |
Cigarettes and OTP. |
|
Constant Currency/Constant rates |
Presentation of results in the prior year's exchange rate, removing the potentially distorting effect of translational foreign exchange on the Group's results. The Group does not adjust for normal transactional gains or losses in profit from operations which are generated by exchange rate movements. |
|
Developed Markets |
As defined by the World Economic Outlook as Advanced Economies and those within the European Union. |
|
Double Materiality Assessment/Material topic |
Although financial materiality has been considered in the development of our Double Materiality Assessment ("DMA"), our DMA/Material topic and any related conclusions as to the materiality of sustainability or ESG matters do not imply that all topics discussed therein are financially material to our business taken as a whole, and such topics may not significantly alter the total mix of information available about our securities. |
|
Emerging Markets |
Those markets not defined as Developed Markets. |
|
HP |
Heated Products, including the devices, which include glo and our hybrid products, which are used to heat our consumables being the Tobacco Heated Products or Herbal Products for Heating. |
|
Modern Oral |
Includes Velo, Grizzly and Lundgrens and products that are characterised as nicotine replacement therapy (including oral pouches, gums, lozenges and sprays). |
|
New Categories |
Includes Vapour, HP and Modern Oral. |
|
OTP |
Other Tobacco Products, including make-your-own, roll-your-own, Pipe and Cigarillos. |
|
Poly-usage/Poly-use |
Refers to a transitional period for smokers towards complete switching to potentially reduced-risk products during which period such smokers reduce cigarette consumption and choose to consume one or more New Category products. |
|
Reduced-risk† |
Based on the weight of evidence and assuming a complete switch from cigarette smoking. These products are not risk free and are addictive. |
|
Smokeless |
New Categories plus Traditional Oral. |
|
Solus usage |
Consumers using only one category of combustible or nicotine products. |
|
THP |
Tobacco Heated Products (i.e., the consumables that contain tobacco used by Heated Product devices). |
|
Top Cigarettes markets |
Being the Top markets for industry Cigarettes sales by revenue - the U.S., Japan, Brazil, Germany, Pakistan, Mexico, and Romania. These markets represent c. 60% of global industry Cigarettes revenue in 2024. |
|
Top HP markets |
Being the Top markets for industry HP revenue - Japan, South Korea, Italy, Germany, Greece, Poland, Romania, the Czech Republic, Spain and Portugal. These Top markets account for c.80% of total industry HP revenue in 2024. |
|
Top Modern |
Being the Top markets for industry Modern Oral sales by revenue - the U.S., Sweden, Denmark, Norway, Switzerland, UK and Poland, accounting for c.90% of total industry Modern Oral revenue in 2024. |
|
Top Vapour Markets |
Being the Top markets for industry Vapour sales by revenue - the U.S., Canada, the UK, France, Germany, Poland and Spain. These Top markets account for c.80% of total industry vapour revenue (rechargeable closed systems consumables and disposables in tracked channels) in 2024 |
|
Traditional Oral |
Including Moist Snuff (including Granit, Mocca, Grizzly, Kodiak) and other traditional snus products (including Camel Snus and Lundgrens). |
|
U.S. |
United States of America. |
|
Value share |
Value share is the estimated retail value of units bought by consumers of a particular brand or combination of brands, as a proportion of the total estimated retail value of units bought by consumers in the industry, category or other sub-categorisation in discussion. Except when referencing particular markets, value share is based on our Top markets. |
|
Vapour |
Battery-powered devices (rechargeable or single-use) that heat liquid formulations - e-liquids - to create a vapour which is inhaled. Vapour products include Vuse. |
|
Volume share |
Offtake volume share, as independently measured by retail audit agencies and scanner sales to consumers, where possible or based on movements within the supply chain (such as sales to retailers) to generate an estimate of shipment share, based upon latest available data. Except when referencing particular markets, volume share is based on our Top markets. |
† Our products as sold in the U.S., including Vuse, Velo, Grizzly, Kodiak, and Camel Snus, are subject to FDA regulation and no reduced-risk claims will be made as to these products without agency clearance.
Data Lake and Reconciliations
Volume
|
Group Volume |
||||
|
Six months ended 30 June |
2025 |
2024 |
||
|
Reported |
Growth % |
Reported |
||
|
New Categories: |
||||
|
Vapour (units mn) |
253 |
-12.9% |
290 |
|
|
HP (bn sticks) |
10.1 |
+1.6% |
9.9 |
|
|
Modern Oral (bn pouches) |
5.0 |
+42.2% |
3.5 |
|
|
Traditional Oral (bn sticks eq) |
2.8 |
-10.4% |
3.1 |
|
|
Cigarettes (bn sticks) |
228.7 |
-8.7% |
250.0 |
|
|
OTP (bn sticks) |
5.4 |
-15.3% |
6.4 |
|
|
Total Combustibles (bn sticks) |
234.1 |
-8.8% |
256.4 |
|
|
Memo: Cigarettes + HP (bn sticks) |
238.8 |
-8.3% |
259.9 |
|
Analysis of profit from operations and diluted earnings per share by segment
|
Six months ended 30 June |
2025 |
||||||
|
Reported |
Adj Items1 |
Adjusted |
Exchange |
Adjusted at CC2 |
Adj for Canada3 at CC2 |
As adj. for Canada3 at CC2 |
|
|
£m |
£m |
£m |
£m |
£m |
£m |
£m |
|
|
Profit from Operations |
|||||||
|
U.S. |
2,255 |
808 |
3,063 |
87 |
3,150 |
- |
3,150 |
|
AME |
1,969 |
(495) |
1,474 |
76 |
1,550 |
(164) |
1,386 |
|
APMEA |
845 |
12 |
857 |
42 |
899 |
- |
899 |
|
Total Region |
5,069 |
325 |
5,394 |
205 |
5,599 |
(164) |
5,435 |
|
Net finance costs |
(969) |
98 |
(871) |
(14) |
(885) |
(45) |
(930) |
|
Associates and joint ventures |
1,474 |
(1,242) |
232 |
13 |
245 |
- |
245 |
|
Profit before tax |
5,574 |
(819) |
4,755 |
204 |
4,959 |
(209) |
4,750 |
|
Taxation |
(1,009) |
(95) |
(1,104) |
(47) |
(1,151) |
54 |
(1,097) |
|
Non-controlling interests |
(53) |
(3) |
(56) |
(1) |
(57) |
- |
(57) |
|
Coupons relating to hybrid bonds net of tax |
(22) |
- |
(22) |
- |
(22) |
- |
(22) |
|
Profit attributable to shareholders |
4,490 |
(917) |
3,573 |
156 |
3,729 |
(155) |
3,574 |
|
Diluted number of shares (m) |
2,205 |
2,205 |
2,205 |
2,205 |
|||
|
Diluted earnings per share (pence) |
203.6 |
162.0 |
169.1 |
162.1 |
|||
|
Six months ended 30 June |
2024 |
||||||
|
Reported |
Adj Items1 |
Adjusted |
Adj for Canada3 |
As adjusted for Canada3 |
|||
|
£m |
£m |
£m |
£m |
£m |
|||
|
Profit from Operations |
|||||||
|
U.S. |
1,775 |
1,278 |
3,053 |
- |
3,053 |
||
|
AME |
1,473 |
14 |
1,487 |
(232) |
1,255 |
||
|
APMEA |
1,010 |
14 |
1,024 |
- |
1,024 |
||
|
Total Region |
4,258 |
1,306 |
5,564 |
(232) |
5,332 |
||
|
Net finance costs |
(305) |
(516) |
(821) |
(66) |
(887) |
||
|
Associates and joint ventures |
1,647 |
(1,367) |
280 |
- |
280 |
||
|
Profit before tax |
5,600 |
(577) |
5,023 |
(298) |
4,725 |
||
|
Taxation |
(1,041) |
(115) |
(1,156) |
77 |
(1,079) |
||
|
Non-controlling interests |
(67) |
- |
(67) |
- |
(67) |
||
|
Coupons relating to hybrid bonds net of tax |
(21) |
- |
(21) |
- |
(21) |
||
|
Profit attributable to shareholders |
4,471 |
(692) |
3,779 |
(221) |
3,558 |
||
|
Diluted number of shares (m) |
2,232 |
2,232 |
2,232 |
||||
|
Diluted earnings per share (pence) |
200.3 |
169.3 |
159.4 |
||||
Notes to the analysis of profit from operations above:
1. Adjusting items represent certain items which the Group considers distinctive based upon their size, nature or incidence.
2. CC: constant currency - measures are calculated based on a re-translation, at the prior year's exchange rates, of the current year's results of the Group and, where applicable, its segments.
3. The adjustment in respect of Canada is discussed on page 13, with the adjustment based upon the profit after interest and tax from all sources, excluding New Categories, in Canada.
Data Lake and Reconciliations (continued)
Non-GAAP measures
To supplement the presentation of the Group's results of operations and financial condition in accordance with IFRS, the Group also presents several non-GAAP measures used by management to monitor the Group's performance. The Group's management regularly reviews the measures used to assess and present the financial performance of the Group and, as relevant, its geographic segments.
Although the Group does not believe that these measures are a substitute for IFRS measures, the Group does believe such results excluding the impact of adjusting items and currency fluctuations that may significantly affect the users' understanding of the Group's performance when compared across period, as applicable, provide additional useful information to investors regarding the underlying performance of the business on a comparable basis.
The following table demonstrates the principal non-GAAP measures which the Group uses and indicates the IFRS measure from which each principal Non-GAAP measure is reconciled from:
|
Non-GAAP Measure title |
Presented in |
Reconciled from: |
|||
|
Current rates |
Constant rates |
Adjusted for Canada2 |
IFRS measure |
||
|
Revenue |
£m |
n/a1 |
Yes |
Revenue |
|
|
New Categories revenue |
£m |
Yes |
Yes |
Revenue |
|
|
Smokeless revenue as a % of total revenue |
% |
Yes |
Revenue |
||
|
Adjusted gross profit |
£m |
Yes |
Yes |
Profit from Operations |
|
|
Adjusted gross margin |
% |
Yes |
Yes |
Revenue/Profit from Operations |
|
|
Category contribution |
£m |
Yes |
Yes |
Profit from Operations |
|
|
Category contribution margin |
% |
Yes |
Yes |
Revenue/Profit from Operations |
|
|
Adjusted profit from operations |
£m |
Yes |
Yes |
Yes |
Profit from Operations |
|
Adjusted operating margin |
% |
Yes |
Yes |
Yes |
Revenue/Profit from Operations |
|
Adjusted diluted earnings per share |
p |
Yes |
Yes |
Yes |
Diluted Earnings per Share |
|
Adjusted EBITDA |
£m |
Yes |
Yes |
Profit for the Year |
|
|
Adjusted net debt |
£m |
Yes |
Yes |
Borrowings |
|
|
Operating cash conversion |
% |
Yes |
Net cash generated from operating activities |
||
|
Adjusted cash generated from operations |
£m |
Yes |
Yes |
Net cash generated from operating activities |
|
|
Free cash flow before and after dividends paid to shareholders |
£m |
Yes |
Net cash generated from operating activities |
||
1. Revenue at current rates is the IFRS measure. 2. The adjustment in respect of Canada is discussed on page 13, with the adjustment based upon the profit after interest and tax from all sources, excluding New Categories, in Canada.
The Group also uses adjusted share of post-tax results of associates and joint ventures, and underlying tax rate. Furthermore, the Group also presents adjusted return on capital (reconciled from profit from operations as a proportion of average total assets less current liabilities) within the full year results only.
Adjusting items, used to calculate certain of the above measures, are identified in accordance with the Group's accounting policies. They represent certain items of income and expense which the Group considers distinctive based on their size, nature or incidence and which individually or, if of a similar type, in aggregate, are relevant to an understanding of the Group's underlying financial performance.
As discussed on page 13, for certain measures, the Group also adjusts for the performance of Canada reflecting how Management assesses the performance of Canada on an ongoing basis.
Additionally, the Group uses the non-GAAP measures of non-controlling interest, coupons relating to hybrid bonds net of tax and profit attributable to shareholders.
The Group also supplements its presentation of revenue in accordance with IFRS by presenting the non-GAAP component breakdowns of revenues by product category (including revenue generated from Vapour, Heated Products, Modern Oral, New Categories as a whole, combustibles and Traditional Oral), including by geographic segment (including revenue generated in the United States, Americas and Europe and Asia-Pacific, Middle East and Africa). The Group further supplements the presentation of profit from operations in accordance with IFRS by presenting the non-GAAP measure referred to as New Categories contribution, which reflects the marginal contribution of the New Categories products to the Group's financial performance. This measure includes all attributable revenue and costs. The Group's Management Board believes these measures, which are used internally, are useful to the users of the financial statements in helping them understand the underlying business performance of individual Group product categories, including by geographic segments. They are not presentations made in accordance with IFRS and should not be considered as an alternative to breakdowns of revenues or profit from operations determined in accordance with IFRS. Breakdowns of revenues by product category and contributions to profit from operations by product category are not necessarily comparable to similarly titled measures used by other companies. As a result, readers should not consider these measures in isolation from, or as a substitute analysis for, the Group's breakdowns of revenues as determined in accordance with IFRS or profit from operations as determined in accordance with IFRS.
In 2024, the Group introduced Adjusted Gross Profit, Adjusted Gross Margin and Category Contribution Margin as non-GAAP measures. These measures demonstrate the Group's profitability (before adjusting items and translational foreign exchange) from the principal product categories, illustrating the category profitability development as the Group realises the transition from combustibles to smokeless products in line with the Group's strategy to Build a Smokeless World. New Categories adjusted Gross Margin and New Categories Contribution Margin will be used within the Group's incentive schemes from January 2025.
The Management Board, as the chief operating decision-maker, reviews a number of our IFRS and non-GAAP measures for the Group and geographic segments and its product categories at constant rates of exchange. This allows comparison of the Group's results, had they been translated at the previous year's average rates of exchange. The Group does not adjust for the normal transactional gains and losses in profit from operations that are generated by exchange movements. Although the Group does not believe that these measures are a substitute for IFRS measures, the Group does believe that such results excluding the impact of currency fluctuations year-on-year provide additional useful information to investors regarding the operating performance on a local currency basis.
Data Lake and Reconciliations (continued)
Non-GAAP measures (continued)
The Group also supplements its presentation of cash flows in accordance with IFRS by presenting the non-GAAP measures of free cash flow (before dividends paid to shareholders), free cash flow (after dividends paid to shareholders) and operating cash flow conversion ratio. The Group's Management Board believes these measures, which are used internally, are useful to the users of the financial statements in helping them understand the underlying business performance and can provide insights into the cash flow available to, among other things, reduce debt and pay dividends. Free cash flow (before dividends paid to shareholders), free cash flow (after dividends paid to shareholders) and operating cash flow conversion ratio have limitations as analytical tools. They are not presentations made in accordance with IFRS and should not be considered as an alternative to net cash generated from operating activities determined in accordance with IFRS. Free cash flow (before dividends paid to shareholders), free cash flow (after dividends paid to shareholders) and operating cash flow conversion ratio are not necessarily comparable to similarly titled measures used by other companies. As a result, readers should not consider these measures in isolation from, or as a substitute analysis for, the Group's results of operations or cash flows as determined in accordance with IFRS.
The Group also presents net debt and adjusted net debt, non-GAAP measures, on pages 2, 10, 11 and 59. The Group uses net debt and adjusted net debt to assess its financial capacity. The Management Board believes that these additional measures, which are used internally, are useful to the users of the financial statements in helping them to see how business financing has changed over the year. Net debt and adjusted net debt have limitations as analytical tools. They are not presentations made in accordance with IFRS and should not be considered as alternatives to borrowings or total liabilities determined in accordance with IFRS. Net debt and adjusted net debt are not necessarily comparable to similarly titled measures used by other companies. As a result, readers should not consider these measures in isolation from, or as a substitute analysis for the Group's measures of financial position as determined in accordance with IFRS.
Due to the secondary listing of the ordinary shares of British American Tobacco p.l.c. on the main board of the JSE in South Africa, the Group is required to present headline earnings per share and diluted headline earnings per share, as alternative measures of earnings per share, calculated in accordance with Circular 1/2023 'Headline Earnings' issued by the South African Institute of Chartered Accountants. These are shown on page 30.
The Group also presents the underlying tax rate, a non-GAAP measure, on page 27. The Group uses the underlying tax rate to assess the tax rate applicable to the Group's underlying operations, excluding the Group's share of post-tax results of associates and joint ventures in the Group's pre-tax results and adjusting items. The Management Board believes that this additional measure, which is used internally, is useful to the users of the financial statements because it excludes the contribution from the Group's associates, recognised after tax but within the Group's pre-tax profits, and adjusting items, thereby enhancing users' understanding of underlying business performance.
Underlying tax rate has limitations as an analytical tool. It is not a presentation made in accordance with IFRS and should not be considered as an alternative to the Group's headline effective tax rate as determined in accordance with IFRS. Underlying tax rate is not necessarily comparable to similarly titled measures used by other companies. As a result, this measure should not be considered in isolation from, or as a substitute analysis for, the Group's underlying tax rate as determined in accordance with IFRS.
Revenue, at constant rates of exchange
Definition: revenue before the impact of foreign exchange.
|
Six months ended 30 June |
2025 |
2024 |
|
£m |
£m |
|
|
Revenue |
12,069 |
12,340 |
|
Impact of translational foreign exchange |
498 |
|
|
Revenue translated at 2024 exchange rates |
12,567 |
12,340 |
Revenue by Product Category, including New Categories, at constant rates of exchange
Definition: revenue derived from each of the main product categories, including New Categories, before the impact of foreign exchange. These measures enable users of the financial statements to compare the Group's business performance across and with reference to the Group's investment activity.
|
Six months ended 30 June |
2025 |
2024 |
|||
|
Group Revenue |
Reported |
Impact of exchange |
Revenue at CC |
Reported |
|
|
£m |
£m |
£m |
£m |
||
|
New Categories |
1,651 |
38 |
1,689 |
1,651 |
|
|
Vapour |
737 |
19 |
756 |
869 |
|
|
HP |
444 |
10 |
454 |
441 |
|
|
Modern Oral |
470 |
9 |
479 |
341 |
|
|
Traditional Oral |
542 |
13 |
555 |
555 |
|
|
Smokeless |
2,193 |
51 |
2,244 |
2,206 |
|
|
Combustibles |
9,515 |
418 |
9,933 |
9,856 |
|
|
Other |
361 |
29 |
390 |
278 |
|
|
Total Revenue |
12,069 |
498 |
12,567 |
12,340 |
|
Data Lake and Reconciliations (continued)
Non-GAAP measures (continued)
|
Six months ended 30 June |
2025 |
2024 |
|||
|
U.S. Revenue |
Reported |
Impact of exchange |
Revenue at CC |
Reported |
|
|
£m |
£m |
£m |
£m |
||
|
New Categories |
536 |
14 |
550 |
529 |
|
|
Vapour |
434 |
11 |
445 |
507 |
|
|
HP |
- |
- |
- |
- |
|
|
Modern Oral |
102 |
3 |
105 |
22 |
|
|
Traditional Oral |
521 |
14 |
535 |
537 |
|
|
Smokeless |
1,057 |
28 |
1,085 |
1,066 |
|
|
Combustibles |
4,328 |
114 |
4,442 |
4,281 |
|
|
Other |
47 |
1 |
48 |
31 |
|
|
Total Revenue |
5,432 |
143 |
5,575 |
5,378 |
|
|
Six months ended 30 June |
2025 |
2024 |
|||
|
AME Revenue |
Reported |
Impact of exchange |
Revenue at CC |
Reported |
|
|
£m |
£m |
£m |
£m |
||
|
New Categories |
832 |
17 |
849 |
839 |
|
|
Vapour |
267 |
7 |
274 |
301 |
|
|
HP |
218 |
5 |
223 |
235 |
|
|
Modern Oral |
347 |
5 |
352 |
303 |
|
|
Traditional Oral |
21 |
(1) |
20 |
18 |
|
|
Smokeless |
853 |
16 |
869 |
857 |
|
|
Combustibles |
3,216 |
211 |
3,427 |
3,334 |
|
|
Other |
212 |
22 |
234 |
185 |
|
|
Total Revenue |
4,281 |
249 |
4,530 |
4,376 |
|
|
Six months ended 30 June |
2025 |
2024 |
|||
|
APMEA Revenue |
Reported |
Impact of exchange |
Revenue at CC |
Reported |
|
|
£m |
£m |
£m |
£m |
||
|
New Categories |
283 |
7 |
290 |
283 |
|
|
Vapour |
36 |
1 |
37 |
61 |
|
|
HP |
226 |
5 |
231 |
206 |
|
|
Modern Oral |
21 |
1 |
22 |
16 |
|
|
Traditional Oral |
- |
- |
- |
- |
|
|
Smokeless |
283 |
7 |
290 |
283 |
|
|
Combustibles |
1,971 |
93 |
2,064 |
2,241 |
|
|
Other |
102 |
6 |
108 |
62 |
|
|
Total Revenue |
2,356 |
106 |
2,462 |
2,586 |
|
Data Lake and Reconciliations (continued)
Non-GAAP measures (continued)
Adjusted Gross Profit and Adjusted Gross Margin at Constant Rates of Exchange
Definition - Profit from operations before the impact of adjusting items and translational foreign exchange, and before all non-production/attributable distribution costs and presented adjusting for the performance of Canada (where applicable, and excluding New Categories), in £ and as a proportion of revenue (at constant rates).
To supplement BAT's performance presented in accordance with IFRS, the Group's Management Board reviews the contribution to Group profit from operations (before the impact of adjusting items, translational foreign exchange and non-production/attributable distribution costs). The measure is reviewed in absolute £ values and as a proportion of revenue. This measure also adjusts for the performance of Canada (where applicable, and excluding New Categories), as discussed on page 13. This reflects the focus of the Group's strategic ambition and investment activity. New Category adjusted gross margin (being a sub-set of Group adjusted gross margin) will be included within the Group's incentive schemes.
The Group's Management Board believes that these additional measures provide information that enables users of the financial statements to compare the Group's business performance across periods and by reference to the Group's investment activity and strategic development. Adjusted gross profit and adjusted gross margin have limitations as analytical tools. They are not presentations made in accordance with IFRS, are not measures of financial condition or liquidity and should not be considered as alternatives to profit from operations as determined in accordance with IFRS. Adjusted gross profit and adjusted gross margin are not necessarily comparable to similarly titled measures used by other companies. As a result, you should not consider such performance measures in isolation from, or as a substitute analysis for, BAT's results of operations as determined in accordance with IFRS.
Please refer to page 53 for the reconciliation of Group profit from operations to adjusted gross profit and adjusted gross margin, included as part of a wider reconciliation of non-GAAP measures.
Category Contribution and Category Contribution Margin at Constant Rates of Exchange
Definition - Profit from operations before the impact of adjusting items and translational foreign exchange, having allocated costs that are attributable to a product category and presented adjusting for the performance of Canada (where applicable, and excluding New Categories) in £ and as a proportion of revenue (at constant rates).
To supplement BAT's performance presented in accordance with IFRS, the Group's Management Board reviews the contribution to Group profit from operations (before the impact of adjusting items and translational foreign exchange) of the principal product categories, reflecting the focus of the Group's investment activity. The measure is reviewed in absolute £ values and as a proportion of revenue. This measure also adjusts for the performance of Canada (where applicable and excluding New Categories), as discussed on page 13. Category contribution is, and Category contribution margin will be in the future, assessed by management within the Group's incentive schemes.
The Group's Management Board believes that these additional measures provide information that enables users of the financial statements to compare the Group's business performance across periods and by reference to the Group's investment activity. Category contribution and category contribution margin by products as measures of Group performance have limitations as analytical tools. They are not presentations made in accordance with IFRS, are not measures of financial condition or liquidity and should not be considered as alternatives to profit from operations as determined in accordance with IFRS. Category Contribution and Category Contribution margin are not necessarily comparable to similarly titled measures used by other companies. As a result, you should not consider such performance measures in isolation from, or as a substitute analysis for, BAT's results of operations as determined in accordance with IFRS.
Please refer to page 53 for the reconciliation of Group profit from operations to category contribution and category contribution margin, included as part of a wider reconciliation of non-GAAP measures.
The reconciliation provided reflects the marginal contribution of the Group principal product categories to the Group's financial performance. This measure includes all attributable revenue and costs. This measure is provided in aggregate as certain costs are incurred across all New Categories and are not product specific. However, certain overhead costs that are not category specific are excluded from Category Contribution.
Data Lake and Reconciliations (continued)
Non-GAAP measures (continued)
Reconciliations of Revenue to Revenue by Product Category, at Constant Rates of Exchange and Group Profit from Operations to Adjusted Profit from Operations, Adjusted Operating margin, Category Contribution, Adjusted Gross Profit and Adjusted Gross Margin, all at constant rates of exchange and adjusted for the performance of Canada (where applicable, and excluding New Categories).
The following reconciliations are provided to support the definitions of the above measures as explained on pages 50 and 52.
|
2025 |
||||||
|
Group reported £m |
Combustibles £m |
New Categories £m |
Traditional Oral £m |
Other £m |
||
|
Revenue |
12,069 |
9,515 |
1,651 |
542 |
361 |
|
|
vs 2024 |
-2.2% |
-3.5% |
-% |
-2.4% |
30.1% |
|
|
Impact of translational FX |
498 |
418 |
38 |
13 |
29 |
|
|
Revenue at constant FX |
12,567 |
9,933 |
1,689 |
555 |
390 |
|
|
vs 2024 |
1.8% |
0.8% |
2.4% |
-% |
40.3% |
|
|
Profit from Operations |
5,069 |
|||||
|
Operating margin |
42.0% |
|||||
|
Adjusting items (see page 52) |
325 |
|||||
|
Impact of translational FX |
205 |
|||||
|
Adjustments in respect of Canada1 |
(164) |
|||||
|
Adjusted profit from operations (as adj for Canada) |
5,435 |
|||||
|
Adj. operating margin (as adj for Canada) |
43.2% |
|||||
|
Other costs that are not attributable to categories |
942 |
|||||
|
Category Contribution (as adj for Canada) |
6,377 |
5,697 |
179 |
418 |
83 |
|
|
Category Contribution margin (as adj for Canada) |
50.7% |
57.4% |
10.6% |
75.2% |
21.3% |
|
|
Category spend (Marketing Investment and R&D) |
1,910 |
987 |
827 |
43 |
53 |
|
|
Adjusted gross profit (as adj for Canada) |
8,287 |
6,684 |
1,006 |
461 |
136 |
|
|
vs 2024 |
3.0% |
2.4% |
6.8% |
1.7% |
8.8% |
|
|
Adjusted gross margin (as adj for Canada) |
65.9% |
67.3% |
59.6% |
83.0% |
34.9% |
|
|
Adjusted gross profit at current rates (as adj for Canada) |
7,989 |
6,428 |
987 |
449 |
125 |
|
|
at Constant FX |
||
|
2024 |
||||||
|
Group reported £m |
Combustibles £m |
New Categories £m |
Traditional Oral £m |
Other £m |
||
|
Revenue |
12,340 |
9,856 |
1,651 |
555 |
278 |
|
|
Profit from Operations |
4,258 |
|||||
|
Operating margin |
34.5% |
|||||
|
Adjusting items (see page 52) |
1,306 |
|||||
|
Adjustments in respect of Canada1 |
(232) |
|||||
|
Adjusted profit from operations (as adj for Canada) |
5,332 |
|||||
|
Adj. operating margin (as adj for Canada) |
43.2% |
|||||
|
Other costs that are not attributable to categories |
901 |
|||||
|
Category Contribution (adj. for Canada) |
6,233 |
5,573 |
129 |
427 |
104 |
|
|
Category Contribution margin (as adj for Canada) |
50.5% |
56.6% |
7.8% |
76.9% |
37.4% |
|
|
Category spend (Marketing Investment and R&D) |
1,812 |
952 |
813 |
26 |
21 |
|
|
Adjusted gross profit (as adj for Canada) |
8,045 |
6,525 |
942 |
453 |
125 |
|
|
Adjusted gross margin (as adj for Canada) |
65.2% |
66.2% |
57.1% |
81.6% |
45.0% |
|
1. The adjustment in respect of Canada is discussed on page 13, with the adjustment based upon the profit after interest and tax from all sources, excluding New Categories, in Canada.
Data Lake and Reconciliations (continued)
Non-GAAP measures (continued)
Adjusted profit from operations, adjusted profit from operations at constant rates of exchange, adjusted profit from operations at constant rates of exchange (as adjusted for Canada1) ; adjusted operating margin and adjusted operating margin (as adjusted for Canada)
Definition: profit from operations before the impact of adjusting items (described on pages 25 to 27), adjustments in respect of Canada (as discussed on page 13) and translational foreign exchange; and adjusted profit from operations as a percentage of revenue and adjusted profit from operations (as adjusted for Canada) as a percentage of revenue, at constant rates of exchange.
|
Six months ended 30 June |
2025 |
2024 |
|
£m |
£m |
|
|
Profit from operations |
5,069 |
4,258 |
|
Add: |
||
|
Restructuring and integration costs |
13 |
- |
|
Amortisation and impairment of trademarks and similar intangibles |
804 |
1,295 |
|
Impairment of goodwill |
72 |
- |
|
Romania other taxes |
(22) |
- |
|
Charges in connection with disposal of associate |
3 |
6 |
|
Changes in provision in relation to Canada Approved Plan |
(575) |
- |
|
Credit in respect of settlement of historical litigation in relation to the Fox River |
- |
(132) |
|
Charges in respect of DOJ investigation and OFAC investigation |
- |
4 |
|
Other adjusting items (including Engle) |
30 |
133 |
|
Adjusted profit from operations |
5,394 |
5,564 |
|
Impact of translational foreign exchange on adjusted profit from operations |
205 |
|
|
Adjusted profit from operations translated at 2024 exchange rates |
5,599 |
5,564 |
|
Adjustments in respect of Canada1, translated at 2024 exchange rates |
(164) |
(232) |
|
Adjusted profit from operations, as adjusted for Canada, translated at 2024 exchange rates |
5,435 |
5,332 |
|
Operating Margin (Profit from operations as % of revenue) |
42.0% |
34.5% |
|
Adjusted Operating Margin (Adjusted profit from operations as % of revenue) |
44.7% |
45.1% |
|
Adjusted Operating Margin as adjusted for Canada (Adjusted PFO as adjusted for Canada as % of revenue), translated at 2024 exchange rates |
43.2% |
43.2% |
Adjusted net finance costs and adjusted net finance costs (as adjusted for Canada1), at constant rates of exchange
Definition: net finance costs before the impact of adjusting items (described on page 27), adjustments in respect of Canada (where applicable, and excluding New Categories) as discussed on page 13 and translational foreign exchange.
|
Six months ended 30 June |
2025 |
2024 |
|
£m |
£m |
|
|
Finance costs |
(1,084) |
(424) |
|
Finance income |
115 |
119 |
|
Net finance costs |
(969) |
(305) |
|
Less: Adjusting items in net finance costs |
98 |
(516) |
|
Adjusted net finance costs |
(871) |
(821) |
|
Comprising: |
||
|
Interest payable |
(879) |
(901) |
|
Interest and dividend income |
115 |
119 |
|
Fair value changes - derivatives |
(585) |
(49) |
|
Exchange differences |
478 |
10 |
|
Adjusted net finance costs |
(871) |
(821) |
|
Impact of translational foreign exchange |
(14) |
|
|
Adjusted net finance costs translated at 2024 exchange rates |
(885) |
(821) |
|
Adjustments in respect of Canada1, translated at 2024 exchange rates |
(45) |
(66) |
|
Adjusted net finance costs, as adjusted for Canada, translated at 2024 exchange rates |
(930) |
(887) |
1. The adjustment in respect of Canada is discussed on page 13, with the adjustment based upon the profit after interest and tax from all sources, excluding New Categories, in Canada.
Data Lake and Reconciliations (continued)
Non-GAAP measures (continued)
Adjusted share of post-tax results of associates and joint ventures and adjusted share of post-tax results of associates and joint ventures, at constant rates of exchange
Definition: share of post-tax results of associates and joint ventures before the impact of adjusting items (described on page 28) and translational foreign exchange.
|
Six months ended 30 June |
2025 |
2024 |
|
£m |
£m |
|
|
Group's share of post-tax results of associates and joint ventures |
1,474 |
1,647 |
|
Issue of shares and changes in shareholding |
(2) |
(6) |
|
Gain on ITC's demerger of hotels business (net of tax) |
(333) |
- |
|
Gain on partial divestment of shares held in ITC* |
(904) |
(1,361) |
|
Gain on sale of land and property by VST industries Limited |
(3) |
- |
|
Adjusted Group's share of post-tax results of associates and joint ventures |
232 |
280 |
|
Impact of translational foreign exchange |
13 |
|
|
Adjusted Group's share of post-tax results of associates and joint ventures translated at 2024 exchange rates |
245 |
280 |
* The 2025 value of the gain related to the partial divestment of shares held in ITC is provisional.
Adjusted taxation
Definition: Taxation before the impact of adjusting items (described on page 28).
|
Six months ended 30 June |
2025 |
2024 |
|
£m |
£m |
|
|
UK |
||
|
- current year tax |
66 |
83 |
|
- adjustment in respect of prior periods |
(1) |
- |
|
Overseas |
||
|
- current year tax |
1,093 |
1,208 |
|
- adjustment in respect of prior periods |
(5) |
194 |
|
Current tax |
1,153 |
1,485 |
|
Pillar 2 income tax |
43 |
46 |
|
Total current tax |
1,196 |
1,531 |
|
Deferred tax |
(187) |
(490) |
|
Taxation on ordinary activities |
1,009 |
1,041 |
|
Adjusting items in taxation |
66 |
(36) |
|
Taxation on adjusting items |
29 |
151 |
|
Adjusted taxation |
1,104 |
1,156 |
Data Lake and Reconciliations (continued)
Non-GAAP measures (continued)
Underlying tax rate and underlying tax rate, at constant rates of exchange (as adjusted for Canada1)
Definition: tax rate incurred before the impact of adjusting items (described on pages 25 to 28), adjustments in respect of Canada (as discussed on page 13) and translational foreign exchange and to adjust for the inclusion of the Group's share of post-tax results of associates and joint ventures within the Group's pre-tax results.
|
Six months ended 30 June |
2025 |
2024 |
|
£m |
£m |
|
|
Profit before taxation (PBT) |
5,574 |
5,600 |
|
Less: |
||
|
Share of post-tax results of associates and joint ventures |
(1,474) |
(1,647) |
|
Adjusting items within profit from operations |
325 |
1,306 |
|
Adjusting items within finance costs |
98 |
(516) |
|
Adjusted PBT, excluding associates and joint ventures |
4,523 |
4,743 |
|
Impact of translational foreign exchange |
191 |
|
|
Adjusted PBT, excluding associates and joint ventures translated at 2024 exchange rates |
4,714 |
4,743 |
|
Adjustments in respect of Canada2, translated at 2024 exchange rates |
(209) |
(298) |
|
Adjusted PBT, excluding associates and joint ventures and as adjusted for Canada, translated at 2024 exchange rates |
4,505 |
4,445 |
|
Taxation on ordinary activities |
(1,009) |
(1,041) |
|
Adjusting items within taxation and taxation on adjusting items |
(95) |
(115) |
|
Adjusted taxation |
(1,104) |
(1,156) |
|
Impact of translational foreign exchange on adjusted taxation |
(47) |
|
|
Adjusted taxation translated at 2024 exchange rates |
(1,151) |
(1,156) |
|
Adjustments in respect of Canada2, translated at 2024 exchange rates |
54 |
77 |
|
Adjusted taxation, as adjusted for Canada translated at 2024 exchange rates |
(1,097) |
(1,079) |
|
Effective tax rate |
18.1% |
18.6% |
|
Underlying tax rate |
24.4% |
24.4% |
|
Underlying tax rate (constant rates) |
24.4% |
|
|
Underlying tax rate (constant rates) as adjusted for Canada2 |
24.4% |
Adjusted diluted earnings per share, at current and constant rates of exchange and adjusted diluted earnings per share, at constant rates of exchange as adjusted for Canada
Definition: diluted earnings per share before the impact of adjusting items and the performance of Canada (where applicable, and excluding New Categories) as discussed on page 13, presented at the prior year's rate of exchange.
|
Six months ended 30 June |
2025 |
2024 |
|
pence |
pence |
|
|
Diluted earnings per share |
203.6 |
200.3 |
|
Effect of amortisation and impairment of goodwill, trademarks and similar intangibles |
31.4 |
44.5 |
|
Effect of settlement of historical litigation in relation to the Fox River |
- |
(5.0) |
|
Effect of the changes in provision in relation to the Approved Plans in Canada |
(19.1) |
- |
|
Effect of partial disposal of an associate |
0.1 |
0.3 |
|
Effect of Romania other taxes |
(1.0) |
- |
|
Effect of charges in respect of DOJ and OFAC investigations |
- |
0.2 |
|
Effect of restructuring and integration costs |
0.2 |
- |
|
Effect of other adjusting items in operating profit |
1.2 |
4.6 |
|
Effect of adjusting items in net finance costs |
3.4 |
(17.4) |
|
Effect of gains related to the partial divestment of shares held in ITC1 |
(41.0) |
(61.1) |
|
Tax associated with the partial divestment of shares held in ITC and hotels business demerger1 |
1.6 |
1.6 |
|
Effect of associates' adjusting items |
(15.3) |
(0.3) |
|
Effect of adjusting items in respect of deferred taxation |
(2.8) |
(5.9) |
|
Adjusting items in tax |
(0.3) |
7.5 |
|
Adjusted diluted earnings per share |
162.0 |
169.3 |
|
Impact of translational foreign exchange |
7.1 |
|
|
Adjusted diluted earnings per share translated at 2024 exchange rates |
169.1 |
169.3 |
|
Adjustments in respect of Canada2, translated at 2024 exchange rates |
(7.0) |
(9.9) |
|
Adjusted diluted earnings per share translated at 2024 exchange rates as adjusted for Canada |
162.1 |
159.4 |
1. The 2025 values of the gains related to the partial divestment of shares held in ITC and associated tax are provisional.
2. The adjustment in respect of Canada is discussed on page 13, with the adjustment based upon the profit after interest and tax from all sources, excluding New Categories, in Canada.
Data Lake and Reconciliations (continued)
Non-GAAP measures (continued)
Operating cash flow conversion ratio
Definition: net cash generated from operating activities before the impact of adjusting items and dividends from associates, taxes paid and after net capital expenditure, as a proportion of adjusted profit from operations.
|
Six months ended 30 June |
2025 |
2024 |
|
£m |
£m |
|
|
Net cash generated from operating activities |
2,309 |
3,165 |
|
Cash related to adjusting items |
430 |
339 |
|
Dividends from associates |
(168) |
(196) |
|
Tax paid |
1,576 |
1,153 |
|
Net capital expenditure |
(119) |
(96) |
|
Other |
(4) |
(1) |
|
Operating cash flow |
4,024 |
4,364 |
|
Adjusted profit from operations |
5,394 |
5,564 |
|
Cash conversion ratio |
46% |
74% |
|
Operating cash flow conversion ratio |
75% |
78% |
|
Cash conversion is net cash generated from operating activities as a proportion of profit from operations |
Adjusted cash generated from operations, at constant rates of exchange
Definition: net cash generated from operating activities before the impact of adjusting items (litigation), excluding dividends received from associates, and after dividends paid to non-controlling interests, net interest paid and net capital expenditure, and translational foreign exchange.
|
Six months ended 30 June |
2025 |
2024 |
|
£m |
£m |
|
|
Net cash generated from operating activities |
2,309 |
3,165 |
|
Dividends paid to non-controlling interests |
(63) |
(62) |
|
Net interest paid |
(889) |
(877) |
|
Net capital expenditure |
(119) |
(96) |
|
Other |
(4) |
(1) |
|
Cash related to adjusting items within adjusted cash generated from operations |
417 |
304 |
|
Dividends from associates |
(168) |
(196) |
|
Adjusted cash generated from operations |
1,483 |
2,237 |
|
Impact of translational foreign exchange |
31 |
|
|
Adjusted cash generated from operations, at constant exchange rates |
1,514 |
2,237 |
Free cash flow (before and after dividends paid to shareholders), at constant rates of exchange
Definition: net cash generated from operating activities after dividends paid to non-controlling interests, net interest paid and net capital expenditure, and translational foreign exchange. This measure is presented before and after dividends paid to shareholders.
|
Six months ended 30 June |
2025 |
2024 |
|
£m |
£m |
|
|
Net cash generated from operating activities |
2,309 |
3,165 |
|
Dividends paid to non-controlling interests |
(63) |
(62) |
|
Net interest paid |
(889) |
(877) |
|
Net capital expenditure |
(119) |
(96) |
|
Other |
(4) |
(1) |
|
Free cash flow (before dividends paid to shareholders) |
1,234 |
2,129 |
|
Dividends paid to shareholders |
(2,609) |
(2,605) |
|
Free cash flow (after dividends paid to shareholders) |
(1,375) |
(476) |
|
Impact of translational foreign exchange |
27 |
|
|
Free cash flow (after dividends paid to shareholders), at constant exchange rates |
(1,348) |
(476) |
Data Lake and Reconciliations (continued)
Non-GAAP measures (continued)
Free cash flow (before and after dividends paid to shareholders), at constant rates of exchange (continued)
The Group has an expectation to deliver a total of £50 billion of free cash flow (FCF) before dividends between 2024 and 2030 (inclusive). The table below provides a reconciliation of the progress to date.
|
FCF before dividends (as above) |
|
|
£m |
|
|
Year ended 31 December 2024 |
7,901 |
|
Six months ended 30 June 2025 |
1,234 |
|
Total |
9,135 |
Net debt
Definition: total borrowings, including related derivatives, less cash and cash equivalents and current investments held at fair value.
|
Six months ended 30 June |
2025 |
2024 |
|
£m |
£m |
|
|
Opening net debt |
(31,253) |
(34,640) |
|
Free cash flow (after dividends paid to shareholders) |
(1,375) |
(476) |
|
Other cash payments |
(47) |
(103) |
|
Net proceeds from partial divestment of shares held in ITC |
1,052 |
1,577 |
|
Purchase of own shares |
(450) |
(366) |
|
Other non-cash movements |
120 |
619 |
|
Impact of foreign exchange |
1,611 |
(269) |
|
Closing net debt |
(30,342) |
(33,658) |
Adjusted net debt
Definition: net debt, excluding the impact of the revaluation of Reynolds American Inc. acquired debt arising as part of the purchase price allocation process and excluding net debt items included within assets held-for-sale.
|
Six months ended 30 June |
2025 |
2024 |
|
£m |
£m |
|
|
Borrowings (excluding lease liabilities) |
34,672 |
39,618 |
|
Lease liabilities |
536 |
540 |
|
Derivatives in respect of net debt |
27 |
130 |
|
Cash and cash equivalents |
(4,404) |
(5,934) |
|
Current assets held at fair value |
(489) |
(696) |
|
Purchase price adjustment (PPA) to Reynolds American Inc. debt |
(593) |
(685) |
|
Adjusted net debt |
29,749 |
32,973 |
The Group does not provide adjusted net debt as a proportion of adjusted earnings before interest, tax, depreciation and amortisation (adjusted EBITDA) as part of the half year results. The measure would not be reasonable, using six months of adjusted EBITDA as a proportion of the period end net debt position. Group management does not assess adjusted net debt as a proportion of adjusted EBITDA based upon actual/periodic performance during the year, rather assessing the estimated performance on a forecast basis to manage the Group leverage position on a full year basis.
As discussed on page 13, a Global Settlement Agreement with respect to the ongoing litigation in Canada has been approved. This would lead to an outflow of cash, cash equivalents and investments held at fair value as part of the settlement, thereby increasing the level of adjusted net debt. To aid the users of the financial statements, the below table has been provided to illustrate the Group's leverage ratio of adjusted net debt to adjusted EBITDA, after such a payment.
|
Six months ended 30 June |
2025 |
2024 |
|
£m |
£m |
|
|
Adjusted net debt (above) |
29,749 |
32,973 |
|
Cash and cash equivalents and investments held at fair value (IHaFV) in Canada |
2,580 |
2,581 |
|
Adjusted net debt excluding the cash and cash equivalents and IHaFV in Canada |
32,329 |
35,554 |
Data Lake and Reconciliations (continued)
Summary of volume and revenue by category by region
|
Volume (unit) |
|||||||||||
|
Six months ended 30 June |
U.S. |
AME |
APMEA |
Group |
|||||||
|
2025 |
% change |
2025 |
% change |
2025 |
% change |
2025 |
% change |
||||
|
New Categories |
|||||||||||
|
Vapour (units mn) |
123 |
-13.8% |
112 |
-7.3% |
18 |
-33.4% |
253 |
-12.9% |
|||
|
HP (sticks bn) |
- |
-% |
3.9 |
-8.3% |
6.2 |
+8.7% |
10.1 |
+1.6% |
|||
|
Modern Oral (pouches bn) |
1.1 |
+206% |
3.3 |
+24.9% |
0.6 |
+15.1% |
5.0 |
+42.2% |
|||
|
Traditional Oral (stick eq bn) |
2.5 |
-9.5% |
0.3 |
-16.8% |
- |
-% |
2.8 |
-10.4% |
|||
|
Cigarettes (sticks bn) |
21 |
-7.7% |
111 |
-3.5% |
97 |
-14.0% |
229 |
-8.7% |
|||
|
OTP (stick eq bn) |
- |
+0.9% |
4 |
-14.2% |
1 |
-24.6% |
5 |
-15.3% |
|||
|
Total Combustibles |
21 |
-7.6% |
115 |
-4.0% |
98 |
-14.1% |
234 |
-8.8% |
|||
|
Memo: Cigarettes and HP (sticks bn) |
21 |
-7.7% |
115 |
-3.7% |
103 |
-12.9% |
239 |
-8.3% |
|||
|
Revenue - reported at current rates (£m) |
|||||||||||
|
Six months ended 30 June |
U.S. |
AME |
APMEA |
Group |
|||||||
|
2025 |
% change |
2025 |
% change |
2025 |
% change |
2025 |
% change |
||||
|
New Categories |
536 |
+1.3% |
832 |
-0.8% |
283 |
+0.4% |
1,651 |
-% |
|||
|
Vapour |
434 |
-14.5% |
267 |
-11.4% |
36 |
-40.5% |
737 |
-15.3% |
|||
|
HP |
- |
-% |
218 |
-7.4% |
226 |
+10.1% |
444 |
+0.8% |
|||
|
Modern Oral |
102 |
+372% |
347 |
+14.7% |
21 |
+29.7% |
470 |
+38.1% |
|||
|
Traditional Oral |
521 |
-2.9% |
21 |
+11.4% |
- |
-% |
542 |
-2.4% |
|||
|
Total Smokeless |
1,057 |
-0.8% |
853 |
-0.6% |
283 |
+0.4% |
2,193 |
-0.6% |
|||
|
Total Combustibles |
4,328 |
+1.1% |
3,216 |
-3.5% |
1,971 |
-12.0% |
9,515 |
-3.5% |
|||
|
Other |
47 |
+52.5% |
212 |
+15.2% |
102 |
+63.1% |
361 |
+30.1% |
|||
|
Total |
5,432 |
+1.0% |
4,281 |
-2.2% |
2,356 |
-8.9% |
12,069 |
-2.2% |
|||
|
Revenue - at constant rates (£m) |
|||||||||||
|
Six months ended 30 June |
U.S. |
AME |
APMEA |
Group |
|||||||
|
2025 |
% change |
2025 |
% change |
2025 |
% change |
2025 |
% change |
||||
|
New Categories |
550 |
+3.9% |
849 |
+1.3% |
290 |
+2.5% |
1,689 |
+2.4% |
|||
|
Vapour |
445 |
-12.3% |
274 |
-9.1% |
37 |
-38.4% |
756 |
-13.0% |
|||
|
HP |
- |
-% |
223 |
-4.8% |
231 |
+12.3% |
454 |
+3.1% |
|||
|
Modern Oral |
105 |
+384% |
352 |
+16.5% |
22 |
+32.7% |
479 |
+40.6% |
|||
|
Traditional Oral |
535 |
-0.4% |
20 |
+10.1% |
- |
-% |
555 |
-% |
|||
|
Total Smokeless |
1,085 |
+1.8% |
869 |
+1.5% |
290 |
+2.5% |
2,244 |
+1.8% |
|||
|
Total Combustibles |
4,442 |
+3.8% |
3,427 |
+2.8% |
2,064 |
-7.9% |
9,933 |
+0.8% |
|||
|
Other |
48 |
+57.1% |
234 |
+26.4% |
108 |
+73.0% |
390 |
+40.3% |
|||
|
Total |
5,575 |
+3.7% |
4,530 |
+3.5% |
2,462 |
-4.8% |
12,567 |
+1.8% |
|||