
Harbour Energy plc
Full year results for the year to 31 December 2024
6 March 2025
Harbour Energy plc ("Harbour" or the "Company" or the "Group") today announces its results for the year ended 31 December 2024.
Actuals to 31 December 2024 reflect the completion of the Wintershall Dea transaction on 3 September 2024 and include approximately four months of contribution from the acquired portfolio.
Linda Z Cook, Chief Executive Officer, commented:
"2024 was a transformational year with the completion of the Wintershall Dea transaction, our fourth significant transaction since 2017. As a result, we achieved a step change in the scale, resilience and longevity of our business underpinning the potential for material free cash flow generation well into the next decade. At the same time, we delivered another year of solid operational and financial performance.
"Looking to 2025, we have had a strong start to the year. We continue to prioritise safe and efficient operations, mature our significant 2C resource base and maintain disciplined capital allocation. We remain excited about our future and look forward to realising the potential of our company for all our stakeholders."
Operational highlights
|
§ |
Completed transformational acquisition of Wintershall Dea portfolio; integration progressing as planned |
|
§ |
Production of 258 kboepd (2023: 186 kboepd), a c.40 per cent increase on 2023 |
|
§ |
Unit operating costs of $16.5/boe (2023: $16.4/boe) |
|
§ |
Total recordable injury rate of 1.0 per million hours worked (2023: 0.7) |
|
§ |
Successful drilling in the UK, Norway, Argentina and Indonesia; new projects online in the UK and Argentina |
|
§ |
Total capital expenditure (including decommissioning) of $1.8 billion (2023: $1.0 billion) |
|
§ |
2P reserves and 2C resources more than tripled to 3.2 bnboe (2023: 880 mmboe), representing 19 years 2P reserves and 2C resource life |
|
§ |
Appointment of Chief Operating Officer, Nigel Hearne, in February 2025 |
Financial highlights[1]
|
§ |
Revenue and EBITDAX of $6.2 billion (2023: $3.7 billion) and $4.0 billion (2023: $2.7 billion), up c.65 per cent and c.50 per cent respectively, versus 2023 |
|
§ |
Profit before tax of $1.2 billion (2023: $0.6 billion) impacted by c.$0.8 billion of period specific predominantly non-cash accounting charges largely driven by adverse changes to the UK fiscal regime |
|
§ |
Loss after tax of $93 million (2023: $45 million profit) reflecting a 108% effective tax rate (2023 restated: 93%) |
|
§ |
Free cash flow of $0.1 billion (2023: $1.0 billion), including a $0.5 billion negative working capital movement and before one-off acquisition-related costs and shareholder distributions. |
|
§ |
Proposed final dividend of $227.5 million (13.19 cents per ordinary share), in line with Harbour's increased annual dividend policy of $455 million ($380 million to be paid on the ordinary shares) |
|
§ |
Net debt before unamortised fees of $4.7 billion (2023: $0.2 billion); year-end leverage (net debt before unamortised fees/pro forma EBITDAX) of 0.7x (2023: 0.1x) |
|
§ |
Corporate and senior unsecured issue credit ratings upgraded to investment grade Baa2, BBB- and BBB- from Moody's, S&P and Fitch, respectively |
2025 outlook
|
§ |
Production of 450-475 kboepd, a c.80% increase versus 2024; production of c.500 kboepd to end February 2025 |
|
|
§ |
Unit operating cost of c.$14/boe, a c.15% reduction versus 2024 |
|
|
§ |
Total capital expenditure (including decommissioning spend) of c.$2.4-2.6 billion |
|
|
§ |
At Brent oil price of $80/bbl and European and UK natural gas prices of $13/mscf, estimated free cash flow of c.$1.0 billion |
|
|
Enquiries |
||
|
Harbour Energy plc |
+44 20 3833 2421 |
|
|
Elizabeth Brooks, SVP Investor Relations Andy Norman, SVP Communications |
||
|
Brunswick |
+44 20 7404 5959 |
|
|
Patrick Handley, Will Medvei |
||
Analyst and investor conference call and webcast
Harbour will host a Capital Markets Update today, including a presentation of its 2024 Full Year Results, at 9.00am (UK time). The link to register for the webcast, and the presentation, will be available on www.harbourenergy.com. A replay will be available on Harbour's website shortly after the event.
Details of the Capital Markets Update is outlined in a separate announcement issued this morning.
Forward looking statements
This statement contains certain forward-looking statements that are subject to the usual risk factors and uncertainties associated with the oil and gas exploration and production business. Whilst Harbour believes the expectations reflected herein to be reasonable in light of the information available to them at this time, the actual outcome may be materially different owing to factors beyond Harbour's control or within Harbour's control where, for example, Harbour decides on a change of plan or strategy. Accordingly, no reliance may be placed on the figures contained in such forward-looking statements.
Auditors Report
In accordance with the UK Listing Rule 6.4, the 2024 Auditors Report will be submitted to the Financial Conduct Authority via the National Storage Mechanism today and will be available for inspection at: http://data.fca.org.uk/#/nsm/nationalstoragemechanism
Performance
Solid operational performance materially enhanced by acquisition
Production averaged 258 kboepd (2023: 186 kboepd) during 2024, split c.40 per cent liquids, c.45 per cent European natural gas and c.15 per cent other natural gas.
The c.40 per cent increase in production in 2024 versus 2023 was driven by the acquisition of the Wintershall Dea assets. The acquisition completed in September resulting in our expanded and diversified global portfolio achieving rates of c.500 kboepd in the fourth quarter with material contributions from Norway, the UK and Argentina.
Production was also supported by new projects and development wells coming on-stream in the UK, Argentina and Norway in the second half of the year. Looking to 2025, production on a full year basis is expected to increase to between 450-475 kboepd reflecting a full 12 months' contribution from the acquired Wintershall Dea assets and broadly stable production in the UK.
Absolute operating costs for 2024 were $1.6 billion (2023: $1.1 billion) which, on a unit of production basis, equated to $16.5/boe (2023: $16.4/boe). This reflects the addition of the lower cost Wintershall Dea portfolio offset by higher unit operating costs at our UK assets due to lower production volumes. In 2025, unit operating costs are expected to reduce to c.$14/boe, benefitting from a full year's contribution from the Wintershall Dea portfolio and continued management of our UK cost base.
2024 capital expenditure including decommissioning totalled $1.8 billion (2023: $1.0 billion). The increase on the prior year reflects the additional capital expenditure associated with the acquired Wintershall Dea assets, and accelerated capital investment in the UK ahead of anticipated changes to the UK fiscal regime. 2025 total capital expenditure is expected to be between $2.4-2.6 billion, reflecting 12 months of the Wintershall Dea portfolio partially offset by materially reduced capital investment in the UK.
Safe and responsible operations
A priority during the year was the safe transfer of the Wintershall Dea portfolio which we achieved in September. However, after consistently improving our safety record, 2024 saw Harbour's total recordable injury rate increase to 1.0 per million hours worked (2023: 0.7), in part reflecting the higher TRIR from the newly acquired assets for the last four months of 2024. Further, we recorded our first-ever Tier 1 process safety event - in Indonesia - along with three Tier 2 events (2023: zero). All events have been rigorously investigated, resulting in actions to improve performance with a particular focus on strengthening our process safety defences in Indonesia and reducing our TRIR in Germany.
In 2024, our GHG intensity improved to 14 kgCO2e/boe, (2023: 22 kgCO2e/boe) on a net equity, pro forma basis, reflecting the lower emissions intensity of the acquired portfolio. We remain on track to halve our gross operated emissions by 2030.
Maximising the value of our producing assets
The majority of Harbour's capital programme is focused on infrastructure-led opportunities, converting reserves into production and cash flow. These opportunities are typically low risk, high return investments concentrated around our existing production hubs, predominantly in Norway, the UK, Argentina and Germany.
In the UK, 2024 saw Harbour accelerate drilling around its operated hubs, taking advantage of tax credits which expired before year end 2024. This included a return to drilling at the Britannia satellite fields, with the Callanish F6 infill well on-stream in July while, at AELE, the North West Seymour well started up production in September. At Jocelyn South, we made a gas condensate discovery which is being brought on-stream through Harbour's Judy platform post period end in Q1 2025. In addition, in November, Harbour delivered first oil from its operated Talbot project, a three well subsea tie-back to J-Area. The project marked a material milestone for Harbour and was completed on schedule, within budget and with no recordable injuries.
In Norway, we continued to mature our pipeline of high value, short cycle developments. This includes the Harbour-operated Maria Phase 2 project, a four well subsea tieback to existing infrastructure in the Maria field, with production start-up expected during summer 2025, and Dvalin North, a subsea tieback to Dvalin. At Dvalin North, fabrication of the subsea infrastructure is well advanced with development drilling expected to commence in 2026. Harbour has a proven exploration track record in Norway, helping to support reserve replacement. This continued in 2024 with six successes from six exploration and appraisal wells drilled, including the Storjo gas discovery and successful appraisal drilling at Adriana/Sabina, both potential tie-backs to the Skarv hub.
In Argentina, Harbour holds a material non-operated position and is one of the country's largest gas producers. Production at our offshore CMA-1 concession in the Tierra del Fuego province was supported by the Fenix gas project, comprising a three well unmanned platform tied into existing CMA-1 facilities, which came on-stream ahead of schedule in September. Onshore in the Neuquén province, a multi-pad drilling campaign is ongoing to maintain gas production from our Aguada Pichana Este concession in the Vaca Muerta unconventional play. Production is currently constrained by offtake and local market capacity.
Elsewhere, in Germany, development activities across our three production hubs continued to support stable production. In Egypt, the two Raven West infill wells at West Nile Delta were progressed with production start-up from the first well achieved post period end in February 2025. In Indonesia, Harbour successfully amended its gas sales agreements with the Singapore buyers of Natuna Sea Block A gas, increasing the take-or-pay commitment under a tiered pricing structure, enabling higher production in the second half of 2024.
As at year end 2024, Harbour's proven and probable (2P) reserves on a working interest basis stood at 1.25 bnboe, more than three times higher than that at year end 2023 (2023: 0.36 bnboe). This increase was driven by the addition of 1.0 bnboe from the Wintershall Dea transaction, offsetting the impact of production by more than tenfold.
Strategic investment options
A broad set of major projects with the potential for material reserves replacement
During 2024, Harbour's 2C resources more than tripled to 1.91 bnboe (2023: 0.52 bnboe), driven by the Wintershall Dea transaction and providing significant reserve replacement opportunities. Organic additions to our 2C resources included exploration success in Indonesia, Norway and the UK, partially offset by revisions to our UK resources, largely the result of changes to the fiscal environment.
Harbour's 2C resources are split c.40 per cent in high value, near infrastructure opportunities, mainly in Norway, the UK and Argentina; c.30 per cent in conventional offshore growth projects in Mexico and Indonesia; with the remaining c.30 per cent in the globally competitive, unconventional Vaca Muerta shale play, onshore Argentina.
In Mexico, through the Wintershall Dea transaction, Harbour increased its interest in the offshore Zama and Kan oil fields and obtained an interest in the offshore Polok and Najaal discoveries. At Zama, FEED on the approved unit development plan was substantially completed in 2024. The Zama partners are now in discussions with Pemex to optimise the development concepts and accelerate first oil. A positive final investment decision at Zama would result in significant 2C resource moving into 2P reserves, replacing the equivalent of over a year's worth of Group production. To the southwest of Zama, appraisal drilling was successfully completed at the Harbour operated Kan oil discovery in Block 30. Work to identify the optimum development concept will be undertaken during 2025.
In August, a multi-well exploration and appraisal campaign across our Andaman Sea acreage in Indonesia was completed and included material gas discoveries at Layaran and Tangkulo on Andaman South (Harbour 20 per cent). In addition, Harbour secured a 60 per cent operated interest in the Central Andaman licence, which includes an extension of the Layaran discovery. Harbour, together with its partners, is now evaluating potential development options, including an accelerated development at Tangkulo.
Argentina represents the largest single component of Harbour's 2C resources, with 770 mmboe of 2C resources. In Q4, Harbour signed a participation agreement to acquire a 15 per cent interest in Southern Energy SA which is looking to develop a 2.45 million tonnes per annum (mtpa) FLNG export project off the coast of the Rio Negro province. It is anticipated that the upstream partners in Southern Energy SA will supply the natural gas for the FLNG project, enabling Harbour's Argentina natural gas to access global LNG export markets. This marks a significant milestone towards unlocking the accelerated development of Harbour's huge natural gas resource in Argentina. Harbour also has an interest in the San Roque licence, which is in the oil window of the Vaca Muerta play, and discussions with partners for the potential development of the resource are ongoing.
Building a competitive CCS business
Harbour's pipeline of potential CCS projects was strengthened in 2024 by the acquisition of the Wintershall Dea portfolio which added CO2 storage licences in Denmark, Norway and the UK, where we already have our Viking project.
At Viking, FEED was substantially completed in 2024 and the Development Consent Order (DCO) for the proposed new onshore CO2 pipeline was submitted to the Secretary of State for approval in December. Clarity on commercial terms of the project is anticipated following the conclusion of the UK Government's Critical Spending Review in 2025. Viking's gross storage resource increased to 417 million tonnes as at 31 December 2024 (2023: 300 million tonnes), following the addition of the storage resources of two new CCS licences in Viking's vicinity awarded in 2023.
In December 2024, Harbour together with its partners announced a final investment decision for the Greensand Future project in Denmark, marking Harbour's first CCS project to reach FID. Greensand Future is a small, short cycle project with high returns, driven by the ability to reuse existing infrastructure and defer decommissioning at the Nini field. The project is targeting first injection from 2026. Harbour also has an interest in the cost-advantaged, onshore Greenstore CCS project in Denmark, which is being progressed through the appraisal work programme.
M&A remains a core part of our strategy
With the addition of the Wintershall Dea portfolio, we have a much wider organic investment opportunity set with the potential to support material production well into the next decade. However, M&A remains a core dimension of our strategy, and we will continue to leverage our capabilities in this area to strengthen our portfolio.
The opportunity set for M&A remains rich including potential asset sales from large companies following consolidation, private companies continuing to look for liquidity, and small companies seeking scale, access to capital and relevance with investors. We will however continue to be disciplined, prioritising high-quality assets which lengthen our reserve life, provide a balance of oil and gas, and increase our operational control while, at the same time, are supportive to our investment grade credit ratings.
We will also continue to actively manage our portfolio, ensuring our capital and resources are deployed in line with our strategy. To this end, we agreed the sale of our Vietnam business, post period end, and exited an uncompetitive CCS licence in the UK.
Strong financial position
The acquisition of the Wintershall Dea assets is expected to deliver a step up in the scale and sustainability of our free cash flow, underpinned by our improved reserve life and expanded resource base. For 2024, Harbour delivered free cash flow of $0.1 billion for the year, before shareholder distributions and one-off acquisition-related costs. Cash flow is impacted by a number of period specific items including a material negative working capital movement, driven by the adjustment of our working capital cycle to the increased size of our business, significant planned shutdowns in Norway in September post completion, and payment of previously deferred UK taxes on 2023 earnings.
The Board has declared a final dividend of $227.5 million in respect of the 2024 financial year to be paid in May 2025 equating to 13.19 cents per ordinary share, subject to shareholder approval. This is in line with the Board's commitment at the time of acquisition announcement to increase the annual dividend to $455 million and signals the Board's ongoing confidence in the scale and longevity of our free cash flow generation.
Harbour's debt structure was transformed over 2024 with the reserves-based debt facility replaced with unsecured, lower cost and more flexible bank facilities and bonds. Harbour's corporate and senior bond credit ratings were upgraded to investment grade from all leading credit rating agencies and in October, Harbour issued €1.6 billion of Euro denominated, investment grade bonds. At year-end 2024, net debt (before unamortised fees) stood at $4.7 billion with leverage, on a pro forma basis, of 0.7x.
Since becoming a public company in 2021, our sustained operational and financial delivery along with our disciplined approach to capital allocation enabled us to repay c.$2.9 billion of debt and return c.$1.2 billion to shareholders while retaining the flexibility to complete a transformational acquisition.
2025 Annual General Meeting (AGM) and Board update
Harbour Energy's Annual General Meeting will be held on Thursday 8 May 2025. The Notice of Meeting will be published alongside the full annual report and accounts in March 2025. Andy Hopwood will be standing down from the Board at the close of the AGM and will not therefore be put forward for re-election by shareholders.
Harbour plans to seek authority from its shareholders at its upcoming AGM to conduct an off-market buyback of shares held by BASF, its largest shareholder. While BASF remain a significant shareholder, it is Harbour's intention to seek such authority each year from its shareholders to retain maximum flexibility. The Company is not obliged to exercise the authority or proceed with an off-market buyback once the authority has been approved.
Outlook1
Looking to 2025, Harbour will benefit from a full year's contribution from the Wintershall Dea assets resulting in another step up in production, a reduction in unit operating costs and increased free cash flow generation. In these times of continued geopolitical uncertainty and commodity price volatility, the resilience our more diverse and lower cost portfolio provides is ever more important. It is also why we aim for a balance of oil and gas and employ a disciplined and consistent approach to hedging. At Brent oil prices of $80/bbl and UK and European natural gas prices of $13/mscf, we expect to generate free cash flow of c. $1.0 billion1 in 2025. With a $5/bbl change in Brent oil prices or $1/mscf change in European natural gas prices impacting free cash flow by c.$115 million, we still expect to generate material free cash flow at current prices.
As we look to the future, we will continue to prioritise safe and efficient operations as we complete the integration of our new Business Units, mature our significant 2C resource base and maintain disciplined capital allocation. Our high-quality portfolio with significant optionality, financial strength and strong management team mean we are well-positioned for continued execution of our strategy and delivery of competitive shareholder returns.
1 2025 guidance/outlook assumes a US dollar to GBP sterling exchange rate of $1.25/£, US dollar to Euro exchange rate of $1.1/€ and a Norwegian NOK to US dollar exchange rate of NOK11/$. Free cash flow sensitivity assumes mid-point of production and capex guidance. A 1:1 conversion rate for $/mmbtu to $/mscf has been assumed.
Financial Review
Summary of financial results
|
Units |
2024 |
2023 As restated1 |
|
|
Production and post-hedging realised prices |
|||
|
Production |
kboepd |
258 |
186 |
|
Crude oil |
$/boe |
82 |
78 |
|
European gas2 |
$/mscf |
11 |
7 |
|
Other gas2 |
$/mscf |
4 |
13 |
|
Income statement |
|||
|
Revenue and other income |
$ million |
6,226 |
3,751 |
|
EBITDAX3 |
$ million |
4,006 |
2,675 |
|
Profit before taxation |
$ million |
1,219 |
616 |
|
(Loss)/profit after taxation |
$ million |
(93) |
45 |
|
Basic (loss)/earnings per ordinary voting share |
cents/share |
(10) |
6 |
|
Other financial key figures |
|||
|
Total capital expenditure3 |
$ million |
1,828 |
969 |
|
Operating cash flow |
$ million |
1,615 |
2,150 |
|
Free cash flow3 |
$ million |
(118) |
1,048 |
|
Shareholder returns paid3 |
$ million |
199 |
439 |
|
Net debt3 |
$ million |
4,424 |
207 |
|
Leverage ratio3 |
times |
1.1 |
0.1 |
1 2023 results throughout this financial review have been restated with respect to the Vietnam asset held for sale classification given the previous sales process did not conclude.
2 2024 reflects the impact of the Wintershall Dea portfolio. Europe includes UK, Norway and Germany with 2023 comparative restated to $/mscf. For Other gas, the 2023 comparative relates solely to the Indonesia business.
3 See Glossary for the definition of non-IFRS measures. Reconciliations between IFRS and non-IFRS measures are provided within this financial review.
Income Statement
|
2024 $ million |
2023 $ million As restated |
|
|
Revenue and other income |
6,226 |
3,751 |
|
Cost of operations |
(3,613) |
(2,376) |
|
EBITDAX1 |
4,006 |
2,675 |
|
Operating profit |
1,648 |
932 |
|
Profit before tax |
1,219 |
616 |
|
Taxation |
(1,312) |
(571) |
|
(Loss)/profit after tax |
(93) |
45 |
|
Cents/share |
Cents/share As restated |
|
|
Basic (loss)/earnings per ordinary voting share |
(10) |
6 |
1 Non-IFRS measure - see Glossary for the definition.
Revenue and other income
Total revenue and other income increased to $6,226 million (2023: $3,751 million). This was driven by higher production, primarily due to the Wintershall Dea transaction with the newly acquired portfolio contributing $2,021 million in the four months post completion, and increased commodity prices, especially European natural gas.
|
2024 $ million |
2023 $ million |
|
|
Revenue and other income |
6,226 |
3,751 |
|
Crude oil |
2,878 |
2,086 |
|
Gas |
2,936 |
1,415 |
|
Condensate |
283 |
179 |
|
Tariff income and other revenue |
61 |
35 |
|
Other income |
68 |
36 |
Revenue earned from hydrocarbon production activities increased to $6,097 million (2023: $3,680 million) after realised hedging losses of $18 million (2023: $911 million). This increase was mainly driven by higher production due to the acquired portfolio and higher post-hedging realised European natural gas prices. Of Harbour's total annual production of 258 kboepd and revenue of $6,226 million, 98 kboepd and $2,021 million revenue was delivered by the acquired portfolio in the four months post completion.
Crude oil sales increased to $2,878 million (2023: $2,086 million) after realised hedging gains of $32 million (2023: losses of $93 million). This was driven by higher production volumes from the acquired portfolio as well as a higher realised post-hedging oil price of $82/bbl (2023: $78/bbl). Of Harbour's total annual crude oil production of 90 kboepd and total $2,878 million post-hedging crude oil revenue, 27 kboepd and $590 million was delivered by the acquired portfolio in the four months post completion.
Gas revenue was $2,936 million (2023: $1,415 million), split between European gas revenue of $2,644 million (2023: $1,284 million) including realised hedging losses of $50 million (2023: $818 million) and other gas revenue of $292 million (2023: $131 million). The increase in both categories is primarily due to the acquired portfolio. Of Harbour's total annual gas production of 149 kboepd, 67 kboepd was delivered by the acquired portfolio in the four months post completion with associated European and Other post-hedging gas revenue of $1,121 million and $174 million respectively. The realised post-hedging price for our European and other gas was $11/mscf (2023: $7/mscf) and $4/mscf (2023: $13/mscf), respectively. The fall in the realised other gas price reflects the lower price environments of the acquired portfolio.
Condensate revenue was $283 million (2023: $179 million) and tariff income $61 million (2023: $35 million). Other income amounted to $68 million (2023: $36 million) which includes partner recovery on lease obligations and government subsidies in Argentina.
Cost of operations
Cost of operations increased to $3,613 million (2023: $2,376 million, as restated) driven primarily by costs associated with the acquired assets and a negative movement in hydrocarbon inventories and over/underlift. Cost of operations includes operating costs of $1,612 million (2023: $1,171 million) and depreciation, depletion and amortisation expense of $1,704 million (2023: $1,414 million, as restated) as discussed below along with over/underlift movements and other items for an expense of $297 million (2023: $209 million, credit).
|
2024 $ million |
2023 $ million As restated |
|
|
Operating costs |
||
|
Field operating costs |
1,612 |
1,171 |
|
Non-cash depreciation on non-oil and gas assets |
(25) |
(26) |
|
Tariff income |
(32) |
(30) |
|
Total operating costs |
1,555 |
1,115 |
|
Operating costs per barrel ($ per barrel)1 |
16.5 |
16.4 |
|
Movement in over/underlift balances and hydrocarbon inventories |
201 |
(225) |
|
Depreciation, depletion and amortisation (DD&A) |
||
|
Depreciation of oil and gas properties |
1,704 |
1,414 |
|
Depreciation of non-oil and gas properties |
22 |
12 |
|
Amortisation of intangible assets |
19 |
23 |
|
Total DD&A |
1,745 |
1,449 |
|
DD&A before impairment charges ($ per barrel)1 |
18.5 |
21.3 |
1 Non-IFRS measure - see Glossary for the definition.
Total operating costs increased to $1,555 million (2023: $1,115 million) driven by the four-month contribution of the acquired portfolio. However, they were materially unchanged on a unit of production basis at $16.5/boe (2023: $16.4/boe).
Depreciation, depletion and amortisation unit expense, which reflects the capitalised costs of producing assets divided by produced volumes, decreased to $18.5/boe (2023: $21.3/boe, as restated).
General and administrative expenses
General and administrative expenses amounted to $352 million (2023: $149 million). The increase was driven by the enlarged group, including expansion of our corporate centre, and additional and one-off M&A transaction costs of $119 million (2023: $33 million) associated with the Wintershall Dea acquisition.
EBITDAX1
EBITDAX1 was $4,006 million (2023: $2,675 million, as restated), with the increase driven by the four-month contribution of the acquired assets.
|
2024 $ million |
2023 $ million As restated |
|
|
Operating profit |
1,648 |
932 |
|
Depreciation, depletion and amortisation |
1,745 |
1,449 |
|
Impairment of property, plant and equipment |
352 |
176 |
|
Impairment of right-of-use asset |
20 |
- |
|
Impairment of goodwill |
- |
25 |
|
Exploration and evaluation expenditure, and new ventures |
68 |
36 |
|
Exploration costs written-off |
173 |
57 |
|
EBITDAX1 |
4,006 |
2,675 |
1 Non-IFRS measure - see Glossary for the definition.
The Group has recognised a net pre-tax impairment charge on property, plant and equipment of $352 million (2023: $176 million, as restated). Of this, $174 million was in respect of revisions to decommissioning estimates on mainly non-producing assets with no remaining book value. The remainder largely relates to impairments on three fields in the UK due to impacts from further changes to the UK Energy Profits Levy (EPL) and changes in life of field outlook.
During the year, the Group expensed $241 million (2023: $93 million) of exploration and appraisal activities. This covers exploration write-off expense of $173 million (2023: $57 million) including write-off of costs associated with projects in the UK ($79 million) and licence relinquishments in Norway ($64 million), and $40 million (2023: $29 million) costs primarily associated with carbon capture and storage activities.
Net financing costs
Finance income amounted to $173 million (2023: $104 million). The increase compared to 2023 is primarily due to unrealised foreign exchange gains of $118 million during the year which predominantly arose on the revaluation of the Group's tax liabilities due to the strengthening of the US dollar in the year.
Finance expenses amounted to $602 million (2023: $420 million). This included:
|
§ |
interest expense incurred of $78 million (2023: $42 million) related to debt facilities and bonds; |
|
§ |
bank and financing fees of $139 million (2023: $100 million); |
|
§ |
unwinding of the discount on decommissioning provisions of $221 million (2023: $156 million) which increased due to the acquired assets and increased estimates in the UK; |
|
§ |
$53 million (2023: $51 million) of lease interest; |
|
§ |
$43 million related to changes in the fair value of foreign exchange derivatives (2023: $nil); and |
|
§ |
realised losses on foreign exchange forward contracts $71 million (2023: $9 million, gain). |
Earnings and taxation
Loss after tax amounted to $93 million (2023: $45 million profit, as restated). This resulted in a loss per ordinary voting share of 10 cents (2023: 6 cents, earnings, as restated) after taking into account the weighted average number of ordinary voting shares in issue of 990 million (2023: 804 million) following the issue of shares to BASF and LetterOne as part of the acquisition. After taking into consideration $15 million (2023: $nil) attributable to subordinated notes investors, loss after tax attributable to equity owners of the company amounted to $108 million (2023: $45 million gain attributable to equity owners of the company).
Harbour's tax expense increased to $1,312 million in 2024 (2023: $571 million, as restated), primarily driven by higher pre-tax profits resulting from the additional earnings contributed by the acquisition and specific UK adjustments due to the EPL. The tax expense comprises a current tax expense of $1,415 million (2023: $677 million) and a deferred tax credit of $103 million (2023: $106 million, credit).
The effective tax rate of 108 per cent (2023: 93 per cent, as restated) is materially higher than the statutory tax rate of 78 per cent (2023: 75 per cent). This is primarily due to several UK-specific exceptional items. Key contributors include the increase in UK decommissioning obligations in the period (15 per cent), the impairment of tangible and intangible assets in the UK (4 per cent) and the increase in the EPL rate from 35 per cent to 38 per cent (6 per cent).
Shareholder distributions
A final dividend with respect to 2023 of 13.00 cents per ordinary share was proposed on 7 March 2024 and approved by shareholders at the AGM on 9 May 2024. The dividend was paid on 22 May 2024 to all shareholders on the register as at 12 April 2024, totaling $100 million. An interim dividend was announced on 8 August 2024 at 13 cents per share and was paid on 25 September 2024 at a value of $99 million[2].
The Board is proposing a final dividend with respect to 2024 of 13.19 cents per voting ordinary share to be paid in pound sterling at the spot rate prevailing on the record date. This dividend is subject to shareholder approval at the AGM, to be held on 8 May 2025. If approved, the dividend will be paid on 21 May 2025 to shareholders as of 11 April 2025. The ex-dividend date is 10 April 2025. A dividend reinvestment plan (DRIP) is available to shareholders who would prefer to invest their dividends in the shares of the company. The last date to elect for the DRIP in respect of this dividend is 29 April 2025.
A DRIP is provided by Equiniti Financial Services Limited. The DRIP enables the Company's shareholders to elect to have their cash dividend payments used to purchase the Company's shares. More information can be found at www.shareview.co.uk/info/drip.
Statement of Financial Position
|
2024 $ million |
2023 $ million As restated |
|
|
Assets |
||
|
Goodwill |
5,147 |
1,302 |
|
Non-current assets, excluding goodwill and deferred taxes |
21,133 |
7,061 |
|
Deferred tax assets |
130 |
7 |
|
Current assets |
3,634 |
1,546 |
|
Assets held for sale |
277 |
- |
|
Total assets |
30,321 |
9,916 |
|
Liabilities and Equity |
||
|
Borrowings net of transaction fees |
5,229 |
509 |
|
Provisions |
7,521 |
4,135 |
|
Deferred tax liabilities |
6,221 |
1,297 |
|
Lease creditor |
792 |
768 |
|
Derivative liabilities |
826 |
284 |
|
Other liabilities |
3,248 |
1,370 |
|
Liabilities directly associated with assets held for sale |
233 |
- |
|
Total liabilities |
24,070 |
8,363 |
|
Equity |
6,251 |
1,553 |
|
Total liabilities and equity |
30,321 |
9,916 |
|
Net debt |
4,424 |
207 |
Assets
The increase in total assets of $20,405 million to $30,321 million (2023: $9,916 million, as restated) is mainly as a result of the acquisition, primarily property, plant and equipment of $10,011 million, exploration, evaluation and other intangible assets of $4,409 million and goodwill arising from purchase price allocation exercise of $3,845 million. Total assets include assets held for sale in respect of the Vietnam disposal of $277 million.
The goodwill of $3,845 million arises principally from the requirement to recognise undiscounted deferred tax liabilities for the difference between the fair value and the tax base of the acquired assets and liabilities assumed in the business combination. This goodwill will ultimately be charged to the income statement over time as an impairment charge, primarily as the deferred tax balances unwind.
Liabilities
The increase in total liabilities of $15,707 million to $24,070 million (2023: $8,363 million, as restated) is primarily driven by the recognition of the liabilities assumed as a result of the acquisition. Liabilities assumed included deferred tax liabilities of $5,500 million, borrowings net of transaction fees of $3,079 million, provisions of $2,940 million, trade and other payables of $1,159 million and current tax liabilities of $1,128 million. Additionally, the Group increased its borrowings by $1,914 million being $250 million drawn under the $3 billion revolving credit facility (RCF) and new issue of Euro-denominated bonds of $1,664 million (nominal €1,600 million). Total liabilities included liabilities directly associated with assets held for sale in respect of the Vietnam disposal of $233 million.
The net deferred tax position on the statement of financial position is a liability of $6,091 million (2023: $1,290 million, as restated). This is primarily made up of a deferred tax liability in respect of the future profits which will flow from our property, plant and equipment of $9,600 million offset by a deferred tax asset in respect of future tax relief on decommissioning spend of $2,791 million, fair value losses on derivatives of $336 million and tax losses of $288 million (before adjustment for assets held for sale).
Equity and reserves
Total equity increased by $4,698 million to $6,251 million (2023: $1,553 million, as restated) mainly due to the recognition of merger reserve of $3,457 million associated with the 921 million shares issued to BASF and LetterOne as part of the acquisition as well as the recognition of subordinated notes that were assumed as part of the acquisition of $1,548 million. Movements in equity also included unfavourable post-tax fair value movements on cash flow hedges of $166 million (2023: favourable of $792 million) and gains on currency translation of $130 million (2023: $103 million) all recognised in other comprehensive income. Equity was reduced by dividend payments of $199 million (2023: $190 million) in addition to the loss for the year.
Net debt
As at 31 December 2024, net debt of $4,424 million (2023: $207 million, as restated). This consisted of borrowings amounting to $5,512 million (2023: $500 million) net of unamortised fees of $283 million (2023: $7 million) less cash balances of $805 million (2023: $286 million, as restated). During the year the RBL facility was replaced by the RCF and, as at 31 December 2024, $250 million was outstanding. At the end of 2023 the drawdown in the RBL was $nil and there were $61 million of unamortised fees classified in debtors which were expensed in 2024. As part of the acquisition, $3,079 million worth of borrowings were assumed, and a $1,500 million bridge facility was used to complete the acquisition. This was subsequently refinanced into two Euro-denominated bonds amounting to $1,664 million (€900 million and €700 million, respectively). In addition, Harbour had surety bonds of $675 million (£540 million) at year end which provide cover for decommissioning securities.
Available liquidity, comprising undrawn portion of the RCF facility of $1.9 billion ($250 million debt and $0.9 billion letters of credit for decommissioning have been drawn) plus cash balances of $0.8 billion (2023: $0.3 billion), was $2.7 billion (2023: $1.6 billion) at the end of the year.
As at 31 December 2024, the leverage ratio1 was 1.1x (2023: 0.1x) which has increased primarily as a result of the significant increase in net debt due to the acquisition, as well as only four months of EBITDAX contribution from the acquired portfolio. The balance sheet is in a strong position supported by the RCF facility and investment grade credit ratings.
|
2024 $ million |
2023 $ million As restated |
|
|
Leverage ratio |
||
|
Net debt1 |
4,424 |
207 |
|
EBITDAX1 |
4,006 |
2,675 |
|
Leverage ratio1 |
1.1x |
0.1x |
1 Non-IFRS measure - see Glossary for the definition.
Derivative financial instruments
We carry out hedging activity to manage commodity price risk. We have entered into both a series of fixed-price sales agreements and a financial hedging programme for both oil and gas, consisting of swap and option instruments. Hedges realised to date are in respect of both crude oil and natural gas.
The current hedging programme is shown below:
|
Hedge position |
2025 |
2026 |
2027 |
|
Oil |
|||
|
Total oil volume hedged (thousand bbls) |
16,162 |
12,881 |
- |
|
- of which swaps |
15,598 |
12,881 |
- |
|
- of which zero cost collars |
564 |
- |
- |
|
Weighted average fixed price ($/bbl) |
76.47 |
72.88 |
- |
|
Weighted average collar floor and cap ($/bbl) |
60.00 - 86.78 |
- |
- |
|
Natural gas |
|||
|
Gas volume hedged (thousand boe) |
33,509 |
19,924 |
2,056 |
|
- of which swaps/fixed price forward sales |
26,912 |
16,817 |
2,056 |
|
- of which zero cost collars |
6,597 |
3,106 |
- |
|
Weighted average fixed price ($/mscf) |
12.91 |
10.79 |
11.29 |
|
Weighted average collar floor and cap ($/mscf) |
11.46 - 22.50 |
9.04 - 16.71 |
- |
As at 31 December 2024, our financial hedging programme on commodity derivative instruments showed a pre-tax negative mark-to-market fair value of $476 million (2023: $18 million). Most of the commodity derivatives were designated as cash flow hedges, therefore, changes in fair value were reported in other comprehensive income.
For foreign exchange derivative instruments, the pre-tax negative mark-to-market fair value was $198 million (2023: $nil). Of this value, $173 million related to the cross-currency interest rate swaps designated as cash flow hedges relating to the euro bonds where €2.4 billion was hedged at a forward rate of between 1.1015 and 1.1209. The remaining $25 million related to FX forward contracts designated as fair value through income statement.
Acquisition of Wintershall Dea assets
On 3 September 2024, the Group closed the transaction to acquire substantially all of Wintershall Dea's upstream assets from BASF and LetterOne, including those in Norway, Germany, Denmark, Argentina, Mexico, Egypt, Libya and Algeria as well as Wintershall Dea's CCS licences in Europe. Under the purchase price allocation that was performed, the fair values of identifiable assets and liabilities of Wintershall Dea, and resulting goodwill, are as follows:
|
Fair value recognised on acquisition $ million |
|
|
Assets |
|
|
Other intangible assets |
4,409 |
|
Property, plant and equipment |
10,011 |
|
Right-of-use assets |
106 |
|
Deferred tax assets |
147 |
|
Other assets, excluding cash and cash equivalents |
1,814 |
|
Cash and cash equivalents |
748 |
|
Total assets |
17,235 |
|
Liabilities |
|
|
Borrowings |
3,079 |
|
Provisions |
2,940 |
|
Deferred tax liabilities |
5,500 |
|
Lease creditor |
118 |
|
Derivative liabilities |
317 |
|
Other liabilities |
2,287 |
|
Total liabilities |
14,241 |
|
Fair value of net identifiable net assets acquired |
2,994 |
|
Subordinated notes measured at fair value |
(1,548) |
|
Goodwill arising on acquisition |
3,845 |
|
Purchase consideration transferred |
5,291 |
The goodwill of $3,845 million arises principally from the requirement to recognise undiscounted deferred taxes liabilities for the difference between the fair value and the tax base of the acquired assets and liabilities assumed in the business combination. This goodwill will ultimately be charged to the income statement over time as an impairment charge, primarily as the deferred tax balances unwind.
From the date of acquisition, the acquired assets contributed $2,021 million of revenue and $867 million to profit before tax from continuing operations of the Group. If the combination had taken place at the beginning of the year, revenue from continuing operations would have been $10,516 million and profit before tax from continuing operations for the Group would have been $3,017 million.
Statement of cash flows1
|
2024 $ million |
2023 $ million As restated |
|
|
Cash flow from operating activities before tax payments |
3,114 |
2,588 |
|
Tax payments |
(1,499) |
(438) |
|
Cash flow from operating activities after tax payments |
1,615 |
2,150 |
|
Cash flow from investing activities - capital investment |
(1,322) |
(718) |
|
Cash flow from investing activities - other2 |
89 |
25 |
|
Operating cash flow after investing activities |
382 |
1,457 |
|
Cash flow from financing activities3 |
(500) |
(409) |
|
Free cash flow4 |
(118) |
1,048 |
|
Cash and cash equivalents |
805 |
286 |
1 Table excludes financing activities related to debt principal movements.
2 Excludes net expenditure on business combinations of ($1,044 million, note 14 of the financial statements).
3 Interest and lease interest and capital payments only, excludes shareholder distributions.
4 Non-IFRS measure - see Glossary for the definition.
Net operating cashflow before tax was $3,114 million (2023: $2,588 million, as restated) reflecting the enlarged group. The timing and magnitude of tax payments impacted net cash from operating activities after tax which amounted to $1,615 million (2023: $2,150 million, as restated). Tax payments during the year were $1,499 million compared to $438 million in 2023 due to the enlarged portfolio and balancing payments for prior year UK EPL. UK EPL payments amounted to $732 million (2023: $402 million).
Cash flow working capital movements were negative $494 million (2023: positive $205 million) as the increase in production within the enlarged business coupled with overdue receivables in Egypt and Mexico means we carry a materially higher net working capital position on our balance sheet at year end.
Capital investment was $1,322 million (2023: $718 million) which included property, plant and equipment additions of $884 million (2023: $496 million), exploration and evaluation additions of $359 million (2023: $202 million) and other intangible additions of $79 million (2023: $20 million). Cash outflow from financing activities totalled $500 million (2023: $409 million) split between interest payments of $181 million (2023: $150 million) and lease payments of $319 million (2023: $259 million).
Free cash flow was $118 million outflow after acquisition related costs of $235 million. Before these acquisition related costs free cash flow was $117 million inflow.
Shareholder distributions consist of dividends paid of $199 million (2023: $190 million). In 2023, shareholder distributions also included $249 million related to the repurchase of Harbour's own shares.
Cash and cash equivalent balances were $805 million (2023: $286 million, as restated) at the end of the year.
Capital investment is defined as additions to property, plant and equipment, fixtures and fittings and intangible exploration and evaluation assets, excluding changes to decommissioning assets.
|
2024 $million |
2023 $million As restated |
|
|
Additions to oil and gas assets |
(1,037) |
(482) |
|
Additions to fixtures and fittings, office equipment & IT software |
(73) |
(29) |
|
Additions to exploration and evaluation assets |
(398) |
(210) |
|
Additions to other intangible assets |
(36) |
- |
|
Total capital investment1 |
(1,544) |
(721) |
|
Movements in working capital |
140 |
(22) |
|
Capitalised interest |
18 |
7 |
|
Capitalised lease payments |
64 |
18 |
|
Cash capital investment per the cash flow statement |
(1,322) |
(718) |
1 Non-IFRS measure - see Glossary for the definition.
During the period, the Group incurred total capital expenditure of $1,828 million (2023: $989 million), split by capital investment $1,544 million (2023: $721 million) and decommissioning spend $284 million (2023: $268 million) respectively.
The capital investment for operated assets mainly consisted of; in the UK, project activity at Talbot (J-Area) and development drilling at J-Area, Callanish F6 (GBA), Greater Britannia appraisal at Leverett and discoveries at Gilderoy and Jocelyn South and North West Seymour (AELE); in Norway, multiple tieback projects at Maria, Dvalin North, Irpa, Alva Nord and Idun North plus Solveig; in Germany, continued development of the Mittelplate field; and in Mexico, the Kan-2 appraisal well.
For partner-operated assets, capital investment consisted primarily of; in the UK, drilling at Buzzard, Clair and Schiehallion; in Norway, drilling continued at Skarv and Njord; in Argentina, the offshore Fenix field development was completed; and in Egypt, drilling continued on the Raven West field infill wells. In Indonesia exploration and appraisal wells were drilled at Layaran and Tangkulo in South Andaman.
Refer to the Operational Review for more detail.
Principal risks
The Directors have identified several changes to the principal risks facing the company over the period, primarily as a result of how the Wintershall Dea transaction has diversified the portfolio and strengthened the financial position of the business. Notably, the principal risk recognised in the 2023 Annual Report as 'Access to capital' has been broadened to 'Financial Discipline' to encompass broader aspects of the financial management and control, while the unmitigated risk level of several principal risks has increased.
Post balance sheet events
On 23 January 2025 Harbour announced it had signed a Sale and Purchase Agreement to sell its Vietnam business, which includes the 53.125% equity interest in the Chim Sáo and Dua production fields, to EnQuest for $84 million. The effective date is 1 January 2024 with completion targeted during 2025. This agreement resulted in the Vietnam business unit being classed as asset held for sale as at 31 December 2024.
On 3 March 2025, the Finance Act 2025 was substantively enacted following its third reading in the UK Parliament. While the substantive enactment has no implications for the current accounting period, it confirms that the extension of the Energy Profits Levy to 31 March 2030 will be reflected in the Group's results for the interim period to 30 June 2025. If the Finance Act 2025 had been substantively enacted at the balance sheet date, the deferred tax liability at the end of the period would have increased by $306 million (further details are provided in note 8 of the financial statements).
Going concern
The Directors considered the going concern assessment period to be up to 31 December 2026. The Group monitors and manages its capital position and its liquidity risk regularly to ensure that it has access to sufficient funds to meet forecast cash requirements. Cash forecasts for management are regularly produced and sensitivities considered based on, but not limited to, the Group's latest life of field production and expenditure forecasts, management's best estimate of future commodity prices based on recent forward curves, adjusted for the Group's hedging programme and the Group's borrowing facilities.
The Group's ongoing capital requirements are financed by its $3.0 billion revolving credit facility (RCF), bonds and subordinated notes $1.6 billion, and surety bonds of $675 million (£540 million) which provide cover for decommissioning securities. The RCF is subject to financial covenants that require the ratio of consolidated total net debt, including letters of credit, to last twelve months (LTM) EBITDAX to be less than 3.5x and LTM EBITDA divided by interest expense to exceed 3.5x. Under the Group's base case, the RCF is forecast to have an undrawn balance of $3.0 billion through 2025 and 2026. When combined with drawn letters of credit and unrestricted cash the headroom is forecasted to be $2.5 billion in 2026 which provides a robust liquidity position.
The base case indicates that the Group is able to operate as a going concern with sufficient headroom and remain in compliance with its loan covenants throughout the assessment period.
The Group's going concern assessment is based on management's best estimate of forward commodity price curves and other economic assumptions, production and expenditure in line with approved asset base case, plus the ongoing capital requirements of the Group that will be financed by free cash flow, the existing RCF and bond financing arrangements.
In line with the principal risks that have been identified to impact the financial capability of the Group to operate as going concern, a single downside sensitivity scenario has been prepared reflecting a reduction in:
|
§ |
Brent crude, UK natural gas and Dutch TTF gas prices of 20 per cent, and |
|
§ |
the Group's unhedged production of 10 per cent |
throughout the entire assessment period. Management considers this represents a severe but plausible downside scenario appropriate for assessing going concern and viability.
In this downside scenario when applied individually and in aggregate to the base case forecast, the Group is forecast to have sufficient liquidity headroom throughout the assessment period and to remain in compliance with its financial covenants.
Reverse stress tests have been prepared reflecting reductions in each of commodity price and production parameters, prior to any mitigation strategies, to determine at what levels each would need to reach such that either the lending covenants are breached or liquidity headroom runs out. The results of these reverse stress tests demonstrated the likelihood that a sustained significant fall in commodity prices or a significant fall in production over the assessment period that would be required to cause a risk of funds shortfall or a covenant breach is remote.
Taking the above analysis into account and considering the findings of the work performed to support the statement on the long-term viability of the company and the Group, the Board was satisfied that, for the going concern assessment period, the Group is able to maintain adequate liquidity and comply with its lending covenants up to 31 December 2026 and has therefore adopted the going concern basis for preparing the financial statements.
By order of the Board,
Alexander Krane
Chief Financial Officer
5 March 2024
Financial Statements
Consolidated income statement
For the year ended 31 December 2024
|
Note |
2024 $ million |
2023 As restated $ million |
|
|
Revenue |
4 |
6,158 |
3,715 |
|
Other income |
4 |
68 |
36 |
|
Revenue and other income |
6,226 |
3,751 |
|
|
Cost of operations |
5 |
(3,613) |
(2,376) |
|
Impairment of property, plant and equipment |
5, 12 |
(352) |
(176) |
|
Impairment of right-of-use assets |
13 |
(20) |
- |
|
Impairment of goodwill |
5, 10 |
- |
(25) |
|
Exploration and evaluation expenses and new ventures |
5 |
(68) |
(36) |
|
Exploration costs written-off |
5 |
(173) |
(57) |
|
General and administrative expenses |
5 |
(352) |
(149) |
|
Operating profit |
1,648 |
932 |
|
|
Finance income |
7 |
173 |
104 |
|
Finance expenses |
7 |
(602) |
(420) |
|
Profit before taxation |
1,219 |
616 |
|
|
Income tax expense |
8 |
(1,312) |
(571) |
|
(Loss)/profit for the year |
(93) |
45 |
|
|
(Loss)/profit for the year attributable to: |
|||
|
Equity owners of the company |
(108) |
45 |
|
|
Subordinated notes investors |
15 |
- |
|
|
(93) |
45 |
|
(Loss)/earnings per share |
Note |
$ cents |
$ cents |
|
Basic |
|||
|
Ordinary shares voting |
9 |
(10) |
6 |
|
Ordinary shares non-voting |
9 |
(11) |
- |
|
Diluted |
|||
|
Ordinary shares voting |
9 |
(10) |
6 |
|
Ordinary shares non-voting |
9 |
(11) |
- |
Consolidated statement of comprehensive income
For the year ended 31 December 2024
|
2024 $ million |
2023 As restated $ million |
|
|
(Loss)/profit for the year |
(93) |
45 |
|
Other comprehensive income/(loss) |
||
|
Items that will not be subsequently reclassified to income statement: |
||
|
Actuarial losses |
(6) |
- |
|
Tax credit on actuarial losses |
4 |
- |
|
Net other comprehensive (loss)/income that will not be subsequently reclassified to income statement |
(2) |
- |
|
Items that may be subsequently reclassified to income statement: |
||
|
Fair value (losses)/gains on cash flow hedges |
(545) |
3,168 |
|
Tax credit/(charge) on cash flow hedges |
379 |
(2,376) |
|
Exchange differences on translation |
130 |
103 |
|
Net other comprehensive (loss)/income that may be subsequently reclassified to income statement |
(36) |
895 |
|
Other comprehensive (loss)/income for the year, net of tax |
(38) |
895 |
|
Total comprehensive (loss)/income for the year |
(131) |
940 |
|
Total comprehensive income attributable to: |
||
|
Equity owners of the company |
(146) |
940 |
|
Subordinated notes investors |
15 |
- |
|
(131) |
940 |
Consolidated balance sheet
For the year ended 31 December 2024
|
Note |
2024 $ million |
2023 As restated $ million |
|
|
Assets |
|||
|
Non-current assets |
|||
|
Goodwill |
10 |
5,147 |
1,302 |
|
Other intangible assets |
11 |
5,714 |
1,172 |
|
Property, plant and equipment |
12 |
14,543 |
4,836 |
|
Right-of-use assets |
13 |
656 |
632 |
|
Deferred tax assets |
8 |
130 |
7 |
|
Other receivables |
16 |
176 |
309 |
|
Other financial assets |
23 |
44 |
112 |
|
Total non-current assets |
26,410 |
8,370 |
|
|
Current assets |
|||
|
Inventories |
15 |
368 |
217 |
|
Trade and other receivables |
16 |
2,316 |
873 |
|
Other financial assets |
23 |
145 |
170 |
|
Cash and cash equivalents |
17 |
805 |
286 |
|
3,634 |
1,546 |
||
|
Assets held for sale |
18 |
277 |
- |
|
Total current assets |
3,911 |
1,546 |
|
|
Total assets |
30,321 |
9,916 |
|
|
Equity and liabilities |
|||
|
Equity |
|||
|
Share capital |
25 |
171 |
171 |
|
Merger reserve |
25 |
3,728 |
271 |
|
Other reserves |
(18) |
18 |
|
|
Retained earnings |
807 |
1,093 |
|
|
Equity attributable to equity holders of the company |
4,688 |
1,553 |
|
|
Equity attributable to subordinated notes investors |
26 |
1,563 |
- |
|
Total equity |
6,251 |
1,553 |
|
|
Non-current liabilities |
|||
|
Borrowings |
22 |
4,215 |
493 |
|
Provisions |
21 |
7,024 |
3,905 |
|
Deferred tax |
8 |
6,221 |
1,297 |
|
Trade and other payables |
20 |
30 |
13 |
|
Lease creditor |
13 |
551 |
552 |
|
Other financial liabilities |
23 |
415 |
87 |
|
Total non-current liabilities |
18,456 |
6,347 |
|
Current liabilities |
|||
|
Trade and other payables |
20 |
1,755 |
915 |
|
Borrowings |
22 |
1,014 |
16 |
|
Lease creditor |
13 |
241 |
216 |
|
Provisions |
21 |
497 |
230 |
|
Current tax liabilities |
1,412 |
442 |
|
|
Other financial liabilities |
23 |
462 |
197 |
|
5,381 |
2,016 |
||
|
Liabilities directly associated with the assets held for sale |
18 |
233 |
- |
|
Total current liabilities |
5,614 |
2,016 |
|
|
Total liabilities |
24,070 |
8,363 |
|
|
Total equity and liabilities |
30,321 |
9,916 |
The following notes form part of these financial statements.
The financial statements were approved by the board of directors and authorised for issue on 5 March 2025 and signed on its behalf by:
Alexander Krane
Chief Financial Officer
Consolidated statement of changes in equity
For the year ended 31 December 2024
|
Share capital $ million |
Merger reserve1 $ million |
Capital redemption reserve $ million |
Cash flow hedge reserve2 $ million |
Costs of hedging reserve2 $ million |
Currency translation reserve $ million |
Retained earnings $ million |
Equity attributable to owners of the company $ million |
Equity attributable to sub-ordinated notes investors $ million |
Total equity $ million |
|
|
At 1 January 2023 |
171 |
271 |
8 |
(776) |
(9) |
(100) |
1,456 |
1,021 |
- |
1,021 |
|
Profit for the year as restated |
- |
- |
- |
- |
- |
- |
45 |
45 |
- |
45 |
|
Other comprehensive income |
- |
- |
- |
779 |
13 |
103 |
- |
895 |
- |
895 |
|
Total comprehensive income as restated |
- |
- |
- |
779 |
13 |
103 |
45 |
940 |
- |
940 |
|
Purchase and cancellation of own shares |
- |
- |
- |
- |
- |
- |
(249) |
(249) |
- |
(249) |
|
Share-based payments |
- |
- |
- |
- |
- |
- |
46 |
46 |
- |
46 |
|
Purchase of ESOP trust shares |
- |
- |
- |
- |
- |
- |
(15) |
(15) |
- |
(15) |
|
Dividend paid |
- |
- |
- |
- |
- |
- |
(190) |
(190) |
- |
(190) |
|
At 31 December 2023 as restated |
171 |
271 |
8 |
3 |
4 |
3 |
1,093 |
1,553 |
- |
1,553 |
|
(Loss)/profit for the year |
- |
- |
- |
- |
- |
- |
(108) |
(108) |
15 |
(93) |
|
Other comprehensive (loss)/income |
- |
- |
- |
(188) |
22 |
130 |
(2) |
(38) |
- |
(38) |
|
Total comprehensive (loss)/income |
- |
- |
- |
(188) |
22 |
130 |
(110) |
(146) |
15 |
(131) |
|
Issue of new shares |
- |
3,457 |
- |
- |
- |
- |
- |
3,457 |
- |
3,457 |
|
Share-based payments |
- |
- |
- |
- |
- |
- |
48 |
48 |
- |
48 |
|
Purchase of ESOP trust shares |
- |
- |
- |
- |
- |
- |
(25) |
(25) |
- |
(25) |
|
Acquired through business combination |
- |
- |
- |
- |
- |
- |
- |
- |
1,548 |
1,548 |
|
Dividends paid |
- |
- |
- |
- |
- |
- |
(199) |
(199) |
- |
(199) |
|
At 31 December 2024 |
171 |
3,728 |
8 |
(185) |
26 |
133 |
807 |
4,688 |
1,563 |
6,251 |
1 The increase in the merger reserve represents the difference between the fair value and nominal value of the shares issues as consideration for the acquisition of the Wintershall Dea assets.
2 Disclosed net of deferred tax.
Consolidated statement of cash flows
For the year ended 31 December 2024
|
Note |
2024 $ million |
2023 As restated $ million |
|
|
Net cash flows from operating activities |
29 |
1,615 |
2,150 |
|
Investing activities |
|||
|
Expenditure on exploration and evaluation assets |
(359) |
(202) |
|
|
Expenditure on property, plant and equipment |
12 |
(884) |
(496) |
|
Expenditure on non-oil and gas intangible assets |
(42) |
(20) |
|
|
Expenditure on other intangible assets |
(37) |
(81) |
|
|
Acquisition of subsidiaries, net of cash acquired |
14 |
(1,044) |
- |
|
Finance income received |
76 |
93 |
|
|
Other receipts |
13 |
13 |
|
|
Net cash flows used in investing activities |
(2,277) |
(693) |
|
|
Financing activities |
|||
|
Repurchase of shares |
- |
(249) |
|
|
Proceeds from new borrowings - revolving credit facility |
29 |
2,225 |
- |
|
Proceeds from new borrowings - reserves based lending facility |
29 |
178 |
660 |
|
Proceeds from bridge facility |
29 |
1,500 |
- |
|
Proceeds from bond issuance net of transaction costs |
29 |
1,720 |
- |
|
Payments of principal portion of lease liabilities |
(265) |
(207) |
|
|
Interest paid on lease liabilities |
(54) |
(52) |
|
|
Repayment of revolving credit facility |
29 |
(1,975) |
- |
|
Repayment of reserves based lending facility |
29 |
(178) |
(1,435) |
|
Repayment of bridge facility |
29 |
(1,500) |
- |
|
Repayment of exploration financing facility |
- |
(11) |
|
|
Repayment of financing arrangement |
29 |
(17) |
(21) |
|
Purchase of ESOP trust shares |
(25) |
(12) |
|
|
Interest paid and bank charges |
(181) |
(150) |
|
|
Dividends paid to shareholders |
31 |
(199) |
(190) |
|
Net cash inflow/(outflow) from financing activities |
1,229 |
(1,667) |
|
|
Net increase/(decrease) in cash and cash equivalents |
567 |
(210) |
|
|
Net foreign exchange difference |
(37) |
(4) |
|
|
Reclassification of Vietnam cash as asset held for sale |
(11) |
- |
|
|
Cash and cash equivalents at 1 January |
286 |
500 |
|
|
Cash and cash equivalents at 31 December |
805 |
286 |
Notes to the condensed consolidated financial statements
1. Corporate information
Harbour Energy plc is a limited liability company incorporated in Scotland and listed on the London Stock Exchange. The address of the registered office is 4th Floor, Saltire Court, 20 Castle Terrace, Edinburgh, EH1 2EN, United Kingdom.
The consolidated financial statements of Harbour Energy plc (Harbour or the company) and all its subsidiaries (the Group) for the year ended 31 December 2024 were authorised for issue by the board of directors on 5 March 2025.
On 3 September 2024, the Group completed the acquisition of substantially all of Wintershall Dea's upstream oil and gas assets, including those in Norway, Germany, Denmark, Argentina, Mexico, Egypt, Libya and Algeria as well as Wintershall Dea's CCS licences in Europe. Under IFRS 3 Business Combinations, the Group is the legal and accounting acquirer as it obtained control over the Wintershall Dea portfolio through the business combination: as it was the entity that issued equity and paid cash to effect the business combination; at completion then existing Harbour Energy shareholders held a majority of voting ordinary shares; and from completion, day-to-day management of the enlarged group has been led by existing Harbour Energy personnel, with no change to the executive directorship.
The Group has designated 1 September 2024 as the acquisition date (beginning of month) rather than the actual acquisition date of 3 September 2024 (during the month) as the events between the designated acquisition date and the actual acquisition date do not result in material changes in the amounts recognised.
The acquired Wintershall Dea portfolio results are fully consolidated in the financial statements from 1 September 2024, and all results prior to this date represent those of the legacy Harbour group only.
The Group's principal activities are the acquisition, exploration, development and production of oil and gas reserves in Norway, the UK, Germany, Mexico, Argentina, North Africa and Southeast Asia.
2. Material accounting policies
Basis of preparation
The consolidated financial statements have been prepared on a going concern basis in accordance with UK-adopted International Accounting Standards (IAS) in conformity with the requirements of the Companies Act 2006. The analysis used by the directors in adopting the going concern basis considers the various plans and commitments of the Group as well as various sensitivity and reverse stress test analyses. The results from the severe but plausible downside sensitivities and reverse stress tests with regard to production and commodity price assumptions, which in management's view reflect two of the principal risks, indicate that material changes within one year that would impact the going concern basis of preparation are remote.
In 2023, the Vietnam Business Unit was classified as an asset held for sale however because this deal did not complete the prior year accounts have been restated to classify the assets and liabilities back to their original balance sheet line items.
The presentation currency of the Group financial information is US dollars and all values in the Group financial information are presented in millions ($ million) and all values are rounded to the nearest 1 million, except where otherwise stated.
The financial statements have been prepared on the historical cost basis, except for certain financial assets and liabilities, including derivative financial instruments, which have been measured at fair value.
The accounting policies which follow set out those policies which apply in preparing the financial statements for the year ended 31 December 2024. All accounting policies are consistent with those adopted and disclosed in Harbour's 2023 Annual Report & Accounts.
Basis of consolidation
The consolidated financial statements comprise the financial statements of the company and its subsidiaries as at 31 December 2024. Subsidiaries are those entities over which the Group has control. Control is achieved where the Group has the power over the subsidiary, has rights, or is exposed to variable returns from the subsidiary and has the ability to use its power to affect its returns. All subsidiaries are 100 per cent owned by the Group, except for four entities holding interests in operations in North Africa and CCS projects which are accounted for as joint operations.
Profit or loss and each component of other comprehensive income (OCI) are attributed to the equity holders of the company and to the subordinated notes investors.
If the Group loses control over a subsidiary, it derecognises the related assets (including goodwill), liabilities, non-controlling interest and other components of equity, while any resultant gain or loss is recognised in profit or loss. Any investment retained is recognised at fair value.
The results of subsidiaries acquired or disposed of during the year are included in the income statement from the effective date of acquisition or up to the effective date of disposal, as appropriate. Where necessary, adjustments are made to the financial statements of subsidiaries acquired to bring the accounting policies used into line with those used by other members of the Group.
All intra-group transactions and balances have been eliminated on consolidation.
Prior year adjustment
In August 2023, Harbour announced that it had entered into a sale and purchase agreement (SPA) to sell its business in Vietnam, which holds its 53.125 per cent interest in Chim Sáo and Dua producing fields to Big Energy Joint Stock Company for a consideration of $84 million. At 31 December 2023, the assets and liabilities of Vietnam were classified as assets held for sale (AHFS). The transaction, which had a long-stop date of 10 May 2024, could not be completed within the required timeframe, and was subsequently terminated on 13 May 2024, and as a result the Vietnam business was no longer classified as AHFS. The relevant amounts presented as AHFS in the 31 December 2023 consolidated financial statements have been reclassified. Each of the affected financial statement line items has been restated and the impact is summarised in the following table.
Balance sheet at 31 December 2023
|
As previously reported $ million |
Adjustments $ million |
As restated $ million |
|
|
Non-current assets |
|||
|
Property, plant and equipment |
4,717 |
119 |
4,836 |
|
Right-of-use assets |
587 |
45 |
632 |
|
Other receivables |
184 |
125 |
309 |
|
Current assets |
|||
|
Inventories |
200 |
17 |
217 |
|
Trade and other receivables |
832 |
41 |
873 |
|
Cash and cash equivalents |
280 |
6 |
286 |
|
Assets held for sale |
334 |
(334) |
- |
|
Equity |
|||
|
Retained earnings |
1,080 |
13 |
1,093 |
|
Non-current liabilities |
|||
|
Provisions |
3,818 |
87 |
3,905 |
|
Deferred tax |
1,260 |
37 |
1,297 |
|
Lease creditor |
474 |
78 |
552 |
|
Current liabilities |
|||
|
Trade and other payables |
886 |
29 |
915 |
|
Lease creditor |
199 |
17 |
216 |
|
Liabilities directly associated with the assets held for sale |
242 |
(242) |
- |
From the point of classification as AHFS in August 2023, no depreciation was recorded. In addition, at 31 December 2023, a pre-tax impairment of $38 million was recognised as the fair value less cost to sell was below the carrying amount of the disposal group. As a result of the reclassification from AHFS, the impairment of $38 million has been reversed and additional depreciation covering the period August 2023 to December 2023 has been recorded, on property, plant and equipment of $14 million and on right-of-use assets of $5 million, with net deferred tax of $6 million associated with the impairment reversal and depreciation. As a result of the above adjustments, retained earnings increased by $13 million.
In December 2024, the Group entered into an exclusivity agreement to sell its business in Vietnam to EnQuest for a consideration of $84 million. The transaction has an effective date of 1 January 2024. As a result, the assets and liabilities of Vietnam have been classified as held for sale as at 31 December 2024 (see note 18).
Significant accounting judgements and estimates
The preparation of the Group's financial statements in conformity with UK-adopted IAS requires management to make judgements, estimates and assumptions at the date of the financial statements. Estimates and assumptions are continuously evaluated and are based on management experience and other factors, including expectations of future events that are believed to be reasonable under the circumstances. Uncertainty about these assumptions and estimates could result in outcomes that require a material adjustment to the carrying amount of the assets or liabilities affected in future periods.
In preparing these financial statements, management has made judgements and estimates that affect the application of accounting policies and the reported amounts of assets and liabilities, income and expenses including those that have the potential to materially impact the balance sheet over the next twelve months. Actual results may differ from these estimates.
The significant judgements made by management in applying the Group's accounting policies, and the key sources of estimation uncertainty, were the same as those described in Harbour's 2023 Annual Report & Accounts, with the addition of the purchase price allocation that involved a number of judgements in regard to assessing the fair value of assets and liabilities acquired from Wintershall Dea.
Judgements
|
§ |
Significant accounting judgements considered by the Group are: |
|
§ |
The carrying value of intangible exploration and evaluation assets, in relation to whether commercial determination of an exploration prospect had been reached; |
|
§ |
The carrying value of property, plant and equipment regarding assessing assets for indicators of impairment; |
|
§ |
Decommissioning costs in relation to the timing of when decommissioning would occur; and |
|
§ |
Tax including assessment of risks around tax uncertainties and the recognition of deferred tax assets (see note 8 below). |
Key sources of estimation uncertainty
Details of the Group's critical accounting estimates are set out in these financial statements and are:
|
§ |
Purchase price allocation that involved a number of judgemental estimates in determining the fair values the fair value of assets and liabilities acquired from Wintershall Dea. See note 14 for further information; |
|
§ |
The carrying value of property, plant and equipment and goodwill, where the key assumptions relate to oil and gas prices expected to be realised and the estimation of 2P reserves and production profiles. See notes 10 and 12 for further information; |
|
§ |
Decommissioning costs where the key assumptions relate to the discount and inflation rates applied, applicable rig rates and expected timing of cessation of production (COP) on each field. See note 21 for further information; |
|
§ |
Defined benefit obligations due to volatility arising from actuarial assumptions, such as the discount rate and pension growth. See note 28 for further information; |
|
§ |
The provision for, or disclosure of, areas of uncertainty for tax purposes where the key assumptions are driven by technical analysis corroborated by external advice, and |
|
§ |
Recognition of deferred tax assets and liabilities, where key assumptions relate to oil and gas prices expected to be realised, and production profiles. See note 8 for further information. |
Disclosure regarding the judgements and estimates made in assessing the impact of climate change and the energy transition are described below and references to notes in the financial statements are provided.
The results from downside sensitivities prepared with regard to production and commodity price assumptions, which in management's view reflect the principal risks, indicate that material changes that would impact the carrying amounts of assets and liabilities within the next financial year are unlikely.
Impact of climate change on the financial statements and related disclosures
Judgements and estimates made in assessing the impact of climate change and the energy transition
Harbour monitors global climate change and energy transition developments and plans. Management recognises there is a general high level of uncertainty about the speed and scale of impacts which, together with limited historical information, provides challenges in the preparation of forecasts and plans with a range of possible future scenarios, which may have the potential to materially impact the balance sheet.
The Group's strategic ambition is to achieve Net Zero by 2050 with an interim target of a 50 per cent reduction in Scope 1 and 2 emissions by 2030 against the 2018 baseline. This will be achieved through several opportunities, including operational efficiency improvements, targeted decarbonisation projects and the eventual cessation of production of mature fields. In addition, the company is investing in the development of CCS projects in the UK and Europe.
All new economic investment decisions include the cost of carbon, and opportunities are assessed on their climate-impact potential and alignment with Harbour Energy's net zero aspiration taking into consideration both GHG volumes and intensity. The acquisition during the year has helped to advance our energy transition objective by strategically shifting our portfolio towards natural gas. Over time this move is expected to notably reduce our greenhouse gas intensity on a net equity basis. The corporate modelling that supports the preparation of the financial statements (such as asset and goodwill impairment assessment, going concern and viability, deferred tax asset recoverability) includes project costs related to CCS, certain decarbonisation projects once sanctioned, other activities to reduce gross operated Scope 1 and 2 GHG emissions, the UK and EU Emissions Trading Scheme costs and carbon offset purchases. Emissions reduction incentives are part of staff remuneration through the annual bonus programme.
Climate change and the energy transition have the potential to significantly impact the accounting estimates adopted by management and therefore the valuation of assets and liabilities reported on the balance sheet. On an ongoing basis, management continues to assess the potential impacts on the significant judgements and estimates used in the preparation of the financial statements. Estimates adopted in the financial statements reflect management's best estimate of future market conditions where, in particular, commodity prices can be volatile. Commodity and carbon price curve assumptions are described below noting that there is consideration given to other assumptions, not exhaustively, such as foreign exchange and discount rates. Notwithstanding the challenges around climate change and the energy transition, it is management's view that the financial statements are consistent with the disclosures in the Strategic Report.
This note provides insight into how Harbour has considered the impact on valuations of key line items in the financial statements and how they could change based on the climate change scenarios and sensitivities considered. The scenarios presented show what the possible impact could be on the financial statements considering both high and low commodity and carbon price outlooks plus discount rates range. Importantly, these climate change scenarios do not form the basis of the preparation of the financial statements but rather indicate how the key assumptions that underpin the financial statements would be impacted by the climate change scenarios. They are also designed to challenge management's perspective on the future business environment. It is recognised that the reality of the nature of progress of energy transition will bring greater levels of disruption and volatility than these external scenarios expect and do not represent management's current best estimate.
The financial statements have been prepared using management's current best estimate for the foreseeable future, based on a range of economic forecasts and represented by the Harbour scenario oil price curve. Management regularly reviews these estimates and assumptions to ensure they align with the latest economic conditions and market information.
Property, plant and equipment, and goodwill
Transitioning to lower carbon energy as the energy transition progresses has the potential to significantly impact future commodity and carbon prices which would, in turn, affect the future operating and capital costs, estimates of cessation of production, useful lives, and consequently the recoverable amount of property, plant and equipment and goodwill.
The non-current assets of the Group, particularly goodwill and oil and gas assets within property, plant and equipment, are considered to be the most sensitive to the energy transition. The carrying value of these assets and goodwill notably increased during the year, primarily attributed to the completion of the Wintershall Dea acquisition in the second half of the year.
Depreciation, estimated useful life and risk of stranded assets
The energy transition and the rate of its progression may impact the remaining lifespan of assets. Typically, the Group's oil and gas assets are depreciated using a unit of production method, which is based on the ratio of production in the year to the commercial proven and probable reserves of the field, considering future capital development expenditures.
As at 31 December 2024, the Group's production plans for existing assets indicated that 44 per cent, 18 per cent and nil per cent of the commercial proven and probable reserves would remain by 2030, 2035, and 2050, respectively. Using the unit of production depreciation method, the carrying amounts for the oil and gas assets are depreciated in line with the depletion of reserves. An evaluation of the oil and gas assets as at 31 December 2024 indicated that the oil and gas assets would experience significant additional depreciation by 2030 and near-complete depreciation by 2035, based on the planned depletion of reserves.
This indicates that a substantial portion of proven and probable reserves are anticipated to be produced by 2035, resulting in lower risk of stranded assets being carried in the consolidated balance sheet. The Group's portfolio management approach aims to mitigate the risk of stranded assets in the event of a faster-than-expected structural decline in demand for oil and gas due to tighter environmental regulations, changes in market demands and global energy demand.
Impairment of property, plant and equipment, and goodwill
The important assumptions for impairment testing of goodwill and oil and gas assets applied to the life of fields production and cost profiles include commodity and carbon prices and discount rates. These key assumptions are carefully assessed by management, both in isolation and in aggregate, to ensure there is a fair and balanced view attained with minimal aggregate bias. These assumptions are inherently uncertain and may ultimately diverge from the actual amounts.
During the current year's impairment testing, the Harbour scenario utilised real long-term commodity price assumptions from 2028 for Brent crude at $78 per barrel (2023: $70 per barrel), UK NBP gas at 80 pence per therm (2023: 90 pence per therm), and a European gas price at 2 per cent higher than UK NBP. These were combined with short-term management forecasts reflecting benchmarked consensus and market forward curves at the year end.
Carbon costs are expected to evolve over time and are subject to significant uncertainty due to the rate of transition and the maturity of regulatory frameworks. For the carbon price, Harbour management's real forward price curve assumption in 2024 is $72 per tonne (2023: $63 per tonne), projected to increase to $182 per tonne (2023: $175 per tonne) by 2030. Sensitivity analysis was conducted using the IEA Net Zero carbon price curve, with a flat assumed foreign exchange rate of pound sterling to US dollar rate of £1:$1.30.
Sensitivity to changes in commodity price assumptions
Sensitivity analyses on the impairment of oil and gas assets and goodwill have been conducted using different commodity price scenarios to demonstrate the potential impact on their net book carrying values. It should be noted that the financial statements are based on the Harbour scenario. Impairment sensitivities have been developed using average -10 per cent and +10 per cent deviations from the Harbour scenario long-term crude and gas prices as well as selected published climate change price curves.
The sensitivity scenarios described below incorporate changes to the commodity price assumptions and assume that all other factors remain unchanged from the Harbour scenario used for the basis of preparation of the financial statements. Importantly, these sensitivities are stated before any management mitigation actions to manage downside risks if the scenarios were to occur.
The Sustainability review within the Annual Report, which will be released on 27 March 2025, discusses both transition and physical risk climate change scenarios. This analysis covers the transition risks and the graphs below show the crude oil, UK NBP gas price curves and European TTF gas price for the period to 2050 for the following IEA scenarios: Net Zero Emissions by 2050, Stated Policies and Announced Pledges.
All the scenario price curves are dependent on factors covering supply, demand, economic and geopolitical events and therefore are inherently uncertain and subject to significant volatility and hence unlikely to reflect the future outcome.
|
§ |
Harbour scenario: base price curves used for impairment testing |
|
§ |
IEA Net Zero Emissions by 2050 (NZE): pathway to limiting global temperature rise to 1.5ºC |
|
§ |
IEA Stated Policies Scenario (STEPS): pathway based on existing policy commitments and measures and those currently under development by sector and country |
|
§ |
IEA Announced Pledges Scenario (APS): pathway based on current climate ambitions and targets by governments and industries regardless of whether these have been legislated |
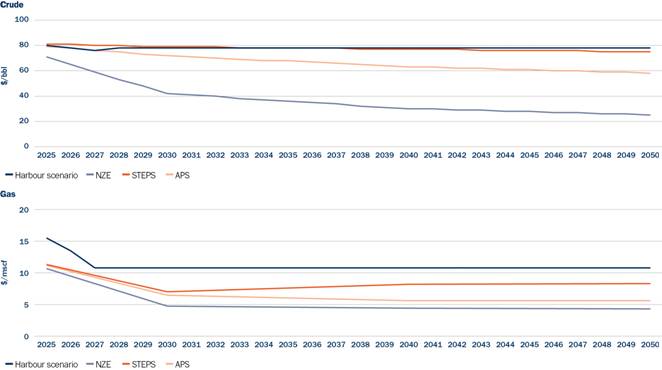
The crude price curves reflect the published IEA price curves for all periods. For UK NBP there are no IEA published price curves therefore management has derived the gas price curves by converting from the published IEA European gas price curve. This was achieved by converting from USD per mbtu to pence per therm and applying other known correlation coefficients between the European and UK gas markets. In addition, for the period 2025-2027, the derived gas price curve matches the Harbour scenario price curve to create a scenario that was considered reasonably plausible.
Pre-development assets are recorded in other intangible assets ahead of demonstration of commerciality and recognition of 2P reserves and hence are not included below, however they are subject to the same management rigour with the corporate models. The majority of such assets are in developing countries with a growing future demand for energy which may reduce the climate change impact from these pre-development assets.
The impact of the sensitivities on the carrying value of oil and gas assets and goodwill in the consolidated balance sheet are shown in the table below.
31 December 2024
|
Commodity |
Carrying value |
Pre-tax sensitivity in carrying value |
||||||
|
+10% price to Harbour scenario |
-10% price to Harbour scenario |
IEA Net Zero Emissions by 2050 (NZE) |
IEA Stated |
IEA Announced Pledges |
||||
|
Goodwill (note 10) |
Crude oil |
5,147 |
- |
(45) |
(928) |
- |
(38) |
|
|
Gas |
- |
(37) |
(1,431) |
(997) |
(1,114) |
|||
|
Oil and gas assets (note 12) |
Crude oil |
14,458 |
- |
(323) |
(2,528) |
- |
(415) |
|
|
Gas |
- |
(2) |
(131) |
(89) |
(35) |
|||
31 December 2023
|
Commodity |
Carrying value |
Pre-tax sensitivity in carrying value |
||||||
|
+10% price to Harbour scenario |
-10% price to Harbour scenario |
IEA Net Zero Emissions by 2050 (NZE) |
IEA Stated |
IEA Announced Pledges |
||||
|
Goodwill (note 10) |
Crude oil |
1,302 |
- |
- |
- |
- |
- |
|
|
Gas |
- |
(4) |
- |
- |
- |
|||
|
Oil and gas assets (note 12) |
Crude oil |
4,822 |
- |
(86) |
(221) |
- |
- |
|
|
Gas |
- |
(21) |
(9) |
- |
- |
|||
The 2024 results and sensitivities are dominated by the acquired Wintershall Dea portfolio which has substantially increased the goodwill and property, plant and equipment carrying values.
The +/-10 per cent price curves used in the Harbour scenarios adjust long-term prices from 2028.
Under the -10 per cent price to Harbour scenario for crude, there is a pre-tax impairment to oil and gas assets of $323 million and on goodwill an impairment of $45 million. For gas a pre-tax impairment of $2 million and on goodwill an impairment of $37 million.
For crude, under the IEA NZE 2050 scenario, there is a pre-tax impairment to oil and gas assets on of $2,528 million and on goodwill an impairment of $928 million. For gas, there is a pre-tax impairment to oil and gas assets of $131 million and on goodwill an impairment of $1,431 million.
For crude, under the IEA STEPS scenario, there is no pre-tax impairment to oil and gas assets or goodwill. For gas, there is a pre-tax impairment to oil and gas assets of $89 million and on goodwill an impairment of $997 million.
For crude, under the IEA APS scenario, there is a pre-tax impairment to oil and gas assets on of $415 million and on goodwill an impairment of $38 million. For gas there is a pre-tax impairment to oil and gas assets of $35 million and on goodwill an impairment of $1,114 million.
Sensitivity to changes in carbon price assumptions
The sensitivity scenarios described below incorporate changes to the carbon price assumptions and assume that all other factors remain unchanged from the Harbour scenario used for the basis of preparation of the financial statements. This sensitivity is stated before any management mitigation actions to manage downside risks if the scenarios were to occur.
The risk of stranded assets may increase in a higher carbon price scenario. Sensitivity analyses of the carrying value of Harbour's oil and gas assets and goodwill to carbon prices have been conducted based on the IEA NZE 2050 scenario. This aims to demonstrate the resilience of the assets' carrying values to higher long-term carbon prices than those reflected in the consolidated balance sheet.
This analysis covers the transition risks, and the graphs below show the carbon price per tonne for the period to 2050 for the IEA NZE 2050 scenario.
The scenario price curves are dependent on factors covering supply, demand, economic and geopolitical events and therefore are inherently uncertain and subject to significant volatility. As a result, they are unlikely to accurately predict future outcomes.
|
§ |
Harbour scenario: base price curves used for impairment testing |
|
§ |
IEA Net Zero Emissions by 2050 (NZE): pathway to limiting global temperature rise to 1.5°C |
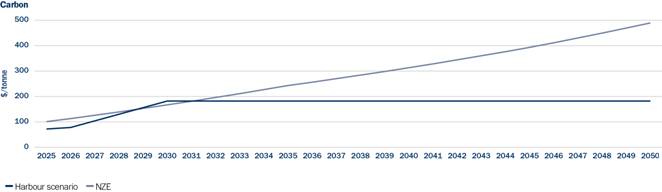
Applying the IEA NZE 2050 carbon price scenario for the entirety of the useful economic life of the assets resulted in a pre-tax impairment of $9 million (2023: $27 million) to oil and gas assets with no impairment to goodwill under this scenario.
Sensitivity to changes in discount rate assumptions
The discount rate applied for impairment testing of the fair value less cost of disposal is based on a nominal post-tax weighted average cost of capital (WACC) after considering both cost of debt and equity. In 2024, the Group's post-tax discount rate ranging from 8.75 per cent to 14.5 per cent (2023: 9.0 per cent to 12.4 per cent) is derived after considering relevant peer group's post-tax WACC and incorporating segment-specific risk.
Considering the discount rates, the Group deems a 1 per cent rise in the discount rate to be a reasonable potentiality for conducting sensitivity analysis, assuming that all other factors utilised in calculating the recoverable value for the carrying amount of goodwill and oil and gas assets remain unaltered.
A 1 per cent increase in the discount rate would result in an additional impairment of $113 million (2023: $24 million) to the oil and gas assets and on goodwill $10 million (2023: $1 million), and a 1 per cent decrease in the discount rate would have no impact on the impairment charge.
Intangible assets - exploration and evaluation assets
The energy transition has the potential to affect the future development or viability of exploration and evaluation prospects. A significant portion of the Group's exploration and evaluation assets relate to prospects that could either be tied back to existing infrastructure or are in developing countries with a growing future demand for energy which may reduce the climate change impact from these pre-development assets and hence require less capital investment as these assets are less exposed to the impacts of the energy transition compared to large frontier developments. At each balance sheet date, all exploration and evaluation prospects are reviewed against the Group's financial framework to ensure that the continuation of activities is planned and expected. There are no significant judgements and/or critical estimation uncertainty related to climate factors.
See Judgements: Exploration and evaluation expenditure and note 11 to the financial statements for further information.
Deferred tax assets
The potential impact of climate change and energy transition on balance sheet items is uncertain and may lead to significant changes in the estimations of parameters such as the useful life of assets and timing of cessation of production together with their related deferred tax balances.
Deferred tax assets are recognised to the extent that their recovery is considerable probable. In general, it is expected that sufficient forecasted taxable profits will be available for the recovery of deferred tax assets recognised at 31 December 2024 and expected to be recovered within the period of production for each asset and after taking into account deferred tax liabilities.
See note 8 Income Taxes for information on deferred tax balances.
Onerous contracts
Contracts may become onerous due to potential loss of revenue or heightened costs stemming from changes in climate change and energy transition regulations.
Management does not foresee any of its existing supply contracts becoming onerous based on the current production level and estimated useful lives of its assets.
Decommissioning cost and provisions
The energy transition may accelerate the decommissioning of assets which would result in an increase in the carrying value of associated decommissioning provisions. Whilst the Group currently expects to incur decommissioning costs over the next 40 years, we anticipate the majority of costs will be incurred between the next 10 to 20 years which will reduce the exposure to the impact of the energy transition.
In the current year, the undiscounted provision for decommissioning and restoration was $10.5 billion (2023: $6.6 billion), recognised on a discounted basis in the consolidated balance sheet.
The discount and inflation rates applied have taken into consideration the applicable rig rates and expected timing of cessation of production on each field. Therefore, the timing of decommissioning expenditures has not been materially brought forward and management do not consider that any reasonable change in the timing of decommissioning expenditure will have a material impact on the decommissioning provisions based on the production plans of existing assets.
Decommissioning cost estimates are based on the current regulatory and external environment. These cost estimates and recoverability of associated deferred tax may change in the future, including as a result of the energy transition. On the basis that all other assumptions in the calculation remain the same, a 10 per cent increase in the cost estimates, and a 10 per cent reduction in the applied discount rates used to assess the final decommissioning obligation, would result in increases to the decommissioning provision of approximately $852 million (2023: $456 million) and $286 million ($440 million), respectively. This change would be principally offset by a change to the value of the associated asset unless the asset is fully depreciated, in which case the change in estimate is recognised directly within the income statement.
See Key sources of estimation uncertainty: Decommissioning costs for further information.
Portfolio changes
Harbour expensed $75 million of costs in relation to CO2 emissions during 2024 (2023: $69 million) with the majority in relation to the UK Emissions Trading Scheme quotas net of allocated free quotas. Quotas in relation to future periods are recognised in intangible assets.
Harbour has investments in a number of CCS projects which are regarded as key to assisting in the energy transition. Projects are recognised in intangible assets once the projects are regarded as technically feasible and commercially viable; prior to this, costs are expensed to the income statement. In 2024 Harbour spent $72 million on CCS activities, capitalising $33 million and expensing $39 million.
Global oil and gas demand considerations
The transition to sustainable energy to mitigate climate change carries the potential to adversely impact commodity prices due to a global decrease in the demand for oil and gas, potentially leading to reduced revenue. Furthermore, investment in clean energy via the adoption of clean energy technologies could elevate production costs, thereby diminishing future profit margins.
Based on prevailing policies and regulatory frameworks, it is anticipated that the growth in global oil demand will decrease, but the demand for oil and gas is projected to continue as a crucial component of the energy mix for the foreseeable future. Natural gas is widely known as a key transition fuel. In the 2024 IEA World Energy Outlook report the demand for natural gas has been revised upwards in all scenarios compared to the previous year, reflecting stronger anticipated demand for gas to meet growth in electricity demand.
During the year, the Group produced 258 kboepd (2023: 186 kboepd), accounting for less than 0.3 per cent of global production. Consequently, the Group does not expect the ability to sell the volume of oil equivalent produced to be directly impacted by shifts in global oil and gas demand. Management remains committed to investing in a diversified oil and gas company.
Cost of carbon allowances
Harbour is part of the European and UK Emissions Trading Schemes (EU and UK ETS) and purchases carbon allowances to meet its regulatory obligations under the schemes. Harbour is entitled to receive a share of free allowances according to UK and EU ETS regulations. Allowances owned in excess of liabilities to date that are available to be used in future periods are recorded in other intangible assets and measured at cost. The costs for purchasing allowances are recorded in costs of operations matching emissions for the period. Accruals that are required for allowances to be purchased are measured at market price.
Segment reporting
The Group's activities consist of one class of business being the acquisition, exploration, development and production of oil and gas reserves and related activities and are split geographically and managed in nine Business Units: namely Norway, the UK, Germany, Mexico, Argentina, North Africa, Southeast Asia, CCS and Corporate.
Joint arrangements
A joint arrangement is one in which two or more parties have joint control. Joint control is the contractually agreed sharing of control of an arrangement, which exists only when decisions about the relevant activities require the unanimous consent of the parties sharing control.
Exploration and production operations are usually conducted through joint arrangements with other parties. The Group reviews all joint arrangements and classifies them as either joint operations or joint ventures depending on the rights and obligations of each party to the arrangement and whether the arrangement is structured through a separate vehicle. The Group's interest in joint operations, such as exploration and production arrangements, are accounted for by recognising its:
|
§ |
Assets, including its share of any assets held jointly |
|
§ |
Liabilities, including its share of any liabilities incurred jointly |
|
§ |
Revenue from the sale of its share of the output arising from the joint operation |
|
§ |
Share of the revenue from the sale of the output by the joint operation |
|
§ |
Expenses, including its share of any expenses incurred jointly |
A joint venture, which normally involves the establishment of a separate legal entity, is a contractual arrangement whereby the parties that have joint control of the arrangement have the rights to the arrangement's net assets. The results, assets and liabilities of a joint venture are incorporated in the consolidated financial statements using the equity method of accounting. During 2023, the Group did not have any interests in joint ventures. Note 33 describes the Group's interests in joint arrangements as at 31 December 2024.
Where the Group transacts with its joint operations, unrealised profits and losses are eliminated to the extent of the Group's interest in the joint operation.
Foreign currency translation
Each entity in the Group determines its own functional currency, being the currency of the primary economic environment in which the entity operates, and items included in the financial statements of each entity are measured using that functional currency.
The consolidated financial statements are presented in US dollars, which is also the parent company's functional currency.
Transactions recorded in foreign currencies are initially recorded in the entity's functional currency by applying an average rate of exchange. Monetary assets and liabilities denominated in foreign currencies are retranslated at the functional currency rate of exchange ruling at the reporting date. All differences are taken to the income statement.
Non-monetary assets and liabilities denominated in foreign currencies are measured at historic cost based on exchange rates at the date of the initial transaction and subsequently not retranslated.
On consolidation, the assets and liabilities of the Group's operations are translated at exchange rates prevailing on the balance sheet date. Income and expense items are translated at the average monthly exchange rates for the year. Equity is held at historic cost and is not retranslated. The resulting exchange differences are recognised as other comprehensive income and are transferred to the Group's currency translation reserve.
When an overseas operation is disposed of, such translation differences relating to it are recognised as income or expense.
Goodwill arising on the acquisition of a foreign operation and any fair value adjustments to the carrying amounts of assets and liabilities arising on the acquisition are treated as assets and liabilities of the foreign operation and translated at the closing rate.
Goodwill
In the event of a business combination or acquisition of an interest in a joint operation in which the activity constitutes a business, as defined in IFRS 3 Business Combinations, the acquisition method of accounting is applied. Goodwill represents the difference between the aggregate of the fair value of purchase consideration transferred at the acquisition date and the fair value of the identifiable assets, liabilities and contingent liabilities acquired, less any non-controlling interest. If however, the fair value of the purchase consideration transferred is lower than the fair value of the identifiable assets and liabilities acquired, less non-controlling interest, the difference is recognised in the income statement as negative goodwill. The Group's goodwill is related to the requirement to recognise deferred tax for the difference between the assigned fair values and the related tax base ('technical goodwill'). The fair value of the Group's licences are based on post-tax cash flows or benchmarked multiples. In accordance with IAS 12 paragraphs 15 and 24, a provision is made for deferred tax corresponding to the difference between the acquisition cost and the transferred tax depreciation basis. The offsetting entry to this deferred tax is goodwill. Hence, goodwill arises as a technical effect of deferred tax. Goodwill is initially measured at cost. Following initial recognition, goodwill is measured at cost less any accumulated impairment. Goodwill acquired in a business combination is, from the acquisition date, allocated to each of the Group's operating segments. This is subsequently tested for impairment at the Group's operating segment level based on the aggregation of any headroom arising from asset impairment tests. Goodwill is treated as an asset of the relevant entity to which it relates, and accordingly non-US dollar goodwill is translated into US dollars at the closing rate of exchange at each reporting date.
Goodwill, as disclosed in note 10, is not amortised but is reviewed for impairment at least annually by assessing the recoverable amount of the operating segments to which the goodwill relates. Where the carrying amount of the operating segment and related goodwill is higher than the recoverable amount of the operating segment, an impairment loss is recognised in the income statement. The recoverable amounts of the operating segments have been determined on a fair value less costs to sell basis. Impairments are expected to arise as the deferred tax that gave rise to the goodwill initially naturally unwinds in the normal course of business. Impairment losses relating to goodwill cannot be reversed in future periods.
Pre-licence costs
Pre-licence costs are expensed in the period in which they are incurred.
Licence and property acquisition costs
Licence and property acquisition costs paid in connection with a right to explore in an existing exploration area are capitalised as exploration and evaluation costs within intangible assets.
Licence and property acquisition costs are reviewed at each reporting date to confirm that there is no indication that the carrying amount exceeds the recoverable amount. If no future activity is planned or the related licence has been relinquished or has expired, the carrying value of the property acquisition costs is written off through the income statement. Upon recognition of proved reserves and internal approval for development, the relevant expenditure is transferred to oil and gas properties within development and production assets.
Exploration and evaluation costs
Once the legal right to explore has been acquired, costs directly associated with the exploration are capitalised as exploration and evaluation (E&E) intangible non-current assets until the exploration is complete and the results have been evaluated. If no potential commercial resources are discovered, the exploration asset is written off.
All such capitalised costs are subject to technical, commercial and management review, as well as review for indicators of impairment at least annually. This is to confirm the continued intent to develop or otherwise extract value from the discovery. When this is no longer the case, the costs are written off through the income statement.
When proved reserves of oil or natural gas are identified and development is sanctioned by management, the relevant capitalised expenditure is first assessed for impairment and, if required, any impairment loss is recognised, then the remaining balance is transferred to oil and gas properties within development and production assets. No amortisation is charged during the exploration and evaluation phase.
Farm-outs - in the exploration and evaluation phase
The Group does not record any expenditure made by the farmee on its account. It also does not recognise any gain or loss on its exploration and evaluation farm-out arrangements but re-designates any costs previously capitalised in relation to the whole interest as relating to the partial interest retained. Any cash consideration received directly from the farmee is credited against costs previously capitalised in relation to the whole interest with any excess accounted for by the farmor as a gain on disposal.
Property, plant and equipment - oil and gas assets
Oil and gas development and production assets are accumulated generally on a field-by-field or cash-generating unit basis where infrastructure is shared. This represents expenditure on the construction, installation or completion of infrastructure facilities such as platforms, pipelines and the drilling of development wells, including E&E expenditures incurred in finding commercial reserves transferred from intangible E&E assets, as outlined in the intangible asset policy above, which is capitalised as oil and gas properties within development and production assets.
The initial cost of an asset comprises its purchase price or construction cost, any costs directly attributable to bringing the asset into operation, the initial estimate of the decommissioning obligation and, for qualifying assets, where relevant, borrowing costs. The purchase price or construction cost is the aggregate amount paid and the fair value of any other consideration given to acquire the asset.
An item of development and production expenditure and any significant part initially recognised is derecognised upon disposal or when no future economic benefits are expected. Any gain or loss arising on derecognition of the asset (calculated as the difference between the net disposal proceeds and the carrying amount of the asset) is included in the income statement.
Expenditure on major maintenance includes refits, inspections or repairs comprising the cost of replacement assets or parts of assets, inspection costs and overhaul costs. Where an asset, or part of an asset, that was separately depreciated and is now written off is replaced and it is probable that future economic benefits associated with the item will flow to the Group, the expenditure is capitalised. All other day-to-day repairs and maintenance costs are expensed as incurred.
Depreciation, depletion and amortisation (DD&A) of oil and gas assets
All costs relating to a development are accumulated and not depreciated until the commencement of production. Depreciation is provided generally on a field-by-field or cash-generating unit basis where infrastructure is shared, using the unit of production method by reference to the ratio of production in the year and the related commercial proven and probable reserves of the field, considering future development expenditures necessary to bring those reserves into production.
When there is a change in the estimated total recoverable proven and probable reserves of a field, that change is accounted for in the depreciation charge over the revised remaining proven and probable reserves.
Acquisitions, asset purchases and disposals
Acquisitions of oil and gas properties are accounted for using the acquisition method when the assets acquired, and liabilities assumed constitute a business.
Transactions involving the purchase of an individual field interest, or a group of field interests, which do not constitute a business, are treated as asset purchases irrespective of whether the specific transactions involve the transfer of the field interests directly or the transfer of an incorporated entity. Accordingly, no goodwill and no deferred tax gross up arises, and the consideration is allocated to the assets and liabilities purchased on an appropriate basis.
Proceeds on disposal are applied to the carrying amount of the specific intangible asset or oil and gas property disposed of and any surplus is recorded as a gain on disposal in the income statement.
Decommissioning
A provision for decommissioning is recognised in full when the related facilities are installed. The amount recognised is the present value of the estimated future expenditure. A corresponding amount equivalent to the provision is also recognised as part of the cost of the related oil and gas property. This is subsequently depreciated as part of the capital costs of the production facilities. Any change in the present value of the estimated expenditure is dealt with from the start of the financial year as an adjustment to the opening provision and the oil and gas property. The unwinding of the discount is included as a finance cost.
Non-oil and gas assets
Property, plant and equipment - fixtures and fittings and office equipment
Fixtures and fittings and office equipment are stated at cost less accumulated depreciation and impairment. Depreciation is provided for on a straight-line basis at rates sufficient to write off the cost of the assets less any residual value over their estimated useful economic lives. The depreciation periods for the principal categories of assets are as follows:
|
§ |
Buildings |
Up to 50 years |
|
§ |
Fixtures and fittings |
Up to 10 years |
|
§ |
Office furniture and equipment |
Up to 5 years |
Intangible assets
Intangible assets principally comprise IT software/licences and carbon allowances. IT software/licences are carried at cost less any accumulated amortisation. These assets are amortised on a straight-line basis over their useful economic lives of between three and ten years. Carbon allowances are carried at cost and subject to impairment testing.
Impairment of non-current assets (excluding goodwill)
In accordance with IAS 36 Impairment of Assets, impairment tests are carried out on items of property, plant and equipment and intangible assets where there is an indicator of impairment, or an indicator identified that a prior year impairment may have reversed or decreased. Such indications may be based on events or changes in the market environment, or on internal sources of information.
Impairment and reversal indicators
Property, plant and equipment and intangible assets with finite useful lives are only tested for impairment when there is an indication that they may be impaired. This is generally the result of significant changes to the environment in which the assets are operated or when asset performance is significantly lower than expected.
The main impairment indicators used by the Group are described below:
|
§ |
External sources of information: |
|
− |
− Significant changes in the economic, technological, political or market environment in which the entity operates or to which an asset is dedicated |
|
− |
− Fall in demand |
|
− |
− Changes in commodity prices and exchange rates |
|
§ |
Internal sources of information: |
|
− |
− Evidence of obsolescence or physical damage |
|
− |
− Significantly lower than expected production or cost performance |
|
− |
− Reduction in reserves and resources, including as a result of unsuccessful results of drilling operations |
|
− |
− Pending expiry of licence or other rights |
|
− |
− In respect of capitalised exploration and evaluation costs, lack of planned future activity on the prospect or licence |
|
− |
− For reversals, plausible downside sensitivity scenarios are run to test the robustness of the asset carrying values typically against changes in production and commodity prices |
Measurement of recoverable amount
The cash-generating unit (CGU) applied for impairment test purposes is generally the field, except that a number of field interests may be grouped as a single CGU where the cash inflows of each field are interdependent. The carrying value of each CGU is compared against the expected recoverable amount of the asset, which is primarily determined based on the fair value less cost of disposal (FVLCD) method, where the fair value is determined from the estimated present value of the future net cash flows expected to be derived from production of commercial reserves. Standard valuation techniques are used based on the discount rates that reflect the specific characteristics of the operating entities concerned; discount rates are determined on a post-tax basis and applied to post-tax cash flows.
Any impairment loss is recorded in the income statement under 'Impairment of property, plant and equipment'. Impairment losses recorded in relation to property, plant and equipment may be subsequently reversed if the recoverable amount of the assets subsequently increases above carrying value. The increased carrying amount of an item of property, plant or equipment attributable to a reversal of an impairment loss may not exceed the carrying amount that would have been determined (net of depreciation/amortisation) had no impairment loss been recognised in prior periods.
Non-current assets held for sale and discontinued operations
The Group classifies non-current assets and disposal groups as assets held for sale if their carrying amounts will be recovered principally through a sale transaction rather than through continuing use. Non-current assets and disposal groups classified as held for sale are measured at the lower of their carrying amount and fair value less costs to sell. Costs to sell are the incremental costs directly attributable to the disposal group, excluding finance costs and income tax expense. The criteria for held for sale classification is regarded as met only when the sale is highly probable, and the asset or disposal group is available for immediate sale in its present condition. Management must be committed to the plan to sell the asset and the sale expected to be completed within one year from the date of the classification. Actions required to complete the sale should indicate that it is unlikely that significant changes to the sale will be made or that the decision to sell will be withdrawn. Property, plant and equipment and intangible assets are not depreciated or amortised once classified as assets held for sale. Assets and liabilities classified as held for sale are presented separately as current line items in the balance sheet.
Financial assets
The Group uses two criteria to determine the classification of financial assets: the Group's business model and contractual cash flow characteristics of the financial assets. Where appropriate the Group identifies three categories of financial assets: amortised cost, fair value through profit or loss (FVTPL), and fair value through other comprehensive income (FVOCI).
Financial assets held at amortised cost
Financial assets held at amortised cost are initially measured at fair value plus transaction and subsequently measured using the effective interest (EIR) method and are subject to impairment. The EIR amortisation is presented within finance income in the income statement.
Cash and cash equivalents
Cash and cash equivalents comprise cash at bank and other short-term highly liquid investments that are held for the purpose of meeting short-term cash commitments, readily convertible to a known amount of cash and are subject to an insignificant risk of changes in value.
Impairment of financial assets
The Group recognises an allowance for expected credit losses (ECLs) for all debt instruments not held at FVTPL. ECLs are based on the difference between the contractual cash flows due in accordance with the contract and all the cash flows that the Group expects to receive, discounted at an approximation of the original effective interest rate.
ECLs are recognised in two stages:
|
§ |
12-month ECL: for credit exposures for which there has not been a significant increase in credit risk since initial recognition, ECLs are provided for credit losses that result from default events (payment, prospective or covenant) that are possible within the next 12 months |
|
§ |
Lifetime ECL: for those credit exposures for which there has been a significant increase in credit risk since initial recognition, a loss allowance is required for credit losses expected over the remaining life of the exposure, irrespective of the timing of the default |
For trade receivables and contract assets, the Group applies a simplified approach in calculating ECLs as allowed under IFRS 9: Financial Instruments. Provision rates are calculated based on estimates including the probability of default by assessing counterparty credit ratings, as adjusted for forward-looking factors specific to the debtors, the economic environment and the Group's historical credit loss experience.
Credit impaired financial assets
At each reporting date, the Group assesses whether financial assets carried at amortised cost and debt financial assets carried at FVOCI are credit impaired. A financial asset is 'credit impaired' when one or more events that have a detrimental impact on the estimated future cash flows of the financial asset have occurred.
Evidence that a financial asset is credit impaired includes the following observable data:
|
§ |
Significant financial difficulty of the borrower or issuer |
|
§ |
A breach of contract such as default or past due event |
|
§ |
The restructuring of a loan or advance by the Group on terms that the Group would otherwise not consider |
|
§ |
Becoming probable that the borrower will enter bankruptcy or other financial reorganisation |
|
§ |
The disappearance of an active market for a security because of financial difficulties |
Financial liabilities
Financial liabilities are classified, at initial recognition, as financial liabilities at fair value through profit or loss, loans and borrowings, payables, or as derivatives designated as hedging instruments in an effective hedge, as appropriate. All financial liabilities are recognised initially at fair value and, in the case of loans, borrowings and payables, net of directly attributable transaction costs which are capitalised and amortised over the term of the borrowings. Where borrowings have been fully repaid but the borrowing facility remains, directly attributable transaction costs that remain unamortised are presented within current and/or non-current assets.
Borrowings and loans
Interest-bearing bank loans and overdrafts are recorded at the proceeds received, net of direct issue costs. Finance charges, including premiums payable on settlement or redemption and direct issue costs, are accounted for on an accruals basis in the income statement using the effective interest method and are added to the carrying amount of the instrument to the extent that they are not settled in the year in which they arise.
Subordinated notes
Through the acquisition of the Wintershall Dea portfolio, the Group now holds two series of subordinated resettable fixed rate notes (subordinated notes) in the aggregate principal amount of €1,500 million, which were transferred to Harbour on completion of the acquisition. The subordinated notes are callable three months prior to the first reset date for the NC2026 series and six months prior to the first reset date for the NC2029 series, and have no maturity.
Based on their characteristics (mainly no mandatory repayment and no obligation to pay a coupon except under certain circumstances specified into the documentation of the subordinated notes) and in compliance with IAS 32: Financial Instruments: Presentation, the subordinated notes are wholly classified as equity. On completing the acquisition, the issued subordinated notes are recognised at fair value, based on market rate as of the acquisition date. Accrued interest payable to the subordinated notes investors increases equity, whereas the distribution of interest payments reduces equity.
Derecognition
A financial liability is derecognised when the obligation under the liability is discharged, cancelled, or expires. When an existing financial liability is replaced by another from the same lender on substantially different terms, or the terms of an existing liability are substantially modified, such an exchange or modification is treated as the derecognition of the original liability and the recognition of a new liability. The difference in the respective carrying amounts is recognised in the income statement.
Derivative financial instruments
The Group uses derivative financial instruments such as forward currency contracts, interest rate swaps, commodity option contracts and commodity swap arrangements, to hedge its foreign currency risks, interest rate risks and commodity price risks, respectively. Derivative financial instruments are initially recognised and subsequently remeasured at fair value. Certain derivative financial instruments are designated as cash flow hedges in line with the Group's risk management policies. When derivatives do not qualify for hedge accounting or are not designated as accounting hedges, changes in the fair value of the instrument are recognised within the income statement.
A derivative with a positive fair value is recognised as a financial asset whereas a derivative with a negative fair value is recognised as a financial liability. Derivatives are not offset in the financial statements unless the Group has both a legally enforceable right and intention to offset. A derivative is presented as a non-current asset or a non-current liability if the remaining maturity of the instrument is more than 12 months and it is not due to be realised or settled within 12 months. Other derivatives maturing in less than 12 months and expected to be realised or settled in less than 12 months are presented as current assets or current liabilities.
Cash flow hedges
The effective portion of gains and losses arising from the remeasurement of derivative financial instruments designated as cash flow hedges are deferred within other comprehensive income and subsequently transferred to the income statement in the period the hedged transaction is recognised in the income statement. When a hedging instrument is sold or expires, any cumulative gain or loss previously recognised in other comprehensive income remains deferred until the hedged item affects profit or loss or is no longer expected to occur. Any gain or loss relating to the ineffective portion of a cash flow hedge is immediately recognised in the income statement. Hedge ineffectiveness could arise if volumes of the hedging instruments are greater than the hedged item of production, or where the creditworthiness of the counterparty is significant and may dominate the transaction and lead to losses.
Fair values
Fair value is defined as the price that would be received to sell an asset or paid to transfer a liability in an orderly transaction between market participants at the measurement date. It is determined by reference to quoted market prices adjusted for estimated transaction costs that would be incurred in an actual transaction, or by the use of established estimation techniques such as option pricing models and estimated discounted values of cash flows.
For financial instruments not traded in an active market, the fair value is determined using appropriate valuation techniques.
Under IFRS 9 Financial Instruments, embedded derivatives are not separated from a host financial asset, and are classified based on their contractual terms and the Group's business model.
Equity
Share capital
Share capital includes the total net proceeds, both nominal and share premium, on the issue of ordinary (voting and non-voting) and preference shares of the company.
Merger reserve
On 31 March 2021, Harbour Energy plc (formerly Premier Oil plc) acquired Chrysaor Holdings Limited as part of a reverse acquisition. Under the terms of the merger, Premier legally acquired Chrysaor through the issuance of consideration shares whilst Chrysaor was the acquirer for accounting purposes, primarily as a result of its ability to appoint the Board of the enlarged group. The merger reserve primarily represented Premier's opening balance on the legal reserve plus the fair value of the assets and liabilities acquired by Chrysaor. This was subsequently reduced following a capital restructuring in 2022.
On 3 September 2024, the company acquisition of the Wintershall Dea assets met the conditions to recognise the difference between the fair value and nominal value of the shares issues as consideration as merger reserve.
Capital redemption reserve
The capital redemption reserve represents the nominal value of shares transferred following the company's purchase of them.
Cash flow hedge reserve
The cash flow hedge and cost of hedging reserves represent gains and losses on derivatives classified as effective cash flow hedges. Upon the designation of option instruments as hedging instruments, the intrinsic and time value components are separated, with only the intrinsic component being designated as the hedging instrument and the time value component is deferred in other comprehensive income as a 'cost of hedging'.
Currency translation reserve
This reserve comprises exchange differences arising on consolidation of the Group's operations with a functional currency other than the US dollar.
Share-based payments
The Group has applied the requirements of IFRS 2 Share-Based Payment. The Group has share-based awards that are equity and cash settled as defined by IFRS 2. The fair value of the equity-settled awards has been determined at the date of grant of the award allowing for the effect of any market-based conditions. The fair value determined at the grant date of the equity-settled share-based payments is expensed on a straight-line basis over the vesting period, based on the Group's estimate of shares that will eventually vest and adjusted for the effect of non-market based vesting conditions. For cash-settled awards, a liability is recognised for the goods or service acquired. This is measured initially at the fair value of the liability. The fair value of the liability is subsequently remeasured at each balance sheet date until the liability is settled, and at the date of settlement, with any changes in fair value recognised in the income statement.
Inventories
All inventories, except for petroleum products, are stated at the lower of cost and net realisable value. The cost of materials is the purchase cost, determined on weighted average cost basis. Petroleum products and underlift and overlift positions are measured at net realisable value using an observable year-end oil or gas market price, and are included in other debtors or creditors, respectively.
Leases
Leases are recognised as a right-of-use asset and a corresponding liability at the date at which the leased asset is available for use by the Group.
Right-of-use assets are measured at cost, less any accumulated depreciation and impairment losses, and adjusted for any remeasurement of lease liabilities. The cost of right-of-use assets includes the amount of lease liabilities recognised, initial direct costs incurred, and lease payments made at or before the commencement date less any lease incentives received. Right-of-use assets are depreciated on a straight-line basis over the shorter of the lease term and the estimated useful lives of the assets which are no more than ten years.
The Group recognises right-of-use assets and lease liabilities on a gross basis and the recovery of lease costs from joint operations' partners is recorded as other income.
Liabilities arising from a lease are initially measured on a present value basis reflecting the net present value of the fixed lease payments and amounts expected to be payable by the Group assuming leases run to full term. The Group has applied judgement to determine the lease term for some lease contracts in which it is a lessee that include renewal options. The assessment of whether the Group is reasonably certain to exercise such options impacts the lease term, which significantly impacts the amount of lease liabilities and right-of-use assets recognised.
|
§ |
The lease payments are discounted at the lease commencement date using the Group's incremental borrowing rates of between 1.2 per cent and 13.1 per cent being the rate that the Group would have to pay to borrow the funds necessary to obtain an asset of similar value in a similar economic environment with similar terms and conditions |
To determine the incremental borrowing rate, the Group where possible:
|
§ |
Uses recent third-party financing received by the individual lessee as a starting point, adjusted to reflect changes in financing conditions since third party financing was received |
|
§ |
Makes adjustments specific to the lease, for example term, country, currency and security |
The Group is exposed to potential future increases in variable lease payments based on an index or rate, which are not included in the lease liability until they take effect. When adjustments to lease payments based on an index or rate take effect, the lease liability is reassessed and adjusted against the right-of-use asset.
Lease payments are allocated between principal and finance cost. The finance cost is charged to the income statement over the lease period so as to produce a constant periodic rate of interest on the remaining balance of the liability for each period.
Payments associated with short-term leases and leases of low value assets are recognised on a straight-line basis as an expense in the income statement. Short-term leases are leases with a lease term of 12 months or less.
For lease arrangements where all partners of a joint operation are considered to share the primary responsibility for lease payments under a lease contract, the Group recognises its share of the respective right-of-use asset and lease liability. This situation is most common where the parties of a joint operation co-sign the lease contract.
The Group recognises a gross lease liability for leases entered into on behalf of a joint operation where it has primary responsibility for making the lease payments. In such instances, if the arrangement between the Group and the joint operation represents a finance sublease, the Group recognises a net investment in sublease for amounts recoverable from non-operators whilst derecognising the respective portion of the gross right-of-use asset. The gross lease liability is retained on the balance sheet.
The net investment in sublease is classified as either trade and other receivables or long-term receivables on the balance sheet according to whether or not the amounts will be recovered within 12 months of the balance sheet date. Finance income is recognised in respect of net investment in subleases.
Provisions for liabilities
A provision is recognised when the Group has a legal or constructive obligation as a result of a past event, it is probable that an outflow of resources embodying economic benefits will be required to settle the obligation and a reliable estimate can be made of the amount of the obligation.
The expense relating to any provision is presented in the income statement net of any reimbursement. If the effect of the time value of money is material, provisions are discounted using a current pre-tax rate that reflects, where appropriate, the risk specific to the liability. Where discounting is used, the increase in the provision due to the passage of time is recognised as part of finance costs in the income statement.
The estimated cost of dismantling and restoring the production and related facilities at the end of the economic life of each field is recognised in full when the related facilities are installed. The amount provided is the present value of the estimated future restoration cost. A non-current asset is also recognised. Any changes to estimated costs or discount rates are dealt with prospectively.
The Group recognises provision for the estimated CO2 emissions costs when actual emissions exceed the emission rights granted and still held. When actual emissions exceed the amount of emission rights granted, a provision is recognised for the exceeding emission rights based on the purchase price of allowances concluded in forward contracts or market quotations at the reporting date.
Group retirement benefits
The Group's various pension plans consist of both defined benefit and defined contribution plans. Payments to defined contribution retirement benefit plans are charged as an expense as they fall due. Payments made to state-managed retirement benefit schemes are dealt with as payments to defined contribution plans where the Group's obligations under the schemes are equivalent to those arising in a defined contribution retirement benefit plan.
The Group operates a defined benefit pension scheme, which requires contributions to be made to a separately administered fund. The cost of providing benefits is determined using the projected unit credit method, with actuarial valuations being carried out at each balance sheet date. Actuarial gains and losses are recognised immediately in the statement of comprehensive income.
The retirement benefit obligation recognised in the balance sheet represents the present value of the defined benefit obligation as reduced by the fair value of plan assets. Any asset resulting from this calculation is limited to the present value of available refunds and reductions in future contributions to the plan.
The Group participates in a legally independent multi-employer plan which is financed by employer and employee contributions as well as the return on plan assets. Since sufficient information is not available for this multi-employer plan, the Group accounts for the plan as if it was a defined contribution plan.
In the case of contribution-based defined benefit pension plans, the Group makes contribution payments to special-purpose funds as well as to life insurances. These contribution payments are recorded as expenses. Furthermore, for some of the Group`s contribution-based defined benefit pension plans, benefit obligations are recognised at the fair value of these funds, so far as the assets exceed the guaranteed minimum benefit amount.
If the assets do not exceed the guaranteed minimum benefit amount, benefit obligations for these contribution-based benefit plans are recognised in the guaranteed minimum benefit amount.
The defined benefit plans are administered by a separate fund that is legally separated from the acquired Wintershall Dea portfolio. The trustees of the pension fund are required by law to act in the interest of the fund and of all relevant stakeholders in the plans.
Trade payables
Initial recognition of trade payables is at fair value. Subsequently they are stated at amortised cost.
Taxes
Current tax
Current tax assets and liabilities for the current and prior periods are measured at the amount expected to be recovered from or paid to the taxation authorities. The tax rates and laws used to compute the amount are those that are enacted or substantively enacted at the reporting date in the countries where the Group operates and generates taxable income.
Current income tax related to items recognised directly in other comprehensive income or equity is recognised in other comprehensive income or directly in equity, not in the income statement.
Management periodically evaluates positions taken in the tax returns with respect to situations in which tax regulations are subject to interpretation and establishes provisions where appropriate.
Deferred tax
Deferred taxation is recognised in respect of all temporary differences arising between the tax bases of the assets and liabilities and their carrying amounts in the financial statements with the following exceptions:
When the deferred tax liability arises from the initial recognition of goodwill or an asset or liability in a transaction that is not a business combination and, at the time of the transaction, affects neither the accounting profit nor taxable profit or loss and does not give rise to equal taxable and deductible temporary differences
|
§ |
In respect of taxable temporary differences associated with investments in subsidiaries, associates and interests in joint arrangements, when the timing of the reversal of the temporary differences can be controlled and it is probable that the temporary difference will not reverse in the foreseeable future |
|
§ |
Deferred tax assets are recognised for all deductible temporary differences, the carry forward of unused tax credits and any unused tax losses. Deferred income tax assets are recognised only to the extent that it is probable that the taxable profit will be available against which the deductible temporary difference, carried forward tax credits or tax losses can be utilised. |
Deferred income tax assets and liabilities are measured on an undiscounted basis at the tax rates that are expected to apply when the related asset is realised or liability is settled, based on tax rates and laws enacted or substantively enacted at the reporting date. The carrying amount of the deferred income tax asset is reviewed at each balance sheet date and reduced to the extent that it is no longer probable that sufficient taxable profits will be available to allow all or part of the asset to be recovered. The Group reassesses any unrecognised deferred tax assets each year taking into account changes in oil and gas prices, the Group's proved and probable reserves and resources profile and forecast capital and operating expenditures.
Deferred income tax assets and liabilities are offset only if a legally enforceable right exists to offset current assets against current tax liabilities, the deferred income tax relates to the same tax authority and that same tax authority permits the Group to make a single net payment.
Deferred tax is charged or credited in the income statement, except when it relates to items charged or credited in other comprehensive income, in which case the deferred tax is also dealt with in other comprehensive income.
Revenue from contracts with customers
Revenue from contracts with customers is recognised when the Group satisfies a performance obligation by transferring a good or service to a customer. A good or service is transferred when the customer obtains control of that good or service. Revenue associated with the sale of crude oil, natural gas and natural gas liquids (NGLs) is measured based on the consideration specified in contracts with customers with reference to quoted market prices in active markets, adjusted according to specific terms and conditions as applicable according to the sales contracts. The transfer of control of oil, natural gas, natural gas liquids and other items sold by the Group occurs when title passes at the point the customer takes physical delivery. The Group principally satisfies its performance obligations at a point in time and the amounts of revenue recognised relating to performance obligations satisfied over time are not significant.
Over/underlift
Differences between the production sold and the Group's share of production result in an overlift or an underlift. Underlift positions are measured at net realisable value using an observable year-end oil or gas market price. Overlift positions are measured using the sales price that generated the overlift. Underlift and overlift positions are included in receivables or payables respectively. Movements during the accounting period are recognised within cost of sales.
Interest income
Interest income is recognised on an accruals basis, by reference to the principal outstanding and at the effective interest rate applicable.
Borrowing costs
Borrowing costs directly attributable to the acquisition, construction or production of an asset that necessarily takes a substantial period of time to get ready for its intended use or sale (a qualifying asset) are capitalised as part of the cost of the respective assets. Where the funds used to finance a project form part of general borrowings, the amount capitalised is calculated using a weighted average of rates applicable to relevant general borrowings of the Group during the period. All other borrowing costs are recognised in the income statement in the period in which they are incurred.
New accounting standards and interpretations
The Group applied for the first-time certain standards and amendments, which are effective for annual periods beginning on or after 1 January 2024 (unless otherwise stated). The Group has not early adopted any other standard, interpretation or amendment that has been issued but is not yet effective.
Management anticipates that all relevant pronouncements will be adopted for the first period beginning on or after the effective date of the pronouncement. New standards, amendments and interpretations not adopted in the current year have not been disclosed as they are not expected to have a material impact on the Group's consolidated financial statements.
Classification of Liabilities as Current or Non-current and Non-current Liabilities with Covenants - Amendments to IAS 1
The amendments specify the requirements for classifying liabilities as current or non-current. The amendments clarify:
|
§ |
What is meant by a right to defer settlement |
|
§ |
That a right to defer must exist at the end of the reporting period |
|
§ |
That classification is unaffected by the likelihood that an entity will exercise its deferral right |
|
§ |
That only if an embedded derivative in a convertible liability is itself an equity instrument would the terms of a liability not impact its classification |
In addition, a requirement has been added to disclose when a liability arising from a loan agreement is classified as non-current and the entity's right to defer settlement is contingent on compliance with future covenants within twelve months.
The amendments had no impact on the Group's consolidated financial statements.
Lease Liability in a Sale and Leaseback - Amendments to IFRS 16
The amendments to IFRS 16 specify the requirements that a seller-lessee uses in measuring the lease liability arising in a sale and leaseback transaction, to ensure the seller-lessee does not recognise any amount of the gain or loss that relates to the right of use it retains. The amendments had no impact on the Group's consolidated financial statements.
Supplier Finance Arrangements - Amendments to IAS 7 and IFRS 7
The amendments to IAS 7 Statement of Cash Flows and IFRS 7 Financial Instruments: Disclosures clarify the characteristics of supplier finance arrangements and require additional disclosure of such arrangements. The disclosure requirements in the amendments are intended to assist users of financial statements in understanding the effects of supplier finance arrangements on an entity's liabilities, cash flows and exposure to liquidity risk.
The disclosure requirements in the amendments provide information about the impact of supplier finance arrangements on liabilities and cash flows, including terms and conditions of those arrangements, quantitative information on liabilities related to those arrangements as at the beginning and end of the reporting period and the type and effect of non-cash changes in the carrying amounts of those arrangements.
The amendments had no impact on the Group's consolidated financial statements.
3. Segment information
The chief operating decision maker, who is responsible for allocating resources and assessing performance of the Group's business segments, has been identified as the Chief Executive Officer.
Prior to the acquisition of substantially all of Wintershall Dea's upstream oil and gas assets, the Group's activities consist of one class of business being the acquisition, exploration, development and production of oil and gas reserves and related activities, and were split geographically and managed in two regions, namely 'North Sea' and 'International'. The North Sea segment included the UK and Norwegian continental shelves, and the 'International' segment included Indonesia, Vietnam and Mexico.
The operating segments have been modified following the acquisition of the Wintershall Dea portfolio and changes in the Group's structure effective from September 2024. The operating segments are now divided geographically and managed across nine business units: namely Norway, UK, Germany, Mexico, Argentina, North Africa, Southeast Asia, CCS and Corporate. The CCS segment includes Denmark.
Information on major customers can be found in note 4.
|
Year ended 31 December 2024 |
Norway $ million |
UK $ million |
Germany $ million |
Mexico $ million |
Argentina $ million |
North $ million |
Southeast Asia $ million |
CCS $ million |
Corporate $ million |
Total segments $ million |
Adjustments and eliminations $ million |
Consolidated $ million |
|
Revenue and other income |
||||||||||||
|
External customers |
||||||||||||
|
- Crude oil sales |
343 |
1,755 |
158 |
55 |
23 |
10 |
141 |
- |
393 |
2,878 |
- |
2,878 |
|
- Gas sales |
86 |
1,143 |
9 |
3 |
111 |
63 |
115 |
- |
1,406 |
2,936 |
- |
2,936 |
|
- Other revenue |
90 |
195 |
1 |
- |
6 |
40 |
- |
- |
12 |
344 |
- |
344 |
|
Other income |
- |
33 |
4 |
2 |
7 |
6 |
1 |
- |
15 |
68 |
- |
68 |
|
Inter-segment |
946 |
791 |
74 |
- |
- |
- |
- |
- |
68 |
1,879 |
(1,879) |
- |
|
Total revenue and other income |
1,465 |
3,917 |
246 |
60 |
147 |
119 |
257 |
- |
1,894 |
8,105 |
(1,879) |
6,226 |
|
Cost of operations |
(520) |
(2,699) |
(243) |
(37) |
(120) |
(58) |
(172) |
(6) |
(1,631) |
(5,486) |
1,873 |
(3,613) |
|
(Reversal)/impairment of property, plant and equipment |
14 |
(323) |
(26) |
- |
- |
- |
(15) |
(5) |
3 |
(352) |
- |
(352) |
|
Impairment of right-of-use asset |
- |
(20) |
- |
- |
- |
- |
- |
- |
- |
(20) |
- |
(20) |
|
Impairment of goodwill |
- |
- |
- |
- |
- |
- |
- |
- |
- |
- |
- |
- |
|
Exploration and evaluation expenses and new ventures |
(22) |
(4) |
- |
- |
- |
- |
- |
(40) |
(2) |
(68) |
- |
(68) |
|
Exploration costs written-off |
(76) |
(81) |
- |
- |
- |
(2) |
(14) |
- |
- |
(173) |
- |
(173) |
|
General and administrative expenses |
(24) |
(76) |
(19) |
(6) |
(9) |
(7) |
(7) |
(1) |
(203) |
(352) |
- |
(352) |
|
Segment operating profit/(loss) |
837 |
714 |
(42) |
17 |
18 |
52 |
49 |
(52) |
61 |
1,654 |
(6) |
1,648 |
|
Finance income |
173 |
|||||||||||
|
Finance expenses |
(602) |
|||||||||||
|
Income tax expense |
(1,312) |
|||||||||||
|
Loss for the year |
(93) |
|||||||||||
|
Total assets |
9,434 |
7,306 |
3,042 |
2,420 |
4,488 |
917 |
919 |
18 |
1,777 |
30,321 |
- |
30,321 |
|
Total liabilities |
(6,622) |
(6,936) |
(1,965) |
(482) |
(1,292) |
(165) |
(454) |
(108) |
(6,046) |
(24,070) |
- |
(24,070) |
|
Total capital additions |
374 |
698 |
59 |
110 |
61 |
46 |
93 |
33 |
70 |
1,544 |
- |
1,544 |
|
Total depreciation, depletion and amortisation |
293 |
1,115 |
146 |
10 |
58 |
16 |
78 |
- |
29 |
1,745 |
- |
1,745 |
|
Year ended 31 December 2023 |
Norway $ million |
UK $ million |
Germany $ million |
Mexico $ million |
Argentina $ million |
North $ million |
Southeast Asia $ million |
CCS $ million |
Corporate $ million |
Total segments $ million |
Adjustments and eliminations $ million |
Consolidated $ million |
|
Revenue and other income |
||||||||||||
|
External customers |
||||||||||||
|
- Crude oil sales |
- |
1,980 |
- |
- |
- |
- |
106 |
- |
- |
2,086 |
- |
2,086 |
|
- Gas sales |
- |
1,272 |
- |
- |
- |
- |
131 |
- |
12 |
1,415 |
- |
1,415 |
|
- Other revenue |
- |
214 |
- |
- |
- |
- |
- |
- |
- |
214 |
- |
214 |
|
Other income |
- |
35 |
- |
- |
- |
- |
- |
- |
1 |
36 |
- |
36 |
|
Inter-segment |
- |
28 |
- |
- |
- |
- |
- |
- |
- |
28 |
(28) |
- |
|
Total revenue and other income |
- |
3,529 |
- |
- |
- |
- |
237 |
- |
13 |
3,779 |
(28) |
3,751 |
|
Cost of operations |
- |
(2,255) |
- |
- |
- |
- |
(149) |
- |
- |
(2,404) |
28 |
(2,376) |
|
Impairment of property, plant and equipment |
- |
(172) |
- |
- |
- |
- |
- |
- |
(4) |
(176) |
- |
(176) |
|
Impairment of right-of-use asset |
- |
- |
- |
- |
- |
- |
- |
- |
- |
- |
- |
- |
|
Impairment of goodwill |
- |
- |
- |
- |
- |
- |
(25) |
- |
- |
(25) |
- |
(25) |
|
Exploration and evaluation expenses and new ventures |
(6) |
(1) |
- |
- |
- |
- |
- |
(29) |
- |
(36) |
- |
(36) |
|
Exploration costs written-off |
(27) |
(11) |
- |
(13) |
- |
- |
(6) |
- |
- |
(57) |
- |
(57) |
|
General and administrative expenses |
1 |
(46) |
- |
- |
- |
- |
(4) |
- |
(100) |
(149) |
- |
(149) |
|
Segment operating profit/(loss) |
(32) |
1,044 |
- |
(13) |
- |
- |
53 |
(29) |
(91) |
932 |
- |
932 |
|
Finance income |
104 |
|||||||||||
|
Finance expenses |
(420) |
|||||||||||
|
Income tax expense |
(571) |
|||||||||||
|
Profit for the year |
45 |
|||||||||||
|
Total assets |
73 |
6,083 |
- |
360 |
- |
- |
905 |
- |
2,495 |
9,916 |
- |
9,916 |
|
Total liabilities |
(34) |
(5,818) |
- |
(49) |
- |
- |
(483) |
- |
(1,979) |
(8,363) |
- |
(8,363) |
|
Total capital additions |
24 |
575 |
- |
44 |
- |
- |
67 |
- |
11 |
721 |
- |
721 |
|
Total depreciation, depletion and amortisation |
1 |
1,352 |
- |
- |
- |
- |
80 |
- |
16 |
1,449 |
- |
1,449 |
4. Revenue from contracts with customers and other income
|
2024 $ million |
2023 $ million |
||
|
Type of goods |
|||
|
Crude oil sales |
2,878 |
2,086 |
|
|
Gas sales |
2,936 |
1,415 |
|
|
Condensate sales |
283 |
179 |
|
|
Total revenue from contracts with customers1 |
6,097 |
3,680 |
|
|
Tariff income |
32 |
30 |
|
|
Other revenue |
29 |
5 |
|
|
Revenue from production activities |
6,158 |
3,715 |
|
|
Other income2 |
68 |
36 |
|
|
Total revenue and other income |
6,226 |
3,751 |
1 Revenues from contracts with customers of $6,115 million (2023: $4,591 million) include crude oil sales of $2,846 million (2023: $2,179 million) and gas sales of $2,986 million (2023: $2,233 million). This was prior to realised hedging gains in the year of $32 million (2023: $93 million, hedging loss) on crude oil and realised hedging losses in the year of $50 million (2023: $818 million) on gas sales.
2 Other income mainly represents partner recoveries related to lease obligations and government subsidies in Argentina. Other income in 2023 includes a receipt related to the Viking CCS Development Agreement that was signed in March 2023.
Approximately 54 per cent (2023: 88 per cent) of the revenues were attributable to sales to energy trading companies of the Shell group.
5. Operating profit
|
Note |
2024 $ million |
2023 As restated $ million |
|
|
Cost of operations |
|||
|
Production, insurance and transportation costs |
1,612 |
1,171 |
|
|
Commodity purchases |
28 |
12 |
|
|
Royalties |
47 |
4 |
|
|
Impairment of receivables |
21 |
- |
|
|
Depreciation of oil and gas assets |
12 |
1,516 |
1,206 |
|
Depreciation of right-of-use oil and gas assets |
13 |
269 |
235 |
|
Capitalisation of IFRS 16 lease depreciation on oil and gas assets |
13 |
(81) |
(27) |
|
Movement in over/underlift balances and hydrocarbon inventories |
201 |
(225) |
|
|
Total cost of operations |
3,613 |
2,376 |
|
|
Impairment expense of oil and gas property, plant and equipment |
12 |
178 |
70 |
|
Net impairment loss due to increase in decommissioning provisions on oil and gas tangible assets |
12 |
174 |
106 |
|
Impairment of goodwill |
10 |
- |
25 |
|
Impairment of right of use asset |
13 |
20 |
- |
|
Exploration costs written-off1 |
11 |
173 |
57 |
|
Exploration and evaluation expenditure and new ventures1 |
68 |
36 |
|
|
General and administrative expenses |
|||
|
Depreciation of right-of-use non-oil and gas assets |
13 |
16 |
9 |
|
Depreciation of non-oil and gas assets |
12 |
6 |
3 |
|
Amortisation of non-oil and gas intangible assets |
11 |
19 |
23 |
|
Acquisition-related transaction costs |
119 |
33 |
|
|
Other administrative costs2 |
192 |
81 |
|
|
Total general and administrative expenses2,5 |
352 |
149 |
|
|
Auditor's remuneration |
|||
|
Audit fees |
|||
|
Fees payable to the company's auditor for the company's Annual Report |
6 |
3 |
|
|
Audit of the company's subsidiaries pursuant to legislation |
1 |
1 |
|
|
Non-audit fees3 |
|||
|
Other services pursuant to legislation - interim review |
- |
- |
|
|
Other services4 |
2 |
1 |
1 During the year, the Group expensed $241 million (2023: $93 million) of exploration and appraisal activities. This covers exploration write-off expense of $173 million (2023: $57 million) including write-off of costs associated with projects in our UK business unit ($79 million) and licence relinquishments in Norway ($64 million), and $40 million (2023: $29 million) costs associated with energy transition projects.
2 Other administrative costs in 2024 include consultancy and business development costs of $119 million (2023: $33 million), mainly related to the acquisition of the Wintershall Dea asset portfolio which completed in September 2024.
3 The company has a policy on the provision of non-audit services by the auditor which is aimed at ensuring their continued independence. This policy is available on the Group's website. The use of the external auditor for services relating to accounting systems or financial statement preparations is not permitted, as are various other services that could give rise to conflicts of interest or other threats to the auditor's objectivity that cannot be reduced to an acceptable level by applying safeguards.
4 Other non-audit services in 2024 primarily relate to transaction related activities including the Wintershall Dea acquisition.
5 Expenses related to both short-term and low value lease arrangements are considered to be immaterial for reporting purposes.
6. Staff costs
|
2024 $ million |
2023 $ million |
|
|
Wages and salaries and other staff costs |
428 |
325 |
|
Social security costs |
46 |
25 |
|
Pension costs |
35 |
29 |
|
Total staff costs |
509 |
379 |
|
Average annual number of employees employed |
2024 Number |
2023 Number |
|
Offshore based |
545 |
534 |
|
Onshore and administration |
1,614 |
1,271 |
|
Total staff |
2,159 |
1,805 |
During the period September to December 2024, following the acquisition of the Wintershall Dea portfolio, the Group employed an average of 3,019 employees.
Staff costs above are recharged to joint venture partners where applicable, or are capitalised to the extent that they are directly attributable to capital or decommissioning projects. The above costs include share-based payments as disclosed in note 27.
The Group operates defined contribution and benefit pension schemes for which further details are provided in note 28.
7. Finance income and finance expenses
|
Note |
2024 $ million |
2023 $ million |
|
|
Finance income |
|||
|
Bank interest |
37 |
19 |
|
|
Other interest and finance gains |
16 |
6 |
|
|
Lease finance income |
1 |
2 |
|
|
Realised gains on foreign exchange forward contracts |
- |
9 |
|
|
Unrealised gains on derivatives1 |
- |
68 |
|
|
Income from investments |
1 |
- |
|
|
Foreign exchange gains |
118 |
- |
|
|
Total finance income |
173 |
104 |
|
|
Finance expenses |
|||
|
Interest payable on reserve based lending facility |
1 |
15 |
|
|
Interest payable on revolving credit facility |
10 |
- |
|
|
Interest payable on bridge loan facility |
8 |
- |
|
|
Interest payable on bonds |
59 |
27 |
|
|
Other interest and finance expenses |
10 |
17 |
|
|
Lease interest |
13 |
53 |
51 |
|
Unrealised losses on derivatives1 |
43 |
- |
|
|
Realised losses on foreign exchange forward contracts |
71 |
- |
|
|
Finance expense on deferred revenue |
20 |
5 |
4 |
|
Foreign exchange losses |
- |
57 |
|
|
Bank and financing fees2 |
139 |
100 |
|
|
Unwinding of discount on decommissioning and other provisions |
21 |
221 |
156 |
|
620 |
427 |
||
|
Finance costs capitalised during the year3 |
(18) |
(7) |
|
|
Total finance expense |
602 |
420 |
1 Losses on derivatives include mark to market losses on foreign currency derivatives of $30 million (2023: $nil), derivative ineffectiveness losses of $8 million (2023: $nil) and $5 million related to changes in the fair value of an embedded derivative within one of the Group's gas contracts (2023: $68 million gain).
2 Bank and financing fees include an amount of $102 million (2023: $48 million) relating to the amortisation of arrangement fees and related costs capitalised against the Group's long-term borrowings (note 22). This primarily relates to the expensing of previously capitalised fees in respect of the Group's reserve based lending (RBL) facility of $61 million at the end of 2023 which was replaced by the new revolving credit facility (RCF) facility as part of the acquisition of the Wintershall Dea portfolio.
3 The amount of finance costs capitalised was determined by applying the weighted average rate of finance costs applicable to the borrowings of the Group of 4.5 per cent to the expenditures on the qualifying assets (2023: 6.0 per cent).
8. Income tax
The major components of income tax expense are:
|
2024 $ million |
2023 As restated $ million |
|
|
Current income tax expense: |
||
|
Charge for the year |
1,413 |
655 |
|
Adjustments in respect of prior years |
2 |
22 |
|
Total current income tax expense |
1,415 |
677 |
|
Deferred tax credit |
||
|
Origination and reversal of temporary differences in current year |
(168) |
(86) |
|
Impact of changes in tax rates1 |
77 |
- |
|
Adjustments in respect of prior years |
(12) |
(20) |
|
Total deferred tax credit |
(103) |
(106) |
|
Total tax expense reported in the income statement |
1,312 |
571 |
|
The tax (credit)/expense in the statement of comprehensive income is as follows: |
||
|
Tax (credit)/expense on cash flow hedges |
(379) |
2,376 |
|
Tax credit on cash actuarial gains and losses |
(4) |
- |
|
Total tax (credit)/expense reported in the statement of comprehensive income |
(383) |
2,376 |
1 The amounts for 2024 comprise the impact of the increase in Energy Profits Levy in the UK business unit from 35 per cent to 38 per cent from 1 November 2024.
Reconciliation of tax expense and the accounting profit before taxation at the Group's statutory tax rate is as follows:
|
2024 $ million |
2023 As restated $ million |
|
|
Profit before income tax |
1,219 |
616 |
|
At the Group's statutory tax rate of 78 per cent (2023: 75 per cent) |
951 |
462 |
|
Effects of: |
||
|
Expenses not deductible for tax purposes |
59 |
103 |
|
Adjustments in respect of prior years |
(10) |
2 |
|
Remeasurement of deferred tax |
53 |
13 |
|
Deferred Energy Profits Levy change in rate |
77 |
- |
|
Impact of different tax rates |
282 |
73 |
|
Allowances and other tax uplifts |
(113) |
(82) |
|
Future dividends from investments in subsidiaries, branches and associates |
(11) |
- |
|
Other |
24 |
- |
|
Total tax expense reported in the consolidated income statement at the effective tax rate of 108 per cent (2023: 93 per cent, restated) |
1,312 |
571 |
The tax expense reconciliation has been prepared based on the statutory tax rate of 78 per cent applicable to oil and gas production in the UK and Norway, the two most significant jurisdictions of operation for the Group. Management believes that using this rate provides the most meaningful comparison between the expected tax expense, based on accounting profit, and the actual tax expense recognised. In 2023, the tax expense was prepared based on the statutory rate of taxation of 75 per cent applying to UK oil and gas production because the majority of the Group's profit was generated in the UK Continental Shelf.
The effective tax rate for the year is 108 per cent, compared to 93 per cent for 2023 (restated).
The effective tax rate of 108 per cent is significantly higher than the statutory rate of 78 per cent for the Group, mainly due to several UK-specific exceptional items impacting the UK tax expense. These items, resulting from the application of Energy Profits Levy (EPL), create tax rate differences reflected in the income statement. Notably, the increase in the UK asset retirement obligation raised the effective tax rate by 15 per cent as there is no tax relief available against EPL for expenditure on abandonment. Additionally, exploration write-offs and impairments of tangible assets in the UK, which carried blended deferred tax liabilities up to the enacted EPL sunset clause date of 31 March 2028, increased the effective tax rate by another 4 per cent. Finally, the EPL rate change from 35 per cent to 38 per cent added 6 per cent to the effective tax rate. Overall, these EPL-related adjustments resulted in an additional 25 per cent increase in the Group's effective tax rate.
The UK and Norway are expected to remain the principal jurisdictions where profits will be earned, so their statutory tax rates for oil and gas production operations are anticipated to continue as the primary factors influencing the Group's future tax expense.
Deferred tax
The principal components of deferred tax are set out in the following tables:
|
Note |
2024 $ million |
2023 As restated $ million |
|
|
Deferred tax assets |
130 |
7 |
|
|
Deferred tax liabilities |
(6,240) |
(1,297) |
|
|
(6,110) |
(1,290) |
||
|
Reclassification of deferred tax liabilities directly associated with assets held for sale |
18 |
19 |
- |
|
Total deferred tax |
(6,091) |
(1,290) |
The presentation above takes into account the offsetting of deferred tax assets and deferred tax liabilities within the same tax jurisdiction (where this is permitted). The overall deferred tax balance in a jurisdiction determines if the deferred tax related to that jurisdiction is disclosed within deferred tax assets or deferred tax liabilities.
The origination of and reversal of temporary differences are, as shown in the next table, related primarily to movements in the carrying amounts and tax base values of expenditure and the timing of when these items are charged and/or credited against accounting and taxable profit.
|
Accelerated capital allowances $ million |
Decom-missioning $ million |
Losses $ million |
Fair $ million |
Other1 $ million |
Overseas $ million |
Total $ million |
|
|
As at 1 January 2023 |
(3,396) |
1,565 |
569 |
2,452 |
(3) |
(178) |
1,009 |
|
Deferred tax credit/(expense) |
546 |
(25) |
(388) |
(61) |
22 |
18 |
112 |
|
Comprehensive income |
- |
- |
- |
(2,376) |
1 |
- |
(2,375) |
|
Foreign exchange |
(51) |
34 |
- |
(9) |
1 |
(5) |
(30) |
|
As at 31 December 2023 |
(2,901) |
1,574 |
181 |
6 |
21 |
(165) |
(1,284) |
|
Restated |
- |
- |
- |
- |
- |
(6) |
(6) |
|
As at 31 December 2023 as restated |
(2,901) |
1,574 |
181 |
6 |
21 |
(171) |
(1,290) |
|
Deferred tax (expense)/credit |
(44) |
257 |
(114) |
(38) |
42 |
- |
103 |
|
Comprehensive income |
- |
- |
- |
380 |
4 |
- |
384 |
|
Other reserves2 |
- |
- |
- |
- |
(1) |
- |
(1) |
|
Additions from business combinations |
(6,509) |
971 |
201 |
(14) |
(2) |
- |
(5,353) |
|
Reclassifications3,4 |
(221) |
7 |
28 |
15 |
171 |
- |
|
|
Foreign exchange |
75 |
(18) |
(8) |
2 |
(4) |
- |
47 |
|
As at 31 December 2024 |
(9,600) |
2,791 |
288 |
336 |
75 |
- |
(6,110) |
1 Includes deferred tax movements related to investment allowances, share-based payments and pensions.
2 Movement in other reserves relates to the element of deferred tax on UK share-based payments taken to profit and loss reserves.
3 Items classified as overseas balances in 2023 have been reclassified into specific deferred tax categories.
4 Balances related to UK investment allowances ($12 million) have been reclassified from accelerated capital allowances to other
The Group's deferred tax assets are recognised to the extent that taxable profits are expected to arise against which the tax assets can be utilised. The Group assessed the recoverability of tax losses and allowances using corporate assumptions which are consistent with the Group's impairment assessment. Based on those assumptions, the Group expects to fully utilise its recognised tax losses and allowances. The recovery of the Group's UK decommissioning deferred tax asset is additionally supported by the ability to carry back decommissioning tax losses and set these against ring fence taxable profits of prior periods.
In October 2024, the UK Government announced changes to the EPL, including an increase in the rate from 35 per cent to 38 per cent, the removal of the main EPL investment allowance and an extension of the EPL to 31 March 2030. The three per cent increase in the rate and the removal of the main EPL investment allowance were substantively enacted at the balance sheet date and have effect from 1 November 2024. As a result, the current accounting period reflects an additional deferred tax expense of $77 million, based on the currently enacted expiration date of the EPL of 31 March 2028 and the remeasurement of temporary differences expected to reverse within this period. The extension of the EPL to 31 March 2030 was substantively enacted on 3 March 2025 and is therefore not reflected in the financial statements as at 31 December 2024. This impact will be included in the financial statements for the following period. If the extension had been in place at the balance sheet date, an additional deferred tax expense of $306 million would have been recognised in the current financial statements.
In the UK, ring fence tax losses cannot be offset against profits subject to EPL nor are deductions allowed for decommissioning related expenditure. Consequently, any deferred tax assets representing future decommissioning deductions or ring fence tax losses are unaffected by the EPL. The primary impact of the EPL is on the deferred tax liability associated with accelerated capital allowances. The closing deferred tax liability for the period is $6,110 million (2023: $1,290 million), of which $877 million (2023: $1,014 million) relates to deferred tax liabilities arising from the impact of the EPL.
Consistent with other sensitivity analyses undertaken, we have assessed the impact on the recoverability of deferred tax assets based on a decrease of 10 per cent to the Harbour scenario average crude price curves. While there would generally be no material impacts, tax losses in Mexico are particularly sensitive to the timing of profits as they expire within a 10-year period once generated. Under this scenario, the deferred tax assets currently recognised for Mexican tax losses would decrease by around $50 million.
Unrecognised tax losses and allowances
Deferred tax assets are recognised for tax loss carry forwards, tax allowances and other deductible temporary differences to the extent that it is probable the associated tax benefits will be realised through offsetting future taxable profits or by carrying losses back to prior periods' profits. At the end of the accounting period, the Group had not recognised deferred tax assets for tax losses, allowances and other deductible temporary differences amounting to approximately $2,743 million (2023: $1,290 million). These other deductible temporary differences include unclaimed tax depreciation, unrealised losses on non-commodity derivatives and decommissioning related provisions.
|
2024 $ million |
2023 $ million |
||
|
Tax losses by expiry date |
|||
|
Expiring within 5 years |
477 |
24 |
|
|
Expiring within 6-10 years |
240 |
13 |
|
|
No expiration |
1,621 |
1,115 |
|
|
2,338 |
1,152 |
||
|
Other deductible temporary differences and allowances |
405 |
138 |
|
|
Total unrecognised tax losses and allowances |
2,743 |
1,290 |
No deferred tax liabilities were recognised for temporary differences associated with investments in subsidiaries, branches and associates of approximately $293 million (2023: $nil) because the Group is in a position to control the timing of the reversal of the temporary differences and it is probable that such differences will not reverse in the foreseeable future.
Global minimum corporation tax rate - Pillar Two requirements
The legislation implementing the Organisation for Economic Co-operation and Development's (OECD) proposals for a global minimum corporation tax rate (Pillar Two) was substantively enacted into UK law on 20 June 2023. The rules became effective from 1 January 2024.
The Group has applied the mandatory exception in IAS 12 to recognising and disclosing information about deferred tax assets and liabilities related to Pillar Two income taxes.
The Group has performed an assessment of its potential exposure to Pillar Two income taxes for periods from 1 January 2024. The assessment of the potential exposure is based on the most recent tax filings, country-by-country reporting and financial statements for the constituent entities in the Group. Based on the assessment, the Pillar Two effective tax rates in most of the jurisdictions in which the Group operates are above 15 per cent and the transitional safe harbour relief is expected to apply. On this basis, the Group does not expect a material exposure to Pillar Two income taxes in any jurisdictions.
Uncertain tax positions
The Group considers an uncertain tax position to exist when it believes that the amount of profit subject to tax in the future may exceed the amount initially reflected in the Group's tax returns. The Group applies IFRIC 23 Uncertainty over Income Tax Treatments in relation to uncertain tax positions. When management judges that an outflow of funds is probable and a reliable estimate of the dispute can be made, a provision is recognised for the best estimate of the most likely liability.
In estimating any such liability, the Group adopts a risk-based approach, considering the specific circumstances of each dispute. This is based on management's interpretation of tax law and, where appropriate, is supported by independent specialist advice. These estimates are inherently judgemental and can change significantly over time as disputes progress and new facts emerge.
Provisions are reviewed continuously. However, the resolution of tax issues may take a long time to conclude, and there is a possibility that the amounts ultimately paid could differ from the amounts initially provided.
In 2023, an uncertain tax position was identified in certain UK subsidiaries relating to the timing of the taxation of fair value movements and realised gains and losses on hedges entered into to manage commodity price risk. On the strength of independent advice, management considers that there is no expectation of a net additional outflow of funds. As such no additional liability has been recognised in the consolidated financial statements as at 31 December 2024. However, a contingent liability exists as the UK tax authorities could take an alternative view on whether the fair value movements on the hedged instruments are disregarded for tax purposes. While not considered a likely outcome, if the UK tax authorities were to disagree and successfully challenge the position, a possible liability currently estimated not to exceed $130 million could arise because of the differences in tax rates across the periods in question.
9. (Loss)/earnings per share (EPS)
Basic EPS is calculated by dividing the profit after tax attributable to ordinary shareholders of the Group by the weighted average number of ordinary shares in issue during the year.
Diluted EPS is calculated by dividing the profit after tax attributable to ordinary shareholders by the weighted average number of ordinary share in issue during the year plus the weighted average number of ordinary shares that would be issued on conversion of all the dilutive potential ordinary shares into ordinary shares.
The following table reflects the income and share data used in the basic and diluted EPS calculations:
|
2024 |
2023 As restated |
|
|
(Loss)/earnings for the year ($ millions) |
||
|
Earnings for the purpose of basic earnings per share |
(108) |
45 |
|
Effect of dilutive potential ordinary shares |
- |
- |
|
(Loss)/earnings for the purpose of diluted earnings per share |
(108) |
45 |
|
Number of ordinary shares (millions) |
||
|
Weighted average number of ordinary shares (voting) for the purpose of basic earnings per share |
990 |
804 |
|
Weighted average number of ordinary shares (non-voting) for the purpose of basic earnings per share |
93 |
- |
|
Weighted average number of ordinary shares (voting) for the purpose of diluted earnings per share1 |
990 |
806 |
|
Weighted average number of ordinary shares (non-voting) for the purpose of diluted earnings per share |
93 |
- |
|
(Loss)/earnings per share ($ cents) |
||
|
Basic: |
||
|
Ordinary shares voting |
(10) |
6 |
|
Ordinary shares non-voting |
(11) |
- |
|
Diluted: |
||
|
Ordinary shares voting |
(10) |
6 |
|
Ordinary shares non-voting |
(11) |
- |
1 2023 excludes certain share options outstanding at 31 December 2023 as their option price was greater than market price.
10. Goodwill
Goodwill represents the difference between the aggregate of the fair value of purchase consideration transferred at the acquisition date and the fair value of the identifiable assets.
|
Note |
2024 $ million |
2023 $ million |
|
|
Cost and net book value |
|||
|
At 1 January |
1,302 |
1,327 |
|
|
Additions from business combinations |
14 |
3,845 |
- |
|
Impairment charge |
- |
(25) |
|
|
At 31 December |
5,147 |
1,302 |
Goodwill is allocated as follows to the operating segments:
|
2024 $ million |
2023 $ million |
||
|
Cost and net book value |
|||
|
Norway |
2,651 |
- |
|
|
UK |
1,278 |
1,278 |
|
|
Germany |
401 |
- |
|
|
Mexico |
199 |
- |
|
|
Argentina |
594 |
- |
|
|
Southeast Asia |
24 |
24 |
|
|
At 31 December |
5,147 |
1,302 |
The goodwill balance consists of balances arising from the acquisition of Wintershall Dea's upstream oil and gas assets on 3 September 2024, the completion of the all-share merger between Premier Oil plc and Chrysaor Holdings Limited in March 2021, Chrysaor Holdings Limited's acquisition of the ConocoPhillips UK business, and the UK North Sea assets from Shell, which completed on 30 September 2019 and 1 November 2017, respectively.
Impairment testing of goodwill
In accordance with IAS 36 Impairment of Assets, goodwill is reviewed for impairment at the year-end, or more frequently, if there are indications that goodwill might be impaired.
The goodwill recognised in business combinations is allocated to operating segments for the purpose of impairment testing. The carrying value of goodwill is tested at the operating segment level against the aggregated headroom arising from the impairment testing of corresponding segment assets. The carrying value of the assets is the sum of tangible assets, intangible assets and goodwill as of the assessment date. In the asset impairment test performed, and where applicable, the carrying value is adjusted by deferred tax which protects goodwill from an immediate impairment. When the deferred tax liabilities from the acquisitions naturally unwind and decrease, as a result of depreciation through production, more goodwill is exposed to impairment. This may lead to future impairment charges even though other assumptions remain stable.
At the year-end, the Group tested for impairment in accordance with the accounting policy and no goodwill impairment was recognised (2023: $25 million). Goodwill will ultimately be impaired to the income statement as the relevant operating segment businesses mature.
Determining recoverable amount
The recoverable amounts of the CGU and fields have been determined on a fair value less costs to sell basis. The key assumptions used in determining the fair value are often subjective, such as the future long-term oil and gas price assumption, or the operational performance of the assets. Discounted cash flow models comprising asset-by-asset life of field projections using Level 3 inputs (based on the IFRS 13 fair value hierarchy) have been used to determine the recoverable amounts.
The cash flows have been modelled on a post-tax and post-decommissioning basis, inflated at 2.5 per cent per annum from 1 January 2028, and discounted at the Group's post-tax discount rate of between 8.75 per cent and 14.5 per cent (2023: 9.0 - 12.4 per cent post-tax). Risks specific to assets within the CGU are reflected within the cash flow forecasts.
Key assumptions used in calculations
Assumptions involved in impairment measurement include estimates of commercial reserves and production volumes, future oil and gas prices, discount rates and the level and timing of expenditures, all of which are inherently uncertain.
Commodity and carbon prices
Management's commodity price curve assumptions are benchmarked against a range of external forward price curves on a regular basis. The first three years reflect the market forward prices curves transitioning to a long-term price thereafter. The long-term commodity prices and carbon prices are shown in note 2 of the financial statements.
Production volumes and oil and gas reserves
Based on life of field production profiles for each asset within the CGUs. Proven and probable reserves are estimates of the amount of oil and gas that can be economically extracted from the Group's oil and gas assets. The Group estimates its reserves using standard recognised evaluation techniques and they are assessed at least annually by management and by an independent consultant. Proven and probable reserves are determined using estimates of oil and gas in place, recovery factors and future commodity prices.
Costs
Operating expenditure, capital expenditure and decommissioning costs, which have been inflated at 2.5 per cent per annum from 1 January 2028, are derived from the Group's business plan.
Discount rates
Represent management's estimate of the Group's country-based weighted average cost of capital (WACC), considering both debt and equity. The cost of equity is derived from an expected return on investment by the Group's investors, and the cost of debt is based on its interest-bearing borrowings. Segment-specific risk is incorporated by applying a beta factor based on publicly available market data. The discount rate is based on an assessment of a relevant peer group's post-tax WACC.
Foreign exchange rates
Based on management's long-term rate assumptions, with reference to a range of underlying economic indicators.
Sensitivity to changes in assumptions used in calculations
The Group has run sensitivities on its long-term commodity price assumptions, which have been based on long-range forecasts from external financial analysts, using alternate long-term price assumptions, and discount rates. These are considered to be reasonably possible changes for the purposes of sensitivity analysis. As shown in note 2 of the financial statements, the sensitivity analysis on commodity prices reflecting a 10 per cent reduction in the long-term oil and gas price deck applied in the impairment test would result in $81 million goodwill impairment. A 1 per cent increase in the discount rate would result in an impairment to goodwill of $10 million.
11. Other intangible assets
|
Note |
Oil and gas assets $ million |
Non-oil and gas assets1 $ million |
Carbon allowances $ million |
Total |
|
|
Cost |
|||||
|
At 1 January 2023 |
817 |
137 |
- |
954 |
|
|
Additions during the year |
210 |
20 |
- |
230 |
|
|
Transfers from property, plant and equipment |
12 |
- |
7 |
- |
7 |
|
Reclassification from trade and other receivables |
- |
- |
86 |
86 |
|
|
Increase in decommissioning asset |
21 |
4 |
- |
- |
4 |
|
Exploration write-off |
(57) |
- |
- |
(57) |
|
|
Currency translation adjustment |
42 |
8 |
- |
50 |
|
|
At 31 December 2023 |
1,016 |
172 |
86 |
1,274 |
|
|
Additions during the year |
398 |
51 |
36 |
485 |
|
|
Additions from business combinations and joint arrangements |
4,407 |
2 |
- |
4,409 |
|
|
Transfers from property, plant and equipment |
12 |
(39) |
1 |
- |
(38) |
|
Increase in decommissioning asset |
21 |
12 |
- |
- |
12 |
|
Exploration write-off2 |
(173) |
- |
- |
(173) |
|
|
Utilised |
- |
- |
(54) |
(54) |
|
|
Disposals |
- |
(42) |
- |
(42) |
|
|
Currency translation adjustment |
(76) |
(3) |
(3) |
(82) |
|
|
At 31 December 2024 |
5,545 |
181 |
65 |
5,791 |
|
|
Amortisation |
|||||
|
At 1 January 2023 |
- |
74 |
- |
74 |
|
|
Charge for the year |
- |
23 |
- |
23 |
|
|
Currency translation adjustment |
- |
5 |
- |
5 |
|
|
At 31 December 2023 |
- |
102 |
- |
102 |
|
|
Charge for the year |
- |
19 |
- |
19 |
|
|
Disposals |
- |
(42) |
- |
(42) |
|
|
Currency translation adjustment |
- |
(2) |
- |
(2) |
|
|
At 31 December 2024 |
- |
77 |
- |
77 |
|
|
Net book value |
|||||
|
At 31 December 2023 |
1,016 |
70 |
86 |
1,172 |
|
|
At 31 December 2024 |
5,545 |
104 |
65 |
5,714 |
1 Non-oil and gas assets relate to Group IT software of $71 million and carbon capture and storage activities, mainly related to the Viking CCS project of $33 million.
2 The exploration write-off of $173 million (2023: $57 million) includes the write off of costs associated with projects in the UK ($79 million) and licence relinquishments in Norway ($64 million).
12. Property, plant and equipment
|
Note |
Oil and gas assets $ million |
Fixtures and fittings & office equipment $ million |
Land and buildings1 $ million |
Total |
|
|
Cost |
|||||
|
At 1 January 2023 |
11,436 |
38 |
- |
11,474 |
|
|
Additions |
482 |
9 |
- |
491 |
|
|
Transfers to intangible assets |
11 |
- |
(7) |
- |
(7) |
|
Reclassification of asset held for sale |
(198) |
- |
- |
(198) |
|
|
Decrease in decommissioning asset |
21 |
(22) |
- |
- |
(22) |
|
Currency translation adjustment |
159 |
2 |
- |
161 |
|
|
At 31 December 2023 |
11,857 |
42 |
- |
11,899 |
|
|
Restated |
198 |
- |
- |
198 |
|
|
At 31 December 20223 as restated |
12,055 |
42 |
- |
12,097 |
|
|
Additions2 |
1,037 |
21 |
1 |
1,059 |
|
|
Additions from business combinations and joint arrangements |
14 |
9,951 |
20 |
40 |
10,011 |
|
Transfers from intangible assets |
11 |
39 |
- |
(1) |
38 |
|
Reclassification of asset held for sale |
18 |
(198) |
- |
- |
(198) |
|
Increase in decommissioning asset3 |
21 |
760 |
- |
- |
760 |
|
Disposals |
(1) |
(24) |
- |
(25) |
|
|
Currency translation adjustment |
(258) |
(2) |
(2) |
(262) |
|
|
At 31 December 2024 |
23,385 |
57 |
38 |
23,480 |
|
|
Accumulated depreciation |
|||||
|
At 1 January 2023 |
5,760 |
24 |
- |
5,784 |
|
|
Charge for the year |
1,192 |
3 |
- |
1,195 |
|
|
Impairment charge |
214 |
- |
- |
214 |
|
|
Reclassification of asset held for sale |
(103) |
- |
- |
(103) |
|
|
Currency translation adjustment |
91 |
1 |
- |
92 |
|
|
At 31 December 2023 |
7,154 |
28 |
- |
7,182 |
|
|
Restated |
79 |
- |
- |
79 |
|
|
At 31 December 2023 as restated |
7,233 |
28 |
- |
7,261 |
|
|
Charge for the year |
1,516 |
5 |
1 |
1,522 |
|
|
Impairment charge |
352 |
- |
- |
352 |
|
|
Reclassification of asset held for sale |
18 |
(124) |
- |
- |
(124) |
|
Disposals |
(1) |
(24) |
- |
(25) |
|
|
Currency translation adjustment |
(49) |
- |
- |
(49) |
|
|
At 31 December 2024 |
8,927 |
9 |
1 |
8,937 |
|
|
Net book value: |
|||||
|
At 31 December 2023 as restated |
4,822 |
14 |
- |
4,836 |
|
|
At 31 December 2024 |
14,458 |
48 |
37 |
14,543 |
1 Land and buildings include investment property of $2.6 million (2023: $nil).
2 Included within property, plant and equipment additions of $1,059 million (2023: $491 million) are associated cash flows of $884 million (2023: $496 million) and non-cash flow movements of $175 million (2023: $5 million) represented by a $93 million increase in capital accruals (2023: $30 million decrease), $64 million of capitalised lease depreciation (2023: $18 million) and $18 million of capitalised interest (2023: $7 million).
3 An increase in the decommissioning assets of $760 million (2023: $22 million) was made during the year as a result of both an update to the decommissioning estimates and new obligations (note 21).Impairment assessments
During the year, the Group recognised a pre-tax impairment charge of $352 million (post-tax $185 million) (2023: $176 million; post-tax $83 million). This comprised a pre-tax impairment charge representing a write-down of property, plant and equipment assets of $163 million (2023: $70 million) across three fields in the UK, mainly driven by further changes to the UK Energy Profits Levy and changes in life of field outlook, in addition to a fair value impairment on the Vietnam held for sale asset of $15 million. A pre-tax impairment charge of $174 million (2023: $106 million) was also recorded in respect of revisions to decommissioning estimates on late-life assets, and non-producing assets with no remaining net book value (see note 21).
In 2023, a net pre-tax impairment charge of $176 million was recognised as a result of impairments on two UK CGUs of $70 million, one driven by a reduction in the gas price forward curve and the other by a revised decommissioning cost profile, and a pre-tax impairment charge of $106 million in respect of revisions to decommissioning estimates on the Group's non-producing assets with no remaining net book value.
Key assumptions used in calculations
Assumptions used in impairment measurement include estimates of commercial reserves and production volumes, future oil and gas prices, discount rates and the level and timing of expenditures, all of which are inherently uncertain.
Commodity and carbon prices
The Group uses the fair value less cost of disposal method (FVLCD) to calculate the recoverable amount of the cash-generating units (CGU) consistent with a level 3 fair value measurement (see note 23). In determining the recoverable value, appropriate discounted-cash-flow valuation models were used, incorporating market-based assumptions. Management's commodity price curve assumptions are benchmarked against a range of external forward price curves on a regular basis. Individual field price differentials are then applied. The first three years reflect benchmarked consensus and market forward price curves transitioning to a long-term price from 2028, thereafter inflated at 2.5 per cent per annum. The long-term commodity prices used were $78 per barrel for Brent crude, 80 pence per therm for UK NBP gas and the European gas price at 2 per cent higher than UK NBP.
Production volumes and oil and gas reserves
Production volumes are based on life of field production profiles for each asset within the CGU. Proven and probable reserves are estimates of the amount of oil and gas that can be economically extracted from the Group's oil and gas assets. The Group estimates its reserves using standard recognised evaluation techniques, assessed at least annually by management. Proven and probable reserves are determined using estimates of oil and gas in place, recovery factors and future commodity prices.
Costs
Operating expenditure, capital investment and decommissioning costs are derived from the Group's business plan.
Discount rates
The discount rate reflects management's estimate of the Group's country-based weighted average cost of capital (WACC).
Foreign exchange rates
Based on management's long-term rate assumptions, with reference to a range of underlying economic indicators.
Sensitivity to changes in assumptions used in calculations
Reductions or increases in the long-term oil and gas prices of 10 per cent are considered to be reasonably possible changes for the purpose of sensitivity analysis. As shown in note 2 of the financial statements, the decreases to the long-term oil and gas prices from 2028 specified above would result in a further pre-tax impairment of $330 million (post-tax $99 million) and increases to the long-term oil and gas prices would result in a no material change to the impairment charge.
Considering the discount rates, the Group believes a one per cent increase in the post-tax discount rate is considered to be a reasonable possibility for the purpose of sensitivity analysis. A one per cent increase in the post-tax discount rate would lead to a further pre-tax impairment of $113 million (post-tax $33 million) on oil and gas assets and $10 million on goodwill, and a one per cent decrease in the post-tax discount rate would lead to a lower pre-tax impairment charge of $129 million (post-tax $41 million).
13. Leases
This note provides information for leases where the Group is a lessee.
Balance sheet
|
Right-of-use assets |
Note |
Land and buildings $ million |
Drilling $ million |
FPSO |
Offshore facilities $ million |
Equipment $ million |
Total $ million |
|
Cost |
|||||||
|
At 1 January 2023 |
88 |
169 |
562 |
334 |
20 |
1,173 |
|
|
Additions during the year |
25 |
- |
- |
- |
1 |
26 |
|
|
Cost revisions/remeasurements |
1 |
48 |
63 |
(6) |
4 |
110 |
|
|
Reclassification of asset held for sale |
2 |
(5) |
- |
(71) |
- |
- |
(76) |
|
Disposals |
(4) |
(19) |
- |
- |
- |
(23) |
|
|
Currency translation adjustment |
4 |
10 |
- |
- |
1 |
15 |
|
|
At 31 December 2023 |
109 |
208 |
554 |
328 |
26 |
1,225 |
|
|
Restated |
5 |
- |
71 |
- |
- |
76 |
|
|
At 31 December 2023 as restated |
114 |
208 |
625 |
328 |
26 |
1,301 |
|
|
Additions during the year1 |
27 |
166 |
- |
- |
- |
193 |
|
|
Additions from business combinations and joint arrangements1 |
55 |
4 |
- |
- |
47 |
106 |
|
|
Cost revisions/remeasurements |
6 |
38 |
3 |
32 |
(11) |
68 |
|
|
Reclassification of asset held for sale |
18 |
- |
- |
(71) |
- |
(2) |
(73) |
|
Disposals |
(5) |
- |
- |
- |
- |
(5) |
|
|
Currency translation adjustment |
(3) |
(5) |
- |
- |
(1) |
(9) |
|
|
At 31 December 2024 |
194 |
411 |
557 |
360 |
59 |
1,581 |
|
|
Accumulated depreciation |
|||||||
|
At 1 January 2023 |
26 |
129 |
209 |
61 |
13 |
438 |
|
|
Charge for the year |
9 |
42 |
94 |
89 |
5 |
239 |
|
|
Reclassification of asset held for sale |
2 |
(2) |
- |
(23) |
- |
- |
(25) |
|
Disposals |
(4) |
(19) |
- |
- |
- |
(23) |
|
|
Currency translation adjustment |
1 |
7 |
- |
- |
1 |
9 |
|
|
At 31 December 2023 |
30 |
159 |
280 |
150 |
19 |
638 |
|
|
Restated |
2 |
- |
29 |
- |
- |
31 |
|
|
As 31 December 2023 as restated |
32 |
159 |
309 |
150 |
19 |
669 |
|
|
Charge for the year |
16 |
99 |
83 |
76 |
11 |
285 |
|
|
Impairment charge2 |
20 |
- |
- |
- |
- |
20 |
|
|
Reclassification of asset held for sale |
18 |
- |
- |
(40) |
- |
- |
(40) |
|
Disposals |
(5) |
- |
- |
- |
- |
(5) |
|
|
Currency translation adjustment |
(1) |
(3) |
- |
- |
- |
(4) |
|
|
At 31 December 2024 |
62 |
255 |
352 |
226 |
30 |
925 |
|
|
Net book value |
|||||||
|
At 31 December 2023 as restated |
82 |
49 |
316 |
178 |
7 |
632 |
|
|
At 31 December 2024 |
132 |
156 |
205 |
134 |
29 |
656 |
1 Additions of $299 million including $106 million related to business combinations (note 14) were made to the right-of-use assets during the year (2023: total additions of $26 million related to new land and buildings).
2 The impairment charge of $20 million relates to one of the Group's office buildings in the UK.
|
Lease liabilities |
Note |
2024 $ million |
2023 As restated $ million |
|
At 1 January as restated |
768 |
825 |
|
|
Additions |
193 |
28 |
|
|
Additions from business combinations and joint arrangements |
14 |
118 |
- |
|
Remeasurement |
67 |
110 |
|
|
Finance costs charged to income statement |
7 |
53 |
51 |
|
Finance costs charged to decommissioning provision |
21 |
1 |
1 |
|
Reclassification of liabilities as held for sale |
18 |
(78) |
- |
|
Lease payments |
(319) |
(262) |
|
|
Currency translation adjustment |
(11) |
15 |
|
|
At 31 December |
792 |
768 |
|
|
Classified as: |
|||
|
Current |
241 |
216 |
|
|
Non-current |
551 |
552 |
|
|
Total lease liabilities |
792 |
768 |
The significant portion of the Group's lease liabilities represent lease arrangements for an FPSO vessel on the Catcher asset, and offshore facilities on the Tolmount asset oil and gas infrastructure assets in the UK business unit.
The lease liabilities and associated right-of-use-assets have been calculated by reference to in-substance fixed lease payments in the underlying agreements incurred throughout the non-cancellable period of the lease along with periods covered by options to extend and terminate the lease where the Group is reasonably certain that such options will be exercised. When assessing whether extension options were likely to be exercised, assumptions are consistent with those applied when testing for impairment.
Income statement
|
Depreciation charge of right-of-use assets |
Note |
2024 $ million |
2023 $ million |
|
Land and buildings - non-oil and gas assets1 |
35 |
8 |
|
|
Land and buildings - oil and gas assets |
1 |
1 |
|
|
Drilling rigs |
99 |
42 |
|
|
FPSO |
83 |
99 |
|
|
Offshore facilities |
77 |
89 |
|
|
Equipment - non-oil and gas assets |
1 |
1 |
|
|
Equipment - oil and gas assets |
9 |
4 |
|
|
305 |
244 |
||
|
Capitalisation of IFRS 16 lease depreciation2 |
|||
|
Drilling rigs |
(77) |
(25) |
|
|
Equipment |
(4) |
(2) |
|
|
Depreciation charge included within consolidated income statement |
224 |
217 |
|
|
Lease interest |
7 |
53 |
51 |
1 Includes impairment charge of $20 million related to one of the Group's office building in the UK.
2 Of the $81 million (2023: $27 million) capitalised IFRS 16 lease depreciation, $64 million (2023: $18 million) has been capitalised within property, plant and equipment and $17 million (2023: $9 million) within provisions (note 21).
The total cash outflow for leases in 2024 was $319 million (2023: $259 million).
14. Business combinations
Business combinations during the year ended 31 December 2024
On 3 September 2024, the Group closed the transaction to acquire substantially all of Wintershall Dea's upstream assets from BASF and LetterOne, including those in Norway, Germany, Denmark, Argentina, Mexico, Egypt, Libya and Algeria as well as Wintershall Dea's carbon capture and storage (CCS) licences in Europe. The Group acquired the portfolio as it significantly increases production capacity and provides geographic diversification, adding high quality assets with material positions in Norway, Germany, Argentina, North Africa and Mexico. It also strengthens the Group's financial position, delivering investment grade credit ratings post-transaction. The Group acquired control through the payment of cash and issuance of shares to BASF and LetterOne.
A purchase price allocation (PPA) exercise has been performed under which the identifiable assets and liabilities of Wintershall Dea were recognised at fair value. The fair values, and resulting goodwill, are provisional and will be finalised in Harbour's full year 2025 financial statements. The provisional fair values of the net identifiable assets as at the date of acquisition are as follows:
|
Note |
Fair value recognised on acquisition $ million |
|
|
Non-current assets |
||
|
Other intangible assets |
11 |
4,409 |
|
Property, plant and equipment |
12 |
10,011 |
|
Right-of-use assets |
13 |
106 |
|
Deferred tax assets |
8 |
147 |
|
Other receivables |
16 |
56 |
|
Other financial assets |
23 |
52 |
|
Current assets |
||
|
Inventories |
15 |
213 |
|
Trade and other receivables |
16 |
1,305 |
|
Other financial assets |
23 |
188 |
|
Cash and cash equivalents |
17 |
748 |
|
Total assets |
17,235 |
|
|
Non-current liabilities |
||
|
Borrowings |
22 |
3,038 |
|
Provisions |
21,28 |
2,616 |
|
Deferred tax |
8 |
5,500 |
|
Trade and other payables |
20 |
25 |
|
Lease creditor |
13 |
86 |
|
Other financial liabilities |
23 |
99 |
|
Current liabilities |
||
|
Trade and other payables |
20 |
1,134 |
|
Borrowings |
22 |
41 |
|
Lease creditor |
13 |
32 |
|
Provisions |
21,28 |
324 |
|
Current tax liabilities |
8 |
1,128 |
|
Other financial liabilities |
23 |
218 |
|
Total liabilities |
14,241 |
|
Fair value of identifiable net assets acquired |
2,994 |
|
|
Subordinated notes measured at fair value1 |
26 |
(1,548) |
|
Goodwill arising on acquisition |
10 |
3,845 |
|
Purchase consideration transferred |
5,291 |
1 Subordinated notes accounted for within equity, see note 26.
The fair values of the oil and gas assets and intangible assets acquired have been determined using valuation techniques based on discounted cash flows using forward curve commodity prices and estimates of long-term prices consistent with those applied by management when testing assets for impairment, a discount rate based on market observable data and cost and production profiles generally consistent with the 2P and a component of 2C reserves, if applicable, acquired with each asset. Where applicable, other observable market information has also been used.
The decommissioning provisions recognised have been estimated based on Harbour's internal estimates with reference to observable market data, including rig rates.
The equity consideration settled in ordinary shares of $2,513 million has been calculated based on 669,714,027 BASF consideration shares being issued by the company at a price of £2.86 per share, being the closing price of ordinary shares on the acquisition date and translated at the spot pound sterling to US dollar rate on that date of £1:$1.3122.
The equity consideration settled in non-voting shares of $944 million has been calculated based on 251,488,211 non-voting shares being issued at their fair value, measured in accordance with IFRS 13 Fair Value Measurement. A binomial lattice valuation methodology has been utilised to determine the fair value of the non-voting shares based on the value of ordinary shares with inputs that reflect the different features of these shares. Key assumptions input into the fair value model include: timing and quantum of future dividend payments; estimates of the timing of lifting of relevant sanctions on the minority ultimate beneficial owners of LetterOne; estimated date of conversion to ordinary shares under certain conditions; expected volatility of ordinary shares; appropriate discount rate; and discount for lack of marketability. The resultant fair value of a non-voting share has been determined to closely approximate that of an ordinary share, £2.86 per share, being the closing price of ordinary shares on the acquisition date and translated at the spot pound sterling to US dollar rate on that date of £1:$1.3122.
The acquisition date fair value of the trade receivables amounts to $936 million. The gross amount of trade receivables is $1,015 million, which is expected to be collected within contractual terms.
The fair value of the subordinated notes has been determined by reference to quoted market prices in Euros translated to US dollars at the exchange rate prevailing on the date of acquisition.
The goodwill of $3,845 million arises principally from the requirement to recognise deferred tax assets and liabilities for the difference between the assigned fair values and the tax bases of the acquired assets and liabilities assumed in a business combination. The assessment of fair values of oil and gas assets acquired is based on cash flows after tax. Nevertheless, in accordance with IAS 12 Income Taxes, paragraphs 15 and 19, a provision is made for deferred tax corresponding to the tax rate multiplied by the difference between the acquisition cost and the tax base. The offsetting entry to this deferred tax is goodwill. Hence, goodwill arises as a technical effect of deferred tax (technical goodwill).
There are no specific IFRS guidelines pertaining to the allocation of technical goodwill and management has therefore applied the general guidelines for allocating goodwill. Technical goodwill is allocated by segment, in line with where it arises, and none is expected to be deductible for income tax purposes.
From the date of acquisition, the Wintershall Dea assets contributed $2,021 million of revenue and $867 million to profit before tax from continuing operations of the Group. If the combination had taken place at the beginning of the year, revenue from continuing operations would have been $10,516 million and profit before tax from continuing operations for the Group would have been $3,017 million.
|
$ million |
|
|
Purchase consideration |
|
|
Shares issued, at fair value |
3,457 |
|
Cash paid |
1,782 |
|
Contingent consideration |
52 |
|
Total consideration |
5,291 |
|
Analysis of cash flows on acquisition: |
|
|
Transaction costs of the acquisition (included in cash flows from operating activities) |
(118) |
|
Net cash acquired with the subsidiaries (included in cash flows from investing activities) |
748 |
|
Transaction costs attributable to issuance of shares (included in cash flows from financing activities, net of tax) |
(1) |
|
Net cash flow on acquisition |
629 |
It should be noted that, at the date of completion, a cash payment of $1,792 million was made to the former owners of Wintershall Dea. This payment is reflected in the consolidated statement of cash flows. Subsequently, and as contemplated by the business combination agreement, a reduction in cash consideration payable of $10 million was identified, reducing the cash consideration to $1,782 million. This is reflected in the fair value of consideration above. As the review period is ongoing, and further adjustments may be identified, this $10 million has not yet been repaid to the company.
Transaction costs of $119 million (2023: $33 million) were expensed and are included in administrative expenses.
Contingent consideration
As part of the purchase agreement with the previous owners of the Wintershall Dea assets, contingent consideration has been agreed, dependent on the average Brent price during six six-month periods ending 18, 24, 30, 36, 42 and 48 months after completion. If during any of these six-month periods, the average Brent price is:
|
§ |
Greater than or equal to $86 per barrel but less than or equal to $100 per barrel, a cash payment of $30 million will be made; |
|
§ |
greater than $100 per barrel, a cash payment of $50 million will be made; or |
|
§ |
less than $86 per barrel, no cash payment will be made. |
As at the acquisition date, the fair value of the contingent consideration was estimated to be $52 million, determined using an option pricing model. The contingent consideration is classified as a long-term other financial liability (see note 23).
15. Inventories
|
2024 $ million |
2023 As restated $ million |
||
|
Hydrocarbons |
56 |
49 |
|
|
Consumables and subsea supplies |
312 |
168 |
|
|
Total inventories |
368 |
217 |
Inventories of consumables and subsea supplies include a provision of $39 million (2023: $28 million) where it is considered that the net realisable value is lower than the original cost.
Inventories recognised as an expense during the year ended 31 December 2024 amounted to $7 million (2023: $1 million). These expenses are included within production costs.
16. Trade and other receivables
|
2024 $ million |
2023 As restated $ million |
||
|
Trade receivables |
1,203 |
372 |
|
|
Underlift position |
175 |
146 |
|
|
Other debtors |
249 |
86 |
|
|
Prepayments and accrued income |
631 |
223 |
|
|
Corporation tax receivable |
58 |
46 |
|
|
Total trade and other receivables |
2,316 |
873 |
Trade receivables are non-interest bearing and are generally on 20-to-30-day terms. As at 31 December 2024, there were $433 million of trade receivables that were past due (2023: $nil), primarily relating to operations in the Mexico and North Africa segments.
Prepayments and accrued income mainly comprise amounts due, but not yet invoiced, for the sale of oil and gas.
The carrying value of the trade and other receivables are equal to their fair value as at the balance sheet date.
During the fourth quarter of 2024, the Group issued a credit default swap (CDS) for a notional amount of $60 million to a third-party financial institution. The CDS relates to secured borrowing provided by the financial institution to one of the Group's customers in Mexico. The secured borrowing was utilised by the customer to pay certain of our outstanding receivables. The notional amount of the CDS outstanding as of 31 December 2024 was $32 million and will reduce on a monthly basis over its 22-month term. The fair value of this derivative liability was not material as at 31 December 2024.
Other long-term receivables
|
2024 $ million |
2023 As restated $ million |
||
|
Net investment in sublease |
- |
37 |
|
|
Decommissioning funding asset1 |
59 |
56 |
|
|
Other receivables2 |
107 |
216 |
|
|
Prepayments and accrued income |
10 |
- |
|
|
Total other long-term receivables |
176 |
309 |
1 The decommissioning funding asset relates to the decommissioning liability agreement entered into with E.ON who will reimburse 70 per cent on the net share of the total decommissioning cost of the two assets in the UK to a maximum possible funding of £63 million. At 31 December 2024, a long-term decommissioning funding asset of $59 million (2023: $56 million) has been recognised.
2 Other receivables includes $44 million in cash held in escrow accounts for expected future decommissioning expenditure in Indonesia (2023: $39 million). Other receivables at December 2023 also included $21 million held as security for the Mexican letters of credit, and $42 million related to the non-current element of the unamortised portion of issue costs and bank fees related to the RBL (see note 22).
17. Cash and cash equivalents
|
2024 $ million |
2023 As restated $ million |
||
|
Cash at banks and in hand |
805 |
286 |
Cash at bank earns interest at floating rates based on daily bank deposit rates. The Group only deposits cash with major banks of high-quality credit standing.
Included in cash and cash equivalents at 31 December 2024 were amounts in Argentina totalling $173 million (2023: $nil) subject to currency controls or other legal restrictions. In addition, the cash and cash equivalents balance includes an amount of $43 million (2023: $nil) required to cover initial margin on trading exchanges, counterparty margining on outstanding commodity trades and all other balances subject to restriction.
18. Assets held for sale
In December 2024, the Group entered into an exclusivity agreement to sell its business in Vietnam, which holds 53.125 per cent interest in the Chim Sáo and Dua producing fields, to EnQuest for a consideration of $84 million. The transaction has an effective date of 1 January 2024. The assets and liabilities of Vietnam have been classified as assets held for sale in the balance sheet as at 31 December 2024, as completion is expected to be achieved by the second quarter of 2025.
The Group's Vietnam operations are included in the Southeast Asia segment, previously International, however are not considered a major geographical area or line of business and therefore the disposal has not been classified as discontinued operations.
In the prior period, the Vietnam business had also been classified as held for sale based on a prior agreement. In August 2023, the Group had entered into a Sale and Purchase Agreement to sell its business in Vietnam to Big Energy Joint Stock Company, however this was terminated in May 2024. As a result the Vietnam business was declassified as assets held for sale. Therefore, the relevant amounts presented as assets held for sale in 31 December 2023 have been reclassified to reflect this.
The major classes of assets and liabilities of the Group as held for sale as at 31 December 2024 are as follows:
|
Note |
2024 $ million |
||
|
Current |
|||
|
Assets |
|||
|
Property, plant and equipment |
12 |
74 |
|
|
Right-of-use-assets |
13 |
33 |
|
|
Other receivables and working capital |
170 |
||
|
Assets held for sale |
277 |
||
|
Liabilities |
|||
|
Provisions |
21 |
90 |
|
|
Lease creditor |
13 |
78 |
|
|
Trade and other payables |
46 |
||
|
Deferred tax |
8 |
19 |
|
|
Liabilities directly associated with assets held for sale |
233 |
||
|
Net assets directly associated with disposal group |
44 |
||
|
Impairment loss recorded |
10 |
Immediately before the classification of the disposal group as assets held for sale, the recoverable amount was estimated for the disposal group and no impairment loss was identified. The assets in the disposal group are held at the lower of their carrying amount and fair value less costs to sell. As at 31 December 2024, a post-tax impairment of $10 million was recognised as the fair value less cost to sell, being the expected consideration adjusted for items agreed under the SPA, was below the carrying amount of the disposal group. Following the impairment charge the net assets directly associated with the disposal group held on the consolidated balance sheet was $44 million.
19. Commitments
Capital commitments
As at 31 December 2024, the Group had commitments for future capital expenditure amounting to $1,690 million (2023: $389 million). Where the commitment relates to a joint arrangement, the amount represents the Group's net share of the commitment. Where the Group is not the operator of the joint arrangement then the amounts are based on the Group's net share of committed future work programmes.
20. Trade and other payables
|
2024 $ million |
2023 As restated $ million |
||
|
Current |
|||
|
Trade payables |
1,365 |
680 |
|
|
Overlift position |
207 |
33 |
|
|
Other payables |
132 |
144 |
|
|
Matured financial instruments |
27 |
48 |
|
|
Deferred income1 |
24 |
10 |
|
|
1,755 |
915 |
||
|
Non-current |
|||
|
Other payables |
19 |
13 |
|
|
Deferred income1 |
11 |
- |
|
|
30 |
13 |
1 Deferred income includes $19 million (2023: $nil) relating to payments for oil not yet delivered and $5 million (2023: $10 million) in relation to the closing year-end fair value payable to FlowStream who historically provided funding for the Solan asset in the UK in return for a share in production.
21. Provisions
|
Decom--missioning provision $ million |
Pension provision $ million |
Employee obligation provision $ million |
Onerous contract provision $ million |
Other provisions $ million |
Total $ million |
|
|
At 1 January 2023 |
4,141 |
- |
24 |
- |
- |
4,165 |
|
Additions |
40 |
- |
- |
- |
- |
40 |
|
Changes in estimates - decrease to oil and gas tangible decommissioning assets |
(203) |
- |
- |
- |
- |
(203) |
|
Changes in estimates on oil and gas tangible assets - debit to income statement |
141 |
- |
- |
- |
- |
141 |
|
Changes in estimate on oil and gas intangible assets - debit to income statement |
4 |
- |
- |
- |
- |
4 |
|
Changes in estimate - debit to income statement |
- |
- |
3 |
- |
- |
3 |
|
Amounts used |
(248) |
- |
- |
- |
- |
(248) |
|
Reclassification of liabilities directly associated with assets held for sale |
(87) |
- |
- |
- |
- |
(87) |
|
Interest on decommissioning lease |
(1) |
- |
- |
- |
- |
(1) |
|
Depreciation, depletion and amortisation on decommissioning right-of-use leased asset |
(9) |
- |
- |
- |
- |
(9) |
|
Unwinding of discount |
156 |
- |
- |
- |
- |
156 |
|
Currency translation adjustment |
87 |
- |
- |
- |
- |
87 |
|
At 31 December 2023 |
4,021 |
- |
27 |
- |
- |
4,048 |
|
Restated |
87 |
- |
- |
- |
- |
87 |
|
At 31 December 2023 as restated |
4,108 |
- |
27 |
- |
- |
4,135 |
|
Additions |
36 |
- |
- |
- |
- |
36 |
|
Additions from business combinations and joint arrangements |
2,511 |
40 |
40 |
65 |
284 |
2,940 |
|
Changes in estimates - increase to oil and gas tangible decommissioning assets |
550 |
- |
- |
- |
- |
550 |
|
Changes in estimates - increase to oil and gas intangible assets |
6 |
- |
- |
- |
- |
6 |
|
Changes in estimate on oil and gas tangible assets - debit to income statement |
174 |
- |
- |
- |
- |
174 |
|
Changes in estimate on oil and gas intangible assets - debit to income statement |
6 |
- |
- |
- |
- |
6 |
|
Changes in estimate - debit to income statement |
3 |
3 |
29 |
- |
28 |
63 |
|
Actuarial gains and losses |
- |
7 |
- |
- |
- |
7 |
|
Amounts used |
(284) |
(1) |
(25) |
(30) |
(36) |
(376) |
|
Reclassification of liabilities directly associated with assets held for sale |
(90) |
- |
- |
- |
- |
(90) |
|
Interest on decommissioning lease |
(1) |
- |
- |
- |
- |
(1) |
|
Depreciation, depletion and amortisation on decommissioning right-of-use leased asset |
(17) |
- |
- |
- |
- |
(17) |
|
Unwinding of discount |
221 |
- |
- |
- |
- |
221 |
|
Currency translation adjustment |
(109) |
(3) |
(3) |
- |
(18) |
(133) |
|
At 31 December 2024 |
7,114 |
46 |
68 |
35 |
258 |
7,521 |
|
Classified within |
Non-current liabilities $ million |
Current liabilities $ million |
Total $ million |
|||
|
At 31 December 2023 |
3,905 |
230 |
4,135 |
|||
|
At 31 December 2024 |
7,024 |
497 |
7,521 |
All of the $36 million decommissioning provision additions relate to oil and gas tangible assets (2023: $40 million).
Decommissioning provision
The Group provides for the estimated future decommissioning costs on its oil and gas assets at the balance sheet date. The payment dates of expected decommissioning costs are uncertain and are based on economic assumptions of the fields concerned. The Group currently expects to incur decommissioning costs within the next 40 years, around half of which are anticipated to be incurred between the next 10 to 20 years. These estimated future decommissioning costs are inflated at the Group's long-term view of inflation of 2.5 per cent per annum (2023: 2.5 per cent per annum) and discounted at a risk-free rate of between 2.2 per cent and 6.6 per cent (2023: 4.3 per cent and 5.2 per cent) reflecting a 6-month (2023: six-month) rolling average of market rates over the varying lives of the assets to calculate the present value of the decommissioning liabilities. The unwinding of the discount is presented within finance costs.
These provisions have been created based on internal and third-party estimates. Assumptions based on the current economic environment have been made, which management believe are a reasonable basis upon which to estimate the future liability. These estimates are reviewed regularly to consider any material changes to the assumptions. However, actual decommissioning costs will ultimately depend upon market prices for the necessary decommissioning work required, which will reflect market conditions at the relevant time. In addition, the timing of decommissioning liabilities will depend upon the dates when the fields become economically unviable, which in itself will depend on future commodity prices and climate change, which are inherently uncertain.
Pension provision
Please refer to note 28 for pension provisions.
Employee obligation provisions
Employee obligation provisions of $68 million relate to obligations to pay long-service bonuses, anniversary bonuses, and variable remuneration, including the associated social security contributions and provisions due to early retirement as well as phased-in early retirement models. This includes a termination benefit provision in Indonesia of $26 million (2023: $27 million), where the Group operates a service, severance and compensation pay scheme under a collective labour agreement with the local workforce.
Onerous contract provision
The onerous contract provision of $35 million (2023: $nil) relates to working programmes in Libya due to force majeure conditions in-country.
Other provisions
Other provisions mainly includes a $132 million provision related to gas migration in Rehden, Germany arising from a commercial settlement entered into by Wintershall Dea and a third party at the time of the Wintershall and Dea merger in 2019 and a $61 million provision related to restructuring programmes within Norway, Germany and Mexico.
22. Borrowings and facilities
The Group's borrowings are carried at amortised cost:
|
2024 $ million |
2023 $ million |
|
|
Reserves-based lending (RBL) facility |
5,011 |
493 |
|
Bond |
218 |
- |
|
Other loans |
- |
16 |
|
Total borrowings |
5,229 |
509 |
|
Classified within: |
||
|
Current liabilities |
4,215 |
493 |
|
Non-current liabilities |
1,014 |
16 |
|
Total provisions |
5,229 |
509 |
Bonds
|
31 December 2024 |
||||||
|
% |
Maturity |
Currency |
Nominal value €/$ million |
Fair value |
Carrying value $ million |
|
|
Bond ISIN: XS2054209833 |
0.8 |
2025 |
EUR |
1,000 |
1,019 |
1,014 |
|
Bond ISIN: US411618AB75/ USG4289TAA19 |
5.5 |
2026 |
USD |
500 |
499 |
496 |
|
Bond ISIN: XS2054210252 |
1.3 |
2028 |
EUR |
1,000 |
962 |
954 |
|
Bond ISIN: XS2908093805 |
3.8 |
2029 |
EUR |
700 |
729 |
720 |
|
Bond ISIN: XS2055079904 |
1.8 |
2031 |
EUR |
1,000 |
905 |
901 |
|
Bond ISIN: XS2908095172 |
4.4 |
2032 |
EUR |
900 |
940 |
926 |
In October 2021, Harbour Energy Finance Limited, a subsidiary of Harbour, issued a $500 million bond under Rule 144A and with a tenor of five years to maturity. The coupon was set at 5.50 per cent and interest is payable semi-annually.
Under the terms of the business combination entered into between the company, BASF and LetterOne, three existing Wintershall Dea bonds were ported to Harbour Energy on completion of the acquisition.
As at 31 December 2024, the fair value of these bonds, which is determined using quoted market prices in an active market, amounts to $2,886 million. The repayment obligation remains at €3,000 million ($3,106 million).
On 26 September 2024, Harbour announced that Wintershall Dea Finance BV as issuer, a subsidiary of Harbour, priced an offering on 25 September 2024 of €700 million in aggregate principal amount of 3.830 per cent senior notes due 2029 and €900 million in aggregate principal amount of 4.357 per cent senior notes due. Harbour primarily used the proceeds from this offering to repay and cancel the $1.5 billion bridge facility utilised for the Wintershall Dea acquisition which completed on 3 September 2024.
The previous reserves based lending (RBL) facility was replaced upon completion of the acquisition by the new bridge and revolving credit facility (RCF).
At the balance sheet date, the outstanding RCF balance, excluding incremental arrangement fees, related costs and letters of credit, was $250 million (2023: RBL $nil). As at 31 December 2024, $1,854 million remained available for drawdown under the RCF (2023: $1,972 million under the RBL).
The Group has facilities to issue up to $1,750 million of letters of credit (2023: $1,750 million), of which $871 million (2023: $1,186 million) was in issue as at 31 December 2024, mainly in respect of future decommissioning liabilities.
Arrangement fees and related costs of $276 million were capitalised when the three existing Wintershall Dea bonds were ported to Harbour Energy on completion of the acquisition. In addition, $34 million of arrangement fees and related costs in relation to the RCF, $13 million in relation to the bridge facility and $11 million related to the €700 million and €900 million senior notes, were capitalised during the year. $102 million of arrangement fees and related costs were amortised during the year and are included within financing costs, including $66 million related to the RBL facility and $13 million related to the bridge facility, upon termination of those facilities.
At 31 December 2024, $284 million of arrangement fees and related costs remain capitalised (2023: $68 million). $32 million of these arrangement fees relate to the RCF, and a further $252 million (2023: $7 million) relate to the bond facilities.
Interest of $34 million on the bonds and RCF facilities (Dec 2023: $6 million related to the $500 million bond interest) had accrued by the balance sheet date and has been classified within accruals.
Other loans at 31 December 2023 represent a commercial financing arrangement with Baker Hughes (formerly BHGE) was repaid in full in December 2024.
The table below details the change in the carrying amount of the Group's borrowings arising from financing cash flows:
|
$ million |
||
|
Total borrowings as at 1 January 2023 |
1,238 |
|
|
Proceeds from drawdown of borrowing facilities |
660 |
|
|
Repayment of RBL |
(1,435) |
|
|
Repayment of financing arrangement |
(21) |
|
|
Repayment of exploration finance facility loan |
(11) |
|
|
Arrangement fees and related costs capitalised |
(34) |
|
|
Financing arrangement interest payable |
3 |
|
|
Amortisation of arrangement fees and related costs |
48 |
|
|
Reclassification of RBL arrangement fees and related costs to current and non-current assets |
61 |
|
|
Total borrowings as at 31 December 2023 |
509 |
|
|
Reclassification of capitalised RBL arrangement fees and related costs as borrowings |
(61) |
|
|
Proceeds from RBL facility |
178 |
|
|
Repayment of RBL facility |
(178) |
|
|
Proceeds from issue of bridge facility |
1,500 |
|
|
Repayment of bridge facility |
(1,500) |
|
|
Bond debt arising on business combination (net of arrangement fees and related costs) |
3,038 |
|
|
Proceeds from issue of new bonds |
1,728 |
|
|
Proceeds from issue of revolving credit facility |
2,225 |
|
|
Repayment of revolving credit facility |
(1,975) |
|
|
Arrangement fees and related costs capitalised |
(58) |
|
|
Amortisation of arrangement fees and related costs |
102 |
|
|
Repayment of financing arrangement |
(17) |
|
|
Financing arrangement interest payable |
1 |
|
|
Currency translation adjustment on Euro bonds |
(263) |
|
|
Total borrowings as at 31 December 2024 |
5,229 |
23. Other financial assets and liabilities
The Group held the following financial instruments at fair value at 31 December 2024. The fair values of all derivative financial instruments are classified in accordance with the hierarchy described in IFRS 13.
|
31 December 2024 |
31 December 2023 |
|||
|
Current |
Assets $ million |
Liabilities $ million |
Assets $ million |
Liabilities |
|
Measured at fair value through profit and loss |
||||
|
Foreign exchange derivatives |
- |
(25) |
6 |
- |
|
Commodity derivatives |
26 |
(14) |
- |
- |
|
Short term investments |
25 |
- |
- |
- |
|
Fair value of embedded derivative within gas contract |
5 |
- |
10 |
- |
|
56 |
(39) |
16 |
- |
|
|
Measured at fair value through other comprehensive income |
||||
|
Commodity derivatives |
89 |
(396) |
154 |
(197) |
|
Foreign exchange derivatives |
- |
(27) |
- |
- |
|
89 |
(423) |
154 |
(197) |
|
|
Total current |
145 |
(462) |
170 |
(197) |
|
Non-current |
||||
|
Measured at fair value through profit and loss |
||||
|
Commodity derivatives |
1 |
(2) |
- |
- |
|
Contingent consideration1 |
- |
(52) |
- |
- |
|
Other financial assets-investments |
7 |
- |
- |
- |
|
8 |
(54) |
- |
- |
|
|
Measured at fair value through other comprehensive income |
||||
|
Commodity derivatives |
36 |
(215) |
112 |
(87) |
|
Foreign exchange derivatives |
- |
(146) |
- |
- |
|
36 |
(361) |
112 |
(87) |
|
|
Total non-current |
44 |
(415) |
112 |
(87) |
|
Total current and non-current |
189 |
(877) |
282 |
(284) |
1 Contingent consideration relates to the Wintershall Dea transaction and will be paid between 18-48 months after completion, depending on the average Brent crude price during six-month periods. This is valued using an option pricing model.
Fair value measurements
All financial instruments that are initially recognised and subsequently remeasured at fair value have been classified in accordance with the hierarchy described in IFRS 13 'Fair Value Measurement'. The hierarchy groups fair value measurements into the following levels based on the degree to which the fair value is observable.
|
§ |
Level 1: fair value measurements are derived from unadjusted quoted prices for identical assets or liabilities |
|
§ |
Level 2: fair value measurements include inputs, other than quoted prices included within level 1, which are observable directly or indirectly |
|
§ |
Level 3: fair value measurements are derived from valuation techniques that include significant inputs not based on observable data |
|
Financial assets |
Financial liabilities |
||||
|
As at 31 December 2024 |
Level 1 $ million |
Level 2 $ million |
Level 3 $ million |
Level 2 $ million |
Level 3 $ million |
|
Fair value of embedded derivative within gas contract |
- |
5 |
- |
- |
- |
|
Commodity derivatives |
- |
152 |
- |
(627) |
- |
|
Argentinian bonds |
25 |
- |
- |
- |
- |
|
Foreign exchange derivatives |
- |
- |
- |
(198) |
- |
|
Investments |
- |
- |
7 |
- |
- |
|
Contingent consideration |
- |
- |
- |
- |
(52) |
|
Total fair value |
25 |
157 |
7 |
(825) |
(52) |
|
Financial assets |
Financial liabilities |
||||
|
As at 31 December 2023 |
Level 1 $ million |
Level 2 $ million |
Level 3 $ million |
Level 2 $ million |
Level 3 $ million |
|
Fair value of embedded derivative within gas contract |
- |
10 |
- |
- |
- |
|
Commodity derivatives |
- |
266 |
- |
(284) |
- |
|
Foreign exchange derivatives |
- |
6 |
- |
- |
- |
|
Total fair value |
- |
282 |
- |
(284) |
- |
There were no transfers between fair value levels in 2023 or 2024.
Fair value movements recognised in the income statement on financial instruments are shown below:
|
Finance income |
2024 $ million |
2023 $ million |
|
Change in fair value of embedded derivative within gas contract |
- |
68 |
|
Commodity derivatives |
5 |
- |
|
Argentinian bonds |
7 |
- |
|
Interest rate derivatives |
- |
(43) |
|
12 |
25 |
|
Finance expenses |
2024 $ million |
2023 $ million |
|
Change in fair value of embedded derivative within gas contract |
5 |
- |
|
Foreign exchange derivatives |
30 |
- |
|
35 |
- |
Fair values of other financial instruments
The following financial instruments are measured at amortised cost and are considered to have fair values different to their book values.
|
2024 |
2023 |
|||
|
As at 31 December 2024 |
Book value $ million |
Book value $ million |
Book value $ million |
Book value $ million |
|
USD bond |
(496) |
(499) |
(493) |
(487) |
|
EUR bonds |
(4,515) |
(4,555) |
- |
- |
|
Total |
(5,011) |
(5,054) |
(493) |
(487) |
The fair value of the bond is within level 2 of the fair value hierarchy and has been estimated by discounting future cash flows by the relevant market yield curve at the balance sheet date. The fair values of other financial instruments not measured at fair value including cash and short-term deposits, trade receivables, trade payables and floating rate borrowings equate approximately to their carrying amounts.
Cash flow hedge accounting
The Group uses a combination of fixed price physical sales contracts and cash-settled fixed price commodity swaps and options to manage the price risk associated with its underlying oil and gas revenues. As at 31 December 2024, all of the Group's cash-settled fixed price commodity swap derivatives have been designated as cash flow hedges of highly probable forecast sales of oil and gas.
The following table indicates the volumes, average hedged price and timings associated with the Group's commodity hedges:
|
Position as at 31 December 2024 |
2025 |
2026 |
2027 |
|
|
Oil |
||||
|
Total oil volume hedged (thousand bbls) |
16,162 |
12,881 |
- |
|
|
- of which swaps |
15,598 |
12,881 |
- |
|
|
- of which zero cost collars |
564 |
- |
- |
|
|
Weighted average fixed price ($/bbl) |
76.47 |
72.88 |
- |
|
|
Weighted average collar floor and cap ($/bbl) |
60.00-86.78 |
- |
- |
|
|
Natural gas |
||||
|
Gas volume hedged (thousand boe) |
33,509 |
19,924 |
2,056 |
|
|
- of which swaps/fixed price forward sales |
26,912 |
16,817 |
2,056 |
|
|
- of which zero cost collars |
6,597 |
3,106 |
- |
|
|
Weighted average fixed price ($/mscf) |
12.91 |
10.79 |
11.29 |
|
|
Weighted average collar floor and cap ($/mscf) |
11.46-22.50 |
9.04-16.71 |
- |
As at 31 December 2024, the fair value of net commodity derivatives designated as cash flow hedges, all executed under ISDA agreements with no margining requirements, was a net payable of $513 million (2023: $66 million payable) and net unrealised pre-tax losses of $487 million (2023: $16 million) were deferred in other comprehensive income in respect of the effective portion of the hedge relationships.
Amounts deferred in other comprehensive income will be released to the income statement as the underlying hedged transactions occur. As at 31 December 2024, net deferred pre-tax losses of $307 million (2023: $51 million) are expected to be released to the income statement within one year.
Hedge ineffectiveness
The following table summarises the hedge ineffectiveness as at 31 December:
|
2024 $ million |
2023 $ million |
|||
|
Commodity derivatives |
- |
- |
||
|
Foreign exchange derivatives |
8 |
- |
||
|
8 |
- |
24. Financial risk factors and risk management
The Group's principal financial assets and liabilities comprise trade and other receivables, cash and short-term deposits accounts, trade payables, interest bearing loans and derivative financial instruments. The main purpose of these financial instruments is to manage short-term cash flow, price exposures and raise finance for the Group's expenditure programme.
Risk exposures and responses
The Group manages its exposure to key financial risks in accordance with its financial risk management policy. The objective of the policy is to support the delivery of the Group's financial targets while protecting future financial security. The main risks that could adversely affect the Group's financial assets, liabilities or future cash flows are market risks comprising commodity price risk, interest rate risk and foreign currency risk, liquidity risk, and credit risk. Management reviews and agrees policies for managing each of these risks which are summarised in this note.
The Group's management oversees the management of financial risks. The Group's senior management ensures that financial risk-taking activities are governed by appropriate policies and procedures and that financial risks are identified, measured and managed in accordance with Group policies and risk objectives. All derivative activities for risk management purposes are carried out by specialist teams that have the appropriate skills, experience and supervision. It is the Group's policy that no trading in derivatives for speculative purposes shall be undertaken.
Market risk
Market risk is the risk that the fair value of future cash flows of a financial instrument will fluctuate because of changes in market prices. Market risk comprises three types of risk: commodity price risk, interest rate risk and foreign currency risk. Financial instruments mainly affected by market risk include loans and borrowings, deposits and derivative financial instruments.
The sensitivity analyses in the following sections relate to the position as at 31 December 2024 and 31 December 2023.
The sensitivity analyses have been prepared on the basis that the number of financial instruments are all constant. The sensitivity analyses are intended to illustrate the sensitivity to changes in market variables on the composition of the Group's financial instruments at the balance sheet date and show the impact on profit or loss and shareholders' equity, where applicable.
The following assumptions have been made in calculating the sensitivity analyses:
|
§ |
The sensitivity of the relevant profit before tax item and/or equity is the effect of the assumed changes in respective market risks for the full year based on the financial assets and financial liabilities held at the balance sheet date |
|
§ |
The sensitivities indicate the effect of a reasonable increase in each market variable. Unless otherwise stated, the effect of a corresponding decrease in these variables is considered approximately equal and opposite |
|
§ |
Fair value changes from derivative instruments designated as cash flow hedges are considered fully effective and recorded in shareholders' equity, net of tax |
|
§ |
Fair value changes from derivatives and other financial instruments not designated as cash flow hedges are presented as a sensitivity to profit before tax only and not included in shareholders' equity |
Commodity price risk
The Group is exposed to the risk of fluctuations in prevailing market commodity prices on the mix of oil and gas products. On a rolling basis, the policy allows the Group to hedge the commodity price exposure associated with 40 to 70 per cent of the next 12 months' production (year 1), between 30 and 60 per cent of year 2 production, from year 3 up to 50 per cent of production and from year 4 up to 40 per cent of production. Current target is to hedge circa 50 per cent of year 1 and up to 30 per cent of year 2 commodity price exposure. The Group manages these risks through the use of fixed price contracts with customers for physical delivery and derivative financial instruments including fixed price swaps and options.
Commodity price sensitivity
The following table summarises the impact on the Group's pre-tax profit and equity from a reasonably foreseeable movement in commodity prices on the fair value of commodity based derivative instruments held by the Group at the balance sheet date.
|
As at 31 December 2024 |
Market movement |
Effect on profit before tax $ million |
Effect on equity $ million |
|
Brent oil price |
$10 /bbl increase |
- |
(91) |
|
Brent oil price |
$10 /bbl decrease |
- |
91 |
|
NBP gas price |
£0.1 /therm increase |
- |
(36) |
|
NBP gas price |
£0.1 /therm decrease |
- |
36 |
|
TTF |
$1.5 / MMBtu increase |
15 |
(14) |
|
TTF |
$1.5 / MMBtu decrease |
(15) |
14 |
|
THE |
$1.5 / MMBtu increase |
(15) |
(46) |
|
THE |
$1.5 / MMBtu decrease |
15 |
46 |
|
As at 31 December 2023 |
Market movement |
Effect on profit before tax $ million |
Effect on equity $ million |
|
Brent oil price |
$10 /bbl increase |
- |
(28) |
|
Brent oil price |
$10 /bbl decrease |
- |
28 |
|
NBP gas price |
£0.1 /therm increase |
- |
(28) |
|
NBP gas price |
£0.1 /therm decrease |
- |
28 |
Interest rate risk
Interest rate risk is the risk that the fair value of future cash flows of a financial instrument will fluctuate because of changes in market interest rates. The Group's exposure to the risk of changes in market interest rates relates primarily to the Group's long-term debt obligation with floating interest rates.
At 31 December 2024, floating rate borrowings comprise loans under the RCF which incurs interest between 5.9 and 6.6 per cent (based on the Secured Overnight Financing Rate (SOFR) plus a 1.45 per cent margin) and fixed rate borrowings comprise a $500 million high yield bond which incurs interest at 5.5 per cent per annum and bonds of €4.6 billion which incur interest at between 0.84 per cent and 4.357 per cent per annum (see note 22). As at 31 December 2023, fixed rate borrowings comprised a bond incurring interest at 5.5 per cent per annum, and no floating rate borrowings. Floating rate financial assets comprise cash and cash equivalents which earn interest at the relevant market rate. Prior to settlement of the RBL, the Group monitored its exposure to fluctuations in interest rates and uses interest rate derivatives to manage the fixed and floating composition of its borrowings.
The interest rate financial instruments in place at the balance sheet date are shown below:
|
Derivative |
Currency pair |
Notional amount |
Period of hedge |
Terms |
|
|
31 December 2024 |
Cross-currency interest rate swaps |
USD:EUR |
€363 million |
<1 year |
$1.1015:€1 |
|
€1,403 million |
2-5 years |
$1.1017-$1.1209:€1 |
|||
|
€650 million |
>5 years |
$1.1209:€1 |
|||
|
31 December 2023 |
Cross-currency interest rate swaps |
N/A |
$nil |
N/A |
N/A |
The cross-currency interest rate swaps relating to the Euro bonds have been designated as cash flow hedges where €2.4 billion was hedged at a forward rate of between 1.1015 and 1.1209.
The interest rate and currency profile of the Group's interest-bearing financial assets and liabilities are shown below:
|
As at 31 December 2024 |
Cash at bank $ million |
Fixed rate borrowings $ million |
Floating rate borrowings $ million |
Total $ million |
|
US dollar |
416 |
(496) |
(218) |
(298) |
|
Pound sterling |
75 |
- |
- |
75 |
|
Euro |
75 |
(4,515) |
- |
(4,440) |
|
Norwegian krone |
36 |
- |
- |
36 |
|
Argentinian pesos |
173 |
- |
- |
173 |
|
Mexican pesos |
10 |
- |
- |
10 |
|
Egyptian pound |
8 |
- |
- |
8 |
|
Other |
12 |
- |
- |
12 |
|
805 |
(5,011) |
(218) |
(4,424) |
|
As at 31 December 2023 As restated |
Cash at bank $ million |
Fixed rate borrowings $ million |
Floating rate borrowings $ million |
Total $ million |
|
US dollar |
244 |
(493) |
- |
(249) |
|
Pound sterling |
28 |
- |
- |
28 |
|
Norwegian krone |
13 |
- |
- |
13 |
|
Other |
1 |
- |
- |
1 |
|
286 |
(493) |
- |
(207) |
Interest rate sensitivity
The following table demonstrates the indicative pre-tax effect on profit and equity of applying a reasonably foreseeable increase in interest rates to the Group's financial assets and liabilities at the balance sheet date.
|
Market movement |
Effect on profit before tax $ million |
Effect on equity $ million |
|
|
31 December 2024 |
|||
|
US dollar interest rates |
+100 basis points |
1 |
- |
|
31 December 2023 |
|||
|
US dollar interest rates |
+100 basis points |
2 |
- |
Foreign currency risk
Foreign currency risk is the risk that the fair value or future cash flows of a financial instrument will fluctuate because of changes in foreign exchange rates.
The Group is exposed to foreign currency risk primarily arising from exchange rate movements in US dollar against a range of foreign currencies. To mitigate exposure to movements in exchange rates, wherever possible financial assets and liabilities are held in currencies that match the functional currency of the relevant entity. The Group has material subsidiaries with functional currencies of pound sterling, US dollar, Norwegian krone, Euro and Mexican pesos. Exposures can also arise from sales or purchases denominated in currencies other than the functional currency of the relevant entity, such exposures are monitored and hedged with agreement from the Board.
The Group enters into forward contracts as a means of hedging its exposure to foreign exchange rate risks. As at 31 December 2024, the Group had:
|
§ |
£212.5 million hedged at a forward rate of between $1.2482 and $1.2774:£1 for January 2025 |
|
§ |
NOK 9.6 billion hedged at forward rates of between NOK 10.9805 and NOK 11.3963:£1 for the period January 2025 to May 2025 |
As at 31 December 2023, the Group had £212 million hedged at a forward rate of between $1.2182 and $1.2742:£1 for the period from January 2024 to October 2024.
Foreign currency sensitivity
Changes in exchange rates could lead to losses in the value of financial instruments and adverse changes in future cash flows. Foreign currency risks from financial instruments arise from the translation of financial receivables, cash and cash equivalents and financial liabilities into the functional currency of the Group company at the closing rates. The following table demonstrates the sensitivity to a reasonably foreseeable change in US dollars against other currencies with all other variables held constant, on the Group's profit before tax (due to foreign exchange translation of monetary assets and liabilities). The impact of translating the net assets of foreign operations into US dollars is excluded from the sensitivity analysis.
|
Sensitivity (+10%) $ million |
Sensitivity $ million |
|
|
31 December 2024 |
||
|
Pound sterling |
239 |
(239) |
|
Argentinian peso |
(14) |
(14) |
|
Euro |
(267) |
267 |
|
Norwegian krone |
81 |
(81) |
|
Danish krone |
7 |
(7) |
|
Mexican peso |
(1) |
1 |
|
Egyptian pound |
(1) |
1 |
|
31 December 2023 |
||
|
Pound sterling |
78 |
(78) |
Credit risk
Credit risk is the risk that a counterparty will not meet its obligations under a financial instrument or customer commercial contract, leading to financial loss. Credit risks are managed on a Group basis. Group-wide procedures cover applications for credit approval for both financial and non-financial counterparties where appropriate. These procedures cover the granting and renewal of counterparty credit limits, the monitoring of exposures with respect to these limits and the requirements triggering secured payment terms.
The solvency of and credit exposures with all counterparties are monitored and assessed on a timely basis. If customers are independently rated, these ratings are primarily used for assessment. If there is no independent rating, the credit risk management function assesses customers' credit quality based on their financial position or bases the assessment on experience and other factors. In these cases, individual risk limits are set based on internal equivalent or by external ratings.
Credit risk in financial instruments arise from cash or cash equivalents and financial derivatives. The placing of liquid funds is subject to credit approval. Banks with a credit rating of "A "are normally used. In some cases, funds may be held in an overseas business unit with lower credit quality which may also be impacted by the country sovereign rating. In these situations, credit approval is given within the country risk environment. Derivative financial instruments are conducted with credit approved banks and financial institutions normally rated A- or better and selected credit approved commercial counterparties. Selectively derivatives may be conducted with local banks in asset territories below this rating subject to credit approval
The Group is exposed to credit risk from its operating activities, primarily for trade receivables, and from its financing activities. The Group seeks to trade only with recognised, creditworthy third parties. Trade receivables are monitored on an ongoing basis and credit exposures related to receivables mark to market positions are monitored closely for credit decline which may allow the provision of contractual credit support by a third party.
An indication of the concentration of credit risk on trade receivables is shown in note 4, whereby the revenue from one customer exceeds 54 per cent (2023: 88 per cent) of the Group's consolidated revenue.
With regard to Harbour's own credit risk management it has own corporate credit ratings from the credit rating agencies:
|
§ |
S&P Global at BBB- |
|
§ |
Fitch at BBB- |
|
§ |
Moody's at Baa2 |
In addition, each of the traded bonds have ratings from the credit ratings agencies.
Impairment on financial assets
In order to determine the impairment of financial assets, Harbour Energy uses either a general three-stage approach or the simplified approach, according to IFRS 9, as applicable. In the case of financial assets for which the simplified approach does not apply, their assessment takes place as at each reporting date to determine whether the credit risk on a financial instrument has increased significantly since its initial recognition.
Trade accounts receivable, other receivables including cash at bank and deposits are subject to the expected credit loss model. This is generally based on either externally provided or internal ratings for each debtor which, in certain cases, are updated based on recently available information.
To measure the expected credit losses on trade accounts receivable, Harbour Energy applies the simplified approach according to IFRS 9. Accordingly, the loss allowance is measured at an amount equal to the lifetime expected credit losses. For trade accounts receivable, the contractual payment term is usually 30 days. In deviation to this general rule, terms of up to one year are considered for the calculation of expected credit losses due to different regional payment practices.
The loss allowance for other receivables, including cash at bank and deposits is measured at an amount equal to the 12-month expected credit loss. If the term of the financial instrument is shorter than 12 months, the lifetime expected credit loss is applied.
|
As at 1 January 2024 $ million |
Additions from business combinations & joint arrangements $ million |
Additions $ million |
Reversals $ million |
Reclass between categories $ million |
Disposals $ million |
FX $million |
At 31 December 2024 $ million |
|
|
Trade receivables |
||||||||
|
Of which stage 21 |
- |
- |
22 |
(1) |
- |
- |
(1) |
20 |
|
Of which stage 32 |
- |
- |
- |
- |
- |
- |
- |
- |
|
- |
- |
22 |
(1) |
- |
- |
(1) |
20 |
|
|
Other receivables |
||||||||
|
Of which stage 21 |
- |
- |
- |
- |
- |
- |
- |
- |
|
Of which stage 32 |
- |
- |
2 |
- |
- |
- |
- |
2 |
|
- |
- |
2 |
- |
- |
- |
- |
2 |
|
|
Financial receivables and bank balances |
||||||||
|
Of which stage 13 |
- |
- |
- |
- |
- |
- |
- |
- |
|
Of which stage 21 |
- |
- |
- |
- |
- |
- |
- |
- |
|
Of which stage 32 |
- |
- |
- |
- |
- |
- |
- |
- |
|
- |
- |
- |
- |
- |
- |
- |
- |
|
|
Total |
- |
- |
24 |
(1) |
- |
- |
(1) |
22 |
1 The credit risk has increased significantly since initial recognition, the loss allowance for the financial assets is measured at an amount equal to the lifetime expected credit losses.
2 The financial asset is credit impaired.
3 The loss allowance for financial assets is measured at an amount equal to a 12-month expected credit loss.
Liquidity risk
Liquidity risk is the risk that the Group will encounter difficulty in meeting obligations associated with financial liabilities that are settled by delivering cash or another financial asset. The Group monitors the amount of borrowings maturing within any specific period and expects to meet its financing commitments from the operating cash flows of the business and existing committed lines of credit. The table below summarises the maturity profile of the Group's financial liabilities based on contractual undiscounted payments:
|
As at 31 December 2024 |
Within one year $ million |
1 to 2 years $ million |
2 to 5 years $ million |
Over 5 years $ million |
Total $ million |
|
Non-derivative financial liabilities |
|||||
|
Bonds |
1,173 |
629 |
2,049 |
2,127 |
5,978 |
|
Other loans |
251 |
- |
- |
- |
251 |
|
Trading contracts within the scope of IFRS 9 (settled physically) |
54 |
8 |
- |
- |
62 |
|
Trade and other payables |
1,548 |
30 |
- |
- |
1,578 |
|
Lease obligations |
295 |
206 |
394 |
92 |
987 |
|
Total non-derivative financial liabilities |
3,321 |
873 |
2,443 |
2,219 |
8,856 |
|
Derivative financial liabilities |
|||||
|
Net-settled commodity derivatives |
191 |
92 |
23 |
- |
306 |
|
Net-settled foreign exchange derivatives |
48 |
39 |
97 |
29 |
213 |
|
3,560 |
1,004 |
2,563 |
2,248 |
9,375 |
|
As at 31 December 2023 As restated |
Within one year $ million |
1 to 2 years $ million |
2 to 5 years $ million |
Over 5 years $ million |
Total $ million |
|
Non-derivative financial liabilities |
|||||
|
Bond |
28 |
28 |
528 |
- |
584 |
|
Other loans |
16 |
- |
- |
- |
16 |
|
Trade and other payables |
854 |
13 |
- |
- |
867 |
|
Lease obligations |
250 |
186 |
340 |
121 |
897 |
|
Total non-derivative financial liabilities |
1,147 |
227 |
868 |
121 |
2,364 |
|
Derivative financial liabilities |
|||||
|
Net-settled commodity derivatives |
197 |
87 |
- |
- |
284 |
|
Net-settled foreign exchange derivatives |
- |
- |
- |
- |
- |
|
1,345 |
314 |
868 |
121 |
2,648 |
The maturity profiles in the above tables reflect only one side of the Group's liquidity position and will be recorded in the income statement against future production and revenue which are not recognised on the balance sheet as assets. Interest bearing loans and borrowings and trade payables mainly originate from the financing of assets used in the Group's ongoing operations such as property, plant and equipment and working capital such as inventories. These assets are considered part of the Group's overall liquidity risk.
Financial instruments subject to offsetting, enforceable master netting arrangements
The following table shows the amounts recognised for financial assets and liabilities which are subject to offsetting arrangements on a gross basis, and the amounts offset in the balance sheet.
|
As at 31 December 2024 |
Gross amounts of recognised financial assets/(liabilities) $ million |
Amounts set off $ million |
Net amounts presented on the balance sheet $ million |
|
Commodity derivative assets |
748 |
(596) |
152 |
|
Commodity derivative liabilities |
(1,223) |
596 |
(627) |
|
As at 31 December 2023 |
|||
|
Commodity derivative assets |
303 |
(37) |
266 |
|
Commodity derivative liabilities |
(321) |
37 |
(284) |
Derivatives are offset in the financial statements where the Group has a legally enforceable right and intention to offset.
25. Share capital
|
2024 |
2023 |
|||
|
Issued and fully paid |
Number |
$ million |
Number |
$ million |
|
Ordinary shares of 0.002p each |
1,440,109,512 |
0 |
770,370,830 |
0 |
|
Ordinary non-voting shares of 0.002p each |
251,488,211 |
0 |
- |
- |
|
Ordinary non-voting deferred shares of 12.4999p each |
925,532,809 |
171 |
925,532,809 |
171 |
|
171 |
171 |
|||
The rights and restrictions attached to the ordinary shares are as follows:
|
§ |
Dividend rights: the rights of the holders of ordinary shares shall rank pari passu in all respects with each other in relation to dividends |
|
§ |
Winding up or reduction of capital: on a return of capital on a winding up or otherwise (other than on conversion, redemption or purchase of shares) the rights of the holders of ordinary shares to participate in the distribution of the assets of the company available for distribution shall rank pari passu in all respects with each other |
|
§ |
Voting rights: the holders of ordinary shares shall be entitled to receive notice of, attend, vote and speak at any general meeting of the company |
The rights and restrictions to the ordinary non-voting shares are as follows. Further information on the rights and obligations attached to the non-voting ordinary shares is set out in the circular and prospectus published by the company on 12 June 2024.
|
§ |
Dividend rights: each non-voting share will be entitled to receive an amount equal to a 13 per cent premium to the amount of any distribution per ordinary share made by the company, whether by cash dividend, dividend in specie, scrip dividend, capitalisation issue or otherwise |
|
§ |
Winding up or reduction of capital: on a winding up or liquidation of the company, holders of non-voting ordinary shares will be paid in priority to any other payment to holders of shares in the company |
|
§ |
Voting rights: a holder of non-voting ordinary shares shall not be entitled, in its capacity as a holder of such non-voting shares, to receive notice of any general meeting of the company nor to attend, speak or vote at any such general meeting, unless the business of the meeting includes the consideration of a resolution to: (a) wind up the company; or (b) re-register the company as a private company |
|
§ |
Transferability: the non-voting ordinary shares are not admitted to listing or trading. The non-voting ordinary shares may be transferred to certain permitted transferees, in certain cases only with the consent of the company and in accordance with the terms of the non-voting ordinary shares |
|
§ |
Conversion rights: a holder of von-voting ordinary shares will be entitled to convert at least 25,000,000 non-voting shares either: (i) in conjunction with the sale of non-voting ordinary shares to market sale placees, which upon completion of such sale will be redesignated as ordinary shares; or (ii) following the satisfaction of the conversion conditions (as defined in the terms of the non-voting ordinary shares). The non-voting ordinary shares will be convertible into ordinary shares on a one for one basis except that following any allotment or issue of ordinary shares by way of capitalisation of profits or reserves or any sub-division or consolidation of ordinary shares by the company (an "adjustment event"), the non-voting ordinary shares will convert into such number of ordinary shares and the non-voting shareholder will receive the same proportion of voting rights and entitlement to participate in distributions of the company, as nearly as practicable, as would have been the case had no adjustment event occurred. Additionally, subject to certain exceptions, the company will be required to procure the conversion of the non-voting ordinary shares into ordinary shares following: (i) the cancellation of the listing of the ordinary shares; and (ii) the acquisition of more than 50% of the voting rights of the company by any person (other than the holder of the non-voting shares and any of such holder's concert parties) |
The rights and restrictions attached to the non-voting deferred shares are as follows:
They will have no voting or dividend rights and, on a return of capital or on a winding up of the company, will have the right to receive the amount paid up thereon only after holders of all ordinary shares have received, in aggregate, any amounts paid up on each ordinary share plus £10 million on each ordinary share. The non-voting deferred shares will not give the holder the right to receive notice of, nor attend, speak or vote at, any general meeting of the company
Issue of ordinary shares
During the year, the company issued 921,226,893 ordinary shares at a nominal value of 0.002 pence per share. This primarily consisted of 669,714,027 voting shares issued to BASF and 251,488,211 non-voting shares issued to LetterOne on completion of the acquisition. The company also issued 24,655 (2023: 5,092) ordinary shares at a nominal value of 0.002 pence per share in relation to the exercise of SAYE awards.
The issue of the ordinary shares to BASF and LetterOne resulted in an amount of $3,457 million that has been recognised as a merger reserve. These shares were issued at a share price of £2.86 per share, being the closing price of ordinary shares on the acquisition date and translated at the spot pound sterling to US dollar rate on that date of £1:$1.3122. For further information see note 14.
Purchase and cancellation of own shares
During 2024, none of the company's ordinary shares were repurchased or cancelled as the share buyback programme had been completed by the end of the prior year. During 2023, the company repurchased 76,803,058 ordinary shares for a total consideration, including transaction costs of $249 million (recognised in retained earnings), as part of the share purchase programmes announced on 3 November 2022 and 9 March 2023, which concluded on 28 September 2023. All shares purchased had been cancelled.
|
Own shares |
2024 $ million |
2023 $ million |
|
At 1 January |
24 |
21 |
|
Purchase of ESOP trust shares |
25 |
16 |
|
Release of shares |
(13) |
(13) |
|
At 31 December |
36 |
24 |
The own shares represent the net cost of shares in Harbour Energy plc purchased in the market or issued by the company into the Harbour Energy plc Employee Benefit (ESOP) Trust. This ESOP Trust holds shares to satisfy awards under the Group's share incentive plans. At 31 December 2024, the number of ordinary shares of 0.002 pence each held by the trust was 9,223,652 (2023: 6,079,705).
26. Subordinated notes
On 22 February 2024, the bondholders of two series of subordinated resettable fixed rate notes (subordinated notes) in the aggregate principal amount of €1,500 million approved a change in guarantor from Wintershall Dea AG to Harbour Energy plc which became effective upon completing Wintershall Dea acquisition transaction, at which point these bonds were ported to Harbour's acquired subsidiary Wintershall Dea Finance 2 BV.
The subordinated notes are callable three months prior to the first reset date for the NC2026 series and six months prior to the first reset date for the NC2029 series:
|
% |
Reset date |
Currency |
Nominal €million |
Nominal value |
Carrying value |
|
|
Bond ISIN: XS2286041517 |
2.5% |
2026 |
EUR |
650 |
718 |
690 |
|
Bond ISIN: XS2286041947 |
3.0% |
2029 |
EUR |
850 |
939 |
873 |
|
Total |
1,500 |
1,657 |
1,563 |
|
2024 $ million |
|||||
|
Fair value on acquisition |
1,548 |
||||
|
Accrued interest in the period to 31 December |
15 |
||||
|
Nominal value on acquisition |
1,563 |
Under IAS 32, subordinated notes are wholly classified as equity. The issued subordinated notes are recognised in equity at fair value, based on the market prices of these instruments as of the acquisition date. Accrued interest payable to the subordinated notes investors increases equity, whereas the distribution of interest payments reduces equity.
27. Share-based payments
The company currently operates a Long-Term Incentive Plan (LTIP) for certain employees, a Share Incentive Plan (SIP), a Save As You Earn (SAYE) scheme for UK-based employees, and an Expatriate SIP for expatriate employees only.
For the year ended 31 December 2024, the total cost recognised by the company for share-based payment transactions was $51 million (2023: $46 million). A credit of $51 million (2023: $46 million) has been recorded in retained earnings for all equity-settled payments of the company.
Like other elements of remuneration, this charge is processed through the time-writing system which allocates cost, based on time spent by individuals, to various entities within the Group. Part of this cost is therefore recharged to the relevant subsidiary undertakings, part is capitalised as directly attributable to capital projects and part is charged to the income statement as operating costs, pre-licence exploration costs or general and administration costs.
Details of the various share incentive plans currently in operation are set out below:
2017 Long-term Incentive Plan (2017 LTIP)
Discretionary share awards are granted to employees under the company's Long-Term Incentive Plan (LTIP).
The following types of award have been granted under the 2017 LTIP:
|
§ |
Performance share awards (PSAs): vesting is subject to a performance target, normally measured over a three-year period from 1 January based on total shareholder return (TSR) relative to (i) FTSE 100 index, and (ii) a bespoke peer group of oil and gas companies and aligns to longer-term strategic objectives |
|
§ |
Conditional share awards (CSAs): vesting is only subject to continued employment |
|
§ |
Deferred bonus share (DBS) awards: certain employees are required to defer a portion of their annual bonus into shares which vest over a three-year period subject to continued employment |
All LTIP awards are granted in the form of nil-cost options or conditional share awards and therefore there is no exercise price payable on the exercise of these awards.
The following table shows the movement in the number of LTIP awards:
|
2024 million shares |
2023 million shares |
|
|
Outstanding at 1 January |
33.7 |
27.8 |
|
Granted |
15.7 |
15.1 |
|
Vested |
(2.6) |
(8.7) |
|
Forfeited |
(9.3) |
(0.5) |
|
Outstanding at 31 December1 |
37.5 |
33.7 |
1 This includes 0.7 million cash settled awards at 31 December 2024 (2023: 0.6 million), which are revalued using the year-end share price.
LTIP awards totalling 2.6 million shares were vested during the period (2023: 8.7 million). The weighted average remaining contractual life of the LTIP awards at 31 December 2024 was 1.33 years (2023: 2.2 years).
Key assumptions used to calculate the fair value of awards
The fair value of PSAs which are subject to TSR conditions, is determined using a Monte Carlo simulation. The fair value of all other awards is calculated using the share price at the date of grant, adjusted for dividends not received during the vesting period.
The following table lists the inputs to the model used in respect of the PSAs granted during the financial year:
|
2024 |
2023 |
|
|
Share price at date of grant |
£2.39-£3.22 |
£2.44 - £2.90 |
|
Dividend yield |
0% |
0% |
|
Expected term |
3 years |
2.9 - 3.0 years |
|
Risk free rate |
4.1%-4.3% |
3.3%-4.2% |
|
Share price volatility of the company |
47.0%-47.5% |
49.2%-50.2% |
The weighted average fair value of the PSA awards granted in 2024 was $1.64 (2023: $2.86).
Expected volatility was determined by reference to both the historical volatility of the company and the historical volatility of a group of comparable quoted companies over a period in line with the expected term assumption.
Share Incentive Plan (SIP)
Under the Share Incentive Plan employees are invited to make contributions to buy partnership shares. If an employee agrees to buy partnership shares the company currently matches the number of partnership shares bought with an award of shares (matching shares), on a one-for-one basis. In 2024, 0.6 million matching shares were awarded to employees (2023: 0.3 million). The SIP matching shares are valued based on the quoted share price on the grant date.
Save As You Earn (SAYE) scheme
Under the SAYE scheme, UK qualifying employees with one month or more continuous service can join the scheme. Employees can save up to a maximum of £500 per month through payroll deductions for a period of three years, after which time they can acquire shares at the option price, which is set at a discount of up to 20 per cent to the prevailing market price at the grant date, determined in accordance with SAYE scheme rules. In 2024, 1 million SAYE options were granted (2023: 3.1 million).
The SAYE options outstanding at 31 December 2024 had exercise prices ranging from £2.32 to £2.72 (2023: £2.21 to £4.12) and a weighted average remaining contractual life of 2.25 years (2023: 2.8 years).
28. Group pension schemes
In addition to state pension plans, most employees are granted company pension benefits from either defined contribution or defined benefit plans. Benefits generally depend on the length of service, compensation and contributions and take into consideration the legal framework of labour, tax and social security laws in the countries where the employing subsidiaries are located.
Defined contribution schemes
The Group primarily operates defined contribution retirement benefit schemes. The only obligation of the Group with respect to the retirement benefit schemes are to make specified contributions. Payments to the defined contribution schemes are charged as an expense as they fall due.
Defined benefit plans
Germany
Employees of Harbour Energy companies in Germany participate in a capital market-oriented defined benefit pension scheme. This scheme applies to all new employees joining Harbour Energy and is financed by employer and employee contributions and the performance of the investment. Typically, Harbour Energy guarantees at least the sum of all employer and employee contributions paid and usually covers these pension obligations with plan assets as part of an additional contractual trust arrangement (CTA). The option of building up employee-financed retirement provisions through deferred compensation is also available to all employees of Harbour Energy companies in Germany as part of the capital market-oriented defined benefit pension scheme. All other pension plans (including deferred compensation plans) have been closed to new employees.
The defined benefit plan of BASF Pensionskasse VVaG was closed in 2004.
Some Harbour Energy companies in Germany only participate in the BASF group's pension plans for periods of service already rendered (past service). Some of the past service benefits financed via BASF Pensionskasse VVaG are subject to adjustments that must be borne by its member companies to the extent that these cannot be borne by BASF Pensionskasse VVaG due to the regulations imposed by the German supervisory authority. In addition to the former basic level of BASF Pensionskasse VVaG benefits, there are still defined pension schemes, which are financed via pension provisions at the German Group companies. The benefits are largely based on modular plans. Only employees who already participated in various existing deferred compensation plans before 2022 can continue to participate in these plans.
BASF SE does not provide sufficient plan information from BASF Pensionskasse regarding the allocation of assets to Harbour Energy for year-end closing. As a result, the former participation in BASF Pensionskasse is accounted for as a multi-employer defined benefit plan with insufficient information about the asset allocation and, therefore, as a defined contribution plan in accordance with IAS 19.36.
For further existing pension plans in Germany that are self-managed by Harbour Energy, assets were transferred to Willis Towers Watson Treuhand GmbH within the framework of CTAs and to Willis Towers Watson Pensionsfonds AG as insolvency insurance. Willis Towers Watson Pensionsfonds AG falls within the scope of the Act on Supervision of Insurance Undertakings and Oversight by the German Federal Financial Supervisory Authority (BaFin). Insofar as a regulatory deficit occurs in the pension fund, supplementary payments are requested from the employer. Irrespective of the rules, the liability of the employer remains in place. The bodies of Willis Towers Watson Treuhand GmbH and Willis Towers Watson Pensionsfonds AG are responsible for ensuring that the funds under management are used in compliance with the contract and thus fulfil the requirements for their recognition as plan assets.
The defined benefit plans that are recognised as pension provisions mainly include pension promises and are hence subject to longevity risk.
Norway
The Harbour Energy Norge AS (formerly Wintershall Dea Norge) defined benefit plans have been closed to new employees since 1 January 2016. For Norwegian employees whose remaining length of service until retirement on 1 January 2016 was 15 years or less, a final salary commitment continues to apply after the closure of the plan. The plans are partly funded via Nordea Liv AS. Employees who still had a remaining length of service of more than 15 years on the date of 1 January 2016, and employees who joined the company after this date are entitled to benefits under a defined contribution pension plan. Defined contribution plans are either secured with Nordea Liv AS or unfunded and administered by Storebrand Pensjonstjenester on behalf of Harbour Energy Norge AS (formerly Wintershall Dea Norge AS).
Moreover, closed defined benefit plans are in place for former DEA Norge employees. These are secured with DNB ASA. Employees who still had 15 years or less until retirement on 1 January 2021 remained in the existing plans. All others were transferred to existing defined contribution plans.
UK
Harbour Energy operates a final salary defined benefit pension plan in the UK, primarily inflation-linked annuities based on an employee's length of service and final salary. The scheme is closed to new members. Further details of this plan have not been provided as the plan is not material to the financial position or results of the Group.
Actuarial assumptions
The amount of the provision for defined benefit pension schemes was determined by actuarial methods based on the following key assumptions.
|
31 December 2024 |
||
|
Key assumptions (%) |
Germany |
Norway |
|
Discount rate |
3.4 |
3.1 |
|
Pension growth |
2.3 |
1.8 |
The assumptions used to determine the present value of the entitlements as at 31 December 2024 are used in the following fiscal year to determine the expenses for pension plans.
The valuation of the defined benefit obligation is generally performed using the most recent actuarial mortality tables as at 31 December 2024.
|
Actuarial mortality tables as at 31 December 2024 |
|
|
Germany |
Heubeck Richttafeln 2018 G |
|
Norway |
K2013 |
Provision for pensions
|
Defined benefit obligations $ million |
Plan assets $ million |
Total $ million |
|
|
On acquisition |
|||
|
Current service costs |
3 |
- |
3 |
|
Interest expense/(income) |
5 |
(5) |
- |
|
8 |
(5) |
3 |
|
|
Remeasurement |
|||
|
Return on plan assets, excluding amounts already recognised in interest income |
- |
- |
- |
|
Actuarial gains/losses |
|||
|
- of which effect of changes in financial assumptions |
10 |
- |
10 |
|
- of which effect of experience adjustments |
(3) |
- |
(3) |
|
7 |
- |
7 |
|
|
Currency effect |
(31) |
28 |
(3) |
|
Employer contribution to the funded plans |
- |
(1) |
(1) |
|
Benefit payments |
(9) |
9 |
- |
|
Change of scope |
493 |
(453) |
40 |
|
As at 31 December 2024 |
468 |
(422) |
46 |
The present value of the defined benefit obligations less plan assets measured at fair value results in the net defined benefit obligation arising from funded and unfunded plans and is recognised as pension provision on the balance sheet. Of the present value of defined benefit obligations, $98 million relate to benefit obligations in Germany, $320 million to benefit obligations in Corporate and $49 million to benefit obligations in Norway.
Domestic company pensions are subject to an obligation to review for adjustments every three years pursuant to Section 16 of the German Occupational Pension Act (BetrAVG). Additionally, some commitments grant annual pension adjustments, which may exceed the legally mandated adjustment obligation.
The weighted average duration of the pension obligations is 20 years in Germany, 10 years for Corporate and 15 years in Norway.
Sensitivity analysis of defined benefit obligations
An increase or decrease in the discount rate and pension growth would have the following impact on the present value of the defined benefit obligations:
Change in actuarial assumptions
|
Impact on defined benefit obligations |
||
|
31 December 2024 $ million |
31 December 2023 $ million |
|
|
Discount rate |
Germany |
Norway |
|
Increase of 0.5 percentage points |
3.4 |
3.1 |
|
Reduction of 0.5 percentage points |
||
|
Pension growth |
||
|
Increase of 0.5 percentage points |
||
|
Reduction of 0.5 percentage points |
2.3 |
1.8 |
Plan assets
The investment policy in Germany is based on detailed asset liability management (ALM) studies. Portfolios are identified that can achieve the best target return within a given risk budget. From these efficient portfolios, one is selected, and the strategic asset allocation is determined. The strategic asset allocation consists of two main elements. The first one is used to hedge fluctuations. This involves the use of capital market instruments that hedge the financial risks arising from the valuation of pension obligations. The second part of the allocation is used to generate income and for diversification purposes. The broadly diversified portfolio includes investments in bonds, equities, real estate and other asset classes. The assets are continuously monitored and managed from a risk and return perspective.
Composition of plan assets (fair values)
|
31 December 2024 |
||||
|
Germany $ million |
Of which has an active market |
Norway $ million |
Of which has an active market |
|
|
Assets held in insurance company |
3 |
- |
22 |
100% |
|
Specialised funds |
397 |
100% |
- |
- |
|
400 |
- |
22 |
- |
|
29. Notes to the statement of cash flows
Net cash flows from operating activities consist of:
|
2024 $ million |
2023 As restated $ million |
|
|
Profit before taxation |
1,219 |
616 |
|
Adjustments to reconcile profit before tax to net cash flows |
||
|
Finance cost, excluding foreign exchange |
602 |
363 |
|
Finance income, excluding foreign exchange |
(55) |
(104) |
|
Depreciation, depletion and amortisation |
1,745 |
1,449 |
|
Net impairment of property, plant and equipment |
352 |
176 |
|
Impairment of goodwill |
- |
25 |
|
Impairment of right-of-use asset |
20 |
- |
|
Share based payments |
51 |
20 |
|
Decommissioning payments |
(284) |
(268) |
|
Fair value movements on derivatives |
(68) |
- |
|
Changes in provisions |
(31) |
- |
|
Exploration costs written-off |
173 |
57 |
|
Movement in realised cash flow hedges not yet settled |
(31) |
(207) |
|
Unrealised foreign exchange (gain)/loss |
(116) |
49 |
|
Working-capital adjustments |
||
|
Decrease)/(increase) in inventories |
39 |
(52) |
|
(Increase)/decrease in trade and other receivables |
(32) |
525 |
|
Decrease in trade and other payables |
(470) |
(61) |
|
Net tax payments |
(1,499) |
(438) |
|
Net cash inflow from operating activities |
1,615 |
2,150 |
Reconciliation of net cash flow to movement in net borrowings
|
2024 $ million |
2023 As restated $ million |
|
|
Proceeds from drawdown of RBL facility |
(178) |
(660) |
|
Proceeds from Euro bonds |
(1,728) |
- |
|
Proceeds from RCF |
(2,225) |
- |
|
Proceeds from bridge facility |
(1,500) |
- |
|
Repayment of RBL facility |
178 |
1,435 |
|
Repayment of bridge facility |
1,500 |
- |
|
Repayment of RCF |
1,975 |
- |
|
Repayment of EFF loan |
- |
11 |
|
Repayment of financing arrangement |
17 |
21 |
|
Bond debt arising on business combination1 |
(3,038) |
- |
|
Financing arrangement interest payable |
(1) |
(3) |
|
Arrangement fees and related costs on RBL capitalised |
- |
34 |
|
Arrangement fees and related costs on bonds capitalised |
11 |
- |
|
Arrangement fees and related costs on RCF capitalised |
34 |
- |
|
Arrangement fees and related costs on bridge facility capitalised |
13 |
- |
|
Amortisation of arrangement fees and related costs capitalised |
(102) |
(48) |
|
Currency translation adjustment on Euro bonds |
263 |
- |
|
Movement in total borrowings |
(4,781) |
790 |
|
Cash acquired on business combination |
748 |
- |
|
Movement in cash and cash equivalents |
(229) |
(214) |
|
(Increase)/decrease in net borrowings in the year |
(4,262) |
576 |
|
Opening net borrowings |
(162) |
(738) |
|
Closing net borrowings |
(4,424) |
(162) |
1 Net of capitalised arrangement fees and related costs of $276 million.
Analysis of net borrowings
|
2024 $ million |
2023 As restated $ million |
|
|
Cash and cash equivalents |
805 |
286 |
|
RCF |
(218) |
- |
|
Bonds |
(5,011) |
(493) |
|
Net debt |
(4,424) |
(207) |
|
Financing arrangement |
- |
(16) |
|
Closing net borrowings |
(4,424) |
(223) |
|
Non-current assets1 |
- |
42 |
|
Current assets1 |
- |
19 |
|
Closing net borrowings before unamortised fees1 |
(4,424) |
(162) |
1 At 31 December 2023, $61 million of fees associated with the RBL facility were recognised in debtors.
The carrying values on the balance sheet are stated net of the unamortised portion of issue costs and bank fees of $284 million of which $32 million relates to the RCF and $252 million is netted against the bonds (Dec 2023: $68 million of which $61 million related to the RBL, which was recognised in assets and $7 million related to the bond, which was netted off against the borrowings).
30. Related party disclosures
Transactions between the company and its subsidiaries, which are related parties, have been eliminated on consolidation and are not disclosed in this note.
BASF and LetterOne have been classified as related parties because they are substantial shareholders holding 669.7 million of voting ordinary shares and 251.5 million of non-voting ordinary shares, respectively. The BASF shareholding represents 46.5 per cent of voting ordinary shares.
BASF is entitled to dividends as per note 31 which, whilst denominated in pound sterling will, specifically for BASF, will be paid in US dollars.
Compensation of key management personnel of the Group
Remuneration of key management personnel, including directors of the Group, is shown below:
|
2024 $ million |
2023 $ million |
|
|
Salaries and short-term employee benefits |
16 |
13 |
|
Payments made in lieu of pension contributions |
1 |
1 |
|
Termination benefits |
1 |
- |
|
Pension benefits |
- |
- |
|
18 |
14 |
31. Distributions made and proposed
A final dividend of 13 cents per ordinary share in relation to the year ended 31 December 2023 was paid on 22 May 2024 pursuant to shareholder approval received on 9 May 2024.
An interim dividend of 13 cents per ordinary share in relation to the half year ended 30 June 2024 was paid on 25 September 2024.
|
2024 $ million |
2023 $ million |
|
|
Cash dividends on ordinary shares declared and paid |
||
|
Final dividend for 2023: 13 cents per share (2022: 12 cents per share) |
100 |
99 |
|
Interim dividend for 2024: 13 cents per share (2023: 12 cents per share) |
99 |
91 |
|
199 |
190 |
|
|
Proposed dividends on ordinary shares |
||
|
Final dividend for 2024: 13.19 cents per share (2023: 13 cents per share) |
227.5 |
100 |
Proposed dividends on ordinary shares are subject to approval at the annual general meeting and are not recognised as a liability as at 31 December.
32. Events after the reporting period
On 23 January 2025 Harbour announced it had signed a Sale and Purchase Agreement to sell its Vietnam business, which includes the 53.125 per cent equity interest in the Chim Sáo and Dua production fields, to EnQuest for $84 million. The effective date is 1 January 2024 with completion targeted during 2025. This agreement resulted in the Vietnam business unit being classed as asset held for sale as at 31 December 2024.
On 3 March 2025, the Finance Act 2025 was substantively enacted following its third reading in the UK Parliament. While the substantive enactment has no implications for the current accounting period, it confirms that the extension of the Energy Profits Levy to 31 March 2030 will be reflected in the Group's results for the interim period to 30 June 2025. If the Finance Act 2025 had been substantively enacted at the balance sheet date, the deferred tax liability at the end of the period would have increased by $306 million (further details are provided in note 8).
33. Group information
Subsidiary undertakings of the company which were all wholly owned at 31 December 2024 were:
|
Name of Company |
Area of operation |
Country of incorporation |
Main activity |
|
Chrysaor (U.K.) Alpha Limited17 |
UK |
UK |
Exploration, production, and development |
|
Chrysaor (U.K.) Beta Limited17 |
UK |
UK |
Decommissioning activities |
|
Chrysaor (U.K.) Sigma Limited17 |
UK |
UK |
Exploration, production, and development |
|
Chrysaor (U.K.) Theta Limited17 |
UK |
UK |
Exploration, production, and development |
|
Chrysaor CNS Limited17 |
UK |
UK |
Exploration, production, and development |
|
Chrysaor Developments Limited17 |
UK |
UK |
Decommissioning activities |
|
Chrysaor E&P Limited17 |
UK |
UK |
Intermediate holding company |
|
Chrysaor Holdings Limited7 |
UK |
Cayman Islands |
Intermediate holding company |
|
Chrysaor Limited17 |
UK |
UK |
Exploration, production, and development |
|
Harbour Energy Marketing Limited17 |
UK |
UK |
Gas trading |
|
Chrysaor North Sea Limited17 |
UK |
UK |
Exploration, production, and development |
|
Chrysaor Petroleum Company U.K. Limited17 |
UK |
UK |
Exploration, production, and development |
|
Chrysaor Petroleum Limited17 |
UK |
UK |
Decommissioning activities |
|
Chrysaor Production (U.K.) Limited17 |
UK |
UK |
Exploration, production, and development |
|
Chrysaor Production Holdings Limited17 |
UK |
UK |
Intermediate holding company |
|
Chrysaor Resources (Irish Sea) Limited17 |
UK |
UK |
Exploration, production, and development |
|
DEA Cyrenaica GmbH8 |
Libya |
Germany |
Exploration, production, and development |
|
DEA E&P GmbH8 |
Germany |
Germany |
Exploration, production, and development |
|
DEA North Africa/Middle East GmbH8 |
North Africa |
Germany |
Exploration, production, and development |
|
DEM México Erdoel, S.A.P.I. de C.V.14 |
Mexico |
Mexico |
Intermediate holding company |
|
E&A Internationale Explorations-und Produktions GmbH20 |
Germany |
Germany |
Exploration, production, and development |
|
Ebury Gate Limited9 |
Guernsey |
Guernsey |
Risk mitigation services |
|
EnCore Oil Limited17 |
UK |
UK |
Intermediate holding company |
|
FP Mauritania A BV11 |
Mauritania |
Netherlands |
Decommissioning activities |
|
FP Mauritania B BV11 |
Mauritania |
Netherlands |
Decommissioning activities |
|
Harbour Energy Bloque 7, S.A. de C.V. (formerly Premier Oil Exploration and Production Mexico S.A.de C.V.)15 |
Mexico |
Mexico |
Exploration, production, and development |
|
Harbour Energy DH GmbH21 |
Germany |
Germany |
Intermediate holding company |
|
Harbour Energy Finance Limited17 |
UK |
UK |
Financing company |
|
Harbour Energy Netherlands Holdings BV11 |
Netherlands |
Netherlands |
Intermediate holding company |
|
Harbour Energy Norge AS (formerly Wintershall Dea Norge AS)12,22 |
Norway |
Norway |
Exploration, production, and development |
|
Harbour Energy Services Limited17 |
UK |
UK |
Service company |
|
Harbour Energy Unidad Zama, S. de R.L. de C.V (formerly Sierra O&G Exploration y Produccion, S. de R.L de C.V.)14 |
Mexico |
Mexico |
Exploration, production, and development |
|
Izta Energia, S. de R.L. de C.V.14 |
Mexico |
Mexico |
Intermediate holding company |
|
Premier Oil (Vietnam) Limited4 |
Vietnam |
British Virgin Islands |
Exploration, production, and development |
|
Premier Oil Aberdeen Services Limited17 |
UK |
UK |
Service company |
|
Premier Oil and Gas Services Limited17 |
UK |
UK |
Service company |
|
Premier Oil Andaman I Limited17 |
Indonesia |
UK |
Exploration, production, and development |
|
Premier Oil Andaman Limited17 |
Indonesia |
UK |
Exploration, production, and development |
|
Premier Oil Barakuda Limited17 |
Indonesia |
UK |
Exploration, production, and development |
|
Premier Oil E&P Holdings Limited17 |
UK |
UK |
Intermediate holding company |
|
Premier Oil E&P UK EU Limited17 |
UK |
UK |
Exploration, production, and development |
|
Premier Oil E&P UK Limited17 |
UK |
UK |
Exploration, production, and development |
|
Premier Oil Exploration (Mauritania) Limited13 |
Mauritania |
Jersey |
Decommissioning activities |
|
Premier Oil Group Holdings Limited1,17 |
UK |
UK |
Intermediate holding company |
|
Premier Oil Group Limited19 |
UK |
UK |
Intermediate holding company |
|
Premier Oil Holdings Limited17 |
UK |
UK |
Intermediate holding company |
|
Premier Oil Mauritania B Limited13 |
Mauritania |
Jersey |
Decommissioning activities |
|
Premier Oil Mexico Holdings Limited17 |
UK |
UK |
Intermediate holding company |
|
Premier Oil Mexico Investments Limited17 |
UK |
UK |
Intermediate holding company |
|
Premier Oil Mexico Recursos S.A. de C.V.15 |
Mexico |
Mexico |
Exploration, production, and development |
|
Premier Oil Natuna Sea BV11 |
Indonesia |
Netherlands |
Exploration, production, and development |
|
Premier Oil Overseas BV11 |
Netherlands |
Netherlands |
Intermediate holding company |
|
Premier Oil South Andaman Limited17 |
Indonesia |
UK |
Exploration, production, and development |
|
Premier Oil Tuna BV11 |
Indonesia |
Netherlands |
Exploration, production, and development |
|
Premier Oil UK Limited19 |
UK |
UK |
Exploration, production, and development |
|
Premier Oil Vietnam Offshore BV11 |
Vietnam |
Netherlands |
Exploration, production, and development |
|
Servicios Unidad PWTH S. De R.L. de C.V14 |
Mexico |
Mexico |
Service company |
|
Sierra Blanca P&D, S. de R.L de C.V.14 |
Mexico |
Mexico |
Exploration, production, and development |
|
Sierra Coronado E&P, S. de R.L de C.V. 14 |
Mexico |
Mexico |
Exploration, production, and development |
|
Sierra Nevada E&P, S. de R.L de C.V. 14 |
Mexico |
Mexico |
Exploration, production, and development |
|
Sierra Offshore Exploration, S. de R.L de C.V. 14 |
Mexico |
Mexico |
Exploration, production, and development |
|
Sierra Oil & Gas Holdings, L.P6 |
Mexico |
Canada |
Intermediate holding company |
|
Sierra Oil & Gas S.de R.L. de C.V14 |
Mexico |
Mexico |
Exploration, production, and development |
|
Sierra Perote E&P, S. de R.L de C.V.14 |
Mexico |
Mexico |
Exploration, production, and development |
|
Wintershall Dea Algeria GmbH8 |
Algeria |
Germany |
Exploration, production, and development |
|
Wintershall Dea Argentina S.A2 |
Argentina |
Argentina |
Exploration, production, and development |
|
Wintershall Dea Deutschland GmbH8 |
Germany |
Germany |
Exploration, production, and development |
|
Wintershall Dea Finance 2 BV (1)11 |
Netherlands |
Netherlands |
Financing company |
|
Wintershall Dea Finance BV (1)11 |
Netherlands |
Netherlands |
Financing company |
|
Wintershall Dea Global Holding GmbH8 |
Germany |
Germany |
Exploration, production, and development |
|
Wintershall Dea Global Support11 |
Netherlands |
Netherlands |
Service company |
|
Wintershall Dea Holding GmbH8 |
Germany |
Germany |
Exploration, production, and development |
|
Wintershall Dea Insurance Limited10 |
Guernsey |
Guernsey |
Risk mitigation services |
|
Wintershall Dea International GmbH8 |
Germany |
Germany |
Exploration, production, and development |
|
Wintershall Dea Marketing Services GmbH20 |
Germany |
Germany |
Distribution, transportation and trade |
|
Wintershall Dea Mexico Holding BV11 |
Mexico |
Netherlands |
Intermediate holding company |
|
Wintershall DEA Mexico Holdings GP Ltd5 |
Mexico |
Canada |
Intermediate holding company |
|
Wintershall DEA México, S. de R.L. de C.V.14 |
Mexico |
Mexico |
Exploration, production, and development |
|
Wintershall Dea Middle East GmbH20 |
United Arab Emirates |
Germany |
Exploration, production, and development |
|
Wintershall Dea Nederland BV11 |
Netherlands |
Netherlands |
Servicing and financing company |
|
Wintershall Dea Nile GmbH8 |
Egypt |
Germany |
Exploration, production, and development |
|
Wintershall Dea South East Asia GmbH20 |
Germany |
Germany |
Exploration, production, and development |
|
Wintershall Dea Suez GmbH8 |
Egypt |
Germany |
Exploration, production, and development |
|
Wintershall Dea Technology Ventures GmbH20 |
Germany |
Germany |
Investment company |
|
Wintershall Dea TSC GmbH & Co.KG8 |
Germany |
Germany |
Research and development |
|
Wintershall Dea TSC Management GmbH20 |
Germany |
Germany |
Research and development |
|
Wintershall Dea Vermögensverwaltungs gesellschaft mbH20 |
Germany |
Germany |
Intermediate holding company |
|
Wintershall Dea WND GmbH8 |
Egypt |
Germany |
Exploration, production, and development |
|
Wintershall Petroleum (E&P) BV11 |
Netherlands |
Netherlands |
Exploration, production, and development |
|
Chrysaor (U.K.) Britannia Limited17 |
- |
UK |
Dormant company |
|
Chrysaor (U.K.) Lambda Limited16 |
- |
Ireland |
Dormant company |
|
DEA Trinidad & Tobago GmbH8 |
- |
Germany |
Non-trading |
|
EnCore (NNS) Limited17 |
- |
UK |
Non-trading |
|
Harbour Energy Argentina Limited17 |
- |
UK |
Dormant company |
|
Harbour Energy Central Andaman Limited (formerly Premier Oil B Limited)17 |
- |
UK |
Dormant company |
|
Harbour Energy Developments Limited17 |
- |
UK |
Dormant company |
|
Harbour Energy Production Limited17 |
- |
UK |
Dormant company |
|
Harbour Energy Secretaries Limited17 |
- |
UK |
Dormant company |
|
Premier Oil (EnCore Petroleum) Limited17 |
- |
UK |
Non-trading |
|
Premier Oil ANS Limited17 |
- |
UK |
Non-trading |
|
Premier Oil do Brasil Petroleo e Gas Ltda3 |
- |
Brazil |
Dormant company |
|
Premier Oil Exploration Limited19 |
- |
UK |
Non-trading |
|
Premier Oil Far East Limited17 |
- |
UK |
Non-trading |
|
Premier Oil ONS Limited17 |
- |
UK |
Dormant company |
|
Premier Oil Pakistan Offshore BV11 |
- |
Netherlands |
Dormant company |
|
Premier Oil Vietnam 121 Limited17 |
- |
UK |
Non-trading |
|
Viking CCS Limited17 |
- |
UK |
Dormant company |
|
Chrysaor (U.K.) Delta Limited17 |
- |
UK |
Liquidation |
|
Chrysaor (U.K.) Eta Limited17 |
- |
UK |
Liquidation |
|
Chrysaor (U.K.) Zeta Limited17 |
- |
UK |
Liquidation |
|
Chrysaor Production Limited18 |
- |
UK |
Liquidation |
|
Chrysaor Resources (UK) Holdings Limited17 |
- |
UK |
Liquidation |
|
Premier Oil ANS Holdings Limited18 |
- |
UK |
Liquidation |
|
Premier Oil Congo (Marine IX) Limited13 |
- |
Jersey |
Liquidation |
|
Premier Oil Exploration ONS Limited18 |
- |
UK |
Liquidation |
|
Premier Oil Finance (Jersey) Limited1,13 |
- |
Jersey |
Liquidation |
Note:
1 Held directly by the company. All other companies are held through a subsidiary undertaking.
2 Registered office - Ingeniero Della Paolera 265 Piso 14 Ciudad de Buenos Aires, C1001ADA Argentina.
3 Registered office - Rua Lauro Müller, 116 - Sala 2006, Torre Rio Sul, Shopping, 20º andar, Botafogo, Rio de Janeiro - RJ - CEP: 22.290-906, Brazil.
4 Registered office - Commerce House, Wickhams Cay 1, Road Town, Tortola, VG1110.
5 Registered office - 181 Bay Street, Suite 2100, Toronto, ON M5J 2T3, Canada.
6 Registered office - 44 Chipman Hill, Suite 1000, Saint John, NB E2L 2A9, Canada.
7 Registered office - Cricket Square, Hutchins Drive, PO Box 2681, Grand Cayman, KY1-1111.
8 Registered office - Hamburg, Germany, business address: Am Lohsepark 8, 20457 Hamburg.
9 Registered office - Level 5, Mill Court, La Charroterie, St Peter Port, Guernsey, GY1 1EJ.
10 Registered office - Level 3,Mill Court, La Charroterie, St Peter Port, Guernsey, GY1 4ET.
11 Registered office - Lange Kleiweg 56H, 2288 GK, Rijswijk, Netherlands.
12 Jåttåflaten 27, 4020 Stavanger, Norway.
13 2nd Floor, Lime Grove House, Green Street, St. Helier, JE2 4UB, Jersey.
14 Registered office - Campos Eliseos 345, floor 12, Polanco V Seccion, Mexico City, CP 11560, Mexico.
15 Registered office - Presidente Masaryk 111, Piso 1, Polanco V Seccion, Mexico City, CP 11560, Mexico.
16 Registered office - Riverside One, Sir John Rogerson's Quay, Dublin 2, Ireland.
17 151 Buckingham Palace Road, London, SW1W 9SZ, United Kingdom.
18 C/O Teneo Financial Advisory Limited The Colmore Building, 20 Colmore Circus Queensway, Birmingham, B4 6AT, United Kingdom.
19 Registered office - 4th Floor, Saltire Court, 20 Castle Terrace, Edinburgh, EH1 2EN, United Kingdom.
20 Registered office - Kassel, Germany, business address: Am Lohsepark 8, 20457 Hamburg, Germany.
21 Registered office - Frankfurt am Main, Germany, business address: Am Lohsepark 8, 20457 Hamburg, Germany.
22 The companies Harbour Energy Norge AS and Wintershall Dea Norge AS merged in December 2024.
Joint operations and investments
Companies that are not wholly owned or controlled by the Group were:
|
Name of company |
Effective % ownership |
Registered office address |
|
Luna Carbon Storage ANS |
60 |
Jåttåflaten 27, 4020, Stavanger, Norway |
|
Havstjerne ANS |
60 |
Jåttåflaten 27, 4020, Stavanger, Norway |
|
Disouq Petroleum Company |
50 |
Plot No. 188 (Dana Gas Building), City Center, 5th Settlement, New Cairo, Egypt |
|
JV East Damanhur Gas Company |
50 |
Plot No. 188 (Dana Gas Building), City Center, 5th Settlement, New Cairo, Egypt |
|
Erdgas Münster GmbH |
33.7 |
Johann-Krane-Weg 46, 48149, Münster, Germany |
|
Wellstarter AS |
24.4 |
Stiklestadveien 3, 7041, Trondheim, Norway |
|
AMBARtec AG |
24.4 |
Erna-Berger-Str. 17, 01097, Dresden, Germany |
|
Earth Science Analytics AS |
13.5 |
Strandveien 37, 1366, Lysaker, Norway |
|
Gasoducto Cruz del Sur S.A. |
10 |
La Cumparsita 1373 office 402, 11200, Montevideo, Uruguay |
|
HiiROC Limited |
9.6 |
Number 22 Mount Ephraim, Tunbridge Wells, TN4 8AS, United Kingdom |
|
Gas Links S.A |
5.1 |
Don Bosco 3672 6th floor, C1206ABF, City of Buenos Aires, Argentina |
Joint operations that are not managed through separate companies are mainly located in Norway, the UK, Germany, Mexico and Argentina.
Group reserves and resources
Oil and gas 2P reserves and 2C resources1
|
2P reserves (working interest) |
2P reserves5 (entitle-ment) |
2C resources (working interest) |
||||||
|
1 January 2024 mmboe |
Acquisi-tions3 mmboe |
Revisions4 |
Produc-tion |
31 Dec 2024 mmboe |
31 Dec 2024 mmboe |
31 Dec 2024 mmboe |
||
|
Norway |
Oil and NGLs |
- |
179 |
- |
(7) |
172 |
172 |
150 |
|
Gas2 |
- |
297 |
- |
(12) |
285 |
285 |
158 |
|
|
Total |
- |
477 |
- |
(19) |
458 |
458 |
308 |
|
|
UK |
Oil and NGLs |
183 |
- |
(3) |
(27) |
153 |
153 |
91 |
|
Gas2 |
161 |
- |
9 |
(28) |
142 |
142 |
52 |
|
|
Total |
343 |
- |
6 |
(55) |
295 |
295 |
143 |
|
|
Argentina |
Oil and NGLs |
- |
21 |
- |
(1) |
20 |
20 |
91 |
|
Gas2 |
- |
243 |
- |
(7) |
236 |
236 |
680 |
|
|
Total |
- |
264 |
- |
(8) |
256 |
256 |
770 |
|
|
Germany |
Oil and NGLs |
- |
95 |
- |
(2) |
92 |
92 |
16 |
|
Gas2 |
- |
35 |
- |
(1) |
34 |
34 |
27 |
|
|
Total |
- |
130 |
- |
(4) |
126 |
126 |
43 |
|
|
North Africa |
Oil and NGLs |
- |
9 |
- |
(1) |
8 |
6 |
5 |
|
Gas2 |
- |
48 |
- |
(4) |
44 |
30 |
25 |
|
|
Total |
- |
57 |
- |
(4) |
52 |
36 |
30 |
|
|
Mexico |
Oil and NGLs |
- |
40 |
- |
(1) |
39 |
25 |
386 |
|
Gas2 |
- |
8 |
- |
(0) |
8 |
7 |
18 |
|
|
Total |
- |
48 |
- |
(1) |
47 |
31 |
405 |
|
|
Southeast Asia |
Oil and NGLs |
7 |
- |
0 |
(2) |
6 |
4 |
44 |
|
Gas2 |
10 |
- |
0 |
(2) |
8 |
6 |
167 |
|
|
Total |
18 |
- |
1 |
(4) |
14 |
10 |
211 |
|
|
Total |
Oil and NGLs |
190 |
343 |
(2) |
(40) |
491 |
472 |
783 |
|
Gas2 |
171 |
632 |
9 |
(55) |
758 |
740 |
1,127 |
|
|
Total |
361 |
976 |
7 |
(94) |
1,249 |
1,212 |
1,910 |
1 The volumes in the above table reflect internal estimates. DeGolyer and MacNaughton (D&M) audited by means of independent assessment a substantial proportion of the asset base, covering 90 per cent of working interest 2P reserves and over 70 per cent of working interest 2C resources. D&M opinion on these estimates is as follows; it is D&M's opinion that the proved-plus-probable 2P reserves estimates prepared by Harbour on the properties evaluated be D&M, when compared on the basis of working interest millions of barrels of oil equivalent, in aggregate, do not differ materially from those prepared by D&M and it is D&M's opinion that the 2C contingent resources estimates prepared by Harbour on the properties evaluated be D&M, when compared on the basis of working interest millions of barrels of oil equivalent, in aggregate, do not differ materially from those prepared by D&M.
2 Gas volumes are converted to boe using conversion factors of 5.8 mmbtu per boe for 2P reserves. 2C gas volumes are converted to mmboe using 5.8 mmbtu/boe, where gas calorific values can be meaningfully determined, and 5.6 mscf/boe, where otherwise. Fuel gas is not included in the 2P reserves estimates.
3 Relates to Harbour's acquisition of Wintershall Dea assets that completed on 3 September 2024.
4 2P reserves revisions include both changes from re-estimation and additions. The overall revision predominantly reflects additions made for activity in the Elgin and AELE hubs, in the UK, obtaining approvals in 2024. Revisions based on re-estimates account for less the one percent change to the reserves volume for the UK and Southeast Asia.
5 Harbour's net entitlement 2P reserves are lower than its working interest 2P reserves for some assets in Mexico, North Africa and Southeast Asia, reflecting the terms of the production sharing contracts (PSC) for the relevant assets.
Because of rounding, some totals may not agree exactly with the sum of their component parts.
C02 storage 2P capacity and 2C resources1
|
2P capacity million tonnes 31 December 2024 |
2C resources2 million tonnes 31 December 2024 |
|
|
Norway |
0.4 |
220.8 |
|
UK |
- |
390.9 |
|
Denmark |
- |
25.4 |
|
Total3 |
0.4 |
659.1 |
1 All numbers are representative of Harbour's working interest.
2 Total includes resources associated with two area in the Netherlands, where there is currently no storage licence in place. Harbour has a cooperation agreement to evaluate CCS storage on Q1-B and P6-AB which are subject to production licences. The nature of licencing for CCS in the Netherlands means that storage licences are not required for exploration stage CCS evaluation where there is a producing licence.
3 The volumes in the above table reflect internal estimates. AGR Energy Services AS (AGR) have provided a competent persons report over the Havstjerne and Luna 2C resources in Norway. ERCE Equipoise Ltd (EQR) have provided a competent persons report over the Viking 2C resources in the UK. The resources that have been independently assessed amount to c.70% of the total Harbour storage resources, the independent assessment of these resources is not materially different in the aggregate volume to the internal Harbour estimates for these assets (<5%).
Non-IFRS measures
Harbour uses certain measures of performance that are not specifically defined under IFRS or other generally accepted accounting principles (GAAP). These non-IFRS measures, which are presented within the Financial review, are defined below:
Capital investment: Depicts how much the Group has spent on purchasing fixed assets in order to further its business goals and objectives. It is a useful indicator of the Group's organic expenditure on oil and gas assets, and exploration and appraisal assets, incurred during a period.
DD&A per barrel: Depreciation and amortisation of oil and gas properties for the period divided by working interest production. This is a useful indicator of ongoing rates of depreciation and amortisation of the Group's producing assets.
EBITDAX: Earnings before tax, interest, depreciation and amortisation, impairments, remeasurements, onerous contracts and exploration expenditure. This is a useful indicator of underlying business performance.
Free cash flow: Operating cash flow less cash flow from investing activities (exclusive of net expenditure on business combinations) less interest and lease payments (principal and interest).
Leverage ratio: Net debt/ last twelve months EBITDAX.
Liquidity: The sum of cash and cash equivalents on the balance sheet and the undrawn amounts available to the Group on our principal facilities. This is a key measure of the Group's financial flexibility and ability to fund day-to-day operations.
Net debt: Total revolving credit facility and bonds (net of the carrying value of unamortised fees) less cash and cash equivalents recognised on the consolidated balance sheet. This is an indicator of the Group's indebtedness and contribution to capital structure.
Operating cost per barrel: Direct operating costs (excluding over/underlift) for the period, including tariff expense, insurance costs and mark to market movements on emissions hedges, less tariff income, divided by working interest production. This is a useful indicator of ongoing operating costs from the Group's producing assets.
Shareholder returns paid: Dividends plus share buybacks completed in the period are included in this metric which shows the overall value returned to stakeholders in the period.
Total capital expenditure: Capital investment 'additions' per notes 11 and 12 plus decommissioning expenditure 'amounts used' per note 21.
Glossary
|
2C |
Contingent resources |
|
2P |
Proven and probable reserves |
|
AGM |
Annual general meeting |
|
AHFS |
Asset held for sale |
|
APS |
Announced Pledges Scenario (IEA) |
|
bbl |
Barrel |
|
boe |
Barrel of oil equivalent |
|
bnboe |
Billion barrels of oil equivalent |
|
CCS |
Carbon capture and storage |
|
CGU |
Cash generating unit |
|
COP |
Cessation of production |
|
DD&A |
Depreciation, depletion and amortisation |
|
DRIP |
Dividend re-investment plan |
|
E&E |
Exploration and evaluation |
|
EBITDAX |
Earnings before interest, tax, depreciation, amortisation and exploration |
|
ECL |
Expected credit losses |
|
EFF |
Exploration financing facility |
|
EIR |
Effective interest rate |
|
EPL |
Energy Profits Levy (UK) |
|
EPS |
Earnings per share |
|
ESOP |
Employee stock ownership plan |
|
ETS |
Emission trading system |
|
FEED |
Front End Engineering & Design |
|
FLNG |
Floating liquefied natural gas |
|
FPSO |
Floating production storage offtake vessel |
|
FVLCD |
Fair value less cost of disposal |
|
FVOCI |
Fair value through other comprehensive income |
|
FVTPL |
Fair value through profit or loss |
|
GAAP |
Generally accepted accounting principles |
|
GHG |
Greenhouse gas emissions |
|
IAS |
International Accounting Standards |
|
IASB |
International Accounting Standards Board |
|
IFRSs |
International Financial Reporting Standards |
|
kboepd |
Thousand of barrels of oil equivalent per day |
|
kgCO2e |
Kilograms of carbon dioxide equivalent |
|
LC |
Letter of credit |
|
LTM |
Last twelve months |
|
LTIP |
Long Term Incentive Plan |
|
mmbtu |
Million British thermal unit |
|
mmbbl |
Million barrels of oil |
|
mmboe |
Million barrels of oil equivalent |
|
mt |
Million tonnes |
|
mtpa |
Million tonnes per annum |
|
mscf |
Thousand standard cubic feet |
|
NBP |
National Balancing Point (UK natural gas prices) |
|
NOK |
Norwegian krone |
|
NZE |
Net Zero Emissions Scenario (IEA) |
|
OECD |
Organisation for Economic Co-operation and Development |
|
PP&E |
Property, plant and equipment |
|
PSC |
Production sharing contract |
|
RBL |
Reserves-based lending |
|
RCF |
Revolving credit facility |
|
SAYE |
Save As You Earn |
|
SOFR |
Secured Overnight Financing Rate |
|
SPA |
Sales and purchase agreement |
|
STEPS |
IEA Stated Policies (IEA) |
|
TCFD |
Task Force on Climate-related Financial Disclosures |
|
Therm |
Unit of UK natural gas |
|
TRIR |
Total Recordable Injury Rate (The number of fatalities, lost time injuries, substitute work, and other injuries requiring treatment by a medical professional per million hours worked) |
|
USD |
US dollar |
|
WACC |
Weighted average cost of capital |
1 See Glossary for the definition of non-IFRS measures used in this section.
[2] Difference to the final dividend value declared of $100 million is due to foreign exchange adjustments on sterling denominated shares at the date of payment.