

IXICO plc
("IXICO" or the "Group")
Financial Results for year ended 30 September 2024 & Notice of AGM
04 December 2024 - London, UK. IXICO plc (AIM: IXI, "IXICO" or "the Company") a global leader in neuroscience imaging, using its AI-driven platform to help advance therapy research in neurological disorders, announces its audited results for the year ended 30 September 2024 ("FY24").
The Group has repositioned itself during 2024, slowing down revenue decline, delivering robust commercial recovery in H2 and defining a new path towards sustainable performance at scale. The appointment of Bram Goorden as CEO towards the end of H2, the completion of an oversubscribed £4 million capital raise in October, and the launch of the Group's next generation TrialTracker AI-driven imaging platform, underpinned by growth in the Group's orderbook towards the end of the year, provide strong foundations for a return of the Group to growth in 2025.
Financial:
Financial performance for the full year marginally outperformed the trading update provided ahead of the Group's capital raise that completed on 28 October 2024, thanks to a stronger second half. Gross margin and EBITDA followed suit.
· Revenues of £5.8 million (2023: £6.7 million). The reduction on the prior period reflects a slower pace of new client contract wins in the first six months of the year. The Group recorded 27% increase in revenues in the second half of the year as compared to the first half;
· Gross Profit margin of 47% (2023: 49%); Gross profit margin has remained largely stable, despite revenue reduction due to careful cost management across the year;
· EBITDA1 loss of £1.7 million (2023: £0.8 million); EBITDA losses improved compared to market expectations, with the increase compared to prior year due to a combination of lower revenues and a decrease in cost capitalisation (resulting in increased cost expense) partially offset by cost reductions delivered across the year;
· Closing, debt-free, cash of £1.8 million (2023: £4.0 million); Cash was subsequently augmented by £3.7 million net proceeds from an oversubscribed capital raise completed after the financial year end; and
· Closing Net Asset value of £9.5 million (2023: £11.4 million).
Operational & Commercial:
· Several key appointments were made:
o Bram Goorden appointed in August 2024, to be a commercially focussed scale-up CEO;
o Mark Warne appointed Independent Chair of the Board in January 2024
o Deepened Board expertise with the appointment of Dr Dipti Amin as a Non-Executive Director in October 2023.
· The Group's next generation AI-driven platform TrialTracker live on client trials; Capitalised investment in this platform during the year of £0.5 million (2023: £1.9 million) and investment in US commercial and operational presence initiated;
· Important strategic collaborations signed during the year with the Global Alzheimer's Platform ('GAP') for their BioHermes 2 AD study, and the expansion of the HD-IH HD consortium. The GAP contract is a high-profile contract, with several large pharma companies contributing to it, from which IXICO can build its profile further in AD. The HD-IH HD study is anticipated to become the leading HD dataset, with over 6,000 MRI datasets analysed by IXICO, and consolidates IXICO's position in HD;
· £8.9 million in new contracts won during the period reflecting a combination of new contracts (11 clients) and client contract extensions (15 clients);
· Careful cost management resulted in a 12% annual reduction in salary costs; and
· Closing order book of £15.3 million (2023: £14.8 million), with over 75% of forecast revenues for FY25 contracted.
(1) EBITDA is defined as earnings before interest, tax, depreciation, and amortisation
Bram Goorden, CEO of IXICO, said: "We expect 2024 to reflect a transition from the recent periods of revenue decline. Thanks to careful cost management, a successful capital raise and by redirecting efforts towards areas of growth, we have defined a clear strategy for scale. Going into 2025, I am confident we will continue to see renewed growth, already partly witnessed in the second half of last year, thanks to the completion and deployment of TTNx, the next generation of our advanced AI platform, further market leading scientific innovation, an expanded global footprint and strengthened customer-facing teams."
Notice of AGM
IXICO announces that its 2025 Annual General Meeting ("AGM") will be held at IXICO's office, 4th Floor Griffin Court, 15 Long Lane, London, EC1A 9PN on 24 January 2025 at 10.30 a.m.
The full Annual Report and Accounts, along with Notice of AGM, will be sent to shareholders on 20 December 2024 and at the same time will be made available on the Company's website in accordance with AIM Rule 20.
This announcement contains inside information as stipulated under the retained EU law version of the Market Abuse Regulation (EU) No. 596/2014 (the "UK MAR") which is part of UK law by virtue of the European Union (Withdrawal) Act 2018. The information is disclosed in accordance with the Company's obligations under Article 17 of the UK MAR.
For further information please contact:
|
IXICO plc |
+44 (0) 20 3763 7499 |
||
|
Bram Goorden, Chief Executive Officer Grant Nash, Chief Financial Officer |
|||
|
Cavendish Capital Markets Limited (Nominated adviser and sole broker) |
+44 (0)20 7220 0500 |
||
|
Giles Balleny / Dan Hodkinson (Corporate Finance) Nigel Birks (Life Sciences Specialist Sales) Harriet Ward (Corporate Broking) |
|||
|
Michael F Johnson / Tamar Cranford-Smith (Sales) |
|||
About IXICO
IXICO is dedicated to delivering insights in neuroscience based on its AI-driven platform to help transform the advancement of investigational therapies for neurological diseases, such as Huntington's disease, Parkinson's disease and Alzheimer's disease. The Company's purpose is to advance medicine and human health by turning data into clinically meaningful information, providing valuable new insights in neuroscience by supporting pharmaceutical companies across all phases of CNS clinical research. IXICO's ambition is to be a leading advocate of artificial intelligence in medical image analysis.
IXICO is a global group, serving large pharma and biotech customers with breakthrough data analytics at scale via its remote access AI platform. IXICO's technology provides critical neurodegenerative disease clinical trial support and insight, helping to reduce R&D risk and uncertainty while enhancing disease understanding and drug development efficiencies. IXICO is headquartered in the UK, with subsidiaries in the US and across several other international territories.
More information is available on www.IXICO.com and follow us on Twitter @IXICOnews
Chair's Statement
I am delighted to present this statement on behalf of the Board of IXICO plc, a leader in neuroscience imaging, using AI to drive advanced therapy research in neurological and neurodegenerative disorders.
The Board has been resolutely focused on strengthening the foundations of the Group to create value for IXICO's shareholders. The opportunity for IXICO's innovative AI-driven platform in the rapidly growing multi-billion-dollar neuroscience imaging market has never been more relevant. During the year there has been significant progress made towards returning the Group to growth. In the second half of the year, revenues have grown 27% compared to H1, the order book has expanded to £15.3 million exceeding 2023 levels, and the pipeline of new contract opportunities is growing.
Growth strategy
IXICO already has established repeat customer partnerships with global biopharmaceutical companies and contract research organisations in Phase I, II and III clinical trials. However, until now, due to a focussed effort to make progress in a selective number of disease areas, the Group has not fully exploited the value of its technology. Extensive development of novel AI-driven algorithms during the year has delivered a platform now capable of scale - not only across a broader array of neurological diseases, but also in new areas of revenue such as clinical decision making and precision medicine.
In the last quarter of the year, the Board has undertaken two specific initiatives to capitalise on an expanding market opportunity:
· The appointment of Bram Goorden as CEO. An experienced leader in BioPharma and precision medicine, Bram has updated the Group's strategy with three pillars; Innovate, Lead and Scale. We are seeing immediate results from the execution of this optimised strategy across operations, product development and commercial momentum.
· The completion of a substantially oversubscribed £4 million capital raise concluded in October 2024, putting the Group on a firm financial footing. The fundraise provides resource certainty to execute the Innovate, Lead and Scale strategy at pace.
I am confident that these actions, together with additional operational and commercially focussed activities the Group has undertaken in the last twelve months, are a solid foundation for sustainable growth.
Financial performance
As previously reported, the macro-economic backdrop during this trading year has been challenging. However, the sophistication of the Group's technology, the continued broadening and deepening of its product offering, together with a dedicated commercial effort has resulted in financial resilience. Latterly, as reported in the Trading Update on 14 August 2024, the revenue outlook for IXICO is positive with new contract wins driving revenue growth across the second half of the year. The Board are pleased to report, as outlined in these year-end results, this trend to growth continues. Through the activities of the Audit Committee, the Board, and the Leadership Team, the Group continues to implement and maintain robust financial controls and reporting.
Organisation
Our people, as ever, remain critical to our success. IXICO is a dynamic collaborative place to work where innovation thrives. This is demonstrated by a continued ability to create commercially attractive proprietary technology while leveraging broader industry advances in AI and imaging. During the year we broadened the Board with the appointment of Dr Dipti Amin as an Independent Non-Executive Director. Dr Amin is a medically trained senior executive with extensive commercial, leadership and operational experience, in medicine, pharmacology and the highly regulated healthcare and research sectors. I would like to thank our people for their hard work, passion, and dedication which has been instrumental in driving us forward.
Governance
As an AIM-quoted company the Board remains committed to high standards of corporate governance that ensures the Group operates in a transparent and ethical way that delivers value for employees, shareholders and stakeholders. During the year the activities of the Board, highlighted above, have aimed to secure the financial stability, minimise risk, and optimise the organisational structure of IXICO.
Outlook
With the new skillsets within the team, and the operations of the business appropriately resourced, we are now seeing financial performance improving and anticipate a period of sustained commercial momentum. I would like to extend my gratitude to all our shareholders, partners, and customers for their trust and support. Together, we are poised to achieve a differentiated leading position across the neurological imaging market, at scale.
Always with the end goal in mind, such activity can deliver a deeper understanding of neurological diseases, and consequently, lead to the discovery and development of new medicines to improve the lives of patients around the world.
 |
Mark Warne
Non-Executive Chair
Chief Executive's statement
Executive Summary
As incoming CEO, joining towards the end of our 2024 financial year, I made it my priority to complete the year on a high for the Group and for our customers. Together with the excellent IXICO team, we increased commercial momentum, enacted actions to strengthen the balance sheet, all whilst freeing up resources for innovation and future expansion in novel areas for our AI-driven precision medicine platform in neurology.
Two of my initial observations and drivers to join the Group have been strengthened during these first few months of my tenure:
1. IXICO's science and global operations teams are excellent, and the technology is groundbreaking as confirmed by customers, key opinion leaders and the numerous partners with which our Group is collaborating; and
2. The platform and footprint have the potential for significantly more impact in terms of customer numbers, patient reach and shareholder value.
The Group is preparing to celebrate its 20th anniversary, which is a testament to the heritage and early involvement in helping change the course of clinical development in the area of neurodegenerative diseases. With many of the pioneering scientists and technology experts still part of today's IXICO team, the face of the Group has changed a great deal across recent years. Particularly, the next generation of our proprietary platform TTNx has been completed and is now enabled with the latest technological advances in neuroimaging analytics, as well as guaranteeing future-proof levels of security, regulatory compliance, scale and user friendliness.
IXICO's leading position in Huntington's Disease (HD) remains unparalleled. This has been proven by important contracts and collaborations, including the long-term contract with a US based Pharma announced in August 2024, and our place in the increasingly influential Huntington's Disease Imaging Harmonization Consortium (HD-IH). Based on more than 6,000 data sets, we witness how the insights derived from the work of the HD-IH consortium will create long term value to the biopharmaceutical partners and support them and the broader HD research community.
Novel algorithms powered by our proprietary IXIQ.Ai platform in the areas of Alzheimer's Disease (AD) and Parkinson's Disease (PD) enable the Group to continue to play a prominent role in those two fields, where we have long-standing expertise in MRI, PET and other imaging analytics. As a result, we supported seven major global AD programmes and we further strengthened the collaboration with the Global Alzheimer's Platform (GAP). This builds on the previous year's completion of an initial 1,000 participant trial, notable for achieving a secondary recruitment target requiring a minimum of 20% of the study participants to be from traditionally underrepresented populations. This enabled IXICO to report on initial findings on differences between racial and ethnic groups at the CTAD opening symposium (Boston, October 2023). During 2024, IXICO was awarded the Bio-Hermes 2 trial, extending the program into Tau PET and MRI and further strengthening the partnership with GAP.
Operationally, we delivered seamlessly for our clients, providing services to more than 35 neurology trials, broadening our offering across therapeutic indications whilst improving our service level metrics to exceed our clients' expectations. Our next generation TrialTracker platform went live and enabled by the IXIQ.Ai system, we saw the first benefits of this powerful new platform. I look forward to reporting more progress in 2025 and properly introducing TTNx to the market.
I am convinced that IXICO can play an even bigger role in the development of the next generation of treatments for neurodegenerative diseases. This has resulted in the "Innovate / Lead / Scale" strategy that sets out to accelerate the development of novel algorithms on our platform to increase our reach and penetration in the global arena. Important scientific themes such as neuromelanin as a proxy for dopamine loss in PD and identification of the vascular fingerprint in Dementia / AD, will define the course of breakthrough innovation the coming years. IXICO was part of some of the initial biomarker discovery work in these areas and we are determined to now play a major role in helping biopharma sponsors with the technology and expertise to equip their trials with these latest analytics.
These are exciting times as we are part of generating increased understanding of neurodegenerative diseases whilst seeing important regulatory approvals come through for drugs such as Eisai's Lecanemab and Eli Lilly's Donanemab. Several major biopharma companies have expressed heightened focus and investments in the areas which IXICO has been supporting since its inception. We are convinced that this will positively impact our ability to deliver on our purpose of harnessing medical imaging data to advance human health, strengthening our position as a platform for neuroscience imaging data analytics, and importantly scaling these efforts to grow our share in the market of the clinical trials industry.
2024 has been a year of transition for IXICO with lower revenues in the first half of the year, but an initial trend reversal in the subsequent six months, thanks to some major contract wins. This trend continues as we build up a healthier growth trajectory going into 2025. To accelerate this trend and allow the above-mentioned innovation to act as a driver for revenues, we went to existing and new investors and successfully concluded a capital raise of £4 million. The interactions with our key investors, both institutional and retail and the strong confidence they showed in IXICO (resulting in a significant oversubscription of the fundraising) were important indicators for me personally confirming my view that IXICO is poised to play a bigger role in the current positive innovation landscape, an area which the Group has called home for 20 years.
We enter our financial year 2025 with an order book of signed contracts valued at £15.3 million and a stronger pipeline of client opportunities, with visibility of new contracts to provide a platform for double digit revenue growth in 2025 and beyond. In addition, I expect to report the results from our strategy to develop the role of our TTNx platform as an enabler in areas such as post marketing surveillance (PMS) and clinical decision making, potentially bringing our solutions closer to patients and their care.
The IXICO team is a highly motivated group of scientists and technology experts and it is quite the privilege to be leading this team of innovators, serving some of the most important development programs in solving what's rapidly becoming society's biggest healthcare challenge: helping patients with neurodegenerative diseases lead more healthy and fulfilling lives. As I look forward, 2025 will be a year where we solidify the role of our Group in supporting this while exploring additional new avenues for increased revenue generation.
Revenues
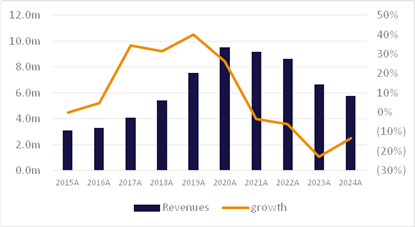
IXICO's FY24 revenues were £5.8 million. We expect improved conditions for the biopharmaceutical industry supporting revenue growth in FY25. As shown in the chart below, IXICO has historically demonstrated its ability to grow quickly, delivering strong growth in the 30-40% range between 2017 and 2020 following the win of a large phase III trial. As we have built out the diversity of our order book following the cancellation of that large trial, we are now in a good position to win further such studies and return to revenue growth.
| Revenues and revenue growth |
|
|
Source: Company data. Cavendish estimates |
Growth strategy & Corporate outlook
Ambition
I have set the target of growing revenues towards £20 million+ in the medium term based upon the Innovate / Lead / Scale strategy, with an expectation of a return to revenue growth over 2025 and an initial target beyond this of reaching £10 million revenues on the back of the recent capital raise. Key targets to drive revenue growth are:
- Increase the serviceable market to £65m+ by increasing traction in the AD and PD clinical trial markets.
- Expanding the commercial footprint and pipeline, particularly in the US.
- Improving the pipeline to order book conversion success rate by increased differentiation in our analysis offerings.
Future revenues will be supported by expansion of the AI-driven platform into new revenue streams with a particular focus on moving into post-market assessments and clinical practice, targeting the large market opportunities beyond the current contract research organisation model.
In addition, we plan to expand our next-generation AI-powered imaging biomarker platform, TTNx. TTNx is a full redevelopment of the Group's TrialTracker platform, making use of Microsoft Azure cloud technology and has been the subject of significant investment over the past few years. This platform is validated and is regulatory compliant and provides the Group with the opportunity to further strengthen its position in the market. We strongly believe we are well positioned to capitalise on the latent value held within this platform and unique data assets through the application of our proven advanced IXIQ.Ai analytics platform.
Over the medium term, the Board has identified opportunities to tap into new future revenue streams using TTNx by bridging R&D and clinical practice, facilitating the consolidation of analytics, and supporting clinical decision making via Software as a Service, licensing or strategic co-development models. This opportunity arises as TTNx, using Microsoft Azure technologies, is highly extensible and scalable. This then enables the augmentation of the platform's capabilities in response to specific opportunities such as the potential to support clients and clinicians as drugs showing efficacy in neurological conditions achieve market approval and move into post market assessment and clinical practice.
The Innovate / Lead / Scale strategy
Innovate
We aim to differentiate IXICO through novel biomarker analytics, enabling the Group to better penetrate new and larger key disease areas such as AD and PD, thereby increasing the Group's serviceable market by an estimated factor of three. In the next 6-12 months, we will seek to further differentiate our offering through the application of our proven IXIQ.Ai analytics platform in AD and PD with three new MRI-driven biomarkers to analyse a subject's vascular "fingerprint", neuromelanin accumulation and inflammatory processes.
More accurate assessment of vascular pathology in AD trials can support targeted trial recruitment, specifically in populations with an increased level of vascular pathology as has been shown for some traditionally underrepresented populations. Furthermore, it allows more informed treatment decisions and can potentially help identify subjects at risk for Amyloid-related imaging abnormalities (ARIA) which is important both in clinical trials and post market assessment. Neuromelanin analysis is used in PD trials as a proxy for dopamine loss and is considered a potential alternative to currently used dopamine SPECT / PET biomarkers. MRI-based quantification of inflammatory processes can support both AD and PD trials as inflammation plays a role in disease hypotheses across both indications and is increasingly relevant as a treatment target. The additions of these three biomarkers to our analysis offering is expected to activate a significantly enhanced pipeline. In focussing on next generation AI powered biomarkers services, the Group seeks to address a larger proportion of the global neuroimaging clinical trials market, valued at $13.5 billion in 2022.
Lead
IXICO is focused on solidifying its presence and impact in the CNS precision medicine space by reinforcing its medical key opinion leadership. We are investing in medical thought leadership to become even more visible on the global stage by increasing interaction with key opinion leaders ("KOLs") in the neurology space. We want to give visibility to the work in collaboration with KOLs that aligns with and showcases our leading technology. We intend to build on our existing partnerships to validate and position our technology in AD and PD, such as Global Alzheimer's Platform Foundation (GAP), the Critical Path For Alzheimer's Disease (CPAD) and the Critical Path for Parkinson's disease (CPP). GAP seeks to accelerate the delivery of innovative therapies to individuals living with AD and PD and conducts natural history trials to assess techniques that support the accurate and cost-effective identification of individuals with AD. IXICO has provided the imaging services to this platform since 2020. CPAD is a consortium of commercial and charitable organisations that work together to support drug development in AD. CPP is the equivalent consortium focussed on PD.
In 2025 we will increase our conference engagement and demonstrate thought leadership and engagement, building upon recent success at the Alzheimer's Association International Conference (AAIC), the Alzheimer's & Parkinson's Diseases Conference (ADPD) and the Clinical Trials on Alzheimer's Disease (CTAD) conference. We have shown success of this approach in HD, specifically through the Huntington's Disease Imaging Harmonization (HD-IH) consortium, where our team is analysing over 6,000 datasets in partnership with the CHDI foundation and several biopharmaceutical companies. This project validates IXICO's analysis capabilities, with KOLs publishing and presenting on the results from this consortium. A consequence of this, we have further cemented our position as being the leading provider of image analysis services in HD.
Scale & Execute
Rapid change in the design and execution of clinical trials requires global commercial reach for clinical trial neuroimaging services, particularly into North America.
The significance of the North American market cannot be understated: 83, or 44%, of current AD clinical trials are exclusively conducted in North America. The region is home to a significant proportion of key neurological imaging decision makers, including those employed by Biogen, Roche, Lilly, Takeda, and Janssen. Furthermore, North America is the centre for key scientific collaborations and consortia, including the Global Alzheimer's Platform Foundation (GAP), CHDI Foundation, Alzheimer's Disease Neuroimaging Initiative (ADNI) and CPAD amongst others. As a result, we believe that increased focus on the North American market will drive the Group's exposure to key industry players, widen IXICO's geographic reach in line with changing client needs, and expand the Group's addressable market. We are not starting from scratch with our focus on North America. 14 of the 26 projects that are currently in the Group's orderbook are US based (or US focused) projects. This equates to c.45% of the Group's orderbook by value and US based projects have contributed c.40% of the Group's 2024 revenues. It is a focus on accelerating this growth further, that is a key strut in the Group's strategy.
To scale our operations effectively, we plan to grow our global pipeline and revenue potential through increased access to client and large Contract Research Organisation (CRO) decision-makers, driving business development. We aim to increase our serviceable market by an estimated factor of three, expand our commercial pipeline by a factor of four, and improve our pipeline-to-order book conversion success rate.
In the medium term, IXICO will focus on accelerating growth by actively pursuing new addressable markets beyond the traditional CRO model, through extending our technology platform into post market assessment and, in partnership with others, investigate utility in clinical decision support. This reflects the extensibility IXICO has built into its TTNx platform which enables us, via partnership opportunities, to support the provision of multi-biomarker platforms and/or bring closer the interactions and seamless communication of data with large scale CROs, analysis groups, imaging providers and/or providers of electronic health records (EHR). We have identified these as opportunities to leverage our TTNx platform into areas that require highly resilient, secure but bespoke technologies to underpin the collection, collation and analysis of large-scale data. TTNx has been developed to enable the delivery of post marketing assessment studies, the potential of which has been shown, albeit on a relatively small scale.

Bram Goorden
Chief Executive Officer
Financial review
Right sizing the Group for future growth.
In late 2024, IXICO raised just over £4.0 million (£3.7 million net) to deliver the next phase of the Group's strategy. This strategy is focussed on leveraging the significant latent value the Group has developed within its science and technology platform. It is anticipated that the investments made subsequent to this capital raise will return the Group to revenue growth which will, over the medium term, return improved margins, profitability and cash generation.
The capital raise was completed at a relatively challenging time in the clinical trials and financial markets and reflects the depth of existing and new shareholder interest, conviction and enthusiasm for the strategy laid out by the Group.
Looking to 2025, a strengthening of the clinical trials market is anticipated, reflecting a return to 2022 investment levels in drug development. The capital raise concluded in October 2024, in addition to cost management decisions executed earlier in the year mean the Group is well placed to leverage this market improvement by investing in a clearly defined set of strategic priorities.
This review includes a comparison of the financial KPIs used to compare performance to the prior year, a summary of which is shown below:
|
KPI |
2024 result |
2023 result |
Movement |
|
|
Revenue |
£5.8m |
£6.7m |
£0.9m↓ |
|
|
Gross profit |
£2.7m |
£3.3m |
£0.6m↓ |
|
|
Gross margin |
47.0% |
49.1% |
210bps↓ |
|
|
EBITDA loss |
(£1.7m) |
(£0.8m) |
£0.9m↓ |
|
|
Operating loss |
(£2.2m) |
(£1.4m) |
£0.8m↓ |
|
|
Loss per share |
(4.14p) |
(2.44p) |
1.70p↓ |
|
|
Order book |
£15.3m |
£14.8m |
£0.5m↑ |
|
|
Net assets |
£9.5m |
£11.4m |
£1.9m↓ |
|
|
Cash |
£1.8m |
£4.0m |
£2.2m↓ |
|
|
Non-current asset investments |
£0.5m |
£1.9m |
£1.4m↓ |
|
Revenue
Revenue for the year of £5.8 million (2023: £6.7 million) represents a year-on-year contraction of 13%. This contraction was caused by the weak market conditions across the clinical trials market throughout 2023 and the first half of 2024 resulting in lower levels of contract wins during this period. As 2024 progressed, a material uptick in the number and value of contracts wins has resulted in a £0.5 million increase in the value of the order book at the end of the year (£15.3 million) as compared to the same timepoint in the prior year (£14.8 million). Growth in the orderbook is an important metric for the Group, as this provides a strong lead indicator of future revenues.
Gross profit
The Group reports gross profit of £2.7 million for the year (2023: £3.3 million). This equates to a gross margin of 47.0% (2023: 49.1%). Whilst this is a strong gross margin, the reduction on the prior year reflects the reduction in revenues and the relatively fixed cost base of the Group.
Gross profit is driven by both the revenue volume itself as well as the mix of revenues being delivered. Across 2024, approximately 60% of the Group's revenues have been from phase I and phase II clinical trials (which tend to be lower margin than later phase trials). Positively, this portfolio provides a strong base for future revenue growth, as those trials which successfully move from early to late phase provide the Group with the opportunity to continue providing services as these trials transition to larger, later phase, more profitable trials.
Earnings before interest, tax, depreciation, and amortisation ('EBITDA')
The Group delivered an EBITDA loss of £1.7 million in the year (2023: £0.8 million). This reflects the reduction in revenues, tighter margins, a couple of non-recurring items that supressed profitability in 2024 and a reduced level of cost capitalisation. These negative impacts have then been partially offset by careful cost management including the completion of a headcount reduction exercise that removed 12% of salary costs between 2023 and 2024.
|
2024 £000 |
2023 £000 |
||
|
Profit attributable to equity holders |
(2,001) |
(1,178) |
|
|
Depreciation of fixed assets |
239 |
400 |
|
|
Amortisation of fixed assets |
236 |
225 |
|
|
Interest on lease liabilities |
21 |
29 |
|
|
Other interest payable |
3 |
- |
|
|
Interest on cash held at bank |
(85) |
(105) |
|
|
Taxation |
(93) |
(183) |
|
|
EBITDA |
(1,680) |
(812) |
|
Operating profit
Operating expenditure in the year reflected careful cost management alongside targeted investment, specifically:
· research and development expenses of £1.3 million (2023: £0.9 million) included the development of new algorithms to support image analysis in new and existing therapeutic indications. In addition, the Group capitalised £0.3 million of internal development expenditure primarily in respect of its next generation Trial Tracker platform (2023: £1.2 million);
· sales and marketing expenses of £1.4 million (2023: £1.3 million) reflecting the investment in sales executives and marketing and product capabilities as well as £0.1 million of one-time costs related to commercial consultancy; and
· general and administrative expenses of £2.9 million (2023: £2.9 million) reflecting savings in headcount following a restructure at the start of the year, offset by additional one-time expenditure of approximately £0.3million relating to CEO succession.
Operating losses totalled £2.2 million (2023: £1.4 million) equated to an operating loss margin of 37% (2023: 22%).
Order book
The Group grew its contracted order book during the year. On 30 September 2024 this totalled £15.3 million (2023: £14.8 million), which takes account of £5.8 million of revenues delivered during the financial year, £8.9 million of new and expanded multi-year contracts secured during the year and £2.7 million of trial descopes due to client trial failures and minor foreign exchange movement in the year. This net growth in the order book reflects the improvements in the clinical trials market in the latter part of 2024.
Growth in orderbook provides a leading indicator of future growth. The orderbook increase is 3% across the year, with an increase of 20% since the half-year reflecting the marked increase in new contract wins in this latter part of the year.
Looking forward, the Group aims to report accelerated growth in orderbook on an annual basis such that a sustainable level of greater than 10% revenue growth is achieved.
New contracts won were with 11 clients with contract extensions with 15 clients.
|
2024 £000 |
2023 £000 |
||
|
Opening orderbook |
14,753 |
16,019 |
|
|
New wins |
8,947 |
8,030 |
|
|
Revenue |
(5,766) |
(6,665) |
|
|
Net descoping, inflation and FX |
(2,674) |
(2,631) |
|
|
Closing orderbook |
15,260 |
14,753 |
Cash
The Group reported a cash balance on 30 September 2024 of £1.8 million (2023: £4.0 million). The reduction in cash reflects operating cash outflows after tax receipts of £1.7 million in the year (2023: £0.3 million cash inflow), £0.4 million (2023: £1.9 million) of capitalised investment in data and technology assets designed to support future scalability and £0.1 million (2023: £0.2 million) of lease payments on the Group offices.
The Group completed a successful capital raise of just over £4.0 million (£3.7 million after fees) soon after the close of the 2024 financial year.
Non-current asset investments
The Group capitalised £0.5 million of non-current assets in the year to 30 September 2024 (2023: £1.9 million). This decrease in non-current assets investment reflects that the Group's next generation TrialTracker platform was completed and ready for use early in the financial year and consequently saw a reduced level of capital expenditure invested during 2024. 2025 capitalised investment in its platform to deliver additional functionality is expected to be approximately the same level as 2024.
The next generation TrialTracker platform, equipped with the Group's leading analysis algorithms, positions the Group to further enhance its services into clinical trials as well as providing opportunities to penetrate adjacent markets such as post-market and clinical safety assessments in a robust, secure and regulatory-compliant centralised manner. The platform utilises Microsoft Azure's cloud infrastructure and technologies.
Net assets
The Group's net asset position decreased by £1.9 million to £9.5 million across the year (2023: £11.4 million). This reflects losses reported, partially offset by the investments made in technology assets to underpin long-term future growth aspirations and market demands.
This net asset position was enhanced soon after the financial year on the successful completion of a £4.0 million capital raise (£3.7 million after fees).
Loss per share
The Group reports a loss per share of 4.14p (2023: 2.44p).
Grant Nash
Chief Financial Officer
Financial Statements
Consolidated Statement of Comprehensive Income
for the years ended 30 September 2024 and for 30 September 2023
|
30-Sep-24 |
30-Sep-23 |
|||
|
Notes |
£000 |
£000 |
||
|
Revenue |
6 |
5,766 |
6,665 |
|
|
Cost of sales |
(3,055) |
(3,395) |
||
|
Gross profit |
2,711 |
3,270 |
||
|
Other income |
8 |
781 |
393 |
|
|
Operating expenses |
||||
|
Research and development expenses |
(1,337) |
(925) |
||
|
Sales and marketing expenses |
(1,396) |
(1,321) |
||
|
General and administrative expenses |
(2,913) |
(2,854) |
||
|
Total operating expenses |
11 |
(5,646) |
(5,100) |
|
|
Operating loss |
(2,154) |
(1,437) |
||
|
Finance income |
85 |
105 |
||
|
Finance expense |
(25) |
(29) |
||
|
Loss on ordinary activities before taxation |
11 |
(2,094) |
(1,361) |
|
|
Taxation |
12 |
93 |
183 |
|
|
Loss attributable to equity holders for the period |
(2,001) |
(1,178) |
||
|
Other comprehensive income/(expense): |
||||
|
Items that will be reclassified subsequently to profit or loss |
||||
|
Foreign exchange translation differences |
(2) |
(21) |
||
|
Movement in fair value of cash flow hedges |
23 |
32 |
111 |
|
|
Cash flow hedges recycled to revenue |
23 |
(5) |
(27) |
|
|
Total other comprehensive income |
25 |
63 |
||
|
Total comprehensive expense attributable |
||||
|
to equity holders for the period |
(1,976) |
(1,115) |
||
|
Loss per share (pence) |
||||
|
Basic loss per share |
13 |
(4.14) |
(2.44) |
|
|
Diluted loss per share |
13 |
(4.14) |
(2.44) |
Consolidated Statement of Financial Position
as at 30 September 2024 and 30 September 2023
|
30-Sep-24 |
30-Sep-23 |
|||
|
Notes |
£000 |
£000 |
||
|
Assets |
||||
|
Non-current assets |
||||
|
Property, plant and equipment |
14 |
313 |
518 |
|
|
Intangible assets |
15 |
6,374 |
6,147 |
|
|
Commission assets |
17 |
9 |
39 |
|
|
Total non-current assets |
6,696 |
6,704 |
||
|
Current assets |
||||
|
Trade and other receivables |
17 |
2,213 |
1,706 |
|
|
Current tax receivables |
12 |
492 |
549 |
|
|
Cash and cash equivalents |
1,787 |
4,031 |
||
|
Total current assets |
4,492 |
6,286 |
||
|
Total assets |
11,188 |
12,990 |
||
|
Liabilities and equity |
||||
|
Non-current liabilities |
||||
|
Trade and other payables |
18 |
- |
2 |
|
|
Lease liabilities |
19 |
150 |
275 |
|
|
Total non-current liabilities |
150 |
277 |
||
|
Current liabilities |
||||
|
Trade and other payables |
18 |
1,410 |
1,142 |
|
|
Derivative financial liabilities |
23 |
- |
27 |
|
|
Lease liabilities |
19 |
164 |
112 |
|
|
Total current liabilities |
1,574 |
1,281 |
||
|
Total liabilities |
1,724 |
1,558 |
||
|
Equity |
||||
|
Ordinary shares |
21 |
484 |
484 |
|
|
Share premium |
21 |
84,802 |
84,802 |
|
|
Merger relief reserve |
21 |
1,480 |
1,480 |
|
|
Reverse acquisition reserve |
21 |
(75,308) |
(75,308) |
|
|
Cash flow hedge reserve |
21,23 |
- |
(27) |
|
|
Foreign exchange translation reserve |
21 |
(97) |
(95) |
|
|
Capital redemption reserve |
21 |
7,456 |
7,456 |
|
|
Accumulated losses |
21 |
(9,353) |
(7,360) |
|
|
Total equity |
9,464 |
11,432 |
||
|
Total liabilities and equity |
11,188 |
12,990 |
Company Statement of Financial Position
as at 30 September 2024 and 30 September 2023
|
30-Sep-24 |
30-Sep-23 |
|||
|
Restated1 |
||||
|
Notes |
£000 |
£000 |
||
|
Assets |
||||
|
Non-current assets |
||||
|
Investments in Group undertakings |
16 |
5,865 |
5,857 |
|
|
Trade and other receivables |
17 |
2,224 |
2,450 |
|
|
Total non-current assets |
8,089 |
8,307 |
||
|
Current assets |
||||
|
Trade and other receivables |
17 |
39 |
31 |
|
|
Cash and cash equivalents |
681 |
1,469 |
||
|
Total current assets |
720 |
1,500 |
||
|
Total assets |
8,809 |
9,807 |
||
|
Liabilities and equity |
||||
|
Current liabilities |
||||
|
Trade and other payables |
18 |
45 |
60 |
|
|
Total current liabilities |
45 |
60 |
||
|
Equity |
||||
|
Ordinary shares |
21 |
484 |
484 |
|
|
Share premium |
21 |
84,802 |
84,802 |
|
|
Merger relief reserve |
21 |
1,480 |
1,480 |
|
|
Capital redemption reserve |
21 |
7,456 |
7,456 |
|
|
Accumulated losses |
21 |
(85,458) |
(84,475) |
|
|
Total equity |
8,764 |
9,747 |
||
|
Total liabilities and equity |
8,809 |
9,807 |
1See note 3
Parent Company Income Statement
As permitted by Section 408 of the Companies Act 2006, the income statement of the Company is not presented as part of these financial statements. The Company's loss for the financial year was £991,000 (2023: £707,000).
Consolidated Statement of Changes in Equity
for the years ended 30 September 2024 and 30 September 2023
|
Foreign |
Cash |
||||||||
|
Merger |
Reverse |
exchange |
flow |
Capital |
|||||
|
Ordinary |
Share |
relief |
acquisition |
translation |
hedge |
redemption |
Accumulated |
||
|
shares |
premium |
reserve |
reserve |
reserve |
reserve |
reserve |
Losses |
Total |
|
|
£000 |
£000 |
£000 |
£000 |
£000 |
£000 |
£000 |
£000 |
£000 |
|
|
Balance at 1 October 2022 |
482 |
84,802 |
1,480 |
(75,308) |
(74) |
(111) |
7,456 |
(6,234) |
12,493 |
|
Total comprehensive income |
|||||||||
|
Loss for the year |
- |
- |
- |
- |
- |
- |
- |
(1,178) |
(1,178) |
|
Other comprehensive income/(expense) |
|||||||||
|
Foreign exchange translation |
- |
- |
- |
- |
(21) |
- |
- |
- |
(21) |
|
Movement in fair value of cash flow |
- |
- |
- |
- |
- |
111 |
- |
- |
111 |
|
Cash flow hedges recycled to revenue |
- |
- |
- |
- |
- |
(27) |
- |
- |
(27) |
|
Total comprehensive income/(expense) |
- |
- |
- |
- |
(21) |
84 |
- |
(1,178) |
(1,115) |
|
Transactions with owners |
|||||||||
|
Charge in respect of share options |
- |
- |
- |
- |
- |
- |
- |
52 |
52 |
|
Exercise of share options |
2 |
- |
- |
- |
- |
- |
- |
- |
2 |
|
Total transactions with owners |
2 |
- |
- |
- |
- |
- |
- |
52 |
54 |
|
Balance at 30 September 2023 |
484 |
84,802 |
1,480 |
(75,308) |
(95) |
(27) |
7,456 |
(7,360) |
11,432 |
|
Total comprehensive income |
|||||||||
|
Loss for the year |
- |
- |
- |
- |
- |
- |
- |
(2,001) |
(2,001) |
|
Other comprehensive income/(expense) |
|||||||||
|
Foreign exchange translation |
- |
- |
- |
- |
(2) |
- |
- |
- |
(2) |
|
Movement in fair value of cash flow |
- |
- |
- |
- |
- |
32 |
- |
- |
32 |
|
Cash flow hedges recycled to revenue |
- |
- |
- |
- |
- |
(5) |
- |
- |
(5) |
|
Total comprehensive income/(expense) |
- |
- |
- |
- |
(2) |
27 |
- |
(2,001) |
(1,976) |
|
Transactions with owners |
|||||||||
|
Charge in respect of share options |
- |
- |
- |
- |
- |
- |
- |
8 |
8 |
|
Total transactions with owners |
- |
- |
- |
- |
- |
- |
- |
8 |
8 |
|
Balance at 30 September 2024 |
484 |
84,802 |
1,480 |
(75,308) |
(97) |
- |
7,456 |
(9,353) |
9,464 |
Company Statement of Changes in Equity
for the years ended 30 September 2024 and 30 September 2023
|
Capital |
||||||
|
Ordinary |
Share |
Merger relief |
redemption |
Accumulated |
||
|
shares |
premium |
reserve |
reserve |
losses |
Total |
|
|
£000 |
£000 |
£000 |
£000 |
£000 |
£000 |
|
|
Balance at 1 October 2022 |
482 |
84,802 |
1,480 |
7,456 |
(83,820) |
10,400 |
|
Loss and total comprehensive expense for the year |
- |
- |
- |
- |
(707) |
(707) |
|
Transactions with owners |
||||||
|
Charge in respect of share options |
- |
- |
- |
- |
52 |
52 |
|
Exercise of share options |
2 |
- |
- |
- |
- |
2 |
|
Total transactions with owners |
2 |
- |
- |
- |
52 |
54 |
|
Balance at 30 September 2023 |
484 |
84,802 |
1,480 |
7,456 |
(84,475) |
9,747 |
|
Loss and total comprehensive expense for the year |
- |
- |
- |
- |
(991) |
(991) |
|
Transactions with owners |
||||||
|
Charge in respect of share options |
- |
- |
- |
- |
8 |
8 |
|
Total transactions with owners |
- |
- |
- |
- |
8 |
8 |
|
Balance at 30 September 2024 |
484 |
84,802 |
1,480 |
7,456 |
(85,458) |
8,764 |
Consolidated Statements of Cash Flows
for the years ended 30 September 2024 and 30 September 2023
|
30-Sep-24 |
30-Sep-23 |
|
|
£000 |
£000 |
|
|
Cash flows from operating activities |
||
|
Loss for the financial year |
(2,001) |
(1,178) |
|
Finance income |
(85) |
(105) |
|
Finance expense |
25 |
29 |
|
Taxation |
(93) |
(183) |
|
Depreciation of fixed assets |
239 |
400 |
|
Amortisation of intangibles |
236 |
225 |
|
Research and development expenditure credit |
(405) |
(355) |
|
Impairment of intangible assets |
- |
14 |
|
Share option charge |
8 |
52 |
|
(2,076) |
(1,101) |
|
|
Changes in working capital |
||
|
(Increase)/decrease in trade and other receivables |
(559) |
1,290 |
|
Increase/(decrease) in trade and other payables |
351 |
(327) |
|
Cash (used in)/generated from operations |
(2,284) |
(138) |
|
Taxation received |
553 |
456 |
|
Taxation paid |
(1) |
(16) |
|
Net cash generated from operating activities |
(1,732) |
302 |
|
Cash flows from investing activities |
||
|
Purchase of property, plant and equipment |
(34) |
(100) |
|
Purchase of intangible assets including staff costs capitalised |
(437) |
(1,863) |
|
Finance income |
94 |
99 |
|
Net cash used in from investing activities |
(377) |
(1,864) |
|
Cash flows from financing activities |
||
|
Issue of shares |
- |
2 |
|
Repayment of lease liabilities |
(134) |
(158) |
|
Net cash used in from financing activities |
(134) |
(156) |
|
Movements in cash and cash equivalents in the period |
(2,243) |
(1,718) |
|
Cash and cash equivalents at start of year |
4,031 |
5,769 |
|
Effect of exchange rate fluctuations on cash held |
(1) |
(20) |
|
Cash and cash equivalents at end of year |
1,787 |
4,031 |
IXICO plc
Financial Statements for the year ended 30 September 2024
Notes to the financial statements
The financial information set out in these results does not constitute the Group's consolidated statutory accounts for the years ended 30 September 2024 or 2023. Statutory accounts for the year ended 30 September 2023 have been filed with the Registrar of Companies. The statutory accounts for the year ended 30 September 2024 will be delivered to the Registrar in due course. Those accounts have been reported on by the Independent Auditors; their report for the accounts for both financial years was (i) unqualfied; (ii) did not include a reference of any matters to which the auditor drew attention by way of emphasis without qualifying their report; and (iii) did not contain a statement under 498 (2) or 498 (3) of the Companies act 2006.
1. Presentation of the financial statements
a. General information
IXICO plc (the 'Company') is a public limited company incorporated in England and Wales and is admitted to trading on the AIM market of the London Stock Exchange under the symbol IXI. The address of its registered office is 4th Floor, Griffin Court, 15 Long Lane, London EC1A 9PN.
The Company is the parent of the subsidiaries detailed in note 16, together referred to throughout as 'the Group'. The Group is an established provider of technology-enabled services to the global biopharmaceutical industry. The Group's services are used to select participants for clinical trials and assess the safety and efficacy of new drugs in development within the field of neurological disease.
b. Basis of preparation
The consolidated financial statements have been prepared on a going concern basis and in accordance with international accounting standards in conformity with the requirement of the Companies Act 2006.
The consolidated financial statements comprise a Statement of Comprehensive Income, a Statement of Financial Position, a Statement of Changes in Equity, a Statement of Cash Flows, and accompanying notes. These financial statements have been prepared under the historical cost convention modified by the revaluation of certain financial instruments.
The consolidated financial statements are presented in Great British Pounds ('£' or 'GBP') and are rounded to the nearest thousand unless otherwise stated. This is the predominant functional currency of the Group, and is the currency of the primary economic environment in which it operates. Foreign currency transactions are accounted in accordance with the policies set out below.
The Company has elected to use Financial Reporting Standard - 'The Reduced Disclosure Framework' (FRS101). In preparing these financial statements the Company has taken advantage of all disclosure exemptions conferred by FRS 101. Therefore, these financial statements do not include:
· A statement of cash flows and related notes;
· The requirement to produce a statement of financial position at the beginning of the earliest comparative period;
· The requirements of IAS 24 'Related Party Disclosures' to disclose related party transactions entered in to between two or more members of the group as they are wholly owned within the group;
· The effect of future accounting standards not adopted;
· Paragraphs 45(b) and 46 to 52 of IFRS 2, 'Share-based payment' (details of the number and weighted average exercise prices of share options, and how the fair value of goods or services received was determined);
· Paragraphs 91 to 99 of IFRS 13, 'Fair value measurement' (disclosure of valuation techniques and inputs used for fair value measurement of assets and liabilities).
· Disclosures in relation to impairment of assets
· IFRS 7, 'Financial instruments: Disclosures'.
c. Basis of consolidation
The consolidated financial statements incorporate the accounts of the Company and its subsidiary companies adjusted to eliminate intra-Group balances and any unrealised gains and losses or income and expenses arising from intra-Group transactions. The Company's subsidiaries are detailed in note 16. When necessary, adjustments are made to the financial statements of subsidiaries to bring their accounting policies into line with the Group's accounting policies.
The Group controls a subsidiary when the Group is exposed to, or has rights to, variable returns from its involvement with a subsidiary and has the ability to affect those returns through its power over a subsidiary. In assessing control, potential voting rights that are currently exercisable or convertible are taken into account.
The results of subsidiary companies are included in the consolidated financial statements from the date that control commences until the date that control ceases. The assets and liabilities of foreign operations are translated into GBP at exchange rates prevailing at the end of the reporting period. Income statements and cash flows of foreign operations are translated into GBP at average monthly exchange rates which approximate foreign exchange rates at the date of the transaction. Foreign exchange differences arising on retranslation are recognised directly in a separate translation reserve.
d. Going concern
Following the completion of a £4 million oversubscribed capital raise in October 2024, the Group is well capitalised to deliver on its strategic goals. This capital raise was supported by both existing and new institutional investors confirming strong alignment to the Group's strategy. In addition, the commercial traction of the Group, following a challenging eighteen-month period, improved materially during the second half of the 2024 financial year, resulting in a larger orderbook (book of signed contracts) compared to twelve months previous.
The Group has a strong balance sheet for its size with financial year end net assets of £9.5 million, a £1.8 million cash balance that was subsequently bolstered by a capital raise in October 2024. During the year the Group secured £8.9 million of new contracts providing it with good visibility of future revenues across a diversified portfolio of clients and projects..
In assessing going concern, management has prepared detailed sensitised forecasts which consider different scenarios through to December 2025. These include the risk to current projects and expected future sales pipelines. The Directors have considered these forecasts, alongside the Group's strong balance sheet and cash balance as well as the ability for the Group to mitigate costs if necessary. After due consideration of these forecasts, the Directors concluded with confidence that the Group has adequate financial resources to continue in operation for the foreseeable future.
2. New and amended accounting standards and interpretations
a. Adoption of new accounting standards for the year ended 30 September 2024
The Group has adopted all new and amended accounting standards and interpretations issued by the International Accounting Standards Board ('IASB') that are mandatory for the current reporting period.
There was no impact on the Group's financial statements as a result of adopting these standards.
b. Accounting developments affecting financial statements in subsequent periods
At the date of authorisation of these financial statements, several new, but not yet effective, standards and amendments to existing standards and interpretations have been published by the IASB. The standards and amendments that are not yet effective and have not been adopted early by the Group include:
• Classification of liabilities as current or non-current (Amendments to IAS 1)
• Deferred Tax related to Assets and Liabilities arising from a Single Transaction
• Definition of Accounting Estimates
• Disclosure of Accounting Policies
The Directors anticipate, based on current business processes, that the introduction of the above standards and amendments will not have a material impact on the Group and Company financial statements and therefore the impact of these changes on the financial statements has not been assessed.
3. Prior period adjustment
The Company has reclassified Amounts due from subsidiary undertakings to non-current assets based on the likelihood of this being repaid in the following 12 months, this is in line with the assessment of the subsidiary undertaking. Following this assessment, the Company reassessed the classification of this in the previous financial year. The Company has determined the available information in the previous year would lead to this same conclusion and has so restated this comparative information in the current year.
The impact on the Company's Financial Statements is limited to the non-current and current asset lines with no effect on loss for the financial year or net assets, as restated in the Company balance sheet and note 17.
4. Material accounting policies
4.1 Revenue
Revenue is principally derived from service revenue. Revenue comprises the transaction price, being the amount of consideration the Group expects to be entitled to in exchange for transferring promised goods or services to a customer in the ordinary course of business net of value-added tax, returns, rebates and discounts and after eliminating sales within the Group.
In determining whether to recognise revenue, the Group follows a 5-step process:
1. Identifying the contract with a client;
2. Identifying the performance obligations;
3. Determining the transaction price;
4. Allocating the transaction price to the performance obligations; and
5. Recognising revenue when/as performance obligation(s) are satisfied.
All services provided to clients are agreed at the inception of a project through contracts, wherein the transaction price is determined and agreed for each performance obligation in the schedule of work. The transaction price agreed at the outset is not variable or subject to any refunds or warranties, and this is consistent across all revenue streams. A critical part of the contract is a detailed schedule of work that provides the list of services to be provided by the Group. Under the requirements of IFRS 15 - Revenue from Contracts with Customers, the Group is required to identify individual and distinct performance obligations within each contract. This represents a judgement, and the Group has considered whether each individual service provided meets these requirements in its own right and in the context of the contract, by assessing in particular the level of interrelationship between each type of service and the nature of the contract entered in to with clients.
The Group has identified performance obligations within each of the revenue streams as set out below. The transaction price associated to each performance obligation is allocated based on their relative stand-alone selling price. Revenue is recognised once the performance obligation is met for each distinct service. Deferred income and advanced payments are recognised where consideration is received before all performance considerations have been completed. They are then released in line with contractual terms which dictate which performance obligations they relate to. In some instances the Group invoices in advance of work being completed, a corresponding contract liability is therefore created to account for this. The Group also invoices on completion of contractual milestone. In these instances accrued income is recognised until the invoices are issued to reflect the Group's right to compensation for these completed but not invoiced performance obligations.
Revenue types
The Group's contracts comprise a variety of performance obligations. These obligations are all considered streams of a single revenue type, being service revenue. Most of the Group's revenue is recognised at a point in time; the Group recognises this revenue once control is passed to the client, or once the service has been delivered on behalf of the client.
The Group's most significant streams of service revenue are outlined below and have the respective recognition criteria:
|
Service type |
Performance obligations |
Revenue recognition policy |
|
Project & site set up Training materials and delivery Scientific reports |
This service type includes the initial project set up documentation, such as scientific protocols and operational guides, and close out activities such as scientific reports. Where a tangible product is created, the performance obligation is met once the item is transferred to the client. In respect of training, materials are prepared in advance and provided to clients as tools for site training. Site training is provided either through live online training or through a self-paced training module. The performance obligation is met once each individual site has completed the training. |
Revenue for this service is recognised at a point in time once the Group has delivered the relevant material on behalf of the client. For training materials and delivery, revenue is recognised at the point in time when a site has completed its training. |
|
Project management Site management |
Each contract requires various project management activities. These services are provided throughout the duration of a contract. Site management services are provided throughout the duration of a site being operational and would typically be shorter than the project management cycle. For both activities, the costs and time spent delivering these services are generally spread evenly over the project lifetime. As such the performance obligation is met when the specific service is provided each month. |
The services provided for project and site management represents a provision of ongoing services. As the fee is charged monthly to the client over the duration for which management services are provided, revenue for these items is recognised over a series of points in time across the contract. |
|
TrialTracker configuration and access |
The TrialTracker platform delivers a robust and comprehensive set of centralised imaging services designed to efficiently manage the complex imaging workflow, including image upload, quality control, reading and analysis. The platform also allows for reporting and data transfer. This involves the initial configuration and deployment of TrialTracker, and access granted to client trial sites for upload of clinical information. Due to the lack of interrelationship between the two distinct services provided, each are recognised independently. The performance obligations for each are: · The performance obligation for deployment is met over a period of time during the configuration and development of TrialTracker. · The performance obligation for ongoing access to TrialTracker for the upload of data by client trial sites is recognised over the duration of the project once TrialTracker is deployed. |
The deployment of TrialTracker is recognised over time as the platform is configured for the customer. This is because an asset is being created that has no alternative use for the Group and there is an enforceable entitlement to receive payment for the work completed to date. The ongoing access fee is charged monthly to the client and so revenue is recognised over a series of points in time across the contract. |
|
Data management and quality control |
Ensuring data are managed appropriately and that the data are of a high quality is critical in the delivery of the Group's service. The data management and imaging teams work in collaboration to ensure ongoing integrity of data. The data will go through a series of quality control reviews prior to being used in the Group's performance of reading and analysis. Therefore, the performance obligation is met once the data is quality checked. Data management is an ongoing service performed throughout the duration of a project whilst data is being received and managed on a project. The respective costs and time spent delivering this service is generally spread evenly over the duration in which data is being managed and as such the performance obligation is met when the specific service is provided each month. |
In respect of data quality control, revenue will be recognised at the point in time when data is quality checked. The services provided for data management represents a provision of ongoing services. As the fee is charged monthly to the client over the duration for which data management is required, revenue for these items is recognised over a series of points in time across the contract. |
|
Data reading and analysis |
The Group provides data analysis services across a range of biomarkers, providing high-quality, clinically meaningful data. The performance obligation for these services is met once the analysis is completed. |
Revenue from reading and analysis of clinical data is recognised at the point in time when the work is complete. |
|
Licence revenue |
Revenue relating to licencing is entirely attributable to TrialTracker. Each agreement will grant the user rights to access the software for their own use and receive associated technical support during the licence period. The granting of the licence and its associated support are distinct performance obligations and are met on a straight-line basis over the contract term. |
Revenue for both the licencing and support are recognised on a straight-line basis over the duration of the contract and is therefore recognised over time. Licence revenue in the current year is not material. |
Change orders
Throughout the duration of a contract, the client may request additional services or service changes to be made. For revenue recognition purposes, the Group treats a change order or contract modification to a client agreement as a separate contract, if both:
· the scope changes due to the addition, or reduction, of 'distinct' services; and
· the price change reflects the services stand-alone selling prices ('SSP') under the circumstances of the modified contract.
The revenue recognition for the change order is applied in the same way as the original contract, as detailed above, with the original client agreement remaining unchanged.
The Group has determined that it acted as an agent in no material contracts in the year. The Group charges a management fee and recognises this as revenue. This contract delivered £nil (2023: £13,000) of revenues in the year.
4.2 Other income
Government grants and assistance
A government grant is recognised only when there is reasonable assurance that the Group will comply with any conditions attached to the grant and the grant will be received. The grants are recognised as income over the period necessary to match them with the related costs, for which they are intended to compensate, on a systematic basis. The Group recognises grant income as an item of other income.
Research and Development Expenditure Credit ('RDEC')
The Group has elected to take advantage of the RDEC introduced in the Finance Act 2013. A company may surrender corporation tax losses on research and development expenditure incurred on or after 1 April 2013 for a corporation tax refund. Relief is given as a taxable credit on 13% of qualifying research and development expenditure, with the rate increasing to 20% for expenses incurred from 1 April 2024. The Group recognises research and development expenditure credit as an item of other income, taking advantage of the 'above the line' presentation, and is recognised in the year for which the research and development relates.
4.3 Research and development expenditure
In all instances across the Group, research expenditure is expensed through the income statement. For development expenditure, items will be expensed where the recognition criteria for internally generated intangible assets is not met.
The main criteria used to assess this, as required under IAS 38 - Intangible Assets, are:
- Demonstrating technical feasibility of completing the intangible asset;
- Intention to complete the asset;
- Ability to use or sell the asset in order to generate future economic benefit;
- Availability of adequate technical or other resources to complete development; and
- Ability to measure reliably the expenditure attributable to the asset.
It was determined that the Group continued to meet the above criteria in respect of specific developments to its TrialTracker platform and data analytics service offering. As a result, associated development costs are capitalised in the year and an intangible asset is recognised as set out in note 15.
4.4 Share-based payments
Equity-settled share-based payments are measured at the fair value of the equity instruments at the grant date. The fair value determined at the grant date of the equity-settled share-based payment is expensed on a straight-line basis over the performance period, based on the Group's estimate of equity instruments that will eventually vest. At each reporting date, the Group revises its estimate of the number of equity instruments expected to vest as a result of the effect of any non-market-based performance conditions.
Any changes that impact the original estimates, for example the effect of employees who have left the Group in the year and have forfeited their options, is recognised in the Consolidated Statement of Comprehensive Income such that the cumulative expense reflects the revised estimate, with a corresponding adjustment to equity reserves.
Details regarding the determination of the fair value of equity-settled share-based transactions are set out in note 22 of the consolidated financial statements.
4.5 Employee benefits
All employee benefit costs are recognised in the Consolidated Statement of Comprehensive Income as they are incurred. These principally relate to holiday pay and contributions to the Group defined contribution pension plan.
The assets of the Group pension scheme are held separately from those of the Group in independently administered pension funds. The Group does not offer any other post-retirement benefits.
4.6 Leased assets
A lease is defined as a contract that gives the Group the right to use an asset for a period of time in exchange for consideration. The Group identifies from the contract the total length and cost of the lease contract, and determines whether it meets the definition of a right-of-use asset. Recognition of a right-of-use asset is met if it is longer than 12 months and of a high value. For those leases that do not meet these criteria, the rental charge payable under these leases are charged to the Consolidated Statement of Comprehensive Income on a straight-line basis over the lease term.
The initial recognition and subsequent measurement of right-of-use asset leases are:
Initial recognition
At the commencement date, the Group measures the lease liability at the present value of future lease payments, discounted using the Group's incremental borrowing rate. The Group also recognises a right-of-use asset which is measured at cost, which is made up of the initial measurement of the lease liability, any initial direct costs and an estimate of any costs to reinstate the asset to its original condition.
Subsequent measurement
The lease liability is reduced for payments made and increased for interest accrued, and is remeasured for any modifications made to the lease. The right-of-use asset is depreciated on a straight-line basis over the expected lease term. The asset is also assessed for impairment when such indicators exist.
On the statement of financial position, right-of-use assets are included in property, plant and equipment and lease liabilities are shown separately. Please see note 19 for more information.
4.7 Property, plant and equipment
Property, plant and equipment is stated at cost less accumulated depreciation and, where appropriate, less provisions for impairment. The initial recognition and subsequent measurement of property, plant and equipment are:
Initial recognition
Property, plant and equipment is initially recognised at acquisition cost, including any costs directly attributable to bringing the assets to the location and condition necessary for them to be capable of operating. In most circumstances, the cost will be its purchase cost, together with the cost of delivery.
Subsequent measurement
An asset will only be depreciated once it is ready for use. Depreciation is charged so as to write off the cost of property, plant and equipment, less its estimated residual value, over the expected useful economic lives of the assets.
Depreciation is charged on a straight-line basis as follows:
|
- Office buildings |
over expected lease term |
|
- Leasehold improvements |
shorter of 5 years or the lease term |
|
- Fixtures and fittings |
3 years |
|
- Equipment |
3 years |
The disposal or retirement of an asset is determined by comparing the sales proceeds with the carrying amount. Any gains or losses are recognised within the Consolidated Statement of Comprehensive Income.
4.8 Intangible assets
Acquired intangibles
Intangible assets that are acquired through business combinations are recognised as intangible assets if they are separable from the acquired business or arise from contractual or legal rights. These assets will only be recognised if they are also expected to generate future economic benefits and their fair value can be reliably measured.
Initial recognition
Intangible assets acquired separately are measured on initial recognition at cost. The cost of intangible assets acquired in a business combination is their fair value at the date of acquisition.
Subsequent measurement
Following capitalisation, the intangible assets are carried at cost less any accumulated amortisation, and where appropriate, less provisions for impairment.
Intangible assets are amortised using the straight-line method over their estimated useful economic life as follows:
|
- Intangibles acquired through business combinations |
5 years |
|
- Computer software |
3 years |
|
- Data acquisition |
5 years |
Amortisation is charged to the Consolidated Statement of Comprehensive Income and is included within cost of sales for those items directly related to project activities, or otherwise within general and administrative expenses.
Internally generated intangible assets
Intangible assets that are capitalised internally are deemed to have met the recognition criteria set out in IAS 38. These items relate to research and development costs and are considered in note 4.3.
Initial recognition
Internally generated intangible assets are initially recognised at cost once the recognition criteria of IAS 38 are met.
Subsequent measurement
Any assets that are not yet ready for use will be capitalised as assets under construction and will not be amortised. Once the asset is ready for use, amortisation will begin. The amortisation rates adopted are based on the expected useful economic life of the projects to which they relate, with the charges recognised in accordance with how the Group receives the benefit from the technology. The assets useful economic life is as follows:
|
- Internally generated technology |
3 - 5 years |
|
- Proprietary clinical trial platform |
15 years based on revenue generated by the asset |
4.9 Impairment of non-current assets
Each category of non-current assets is reviewed for impairment annually when under construction or when there is an indication that an asset may be impaired, being when events or changes in circumstances indicate that the carrying value may not be recoverable. An impairment loss is recognised in the Consolidated Statement of Comprehensive Income for the amount by which the asset's carrying value exceeds its recoverable amount.
The recoverable amount is the higher of an asset's fair value less cost to sell and value in use. Non-financial assets, other than goodwill, which have suffered an impairment are reviewed for possible reversal of the impairment at each reporting date.
4.10 Investments in Group undertakings
Investments in Group undertakings are initially recognised at cost and subsequently measured at cost less any impairment provision. Investments are subject to an annual impairment review, with any impairment charge being recognised through the Consolidated Statement of Comprehensive Income. Additions to investments are amounts relating to share options for the services performed by employees of the subsidiaries of the Company and are classified as capital contributions within note 16.
4.11 Trade and other receivables
Trade and other receivables are initially recognised at fair value and subsequently stated at amortised cost using the effective interest method, less any expected credit losses. The Group makes use of a simplified approach in accounting for trade and other receivables as well as contract assets and records the loss allowance as lifetime expected credit losses. These are the expected shortfalls in contractual cash flows, considering the potential for default at any point during the life of the financial instrument. In calculating, the Group uses its historical experience, external indicators and forward-looking information to calculate the expected credit losses.
The Group assess impairment of trade receivables on an individual basis as they possess individual credit risk characteristics based on each client. Refer to note 17 for further information on aging of trade receivables and an analysis of any expected credit losses.
The Group recognises commission payments as incremental costs from obtaining a contract. Those that are paid immediately are capitalised under IFRS 15 and amortised over 3 years (2023: 3 years), being the average length of contracts entered into by the Group, as opposed to using a tailored time period for each project. Management reviews this assessment annually to determine that there are no material variances. Those not paid immediately are accrued over a period of time as this element of the commission payment requires the respective employee to remain in service for a specific period. Commission assets.
4.12 Taxation
Current tax
Current tax represents amounts recoverable within the United Kingdom and is provided at amounts expected to be recovered using the tax rates and laws that have been enacted at the Statement of Financial Position date.
Research and development credits
The benefit associated with UK-based research and development is recognised under the UK's Research and Development Expenditure Credit scheme. Details of the recognition are set out in note 4.2.
Deferred taxation
Deferred tax is provided in full, using the liability method, on temporary differences arising between the tax bases of assets and liabilities and their carrying amounts in the consolidated financial statements in accordance with IAS 12 - Income taxes. Deferred tax liabilities are recognised for all taxable temporary differences. A deferred tax asset is recognised only to the extent that it is probable that sufficient taxable profit will be available in future years to utilise the temporary difference. Deferred tax is not accounted for if it arises from initial recognition of an asset or liability in a transaction, other than a business combination, that at the time of the transaction affects neither the accounting, nor taxable profit or loss.
Deferred income tax is determined using tax rates (and laws) that have been enacted or substantively enacted by the Statement of Financial Position date and are expected to apply when the related deferred income tax asset is realised or the deferred income tax liability is settled.
Deferred tax assets and liabilities are offset only when there is a legally enforceable right to set off current tax assets against current tax liabilities, they relate to income taxes levied by the same taxation authority and the Group intends to settle these on a net basis.
Deferred tax assets are recognised to the extent it is probable that the underlying tax loss or deductible temporary difference will be utilised against future taxable income. This is assessed based on the Group's forecast of future operating results, adjusted for significant non-taxable income and expenses and specific limits on the use of any unused tax loss or credit. As such, the Group does not recognise any deferred tax assets, see note 20.
4.13 Cash and cash equivalents
Cash and cash equivalents comprise cash at bank and in hand with original maturities at inception of 3 months or less.
4.14 Foreign currency translation
Transactions denominated in foreign currencies are translated into Great British Pounds at actual rates of exchange prevailing at the date of transaction. Monetary assets and liabilities expressed in foreign currencies are translated into Great British Pounds at rates of exchange prevailing at the end of the financial year. All foreign currency exchange differences are taken to the Consolidated Statement of Comprehensive Income in the year in which they arise.
Non-monetary items are not retranslated at year end and are measured at historical cost (translated using the exchange rates at the transaction date), except for non-monetary items measured at fair value which are translated using the exchange rates at the date when fair value was determined.
4.15 Trade and other payables
Trade and other payables are non-interest-bearing, unless significantly overdue, and are initially recognised at fair value and subsequently stated at amortised cost.
4.16 Provisions, contingent assets and contingent liabilities
Provisions are recognised when the Group has a present legal or constructive obligation as a result of a past event, it is probable that an outflow of economic resources will be required from the Group and amounts can be estimated reliably. The timing of such outflows may still be uncertain. Such provisions are measured at the estimated expenditure required to settle the present obligation based on the most reliable estimate available at the reporting date, discounted to the present value where material.
Any reimbursement that the Group is virtually certain to collect from a third party in relation to the related provision will be recognised as a separate asset.
Liabilities are not recognised where the outflow of economic resources is not probable, but are instead disclosed as contingent liabilities.
4.17 Equity instruments
Equity instruments issued by the Group are recorded at the proceeds received, net of direct issue costs.
4.18 Financial instruments
Financial assets and financial liabilities are recognised on the Consolidated Statement of Financial Position when the Group or the Company becomes a party to the contractual provisions of the instrument. Debt and equity instruments are classified as either financial liabilities or as equity in accordance with the substance of the contractual arrangement.
The Group utilises one type of derivative financial instrument - forward contracts used for the purposes of hedging. These are designated as cash flow hedges and held at fair value with changes held in the cash flow hedge reserve. On crystallisation the gain or loss is recycled to revenue to reflect the risks being hedged. The ineffective portion of the hedging instrument is recognised in the profit or loss account immediately.
Further information relating to financial instruments and the policies adopted by the Group to manage risk is found in note 23.
5. Significant management judgement in applying accounting policies and estimation uncertainty
When preparing the consolidated financial statements, the Directors make a number of judgements, estimates and assumptions about the recognition and measurement of assets, liabilities, income and expenses.
Significant management judgements
The following are significant management judgements in applying the accounting policies of the Group that have the most significant effect on the consolidated financial statements.
Capitalisation of internally developed software
Distinguishing the research and development phases of a new software product and determining whether the requirements for the capitalisation of development costs are met requires judgement. Management will assess whether a project meets the recognition criteria as set out in IAS 38 based on an individual project basis. More detail is included in note 4.3 as to the specific considerations given to each project when determining whether to capitalise internally developed software. Where the criteria are not met, the research and development expenditure will be expensed in the Consolidated Statement of Comprehensive Income. Where the recognition criteria are met, the items will be capitalised as an intangible asset.
During the year ended 30 September 2024, research and development expenses totalled £1,659,000 (2023: £2,152,000). Of this amount, £322,000 (2023: £1,211,000) was capitalised as an intangible asset relating to employee costs. The balance of expenditure being £1,337,000 (2023: £925,000) is recognised in the Consolidated Statement of Comprehensive Income as an expense.
Recovery of deferred tax assets
Deferred tax assets have not been recognised for deductible temporary differences and tax losses. The Directors consider that there is not sufficient certainty that future taxable profits will be available to utilise those temporary differences and tax losses. Further information on the Group's deferred tax asset can be found in note 20 of the consolidated financial statements.
Estimation uncertainty
Information about estimates and assumptions that have the most significant effect on recognition and measurement of assets, liabilities, income and expenses is provided below. Changes to these estimations may result in substantially different results for the year.
Share-based payments
The Group measures the cost of equity-settled transactions with employees by reference to the fair value of the equity instruments at the date at which they are granted. The fair value of the options granted is measured using an option valuation model, taking into account the terms and conditions upon which the options were granted. Details of the estimations used in determining the fair value of the options in issue are detailed in note 22. In line with IAS 2, management assess whether non-market conditions will be achieved and adjusts appropriately.
Useful lives of depreciable assets
The useful lives of depreciable assets are determined by management at the date of purchase based on the expected useful lives of the assets. These are subsequently monitored and reviewed annually and where there is objective evidence of changes in the useful economic lives, these estimates are adjusted. Any changes to these estimates may result in significantly different results for the period.
The Group amortises its newly developed proprietary clinical trial platform (TTNx) in accordance with its anticipated usage pattern. The platform's useful life has been estimated at 15 years. Amortisation is applied on an escalating basis, aligned with the increasing utilisation of the platform as additional clinical trials are deployed on the platform. Once the platform reaches an equivalent operational capacity to the existing platform, defined as accommodating the number of trials supported by the previous platform, a straight-line amortisation method will be adopted for the remainder of its useful life.
6. Revenue
An analysis of the Group's revenue by type is as follows:
|
2024 |
2023 |
|||||
|
£000 |
£000 |
|||||
|
Service revenue |
5,766 |
6,665 |
All material revenue streams derived by the Group relate to the delivery of services in support of clinical trials. As such, all revenue is deemed to belong to one stream, being service revenue.
Revenue derived from services provided over time do not constitute a material portion of revenue and therefore disclosure distinguishing between revenue recognised at a point in time versus over time is not made.
For the year ended 30 September 2024, revenue includes £22,000 (2023: £214,000) held in contract liabilities within trade and other payables at the beginning of the period. This amount also includes performance obligations relating to advance payments that were not yet complete at the end of the prior year. Advance payments are charged to clients to de-risk start-up activities and are recognised at a point in time once an activities performance obligation is met. At 30 September 2024, £532,000 (2023: £343,000) of advanced payments were recognised on the balance sheet.
7. Segmental information
The Board considers there to be only one core operating segment for the Group's activities. This is based on the Group's development, commercial and operational delivery teams operating across the entirety of the Group, which is primarily based in the United Kingdom. The projects undertaken by the Group are managed by project managers, who receive inputs for each project from other team members. Performance information is reported as a single business unit to the management team.
The information gathered for each project is subsequently reported to the Group's Chief Executive Officer, who is considered to be the chief operating decision-maker. This information is used for resource allocation and assessment of performance. Therefore, the entirety of the Group's revenue and assets can be attributed wholly to this operating segment with reference to the Consolidated Statement of Comprehensive Income and Consolidated Statement of Financial Position.
During the year ended 30 September 2024, the Group had three clients (2023: five clients) that exceeded 10% of total revenue. In 2024, the individual percentage revenue associated with these clients was 13% (£771,000), 13% (£742,000) and 13% (£729,000). In 2023, the individual percentage revenue associated with the five largest clients 14% (£966,000), 14% (£949,000), 13% (£862,000), 12% (£792,000) and 10% (£699,000).
Geographical information
The Group's revenue can be categorised by country, based on the location of the contracting client. Sometimes clients of the Group, which include global biopharmaceutical companies with offices in multiple locations across the world, request the Group to contract directly with their regional offices in the United Kingdom or European locations. In such circumstances the associated revenues are reported as being based in the contracting location even though much of the operational execution of the contract will include entities or partners of the client based elsewhere in the world.
|
2024 |
2023 |
|||||
|
£000 |
£000 |
|||||
|
United States of America |
2,365 |
3,053 |
||||
|
United Kingdom |
1,330 |
952 |
||||
|
Netherlands |
742 |
862 |
||||
|
Ireland |
557 |
689 |
||||
|
Switzerland |
500 |
816 |
||||
|
Other - Europe |
272 |
293 |
||||
|
Revenue |
5,766 |
6,665 |
As the Group is domiciled in the United Kingdom, the entirety of the revenue originates from this location.
8. Other income
Items of other income principally relate to government grants received. Grants are recognised as income over the period required to match them with the related costs, for which they are intended to compensate, on a systematic basis.
The Group also recognises Research and Development Expenditure Credit ('RDEC') as other income.
|
2024 |
2023 |
|
|
£000 |
£000 |
|
|
Grant income |
376 |
38 |
|
RDEC |
405 |
355 |
|
Other income |
781 |
393 |
9. Auditor's remuneration
|
2024 |
2023 |
|||||
|
£000 |
£000 |
|||||
|
Audit services |
||||||
|
- Group and Parent Company |
51 |
56 |
||||
|
- subsidiary companies |
34 |
37 |
||||
|
Total audit fees |
85 |
93 |
||||
|
Audit-related assurance services |
8 |
8 |
||||
|
Total auditor's remuneration |
93 |
101 |
10. Employees and Directors
The average monthly number of persons (including Executive and Non-Executive Directors) employed by the Group was:
|
2024 |
2023 |
||||
|
Number |
Number |
||||
|
Administration |
15 |
14 |
|||
|
Operations, research and development |
66 |
75 |
|||
|
Average total persons employed |
81 |
89 |
The aggregate remuneration of employees in the Group was:
|
2024 |
2023 |
||||
|
£000 |
£000 |
||||
|
Wages and salaries |
5,474 |
5,944 |
|||
|
Social security costs |
671 |
702 |
|||
|
Other pension costs |
279 |
303 |
|||
|
Share-based payments charge |
8 |
52 |
|||
|
Total remuneration for employees |
6,432 |
7,001 |
|||
|
Employee costs capitalised |
(322) |
(1,211) |
|||
|
Net employee costs |
6,110 |
5,790 |
The Group operates a defined contribution pension scheme for employees. The assets of the scheme are held separately from those of the Group in independently administered funds. The amounts outstanding at 30 September 2024 in respect of pension costs were £40,000 (2023: £46,000).
The remuneration of the Group's Directors is set out in the Directors' Remuneration Report in the full annual report, as well as in note 24 under related party transactions.
The Company did not directly employ any staff and therefore there is no cost recognised in respect of staff costs.
11. Loss on ordinary activities before taxation
The Group's loss on ordinary activities before taxation has been achieved after charging:
|
2024 |
2023 |
|||
|
£000 |
£000 |
|||
|
Research and development expenses |
1,304 |
903 |
||
|
Research and development related impairment |
- |
14 |
||
|
Research and development related amortisation |
33 |
8 |
||
|
Sales and marketing expenses |
1,347 |
1,262 |
||
|
Amortisation of commission assets |
49 |
59 |
||
|
Expenses relating to lease of low-value assets |
1 |
1 |
||
|
Depreciation of tangible assets |
239 |
400 |
||
|
Amortisation of intangible assets |
15 |
24 |
||
|
Foreign exchange (gain) / loss |
52 |
85 |
||
|
Administrative expenses |
2,606 |
2,344 |
||
|
Total operating expenses |
5,646 |
5,100 |
||
|
Interest income from cash held at bank |
(85) |
(105) |
||
|
Interest incurred on finance leases |
22 |
29 |
||
|
Interest due on overdue taxation |
3 |
- |
||
|
5,586 |
5,024 |
There is a further amortisation charge of £188,000 (2023: £193,000) recognised in cost of sales for those items directly related to project activities. The total amortisation charge for the year is £236,000 (2023: £225,000).
12. Taxation
The tax charge for each period can be reconciled to the result per the Consolidated Statement of Comprehensive Income as follows:
|
2024 |
2023 |
|
|
£000 |
£000 |
|
|
Loss on ordinary activities before taxation |
(2,094) |
(1,361) |
|
Loss before tax at the effective rate of corporation tax |
||
|
in the United Kingdom of 25% (2023: 22%) |
(524) |
(299) |
|
Effects of: |
||
|
Expenses not deductible for tax purposes |
(13) |
(17) |
|
Origination and reversal of temporary differences |
(51) |
(291) |
|
Research and development uplifts net of losses surrendered for tax credits |
520 |
406 |
|
Overseas taxation |
1 |
16 |
|
Prior period adjustment |
(26) |
2 |
|
Tax credit for the period |
(93) |
(183) |
The tax credit for each period can be reconciled as follows:
|
2024 |
2023 |
|
|
£000 |
£000 |
|
|
Small or medium enterprise research and development credit |
(172) |
(276) |
|
Deduction for corporation tax on RDEC |
104 |
75 |
|
Overseas taxation |
1 |
16 |
|
Prior period adjustment |
(26) |
2 |
|
Tax credit for the period |
(93) |
(183) |
The Group has elected to take advantage of the RDEC, introduced in the Finance Act 2013 whereby a company may surrender corporation tax losses on research and development expenditure incurred on or after 1 April 2013 for a corporation tax refund.
The following is a reconciliation between the tax charge and the tax receivable within the Consolidated Statement of Financial Position:
|
2024 |
2023 |
|
|
£000 |
£000 |
|
|
Current tax receivable at start of period |
549 |
453 |
|
Current period credit |
497 |
552 |
|
Corporation tax repayment |
(554) |
(456) |
|
Current tax receivable at end of period |
492 |
549 |
The tax credit for each period can be reconciled to the current period credit recognised in tax receivable within the Consolidated Statement of Financial Position in each period as follows:
|
2024 |
2023 |
|
|
£000 |
£000 |
|
|
Tax credit for the year |
93 |
183 |
|
RDEC gross of corporation tax deduction |
405 |
355 |
|
Overseas taxation |
(1) |
15 |
|
Tax recoverable |
- |
(1) |
|
Current period credit |
497 |
552 |
13. Earnings per share
The calculation of basic and diluted earnings per share ('EPS') of the Group is based on the following data:
|
2024 |
2023 |
||
|
Earnings |
|||
|
Earnings for the purposes of basic and diluted EPS, being net profit attributable to the owners of the Company (£000) |
|||
|
(2,001) |
(1,178) |
||
|
Number of shares |
|||
|
Weighted average number of shares for the purposes of basic EPS |
48,309,181 |
48,309,181 |
|
|
Weighted average number of shares for the purposes of diluted EPS |
48,309,181 |
48,309,181 |
Basic earnings per share is calculated by dividing earnings attributable to the owners of the Company by the weighted average number of shares in issue during the year. The diluted EPS is calculated by dividing earnings attributable to the owners of the Company by the weighted average number of shares in issue taking into account the share options outstanding during the year. For the year ended to 30 September 2024, there was no dilutive effect as the share options in issue would have decreased the loss per share.
The basic and diluted earnings per share for the Group and Company is:
|
2024 |
2023 |
||
|
Basic earnings per share |
(4.14p) |
(2.44p) |
|
|
Diluted earnings per share |
(4.14p) |
(2.44p) |
14. Property, plant and equipment
Group
|
Office |
Leasehold |
Fixtures and |
|||
|
building |
improvement |
fittings |
Equipment |
Total |
|
|
Cost |
£000 |
£000 |
£000 |
£000 |
£000 |
|
At 1 October 2022 |
777 |
185 |
5 |
1,117 |
2,084 |
|
Additions |
- |
7 |
- |
94 |
101 |
|
Disposals |
- |
- |
- |
(20) |
(20) |
|
At 30 September 2023 |
777 |
192 |
5 |
1,191 |
2,165 |
|
Additions |
- |
3 |
1 |
30 |
34 |
|
Disposals |
- |
- |
- |
(10) |
(10) |
|
At 30 September 2024 |
777 |
195 |
6 |
1,211 |
2,189 |
|
Accumulated depreciation |
|||||
|
At 1 October 2022 |
379 |
157 |
5 |
726 |
1,267 |
|
Charge for the period |
102 |
19 |
- |
279 |
400 |
|
Disposals |
- |
- |
- |
(20) |
(20) |
|
At 30 September 2023 |
481 |
176 |
5 |
985 |
1,647 |
|
Charge for the period |
101 |
14 |
0 |
124 |
239 |
|
Disposals |
- |
- |
- |
(10) |
(10) |
|
At 30 September 2024 |
582 |
190 |
5 |
1,099 |
1,876 |
|
Net book value |
|||||
|
At 30 September 2023 |
296 |
16 |
- |
206 |
518 |
|
At 30 September 2024 |
195 |
5 |
1 |
112 |
313 |
The tangible right-of-use asset is held within the office building category. At 30 September 2024, the carrying amount of the right-of-use asset was £195,000 (2023: £296,000).
Company
At 30 September 2024 and 30 September 2023, the Company had no property, plant and equipment.
15. Intangible assets
Group
|
Right-of-use asset |
Other acquired intangibles |
Other Internally developed technology |
Next generation TrialTracker platform |
Total |
|
|
£000 |
£000 |
£000 |
£000 |
£000 |
|
|
Cost |
|||||
|
At 1 October 2022 |
- |
221 |
710 |
4,111 |
5,042 |
|
Additions |
- |
121 |
89 |
1,589 |
1,799 |
|
Impairment |
- |
- |
(14) |
- |
(14) |
|
At 30 September 2023 |
- |
342 |
785 |
5,700 |
6,827 |
|
Additions |
39 |
- |
20 |
404 |
463 |
|
Disposals |
- |
(32) |
(218) |
- |
(250) |
|
At 30 September 2024 |
39 |
310 |
587 |
6,104 |
7,040 |
|
Accumulated amortisation |
|||||
|
At 1 October 2022 |
- |
141 |
314 |
- |
455 |
|
Amortisation |
- |
47 |
178 |
- |
225 |
|
At 30 September 2023 |
- |
188 |
492 |
- |
680 |
|
Amortisation |
2 |
52 |
163 |
19 |
236 |
|
Disposals |
- |
(32) |
(218) |
- |
(250) |
|
At 30 September 2024 |
2 |
208 |
437 |
19 |
666 |
|
Net book value |
|||||
|
At 30 September 2023 |
- |
154 |
293 |
5,700 |
6,147 |
|
At 30 September 2024 |
37 |
102 |
150 |
6,085 |
6,374 |
Amortisation is charged to the Consolidated Statement of Comprehensive Income and is included within cost of sales for those items directly related to project activities, research and development for those items directly related to the research activities of the company or otherwise within general and administrative expenses.
Internally developed technology
The Group has capitalised research and development costs during the year in relation to the development of its proprietary TrialTracker software. Development includes TrialTracker platform upgrades as well as additional algorithm development. The costs capitalised include time and expenses in relation to staff costs. In recognising these assets, the Group has applied the recognition criteria of IAS 38 relating to internally generated intangible assets, where costs in relation to the development phase must be capitalised under certain circumstances. More information in relation to this is included in the accounting policies of the Group in notes 4 and 5.
Assets under construction
Assets that are still under construction undergo an annual impairment test which is carried out at the end of the reporting period. This impairment test considers the carrying amount of the asset and compares it with its recoverable amount, with an impairment being recognised if the recoverable amount is lower than the carrying amount. Management have determined the recoverable amount as being the value-in-use, which is calculated using management expectations of future revenues, discounted at an applicable rate. Whilst the asset remains under construction, amortisation is not charged.
Company
At 30 September 2024 and 30 September 2023, the Company had no intangible assets.
16. Investments
The consolidated financial statements of the Group as at 30 September 2024 and at 30 September 2023 include:
|
Name of subsidiary |
Class of share |
Country of incorporation |
Principal activities |
|
|
|||
|
IXICO Technologies Limited |
Ordinary |
United Kingdom |
Data collection and analysis of neurological diseases |
|
Indirectly held: |
|||
|
IXICO Technologies Inc. |
Ordinary |
United States |
Sales and marketing |
The Company and Group has no investments other than the holdings in the above subsidiaries that are all 100% owned. The carrying amounts of the investments in subsidiaries for the Company are:
|
2024 |
2023 |
||
|
£000 |
£000 |
||
|
Investments in subsidiary undertakings |
|||
|
At beginning of the period |
5,857 |
5,805 |
|
|
Capital contribution |
8 |
52 |
|
|
Total investments at end of the period |
5,865 |
5,857 |
The capital contribution represents the charge in the year for share-based awards issued by the Company to employees of IXICO Technologies Limited and IXICO Technologies Inc.
17. Trade and other receivables
|
Group |
Company |
|||
|
2024 |
2023 |
2024 |
2023 Restated |
|
|
Current receivables |
£000 |
£000 |
£000 |
£000 |
|
Trade receivables |
1,634 |
945 |
- |
- |
|
Less provision for bad and doubtful debts |
- |
- |
- |
- |
|
Net carrying amount of trade receivables |
1,634 |
945 |
- |
- |
|
Other taxation and social security |
- |
40 |
15 |
6 |
|
Prepayments and accrued income |
518 |
684 |
22 |
20 |
|
Commission assets |
24 |
27 |
- |
- |
|
Other receivables |
37 |
10 |
2 |
5 |
|
Current receivables |
2,213 |
1,706 |
39 |
31 |
|
Non-current receivables |
||||
|
Commission assets |
9 |
39 |
- |
- |
|
Amounts due from subsidiary undertakings |
- |
- |
2,224 |
2,450 |
|
Total trade and other receivables |
2,222 |
1,745 |
2,263 |
2,481 |
All amounts are classified as short-term and are expected to be received within one year. The average credit period granted to clients ranges from 30 to 90 days (2023: 30 to 90 days).
A provision for expected credit losses is made when there is uncertainty over the ability to collect the amounts outstanding from clients. This is determined based on specific circumstances relating to each individual client. The Directors consider that there are immaterial credit losses (2023: immaterial credit losses) due to the calibre of customers the Group has and so the carrying amount of trade and other receivables approximates their fair value.
Within the Company, there are expected to be immaterial credit losses (2023: immaterial credit losses) from subsidiary companies due to the level of cash available in the subsidiaries and expected future earnings. The amounts due from subsidiary undertakings was reclassified to a non-current
asset in the year as the Group does not expect to recover these balances within the next 12 months.
As at the year-end, the ageing of trade receivables which are past due but not impaired is as follows:
|
Group |
Company |
|||
|
2024 |
2023 |
2024 |
2023 |
|
|
£000 |
£000 |
£000 |
£000 |
|
|
Amounts not past due |
1,486 |
864 |
- |
- |
|
Past due: |
||||
|
Less than 30 days |
69 |
81 |
- |
- |
|
Between 31 - 60 days |
8 |
- |
- |
- |
|
Between 61 - 90 days |
18 |
- |
- |
- |
|
More than 90 days |
52 |
- |
- |
- |
|
Total trade receivables |
1,634 |
945 |
- |
- |
The maximum exposure to credit risk at the reporting date is the carrying value of each class of financial assets disclosed in note 23.
18. Trade and other payables
|
Group |
Company |
|||
|
2024 |
2023 |
2024 |
2023 |
|
|
£000 |
£000 |
£000 |
£000 |
|
|
Current liabilities |
||||
|
Trade payables |
83 |
86 |
2 |
- |
|
Other taxation and social security |
180 |
58 |
- |
- |
|
Contract liabilities |
591 |
529 |
- |
- |
|
Accrued expenses |
553 |
464 |
43 |
60 |
|
Other payables |
3 |
5 |
- |
- |
|
1,410 |
1,142 |
45 |
60 |
|
|
Non-current liabilities |
||||
|
Accrued expenses |
- |
2 |
- |
- |
|
Total trade and other payables |
1,410 |
1,144 |
45 |
60 |
Trade payables and accrued expenses principally comprise amounts outstanding for trade purchases and ongoing costs. No interest is charged on the trade payables. The Group's policy is to ensure that payables are paid within the pre-agreed credit terms and to avoid incurring penalties and/or interest on late payments.
The fair value of trade and other payables approximates their current book values.
Reconciliation of liabilities arising from financing activities
The only liabilities affecting financing activities arise solely from the recognition of the lease liability:
|
£000 |
|||
|
Lease liability as at 1 October 2022 |
516 |
||
|
Cash-flow: Repayment of lease |
(158) |
||
|
Non-cash: Interest charge |
29 |
||
|
Lease liability as at 30 September 2023 |
387 |
||
|
Leases acquired in the year |
39 |
||
|
Cash-flow: Repayment of lease |
(134) |
||
|
Non-cash: Interest charge |
22 |
||
|
Lease liability as at 30 September 2024 |
314 |
19. Leases
All lease liabilities are presented in the statement of financial position as follows:
|
2024 |
2023 |
|||
|
£000 |
£000 |
|||
|
Current |
164 |
112 |
||
|
Non-current |
150 |
275 |
||
|
314 |
387 |
The Group uses leases throughout the business for office space and IT equipment. With the exception of short-term leases and leases of low value, each lease is reflected on the balance sheet as a right-of-use asset in property, plant and equipment and a lease liability.
Each lease generally imposes a restriction that, unless there is a contractual right for the Group to sublet the asset to another party, the right-of-use asset can only be used by the Group. For leases over office buildings, the Group must keep those properties in a good state of repair.
The Group has identified one lease relating to the office building, and one lease relating to a software licence that meet the definition of a right-of-use asset. There is no option to purchase on either lease and payments are not linked to an index. The remaining lease terms range between 24 - 34 months (2023: 36 months). The office building lease has the ability to be extended at the end of this term.
The Group has elected to not recognise a lease liability for short-term leases, being 12 months or less, or for leases of low value. Payments for these are expensed on a straight-line basis.
Right-of-use asset and lease liability
|
Asset |
Depreciation |
Carrying amount |
||
|
2024 |
£000 |
£000 |
£000 |
|
|
Office building |
777 |
(582) |
195 |
|
|
Software licence |
39 |
(2) |
37 |
|
|
816 |
(584) |
232 |
||
|
Asset |
Depreciation |
Carrying amount |
||
|
2023 |
£000 |
£000 |
£000 |
|
|
Office building |
777 |
(481) |
296 |
Additional information on the right-of-use asset is as follows:
The various elements recognised in the financial statements are as follows:
|
2024 |
2023 |
|||
|
£000 |
£000 |
|||
|
Statement of Comprehensive Income |
||||
|
Depreciation charge in the year |
101 |
102 |
||
|
Amortisation charge in the year |
2 |
- |
||
|
Interest expense on lease liability |
22 |
29 |
||
|
Low value leases expensed in the year |
1 |
1 |
||
|
Statement of Cash Flows |
||||
|
Capital repayments on lease agreements |
134 |
158 |
The undiscounted maturity analysis of lease liabilities for the office building is as follows:
|
Within 1 year |
1 - 2 years |
2 - 3 years |
Total |
|||
|
30 September 2024 |
||||||
|
Lease payments |
181 |
144 |
12 |
337 |
||
|
Finance charges |
(17) |
(6) |
- |
(23) |
||
|
Net present values |
164 |
138 |
12 |
314 |
||
|
30 September 2023 |
||||||
|
Lease payments |
132 |
166 |
127 |
425 |
||
|
Finance charges |
(20) |
(14) |
(4) |
(38) |
||
|
Net present values |
112 |
152 |
123 |
387 |
At 30 September 2024, the Group's commitment to short-term and low-value leases was £nil (2023: £nil).
20. Deferred tax
Deferred tax asset (unrecognised)
|
Group |
Company |
||||
|
2024 |
2023 |
2024 |
2023 |
||
|
£000 |
£000 |
£000 |
£000 |
||
|
Tax effect of temporary differences: |
|||||
|
Tax allowances in excess of depreciation |
1,615 |
1,581 |
(1) |
(1) |
|
|
Accumulated losses |
(17,963) |
(17,618) |
(3,579) |
(3,331) |
|
|
Losses on financial instruments debited to equity |
1 |
5 |
- |
- |
|
|
Accelerated commission charge |
1 |
14 |
- |
- |
|
|
Deductible temporary differences |
(2) |
(13) |
- |
- |
|
|
Deferred tax asset (unrecognised) |
(16,348) |
(16,031) |
(3,580) |
(3,332) |
|
The unrecognised deferred tax asset predominantly arises due to unused tax losses carried forward that have originated but not reversed at the Consolidated Statement of Financial Position date and from transactions or events that result in an obligation to pay more tax in the future or a right to pay less tax in the future.
The unrecognised deferred tax asset is measured on an undiscounted basis at the tax rates that are expected to apply in the periods in which temporary differences will reverse. Based on tax rates and laws enacted or substantively enacted at the latest balance sheet date, the rate when the above temporary differences are expected to reverse is currently 25% (2023: 25%).
21. Issued capital and reserves
Ordinary shares and share premium
The Company has one class of ordinary shares. The share capital issued has a nominal value of £0.01 and each share carries the right to one vote at shareholders' meetings and all shares are eligible to receive dividends. Share premium is recognised when the amount paid for a share is in excess of the nominal value.
The Group and Company's opening and closing share capital and share premium reserves are:
|
Group and Company |
|||
|
Ordinary |
Share |
Share |
|
|
shares |
capital |
premium |
|
|
Number |
£000 |
£000 |
|
|
Authorised, issued and fully paid |
|||
|
At 30 September 2023 and at 30 September 2024 |
48,351,373 |
484 |
84,802 |
Exercise of share options
During the year, no share options were exercised.
Other reserves
Accumulated losses
This reserve relates to the cumulative results made by the Group and Company in the current and prior periods.
Merger relief reserve
In accordance with Section 612 'Merger Relief' of the Companies Act 2006, the Company issuing shares as consideration for a business combination, accounted at fair value, is obliged, once the necessary conditions are satisfied, to record the share premium to the merger relief reserve.
Reverse acquisition reserve
Reverse accounting under IFRS 3 'Business Combinations' requires that the difference between the equity of the legal parent and the issued equity instruments of the legal subsidiary, pre-combination, is recognised as a separate component of equity.
Capital redemption reserve
This reserve holds shares that were repurchased and cancelled by the Company.
Foreign exchange translation reserve
This reserve represents the impact of retranslation of overseas subsidiaries on consolidation.
Cash flow hedge reserve
This reserve represents the movement in designated hedging instruments in the year that have not yet crystallised.
22. Share-based payments
Certain Directors and employees of the Group hold options to subscribe for shares in the Company under share option schemes. All share options relate to a single scheme outlined in the EMI Share Option Plan 2014.
The scheme is open, by invitation, to both Executive Directors and employees. Participants are granted share options in the Company which contain vesting conditions. These are subject to the achievement of individual employee and Group performance criteria as determined by the Board. The vesting period varies by award and the conditions approved by the Board. Options are usually forfeited if the employee leaves the Group before the options vest.
Total share options outstanding have a range of exercise prices from £0.01 to £0.70 per option and the weighted average contractual life is 5.5 years (2023: 6.7 years). The total charge for each period relating to employee share-based payment plans for continuing operations is disclosed in note 10 of the consolidated financial statements.
Details of the share options under the scheme outstanding during the period are as follows:
|
2024 |
2023 |
|||
|
Number |
Weighted average exercise price |
Number |
Weighted average exercise price |
|
|
Outstanding at start of the period |
3,529,681 |
£0.15 |
4,490,931 |
£0.18 |
|
Exercised |
- |
- |
(200,000) |
£0.01 |
|
Lapsed |
(495,176) |
£0.34 |
(761,250) |
£0.29 |
|
Outstanding at end of the period |
3,034,505 |
£0.12 |
3,529,681 |
£0.15 |
|
Exercisable at end of the period |
2,459,504 |
£0.10 |
1,949,680 |
£0.08 |
23. Financial risk management
In common with all other areas of the business, the Group is exposed to risks that arise from the use of financial instruments. This note describes the Group's objectives, policies and processes for managing those risks and the methods used to measure them.
The main risks arising from the Group's financial instruments are liquidity, interest rate, foreign currency and credit risk. The Group's financial instruments comprise cash and various items such as trade receivables and trade payables, which arise directly from its operations.
Categories of financial instruments
|
2024 |
2023 |
|
|
£000 |
£000 |
|
|
Financial assets held at amortised cost |
||
|
Trade and other receivables excluding prepayments |
1,845 |
1,795 |
|
Cash and cash equivalents |
1,787 |
4,031 |
|
3,632 |
5,826 |
|
Financial liabilities held at amortised cost |
||
|
Trade and other payables excluding statutory liabilities |
745 |
1,144 |
|
Lease liabilities |
314 |
387 |
|
1,059 |
1,531 |
|
Financial liabilities held at fair value |
||
|
Forward contracts held at fair value (Level 2) |
- |
27 |
|
- |
27 |
Fair value of financial assets and liabilities
There is no material difference between the fair values and the carrying values of the financial instruments held at amortised cost because of the short maturity period of these financial instruments or their intrinsic size and risk.
Liquidity risk management
Liquidity risk is the risk that the Group will not be able to meet its obligations as they fall due through having insufficient resources. The Group monitors its levels of working capital to ensure that it can meet its liabilities as they fall due. Ultimate responsibility for liquidity risk management rests with the Board, which has built an appropriate framework for the management of the Group's short-, medium- and long-term funding and liquidity requirements.
The principal current asset of the business is cash and cash equivalents and is therefore the principal financial instrument employed by the Group to meet its liquidity requirements. The Board ensures that the business maintains surplus cash reserves to minimise any liquidity risk.
The financial liabilities of the Group and Company are due within 3 months (2023: 3 months) of the Consolidated Statement of Financial Position date, with the exception of the lease liability. Further analysis of the lease liability is provided in note 19. All other non-current liabilities are due between 1 to 3 years after the period end. The Group does not have any borrowings or payables on demand which would increase the risk of the Group not holding sufficient reserves for repayment.
Market risk
Interest rate risk management
Interest rate risk is the risk that the fair value or future cash flows of a financial instrument will fluctuate because of changes in market interest rate. The Group operates an interest rate policy designed to minimise interest costs and reduce volatility in reported earnings.
The Group holds all cash and cash equivalents with institutions with a recognised high credit rating. Interest rates on current accounts are floating. Changes in interest rates may increase or decrease the Group's finance income.
The Group does not have any committed interest-bearing borrowing facilities and consequently there is no material exposure to interest rate risk in respect of financial liabilities.
Foreign currency risk management
Foreign currency risk is the risk that the fair value of future cash flows of a foreign currency exposure will fluctuate because of changes in foreign exchange rates.
The Group's exposure to the risk of changes in foreign exchange rates relates to the Group's overseas operating activities, primarily denominated in US Dollars, Euros and Swiss Francs. There is also an investment by the Company in a foreign subsidiary. The Group's exposure to foreign currency changes for all other currencies is not material. The Group seeks to minimise the exposure to foreign currency risk by matching local currency income with local currency costs where possible. The Group utilises US Dollar forward contracts to mitigate the risk of US Dollar fluctuations on client contracts. It agrees forward contracts based on forecasts of its US Dollar inflows and applies hedge accounting to minimise currency risk.
The Group enters into forward contracts to sell US Dollars at regular intervals and applies hedge accounting to these contracts. Under hedge accounting, unrealised gains or losses are recognised in other comprehensive income and the cash flow hedge reserve, with the ineffective portion being recognised in the profit and loss as soon as they occur. The gains or losses arising on these are allocated to revenue on settlement. The item hedged was a portion of highly probable forecast US Dollar inflows. The hedged item is the receipt of US Dollars, and the hedging instrument is the sale of a portion of these. The Group has determined that a 1:1 ratio exists between the instrument and items as the underlying risks of both are the same - the exchange rate of USD:GBP. The Group uses the dollar offset method to monitor effectiveness, which compares the change in fair value of the underlying derivative and the change in fair value of future cash flows. Ineffectiveness can arise due to the counterparties credit risk and inaccurate forecasting, which could leave the Group over hedged. In the year some ineffectiveness arose where the Group's actual inflows were below that of the hedging instrument. This ineffective portion was recognised in general and administrative expenses.
At year end the Group had no contracts to sell (2023: $750,000), these hedges are designated as effective under IFRS 9 and hence the fair value of these is recognised in other comprehensive income. These balances are removed from the Group's US Dollar exposure as there is deemed to be no foreign exchange exposure. At 30 September 2024 there were no hedges (2023: $750,000 hedged to period of March 2024, at an average rate of 1.2785). The contracts are valued based on observable market exchange rates.
The hedging transactions in the year had the following effect on the Group's results:
|
Without hedge accounting |
Hedging movements |
2024 |
|
|
£000 |
£000 |
£000 |
|
|
Statement of Comprehensive Income |
|||
|
Revenue |
5,761 |
5 |
5,766 |
|
Gross profit |
2,706 |
5 |
2,711 |
|
General and administrative expenses |
(2,881) |
(32) |
(2,913) |
|
Profit for the year |
(1,974) |
(27) |
(2,001) |
|
Total other comprehensive expense |
(2) |
27 |
25 |
|
Total comprehensive income attributable to equity holders for the period |
(1,976) |
- |
(1,976) |
|
Statement of financial position |
|||
|
Accumulated losses |
(9,353) |
- |
(9,353) |
|
Without hedge accounting |
Hedging movements |
2023 |
|
|
£000 |
£000 |
£000 |
|
|
Statement of Comprehensive Income |
|||
|
Revenue |
6,638 |
27 |
6,665 |
|
Gross profit |
3,243 |
27 |
3,270 |
|
General and administrative expenses |
(2,743) |
(111) |
(2,854) |
|
Profit for the year |
(1,094) |
(84) |
(1,178) |
|
Total other comprehensive expense |
(21) |
84 |
63 |
|
Total comprehensive income attributable to equity holders for the period |
(1,115) |
- |
(1,115) |
|
Statement of financial position |
|||
|
Derivative financial liabilities |
27 |
- |
27 |
|
Cash flow hedge reserve |
- |
(27) |
(27) |
|
Accumulated losses |
(7,387) |
27 |
(7,360) |
The carrying amounts of the Group's foreign currency denominated monetary assets and monetary liabilities as at 30 September are as follows:
|
2024 |
2023 |
||
|
US Dollar exposure |
USD'000 |
USD'000 |
|
|
Balance at end of period |
|||
|
Monetary assets |
587 |
14 |
|
|
Monetary liabilities |
(16) |
(27) |
|
|
Total exposure |
571 |
(13) |
|
|
2024 |
2023 |
||
|
Euro exposure |
EUR'000 |
EUR'000 |
|
|
Balance at end of period |
|||
|
Monetary assets |
37 |
156 |
|
|
Monetary liabilities |
(73) |
(13) |
|
|
Total exposure |
(37) |
143 |
|
|
2024 |
2023 |
||
|
Swiss Franc exposure |
CHF'000 |
CHF'000 |
|
|
Balance at end of period |
|||
|
Monetary assets |
58 |
33 |
|
|
Monetary liabilities |
(22) |
- |
|
|
Total exposure |
35 |
33 |
|
The Company had no foreign currency exposure at the year end (2023: nil).
Foreign currency sensitivity analysis
As at 30 September 2024, the sensitivity analysis assumes a +/-10% change of the USD/GBP, EUR/GBP and CHF/GBP exchange rates, which represents management's assessment of a reasonably possible change in foreign exchange rates (2023: 10%). The sensitivity analysis was applied on the fair value of financial assets and liabilities.
|
2024 |
2023 |
|||
|
10% weaker¹ |
10% stronger |
10% weaker |
10% stronger |
|
|
£000 |
£000 |
£000 |
£000 |
|
|
US Dollar |
(43) |
43 |
1 |
(1) |
|
Euro |
3 |
(3) |
(12) |
12 |
|
Swiss Franc |
(3) |
3 |
(3) |
3 |
|
(43) |
43 |
(14) |
14 |
|
1 10% weaker relates to the Great British Pound strengthening against the currency and therefore the Group would be in a weaker monetary position.
Credit risk management
Credit risk refers to the risk that a counterparty will default on its contractual obligations resulting in financial loss to the Group. The Group's financial assets are cash and cash equivalents and trade and other receivables. The carrying value of these assets represents the Group's maximum exposure to credit risk in relation to financial assets.
The Group's credit risk is primarily attributable to its trade receivables. The amounts presented in the Consolidated Statement of Financial Position are net of allowances for any expected credit losses, estimated by the Group's management based on prior experience and their assessment of the current economic environment, and any specific criteria identified in respect of individual trade receivables. An allowance for expected credit losses is made where there is an identified loss event, which, based on previous experience, is evidence of a reduction in the recoverability of future cash flows. There are no outstanding expected credit losses identified at 30 September 2024 (2023: nil).
Prior to entering into an agreement to provide services, the Group makes appropriate enquiries of the counterparty and independent third parties to determine creditworthiness. The Group has not identified any significant credit risk exposure to any single counterparty or Group of counterparties as at the period end.
The Group and Company continually reviews client credit limits based on market conditions and historical experience. Any provision for impairment, as well as the ageing analysis of overdue trade receivables, is set out in note 17.
The Group and Company's policy is to minimise the risks associated with cash and cash equivalents by placing these deposits with institutions with a recognised high credit rating.
Capital risk management
The Group considers capital to be shareholders' equity as shown in the Consolidated Statement of Financial Position, as the Group is primarily funded by equity finance and is not yet in a position to pay a dividend. The Group had no borrowings at 30 September 2024 (2023: £nil).
The objectives when managing capital are to safeguard the Group's ability to continue as a going concern in order to provide returns for shareholders and for other stakeholders. In order to maintain or adjust the capital structure the Group may return capital to shareholders or issue new shares.
24. Related party transactions
Transactions between the Company and its subsidiaries, which are related parties, have been eliminated on consolidation and are not disclosed in this note.
Remuneration and transactions of Directors and key management personnel
Key management remuneration:
|
2024 |
2023 |
|||||
|
£000 |
£000 |
|||||
|
Short-term employee benefits |
1,147 |
1,113 |
||||
|
Post-employment benefits |
28 |
29 |
||||
|
Other long-term benefits |
(24) |
(44) |
||||
|
Share-based payments |
(7) |
19 |
||||
|
Total remuneration |
1,144 |
1,117 |
Key management includes Executive Directors, Non-Executive Directors and senior management who have the responsibility for managing, directly or indirectly, the activities of the Group.
The aggregate Directors' remuneration, including employers' National Insurance and share-based payments' expense, was £875,000 (2023: £687,000) and aggregate pension of £21,000 (2023: £16,000). Further detail of Directors' remuneration is disclosed in the Directors' Remuneration Report in the full annual report.
Transactions with group companies
The Company is responsible for financing and setting Group strategy. The Company's subsidiaries carry out the Group's research and development strategy, employ all employees, including the Executive Directors, and manage the Group's intellectual property. As a result, a management charge is made between the subsidiaries and the Company for the services provided by the subsidiaries on behalf of the Company. Similarly, as share options are issued in the Company for employees of the subsidiaries, a charge is made between the Company and its subsidiaries.
Intercompany balances are unsecured and are interest bearing at 6%, with no fixed date of repayment but are repayable on demand. The intercompany balance also includes specific funding provided by the Company, which attracts a 0% interest rate.
Outstanding balances related to subsidiary undertakings are disclosed in note 18. During the year, the following transactions occurred with related parties:
|
2024 |
2023 |
|
|
£000 |
£000 |
|
|
Charges from subsidiaries: |
||
|
Management recharge from subsidiaries |
625 |
530 |
|
Net interest charged |
(125) |
(100) |
|
Charges to subsidiaries: |
||
|
Share option charge |
8 |
52 |
25. Post balance sheet events
In October 2024, the Company completed a share capital raise. The company issued 42,621,508 new Ordinary shares for a total contribution of £4,050,000. Included in this, certain Directors of the Company have subscribed for an aggregate of 789,472 Ordinary shares for a total contribution of £75,000.