

10 June 2025
B.P. Marsh & Partners Plc
("B.P. Marsh", "the Company" or "the Group")
Final Results for the Year to 31 January 2025
B.P. Marsh & Partners Plc (AIM: BPM), the specialist private equity investor in early-stage financial services businesses, announces its audited Group Final Results for the year ended 31 January 2025.
Highlights:
· Consolidated profit before tax of £104.7m (31 January 2024: £43.6m)
· Total Shareholder return of £101.2m (44.2%) for the year, comprising growth in Net Asset Value and the £4.0m dividends paid in aggregate in March 2024, May 2024 and July 2024
· Net Asset Value has increased by £97.2m to £326.4m (31 January 2024: £229.2m), a 42.4% increase
· Net Asset Value per share has increased by 261.0p to 890.0p* (31 January 2024: 629.0p)
· Disposal of Lilley Plummer Risks Limited ("LPR") and receipt of £21.7m
· Disposal of Paladin Holdings Limited ("Paladin")/ CBC UK Limited ("CBC") and receipt of £44.0m consideration
· Four new equity investments were made during the year
· Two new equity investments were made post year end
· Equity portfolio valuation increase of 83.5% (2024: 35.9%)
· £4.0m in dividends paid in aggregate in the year (10.72p per share) (31 January 2024: £2.0m, 5.56p per share)
· Since year end, further dividends totalling £8.0m (21.64p per share) paid or proposed
*The fully diluted Net Asset Value per share is 847.3p and includes the remaining 761,499 shares held within the Employee Benefit Trust, but also includes £2.0m of loan repayable if the remaining shares, including 236,259 currently unallocated, are sold. The diluted NAV per share also includes the 1,682,500 options over ordinary shares granted to certain Directors and employees of the Group in November 2023 as the performance criteria for NAV growth had been met as at 31 July 2024 (31 January 2024: 626.9p).
Commenting on the results, Brian Marsh OBE, Chairman, said:
"I am pleased to report a year of exceptional performance, realisations, new investments, and cash returns to shareholders. B.P. Marsh creates real value, and, with a robust and diversified portfolio, we will continue to identify opportunities, support entrepreneurial teams and exit only when it is appropriate.
"While the geopolitical picture continues to produce tension and uncertainty, we have more than succeeded in achieving our objectives. This resilience, reflected in our 42.4% NAV growth, the successful exits from Paladin and Lilley Plummer Risks, and the strategic addition of iO Partners stems from the dedication of our team, the foresight of our investors, and the innovation of our portfolio partners.
"My gratitude extends to every stakeholder who contributed: investors who share our long-term vision, management teams who trust our partnership, and colleagues who exemplify integrity in action. As we look ahead, I am proud to say that one of B.P. Marsh's greatest strengths lies not in its capital alone, but in the people who steward it."
Analyst and investor briefings:
There will be an analyst call today at 08:45am BST. Any analysts wishing to join the call should register to receive an invitation by emailing bpmarsh@tavistock.co.uk if they have not already done so.
The Company will also provide a live presentation for all existing and potential shareholders via the Investor Meet Company platform on 10 June 2025 at 10:30am BST.
Questions can be submitted pre-event via your Investor Meet Company dashboard up until 09:00am BST the day of the meeting or at any time during the live presentation. Investors can sign up to Investor Meet Company for free and add to meet B.P. Marsh via:
https://www.investormeetcompany.com/bp-marsh-partners-plc/register-investor.
Investors who already follow B.P. Marsh on the Investor Meet Company platform will automatically be invited.
Note
This announcement contains inside information for the purposes of Article 7 of Regulation (EU) No 596/2014.
|
For further information, please visit www.bpmarsh.co.uk or contact: |
|
|
B.P. Marsh & Partners Plc Brian Marsh OBE / Alice Foulk |
+44 (0)20 7233 3112 |
|
Nominated Adviser & Joint Corporate Broker: Panmure Liberum Limited Atholl Tweedie / Amrit Mahbubani / Ailsa MacMaster |
+44 (0)20 7886 2500 |
|
Joint Corporate Broker: Singer Capital Markets Advisory LLP Charles Leigh Pemberton / James Moat / Asha Chotai |
+44 (0)20 7496 3000 |
|
Financial PR & Investor Relations: Tavistock Simon Hudson / Katie Hopkins / Kuba Stawiski |
+44 (0)20 7920 3150 |
Statement by the Chairman
Results
The Group delivered another year of robust growth, with Net Asset Value ("NAV") (net of dividends), rising to £326.4m (2024: £229.2m). This reflected a 42.4% increase over the year. The value of the equity portfolio increased by 83.5%, after adjusting for additions and disposals, to £224.1m (2024: £165.4m).
Undiluted NAV per share grew by 41.5% to 890.0p (2024: 629.0p). On a fully diluted basis, taking into account vesting of shares in the Group's Joint Share Ownership Plan, and performance conditions being met in respect of share options issued to certain directors and employees of the Group, NAV per share was 847.3p (2024: 626.9p).
These results benefited from two significant disposals during the year: the sale of our interests in LPR and Paladin. These disposals together realised £65.7m, resulting in a much increased cash and treasury balance as at 31 January 2025 of £74.1m (2024: £40.5m).
Dividend
The Group seeks to deliver value to its shareholders through the performance of our carefully selected portfolio of investments which we believe will continue to generate growth in NAV and the payment of dividends, subject to the cash needs of the business. We also use share buy-backs as a mechanism to return capital to shareholders and manage the discount at which our share price stands to NAV. In the year under review, we progressed both of these aims.
In mid-2023, we stated our intention to pay £2.0m in dividends in respect of each of the years ending 31 January 2024, 2025, and 2026. In March 2024, we committed to increased dividend payments of £4.0m per annum for the financial years ending 31 January 2025, 2026, and 2027, making a total of £12.0m.
Following the disposal of our shareholding in LPR in October 2024, the Board further increased its dividend payment intentions to £5.0m per annum for the years ending 31 January 2026 and 2027 and resolved to extend this £5.0m dividend policy to 31 January 2028. Post year end, the Board paid a Special Dividend of £3.0m, following the receipt of deferred consideration from the 2024 disposal of Paladin.
This means that shareholders can expect to receive a minimum of £8.0m (21.64p per share) for the financial year ending 31 January 2026, and £5.0m (13.56p per share) in each of the financial years ending 31 January 2027 and 2028.
We believe these dividend allocations and the updated share buy-back policy are consistent with the Group's long-term capital management strategy, which allows the Company to maintain its existing investment strategy whilst also rewarding shareholders.
Share buy-back policy
We began the year under review with a policy to buy back up to £0.5m worth of shares at a discount of at least 20.0% to the most recently announced NAV per share. In June 2024, following the strong share price performance, the Group agreed to amend its share buy-back policy to reduce the discount to NAV threshold from 20.0% to 15.0% and allocated up to £1.0m in aggregate for this purpose. Post year end, in April 2025, the Company announced a new £2.0m share buy-back policy. At a General Meeting held on 2 June 2025, shareholders approved the renewal of the Company's general authority to purchase a maximum of 10.0% of the Company's issued ordinary share capital. Shareholders also authorised the Company to make such purchases without triggering a mandatory offer obligation on the Brian Marsh Concert Party, provided that the resultant shareholding of the Brian Marsh Concert Party does not exceed 42.5%. of the ordinary shares in issue (excluding any held in treasury).
Secondary Placing
Significant institutional demand for shares in B.P. Marsh was demonstrated through a two-stage secondary share acquisition, as existing investors increased their holdings and new investors became shareholders via transactions facilitated by the sale of shares by PSC UK Pty Limited ("PSC"), a subsidiary of The Ardonagh Group Limited. On 9 May 2025, 1,936,881 ordinary shares, representing approximately 5.2% of B.P. Marsh's issued share capital, were successfully placed with institutional investors at a price of 630p per share, totalling approximately £12.2m. Following strong residual demand, a further 1,822,183 shares (approximately 4.9% of issued capital) were sold to a single institutional investor, Wellington Management Group LLP. B.P. Marsh did not receive any of the c.£23.7m gross proceeds from the transactions.
At the date of this announcement, PSC has a 9.8% shareholding which is subject to lock-up provisions. As a result of the secondary placing, B.P. Marsh's institutional investor base has been diversified with the addition of new, high quality institutional investors, highlighting the market's continued confidence in the Company's long-term growth strategy and investment approach.
Disposals
The Group completed two major disposals during the year.
In March 2024, the sale of the Group's stake in Paladin completed, generating upfront proceeds of £42.1m, followed by a £1.9m working capital adjustment received in September 2024. A further £9.2m in deferred consideration was received post year end.
In October 2024, the Group agreed to sell its shareholding in LPR for total consideration of £21.7m.
Further information on these disposals is included in the Chief Investment Officer's Statement.
Portfolio
New Investments
During the year, the Group announced it had made four new investments.
In March 2024, the Group acquired a 30.0% Cumulative Preferred Ordinary shareholding in Devonshire UW Topco Limited ("Devonshire"), a London-based Underwriting Agency.
In September 2024, the Group acquired a 44.0% shareholding in CEE Specialty s.r.o. ("CEE"), a Czech Republic-based Underwriting Agency.
In October 2024, the Group subscribed for a 25.5% Cumulative Preferred Ordinary shareholding in Volt UW Holdco Limited ("Volt"), a London-based start-up Underwriting Agency.
Finally, in October 2024, the Group acquired a 30.0% Cumulative Preferred Ordinary shareholding in SRT & Partners Limited ("SRT"), a start-up UK Retail and London Market broker.
Follow-On Investments
During the year, the Group provided XPT Group LLC ("XPT") with a further US$13.6m (£10.8m), structured via a purchase of equity and an additional loan facility.
In May 2024, the Group acquired 7.0% of Pantheon Specialty Group Limited ("Pantheon") for £7.3m from members of Pantheon's management team. Following this, the Group acquired a further 5.0% shareholding in Pantheon, also from members of Pantheon's management team, for cash consideration of £12.5m. These acquisitions raised the Group's total shareholding in Pantheon to 37.0%.
Post Year End activity
Since 31 January 2025, the Group has maintained its momentum in new investments and other portfolio activity.
In April 2025, the Group announced it had subscribed for an 8.0% shareholding, via a mixture of Preferred and Ordinary shares, in iO Finance Partners Topco Limited ("iO Partners"), for £10.0m.
In June 2025, the Group also announced it had subscribed for a 49.0% shareholding in Amiga Specialty Holdings Limited ("Amiga"). B.P. Marsh is providing funding of up to £10.0m via a mix of equity and a loan facility, of which £0.5m was drawn down on completion.
In June 2025, the Group completed the disposal of its investment in Sterling Insurance Pty Limited ("Sterling"), an Australian Underwriting Agency specialising in construction sector liability cover. Sterling was acquired by ATC Insurance Solutions Pty Limited ("ATC"), in which the Group is also a shareholder. B.P. Marsh's share of the consideration will amount to approximately AU$ 6.5m (£3.1m) which will be received in shares in the enlarged ATC Group. Post-transaction, B.P. Marsh's shareholding in the ATC Group increased to 27.0% .
Outlook
We continue to demonstrate our ability to create long-term value and deliver strong returns. Deal origination remains active, particularly in the underwriting and broking sectors, and the new investments made during the year reflect the Company's proven capability in identifying well-positioned and compelling opportunities.
The Group remains committed to supporting its portfolio companies, not only with follow-on capital where appropriate, but also through strategic input aimed at unlocking further growth. With a robust pipeline of prospective investments in both the UK and international markets, supported by a strong cash position, the Group is well placed to act decisively where it sees exceptional potential.
Whilst we continue to prioritise deploying capital into high-conviction opportunities, we are also focused on returning surplus liquidity to shareholders through dividends and share buy-backs when market conditions permit. This dual approach ensures we capture value creation while rewarding the trust placed upon us by our long-term investors.
We extend our gratitude to our existing shareholders and welcome our new shareholders. We would also like to thank our colleagues and portfolio partners for their steadfast support. Our philosophy of patient capital and partnership-driven growth remains unchanged, positioning B.P. Marsh for long-term, sustainable success.
Brian Marsh, OBE
Chairman
10 June 2025
Chief Investment Officer Statement
Portfolio Update and Outlook
I am pleased to report that the Group's performance in its financial year to 31 January 2025 is the strongest since the business floated on the AIM Market in 2006.
Over the financial year to 31 January 2025, the valuation of the Group's equity portfolio has increased by 83.5% (year ending 31 January 2024: 35.9%), adjusting for investments and realisations. NAV over the financial year to 31 January 2025 has increased by 42.4% (year ending 31 January 2024: 35.9%).
These results demonstrate the continued success of our long-term, partnership-oriented investment approach, whereby the Group collaborates closely with our management teams, offering strategic and financial support, aiming for mutually beneficial outcomes without imposing strict exit timelines.
During the financial year to 31 January 2025, the Group completed two substantial realisations, being:-
|
· Paladin Holdings Limited/CBC UK Limited |
Sold to Specialist Risk Group Limited for consideration of £44.0m (IRR: 47.3%). |
|
· Lilley Plummer Risks Limited |
Sold to Clear London Markets Limited, for consideration of £21.7m (IRR: 93.4%). |
Both these realisations delivered substantial returns to the Company, exemplifying the Group's ability to identify and invest in businesses with strong management teams which can deliver considerable returns for all stakeholders.
These successful realisations, both at a premium to the Group's most recent valuations, bolstered the Group's free cash position as at 31 January 2025.
Such liquidity has enabled the Group to continue with its strategy of delivering an increased dividend yield, whilst also deploying cash within the existing portfolio companies alongside making new investments, with the continued aim of delivering NAV growth.
Over the financial year to 31 January 2025, the Group completed four new investments, as follows:-
|
· Devonshire UW Topco Limited |
A start-up underwriting agency specialising in global transactional liability risks. |
|
· CEE Specialty s.r.o |
An established underwriting agency specialising in marine hull, bonds and liability insurance, targeting business in Central and Eastern Europe. |
|
· Volt UW Holdco Limited |
A start-up underwriting agency specialising in energy insurance in both the renewable and non-renewable sectors. |
|
· SRT & Partners Limited |
A start-up UK Retail and London Market broker, which acquired two businesses on completion, being a retail and asset finance business. |
Post financial year end, the Group completed a further two new investments, as follows:-
|
· iO Finance Partners |
A buy-and-build opportunity within the alternative finance market, looking to fill a funding gap for the UK SME market. |
|
· Amiga Specialty Holdings Limited |
A start-up focused on establishing an international specialty underwriting agency. |
Alongside the deployment of capital for these new investments, the Group has increased its dividend distribution. The Group paid an interim dividend of 6.78p per share (£2.5m) on 28 February 2025, a special dividend of 8.08p per share (£3.0m) on 30 May 2025, and is proposing to pay a final dividend of 6.78p per share (£2.5m) on 25 July 2025. Therefore, a total of £8.0m (21.64p per share) will be paid in the financial year ending 31 January 2026.
Disposals
Paladin Holdings Limited / CBC UK Limited
The sale of Paladin to Specialist Risk Group Limited completed on 22 March 2024.
Upon completion, the Group received £42.1m in cash (net of transaction costs), which represented a 37.8% uplift on the Group's latest valuation of the investment as at 31 July 2023. In September 2024, the Group received a further £1.9m in respect of a working capital adjustment.
In April 2025, the Group received a deferred consideration payment of £9.2m from the disposal of Paladin, increasing the aggregate cash received to £53.2m.
The sale represents an Internal Rate of Return of 47.3%.
Subject to performance criteria being satisfied, the Group expects to receive a final deferred consideration payment in 2026.
Lilley Plummer Risks Limited
The sale of LPR to Clear London Markets Limited completed on 29 October 2024.
Upon completion, the Group received £21.7m (net of transaction costs), which represented a £4.5m uplift (26.0%) from the £17.1m valuation as at 31 July 2024.
The sale represents an Internal Rate of Return of 93.4% and a money multiple on equity investment of 70.5x.
Disposal - Post Year End
Sterling Insurance Pty Limited
Post year end, B.P. Marsh completed on the disposal of its indirect equity interest in Sterling to ATC, an independent Australian Underwriting Agency, which it had held through a minority holding in Neutral Bay Investments Limited ("Neutral Bay").
ATC acquired 100% of the issued share capital of Sterling for a total consideration of AU$33m. B.P. Marsh's share of the consideration, via Neutral Bay, will amount to approximately AU$6.5m, which B.P. Marsh will receive in shares in the enlarged ATC Group. B.P. Marsh's shareholding in ATC will increase to approximately 27.0% as a result of the sale.
New Investments
Devonshire UW Topco Limited
In March 2024, the Group completed its investment in Devonshire, the London-based underwriting agency specialising in transactional risks, including Warranty & Indemnity, Specific Tax, and Legal Contingency Insurance.
Devonshire is backed by Lloyd's capacity with support from a strong panel of A-rated insurance capacity providers.
Date of initial investment: March 2024
31 January 2025 valuation: £300,000
Cost of Equity: £300,000
Equity stake: 30.0%
Loan Facility: £1,600,000
CEE Specialty s.r.o
In September 2024, the Group completed its investment in CEE, an underwriting agency based in Prague, with a branch office in Bucharest.
CEE was founded in 2019 and specialises in Marine Hull, Bonds and Liability Insurance, targeting businesses in Central and Eastern Europe.
CEE provided B.P. Marsh with an excellent opportunity to invest in a business with a well-established, highly experienced leadership team and strong growth potential over the coming years.
CEE is continuing its strategy of expanding its current product offering to new geographic areas, whilst also adding new product lines.
Since investment, CEE has performed well, with the business growing substantially year on year.
Date of initial investment: September 2024
31 January 2025 valuation: €2,819,852 (£2,350,000)
Cost of Equity: €2,819,852 (£2,354,134)
Equity stake: 44.0%
Loan Facility: €487,860 (£410,000)
Volt UW Holdco Limited
In October 2024, the Group completed its investment in Volt, a London-based underwriting agency, specialising in energy insurance, focusing specifically on insuring property risks related to power generation and midstream energy across both non-renewable and renewable sectors.
Volt has performed well since investment, exceeding its business plan and is on course to become a best-in-class, client-centric energy underwriting agency with a strong emphasis on Environmental, Social, and Governance (ESG) principles.
Volt operates as a Lloyd's coverholder and since investment has expanded its A-rated capacity from both Lloyd's and non-Lloyd's carriers.
Date of initial investment: October 2024
31 January 2025 valuation: £25.50
Cost of Equity: £25.50
Equity stake: 25.5%
Loan Facility: £2,500,000
SRT & Partners Limited
In October 2024, the Group completed its investment in SRT, a start-up London Market insurance broker, which at completion acquired two existing businesses, being a UK retail broker and an asset finance broker.
Since investment, SRT has successfully introduced a cross-selling opportunity between the two-underlying businesses, as part of its strategy of creating organic sources of revenue between the retail insurance and asset finance brokers.
SRT is also in the process of building out their London Market presence, with the overall aim of SRT being a premier, client-focused broker, offering an array of diversified products across the insurance and asset finance sector.
Date of initial investment: October 2024
31 January 2025 valuation: £150,000
Cost of Equity: £150,000
Equity stake: 30.0%
Loan Facility: £2,350,000
New Investments - Post Year End
iO Finance Partners Topco Limited
In April 2025, the Group completed its investment in iO Partners, subscribing for an 8.0% shareholding, via a mix of Preferred and Ordinary shares for £10.0m.
iO Partners is a buy-and-build opportunity within the alternative finance market, intending to bring together a diverse group of alternative finance providers to support and grow the UK economy and SME market. Its strategy is to fill a funding gap in the UK market. Upon completion, iO Partners acquired three alternative finance providers.
A co-investor to this transaction is Janus Henderson Group plc ("Janus Henderson"), investing £10.0m on the same terms as B.P. Marsh. Janus Henderson is a NYSE listed global active asset manager headquartered in London. As of 31 December 2024, Janus Henderson had approximately £302.4 billion in assets under management.
B.P. Marsh has a successful track record of investing in the financial services sector, backing experienced management teams alongside supportive partners. Whilst iO Partners is not within our primary focus of insurance distribution investments, B.P. Marsh sees this as an opportunity to invest in an experienced management team with a strong track record in the sector, that will deliver long term returns to our shareholders.
Date of initial investment: April 2025
31 January 2025 valuation: N/A
Cost of Equity: £10,000,000
Equity stake: 8.0%
Amiga Specialty Holdings Limited
In June 2025, the Group completed its investment in Amiga, subscribing for a 49.0% shareholding for £49. Amiga is a start-up entity focused on establishing an international specialty underwriting agency. Amiga aims to build a diversified portfolio of specialty insurance products across key global markets, pursuing both organic growth and a strategic mergers and acquisitions approach.
Amiga is led by its Managing Director, Adam Kembrooke, a seasoned insurance professional with over 20 years of industry experience. Prior to founding Amiga, Mr. Kembrooke served as CEO and President of Nexus US, as well as Group Chief Legal Officer at its parent company, Kentro Capital Limited.
Alongside the equity investment, B.P. Marsh has provided a £10.0m loan facility to Amiga, of which £0.5m was drawn down at completion.
Date of initial investment: June 2025
31 January 2025 valuation: N/A
Cost of Equity: £49
Equity stake: 49.0%
Loan Facility: £10,000,000
Portfolio Update & Activity
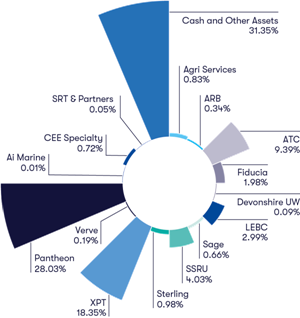
NAV breakdown by portfolio company
The composition of B.P. Marsh's underlying portfolio companies is shown on the chart below.
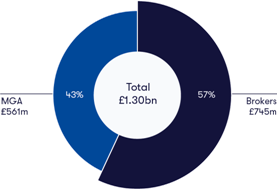
Our current insurance investments produced in aggregate over approximately £1.30bn of insurance premium during 2024 and a breakdown between brokers and Underwriting Agencies is shown below.
Insurance Brokers
The Group's Broking portfolio placed over £745m of gross written premium in 2024, producing over £60.1m of brokerage income, accessing specialty markets around the world.

Underwriting Agencies / Managing General Agents
The Group's Underwriting Agencies produced over £561.4m of gross written premium in 2024, yielding over £58.5m of commission income across many specialist product areas on behalf of more than 50 insurers.
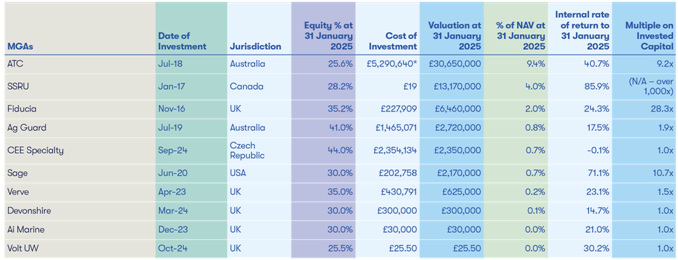
*ATC's equity investment is reported as the combined initial equity investment into ATC, MB Prestige Holdings PTY Limited, and Sterling Insurance PTY Limited
Follow-on Investments and Funding
Pantheon Specialty Group Limited - UK
+ 141.4 pence NAV per share change in the Year
Since the Group's original investment in Pantheon in June 2023, when it subscribed for a 25.0% stake, the business has been a stand out performer in the portfolio.
Over the financial year to 31 January 2025, the Group made two further equity investments in Pantheon.
Firstly, the Group acquired a further 7.0% in May 2024, increasing our shareholding to 32.0%, for cash consideration of £7.3m. Secondly, in October 2024, the Group acquired a further 5.0% shareholding in Pantheon, for cash consideration of £12.5m, increasing its total shareholding to 37.0%.
Both of these share purchases were from Pantheon's management team, allowing them to sell a portion of their shareholding, providing them with personal liquidity, whilst still retaining a significant majority stake in the business.
Since the Group backed management to establish Pantheon, its performance has been exceptional, rapidly becoming a leading independent broker in the London Insurance market. In its current financial year to 31 December 2025, Pantheon is forecasting to achieve an adjusted EBITDA of c. £18m.
In light of this performance, the Group saw the opportunity to increase its shareholding in Pantheon as a well-earned partial liquidity event for Pantheon's management team, whilst also increasing its shareholding in a rapidly growing company.
Date of initial investment: June 2023
31 January 2025 valuation: £91,500,000
Cost of Equity: £21,800,000
Equity stake: 37.0%
XPT Group LLC - USA
+ 24.1 pence NAV per share change in the Year
The Group's investment in XPT, the specialty lines insurance distribution company, continues to perform well, with the business producing close to US$1bn of gross written premium and adjusted EBITDA of US$23.0m in its financial year to 31 December 2024. This strong growth is set to continue through 2025 with XPT budgeting to achieve gross written premium of US$1.2bn and adjusted EBITDA of US$29.0m.
In May 2024, the Group made an additional equity investment of US$1.0m in XPT.
Following this, in November 2024, the Group provided XPT with a further US$12.6m, structured via a purchase of existing equity and an additional loan facility. The funding was provided alongside the extension of XPT's current banking facilities with Apogem Capital LLC, which increased to US$122.0m.
The Group's provision of funding has been structured as follows:-
· An equity share purchase from three members of XPT's senior management; and
· A new loan facility of US$6.3m which will attract an interest rate of SOFR plus 4.7% (subject to a minimum of 10.0%).
The Group's new loan facility, combined with additional bank financing, has enabled XPT to continue to achieve its growth targets through organic expansion, individual hires, and mergers & acquisitions.
Following these new funding arrangements, XPT's Platinum Specialty Underwriters programme business acquired Atri Insurance Services ("Atri"), the US underwriting agency specialising in management and professional liability insurance. Atri has capacity from highly rated paper, primarily Fair American Insurance and Reinsurance Company.
The provision of this new funding reflects our continued confidence in XPT's robust business model and impressive growth trajectory. Since the Group's initial involvement in 2017, XPT has demonstrated exceptional performance, driven by strategic acquisitions, talent hires, and solid organic growth.
Date of initial investment: June 2017
31 January 2025 valuation: £59,900,000
Cost of Equity: £18,838,733
Equity stake: 28.98%
IFA Investment
LEBC Holdings Limited - UK
+ 12.1 pence NAV per share change in the Year
In April 2024, LEBC sold 100% of Aspira Corporate Solutions Limited ("Aspira") to Titan Wealth Holdings Limited, the discretionary fund management/wealth and asset management business.
Upon completion, B.P. Marsh received repayment in full of its outstanding loans with LEBC, a total of £3.3m. The upfront consideration also allowed LEBC to meet its obligations regarding historical defined benefit pension transfer advice, as agreed with the FCA.
LEBC was due to receive the proceeds of sale over a three year earn-out period linked to performance. The first payment was received by LEBC on 6 June 2025, with B.P. Marsh's pro-rata allocation being £5.9m.
All future performance criteria required for deferred consideration payments to LEBC have been removed.
Date of initial investment: April 2007
31 January 2025 valuation: £9,770,000
Cost of Equity: £13,473,657
Equity stake: 61.86%
Other Portfolio Company Highlights
ATC Insurance Solutions - Australia
+ 31.9 pence NAV per share change in the Year
ATC continues to perform strongly across its many product offerings.
When the Group invested in ATC in 2018, the business produced gross written premium of c.AU$61m. Over the period of the Group's investment, the business has grown considerably, and is budgeting to produce gross written premium of AU$225m in its current year to 30 June 2025.
Since investment, ATC has grown into the largest independent underwriting agency in Australia and the Group expects this growth trajectory to continue.
In May 2025, ATC completed the acquisition of 100% of Sterling for a total consideration of AU$33m /£15.7m. Of this amount, AU$6.5m /£3.1m was attributable to B.P. Marsh. The Group's consideration will be settled through the issuance of new ATC shares, resulting in an increase in B.P. Marsh's equity stake in ATC to 27.0%.
Date of initial investment: July 2018
31 January 2025 valuation: £30,650,000
Cost of Equity: £6,476,595
Equity stake: 25.56%
The Fiducia MGA Company Limited ("Fiducia") - UK
+ 4.0 pence NAV per share change in the Year
Fiducia's performance over 2024 was positive, with gross written premium showing strong year on year growth. The Group expects this growth to continue throughout 2025.
This positive performance has allowed Fiducia to pay down £750,000 of its loan outstanding with the Group, demonstrating its ability to grow the business and generate cash.
Date of initial investment: November 2016
31 January 2025 valuation: £6,460,000
Cost of Equity: £227,909
Equity stake: 35.18%
Stewart Specialty Risk Underwriting Ltd ("SSRU") - Canada
+ 3.3 pence NAV per share change in the Year
Performance of SSRU over 2024 was strong, with its EBITDA having more than doubled since 2020. SSRU's budget for 2025 shows strong year on year growth, and the Group is confident that its positive performance since inception will continue moving forward.
SSRU remains actively engaged in seeking new partnerships, consistently introducing additional capacity to the Canadian market.
Date of initial investment: January 2017
31 January 2025 valuation: £13,170,000
Cost of Equity: £19
Equity stake: 28.22%
Market Commentary
The Group continues to track key trends in the insurance sector in which we operate, with a specific focus on premium rates and merger and acquisition activity.
The softening trend in rates has continued into 2025, with global rates declining by 3.0% over the first quarter in 2025, which represented the third consecutive quarter whereby global insurance rates reduced.
The trend of softening rates is principally due to increased insurer competition, with there being new market entrants, alongside existing carriers increasing their exposure to hit growth targets.
A substantial proportion of the market now has access to sufficient capacity, which in turn applies a downward pressure on rates. This is a trend that the Group expects to continue over the course of 2025, subject to any unforeseen circumstances.
Global Property, Financial and Professional lines, alongside Cyber, were the main driver of overall rate decreases, all dropping by 6.0% in the first quarter of 2025.
Conversely, Global Casualty rates increased by 4% in the first quarter of 2025, against the general trend, with rates having increased by 17% over the last 12 months. This has been primarily driven by US Casualty rates, which increased by 8.0% in the first quarter of 2025.
New Business
During the Group's financial year to 31 January 2025, the Group completed four new investments within the financial services (sub)sector in which it specialises, particularly in the underwriting and broking sectors.
The Group continues to invest in niche SME sectors, backed by skilled and knowledgeable management teams, which promotes long-term growth and generates significant value.
Over the financial year to 31 January 2025, the Group continued to see a high number of new business opportunities, having received 72 new business enquiries. This is similar to the 71 new opportunities received in the Group's previous year to 31 January 2024.
The Group has a strong pipeline of new business opportunities within the insurance intermediary sector and subject to appropriate terms, the Group anticipates making additional investments over the course of its financial year to 31 January 2026.
Given the Group's strong liquidity position and positive track record, the Group is confident in its ability to continue to source and invest in opportunities which will create future shareholder value.
Daniel Topping
Chief Investment Officer
10 June 2025
Chief Finance Officer Statement
I am delighted to present my first set of Full Year Results, and to report that the Group has achieved a record financial performance for the year to 31 January 2025.
Financial performance summary
The table below summarises the Group's financial results and key performance indicators for the year to 31 January 2025:
|
Year to/as at |
Year to/as at |
|||
|
31 January |
31 January |
|||
|
2025 |
2024 |
|||
|
Net asset value |
£326.4m |
£229.2m |
||
|
Net asset value per share - undiluted |
890.0p |
629.0p |
||
|
Net asset value per share - diluted |
847.3p |
626.9p |
||
|
Profit on ordinary activities before tax |
£104.7m |
£43.6m |
||
|
Dividend per share paid |
10.72p |
5.56p |
||
|
Total shareholder return (including dividends) |
£101.2m |
£41.7m |
||
|
Total shareholder return on opening shareholders' funds |
44.2% |
22.0% |
||
|
Net cash (used by) / from operating activities (net of equity investments, realisations and loans) |
£(4.2)m |
£(1.2)m |
||
|
Equity cash investment for the year |
£31.5m |
£3.4m |
||
|
Realisations (net of disposal costs) |
£65.7m |
£53.1m |
||
|
Loans issued in the year |
£11.2m |
£20.3m |
||
|
Loans repaid by investee companies in the year |
£14.7m |
£2.7m |
||
|
Cash and treasury funds at end of year |
£74.1m |
£40.5m |
||
|
Borrowing / Gearing |
£Nil |
£Nil |
||
The Group had a very strong year, delivering an increase in NAV of £97.2m (42.4%) to £326.4m (2024: £229.2m), compared with an increase of £39.7m (20.9%) for the same period in 2024. Including the £4.0m aggregate dividend paid in March 2024, May 2024 and July 2024, this represented an overall return of 44.2% for the year (2024: including a £2.0m aggregate dividend, the overall return was 22.0%.
The NAV of £326.4m at 31 January 2025 represents a total increase in NAV of £297.2m since the Group was originally formed in 1990 having adjusted for the original capital investment of £2.5m, the £10.1m net proceeds raised on AIM in 2006 and the £16.6m of net proceeds raised through the Share Placing and Open Offer in July 2018. The Group has delivered an annual compound growth rate of 11.1% in Group NAV after running costs, realisations, losses, distributions and corporation tax since flotation, and 13.1% since 1990.
Investment performance
The Group's equity portfolio movement during the year was as follows:
|
31 January 2024 valuation |
Acquisitions at cost |
Disposal proceeds |
Reclassification from equity portfolio to debtor |
Adjusted 31 January 2024 valuation |
31 January 2025 valuation |
|
£165.4m |
£31.5m |
£(65.7)m |
£(9.0)m |
£122.2m |
£224.1m |
The equity portfolio continued to increase in value, rising by 83.5% to £224.1m (31 January 2024: £165.4m, an increase of 35.9%) after adjusting for £65.7m of net realisations and £31.5m of acquisitions in the year, and after adjusting for a £9.0m reclassification of deferred consideration relating to the disposal of Paladin from the equity portfolio to a debtor within the Consolidated Statement of Financial Position.
The Group made two realisations during the year totalling £65.7m, being £44.0m from the sale of the Group's entire 38.63% investment in Paladin which completed on 22 March 2024 and £21.7m from the sale of the Group's entire 28.4% investment in LPR, which completed on 29 October 2024.
The Group invested a total of £31.5m in equity in the portfolio during the year (2024: £3.4m):
· £28.7m into the existing portfolio, including £21.8m in Pantheon, £5.8m in XPT, £1.1m in LEBC; and
· £2.8m into four new investments, including £2.35m in CEE, £0.3m in Devonshire, £0.15m in SRT and £26 (nominal value) in Volt.
Operating income
Net gains from investments were £107.5m (2024: £43.7m), a 145.9% increase over the previous year, of which £90.2m related to the revaluation of the investment portfolio, and £17.3m in respect of realised gains on disposal of investments during the year to 31 January 2025 (2024: £43.7m related to revaluation of the investment portfolio). The Paladin and LPR sales resulted in an aggregate realised gain on disposal of £62.7m, which has been reflected within a movement from the fair value reserve to retained earnings within the Consolidated Statement of Financial Position.
Despite the Group making two significant realisations in the year to 31 January 2025, income from the portfolio increased by £0.3m, or 4.1% to £7.8m (2024: £7.5m). Dividend income was £0.4m higher due to strong investment portfolio performance, whilst loan interest increased by £0.5m, despite a net reduction in total loans outstanding over the year, due to higher interest rates charged resulting from Bank of England base rate increases. The increase to loan interest and dividend income over the year was offset by a reduction in fee income of £0.6m due to a lower amount of one-off transaction and loan arrangement fees charged in 2025 compared to 2024, as well as a general reduction in fees charged due to the realisations made over the year.
Operating expenses
Operating expenses increased by £5.8m, or 74%, during the year to £13.7m (2024: £7.9m). A significant proportion of the increase in operating expenses related to increased staff costs of £4.8m, of which £3.8m related to one-off bonuses awarded to employees in line with the Group's financial performance and successful realisations made, and £1.0m related to termination payments made to departing employees upon loss of office. The remaining £1.0m increase related to general cost inflation, professional fees incurred for new and follow-on investment activity and expenses relating to the implementation of the Group's Share Option Scheme.
Profit on ordinary activities
The consolidated profit on ordinary activities before taxation for the year was £104.7m which represented an increase of £61.1m, or 140%, over the £43.6m reported in 2024 (2024: up £16.0m, or 58%, to £43.6m). The consolidated profit on ordinary activities after taxation increased by £57.0m, or 134% to £99.5m (2024: up £18.7m, or 78.6%, to £42.5m).
The Group's strategy is to cover its expenses from the portfolio yield. On an underlying basis, including treasury returns and realised gains in cash, but excluding unrealised investment activity (unrealised gains on equity, movement in the provision for deferred consideration on equity portfolio disposals and provision against loans receivable from investee companies), this was achieved with a pre-tax profit of £9.0m for the year (2024: £0.1m).
Liquidity and Loan Portfolio
In addition to contributing equity to its investment portfolio, the Group frequently extends loan financing, either as part of the initial investment structure or as subsequent funding to support further growth. This additional financing may be used for acquisitions, working capital, recruitment or product development.
The Group's loan portfolio balance decreased by £3.3m during the year to £25.6m as at 31 January 2025 (31 January 2024: £28.9m). The key movements were:
· £5.8m was provided to the existing investment portfolio, including £5.0m to XPT, £0.7m to Dempsey Group Limited and £0.1m to Verve Risk Services Limited.
· £5.4m was provided to the new investments made by the Group during the year, including £2.3m to SRT, £1.5m to Devonshire, £1.2m to Volt and £0.4m provided to the management of CEE as part of the investment transaction.
· £12.7m of loans were repaid during the year, including £5.9m from Paladin, £3.3m from LEBC, £2.5m from Pantheon, £0.5m from Fiducia and £0.4m from Brown & Brown (Europe) Holdco Limited.
· In addition to the £2.5m repaid by Pantheon during the year, the remaining loan balance outstanding of £2.0m was reclassified as further equity cost invested, reducing the loan balance owed by Pantheon to £Nil at the year end.
· A £0.2m increase due to foreign exchange movements offset by a £0.1m reduction resulting from loan impairments.
During the year the Group paid dividends totalling £4.0m and bought back £0.8m in shares.
At 31 January 2025, the Group had total available cash and treasury funds of £74.1m (31 January 2024: £40.5m).
Since 31 January 2025, the Group has provided £1.3m in further loans to its existing portfolio in respect of further drawdowns from agreed loan facilities, with £1.0m provided to Pantheon and £0.3m to Volt. The Group also received £0.1m in loan repayments from Fiducia. The loan portfolio balance is currently £26.9m.
The Group has also made two new equity investments. In April 2025, the Group invested £10.0m into iO Partners via a mixture of preferred and ordinary equity. This was followed by an investment made in June 2025 into Amiga for a nominal equity of £49, alongside an initial £0.5m loan drawdown, from its agreed £10.0m facility.
Other significant cash movements include the receipt of £9.2m in further consideration from the sale of the Group's investment in Paladin, which completed in March 2024. This represents the first tranche of deferred consideration that is expected in relation to the sale.
In addition, £5.5m has been distributed in dividends since the year end. The Group's current cash and treasury balance is £65.2m. Treasury funds are all in one month or less deposit accounts.
The Group is debt free.
Undiluted / Diluted NAV per share
The NAV per share at 31 January 2025 is 890.0p (2024: 629.0p). Previously, 1,461,302 shares (which includes unallocated shares now owned by the Employee Benefit Trust which were forfeited by departing employees) being held within an Employee Benefit Trust as part of a long-term share incentive plan for certain directors and employees of the Group were excluded as they did not have voting or dividend rights. However, in October 2023 voting and dividend rights were granted for the 1,206,888 allocated shares which resulted in them being included in the undiluted NAV per share calculation. During the year 681,648 of these allocated shares were sold, leaving 525,240 allocated shares within the Employee Benefit Trust. During the year, the Group received £2.1m of loan debt owed by the Trust in relation to the original transfer of shares which is reflected within the Group's NAV of £326.4m as at 31 January 2025. The remaining 525,240 allocated shares are included in the undiluted NAV per share calculation, alongside £1.5m of loan debt, which remains repayable by the Trust in relation to the original transfer of shares. This debt cannot currently be consolidated within the accounts but will be repaid if the shares are sold.
The diluted NAV per share at 31 January 2025 is 847.3p (31 January 2024: 626.9p). This includes the full 761,499 shares remaining within the Employee Benefit Trust and also includes £2.0m of loan repayable if the shares, including the 236,259 shares that are currently unallocated, were sold.
The diluted NAV per share calculation also includes the 1,682,500 options over ordinary shares granted to certain Directors and employees of the Group in November 2023, which became dilutive at 31 July 2024, as the performance criteria for NAV growth had been met.
Francesca Chappell
Chief Finance Officer
10 June 2025
Forward-looking statements:
Certain statements in this announcement are forward-looking statements. In some cases, these forward looking statements can be identified by the use of forward looking terminology including the terms "anticipate", "believe", "intend", "estimate", "expect", "may", "will", "seek", "continue", "aim", "target", "projected", "plan", "goal", "achieve" and words of similar meaning or in each case, their negative, or other variations or comparable terminology. Forward-looking statements are based on current expectations and assumptions and are subject to a number of known and unknown risks, uncertainties and other important factors that could cause results or events to differ materially from what is expressed or implied by those statements. Many factors may cause actual results, performance or achievements of B.P. Marsh to be materially different from any future results, performance or achievements expressed or implied by the forward-looking statements. Important factors that could cause actual results, performance or achievements of B.P. Marsh to differ materially from the expectations of B.P. Marsh, include, among other things, general business and economic conditions globally, industry trends, competition, changes in government and changes in regulation and policy, changes in its business strategy, political and economic uncertainty and other factors. As such, undue reliance should not be placed on forward-looking statements. Any forward-looking statement is based on information available to B.P. Marsh as of the date of the statement. All written or oral forward-looking statements attributable to B.P. Marsh are qualified by this caution. Other than in accordance with legal and regulatory obligations, B.P. Marsh undertakes no obligation to publicly update or revise any forward-looking statement, whether as a result of new information, future events or otherwise. Nothing in this announcement should be regarded as a profit forecast.
Investments
As at 31 January 2025 the Group's equity interests were as follows:
Ag Guard PTY Limited
Ag Guard is a Managing General Agency, which provides insurance to the agricultural sector, based in Sydney, Australia. The Group holds its investment through Ag Guard's Parent Company, Agri Services Company PTY Limited.
Date of investment: July 2019
Equity stake: 41.0%
31 January 2025 valuation: £2,720,000
Ai Marine Risk Limited
Ai Marine is a start-up MGA with a focus on marine hull insurance and with a strong focus on the UK & Europe, Middle East and Asia Pacific regions.
Date of investment: December 2023
Equity stake: 30.0%
31 January 2025 valuation: £30,000
Asia Reinsurance Brokers (Pte) Limited
ARB is an independent specialist reinsurance and insurance risk solutions provider headquartered in Singapore.
Date of investment: April 2016
Equity stake: 25.0%
31 January 2025 valuation: £1,100,000
ATC Insurance Solutions PTY Limited
ATC is a Managing General Agency and Lloyd's Coverholder, specialising in accident & health, construction & engineering, trade pack, motor and sports insurance headquartered in Melbourne, Australia.
Date of investment: July 2018
Equity stake: 25.6%
31 January 2025 valuation: £30,650,000
CEE Specialty s.r.o.
(https://cee-specialty.eu/index.php/cs/)
CEE Specialty is a Managing General Agency based in Prague, Czech Republic specialising in Marine Hull, Bonds and Liability Insurance.
Date of investment: September 2024
Equity stake: 44%
31 January 2025 valuation: £2,350,000
Criterion Underwriting (Pte) Limited
Criterion was established to provide specialist insurance products to a variety of clients in the cyber, financial lines and marine sectors in Far East Asia, based in Singapore.
Date of investment: July 2018
Equity stake: 29.4%
31 January 2025 valuation: £0
Devonshire UW Limited
(www.devonshire-underwriting.co.uk)
Devonshire is a London based Managing General Agency, specialising in transactional risks encompassing Warranty and Indemnity, Specific Tax, and Legal Contingency Insurance.
Date of investment: March 2024
Equity stake: 30%
31 January 2025 valuation: £300,000
The Fiducia MGA Company Limited
Fiducia is a UK marine cargo Underwriting Agency and Lloyd's Coverholder which specialises in the provision of insurance solutions across a number of marine risks including, cargo, transit liability, engineering and terrorism Insurance.
Date of investment: November 2016
Equity stake: 35.2%
31 January 2025 valuation: £6,460,000
LEBC Holdings Limited
LEBC is an Independent Financial Advisory company providing services to individuals, corporates and partnerships, principally in employee benefits, investment and life product areas.
Date of investment: April 2007
Equity stake: 59.3%
31 January 2025 valuation: £9,770,000
New Denison Limited
Date of investment: June 2023
Equity stake: 40%
31 January 2025 valuation: £0
Pantheon Specialty Group Limited
Pantheon is a holding company established in partnership with Robert Dowman. Pantheon acquired 100% of the share capital of the Lloyd's broker Denison and Partners Limited. With the support of B.P Marsh, Robert Dowman is looking to build a market leading independent specialist broker, across multiple markets.
Date of investment: June 2023
Equity stake: 25.0%
31 January 2025 valuation: £91,500,000
Sage Program Underwriters, Inc.
Sage provides specialist insurance products to niche industries, initially in the inland delivery and field sport sectors based in Bend, Oregon.
Date of investment: June 2020
Equity stake: 30.0%
31 January 2025 valuation: £2,170,000
SRT & Partners Limited
SRT & Partners is a start up UK Retail and London Market broker. Headquartered in London, it funishes its clients and partners with access to the special Broking and Underwriting services they require.
Date of investment: October 2024
Equity stake:30.0%
31 January 2025 valuation: £150,000
Stewart Specialty Risk Underwriting Ltd
SSRU is a Managing General Agency, providing insurance solutions to a wide array of clients in the construction, manufacturing, onshore energy, public entity and transportation sectors based in Toronto, Canada.
Date of investment: January 2017
Equity stake: 28.2%
31 January 2025 valuation: £13,170,000
Sterling Insurance PTY Limited
(www.sterlinginsurance.com.au)
Sterling is a specialist Underwriting Agency offering a range of insurance solutions within the Liability sector, specialising in niche markets including mining, construction and demolition based in Sydney Australia. The Group holds its investment in Sterling via a joint venture with Besso Insurance Group Limited, Neutral Bay Investments Limited.
Date of investment: June 2013
Equity stake: 19.7%
31 January 2025 valuation: £3,200,000
Verve Risk Services Limited
Verve is a London based Managing General Agency specialising in Professional and Management Liability for the insurance industry. Verve operates in the USA, Canada, Bermuda, Cayman Islands and Barbados.
Date of investment: April 2023
Equity stake: 35.0%
31 January 2025 valuation: £625,000
Volt UW Limited
Volt is a London based Managing General Agency, specialising in energy insurance with a clear focus on insuring property risks associated with power generation and midstream energy in both the non-renewable and renewable sector.
Date of investment: October 2024
Equity stake: 25.5%
31 January 2025 valuation: £25.50
XPT Group LLC
XPT is a wholesale insurance broking and Underwriting Agency platform across the U.S. Specialty Insurance Sector operating from many locations in the United States of America.
Date of investment: June 2017
Equity stake: 29.0%
31 January 2025 valuation: £59,900,000
These investments have been valued in accordance with the accounting policies on Investments set out in note 1 of the Consolidated Financial Statements.
Consolidated Financial Statements
CONSOLIDATED STATEMENT OF COMPREHENSIVE INCOME
FOR THE YEAR ENDED 31ST JANUARY 2025
|
Notes |
2025 |
2024 |
|||
|
£'000 |
£'000 |
£'000 |
£'000 |
||
|
GAINS ON INVESTMENTS |
1 |
||||
|
Realised gains / (losses) on disposal of equity investments (net of costs) |
14 |
17,292 |
(37) |
||
|
Net provision (made) / released against equity investments and loans |
16 |
(36) |
24 |
||
|
Unrealised gains on equity investment revaluation |
12 |
90,207 |
43,711 |
||
|
107,463 |
43,698 |
||||
|
INCOME |
|||||
|
Dividends |
1,25 |
3,910 |
3,504 |
||
|
Income from loans and receivables |
1,25 |
2,342 |
1,861 |
||
|
Fees receivable |
1,25 |
1,524 |
2,103 |
||
|
7,776 |
7,468 |
||||
|
OPERATING INCOME |
2 |
115,239 |
51,166 |
||
|
Operating expenses |
(13,672) |
(7,881) |
|||
|
2 |
(13,672) |
(7,881) |
|||
|
OPERATING PROFIT |
101,567 |
43,285 |
|||
|
Financial income |
2,4 |
3,184 |
721 |
||
|
Financial expenses |
2,3 |
(137) |
(55) |
||
|
Exchange movements |
2,8 |
79 |
(333) |
||
|
3,126 |
333 |
||||
|
PROFIT ON ORDINARY ACTIVITIES BEFORE TAXATION |
8 |
104,693 |
43,618 |
||
|
Income taxes |
9 |
(5,194) |
(1,089) |
||
|
PROFIT ON ORDINARY ACTIVITIES AFTER TAXATION ATTRIBUTABLE TO EQUITY HOLDERS |
20 |
£99,499 |
£42,529 |
||
|
TOTAL COMPREHENSIVE INCOME FOR THE YEAR |
20 |
£99,499 |
£42,529 |
||
|
Earnings per share - basic (pence) |
10 |
269.5p |
114.7p |
||
|
Earnings per share - diluted (pence) |
10 |
256.2p |
114.0p |
||
The result for the year is wholly attributable to continuing activities.
CONSOLIDATED AND PARENT COMPANY STATEMENTS OF FINANCIAL POSITION
31ST JANUARY 2025
(Company Number: 05674962)
|
Group |
Company |
|||||
|
Notes |
2025 |
2024 |
2025 |
2024 |
||
|
£'000 |
£'000 |
£'000 |
£'000 |
|||
|
ASSETS |
||||||
|
NON-CURRENT ASSETS |
||||||
|
Property, plant and equipment |
11 |
84 |
65 |
- |
- |
|
|
Right-of-use asset |
21 |
342 |
507 |
- |
- |
|
|
Investments - equity portfolio |
12 |
224,095 |
115,833 |
290,359 |
190,860 |
|
|
Investments - subsidiaries |
12 |
- |
- |
36,123 |
38,383 |
|
|
Loans and receivables |
15 |
22,623 |
16,197 |
1,979 |
2,948 |
|
|
247,144 |
132,602 |
328,461 |
232,191 |
|||
|
CURRENT ASSETS |
||||||
|
Investments - assets held for sale |
12 |
- |
49,549 |
- |
- |
|
|
Investments - treasury portfolio |
13 |
- |
78 |
- |
- |
|
|
Trade and other receivables |
16 |
19,603 |
15,633 |
- |
1,157 |
|
|
Cash and cash equivalents |
13 |
74,137 |
40,435 |
7 |
7 |
|
|
TOTAL CURRENT ASSETS |
93,740 |
105,695 |
7 |
1,164 |
||
|
TOTAL ASSETS |
340,884 |
238,297 |
328,468 |
233,355 |
||
|
LIABILITIES |
||||||
|
NON-CURRENT LIABILITIES |
||||||
|
Lease liabilities |
21 |
(218) |
(416) |
- |
- |
|
|
Deferred tax liabilities |
17 |
(11,847) |
(6,687) |
- |
- |
|
|
TOTAL NON-CURRENT LIABILITIES |
(12,065) |
(7,103) |
- |
- |
||
|
CURRENT LIABILITIES |
||||||
|
Trade and other payables |
(2,215) |
(1,843) |
- |
- |
||
|
Lease liabilities |
21 |
(194) |
(180) |
- |
- |
|
|
TOTAL CURRENT LIABILITIES |
18 |
(2,409) |
(2,023) |
- |
- |
|
|
TOTAL LIABILITIES |
(14,474) |
(9,126) |
- |
- |
||
|
NET ASSETS |
£326,410 |
£229,171 |
£328,468 |
£233,355 |
||
|
CAPITAL AND RESERVES - EQUITY |
||||||
|
Called up share capital |
19,20 |
3,710 |
3,729 |
3,710 |
3,729 |
|
|
Share premium account |
20 |
29,356 |
29,345 |
29,356 |
29,345 |
|
|
Fair value reserve |
20 |
135,132 |
112,768 |
288,216 |
188,717 |
|
|
Reverse acquisition reserve |
20 |
393 |
393 |
- |
- |
|
|
Capital redemption reserve |
20 |
44 |
25 |
44 |
25 |
|
|
Capital contribution reserve |
20 |
72 |
72 |
- |
- |
|
|
Retained earnings |
20 |
157,703 |
82,839 |
7,142 |
11,539 |
|
|
SHAREHOLDERS' FUNDS - EQUITY |
20 |
£326,410 |
£229,171 |
£328,468 |
£233,355 |
|
|
Net asset value per share - undiluted (pence) |
10 |
890.0p |
629.0p |
891.6p |
627.1p |
|
|
Net asset value per share - diluted (pence) |
10 |
847.3p |
626.9p |
847.5p |
627.1p |
|
The Financial Statements were approved by the Board of Directors and authorised for issue on 9th June 2025
and signed on its behalf by:
B.P. Marsh & F.L. Chappell
CONSOLIDATED STATEMENT OF CASH FLOWS
FOR THE YEAR ENDED 31ST JANUARY 2025
|
Notes |
2025 |
2024 |
|||
|
£'000 |
£'000 |
||||
|
Cash from operating activities |
|||||
|
Income from loans to investee companies |
2,342 |
1,861 |
|||
|
Dividends |
3,910 |
3,504 |
|||
|
Fees received |
1,524 |
2,103 |
|||
|
Operating expenses |
(13,672) |
(7,881) |
|||
|
Net corporation tax payable |
9 |
(34) |
(33) |
||
|
Purchase of equity investments |
12 |
(31,501) |
(3,364) |
||
|
Net proceeds from sale of equity investments |
12,14 |
65,738 |
53,117 |
||
|
Net loan repayments from / (payments to) investee companies |
3,466 |
(17,630) |
|||
|
Adjustment for non-cash share incentive and share option plans |
413 |
186 |
|||
|
Exchange movement |
(118) |
(53) |
|||
|
Decrease / (increase) in receivables |
838 |
(1,052) |
|||
|
Increase in payables |
381 |
13 |
|||
|
Depreciation and amortisation |
11,21 |
200 |
191 |
||
|
Net cash from operating activities |
33,487 |
30,962 |
|||
|
Net cash from investing activities |
|||||
|
Purchase of property, plant and equipment |
11 |
(54) |
(13) |
||
|
Purchase of treasury investments net of cash and cash equivalents |
- |
- |
|||
|
Net proceeds from the sale of treasury investments |
79 |
1,130 |
|||
|
Net cash from investing activities |
25 |
1,117 |
|||
|
Net cash from / (used by) financing activities |
|||||
|
Financial income |
4 |
3,184 |
87 |
||
|
Financial expenses |
3 |
(137) |
(39) |
||
|
Net decrease in lease liabilities |
21 |
(184) |
(175) |
||
|
Dividends paid |
7 |
(3,964) |
(2,028) |
||
|
Payments made to repurchase company shares |
10 |
(835) |
(1,053) |
||
|
Cash received in respect of JSOP shares sold |
10,24 |
2,126 |
- |
||
|
Net cash from / (used by) financing activities |
190 |
(3,208) |
|||
|
Change in cash and cash equivalents |
33,702 |
28,871 |
|||
|
Cash and cash equivalents at beginning of the year |
40,435 |
11,564 |
|||
|
Cash and cash equivalents at end of year |
13 |
£74,137 |
£40,435 |
||
All differences between the amounts stated in the Consolidated Statement of Cash Flows and the Consolidated Statement of Comprehensive Income are attributed to non-cash movements.
PARENT COMPANY STATEMENT OF CASH FLOWS
FOR THE YEAR ENDED 31ST JANUARY 2025
|
Notes |
2025 |
2024 |
|||
|
£'000 |
£'000 |
||||
|
Cash from operating activities |
|||||
|
Dividends received from subsidiary undertakings |
- |
10,003 |
|||
|
Net cash from operating activities |
- |
10,003 |
|||
|
Net cash used by financing activities |
|||||
|
Decrease / (increase) in amounts owed by group undertakings |
2,260 |
(7,109) |
|||
|
Adjustment relating to non-cash items |
413 |
186 |
|||
|
Dividends paid |
7 |
(3,964) |
(2,028) |
||
|
Payments made to repurchase company shares |
10 |
(835) |
(1,053) |
||
|
Cash received in respect of JSOP shares sold |
24 |
2,126 |
- |
||
|
Net cash used by financing activities |
- |
(10,004) |
|||
|
Change in cash and cash equivalents |
- |
(1) |
|||
|
Cash and cash equivalents at beginning of the year |
7 |
8 |
|||
|
Cash and cash equivalents at end of year |
£ 7 |
£ 7 |
|||
CONSOLIDATED AND PARENT COMPANY STATEMENTS OF CHANGES IN EQUITY
FOR THE YEAR ENDED 31ST JANUARY 2025
|
Group |
Company |
|||
|
2025 |
2024 |
2025 |
2024 |
|
|
£'000 |
£'000 |
£'000 |
£'000 |
|
|
Opening total equity |
229,171 |
189,537 |
233,355 |
193,721 |
|
Comprehensive income for the year |
99,499 |
42,529 |
99,499 |
42,529 |
|
Dividends paid |
(3,964) |
(2,028) |
(3,964) |
(2,028) |
|
Repurchase of company shares |
(835) |
(1,053) |
(835) |
(1,053) |
|
Share incentive and share option plan |
413 |
186 |
413 |
186 |
|
Amounts received from the Employee Benefit Trust on the sale of shares held under joint ownership |
2,126 |
- |
- |
- |
|
TOTAL EQUITY |
£326,410 |
£229,171 |
£328,468 |
£233,355 |
Refer to Note 20 for detailed analysis of the changes in the components of equity.
NOTES TO THE CONSOLIDATED FINANCIAL STATEMENTS
FOR THE YEAR ENDED 31ST JANUARY 2025
1. ACCOUNTING POLICIES
B.P. Marsh & Partners Plc is a public limited company incorporated in England and Wales under the Companies Act 2006 and domiciled in the United Kingdom. The address of the Company's registered office is 5th Floor, 4 Matthew Parker Street, London SW1H 9NP. The consolidated financial statements for the year ended 31st January 2025 comprise the financial statements of the Parent Company and its consolidated subsidiaries (collectively "the Group").
Basis of preparation of financial statements
These consolidated financial statements have been prepared in accordance with UK-adopted international accounting standards, and in accordance with the Companies Act 2006.
The consolidated financial statements are presented in sterling, the functional currency of the Group, rounded to the nearest thousand pounds (£'000) except where otherwise indicated.
The preparation of financial statements in conformity with UK-adopted international accounting standards requires management to make judgments, estimates and assumptions that affect the application of policies and reported amounts of assets and liabilities, income and expenses. The estimates and associated assumptions are based on historical experience and various other factors that are believed to be reasonable in the circumstances, the results of which form the basis of judgements about the carrying amounts of assets and liabilities. Actual results may differ from those amounts.
In the process of applying the Group's accounting policies, management has made the following judgments, which have the most significant effect on the amounts recognised in the financial statements:
Assessment as an investment entity
Entities that meet the definition of an investment entity within IFRS 10: Consolidated Financial Statements ("IFRS 10") are required to account for their investments in controlled entities, as well as investments in associates at fair value through profit or loss. Subsidiaries that provide investment related services or engage in permitted investment related activities with investees that relate to the parent investment entity's investment activities continue to be consolidated in the Group results. The criteria which define an investment entity are currently as follows:
a) an entity that obtains funds from one or more investors for the purpose of providing those investors with investment services;
b) an entity that commits to its investors that its business purpose is to invest funds solely for returns from capital appreciation, investment income or both; and
c) an entity that measures and evaluates the performance of substantially all of its investments on a fair value basis.
The Group's annual and interim consolidated financial statements clearly state its objective of investing directly into portfolio investments and providing investment management services to investors for the purpose of generating returns in the form of investment income and capital appreciation. The Group has always reported its investment in portfolio investments at fair value. It also produces reports for investors of the funds it manages and its internal management report on a fair value basis. The exit strategy for all investments held by the Group is assessed, initially, at the time of the first investment and this is documented in the investment paper submitted to the Board for approval.
The Board has also concluded that the Company meets the additional characteristics of an investment entity, in that it has more than one investment; the investments are predominantly in the form of equities and similar securities; it has more than one investor and its investors are not related parties. The Board has concluded that B.P. Marsh & Partners Plc and its three trading subsidiaries, B.P. Marsh & Company Limited, B.P. Marsh (North America) Limited and B.P. Marsh Europe Limited, which provide investment related services on behalf of B.P. Marsh & Partners Plc, all meet the definition of an investment entity. These conclusions will be reassessed on an annual basis for changes to any of these criteria or characteristics.
Application and significant judgments
When it is established that a parent company is an investment entity, its subsidiaries are measured at fair value through profit or loss. However, if an investment entity has subsidiaries that provide services that relate to the investment entity's investment activities, the exception to the Amendment of IFRS 10 is not applicable as in this case, the parent investment entity still consolidates the results of its subsidiaries. Therefore, the results of B.P. Marsh & Company Limited, B.P. Marsh (North America) Limited and B.P. Marsh Europe Limited are consolidated into its Group financial statements for the year.
The most significant estimates relate to the fair valuation of the equity investment portfolio as detailed in Note 12 to the Financial Statements. The valuation methodology for the investment portfolio is detailed below. The estimates and underlying assumptions are reviewed on an ongoing basis. Revisions to accounting estimates are recognised in the period in which the estimate is revised if the revision affects only that period or in the period of the revision and future periods if the revision affects both current and future periods.
The accounting policies set out below have been applied consistently to all periods presented in these consolidated financial statements.
New Accounting Standards
There are no new standards that have been issued, but are not yet effective for the year ended 31st January 2025, which might have a material impact on the Group's financial statements in future periods.
Basis of consolidation
(i) Subsidiaries
Subsidiaries are entities controlled by the Group. Control, as defined by IFRS 10, is achieved when the Group is exposed, or has rights, to variable returns from its involvement with the investee and has the ability to affect those returns through its power over the investee. Specifically, the Group controls an investee if and only if the Group has:
a) power over the investee (i.e. existing rights that give it the current ability to direct the relevant activities of the investee);
b) exposure, or rights, to variable returns from its involvement with the investee; and
c) the ability to use its power over the investee to affect its returns.
When the Group has less than a majority of the voting or similar rights of an investee, the Group considers all relevant facts and circumstances in assessing whether it has power over an investee, including:
a) rights arising from other contractual arrangements; and
b) the Group's voting rights and potential voting rights.
The Group re-assesses whether or not it controls an investee if facts and circumstances indicate that there are changes to one or more of the elements of control.
B.P. Marsh & Partners Plc ("the Company"), an investment entity, has three subsidiary investment entities, B.P. Marsh & Company Limited, B.P. Marsh (North America) Limited and B.P. Marsh Europe Limited, that provide services that relate to the Company's investment activities. The results of these three subsidiaries, together with other subsidiaries (except for LEBC Holdings Limited ("LEBC")), are consolidated into the Group consolidated financial statements. The Group has taken advantage of the Amendment to IFRS 10 not to consolidate the results of LEBC. Instead, the investment in LEBC is valued at fair value through profit or loss.
(ii) Associates
Associates are those entities in which the Group has significant influence, but not control, over the financial and operating policies. Investments that are held as part of the Group's investment portfolio are carried in the Consolidated Statement of Financial Position at fair value even though the Group may have significant influence over those companies.
Business combinations
The results of subsidiary undertakings are included in the consolidated financial statements from the date that control commences until the date that control ceases. Control exists where the Group has the power to govern the financial and operating policies of the entity so as to obtain benefits from its activities. Accounting policies of the subsidiaries have been changed where necessary to ensure consistency with the policies adopted by the Group.
All business combinations are accounted for by using the acquisition accounting method. This involves recognising identifiable assets and liabilities of the acquired business at fair value. Goodwill represents the excess of the fair value of the purchase consideration for the interests in subsidiary undertakings over the fair value to the Group of the net assets and any contingent liabilities acquired. The one exception to the use of the acquisition accounting method was in 2006 when B.P. Marsh & Partners Plc became the legal parent company of B.P. Marsh & Company Limited in a share for share exchange transaction. This was accounted for as a reverse acquisition, such that no goodwill arose, and a merger reserve was created reflecting the difference between the book value of the shares issued by B.P. Marsh & Partners Plc as consideration for the acquisition of the share capital of B.P. Marsh & Company Limited. This compliance with IFRS 3: Business Combinations ("IFRS 3") also represented a departure from the Companies Act.
Intra-group balances and any unrealised gains and losses or income and expenses arising from intra-group transactions are eliminated in preparing the consolidated financial statements.
Associates are those entities in which the Group has significant influence, but not control, over the financial and operating policies. Investments that are held as part of the Group's investment portfolio are carried in the Consolidated Statement of Financial Position at fair value even though the Group may have significant influence over those companies. This treatment is permitted by IAS 28: Investment in Associates ("IAS 28"), which requires investments held by venture capital organisations to be excluded from its scope where those investments are designated, upon initial recognition, as at fair value through profit or loss and accounted for in accordance with IAS 39: Financial Instruments ("IAS 39"), with changes in fair value recognised in the profit or loss in the period of the change. The Group has no interests in associates through which it carries on its business.
No Statement of Comprehensive Income is prepared for the Company, as permitted by Section 408 of the Companies Act 2006. The Company made a profit for the year of £99,498,802, prior to a dividend distribution of £3,963,981 (2024: profit of £42,529,132 prior to a dividend distribution of £2,028,206).
Employee services settled in equity instruments
The Group has entered into a joint share ownership plan ("JSOP") with certain employees and directors.
On 12th June 2021 (the "vesting date") the performance criteria was met for 1,206,888 of 1,461,302 shares held under joint share ownership arrangements within the Employee Benefit Trust, after which the members of the scheme became joint beneficial owners of the shares and became entitled to any gain on sale of the shares in excess of 312.6 pence per share.
On 26th October 2023 following the removal of a dividend waiver and block on voting rights on the 1,206,888 allocated ordinary shares held by the Employee Benefit Trust, these ordinary shares became eligible for dividend and voting rights and therefore became fully dilutive for the Group.
236,259 ordinary shares held within the Employee Benefit Trust are unallocated and do not have voting or dividend rights. The Employee Benefit Trust remains the owner of these unallocated shares, however if these shares are sold from the Employee Benefit Trust in the future they would then, post-sale, have voting and dividend rights attached, such that they would become fully dilutive for the Group.
Provided that the shares are eventually sold from the Employee Benefit Trust for at least 284.5 pence per share on average, the Group would be entitled to receive £4,106,259 in total.
The Group has established an HMRC approved Share Incentive Plan ("SIP"). Ordinary shares in the Company, previously repurchased and held in Treasury by the Company, have been transferred to The B.P. Marsh SIP Trust ("the SIP Trust"), an employee share trust, in order to be issued to eligible employees.
Under the rules of the SIP, eligible employees can each be granted up to £3,600 worth of ordinary shares ("Free Shares") by the SIP Trust in each tax year. The number of shares granted is dependent on the share price at the date of grant. In addition, all eligible employees have been invited to take up the opportunity to acquire up to £1,800 worth of ordinary shares ("Partnership Shares") in each tax year and for every Partnership Share that an employee acquires, the SIP Trust will offer two ordinary shares in the Company ("Matching Shares") up to a total of £3,600 worth of shares. The Free and Matching Shares are subject to a one year forfeiture period, however the awards are not subject to any vesting conditions, hence the related expenses are recognised when the awards are made and are apportioned over the forfeiture period.
The fair value of the services received is measured by reference to the listed share price of the Parent Company's shares listed on the AIM on the date of award of the free and matching shares to the employee.
The Group has also established a Share Option Plan ("SOP") for certain employees and directors. Share Options ("Options") over 1,682,500 ordinary shares of 10p each in the Company, in aggregate, have been granted. 3,470 Options of the total 1,685,970 available for allocation are unallocated.
Each of the Options will vest, on a ratchet basis, subject to certain Net Asset Value growth targets being achieved for the three consecutive financial years ending 31st January 2024, 31st January 2025 and 31st January 2026 (the "Performance Period"). The first exercise date is 6th September 2026 whereby 50% of vested Options will be exercisable at 10p per share, with the remaining 50% exercisable at 10p per share from 6th September 2027.
The number of Options which vest will vary depending on the level of Net Asset Value growth achieved, subject to the growth performance criteria as set out below, alongside the percentage of Options that will vest at each value:
|
Compounded annual growth of Net Asset Value over the Performance Period |
% vesting of Options |
|
Less than 8.5% |
0% |
|
Between 8.5% and less than 9.25% |
25% |
|
Between 9.25% and less than 10% |
50% |
|
10% or above |
100% |
For these purposes, Net Asset Value is defined as "audited Total Assets less Total Liabilities for the consolidated Group plus any dividends or other form of shareholder return that are paid in the relevant Financial Year".
Therefore, for all Options to vest, the Net Asset Value (as defined above) would need to exceed £252.2m, adjusted for any shareholder distributions.
Investments - equity portfolio
All equity portfolio investments are designated as "fair value through profit or loss" assets and are initially recognised at the fair value of the consideration. They are measured at subsequent reporting dates at fair value.
The Board conducts the valuations of equity portfolio investments. In valuing equity portfolio investments, the Board applies guidelines issued by the International Private Equity and Venture Capital Valuation Committee ("IPEVCV Guidelines"). The following valuation methodologies have been used in reaching the fair value of equity portfolio investments, some of which are in early stage companies:
a) at cost, unless there has been a significant round of new equity finance in which case the investment is valued at the price paid by an independent third party. Where subsequent events or changes to circumstances indicate that an impairment may have occurred, the carrying value is reduced to reflect the estimated extent of impairment;
b) by reference to underlying funds under management;
c) by applying appropriate multiples to the earnings and revenues and/or premiums of the investee company; or
d) by reference to expected future cash flow from the investment where a realisation or flotation is imminent.
Both realised and unrealised gains and losses arising from changes in fair value are taken to the Consolidated Statement of Comprehensive Income for the year. In the Consolidated Statement of Financial Position the unrealised gains and losses arising from changes in fair value are shown within a "fair value reserve" separate from retained earnings. Transaction costs on acquisition or disposal of equity portfolio investments are expensed in the Consolidated Statement of Comprehensive Income.
Equity portfolio investments are treated as 'Non-current Assets' within the Consolidated Statement of Financial Position unless the directors have committed to a plan to sell the investment and an active programme to locate a buyer and complete the plan has been initiated. Where such a commitment exists, and if the carrying amount of the equity portfolio investment will be recovered principally through a sale transaction rather than through continuing use, the investment is classified as an 'Investments - Assets held for sale' under 'Current Assets' within the Consolidated Statement of Financial Position.
Income from equity portfolio investments
Income from equity portfolio investments comprises:
a) gross interest from loans, which is taken to the Consolidated Statement of Comprehensive Income on an accruals basis;
b) dividends from equity investments are recognised in the Consolidated Statement of Comprehensive Income when the shareholders rights to receive payment have been established; and
c) advisory fees from management services provided to investee companies, which are recognised on an accruals basis in accordance with the substance of the relevant investment advisory agreement.
Investments - treasury portfolio
All treasury portfolio investments are designated as "fair value through profit or loss" assets and are initially recognised at the fair value of the consideration. They are measured at subsequent reporting dates at fair market value as determined from the valuation reports provided by the fund investment manager. Where appropriate, these investments are included within "cash and cash equivalents".
Both realised and unrealised gains and losses arising from changes in fair market value are taken to the Consolidated Statement of Comprehensive Income for the period. In the Consolidated Statement of Financial Position the unrealised gains and losses arising from changes in fair value are shown within the retained earnings as these investments are deemed as being easily convertible into cash. Costs associated with the management of these investments are expensed in the Consolidated Statement of Comprehensive Income.
Income from treasury portfolio investments
Income from treasury portfolio investments comprises of dividends receivable which are either directly reinvested into the funds or received as cash.
Property, plant and equipment
Property, plant and equipment are stated at cost less depreciation. Depreciation is provided at rates calculated to write off the property, plant and equipment cost less their estimated residual value, over their expected useful lives on the following bases:
Furniture & equipment - 5 years
Leasehold fixtures and fittings and other costs - over the life of the lease
Right-of-use asset
IFRS 16 requires lessees to recognise a lease liability, representing the present value of the obligation to make lease payments, and a related right of use ("ROU") asset. The lease liability is calculated based on expected future lease payments, discounted using the relevant incremental borrowing rate. An incremental borrowing rate of 5% was used to discount the future lease payments when measuring the lease liability on adoption of IFRS 16.
The ROU asset is recognised at cost less accumulated depreciation and impairment losses, with depreciation charged on a straight-line basis over the life of the lease. In determining the value of the ROU asset and lease liabilities, the Group considers whether any leases contain lease extensions or termination options that the Group is reasonably certain to exercise.
Foreign currencies
Monetary assets and liabilities denominated in foreign currencies at the reporting period end are translated at the exchange rate ruling at the reporting period end.
Transactions in foreign currencies are translated into sterling at the foreign exchange rate ruling at the date of the transaction.
Exchange gains and losses are recognised in the Consolidated Statement of Comprehensive Income.
Income taxes
The tax credit or expense represents the sum of the tax currently recoverable or payable and any deferred tax. The tax currently recoverable or payable is based on the estimated taxable profit for the year. Taxable profit differs from net profit as reported in the Consolidated Statement of Comprehensive Income because it excludes items of income or expense that are taxable or deductible in other years and it further excludes items that are never taxable or deductible. The Group's receivable or liability for current tax is calculated using tax rates that have been enacted or substantively enacted by the date of the Consolidated Statement of Financial Position.
Deferred tax is the tax expected to be payable or recoverable on differences between the carrying amounts of assets and of liabilities in the financial statements and the corresponding tax bases used in the computation of taxable profit, and it is accounted for using the liability method. Deferred tax liabilities are generally recognised for all taxable temporary differences and deferred tax assets are recognised to the extent that it is probable that taxable profits will be available against which deductible temporary differences can be utilised. Such assets and liabilities are not recognised if the temporary differences arise from goodwill or from the initial recognition (other than in a business combination) of other assets and liabilities in a transaction that affects neither the taxable profit nor the accounting profit.
Deferred tax liabilities are recognised for taxable temporary differences arising on investments in subsidiaries, except where the Group is able to control the reversal of the temporary difference and it is probable that the temporary difference will not reverse in the foreseeable future.
The carrying amount of deferred tax assets is reviewed at each date of the Consolidated Statement of Financial Position and reduced to the extent that it is no longer probable that sufficient taxable profits will be available to allow all or part of the asset to be recovered.
Deferred tax is calculated at the tax rates that are expected to apply in the period when the liability is settled or the asset realised. Deferred tax is charged or credited to the Consolidated Statement of Comprehensive Income, except when it relates to items charged or credited directly to equity, in which case the deferred tax is also dealt with in equity.
Deferred tax assets and liabilities are offset when there is a legally enforceable right to set off current tax assets against current tax liabilities and when they relate to income taxes levied by the same taxation authority and the Group intends to settle its current assets and liabilities on a net basis.
Pension costs
The Group operates a defined contribution scheme for some of its employees. The contributions payable to the scheme during the period are charged to the Consolidated Statement of Comprehensive Income.
Financial assets and liabilities
Financial instruments are recognised in the Consolidated Statement of Financial Position when the Group becomes party to the contractual provisions of the instrument. De-recognition occurs when rights to cash flows from a financial asset expire, or when a liability is extinguished.
Loans and receivables
Loans and receivables are non-derivative financial assets with fixed or determinable payments that are not quoted in an active market. They are included in current assets, except for maturities greater than 12 months after the reporting period which are classified as non-current assets. They are stated at their cost less impairment losses.
Loans and borrowings
All loans and borrowings are initially recognised at the fair value of the consideration received net of issue costs associated with the borrowings. After initial recognition, these are subsequently measured at
amortised cost using the effective interest method, which is the rate that exactly discounts the estimated future cash flows through the expected life of the liabilities. Amortised cost is calculated by taking into account any issue costs and any discount or premium on settlement.
Trade and other receivables
Trade and other receivables in the Consolidated Statement of Financial Position are initially measured at original invoice amount and subsequently measured after deducting any provision for impairment.
Cash and cash equivalents
Cash and cash equivalents in the Consolidated Statement of Financial Position comprise cash at bank and in hand and short-term deposits with an original maturity of three months or less. For the purposes of the Consolidated Statement of Cash Flows, cash and cash equivalents comprise cash and short-term deposits as defined above and other short-term highly liquid investments that are readily convertible into cash and are subject to insignificant risk of changes in value, net of bank overdrafts.
Trade and other payables
Trade and other payables are stated based on the amounts which are considered to be payable in respect of goods or services received up to the date of the Consolidated Statement of Financial Position.
2. SEGMENTAL REPORTING
The Group operates in one business segment, provision of consultancy services to, as well as making and trading investments in, financial services businesses.
Under IFRS 8: Operating Segments ("IFRS 8") the Group identifies its reportable operating segments based on the geographical location in which each of its investments is incorporated and primarily operates. For management purposes, the Group is organised and reports its performance by two geographic segments: UK and Non-UK.
If material to the Group overall (where the segment revenues, reported profit or loss or combined assets exceed the quantitative thresholds prescribed by IFRS 8), the segment information is reported separately.
The Group allocates revenues, expenses, assets and liabilities to the operating segment where directly attributable to that segment. All indirect items are apportioned based on the percentage proportion of revenue that the operating segment contributes to the total Group revenue (excluding any realised and unrealised gains and losses on the Group's current and non-current investments).
Each reportable segment derives its revenues from three main sources from equity portfolio investments as described in further detail in Note 1 under 'Income from equity portfolio investments' and also from treasury portfolio investments as described in Note 1 under 'Income from treasury portfolio investments'.
All reportable segments derive their revenues entirely from external clients and there are no inter-segment sales.
|
Geographic segment 1: UK |
Geographic segment 2: Non-UK |
Group |
||||
|
2025 |
2024 |
2025 |
2024 |
2025 |
2024 |
|
|
£'000 |
£'000 |
£'000 |
£'000 |
£'000 |
£'000 |
|
|
Operating income |
82,855 |
45,345 |
32,384 |
5,821 |
115,239 |
51,166 |
|
Operating expenses |
(7,826) |
(4,356) |
(5,846) |
(3,525) |
(13,672) |
(7,881) |
|
Segment operating profit |
75,029 |
40,989 |
26,538 |
2,296 |
101,567 |
43,285 |
|
Financial income |
1,822 |
399 |
1,362 |
322 |
3,184 |
721 |
|
Financial expenses |
(79) |
(31) |
(58) |
(24) |
(137) |
(55) |
|
Exchange movements |
(18) |
(39) |
97 |
(294) |
79 |
(333) |
|
Profit before tax |
76,754 |
41,318 |
27,939 |
2,300 |
104,693 |
43,618 |
|
Income taxes |
- |
- |
(5,194) |
(1,089) |
(5,194) |
(1,089) |
|
Profit for the year |
£76,754 |
£41,318 |
£22,745 |
£1,211 |
£99,499 |
£42,529 |
Included within the operating income reported above are the following amounts requiring separate disclosure owing to the fact that they are derived from a single investee company and the total revenues attributable to that investee company are 10% or more of the total realised and unrealised income generated by the Group during the period:
|
Investee Company |
Total net operating income attributable to the investee company £'000 |
% of total realised and unrealised operating income |
Reportable geographic segment |
|||
|
2025 |
2024 |
2025 |
2024 |
2025 |
2024 |
|
|
Pantheon Specialty Group Limited |
56,224 |
14,955 |
49 |
29 |
1 |
1 |
|
XPT Group LLC1 |
16,135 |
- |
14 |
- |
2 |
- |
|
ATC Insurance Solutions PTY Limited1 |
12,984 |
- |
11 |
- |
2 |
- |
|
Paladin Holdings Limited1 |
- |
32,382 |
- |
63 |
- |
1 |
|
Lilley Plummer Holdings Limited1 |
- |
6,888 |
- |
13 |
- |
1 |
1There are no disclosures for Paladin Holdings Limited and Lilley Plummer Holdings Limited in the current year as the income derived from these investee companies did not exceed the 10% threshold prescribed by IFRS 8. There is also no disclosure shown for XPT Group LLC and ATC Insurance Solutions PTY Limited in the prior year as the income derived from these investee companies did not exceed the 10% threshold prescribed by IFRS 8 in that year.
|
Geographic segment 1: UK |
Geographic segment 2: Non-UK |
Group |
||||||||||
|
2025 |
2024 |
2025 |
2024 |
2025 |
2024 |
|||||||
|
£'000 |
£'000 |
£'000 |
£'000 |
£'000 |
£'000 |
|||||||
|
Non-current assets |
||||||||||||
|
Property, plant and equipment |
41 |
34 |
43 |
31 |
84 |
65 |
||||||
|
Right-of-use asset |
166 |
268 |
176 |
239 |
342 |
507 |
||||||
|
Investments - equity portfolio |
108,835 |
37,783 |
115,260 |
78,050 |
224,095 |
115,833 |
||||||
|
Loans and receivables |
13,239 |
10,775 |
9,384 |
5,422 |
22,623 |
16,197 |
||||||
|
122,281 |
48,860 |
124,863 |
83,742 |
247,144 |
132,602 |
|||||||
|
Current assets |
||||||||||||
|
Investments - assets held for sale |
- |
49,549 |
- |
- |
- |
49,549 |
||||||
|
Investments - treasury portfolio |
- |
78 |
- |
- |
- |
78 |
||||||
|
Trade and other receivables |
17,294 |
14,840 |
2,309 |
793 |
19,603 |
15,633 |
||||||
|
Cash and cash equivalents |
74,137 |
40,435 |
- |
- |
74,137 |
40,435 |
||||||
|
91,431 |
104,902 |
2,309 |
793 |
93,740 |
105,695 |
|||||||
|
Total assets |
213,712 |
153,762 |
127,172 |
84,535 |
340,884 |
238,297 |
||||||
|
Non-current liabilities |
||||||||||||
|
Lease liabilities |
(106) |
(220) |
(112) |
(196) |
(218) |
(416) |
||||||
|
Deferred tax liabilities |
- |
- |
(11,847) |
(6,687) |
(11,847) |
(6,687) |
||||||
|
(106) |
(220) |
(11,959) |
(6,883) |
(12,065) |
(7,103) |
|||||||
|
Current liabilities |
||||||||||||
|
Trade and other payables |
(2,210) |
(1,838) |
(5) |
(5) |
(2,215) |
(1,843) |
||||||
|
Lease liabilities |
(94) |
(95) |
(100) |
(85) |
(194) |
(180) |
||||||
|
(2,304) |
(1,933) |
(105) |
(90) |
(2,409) |
(2,023) |
|||||||
|
Total liabilities |
(2,410) |
(2,153) |
(12,064) |
(6,973) |
(14,474) |
(9,126) |
||||||
|
Net assets |
£211,302 |
£151,609 |
£115,108 |
£77,562 |
£326,410 |
£229,171 |
||||||
|
Additions to property, plant and equipment |
26 |
7 |
28 |
6 |
54 |
13 |
||||||
|
Depreciation and amortisation of property, plant and equipment |
(97) |
(101) |
(103) |
(90) |
(200) |
(191) |
||||||
|
Net provision (made) / released against equity investments and loans |
(36) |
24 |
- |
- |
(36) |
24 |
||||||
|
Cash flow arising from: |
||||||||||||
|
Operating activities |
49,488 |
37,534 |
(16,001) |
(6,572) |
33,487 |
30,962 |
||||||
|
Investing activities |
25 |
1,117 |
- |
- |
25 |
1,117 |
||||||
|
Financing activities |
190 |
(3,208) |
- |
- |
190 |
(3,208) |
||||||
|
Change in cash and cash equivalents |
49,703 |
35,443 |
(16,001) |
(6,572) |
33,702 |
28,871 |
||||||
As outlined previously, under IFRS 8 the Group reports its operating segments (UK and Non-UK) and associated income, expenses, assets and liabilities based upon the country of domicile of each of its investee companies.
In addition to the segmental analysis disclosure reported above, the Group has undertaken a further assessment of each of its investee companies' underlying revenues, specifically focusing on the geographical origin of this revenue. Geographical analysis of each investee company's 2025 and 2024 revenue budgets was carried out and, based upon this analysis, the directors have determined that on a look-through basis, the Group's portfolio of investee companies can also be analysed as follows:
|
2025 |
2024 |
|
|
% |
% |
|
|
UK |
6 |
29 |
|
Non-UK |
94 |
71 |
|
Total |
100 |
100 |
|
3. FINANCIAL EXPENSES |
2025 |
2024 |
|
£'000 |
£'000 |
|
|
Interest costs on lease liability (Note 21) |
30 |
39 |
|
Investment management costs (Note 13) |
107 |
16 |
|
£ 137 |
£ 55 |
|
|
4. FINANCIAL INCOME |
2025 |
2024 |
|
£'000 |
£'000 |
|
|
Bank and similar interest |
709 |
87 |
|
Income from treasury portfolio investments - interest, dividend and similar income (Note 13) |
1,996 |
467 |
|
Income from treasury portfolio investments - net unrealised gains on revaluation (Note 13) |
479 |
167 |
|
£ 3,184 |
£ 721 |
|
5. STAFF COSTS
The average number of employees, including all directors (executive and non-executive), employed by the Group during the year was 17 (2024: 16); 6 of those are in a management role (2024: 6) and 11 of those are in a support role (2024: 10). All remuneration was paid by B.P. Marsh & Company Limited.
|
The related staff costs were: |
2025 |
2024 |
|
£'000 |
£'000 |
|
|
Wages and salaries |
9,114 |
5,145 |
|
Social security costs |
1,321 |
746 |
|
Pension costs |
277 |
192 |
|
Other employment costs (Note 24) |
392 |
167 |
|
£11,104 |
£6,250 |
|
During the year to 31st January 2017 the Group established a Share Incentive Plan ("SIP") under which certain eligible directors and employees were granted Ordinary shares in the Company. These shares are being held on behalf of these directors and employees within the B.P. Marsh SIP Trust. Refer to Note 24 for further details.
During the year to 31st January 2019, Joint Share Ownership Agreements were also entered into between certain directors and employees and the Company. Refer to Note 24 for further details.
During the year to 31st January 2024 the Group established a Share Option Plan ("SOP") under which certain directors and employees were granted options over Ordinary shares in the Company. Refer to Note 24 for further details.
Share-based charges of £85,780 (2024: £77,492) relating to the SIP and £305,924 (2024: £89,437) relating to the SOP are included within 'Other employment costs' above. No charges relating to the Joint Share Ownership Agreements are included within 'Other employment costs' above as the scheme vested during the year to 31st January 2022.
6. DIRECTORS' EMOLUMENTS
|
2025 |
2024 |
|
|
The aggregate emoluments of the directors were: |
£'000 |
£'000 |
|
Management services - remuneration |
4,924 |
2,933 |
|
Fees |
53 |
30 |
|
Pension contributions - remuneration |
101 |
67 |
|
£ 5,078 |
£ 3,030 |
474,484 of the 1,461,302 shares, in respect of which joint interests were granted during the year to 31st January 2019, were issued to current directors. During the year 261,750 of the 474,484 jointly-owned shares in which the current directors have a joint beneficial interest were sold, with 212,734 jointly-owned shares remaining held by those directors as at 31st January 2025. Refer to Note 24 for further details.
Of the total 22,380 (2024: 32,780) Free, Matching and Partnership Shares granted under the SIP during the year, 5,595 (2024: 8,940) were granted to directors of the Company.
Of the £85,780 (2024: £77,492) charge relating to the SIP and £305,924 (2024: £89,437) charge relating to the SOP, as set out in Note 5, £28,593 (2024: £21,134) and £148,643 (2024: £36,147) related to the directors respectively.
Refer to Note 24 for further details.
|
2025 |
2024 |
|
|
£'000 |
£'000 |
|
|
Highest paid director |
||
|
Emoluments |
1,640 |
1,451 |
|
Pension contribution |
41 |
7 |
|
£ 1,681 |
£ 1,458 |
The total emoluments of the highest paid director disclosed above includes £500,000 paid to the director in respect of loss of office.
The Company contributes into defined contribution pension schemes on behalf of certain employees and directors. Contributions payable are charged to the Consolidated Statement of Comprehensive Income in the period to which they relate.
During the year, 4 directors (2024: 3) accrued benefits under these defined contribution pension schemes.
The key management personnel comprise only the directors.
|
7. DIVIDENDS |
2025 |
2024 |
|
£'000 |
£'000 |
|
|
Ordinary dividends |
||
|
Dividend paid: |
||
|
10.72 pence each on 36,977,431* Ordinary shares (2024: 5.56 pence each on 36,478,524* Ordinary shares) |
3,964 |
2,028 |
|
£ 3,964 |
£ 2,028 |
|
*Due to the Company making three separate dividend payments during the current year (2024: three dividend payments made), the calculation of the number of ordinary shares on which the dividend was paid is an average based upon the total aggregate dividend distribution made divided by the total pence per ordinary share distributed during the year.
In the current year total dividends of £26,902 (2024: £13,304) were payable on the 261,852 (2024: 247,476) ordinary shares held by the B.P. Marsh SIP Trust ("SIP Trust").
In the current year total dividends of £94,692 (2024: £33,551) were payable on the 844,006 allocated ordinary shares held by the B.P. Marsh Employees' Share Trust ("the Employee Benefit Trust") under the Joint Share Ownership Plan ("JSOP") which had full dividend and voting rights. Of this total dividend paid on the shares, £35,083 was paid to participants of the JSOP based upon the employees' proportionate ownership rights attached to the shares which is determined by the Company's share price on the record date. No dividend was payable on the 236,259 unallocated ordinary shares held by the Employee Benefit Trust as these shares do not have full dividend and voting rights attached (2024: No dividend payable on the unallocated ordinary shares).
In addition, no dividend is payable on unallocated ordinary shares held in Treasury on the dividend record date.
|
8. PROFIT ON ORDINARY ACTIVITIES BEFORE TAXATION |
2025 |
2024 |
|
£'000 |
£'000 |
|
|
The profit for the year is arrived at after charging/(crediting): |
||
|
Depreciation and amortisation of property, plant & equipment, and right-of-use asset |
200 |
191 |
|
Auditor's remuneration: |
||
|
Audit fees for the Company |
49 |
37 |
|
Other services: |
||
|
-Audit of subsidiaries' accounts |
18 |
18 |
|
-Taxation |
18 |
14 |
|
-Other advisory |
12 |
14 |
|
Exchange (gain) / loss |
(79) |
333 |
|
9. INCOME TAX EXPENSE |
2025 |
2024 |
|
£'000 |
£'000 |
|
|
Current tax: |
||
|
Current tax on profits for the year |
34 |
33 |
|
Adjustments in respect of prior years |
- |
- |
|
Total current tax |
34 |
33 |
|
Deferred tax (Note 17): |
||
|
Origination and reversal of temporary differences |
5,160 |
1,056 |
|
Total deferred tax |
5,160 |
1,056 |
|
Total income taxes charged in the Consolidated Statement of Comprehensive Income |
£ 5,194 |
£ 1,089 |
The tax assessed for the year is lower (2024: lower) than the standard rate of corporation tax in the UK. The differences are explained below:
|
2025 |
2024 |
|
|
£'000 |
£'000 |
|
|
Profit before tax |
104,693 |
43,618 |
|
Profit on ordinary activities at the standard rate of corporation tax in the UK of 25.00% (2024: 24.00%) |
26,173 |
10,468 |
|
Tax effects of: |
||
|
Expenses not deductible for tax purposes |
355 |
132 |
|
Withholding tax suffered at source on overseas income |
34 |
33 |
|
(Non-taxable)/taxable capital gains on disposal of investments |
(4,323) |
31 |
|
Other effects: |
||
|
Non-taxable income (dividends received) |
(977) |
(841) |
|
Non-taxable income (unrealised gains on equity portfolio revaluation) |
(17,512) |
(9,475) |
|
Management expenses unutilised |
1,444 |
741 |
|
Total income taxes charged in the Consolidated Statement of Comprehensive Income |
£ 5,194 |
£ 1,089 |
Refer to Note 17 for the deferred tax liability relating to the Group's unrealised gains on the equity portfolio.
10. EARNINGS AND NET ASSET VALUE PER SHARE FROM CONTINUING OPERATIONS ATTRIBUTABLE TO THE EQUITY SHAREHOLDERS
|
2025 £'000 |
2024 £'000 |
|
|
Earnings |
||
|
Earnings for the purpose of basic and diluted earnings per share being total comprehensive income attributable to equity shareholders |
99,499 |
42,529 |
|
Earnings per share - basic |
269.5p |
114.7p |
|
Earnings per share - diluted |
256.2p |
114.0p |
|
Number of shares |
Number |
Number |
|
Weighted average number of ordinary shares for the purposes of basic earnings per share |
36,919,364 |
37,081,306 |
|
Number of dilutive shares under option |
1,918,759 |
236,259 |
|
Weighted average number of ordinary shares for the purposes of dilutive earnings per share |
38,838,123 |
37,317,565 |
|
2025 £'000 |
2024 £'000 |
|
|
Net Asset Value |
||
|
Basic Net Asset Value |
||
|
Net Asset Value attributable to equity shareholders |
326,410 |
229,171 |
|
Adjustment to Net Asset Value1 |
1,476 |
3,391 |
|
Adjusted Net Asset Value for the purposes of basic Net Asset Value per share being total Net Asset Value attributable to equity shareholders |
327,886 |
232,562 |
|
Diluted Net Asset Value |
||
|
Net Asset Value attributable to equity shareholders |
326,410 |
229,171 |
|
Adjustment to Net Asset Value2 |
1,980 |
4,106 |
|
Adjusted Net Asset Value for the purposes of diluted Net Asset Value per share being total Net Asset Value attributable to equity shareholders |
328,390 |
233,277 |
|
Net Asset Value per share - basic |
890.0p |
629.0p |
|
Net Asset Value per share - diluted |
847.3p |
626.9p |
|
Number of shares |
Number |
Number |
|
Number of ordinary shares for the purposes of basic Net Asset Value per share |
36,839,869 |
36,974,191 |
|
Number of dilutive shares under option |
1,918,759 |
236,259 |
|
Number of ordinary shares for the purposes of dilutive Net Asset Value per share |
38,758,628 |
37,210,450 |
1Adjustment to Net Asset Value represents the cash receivable by the Group when the 525,240 (2024: 1,206,888) remaining allocated ordinary shares that are held under joint ownership arrangements within the Employee Benefit Trust, and which were considered fully dilutive as at 31st January 2025, are sold.
2Adjustment to Net Asset Value represents the cash receivable by the Group when the total remaining 761,499 (2024: 1,443,147) allocated and unallocated ordinary shares that are held under joint ownership arrangements within the Employee Benefit Trust, are sold.
During the year the Company paid a total of £835,267 including commission, in order to repurchase 156,702 ordinary shares at an average price of 532 pence per share (2024: the Company paid a total of £1,052,751, including commission, in order to repurchase 283,480 ordinary shares at an average price of 370 pence per share).
On 31st October 2024 188,000 ordinary shares in the Company were cancelled. These shares were previously held in Treasury. Following the cancellation, the total number of ordinary shares in issue reduced from 37,288,000 as at 31st January 2024 to 37,100,000 as at 31st January 2025.
Ordinary shares held by the Company in Treasury
|
Movement of ordinary shares held in Treasury: |
||
|
2025 |
2024 |
|
|
Number |
Number |
|
|
Opening total ordinary shares held in Treasury at 1st February |
77,550 |
4,850 |
|
Ordinary shares repurchased into Treasury during the year |
156,702 |
283,480 |
|
Ordinary shares transferred to the B.P. Marsh SIP Trust during the year |
(22,380) |
(32,780) |
|
Ordinary shares cancelled from Treasury during the year |
(188,000) |
(178,000) |
|
Total ordinary shares held in Treasury at 31st January |
23,872 |
77,550 |
The Treasury shares do not have voting or dividend rights and have therefore been excluded for the purposes of calculating Earnings per share and Net Asset Value per share.
The repurchase of the ordinary shares is borne from the Group's commitment to reduce share price discount to Net Asset Value. Prior to 11th June 2024, and in accordance with its Share Buy-Back Policy announcement on 14th November 2023, the Group's policy was to buy back shares when the share price was below 20% of its published Net Asset Value (for up to a maximum aggregate consideration of £500,000).
As outlined in the Group's Share Buy-Back Policy announcement on 11th June 2024, its policy has been, subject to ordinary shares in the Company being available to purchase, to be able to buy small parcels of shares (for up to a maximum aggregate consideration of £1,000,000) at a price representing a discount of at least 15% to the most recently announced diluted Net Asset Value per share and place them into Treasury. On 2nd August 2024 this threshold was subsequently upwardly revised to a 10% discount to diluted Net Asset Value per Share.
On 31st October 2024 a further £1,000,000 was added to the Share Buy-Back programme (increasing the aggregate Share Buy-Back budget to £1,164,733 at that time) to allow the Company to continue purchasing small parcels of ordinary shares, where available, in a Net Asset Value accretive way.
As at 31st January 2024 there were 1,443,147 shares held within the Employee Benefit Trust under the Joint Share Ownership Plan ("JSOP"), of which 236,259 shares were unallocated. The Employee Benefit Trust remains the owner of these unallocated shares which have no dividend or voting rights.
Provided that the shares are eventually sold from the Employee Benefit Trust for at least 284.5 pence per share on average, the Group would be entitled to receive £4,106,259 in total.
During the year 681,648 of the 1,206,888 allocated shares held within the Employee Benefit Trust were sold, including 239,400 shares jointly-owned by 3 executive directors of the Company. As at 31st January 2025 761,499 shares remained within the Employee Benefit Trust, of which 236,259 were unallocated.
Of the £4,106,259 receivable by the Group in total, £2,126,259 was received during the year, leaving a balance outstanding of £1,980,000. As such, provided that the remaining shares are eventually sold from the Employee Benefit Trust for at least 260.0p/share on average, the Group will receive this balance in full.
The weighted average number of shares used for the purposes of calculating the basic earnings per share, net asset value and net asset value per share of the Group includes the 525,240 remaining allocated ordinary shares held within the Employee Benefit Trust as these were considered fully dilutive as at 31st January 2025 due to the dividend and voting rights attached to them. The Group net asset value also includes an adjustment representing the economic right the Group has to the first 281 pence per share (£1,475,924) on the 525,240 allocated ordinary shares held within the Employee Benefit Trust as when the joint share ownership arrangements are eventually exercised, this would also increase the Group's net asset value by £1,475,924.
236,259 unallocated shares currently held within the Employee Benefit Trust have been excluded for the purposes of calculating the basic earnings per share, net asset value and net asset value per share as these shares do not have voting rights or dividend rights whilst they are held within this Employee Benefit Trust. The Group net asset value has also excluded the economic right the Group has to the first 281 pence per share on the 236,259 unallocated shares issued to the Employee Benefit Trust for the same reasons.
On this basis the current undiluted net asset value per share is 890.0 pence for the Group. When the joint share ownership arrangements are eventually exercised in full, although this would increase the number of shares in issue entitled to voting and dividend rights, this would also increase the Group's net asset value by a further £504,076 (total of £4,106,259 based upon the total 1,461,302 shares originally issued to the Employee Benefit Trust at 281 pence per share).
The diluted earnings per share and net asset value per share include the 1,682,500 options over ordinary shares granted as part of the Company's Share Option Plan ("SOP") as these were dilutive for the Group as at 31st January 2025 based upon the performance conditions attached to the options (Note 24).
The diluted net asset value per share is therefore 847.3 pence.
The diluted weighted average number of ordinary shares at 31st January 2025 has been calculated by proportioning the 236,259 vested, but unallocated, shares held under joint share ownership arrangements from the vesting date over the period.
The decrease to the undiluted weighted average number of ordinary shares between 2024 and 2025 is mainly attributable to the 156,702 ordinary shares repurchased into Treasury during the year, offset by the 22,380 ordinary shares transferred from Treasury to the SIP Trust during the year that have been treated as re-issued for the purposes of calculating earnings per share.
22,380 ordinary shares (comprising 22,380 ordinary shares transferred from Treasury to the SIP Trust in April 2024) were allocated to the participating employees as Free, Matching and Partnership shares under the share incentive plan arrangement on 11th April 2024 (Note 24).
11. PROPERTY, PLANT AND EQUIPMENT
|
Furniture and Equipment £'000 |
Leasehold Fixtures and Fittings and Others £'000 |
Total £'000 |
|
|
Group |
|||
|
Cost |
|||
|
At 1st February 2023 |
148 |
152 |
300 |
|
Additions |
13 |
- |
13 |
|
Disposals |
- |
- |
- |
|
At 31st January 2024 |
161 |
152 |
313 |
|
At 1st February 2024 |
161 |
152 |
313 |
|
Additions |
33 |
21 |
54 |
|
Disposals |
- |
- |
- |
|
At 31st January 2025 |
194 |
173 |
367 |
|
Depreciation |
|||
|
At 1st February 2023 |
128 |
93 |
221 |
|
Eliminated on disposal |
- |
- |
- |
|
Charge for the year |
12 |
15 |
27 |
|
At 31st January 2024 |
140 |
108 |
248 |
|
At 1st February 2024 |
140 |
108 |
248 |
|
Eliminated on disposal |
- |
- |
- |
|
Charge for the year |
13 |
22 |
35 |
|
At 31st January 2025 |
153 |
130 |
283 |
|
Net book value |
|||
|
At 31st January 2025 |
£ 41 |
£ 43 |
£ 84 |
|
At 31st January 2024 |
£ 21 |
£ 44 |
£ 65 |
|
At 31st January 2023 |
£ 20 |
£ 59 |
£ 79 |
12. INVESTMENTS - EQUITY PORTFOLIO
|
Group |
Shares in investee companies |
||
|
Continuing investments |
Current Assets - Investments held for sale |
Total |
|
|
£'000 |
£'000 |
£'000 |
|
|
At valuation |
|||
|
At 1st February 2023 |
171,461 |
- |
171,461 |
|
Transfers between categories |
(18,380) |
18,380 |
- |
|
Additions |
3,364 |
- |
3,364 |
|
Disposals |
(53,154) |
- |
(53,154) |
|
Provisions |
- |
- |
- |
|
Unrealised gains in this period |
12,542 |
31,169 |
43,711 |
|
At 31st January 2024 |
£ 115,833 |
£ 49,549 |
£ 165,382 |
|
At 1st February 2024 |
115,833 |
49,549 |
165,382 |
|
Additions |
31,501 |
- |
31,501 |
|
Disposals |
(13,446) |
(49,549) |
(62,995) |
|
Provisions |
- |
- |
- |
|
Unrealised gains in this period |
90,207 |
- |
90,207 |
|
At 31st January 2025 |
£ 224,095 |
£ - |
£ 224,095 |
|
At cost |
|||
|
At 1st February 2023 |
59,321 |
- |
59,321 |
|
Transfers between categories |
(4) |
4 |
- |
|
Additions |
3,364 |
- |
3,364 |
|
Disposals |
(16,758) |
- |
(16,758) |
|
Provisions |
- |
- |
- |
|
At 31st January 2024 |
£ 45,923 |
£ 4 |
£ 45,927 |
|
At 1st February 2024 |
45,923 |
4 |
45,927 |
|
Additions |
31,501 |
- |
31,501 |
|
Disposals |
(308) |
(4) |
(312) |
|
Provisions |
- |
- |
- |
|
At 31st January 2025 |
£ 77,116 |
£ - |
£ 77,116 |
The additions relate to the following transactions in the year:
On 27th March 2024 the Group acquired a 30% cumulative preferred ordinary equity stake in Devonshire UW Limited ("Devonshire") via a holding company, Devonshire UW Topco Limited, for consideration of £300,000. Devonshire is a London-based Underwriting Agency specialising in transactional risks, including Warranty & Indemnity, Specific Tax and Legal Contingency Insurance, with the ability to underwrite transactions in the UK, Europe, Middle East, Africa, Asia, South America, Central America and Australasia. The Group also provided Devonshire with a loan facility of £1,600,000, of which £1,490,125 had been drawn down as at 31st January 2025, with a remaining undrawn facility of £109,875 (Note 22).
On 17th April 2024, the Group acquired a further 2.52% ordinary equity holding in LEBC Holdings Limited ("LEBC") for consideration of £1,100,000. On completion the ordinary shares were immediately converted into preferred shares. The transaction increased the Group's holding in LEBC from 59.34% as at 31st January 2024 to 61.86% as at 31st January 2025.
On 9th May 2024 the Group acquired a further 7% cumulative preferred ordinary equity stake in Pantheon Specialty Group Limited ("Pantheon") for consideration of £7,300,000 increasing its equity holding from 25% as at 31st January 2024 to 32% at the time of investment. On 29th October 2024 the Group invested a further £12,500,000 in cumulative preferred ordinary shares, increasing its equity holding from 32% to 37%. In addition, the Group converted £2,000,000 of Pantheon's loan outstanding into equity. The loan to equity reclassification did not increase the Group's overall equity holding in Pantheon, which remained 37% as at 31st January 2025, but has been treated as an increase to the Group's cost of investment which stood at £21,800,025 as at 31st January 2025. Following the loan reclassification and other repayments made during the year, total outstanding loans due from Pantheon reduced from £4,536,000 as at 31st January 2024 to £Nil as at 31st January 2025.
On 13th May 2024 the Group acquired, through its wholly-owned subsidiary company B.P. Marsh (North America) Limited, a further 0.95% equity stake in XPT Group LLC ("XPT") for USD 1,000,787 (£800,073) as part of a pre-emption share offer. In addition, on 22nd November 2024 the Group invested a further USD 6,323,724 (£4,996,575) in equity, together with loan funding of USD 6,287,675 (£4,968,091), providing funding to assist XPT with a management shareholder restructure. Following these investments, the uptake of other shareholder's pre-emptive rights and other dilutive events, the Group's fully diluted shareholding in XPT reduced from 29.10% as at 31st January 2024 to 28.98% as at 31st January 2025 and the Group's loan balance to XPT increased from USD 6,000,000 (£4,683,644) as at 31st January 2024 to USD 12,287,675 (£9,861,860) as at 31st January 2025.
On 30th September 2024 the Group acquired, through its wholly-owned subsidiary company B.P. Marsh Europe Limited, a 44% equity stake in CEE Specialty s.r.o. ("CEE") for consideration of €2,819,852 (£2,354,134). CEE is an underwriting agency based in Prague, Czech Republic specialising in Marine Hull, Bonds and Liability Insurance, targeting business in Central and Eastern Europe. As part of the overall funding, the Group also provided €487,860 (£407,287) in management loans to the two founder members of CEE.
On 11th October 2024 the Group acquired a 25.5% cumulative preferred ordinary equity stake in Volt Underwriting Limited ("Volt") via a holding company, Volt UW HoldCo Limited, for consideration of £25.50. Volt is a London-based Managing General Agency start-up underwriting a global portfolio of energy business, with a particular focus on the US. The Group also provided Volt with a loan facility of £2,500,000, of which £1,200,000 had been drawn down as at 31st January 2025, with a remaining undrawn facility of £1,300,000 (Note 22).
On 29th October 2024 the Group acquired a 30% cumulative preferred ordinary equity stake in SRT & Partners Limited ("SRT") for consideration of £150,000. SRT is a start-up UK Retail and London Market broker. The Group also provided SRT with a loan facility of £2,350,000, which was drawn down in full on completion and remained outstanding as at 31st January 2025.
The disposals relate to the following transactions in the year:
On 22nd March 2024 the Group completed the disposal of its entire 38.63% holding in Paladin Holdings Limited ("Paladin") to Specialist Risk Group Limited ("SRG"), following receipt of regulatory approval. On completion, the Group received £42,075,838 in initial cash consideration, net of transaction costs, plus repayment in full of its £5,900,500 loans to Paladin. Further proceeds of £1,939,924, representing the net working capital adjustment due to the Group following finalisation of Paladin's completion accounts, were received on 6th September 2024 bringing the total proceeds received as at 31st January 2025 to £44,015,762. The cash proceeds received represented an overall gain of £44,012,262 above the net cost of investment. As well as the initial consideration and working capital adjustment, the Group will also be entitled to receive deferred contingent consideration based upon 20% EBITDA growth targets above Paladin's actual adjusted EBITDA for 2023, in FY24 and FY25, payable in 2025 and 2026. There is also the possibility for the Group to receive further consideration in FY25 should Paladin outperform these growth targets. For amounts received since 31st January 2025, refer to Note 26.
The carrying value of the Group's investment in Paladin as at 1st February 2024 was £49,549,000. A proportion of this carrying value related to the Group's discounted deferred contingent consideration estimate. On disposal, the fair value attributed to the deferred contingent consideration element of the sale amounting to £9,021,000 was reclassified within the Consolidated Statement of Financial Position from 'Investments - assets held for sale' to a debtor balance within 'Other receivables'. As at 31st January 2025 the fair value of the deferred contingent consideration was revalued at £14,541,000 and the associated gain of £5,520,000 has been recognised within the Consolidated Statement of Comprehensive Income.
On 29th October 2024 the Group completed the disposal of its entire fully diluted 28.4% holding in Lilley Plummer Holdings Limited ("Lilley Plummer") to Clear London Markets Limited, following receipt of regulatory approval. On completion the Group received £21,718,937 in cash consideration, net of transaction costs. The cash proceeds received represented an overall gain of £21,418,937 above the net cost of investment.
The unquoted investee companies, which are registered in England except for Asia Reinsurance Brokers Pte Limited (Singapore), Stewart Specialty Risk Underwriting Ltd (Canada), XPT Group LLC (USA), ATC Insurance Solutions PTY Limited (Australia), Criterion Underwriting Pte Limited (Singapore), Agri Services Company PTY Limited (Australia), Sage Program Underwriters, Inc. (USA) and CEE Specialty s.r.o (Czech Republic) are as follows:
|
% holding |
Date |
Aggregate |
Post tax |
||
|
of share |
information |
capital and |
profit/(loss) |
||
|
Name of company |
capital |
available to |
reserves |
for the year |
Principal activity |
|
£ |
£ |
||||
|
Agri Services Company PTY Limited |
41.00 |
30.06.24 |
1,214,831 |
71,022 |
Holding company for specialist Australian agricultural Managing General Agency |
|
Asia Reinsurance Brokers Pte Limited |
25.00 |
31.05.24 |
2,298,607 |
337,610 |
Specialist reinsurance broker |
|
ATC Insurance Solutions PTY Limited |
25.56 |
30.06.24 |
16,677,743 |
5,329,842 |
Specialist Australian Managing General Agency |
|
CEE Specialty s.r.o. |
44.00 |
31.12.24 |
465,361 |
783,638 |
Specialist Managing General Agency |
|
Criterion Underwriting Pte Limited1 |
29.40 |
31.05.20 |
(445,842) |
(32,019) |
Specialist Singaporean Managing General Agency |
|
Dempsey Group Limited2 |
30.00 |
- |
- |
- |
Holding company for specialist Managing General Agency |
|
Devonshire UW Topco Limited |
30.00 |
31.12.24 |
297,076 |
(2,994) |
Specialist Managing General Agency |
|
The Fiducia MGA Company Limited |
35.18 |
31.12.23 |
345,832 |
511,692 |
Specialist UK Marine Cargo Underwriting Agency |
|
LEBC Holdings Limited |
61.86 |
30.09.23 |
(671,916) |
(2,427,586) |
Independent financial advisor company |
|
Neutral Bay Investments Limited |
49.90 |
31.03.25 |
4,241,417 |
345,204 |
Investment holding company |
|
New Denison Limited3 |
40.00 |
30.06.24 |
3 |
- |
Dormant company |
|
Pantheon Specialty Group Limited |
37.00 |
31.12.23 |
(451,965) |
(452,065) |
Holding company for specialist insurance broker |
|
Sage Program Underwriters Inc4 |
30.00 |
31.12.23 |
(12,151) |
48,267 |
Specialist Managing General Agency |
|
SRT & Partners Limited5 |
30.00 |
- |
- |
- |
Specialist Insurance Broker |
|
Stewart Specialty Risk Underwriting Limited |
30.00 |
31.12.23 |
6,013,626 |
3,096,411 |
Specialist Canadian Casualty Underwriting Agency |
|
Verve Risk Services Limited |
35.00 |
31.12.23 |
253,290 |
(177,631) |
Specialist Managing General Agency |
|
Volt UW HoldCo Limited6 |
25.50 |
- |
- |
- |
Specialist Managing General Agency |
|
XPT Group LLC |
28.98 |
31.12.23 |
(17,929,386) |
(6,089,523) |
USA Specialty lines insurance distribution company |
1Recent statutory financial information is not available for Criterion Underwriting Pte Limited as the company is not currently trading.
2Dempsey Group Limited is a newly incorporated company. Statutory accounts are not available as these are not yet due.
3New Denison Limited is a newly incorporated company that is not currently trading.
4Statutory accounts are not available for Sage Program Underwriters, Inc. as these are not required to be filed in the jurisdiction in which the company operates. The financial information included above is therefore based upon management accounts information received for the relevant accounting period.
5 SRT & Partners Limited is a newly incorporated company. Statutory accounts are not available as these are not yet due.
6 Volt UW HoldCo Limited is a newly incorporated company. Statutory accounts are not available as these are not yet due.
The Group's 35% equity investment in EC3 Brokers Group Limited has not been listed above as the company went into administration in November 2022 and remained in administration as at 31st January 2025. The Group does not expect to recover any amounts in respect of this investment which has been provided against in full.
The aggregate capital and reserves and profit/(loss) for the year shown above are extracted from the relevant local GAAP accounts of the investee companies.
|
Shares in |
|
|
Company |
group |
|
undertakings |
|
|
£'000 |
|
|
At valuation |
|
|
At 1st February 2023 |
158,333 |
|
Additions |
- |
|
Unrealised gains in this period |
32,527 |
|
At 31st January 2024 |
£ 190,860 |
|
At 1st February 2024 |
190,860 |
|
Additions |
- |
|
Unrealised gains in this period |
99,499 |
|
At 31st January 2025 |
£ 290,359 |
|
At cost |
|
|
At 1st February 2023 |
2,143 |
|
Additions |
- |
|
At 31st January 2024 |
£ 2,143 |
|
At 1st February 2024 |
2,143 |
|
Additions |
- |
|
At 31st January 2025 |
£ 2,143 |
Shares in group undertakings
All group undertakings are registered in England and Wales. The details and results of group undertakings held throughout the year, which are extracted from the UK-adopted international accounting standards accounts of B.P. Marsh & Company Limited, Marsh Insurance Holdings Limited, B.P. Marsh Asset Management Limited, B.P. Marsh (North America) Limited, B.P. Marsh Europe Limited and the UK GAAP accounts for the other companies, are as follows:
|
Aggregate |
Profit/(loss) |
||||
|
% |
capital and |
for the |
|||
|
Holding |
reserves at |
year to |
|||
|
of share |
31st January |
31st January |
|||
|
Name of company |
Capital |
2025 |
2025 |
Principal activity |
|
|
£ |
£ |
||||
|
B.P. Marsh & Company Limited |
100 |
326,407,884 |
99,498,802 |
Consulting services and investment holding company |
|
|
Marsh Insurance Holdings Limited |
100 |
6,099,974 |
- |
Investment holding company - dormant |
|
|
B.P. Marsh Asset Management Limited |
100 |
776 |
- |
Dormant |
|
|
B.P. Marsh (North America) Limited* |
100 |
26,445,716 |
9,799,626 |
Investment holding company |
|
|
B.P. Marsh Europe Limited |
100 |
92,021 |
92,021 |
Investment holding company |
|
|
B.P. Marsh & Co. Trustee Company Limited |
100 |
1,000 |
- |
Dormant |
|
|
Marsh Development Capital Limited |
100 |
1 |
- |
Dormant |
|
|
XPT London Limited |
100 |
2 |
- |
Dormant |
|
*At the year end B.P. Marsh (North America) Limited held a 100% economic interest in RHS Midco I LLC, a US registered entity incorporated during the year to 31st January 2018 for the purpose of holding the Group's equity investment in XPT Group LLC. In addition, at the year end B.P. Marsh (North America) Limited also held a 100% economic interest in B.P. Marsh US LLC, a US registered entity, which was incorporated during the year to 31st January 2018. There were no profit or loss transactions in either of these two US registered entities during the current or prior year.
In addition, the Group also controls the B.P. Marsh SIP Trust and the B.P. Marsh Employees' Share Trust (Note 24).
Loans to the subsidiaries of £36,122,975 (2024: £38,382,626) are treated as capital contributions.
13. CASH AND CASH EQUIVALENTS
|
Group |
2025 |
2024 |
||
|
£'000 |
£'000 |
|||
|
Cash and cash equivalents comprise: |
||||
|
Treasury portfolio - current investments |
51,693 |
27,447 |
||
|
Cash and bank balances |
22,444 |
12,988 |
||
|
£ 74,137 |
£ 40,435 |
|
Treasury portfolio - current investments |
||||
|
At valuation |
2025 |
2024 |
||
|
£'000 |
£'000 |
|||
|
Market value at 1st February |
27,525 |
11,337 |
||
|
Additions at cost |
69,730 |
64,000 |
||
|
Disposals |
(47,930) |
(48,430) |
||
|
Change in value in the year |
2,368 |
618 |
||
|
Market value at 31st January |
£51,693 |
£27,525 |
||
|
Disclosed as: |
||||
|
Cash and cash equivalents |
51,693 |
27,447 |
||
|
Investments - treasury portfolio |
- |
78 |
||
|
Total |
£51,693 |
£27,525 |
||
|
Investment fund split: |
||||
|
GAM London Limited |
17,268 |
7,175 |
||
|
Rathbone Investment Management Limited |
12,484 |
10,310 |
||
|
Rothschild & Co Wealth Management UK Limited |
21,941 |
10,040 |
||
|
Total |
£51,693 |
£27,525 |
||
The treasury portfolio comprises of investment funds managed and valued by the Group's investment managers, GAM London Limited, Rathbone Investment Management Limited and Rothschild & Co Wealth Management UK Limited. All investments in securities are included at year end market value.
The initial investment into the funds was made following the realisation of the Group's investment in Summa Insurance Brokerage, S.L. in 2022 and further funds were invested following the sale of Kentro Capital Limited during the year ended 31st January 2024. Further funds have been invested following the sale of Paladin Holdings Limited and Lilley Plummer Holdings Limited during the current year.
The purpose of the funds is to hold (and grow) the Group's surplus cash until such time that suitable investment opportunities arise.
As at 31st January 2025 all amounts held in the funds were non-risk interest bearing deposits (as at 31st January 2024, of the total £27,525,222 held within the funds, only £78,462 was risk bearing, with the remaining funds of £27,446,760 being non-risk interest bearing deposits).
The risk bearing fund values can increase, but also have the potential to fall below the amount initially invested by the Group. However, the performance of each fund is monitored on a regular basis and the appropriate action is taken if there is a prolonged period of poor performance.
Investment management costs of £106,793 (2024: £15,569) were charged to the Consolidated Statement of Comprehensive Income during the period.
14. REALISED GAINS / (LOSSES) ON DISPOSAL OF EQUITY INVESTMENTS
The realised gains / (losses) on disposal of investments for the year comprises of a net gain of £17,292,319 (2024: net loss on disposal of investments of £(36,689)).
£3,487,762 of this net gain was in relation to the Group's disposal of its entire 38.63% holding in Paladin Holdings Limited ("Paladin") for initial cash consideration of £44,015,762 (including £1,939,924 received as a post completion working capital adjustment), compared to the attributable fair value of £40,528,000 at 1st February 2024.
As outlined in Note 12, the Group expects to receive deferred contingent consideration based upon Paladin achieving certain EBITDA growth targets. The total carrying value of the Group's investment in Paladin as at 1st February 2024 including the deferred contingent consideration was £49,549,000. On disposal, the fair value attributed to the deferred contingent consideration element of the sale of £9,021,000 was reclassified within the Consolidated Statement of Financial Position from 'Investments - assets held for sale' to a debtor balance included within 'Other receivables'. As at 31st January 2025 the fair value of the deferred contingent consideration was revalued at £14,541,000 resulting in a gain of £5,520,000 which has been recognised within the Consolidated Statement of Comprehensive Income and in Loans and Receivables - Non-current.
£8,281,179 of this net gain was in relation to the Group's disposal of its entire fully diluted 28.4% holding in Lilley Plummer Holdings Limited ("Lilley Plummer") for cash consideration of £21,718,937, compared to the fair value of £13,446,000 at 1st February 2024 and following the release of a provision of £8,242 relating to share consideration due by the Group to a subsidiary company of Lilley Plummer which was not required to be paid.
The disposals of Paladin and Lilley Plummer resulted in a net release of previously unrealised gains to Retained Earnings from the Fair Value Reserve of £62,683,258 (£49,545,500 in respect of Paladin and £13,137,758 in respect of Lilley Plummer) as set out in Note 20.
£3,378 of this net gain was in relation to the receipt of an additional capital distribution from the Group's former investment in Walsingham Holdings Limited ("WHL") following the conclusion of WHL's liquidation process which commenced in February 2022.
The amount included in realised gains on disposal of investments for the year ended 31st January 2024 comprised of a net loss of £(36,689).
£132,000 of this net loss was in respect of the Group's disposal of its entire 40% equity investment in Denison and Partners Limited ("Denison and Partners") for nil cash consideration, compared to the fair value of £132,000 at 1st February 2023. There were no releases of previously unrealised gains or losses to Retained Earnings from the Fair Value Reserve as a result of this disposal in that period as the investment had been held at cost.
The above realised loss arising from the disposal of Denison and Partners was offset by the following realised gains:
A £4,000 realised gain relating to the Group's partial disposal of 250,000 ordinary shares (c.5.9% at the time of divestment) in Paladin Holdings Limited ("Paladin") in that year which were held under a call option arrangement, for consideration of £804,000, compared to the fair value of £800,000 at 1st February 2023.
A £91,311 realised gain relating to an additional capital distribution recognised during that year from the Group's former investment in Summa Insurance Brokerage, S.L. ("Summa") which was sold during the year to 31st January 2022.
There were no releases of previously unrealised gains or losses to Retained Earnings from the Fair Value Reserve as a result of the disposal of Denison and Partners and partial disposal of Paladin in that year as the investments had been held at cost.
Refer to Note 12 for further details relating to the above disposals.
15. LOANS AND RECEIVABLES - NON-CURRENT
|
Group |
Company |
||||
|
2025 |
2024 |
2025 |
2024 |
||
|
£'000 |
£'000 |
£'000 |
£'000 |
||
|
Loans to investee companies (Note 25) |
17,254 |
16,197 |
- |
- |
|
|
Amounts owed by group undertakings |
- |
- |
1,979 |
2,948 |
|
|
Other receivables (Note 14) |
5,369 |
- |
- |
- |
|
|
£ 22,623 |
£ 16,197 |
£ 1,979 |
£ 2,948 |
||
The amounts owed to the Company by group undertakings are interest free and repayable on demand.
Other receivables of £5,368,859 relates to deferred contingent consideration due in relation to the Group's disposal of its investment in Paladin Holdings Limited, which is expected to be received in 2026 (Notes 12 and 14).
See Note 16 for the provisions against loans to investee companies and Note 25 for terms of the loans.
16. TRADE AND OTHER RECEIVABLES - CURRENT
|
Group |
Company |
||||
|
2025 |
2024 |
2025 |
2024 |
||
|
£'000 |
£'000 |
£'000 |
£'000 |
||
|
Trade receivables |
728 |
1,040 |
- |
- |
|
|
Less provision for impairment of receivables |
- |
- |
- |
- |
|
|
728 |
1,040 |
- |
- |
||
|
Loans to investee companies (Note 25) |
8,343 |
12,706 |
- |
- |
|
|
Other receivables |
9,172 |
1 |
- |
- |
|
|
Prepayments and accrued income |
1,360 |
1,886 |
- |
- |
|
|
Amounts owed by group undertakings |
- |
- |
- |
1,157 |
|
|
£ 19,603 |
£ 15,633 |
£ - |
£ 1,157 |
||
In the current year a provision of £74,354 was made (2024: no provisions were made against loans to investee companies) against a loan provided to Brown & Brown (Europe) Holdco Limited ("Brown and Brown"). The loan of £524,253 was made to Brown and Brown in the prior year in relation to the Group's disposal of its investment in Kentro Capital Limited in October 2023, alongside other major selling shareholders in respect of certain identified indemnities under the Sale and Purchase Agreement. In the current year, following notification of the actual specified claims, against which the £74,354 provision was made, the Group received repayment of the remaining loan balance of £449,899. No further amounts are expected to be recovered in relation to this loan.
A provision of £38,564 previously made against a loan was released during the current year due to repayments being received (2024: a provision of £24,000 previously made against a loan was released during that year due to repayments being received). The total provision as at 31st January 2025 was £69,154 (31st January 2024: £107,718) with a potential of recovery.
Other receivables of £9,172,141 relates to deferred contingent consideration due in relation to the Group's disposal of its investment in Paladin Holdings Limited (Note 12). This amount was received in full after the year end (Note 26).
Included within net trade receivables is a gross amount of £632,050 (2024: £929,989) owed by the Group's participating interests. No provision for bad debts has been made in either the current or prior year.
Trade receivables are provided for based on estimated irrecoverable amounts from the fees and interest charged to investee companies, determined by the Group's management based on prior experience and their assessment of the current economic environment.
Movement in the allowance for doubtful debts:
|
Group |
Company |
||||
|
2025 |
2024 |
2025 |
2024 |
||
|
£'000 |
£'000 |
£'000 |
£'000 |
||
|
Balance at 1st February |
- |
- |
- |
- |
|
|
Movement in allowance recognised in the Statement of Comprehensive Income |
- |
- |
- |
- |
|
|
Balance at 31st January |
£ - |
£ - |
£ - |
£ - |
|
In determining the recoverability of a trade receivable, the Group considers any change in the credit quality of the trade receivable from the date credit was initially granted up to the reporting date.
The Group's net trade receivable balance includes debtors with a carrying amount of £728,476 (2024: £1,039,891), of which £163,068 (2024: £485,086) of debtors are past due at the reporting date for which the Group has not made a provision as all amounts are considered recoverable by the directors. The Group does not hold any collateral over these balances other than over £369,539 (2024: £244,160) included within the net trade receivables balance relating to loan interest due from investee companies which is secured on the assets of the investee company.
Ageing of past due but not impaired:
|
Group |
Company |
|||||
|
2025 |
2024 |
2025 |
2024 |
|||
|
£'000 |
£'000 |
£'000 |
£'000 |
|||
|
Not past due |
565 |
555 |
- |
- |
||
|
Past due: 0 - 30 days |
7 |
43 |
- |
- |
||
|
Past due: 31 - 60 days |
3 |
283 |
- |
- |
||
|
Past due: more than 60 days |
153 |
159 |
- |
- |
||
|
£ 728 |
£ 1,040 |
£ - |
£ - |
|||
See Note 25 for terms of the loans and Note 23 for further credit risk information.
17. DEFERRED TAX LIABILITIES - NON-CURRENT
|
Group |
Company |
|||
|
£'000 |
£'000 |
|||
|
At 1st February 2023 |
5,631 |
- |
||
|
Tax movement relating to investment revaluation for the year (Note 9) |
1,056 |
- |
||
|
At 31st January 2024 |
£ 6,687 |
£ - |
||
|
At 1st February 2024 |
6,687 |
- |
||
|
Tax movement relating to investment revaluation for the year (Note 9) |
5,160 |
- |
||
|
At 31st January 2025 |
£ 11,847 |
£ - |
||
Finance (No.2) Act 2017 introduced significant changes to the Substantial Shareholding Exemption ("SSE") rules in Taxation of Chargeable Gains Act 1992 Sch. 7AC which applied to share disposals on or after 1 April 2017. In general terms, the rule changes relaxed the conditions for the Group to qualify for SSE on a share disposal.
New tax legislation was introduced in the US in 2018 which taxes at source gains on disposal of any foreign partnership interests in US limited liability companies ("LLCs"). As such, deferred tax needs to be assessed on any potential net gains from the Group's investment interests in US LLCs.
Having reviewed the Group's current investment portfolio, the directors consider that the Group should benefit from this reform to the SSE rules on all non-US LLC investments. As a result, the directors anticipate that on a disposal of shares in the Group's current non-US LLC investments, so long as the shares have been held for 12 months they should qualify for SSE and no tax charge should arise on their disposal.
The requirement for a deferred tax provision is subject to continual assessment of each investment to test whether the SSE conditions continue to be met based upon information that is available to the Group and that there is no change to the accounting treatment in this regard under UK-adopted international accounting standards. It should also be noted that, until the date of the actual disposal, it will not be possible to ascertain if all the SSE conditions are likely to have been met and, moreover, obtaining agreement of the tax position with HM Revenue & Customs may possibly not be forthcoming until several years after the end of a period of accounts.
Having assessed the current US portfolio, the directors anticipate that there is a requirement to provide for deferred tax in respect of the unrealised gains on investments under the current requirements of UK-adopted international accounting standards as the US LLC investments currently show a net gain. As such, a provision of £11,847,000 has been made as at 31st January 2025 (2024: £6,687,000).
The deferred tax provision of £11,847,000 as at 31st January 2025 (2024: £6,687,000) has been calculated based upon an assessment of the US tax liability arising from the valuations of the Group's holdings within US LLCs at 31st January 2025, using the US Federal rate of 21% together with US State Tax rates prevailing in the states where the Group's US LLCs operate, which range between 0% and 10%. Adjustments were then made based upon available allowances and taxable losses. Given the complexity, the Group utilised the services of a specialist US tax advisory firm.
18. CURRENT LIABILITIES
|
Group |
Company |
||||
|
2025 |
2024 |
2025 |
2024 |
||
|
£'000 |
£'000 |
£'000 |
£'000 |
||
|
Trade and other payables |
|||||
|
Trade payables |
92 |
90 |
- |
- |
|
|
Other taxation & social security costs |
139 |
142 |
- |
- |
|
|
Accruals and deferred income |
1,942 |
1,561 |
- |
- |
|
|
Amounts owed to participating interests |
42 |
50 |
- |
- |
|
|
Lease liabilities (Note 21) |
194 |
180 |
- |
- |
|
|
£2,409 |
£2,023 |
£ - |
£ - |
||
All of the above liabilities are measured at amortised cost.
19. CALLED UP SHARE CAPITAL
|
2025 |
2024 |
|
|
£'000 |
£'000 |
|
|
Allotted, called up and fully paid |
||
|
37,100,000 Ordinary shares of 10p each (2024: 37,288,000) |
3,710 |
3,729 |
|
£3,710 |
£3,729 |
During the year the Company paid a total of £835,267 including commission, in order to repurchase 156,702 ordinary shares at an average price of 532 pence per share (2024: the Company paid a total of £1,052,751, including commission, in order to repurchase 283,480 ordinary shares at an average price of 370 pence per share).
Distributable reserves have been reduced by £835,267 (2024: £1,052,751) as a result.
On 31st October 2024 188,000 ordinary shares in the Company were cancelled. These shares were previously held in Treasury. Following the cancellation, the total number of ordinary shares in issue reduced from 37,288,000 as at 31st January 2024 to 37,100,000 as at 31st January 2025.
As at 31st January 2025 a total of 23,872 ordinary shares were held by the Company in Treasury (31st January 2024: 77,550 ordinary shares were held by the Company in Treasury).
The Treasury shares do not have voting or dividend rights and have therefore been excluded for the purposes of calculating earnings per share and Net Asset Value per share.
The repurchase of the ordinary shares is borne from the Group's commitment to reduce share price discount to Net Asset Value. Prior to 11th June 2024, and in accordance with its Share Buy-Back Policy announcement on 14th November 2023, the Group's policy was to buy back shares when the share price was below 20% of its published Net Asset Value (for up to a maximum aggregate consideration of £500,000).
As outlined in the Group's Share Buy-Back Policy announcement on 11th June 2024, its policy has been, subject to ordinary shares in the Company being available to purchase, to be able to buy small parcels of shares (for up to a maximum aggregate consideration of £1,000,000) at a price representing a discount of at least 15% to the most recently announced diluted Net Asset Value per share and place them into Treasury. On 2nd August 2024 this threshold was subsequently upwardly revised to a 10% discount to diluted Net Asset Value per Share.
On 31st October 2024 a further £1,000,000 was added to the Share Buy-Back programme (increasing the aggregate Share Buy-Back budget to £1,164,733 at that time) to allow the Company to continue purchasing small parcels of ordinary shares, where available, in a Net Asset Value accretive way.
20. STATEMENT OF CHANGES IN EQUITY
|
Group |
Share |
Reverse |
Capital |
Capital |
||||
|
Share |
premium |
Fair value |
acquisition |
redemption |
contribution |
Retained |
||
|
capital |
account |
reserve |
reserve |
reserve |
reserve |
earnings |
Total |
|
|
£'000 |
£'000 |
£'000 |
£'000 |
£'000 |
£'000 |
£'000 |
£'000 |
|
At 1st February 2023 |
3,747 |
29,350 |
106,509 |
393 |
7 |
72 |
49,459 |
189,537 |
|
|
|
|
|
|
|
|
|
|
|
Comprehensive income for the year |
- |
- |
42,654 |
- |
- |
- |
(125) |
42,529 |
|
|
|
|
|
|
|
|
|
|
|
Net transfers on disposal of investments (Note 12) |
- |
- |
(36,395) |
- |
- |
- |
36,395 |
- |
|
|
|
|
|
|
|
|
|
|
|
Dividends paid (Note 7) |
- |
- |
- |
- |
- |
- |
(2,028) |
(2,028) |
|
|
|
|
|
|
|
|
|
|
|
Repurchase of Company shares (Note 19) |
- |
- |
- |
- |
- |
- |
(1,053) |
(1,053) |
|
|
|
|
|
|
|
|
|
|
|
Cancellation of Company shares (Note 19) |
(18) |
- |
- |
- |
18 |
- |
- |
- |
|
|
|
|
|
|
|
|
|
|
|
Share based payment arrangements |
- |
(5) |
- |
- |
- |
- |
191 |
186 |
|
At 31st January 2024 |
£3,729 |
£29,345 |
£112,768 |
£393 |
£25 |
£72 |
£82,839 |
£229,171 |
|
Group |
Share |
Reverse |
Capital |
Capital |
||||
|
Share |
premium |
Fair value |
acquisition |
redemption |
contribution |
Retained |
||
|
capital |
account |
reserve |
reserve |
reserve |
reserve |
earnings |
Total |
|
|
£'000 |
£'000 |
£'000 |
£'000 |
£'000 |
£'000 |
£'000 |
£'000 |
|
At 1st February 2024 |
3,729 |
29,345 |
112,768 |
393 |
25 |
72 |
82,839 |
229,171 |
|
|
|
|
|
|
|
|
|
|
|
Comprehensive income for the year |
- |
- |
85,047 |
- |
- |
- |
14,452 |
99,499 |
|
|
|
|
|
|
|
|
|
|
|
Net transfers on disposal of investments (Note 12 and Note 14) |
- |
- |
(62,683) |
- |
- |
- |
62,683 |
- |
|
|
|
|
|
|
|
|
|
|
|
Dividends paid (Note 7) |
- |
- |
- |
- |
- |
- |
(3,964) |
(3,964) |
|
|
|
|
|
|
|
|
|
|
|
Repurchase of Company shares (Note 19) |
- |
- |
- |
- |
- |
- |
(835) |
(835) |
|
|
|
|
|
|
|
|
|
|
|
Cancellation of Company shares (Note 19) |
(19) |
- |
- |
- |
19 |
- |
- |
- |
|
|
|
|
|
|
|
|
|
|
|
Share based payment arrangements |
- |
11 |
- |
- |
- |
- |
402 |
413 |
|
|
|
|
|
|
|
|
|
|
|
Amounts received from the Employee Benefit Trust on the sale of shares held under joint ownership (Note 24) |
- |
- |
- |
- |
- |
- |
2,126 |
2,126 |
|
|
|
|
|
|
|
|
|
|
|
At 31st January 2025 |
£3,710 |
£29,356 |
£135,132 |
£393 |
£44 |
£72 |
£157,703 |
£326,410 |
|
|
|
|
|
|
|
|
|
|
Company |
Share |
Capital |
Capital |
||||
|
Share |
premium |
Fair value |
redemption |
contribution |
Retained |
||
|
capital |
account |
reserve |
reserve |
reserve |
earnings |
Total |
|
|
£'000 |
£'000 |
£'000 |
£'000 |
£'000 |
£'000 |
£'000 |
|
|
At 1st February 2023 |
3,747 |
29,350 |
156,190 |
7 |
- |
4,427 |
193,721 |
|
|
|
|
|
|
|
|
|
|
Comprehensive income for the year |
- |
- |
32,527 |
- |
- |
10,002 |
42,529 |
|
|
|
|
|
|
|
|
|
|
Dividends paid (Note 7) |
- |
- |
- |
- |
- |
(2,028) |
(2,028) |
|
|
|
|
|
|
|
|
|
|
Repurchase of Company shares (Note 19) |
- |
- |
- |
- |
- |
(1,053) |
(1,053) |
|
|
|
|
|
|
|
|
|
|
Cancellation of Company shares (Note 19) |
(18) |
- |
- |
18 |
- |
- |
- |
|
|
|
|
|
|
|
|
|
|
Share based payment arrangements |
- |
(5) |
- |
- |
- |
191 |
186 |
|
At 31st January 2024 |
£3,729 |
£29,345 |
£188,717 |
£25 |
£ - |
£11,539 |
£233,355 |
|
Company |
Share |
Capital |
Capital |
||||
|
Share |
premium |
Fair value |
redemption |
contribution |
Retained |
||
|
capital |
account |
reserve |
reserve |
reserve |
earnings |
Total |
|
|
£'000 |
£'000 |
£'000 |
£'000 |
£'000 |
£'000 |
£'000 |
|
|
At 1st February 2024 |
3,729 |
29,345 |
188,717 |
25 |
- |
11,539 |
233,355 |
|
|
|
|
|
|
|
|
|
|
Comprehensive income for the year |
- |
- |
99,499 |
- |
- |
- |
99,499 |
|
|
|
|
|
|
|
|
|
|
Dividends paid (Note 7) |
- |
- |
- |
- |
- |
(3,964) |
(3,964) |
|
|
|
|
|
|
|
|
|
|
Repurchase of Company shares (Note 19) |
- |
- |
- |
- |
- |
(835) |
(835) |
|
|
|
|
|
|
|
|
|
|
Cancellation of Company shares (Note 19) |
(19) |
- |
- |
19 |
- |
- |
- |
|
|
|
|
|
|
|
|
|
|
Share based payment arrangements |
- |
11 |
- |
- |
- |
402 |
413 |
|
|
|
|
|
|
|
|
|
|
At 31st January 2025 |
£3,710 |
£29,356 |
£288,216 |
£44 |
£ - |
£7,142 |
£328,468 |
|
|
|
|
|
|
|
|
21. LEASES
Group
The Group has applied IFRS 16: Leases ("IFRS 16") using the retrospective approach. The Group has one lease, that of its main office premises. Information about this lease, for which the Group is a lessee, is presented below.
Right-of-use asset
|
Land and Buildings |
||
|
£'000 |
||
|
At 1st February 2023 |
671 |
|
|
Depreciation charge |
(164) |
|
|
At 31st January 2024 |
£ 507 |
|
|
At 1st February 2024 |
507 |
|
|
Depreciation charge |
(165) |
|
|
At 31st January 2025 |
£ 342 |
|
Lease liabilities
The Group was committed to making the following future aggregate minimum payments under its leases:
|
2025 |
2024 |
|
|
Land and |
Land and |
|
|
Buildings |
Buildings |
|
|
£'000 |
£'000 |
|
|
Maturity analysis - contractual undiscounted cash flows: |
||
|
Earlier than one year |
214 |
214 |
|
Between two and five years |
230 |
444 |
|
£ 444 |
£ 658 |
|
|
Lease liabilities included in Consolidated Statement of Financial Position |
||
|
at 31st January: |
£ 412 |
£ 596 |
|
Maturity analysis: |
||
|
Current liabilities (Note 18) |
194 |
180 |
|
Non-current liabilities |
218 |
416 |
|
£ 412 |
£ 596 |
|
|
Amounts recognised in profit or loss: |
2025 |
2024 |
|
£'000 |
£'000 |
|
|
Interest on lease liabilities (Note 3) |
£ 30 |
£ 39 |
|
Amounts recognised in the Consolidated Statement of Cash Flows: |
2025 |
2024 |
|
£'000 |
£'000 |
|
|
Total cash outflow for leases |
£ (214) |
£ (214) |
Company
There are no right-of-use assets or associated lease liabilities recognised in the Company's Statement of Financial Position.
22. LOAN AND EQUITY COMMITMENTS
On 26th June 2020 (as amended on 1st June 2023) the Group entered into an agreement to provide Sage Program Underwriters, Inc. with a loan facility of USD 300,000. As at 31st January 2025 USD 150,000 had been drawn down, leaving a remaining undrawn facility of USD 150,000. Any drawdown is subject to satisfying certain agreed criteria.
On 28th April 2023 the Group entered into an agreement to provide Verve Risk Services Limited with a loan facility of £569,209 which was drawn down in full on completion. On 10th September 2024 the facility was increased by a further £500,000 to £1,069,209 and on 12th September 2024 a further £75,000 was drawn down. As at 31st January 2025 total loans of £644,209 had been drawn down, leaving a remaining undrawn facility of £425,000.
On 21st December 2023 the Group entered into an agreement to provide Dempsey Group Limited with a loan facility of £1,570,000. As at 31st January 2025 £1,250,000 had been drawn down, leaving a remaining undrawn facility of £320,000.
On 27th March 2024 the Group entered into an agreement to provide Devonshire UW Topco Limited with a loan facility of £1,600,000. As at 31st January 2025 £1,490,125 had been drawn down, leaving a remaining undrawn facility of £109,875.
On 11th October 2024 the Group entered into an agreement to provide Volt UW HoldCo Limited with a loan facility of £2,500,000. As at 31st January 2025 £1,200,000 had been drawn down, leaving a remaining undrawn facility of £1,300,000.
Please refer to Note 26 for details of equity payments made together with loan facilities offered and amounts drawn down after the year end.
23. FINANCIAL INSTRUMENTS
The Group's financial instruments comprise loans to participating interests, cash and liquid resources and various other items, such as trade debtors, trade creditors, other debtors and creditors and loans. These arise directly from the Group's operations.
It is, and has been throughout the period under review, the Group's policy that no trading in financial instruments shall be undertaken unless there are economic reasons for doing so, as determined by the directors.
The main risks arising from the Group's financial instruments are price risk, credit risk, liquidity risk, interest rate risk, currency risk, new investment risk, concentration risk, political risk and ongoing geopolitical events and inflation risk. The Board reviews and agrees policies for managing each of these risks.
Interest rate profile
The Group has cash and cash equivalent balances of £74,137,000 (2024: £40,435,000), which are part of the financing arrangements of the Group. The cash and cash equivalent balances comprise bank current accounts and deposits placed at investment rates of interest, which ranged up to 5.25% p.a. in the period (2024: deposit rates of interest ranged up to 5.25% p.a.). During the year all cash and cash equivalent balances were held in immediate access accounts or on short term deposits of up to 1 month (2024: all cash balances were held in immediate access accounts or on short-term deposits of up to 1 month).
Currency hedging
During the year the Group engaged in two currency hedging transactions of USD 3,075,000 and AUD 600,000 (2024: two currency hedging transactions USD 1,075,000 and AUD 600,000) to mitigate the exchange rate risk for certain foreign currency receivables. These were settled before the year end. A net loss of £102,901 (2024: net gain of £30,049) relating to these hedging transactions was recognised under Exchange Movements within the Consolidated Statement of Comprehensive Income when the transactions were settled. As at the year end the Group had three currency hedging transactions amounting to USD 6,200,000, AUD 600,000 and EUR 244,000 which were entered into on 31st January 2025. The fair values of these hedges are not materially different to the transaction costs.
Financial liabilities
The Company had no borrowings as at 31st January 2025 (2024: no borrowings).
Fair values
The Group has adopted the amendment to IFRS 7 for financial instruments which are measured at fair value at the reporting date. This requires disclosure of fair value measurements by level of the following fair value measurement hierarchy:
· Level 1: Quoted prices unadjusted in active markets for identical assets or liabilities;
· Level 2: Inputs other than quoted prices included within Level 1 that are observable for the asset or liability, observed either directly as prices or indirectly from prices; and
· Level 3: Inputs for the asset or liability that are not based on observable market data.
Unquoted equity instruments are measured in accordance with the IPEVCV Guidelines with reference to the most appropriate information available at the time of measurement. Further information regarding the valuation of unquoted equity instruments can be found in the section 'Investments - equity portfolio' under the Accounting Policies (Note 1).
The following presents the classification of the financial instruments at fair value into the valuation hierarchy at 31st January 2025:
|
Level 1 |
Level 2 |
Level 3 |
Total |
||
|
£'000 |
£'000 |
£'000 |
£'000 |
||
|
Assets |
|||||
|
Equity portfolio investments designated as "fair value through profit or loss" assets |
- |
- |
224,095 |
224,095 |
|
|
- |
- |
£ 224,095 |
£ 224,095 |
The Group's classification of the financial instruments at fair value into the valuation hierarchy at 31st January 2024 are presented as follows:
|
Level 1 |
Level 2 |
Level 3 |
Total |
||
|
£'000 |
£'000 |
£'000 |
£'000 |
||
|
Assets |
|||||
|
Equity portfolio investments designated as "fair value through profit or loss" assets |
- |
- |
165,382 |
165,382 |
|
|
- |
- |
£ 165,382 |
£ 165,382 |
Level 3 inputs are sensitive to assumptions made when ascertaining fair value. Setting the valuation policy is the responsibility of the Valuations Committee, which is then reviewed by the Board. The policy is to value investments within the portfolio at fair value by applying a consistent approach and ensuring that the valuation methodology is compliant with the IPEVCV Guidelines. Valuations of the investment portfolio of the Group are performed twice a year, and the half-year valuations are subjected to the same level of scrutiny and approach as the audited final year accounts by the Valuations Committee.
Of assets held at 31st January 2025 classified as Level 3, 82% by value (2024: 41%) were valued using a multiple of earnings and 18% (2024: 59%) were valued using alternative valuation methodologies.
Valuation multiple - the valuation multiple is the main assumption applied to a multiple of earnings based valuation. The multiple is derived from comparable listed companies or relevant market transaction multiples. Companies in the same industry and geography and, where possible, with a similar business model and profile are selected and then adjusted for factors including size, growth potential and relative performance. A discount is applied or a reduced multiple used to reflect that the investment being valued is unquoted. The multiple is then applied to the earnings, which may be adjusted to eliminate one-off revenues or costs to better reflect the ongoing position, or to adjust for any minority interests. The resulting value is the enterprise value of the investment, after which certain adjustments are made to calculate the equity value. These adjustments may include debt, working capital requirements, regulatory capital requirements, deferred consideration payable, or anything that could be dilutive which is quantifiable. The Group's investment valuation is then derived from this based upon its shareholding.
The weighted average post discount EBITDA earnings multiple used (based on the valuations derived) when valuing the portfolio at 31st January 2025 was 13.2x (2024: 11.4x).
If the multiple used to value each unquoted investment valued on an earnings basis as at 31st January 2025 moved by 10%, this would have an impact on the investment portfolio of £21.2m (2024: £8.5m) or 9.4% (2024: 5.1%).
Alternative valuation methodologies - there are a number of alternative investment valuation methodologies used by the Group, for reasons for specific types of investment. These may include valuing on the basis of an imminent sale where a price has been agreed but the transaction has not yet completed, using a discounted cash flow model, at cost, using specific industry metrics which are common to that industry and comparable market transactions have occurred, and a multiple of revenues where the investments are not yet profitable.
At 31st January 2025 the proportion of the investment portfolio that was valued using these techniques were: 13% using industry metric (2024: 27%), 4% using forecast cash flow (2024: 32%) and 1% at cost (2024: 0.02%).
If the value of all the investments valued under alternative methodologies moved by 10%, this would have an impact on the investment portfolio of £2.7m (2024: £4.2m) or 1.2% (2024: 2.6%).
24. SHARE BASED PAYMENT ARRANGEMENTS
Joint Share Ownership Plan
During the year to 31st January 2019, B.P. Marsh & Partners Plc entered into joint share ownership agreements ("JSOAs") with certain employees and directors.
On 12th June 2018 1,461,302 new 10p Ordinary shares in the Company were issued and transferred into joint beneficial ownership for 12 employees (including 4 directors) under the terms of joint share ownership agreements. No consideration was paid by the employees for their interests in the jointly-owned shares.
The new Ordinary shares were issued into the name of RBC cees Trustee Limited ("the Trustee") as trustee of the B.P. Marsh Employees' Share Trust ("the Employee Benefit Trust") at a subscription price of 281 pence per share, being the mid-market closing price on 12th June 2018. Following the acquisition of the Trustee by JTC Plc on 10th December 2020, the Trustee has since been rebranded to JTC Employer Solutions Trustee Limited.
The jointly-owned shares are beneficially owned by (i) each of the 7 currently participating employees (including former employees) and (ii) the trustee of the Employee Benefit Trust upon and subject to the terms of the JSOAs entered into between the participating employee, the Company and the Trustee.
Under the terms of the JSOAs, the employees and directors are entitled to receive on vesting the growth in value of the shares above a threshold price of 281 pence per share (market value at the date of grant) plus an annual carrying charge of 3.75% per annum (simple interest) to the market value at the date of grant to the date of vesting. The Employee Benefit Trust retains the carrying cost, with 281 pence per share due back to the Company.
On 12th June 2021 (the "vesting date") the performance criteria were met, after which the members of the scheme became joint beneficial owners of the shares and therefore became entitled to any gain on sale of the shares in excess of 312.6 pence per share. Alternatively, the participant and the Trustee may exchange their respective interests in the jointly-owned shares such that each becomes the sole owner of a number of Ordinary shares of equal value to their joint interests.
There were 254,414 shares where the performance criteria was not met on the vesting date that had been forfeited by departing employees and which remained unallocated within the Employee Benefit Trust as at 31st January 2022.
During the year to 31st January 2023, 18,155 of the 254,414 unallocated shares within the Employee Benefit Trust were transferred to the B.P. Marsh SIP Trust ("SIP Trust") to be used as part of the 22-23 SIP awards made in April 2022. Following this transfer and as at 31st January 2024 there were 1,443,147 shares held within the Employee Benefit Trust, of which there were 236,259 shares where the performance criteria was not met on the vesting date and which remained unallocated. The Employee Benefit Trust remains the owner of these unallocated shares and they do not have dividend and voting rights attached.
On 26th October 2023 following the removal of a dividend waiver and block on voting rights on the 1,206,888 allocated ordinary shares held by the Employee Benefit Trust, these ordinary shares became eligible for dividend and voting rights and therefore became fully dilutive for the Group.
Provided that the shares are eventually sold from the Employee Benefit Trust for at least 284.5 pence per share on average, the Group would be entitled to receive £4,106,259 in total.
During the year 681,648 of the shares held within the Employee Benefit Trust were sold, including 239,400 shares jointly-owned by 3 executive directors of the Company (of which 74,850 shares were sold by an executive director who departed during the year). As at 31st January 2025 761,499 shares remained within the Employee Benefit Trust, of which 236,259 were unallocated.
Of the £4,106,259 receivable by the Group in total, £2,126,259 was received during the year, leaving a balance outstanding of £1,980,000. As such, provided that the remaining shares are eventually sold from the Employee Benefit Trust for at least 260.0p/share on average, the Group will receive this balance in full.
Share Incentive Plan
During the year to 31st January 2017 the Group established an HMRC approved Share Incentive Plan ("SIP").
During the year a total of 22,380 ordinary shares in the Company, which were held in Treasury as at 31st January 2024 (2024: 32,780 ordinary shares in the Company, of which 4,850 were held in Treasury as at 31st January 2023 and 27,930 were bought back into Treasury during that year) were transferred to the B.P. Marsh SIP Trust ("SIP Trust"). As a result, a total of 22,380 ordinary shares in the Company were available for allocation to the participants of the SIP (2024: 32,780 ordinary shares were available for allocation).
On 11th April 2024, a total of 12 eligible employees (including 3 executive directors of the Company) applied for the 24-25 SIP and were each granted 746 ordinary shares ("24-25 Free Shares"), representing approximately £3,600 at the price of issue.
Additionally, on the same date, all eligible employees were also invited to take up the opportunity to acquire up to £1,800 worth of ordinary shares ("Partnership Shares"). For every Partnership Share that an employee acquired, the SIP Trust offered two ordinary shares in the Company ("Matching Shares") up to a total of £3,600 worth of shares. All 12 eligible employees (including 3 executive directors of the Company) took up the offer and acquired the full £1,800 worth of Partnership Shares (373 ordinary shares) and were therefore awarded 746 Matching Shares.
The 24-25 Free and Matching Shares are subject to a 1 year forfeiture period.
A total of 22,380 (2024: 32,780) Free, Matching and Partnership Shares were granted to the 12 (2024: 11) eligible employees during the year, including 5,595 (2024: 8,940) granted to 3 (2024: 3) executive directors of the Company.
86,150 ordinary shares were withdrawn from the SIP Trust during the year due to the departure of three employees, including 33,024 ordinary shares withdrawn by a departing executive director of the Company (2024: No withdrawals).
As at 31st January 2025, and after adjusting for a total of 106,101 ordinary shares withdrawn from the SIP Trust by employees on departure and 11,318 ordinary shares forfeited on departure (since inception), a total of 228,537 Free, Matching and Partnership Shares had been granted to 11 eligible employees under the SIP, including 101,787 granted to 3 executive directors of the Company.
£85,780 of the IFRS 2 charges (2024: £77,492) associated with the award of the SIP shares to 12 (2024: 11) eligible directors and employees of the Company has been recognised in the Statement of Comprehensive Income as employment expenses (Note 5).
The results of the SIP Trust have been fully consolidated within these financial statements on the basis that the SIP Trust is effectively controlled by the Company.
Share Option Plan
On 6th September 2023 the Group established a new employee Share Option Plan ("SOP").
On 17th October 2023 Share Options ("Options") over 1,682,500 ordinary shares of 10p each in the Company, in aggregate, were granted to 12 employees, including 3 executive directors of the Company.
The total number of Options available for allocation amounted to 1,685,970, which represented 4.5% of the Company's total ordinary shares in issue at the time the SOP was adopted. 3,470 Options remained unallocated as at 31st January 2025.
Each of the Options will vest, on a ratchet basis, subject to certain Net Asset Value growth targets being achieved for the three consecutive financial years ending 31st January 2024, 31st January 2025 and 31st January 2026 ("Performance Period"). The first exercise date is 6th September 2026 whereby 50% of vested Options will be exercisable at 10p per share, with the remaining 50% exercisable at 10p per share from 6th September 2027.
The number of Options which vest will vary depending on the level of Net Asset Value growth achieved, subject to the growth performance criteria as set out below, alongside the percentage of Options that will vest at each value:
|
Compounded annual growth of Net Asset Value over the Performance Period |
% vesting of Options |
|
Less than 8.5% |
0% |
|
Between 8.5% and less than 9.25% |
25% |
|
Between 9.25% and less than 10% |
50% |
|
10% or above |
100% |
For these purposes, Net Asset Value is defined as "audited Total Assets less Total Liabilities for the consolidated Group plus any dividends or other form of shareholder return that are paid in the relevant Financial Year".
Therefore, for all Options to vest, the Net Asset Value (as defined above) would need to exceed £252.2m, adjusted for any shareholder distributions.
The details of the arrangements are described in the following table:
|
Nature of the arrangement |
Share options |
|
Form of option |
Asian options |
|
Type of option |
Nominal-cost option |
|
Date of grant |
17th October 2023 |
|
Number of instruments granted |
1,682,500 |
|
Exercise price (pence) |
10.00 |
|
Share price (market value) at grant (pence) |
354.22 |
|
Vesting period (years) |
3 years |
|
Vesting conditions |
The recipient must remain an employee throughout the vesting period. The awards vest after 3 years or earlier resulting from either: a) a change of control resulting from a person, or another company, obtaining control of the Company either (i) as a result of a making a General Offer; (ii) pursuant to a court sanctioned Compromise or Scheme of Arrangement; or (iii) in consequence of a Compulsory Acquisition; or b) a person or another company becoming bound or entitled to acquire shares in the Company pursuant to sections 974 to 991 of the Companies Act 2006; or c) a winding up. In such circumstances, an Option may be exercised at any time during the period of six months following the date of the event. Any Option not exercised within this period shall lapse immediately upon the expiry of the six-month period. If a Participant ceases to be a Group Employee before the Vesting Date by reason of being a Good Leaver, the Pro-rated Portion of their Option shall be capable of vesting on the Cessation Date. If a Participant ceases to be a Group Employee by reason of being a Good Leaver after the Vesting Date but before the Exercise Date the Participant shall be entitled to exercise the vested Shares of such a vested Option at any time after the Exercise Date. |
|
Performance period |
The three consecutive financial years beginning 1st February 2023 (i.e. the three periods ending on 31st January 2026) |
|
Net Asset Value at which Options vest |
10% compound annual growth over the Performance Period, or a Net Asset Value threshold of £252.2m, adjusted for any shareholder distributions, with the percentage of Options vesting as follows: Compound Annual Growth achieved: Less than 8.5%: 0% vest Between 8.5% and less than 9.25%: 25% vest Between 9.25% and less than 10%: 50% vest 10% or above: 100% vest |
|
Exercise period |
50% of the vested options may be exercised immediately after the end of the Performance Period or 6th September 2026 (whichever is the latter) with the remaining 50% being capable of exercise after 6th September 2027 |
|
Expected volatility |
19% annual volatility |
|
Risk free rate |
5% |
|
Expected annual dividends (pence) |
2.78 |
|
Settlement |
Cash settled on sale of shares |
|
% expected to vest (based upon leavers) |
80% |
|
Number expected to vest |
1,346,000 |
|
Valuation model |
Monte Carlo techniques using the assumptions of Geometric Brownian Motion |
|
Fair value per granted instrument (pence) |
75.24 |
|
Charge for year ended 31st January 2025 |
£305,924 |
£305,924 of the IFRS 2 charges (2024: £89,437) associated with the grant of the SOP options to 12 (2024: 12) eligible directors and employees of the Company has been recognised in the Statement of Comprehensive Income as employment expenses.
Since the year end, and as announced on 27th March 2025, 490,000 Options have been granted following the lapse of 490,000 Options due to departing employees, 200,000 of which had previously been granted to a former executive director (as announced on 15th November 2023). These Options have been reallocated to the 11 currently eligible employees under the scheme, including 3 executive directors of the Company.
25. RELATED PARTY DISCLOSURES
The following loans owed by the investee companies (including their subsidiaries and other related entities, and including loans to management where indicated) of the Company and its subsidiaries were outstanding at the year end:
|
2025 |
2024 |
|
|
£ |
£ |
|
|
Alchemy Underwriting Limited |
6,000,000 |
6,000,000 |
|
Dempsey Group Limited |
1,250,000 |
500,000 |
|
The Fiducia MGA Company Limited |
999,000 |
1,481,000 |
|
LEBC Holdings Limited |
- |
3,300,000 |
|
Paladin Holdings Limited |
- |
5,900,500 |
|
Pantheon Specialty Group Limited |
- |
4,536,000 |
|
Pantheon Specialty Limited (formerly Denison and Partners Limited) |
670,000 |
670,000 |
|
Verve Risk Services Limited |
644,209 |
569,209 |
|
Devonshire UW Limited |
1,490,125 |
- |
|
Volt UW Limited |
1,200,000 |
- |
|
SRT & Partners Limited |
2,350,000 |
- |
|
AUD |
AUD |
|
|
Agri Services Company PTY Limited |
1,200,000 |
1,200,000 |
|
USD |
USD |
|
|
XPT Group LLC (including management loans) |
12,287,675 |
6,000,000 |
|
Sage Program Underwriters, Inc. |
150,000 |
150,000 |
|
SGD |
SGD |
|
|
Criterion Underwriting Pte Limited |
120,000 |
120,000 |
|
EUR |
EUR |
|
|
CEE Specialty s.r.o. (including management loans) |
487,860 |
- |
The loans are typically secured on the assets of the investee companies and an appropriate interest rate is charged based upon the risk profile of that company.
In the current year a provision of £74,354 was made against a loan provided to Brown & Brown (Europe) Holdco Limited ("Brown and Brown"). The loan of £524,253 was made to Brown and Brown in the prior year in relation to the Group's disposal of its investment in Kentro Capital Limited in October 2023, alongside other major selling shareholders in respect of certain identified indemnities under the Sale and Purchase Agreement. In the current year, following notification of the actual specified claims, against which the £74,354 provision was made, the Group received repayment of the remaining loan balance of £449,899. No further amounts are expected to be recovered in relation to this loan.
The loans of £425,831 to Bastion Reinsurance Brokerage (PTY) Limited (2024: £425,831), £665,000 to Bulwark Investment Holdings (PTY) Limited (2024: £665,000) and £1,450,778 to Property and Liability Underwriting Managers (PTY) Limited (2024: £1,450,778) have been written off as these businesses are in the process of being dissolved with no expectation of recovery.
Income receivable, consisting of consultancy fees, interest on loans and dividends recognised in the Consolidated Statement of Comprehensive Income in respect of the investee companies (including their subsidiaries and other related entities) of the Company and its subsidiaries for the year were as follows:
|
2025 |
2024 |
|
|
£ |
£ |
|
|
Agri Services Company PTY Limited |
171,802 |
190,685 |
|
Alchemy Underwriting Limited |
738,904 |
254,110 |
|
Asia Reinsurance Brokers Pte Limited |
- |
17,702 |
|
ATC Insurance Solutions PTY Limited |
595,207 |
457,722 |
|
Brown & Brown (Europe) Holdco Limited |
35,445 |
5,399 |
|
CEE Specialty s.r.o. |
93,292 |
- |
|
Dempsey Group Limited |
119,936 |
87,505 |
|
Devonshire UW Topco Limited |
209,677 |
- |
|
The Fiducia MGA Company Limited |
145,686 |
192,946 |
|
Kentro Capital Limited |
- |
637,709 |
|
LEBC Holdings Limited |
598,129 |
854,337 |
|
Lilley Plummer Holdings Limited |
669,919 |
441,643 |
|
Neutral Bay Investments Limited |
122,394 |
118,508 |
|
Paladin Holdings Limited |
141,357 |
1,208,851 |
|
Pantheon Specialty Group Limited |
1,299,372 |
180,292 |
|
Pantheon Specialty Limited (formerly Denison and Partners Limited) |
78,120 |
85,926 |
|
Sage Program Underwriters, Inc. |
51,915 |
51,813 |
|
SRT & Partners Limited |
119,260 |
- |
|
Stewart Specialty Risk Underwriting Limited |
691,862 |
674,610 |
|
Verve Risk Services Limited |
116,461 |
132,166 |
|
Volt UW HoldCo Limited |
123,541 |
- |
|
XPT Group LLC |
1,603,424 |
1,828,713 |
In addition, the Group made management charges of £41,000 (2024: £39,000) to the Marsh Christian Trust ("the Trust"), a grant making charitable Trust, of which Brian Marsh, the Executive Chairman and a significant shareholder of the Company, is also the Trustee and Settlor.
The Group also made management charges of £9,600 (2024: £8,000) to Brian Marsh Enterprises Limited ("BME"). Brian Marsh, the Chairman and a significant shareholder of the Company is also the Chairman and majority shareholder of BME.
All the above transactions were conducted on an arms-length basis.
Of the total dividend payments made during the year of £3,963,981, £1,571,327 was paid to the directors or parties related to them (2024: total dividend payments of £2,028,206, of which £857,193 was paid to the directors or parties related to them).
26. EVENTS AFTER THE REPORTING DATE
Group
On 19th March 2025 the Group provided Pantheon Specialty Group Limited ("Pantheon") with further loan funding of £1,000,000. As at 31st January 2025 no loans were outstanding to the Group from Pantheon, and following the aforementioned draw down total loans stand at £1,000,000 at the date of this report.
As at 31st January 2025 the Group had provided loans of £1,200,000 from a total loan facility of £2,500,000 to Volt UW HoldCo Limited. On 20th March 2025 a further £300,000 was drawn down. Total loans stand at £1,500,000, with a remaining undrawn facility of £1,000,000 at the date of this report.
On 27th March 2025 490,000 Options were granted under the Group's Share Option Plan ("SOP") following the lapse of 490,000 Options due to departing employees, 200,000 of which had previously been granted to a former executive director (as announced on 15th November 2023). These Options have been reallocated to the 11 currently eligible employees under the scheme, including 3 executive directors of the Company.
On 16th April 2025 the Group received further consideration of £9,172,141 from the disposal of its investment in Paladin Holdings Limited ("Paladin") to Specialist Risk Group Limited which completed on 22nd March 2024. The payment represents the first tranche of deferred contingent consideration due to the Group which is based upon Paladin achieving 20% EBITDA growth targets above its actual adjusted EBITDA for 2023 in respect of its 2024 financial year and brings the total consideration received by the Group to £53,187,903 at the date of this report. As outlined in Note 12, the Group will be entitled to receive further deferred contingent consideration if this growth target is also achieved in respect of Paladin's 2025 financial year, payable in 2026. There is also the possibility for the Group to receive further consideration in FY25 should Paladin outperform these growth targets.
On 17th April 2025, the Group announced a new Share Buy-back Programme, replacing the policy previously announced on 11th June 2024 (and subsequently updated on 2nd October 2024 and 31st October 2024). The Group has entered into an irrevocable commitment with Singer Capital Markets to manage the Programme through a non-discretionary programme, repurchasing the Company's Ordinary Shares on its behalf, for up to a maximum aggregate consideration of £2,000,000 (previously £1,000,000), and within certain defined parameters. Singer Capital Markets will make trading decisions in relation to the buyback of Ordinary Shares independently of the Company within the programme terms and will therefore have the ability to trade during close periods. Share repurchases will take place in open market transactions and may be made from time to time depending on market conditions, share price, trading volume and other terms. The maximum price paid per Ordinary Share will be no more than the higher of (a) 5% (previously 10%) above the average middle market quotations for an Ordinary Share (as derived from the AIM Appendix to the London Stock Exchange Daily Official List) for the five business days immediately prior to the day the purchase is made and (b) the higher of the price of the last independent trade and the highest current independent purchase bid for Ordinary Shares on the trading venue where the purchase is carried out. At a General Meeting held on 2nd June 2025, shareholders approved the renewal of the Company's general authority to purchase a maximum of 10% of the Company's issued ordinary share capital. Shareholders also authorised the Company to make such purchases without triggering a mandatory offer obligation on the Brian Marsh Concert Party, provided that the resultant shareholding of the Brian Marsh Concert Party does not exceed 42.5%. of the ordinary shares in issue (excluding any held in treasury).
On 23rd April 2025 the Group acquired an 8% equity stake in iO Finance Partners Topco Limited ("iO Partners"), via a mixture of preferred and ordinary shares, for consideration of £10,000,000. iO Partners is a buy-and-build opportunity within the alternative financing market, intending to bring together a diverse group of alternative finance providers to support and grow the UK economy and SME market.
On 9th May 2025, following a successful Secondary Share Placing, new investors became shareholders in the Company through a two-stage secondary share acquisition, as existing investors increased their holdings and new investors became shareholders via transactions facilitated by the sale of shares by PSC UK Pty Limited, a subsidiary of The Ardonagh Group Limited. 1,936,881 ordinary shares, representing approximately 5.2% of the Company's issued share capital, were successfully placed with institutional investors at a price of 630p per share, totalling £12,202,350. Following strong residual demand, a further 1,822,183 shares (approximately 4.9% of issued capital) were sold to a single institutional investor, Wellington Management Group LLP. The Group did not receive any of the £23,682,103 gross proceeds from the transactions.
On 30th May 2025 the Group completed the disposal of its c.19.7% investment in Sterling Insurance PTY Limited ("Sterling"), held via a 49.9% equity holding in Neutral Bay Investments Limited. Sterling was acquired by ATC Insurance Solutions PTY Limited ("ATC"), in which the Group is also a shareholder. Under the terms of the transaction ATC has acquired 100% of Sterling and the Group's consideration for the sale of AUD 6,542,481 (c.£3.1m) will be received in shares in ATC. The expected consideration to be received (subject to foreign exchange translation) is in line with the Group's carrying value of Sterling at 31st January 2025. Following receipt of the consideration, the Group's shareholding in ATC will increase from 25.56% as at 31st January 2025 to 27.0%.
On 4th June 2025 the Group acquired a 49% equity stake in Amiga Specialty Holdings Limited ("Amiga") for a nominal consideration of £49. Amiga is a start-up entity which is looking to build an international specialty underwriting agency, with a diverse portfolio of specialty products across key international markets, both organically and via a targeted M&A strategy. The Group also provided Amiga with a loan facility of up to £10,000,000, of which £500,000 was drawn down on completion, with a remaining undrawn facility of £9,500,000 at the date of this report.
On 5th June 2025, LEBC Holdings Limited ("LEBC"), an investee company of the Group, received the first tranche of deferred contingent consideration due over a three year earn-out period in respect of the sale of 100% of Aspira Corporate Solutions Limited ("Aspira"), a wholly-owned subsidiary of LEBC, to Titan Wealth Holdings Limited which completed in April 2024. The Group is expecting to receive its pro-rata share of the deferred contingent consideration of c.£5,900,000 once onward distribution of the proceeds has been finalised by LEBC. Further proceeds are expected to be received by the Group in 2026 and 2027 and as part of the first payment, all future performance criteria required for the payment of the remaining two deferred consideration payments have been removed.
Company
On 30th May 2025 the Company's subsidiary undertaking, B.P. Marsh & Company Limited, paid a dividend of £16,500,599 (6.549 pence per share) to the Company. This distribution was made in order to provide the Company with sufficient aggregate distributable reserves to allow for the payment of future dividends and to undertake share buy-backs.
27. FINANCIAL RISK MANAGEMENT
This note explains the Group's exposure to financial risks and how these risks could affect the Group's future financial performance. Current year profit and loss information has been included where relevant to add further context.
The Group's operations expose it to a variety of financial risks. The Group manages the risk to limit the adverse effects on the financial performance of the Group by monitoring those risks and acting accordingly.
The monitoring of the financial risk management is the responsibility of the Board. The policies of the Board of directors are implemented by the Group's various internal departments under specific guidelines.
The Group is a selective investor and each investment is subject to an individual risk assessment through an investment approval process. The Group's Investment Committee is part of the overall risk management framework. The risk management processes of the Company are aligned with those of the Group and both the Group and the Company share the same financial risks.
Price risk
The Group is exposed to private equity securities price risk as it invests in unquoted companies. The Group manages the risk by ensuring that a director of the Group is appointed to the board of each investee company. In this capacity, the appointed director can advise the Group's Board of the investee companies' activities and prompt action can be taken to protect the value of the investment. Monthly management reports are required to be prepared by investee companies for the review of the appointed director and for reporting to the Group Board.
A 10% change in the fair value of those investments would have the following direct impact on the Consolidated Statement of Comprehensive Income:
|
Group |
Company |
||||
|
2025 |
2024 |
2025 |
2024 |
||
|
£'000 |
£'000 |
£'000 |
£'000 |
||
|
Fair value of investments - equity portfolio |
224,095 |
165,382 |
290,359 |
190,860 |
|
|
Impact of a 10% change in fair value on Consolidated Statement of Comprehensive Income |
22,410 |
16,538 |
29,036 |
19,086 |
|
Credit risk
The Group is subject to credit risk on its unquoted investments, cash and deposits. The maximum exposure is the amount stated in the Consolidated Statement of Financial Position.
The credit quality of unquoted investments, which are held at fair value and include debt and equity elements, is based on the financial performance of the individual portfolio companies. The credit risk relating to these assets is based on their enterprise value and is reflected through fair value movements.
The Group is exposed to the risk of default on the loans it has made available to investee companies. The loans rank in preference to the equity shareholding and the majority are secured by a charge over the assets of the investment. The Group manages the risk by ensuring that there is a director of the Group appointed to the board of each of its investee companies. In this capacity, the appointed director can advise the Group's board of investee companies' activities and prompt action can be taken to protect the value of the loan, such that the directors believe the credit risk to the Group is adequately managed. When a loan is assessed to be likely to be in default then the Group will review the probability of recoverability, and if necessary, make a provision for any amount considered irrecoverable.
The Group's cash is held with a variety of different counterparties with 100% (2024: 100%) held with A rated institutions.
Liquidity risk
The Group invests in unquoted early stage companies. The timing of the realisation of these investments can be difficult to estimate. The directors assess and review the Group's liquidity position and funding requirements on a regular basis and this is an agenda item for its Board meetings. A key objective is to ensure that the income from the portfolio covers operating expenses such that funds available for investment are not used for working capital. The Group regularly reviews the cash flow forecast to ensure that it has the ability to meet commitments as they fall due and to manage its working capital. The Board considers that the Group has sufficient liquidity to manage current commitments.
As at 31st January 2025 the Group had no borrowings (31st January 2024: no borrowings).
Interest rate risk
Interest rate risk arises from changes in the interest receivable on cash and deposits, on loans issued to investment companies and on certain preferred dividend mechanisms linked to an interest rate. In addition, the risk arises on any borrowings with a variable interest rate. At 31st January 2025, the Group did not have any interest bearing liabilities but did have interest bearing assets. The majority of loans provided by the Group are subject to a minimum interest rate to protect the Group from a period of low interest rates, and also a hurdle rate linked to the UK Base Rate.
An increase of 100 basis points, based upon the Group's closing balance sheet position of its interest bearing assets, excluding any future contractual loan repayments and loan balances provided against at the year end, over a 12-month period, would lead to an approximate increase in total comprehensive income of £270,000 for the Group (2024: £281,000 increase).
Currency risk
The Group currently has substantial exposure to foreign investment and derives income outside the UK. As such some of the Group's income and assets are subject to movement in foreign currencies which will affect the Consolidated Statement of Comprehensive Income in accordance with the Group's accounting policy. The Board monitors the movements and manages the risk accordingly.
At 31st January 2025, 65% of the Group's net assets were sterling denominated (2024: 66%). The Group's general policy remains not to hedge its foreign currency denominated investment portfolio.
The Group's net assets in US Dollar, Australian Dollar, Euro and all other currencies combined are shown in the table below. The sensitivity analysis has been undertaken based upon the sensitivity of the Group's net assets to movements in foreign currency exchange rates, assuming a 10% movement in exchange rates against sterling. The sensitivity of the Company to foreign exchange risk is not materially different from the Group.
|
As at 31st January 2025 |
Sterling |
Australian dollar |
US dollar |
Euro |
Other |
Total |
|
£'000 |
£'000 |
£'000 |
£'000 |
£'000 |
£'000 |
|
|
Net assets |
212,004 |
37,171 |
60,205 |
2,760 |
14,270 |
326,410 |
|
Sensitivity analysis |
||||||
|
Assuming a 10% movement of exchange rates against sterling |
||||||
|
Impact on net assets |
N/A |
(3,352) |
(5,132) |
(19) |
(1,297) |
(9,800) |
|
As at 31st January 2024 |
Sterling |
Australian dollar |
US dollar |
Euro |
Other |
Total |
|
£'000 |
£'000 |
£'000 |
£'000 |
£'000 |
£'000 |
|
|
Net assets |
152,386 |
25,540 |
39,375 |
- |
11,870 |
229,171 |
|
Sensitivity analysis |
||||||
|
Assuming a 10% movement of exchange rates against sterling |
||||||
|
Impact on net assets |
N/A |
(2,294) |
(3,363) |
- |
(1,079) |
(6,736) |
New investment risk
An inherent risk of realising an investment is the loss of a performing asset and a potential lack of suitable new investments to replace the lost income and capital growth. Prior to reinvestment, returns on cash can be significantly lower, which may reduce underlying profitability on a short-term basis until funds are reinvested. The Group has an active Investment Department which continues to receive a strong pipeline of new investment opportunities. In addition, there is often potential for further investment within the Group's existing portfolio.
Concentration risk
Although the Group only invests in financial service businesses, and specifically insurance intermediaries, the Group has a wealth of experience in this specific sector. It seeks to manage concentration risk by making investments across a variety of geographic areas, development stages of business and classes of product. Quantitative data regarding the concentration risk of the portfolio across geographies can be found in the Segmental Reporting analysis in Note 2.
Political risk
As a UK domiciled business with overseas investments, the Group is exposed to the risks associated with changes in UK foreign policy and overseas political regimes. The Board is continually assessing the impact of these on the Group and its underlying investments, however the direct impact on the Group's investment portfolio of these has not been material to date. It remains the Group's intention to continue to invest into the international financial services market. As outlined under 'Currency risk' above, the Group continues to monitor the movements in its foreign currency denominated income and assets and manages this risk accordingly.
Ongoing geopolitical events and inflation risk
The Group is exposed to the risks associated with the ongoing geopolitical events. The Board continually assesses the potential impact of such events and the potential impact on the Group and its underlying investments. Whilst the Group may not have any direct investments in the affected regions, the impact on the wider global economy and associated disruption to capital markets, foreign exchange volatility, price inflation and supply chain issues could affect both the Group's operations and those of its investment portfolio, which could, in turn, impact the future performance of the Group.
The Board is continually assessing the wider economic impact of such events on the Group and its investment portfolio and whilst there has been price inflation which has led to interest rate increases, and volatility within foreign exchange currency rates, certain investments within the Group's portfolio have seen premium rate increases and thus increased commission. Therefore at the current time the Group does not consider these events and inflation to have had a material impact upon the Group.
28. ULTIMATE CONTROLLING PARTY
The directors consider there to be no ultimate controlling party.
Notice
The financial information set out above does not constitute B.P. Marsh & Partners Plc's statutory accounts for the year to 31 January 2025 but is derived from those accounts. The statutory accounts for the year to 31 January 2025 have not yet been delivered to the Registrar of Companies. The auditors have reported on those accounts and have given the following opinion:-
· the financial statements give a true and fair view of the state of the Group's and of the Parent Company's affairs as at 31 January 2025 and of the Group's profit for the year then ended;
· the Group financial statements have been properly prepared in accordance with UK-adopted international accounting standards;
· the Parent Company financial statements have been properly prepared in accordance with UK-adopted international accounting standards; and
· the financial statements have been prepared in accordance with the requirements of the Companies Act 2006.
Approval
The financial statements were approved by the Board of Directors on 9 June 2025 for their release on 10 June 2025.
-Ends-