
1 May 2024
Concurrent Technologies Plc
(the "Company" or the "Group")
Full year results for the year ended 31 December 2023
Solid year of growth providing confidence in updated strategy
Concurrent Technologies Plc (AIM: CNC), a designer and manufacturer of leading-edge computer products, systems and mission critical solutions used in high-performance markets by some of the world's major OEMs, is pleased to announce its results for the year ended 31 December 2023.
Financial highlights
|
2023 |
2022 |
% change |
|
|
Revenue |
£31.7m |
£18.3m |
73% |
|
Gross profit |
£15.6m |
£8.9m |
49% |
|
Profit before tax & exceptionals |
£3.7m |
£0.4m |
959% |
|
Earnings per share |
4.98p |
1.35p |
- |
|
Dividend per share |
1.0p |
0p |
- |
|
EBITDA |
£6.0m |
£2.1m |
- |
|
Order intake |
£28.2m |
£31.5m |
|
|
Closing Cash |
£11.12m |
£4.51m |
146% |
|
Investment in R&D |
£3.80m |
£3.69m |
3% |
|
Total assets |
£47.8m |
£32.6m |
48% |
|
· |
Strong financial performance in FY23, achieving revenues of £31.7m and profit before tax of £3.7m (excluding exceptional costs), notwithstanding a significant investment in the cost base throughout the year to accelerate future growth. |
|
· |
Gross profit margin increased to 49.4% (FY22 48.5%) reflecting easing components challenges and operational efficiency gains. |
|
· |
EBITDA more than doubled to £6.0m (FY22 £2.1m). |
|
· |
Cash generative with closing net cash balance at £11.12m. |
|
· |
Increasingly optimised R&D investment in line with stated strategy to improve the cadence and time to market of products that offer the very latest technology. |
Dividend
|
· |
The Board will propose, at the Annual General Meeting to be held on 20 June 2024, a final dividend of 1 pence per Ordinary Share in the Company. Subject to the approval of shareholders, the final dividend will be paid on 12 July 2024 to shareholders on the register on 28 June 2024. |
|
· |
Further details of the Annual General Meeting will be announced in due course. |
Operational highlights
|
· |
Worked closely with suppliers and customers to successfully manage the supply chain issues that previously impacted performance and the Board is pleased to report that these factors eased as the year progressed. |
|
· |
Continued to transition the business towards a culture and go-to-market strategy that is positioned to scale. |
|
· |
Increased headcount by c.18%, with key hires in product strategy, engineering, commercial, and finance. |
Systems division
|
· |
Secured first substantial systems contract at £1.27m in June 2023 with a UK FTSE 250 company in the defence sector. |
|
· |
Successful acquisition of Phillips Aerospace in the US enabling the Company to move further into the development of systems, providing a platform for future growth. |
Boards division
|
· |
Secured eight major design wins, representing an expected lifetime value to the business of at least £100m, to be realised from 2026 onwards, in the UK and a significant majority in the US, the world's largest market. |
|
· |
£5m of orders from the UK, a five-fold increase on typical prior volumes. |
|
· |
Introduction of numerous new processes, practices, and state-of-the-art tools to enhance design efficiency and quality in FY24 across the Group's key markets. |
Outlook
|
· |
Strategic focus remains on developing and designing boards and systems at pace for a range of applications to deliver on the Group's short-term financial targets and the longer-term lifetime value. |
|
· |
Demand for the Group's product remain high, and the Company is developing a pipeline of opportunities which include, COTs (commercial off the shelf), MOTs (Modified off the shelf) and Systems. |
|
· |
The Group entered FY24 with good momentum evidenced by the $1.57m contract win with a major global US Prime Contractor and new VME board launched, Rhea. |
|
· |
Trading in the first four months of the year is in line with market expectations, providing confidence in delivering another year of profitable growth. |
Miles Adcock, CEO of Concurrent Technologies, commented: "We achieved remarkable success in FY23, putting in place the building blocks that will enable us to deliver long-term, sustainable growth. This is driven by significant design-in wins and strategic investment in the Systems division, including the acquisition of Phillips Aerospace.
"During the year, there was a step change in how the Group invests in marketing, sales, and partnerships to expand our market opportunities. Looking ahead, we will remain focused on leveraging the knowledge and the long-standing relationships the leadership team has developed to invest in a measured way to design boards and systems for a range of applications. As a Board we are confident in the Group's ability to continue building momentum and deliver results for FY24 in line with market expectations."
Enquiries:
|
Concurrent Technologies Plc Kim Garrod - CFO |
+44 (0)1206 752626 |
|
Alma Strategic Communications Hannah Campbell |
|
|
Peter Lynch |
+44 (0)131 220 9772 |
About Concurrent Technologies Plc
Concurrent Technologies Plc develops and manufactures high-end embedded Plug In Cards and Systems for use in a wide range of high performance, long life cycle applications within the telecommunications, defence, security, telemetry, scientific and aerospace markets, including applications within extremely harsh environments. The processor products feature Intel® processors, including the latest generation embedded Intel® Core™ processors, Intel® Xeon® and Intel Atom™ processors. The products are designed to be compliant with industry specifications and support many of today's leading embedded Operating Systems. The products are sold world-wide.
For more information on Concurrent Technologies Plc and its products please visit www.gocct.com.
All trademarks, registered trademarks and trade names used in this announcement are the property of their respective owners.
Chairman's statement
Overview
FY23 was another step in the transformation of Concurrent Technologies into a high-growth business by leveraging our design heritage and market leadership position through the continued investment in our culture, people, sales and marketing and, more broadly, driving a step change in our go-to-market strategy.
In the year, we delivered both record revenues and profit, underpinned by the successful execution of the Group's refreshed strategy. We are focused on developing a broader range of products and systems, in addition to our boards business, both organically and through acquisition. This positions the business for long-term growth, and this year has solidified our view that we now have the right strategic focus and people in place to achieve our ambitions.
The year in review
The first half of the year saw a recovery in trading thanks to the increased customer demand for the Group's products and the team's incredible effort in navigating the previous component shortage issues. This momentum continued into the second half of the year and, for FY23, the Company delivered record revenues and profitability.
Cash balances remain strong, buoyed by the raising of £6.8m through the placing of new ordinary shares to new and existing shareholders in August to partly fund the acquisition of Phillips Aerospace, leaving us in a strong position to invest in the systems business further. On behalf of the Board, I would like to thank all investors who participated in the oversubscribed placing.
Execution against strategy
Throughout the year, Concurrent Technologies achieved significant milestones in line with its strategic objectives. We secured eight substantial design wins, underscoring the excellence of our products and engineering capabilities. These wins will ramp up in the coming years in line with our customers' programmes, but they provide long-term, multi-year revenue visibility, which supports the investment plans in our R&D roadmap.
Additionally, we released several new cutting-edge products in the year that have enriched our portfolio. We remain committed to investing in our product portfolio and capabilities and we are optimistic about the opportunities in FY24 to expand into new markets and deepen our presence within our home markets.
Our end markets remain robust, and we have not only deepened several key relationships with existing customers and partners in the year but, importantly, we are now seeing the opportunity to engage with new customers, servicing a range of projects and geographies, and expect to have the opportunity to bid on larger programmes we were not historically considered for.
The acquisition of Phillips Aerospace in September 2023 marked a significant milestone for the business and has supported our strategic goal of adding both systems capability and US-based manufacturing. We welcome our new Phillips Aerospace colleagues to the Group and recognise the additional talent and skills they bring to our ever-more expert team. The early impact of the acquisition has been positive, and we believe it will significantly improve the Company's capability to design and manufacture rugged systems utilising its existing plug-in cards.
Board
Post-period end, we further strengthened our Board with the appointment of Issy Urquhart as an independent Non-Executive Director to the Company. Issy is an experienced commercial human resources (HR) director with over 30 years' experience working with global technology and financial services businesses in both the public and private sectors. She has joined the Group at a particularly exciting time, and we are already benefiting from her guidance in driving people and change management strategies across our transatlantic operations.
Dividend
With the return to profitability, a 1.0p dividend has been proposed for shareholder approval at the annual general meeting (AGM) which, if passed, will amount to £862,000 paid in early July 2024. Going forward, the Board anticipates dividends will increase in line with profits, with an appropriate level of cover maintained to enable investment for future growth.
Outlook for FY24
In FY24 our strategic focus will remain on developing and designing boards and systems at pace for a range of applications. The year will also see us continue our investment in systems and onboarding new programmes to deliver on our short-term financial targets. Alongside this, a combination of our product leadership and a drive to expand our presence in our focus sectors should deliver a significant increase in multi-year contracts in the medium term.
Mark Cubitt
Chairman
CEO's statement
Overview
FY23 was an outstanding year both financially and operationally. As the headwinds of the global components shortages subsided during the year, the underlying progress in order intake and execution has been reflected in the Group's results, particularly in the second half. Solid progress was also made on our strategic priorities, including the acquisition of Phillips Aerospace in the US, and a material increase in our 'major design wins' that underpin a real step up in revenues in future years as our customers ramp up production and reach their own planned delivery volumes. With a significant investment in additional managerial, technical and sales professionals, we now have an excellent team in place to take the business forward for a period of growth. It is clear the revised strategy and associated transformation are coming together and, as a Board, we are extremely excited about the Group's future.
Financial performance
FY23 was a record year for the Group, achieving revenues of £31.7m (FY22: £18.3m) and profit before tax (excluding exceptional costs of £0.2m, related to the acquisition of Phillips Aerospace) of £3.7m, notwithstanding a significant investment in the cost base throughout the year to accelerate future growth. The strength of our order intake over the preceding 24 months enabled this significant investment in product development to facilitate new customers and design wins. We also worked closely with suppliers and customers to successfully manage the supply chain issues that previously impacted performance and we are pleased to report that these factors eased as the year progressed. Our gross margin has now stabilised, with a slight improvement on FY22. We do believe FY24 should be predominantly unhindered by the issues of the last two years regarding component availability and resulting price pressures.
On 6 September 2023, the Company completed the acquisition of Phillips Aerospace for $3.3m (£2.8m) through a combination of $1.1m (£0.8m) cash, the issue of equity of $1.5m (£1.3m) to the owners of Phillips Aerospace and a further $0.8m (£0.7m) cash in repayment of outstanding loans balances within Phillips Aerospace. Simultaneously, the Company raised £6.8m through the issue of fresh equity to broaden our product offering and strengthen the balance sheet to drive further growth.
Investing for growth amid supply chain shortages inevitably impacted cash. Having started the year at £4.5m, the first half of FY23 experienced a net outflow of £1.5m to a cash balance low of £3m in June. As shipments, and hence invoicing, strengthened, the business reverted to being cash generative, with a year-end cash balance of £11.12m. Q4 was our most productive period, for which only some of the associated customer invoices were paid in 2023, with £5.4m of FY23 revenue to be collected as cash in Q1 FY24, as per our payment terms with customers.
In-year order intake of £28.2m remains strong, despite c.£8m of a small number of large orders slipping into FY24. In all cases, these are opportunities we are down-selected for (i.e. we already secured the design win), but the customers' programme of work experienced delays vs expectations. Positively, this had little detrimental impact on in-year revenue. While we expect order intake to continue to build in FY24 and FY25, it is in subsequent years that we will experience the material benefit of the design wins secured in FY23. This focus on design wins is a large investment in time and activity, since they are typically larger and more strategic business-winning campaigns. While they yield little immediate business benefit, the impact on the medium-to-long-term business is transformative in terms of scale. We intend to ever-increase the number of design wins secured each year. We expect the design wins secured in FY23 to yield a significant lifetime value of at least £100m to be realised from FY26 onwards.
Having already doubled the capacity of our Colchester, UK-based factory, we are planning to enhance both internal and external capacity to accommodate this growth, and indeed any major binary upside opportunities that will require a further capacity increase.
Delivery against strategy
With a year-on-year increase in revenue of over 70%, it is clear our revised strategy and focus on creating a sustainable, high-growth business is delivering the intended results. The Company now comprises two divisions: a Boards division and a nascent Systems division, which we expect to represent an increasing percentage of Group sales in the coming years. The refreshed sales team is core to delivering the Company's strategy, and the level of order intake and revenue delivery in FY23 are evidence of their capability.
Boards division
This is our long-standing business that designs and manufactures computer boards, where we have substantial expertise and a reputation for quality and collaboration. During FY23, we continued to transition the business towards having a culture and go-to-market strategy that is positioned to scale. The strategy here is simple: to provide the right product to market as quickly as possible, with a refreshed focus on customer engagement utilising talented engineers and sales professionals. We have now created a team, cost base and sales strategy capable of delivering c.£40m per annum, before any other material investment is required.
As demonstrated by the revenue performance during FY23 H2, the business has already made material progress and is now positioned to deliver much higher volumes thanks to the investment we have made in expanding the capacity in our Colchester factory. Much of our business in boards is secured via 'design wins', whereby a customer designs us into their own programme, and we can then plan for purchase orders in future years as they reach their own production volumes, typically two to three years after the initial design win. A 'major design win' is one with the potential to achieve peak volumes of >£1m per annum for several consecutive years. Historically, the Company may have secured one or two major design wins per annum. In FY23, we secured eight major design wins, which is an extremely positive leading indicator for future growth, representing a lifetime value to the business of at least £100m. Every region is important to us, but the UK and US are our home markets in which we have a material presence operationally. I am pleased to confirm that we won over £5m of orders from the UK in FY23, a five-fold increase on typical prior volumes.
The boards division has been through significant transformation in all aspects during the year and is now fit to focus on execution in FY24 across our key markets. We are exploring options for additional internal and external capacity in line with our anticipated continued order intake growth in the medium term.
Concurrent Technologies is a Titanium member of the Intel® Partner Alliance, meaning we get direct support from Intel® with allocated resources. In addition, our applications for early access to future silicon are given priority over Gold members and we've been successful in all our recent applications. We also have access to Intel®'s 'Market Development Funds' programme, which allows us to claim a percentage of our marketing costs back if we explicitly promote that we're using Intel® devices. Having our products on the Intel® Partner Showcase enables Intel® salespeople globally to search for our products easily.
Systems division
Since I joined the Company in 2021, we have explored ways to enter the systems market and move up the value chain by supplying whole systems rather than single boards, enabling us to generate substantially higher revenues and open up new market opportunities. We have made excellent progress this year; the systems line of business now includes the acquired Phillips Aerospace in the US in addition to the capability in the UK business, which will be moved out of the boards line of business going forward. This means that from FY24 we will report the top-level financials of both boards and systems individually. This is to give increased transparency and also recognises that each will have different characteristics financially. For example, average sell prices for systems are typically higher, but gross margins are less than for boards because there is more third-party content. Systems will also often include upfront funding from customers for the design of their customer solution. While we do not currently have a business unit structure (with the exception of the acquired business), this will likely be implemented as revenue from systems grows, in order to provide the necessary, dedicated focus and resources on this business.
In the first half of FY23, we won a £1.27m contract for a UK-based system, providing validation of our proposition and capability. The addition of Phillips Aerospace provides a further platform for the Systems division to be a core part of our future growth. Previously, Phillips Aerospace had designed and manufactured our initial standard products for systems, meaning both teams had a successful history of working together and integration post-acquisition was seamless. We have welcomed a highly capable team into the Group, who provide the credibility needed to win and deliver systems solutions that complement our existing boards business. The Board has been encouraged by the level of motivation and integration that the Phillips Aerospace senior management team has shown, contributing significantly to the technical and managerial community within the Group. Revenue contribution by the Phillips Aerospace business since the completion of the acquisition is approximately £0.8m, slightly stronger than we had expected based on the prior annual performance. The Board expects this to increase significantly as systems contracts are secured in the future.
Acquisitive growth
In the medium term, we believe there are a range of opportunities to expand our capability, customer list and market penetration through acquisition. The acquisition of Phillips Aerospace is a good example of our acquisition criteria: a business we knew well; a business that had long-standing customer relationships; and an opportunity for us to add new product expertise, additional major customers, appropriate necessary accreditations and strengthening of our position in our chosen home markets. We are excited by our opportunity to significantly scale Concurrent Technologies organically over the next few years, but we have a clear target to participate in industry consolidation and add to our growth and offering by acquiring leading businesses where possible.
R&D
We continue to focus on investing in R&D in line with our strategy to improve the cadence and time to market of our products that offer the very latest technology.
At the same time that Intel® launched its Raptor Lake-P processor for the embedded market, we announced Hermes, our latest flagship board based on the VPX standard for critical defence applications at the edge. This was our first card based on Intel®'s hybrid architecture consisting of six performance and eight efficient cores, allowing our customers to scale their performance to fit their power and thermal envelope.
In Q3, to meet a key customer need, we shipped a new variant of one of our popular boards with double the amount of memory. We were able to react extremely quickly to secure a critical long-term design win with this variant against strong competition, demonstrating that our robust processes and revitalised culture are succeeding.
We also announced a rugged board to the CompactPCI standard that is still widely used for industrial and defence applications. This was deliberately backwards compatible with legacy cards to secure design wins where programs are undergoing a technology transition extending the life span.
In Q4, we announced our highest-performance processor board, using 'Air Flow Through' technology. This and our first Air Flow Through card, a novel technology for a cooling board that was announced in FY22, are being integrated by the end customers and, having learned a lot by designing boards, we are looking to offer integrated Air Flow Through systems in the future.
To interconnect our processor boards with systems, we introduced a high-performance dual enclave switch. This supports separate 100Gb Ethernet data and 10Gb Ethernet control connections to each board. Having physical data and control separation is critical in many defence applications to ensure security between the two enclaves.
Post-period end, we announced the launch of the Rhea VME single-board computer, which coincided with the launch of Intel®'s latest Atom processor, to harness this very latest technology for customers looking for a simple, cost-effective upgrade.
The product portfolio strengthens with continued investment in R&D and sales, enabling a strong pipeline of opportunities, and conversion of these, to underpin future revenue growth.
Partnerships
As part of our strategy to develop a broader range of products and services, securing and maintaining partnerships is critical for expanding the size and markets available to us.
In H1 FY23, we signed a distribution agreement with SoC-e, an internationally recognised provider of advanced equipment for real-time and deterministic Ethernet networking for critical sectors, to enhance our product offering. The collaboration enables us to enhance our leading range of solutions and systems to our home and global markets with the addition of time-sensitive networking capability, which we are starting to see as a requirement for future combat platforms. We also secured a key partnership agreement with Alpha Data to act as a reseller of its field programmable gate array- (FPGA) based boards and modules.
In H2 FY23, we showcased our defence-related products at the DSEI Exhibition, Europe's largest defence and aerospace show. We worked with partners like Alpha Data and SoC-e to demonstrate our integration capability by showing products like Helios, our new rugged vision computer.
Markets
Defence is the dominant target market for the Group, now accounting for 85% of our board revenue. Industrial (6%), medical (5%) and scientific (4%) are our other important domains.
People and ESG
In recent years, we have assembled a Board and Leadership Team with experience in transforming businesses and growing sales globally, and our success in FY23 is due to the efforts of this driven, refreshed team. During the year, we increased headcount by 17.8%. Attracting and retaining talent is core to our strategy, and I am delighted that in November 2023 we were awarded Gold status by the 5% Club, recognising that more than 5% of our workforce is engaged in 'earn & learn' learning programmes.
Culture change
We believe that culture is what you do and how you behave and that it drives business performance, so we have taken deliberate and active action partnering with Coode Associates to create the company culture that is right for us. Our target culture includes a renewed focus on output, collaboration, empowerment and growth, which in turn has positively impacted our productivity and output.
We will continue to instil this through the business, led by our Leadership Team who, on a daily basis, demonstrate and represent our culture. We have invested heavily in our leadership capability to lead our culture and will continue to do so at all levels.
ESG
We are continuing with our significant transformation to deliver more products faster to market through operational excellence and refined governance. Our key focus for ESG is our people and therefore we have largely invested our time and energy in making sure that we have an attractive reward and benefits offering and providing a developmental place to work.
Outlook
We have achieved remarkable success in FY23, marked by a record financial performance, and have put in place the building blocks that will enable us to deliver long-term, sustainable growth. This is driven by significant design-in wins and strategic investment in the Systems divisions, including the acquisition of Phillips Aerospace.
During the year, there was a step change in how the Group invests in marketing, sales and partnerships to expand our market opportunities. Looking ahead, we will remain focused on leveraging the knowledge and the long-standing relationships the Leadership Team has developed to invest in a measured way to design boards and systems for a range of applications. FY24 will be about balancing our investment and mobilising to win and deliver systems to achieve our short-term financial targets.
Miles Adcock
Chief Executive Officer
CFO's Statement
The Group delivered a strong financial performance in the FY23, with a significant growth in revenue and profit before tax (adjusted for exceptional items), resulting in a solid cash position.
Financial KPIs
|
2023 |
2022 |
2021 |
|
|
Revenue |
£31.7m |
£18.3m |
£20.5m |
|
% change vs previous year |
73% |
-10% |
-3% |
|
Gross profit |
£15.6m |
£8.88m |
£11.4m |
|
% gross margin |
49% |
49% |
56% |
|
Profit before tax & exceptionals |
£3.7m |
£0.4m |
£3.5m |
|
% change vs previous year |
959% |
-89% |
25% |
|
Earnings per share |
4.98p |
1.35p |
3.84p |
|
Proposed dividend per share |
1p |
0p |
2.55p |
|
EBITDA* |
£6.0m |
£2.1m |
£4.9m |
|
Closing cash |
£11.12m |
£4.51m |
£11.84m |
|
% change vs previous year |
146% |
-62% |
5% |
|
Investment in R&D |
£3.8m |
£3.69m |
£1.82m |
|
% change vs previous year |
3% |
103% |
50% |
|
Total assets |
£47.8m |
£32.6m |
£29.8m |
|
Shareholders' funds |
£35.0m |
£23.2m |
£22.7m |
*EBITDA is defined as operating profit excluding finance costs, taxation, depreciation and amortisation.
Revenue
The Company generates sales through products and associated services. A minimal amount of revenue (c.£1.1m) is included in FY23 for system sales (including sales for the acquisition of Phillips Aerospace from 6 September 2023). FY23 saw a record year for revenue, despite being constrained in the first half of the year due to component shortages.
Geographical split of revenue
|
Revenue |
Year to |
Year to |
||||||
|
31 December |
31 December |
|||||||
|
2023 |
2022 |
|||||||
|
£ |
£ |
|||||||
|
United States |
13,060,691 |
6,564,816 |
||||||
|
Malaysia |
392,850 |
3,047,798 |
||||||
|
Germany |
6,450,372 |
|||||||
|
United Kingdom |
2,148,568 |
1,167,266 |
||||||
|
Other Europe |
4,178,401 |
4,003,849 |
||||||
|
Rest of the World |
5,425,434 |
3,491,042 |
||||||
|
31,656,316 |
18,274,771 |
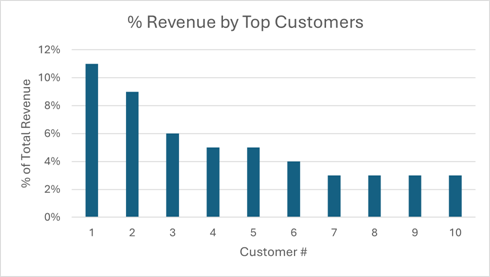
The geographical split of revenue is quite different in FY23 versus the prior year. FY22 was driven by component availability and, therefore, what we were able to ship to customers. FY23 still had an element of this but it was less extreme, with H2 being relatively unconstrained by component availability. We have one customer in Malaysia, and the profile is simply reflective of its schedule. Germany has represented a significant growth area due to timing of programs (orders in FY22 and FY23), with higher production and development volume creating revenue in FY23. A key point to note is the growth in the UK and US, both our home markets, where we have been concentrating our business development activities. An important element of our strategy has been to reduce our reliance on one customer, which was a feature of the past business, and this strategy is clearly working, as evidenced by the table below.
% Revenue by top customers
Revenue by market
|
Defence |
£26,758,184 |
85% |
|
Industrial and scientific |
£3,169,680 |
10% |
|
Medical, communications and other |
£1,728,452 |
5% |
|
Total |
£31,656,316 |
Gross profit
Gross profit increased by 76% to £15.64m (FY22: £8.88m), reflecting the significant increase in revenue. Our gross profit margin of 49.4% (FY22: 48.6%) is reflective of the improving components situation and more efficient delivery.
Profit
Profit before tax (excluding exceptionals) increased by 959% to £3.7m (FY22: £0.4m). This is a result of the record revenues achieved in FY23. EBITDA (measured as operating profit plus depreciation and amortisation) increased by 184% to £6.0m (FY22: £2.1m). Amortisation of our products was up by 23% to £1.35m, reflecting the new product portfolio starting to be released into the profit-and-loss account. Depreciation is also significantly up by 91%, of which 17% reflects the investment in new machinery and the improved offices of Theale, Reading and the remainder is the effect of bringing in the acquisition balances. The new products and the new facility are both key elements in the growth strategy of the Group and will enable the realisation of exceptional further growth.
Earnings per share (EPS) was 4.98p (FY22: 1.35p). This reflects the increased weighted average number of ordinary shares in FY23 generated by the equity raise completed in August 2023. On the previous basis, the EPS would have been 5.0p.
Cost base
It has been necessary to improve the cost base of the business; it has significantly increased with FY23 at £12.2m (FY22: £8.3m). This reflects the investment needed in the business to prepare and be ready for growth. This will be achieved through our new ways of working (e.g. business development, systems, design wins, product development).
The Group continues to pursue the strategy, investing in R&D, developing new products and securing talented people to deliver and drive the business. Through FY23, the business has started to see the results of that investment.
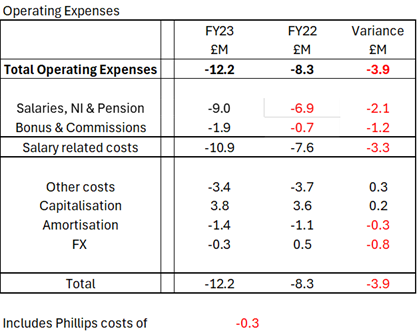
As per the table above, a major part of the cost increase has been the investment in people, with salaries increasing by £2.1m. Headcount has increased by 23, from 129 to 152 (including 12 from the acquisition of Phillips) from 31 December 2022, and has increased from 109 at the beginning of FY22.
Bonuses and commission have also risen in FY23, due to excellent performance and a change to the commission scheme (to simplify and pay on order performance), which generated a one-off catch-up in FY23 of c.£0.3m.
Foreign exchange rates also had a significant impact on the FY23 accounts, with a swing in rates causing a negative effect against FY22. All other costs were relatively flat.
Tax
The Group has undertaken a full tax review and computation, in accordance with UK tax regulations. Due to having significant R&D investment, we remain in a tax credit position for FY23.
Cash flow
The business has a healthy cash balance of £11.1m, with £5.6m generated from normal operations (a strong increase from FY22 at -£0.9m). Revenue was strong in Q4, meaning trade debtors going out of FY23 were high at £5.4m. The business was cash generative in FY23; this is a reversal of the difficult position in FY22 (due to components availability), which saw a decrease of £7.3m.
Statement of financial position
Inventory at the close of FY23 was £11.96m (FY22: £10.09m). This was driven by the management of parts throughout the challenging period due to the components crisis, where the business chose to invest cash in increasing inventory based on market availability to enable the delivery of products. This is now followed by a period of growth and, therefore, inventory holding will revert to 'normal' levels based on a higher-revenue business. These two drivers will continue to play out throughout FY24. The business reviews inventory regularly and provides for obsolescence and slow-moving inventory accordingly, which totalled £1.26m in FY23 (FY22: £0.7m).
Inventory is a key factor in enabling the business to deliver most efficiently and effectively, with careful management contributing to the reduction in lead times in getting products to customers.
Trade payables have increased to £5.7m (FY22: £2.98m). This is predominantly due to the purchase of an end-of-life component that is used across many of the products. This component was delivered in FY23; however, payment terms were agreed that enable payment in April FY24.
Acquisition
On 5 September 2023, Concurrent Technologies Group completed the acquisition of Phillips Aerospace in California, USA.
The acquisition aims to underpin and execute the systems strategy of the business. It provides a footprint, capability, accreditations and credibility that will support the drive for systems revenue going forward.
Phillips Aerospace was purchased for $3.3m (£2.8m), split between cash at $1.1m (£0.8m), equity of $1.5m (£1.3m), and repayment of outstanding loan balances within Phillips Aerospace of $0.8m (£0.7m). A detailed summary of the transaction is set out in Note 27 to the financial statements.
Two of the owners (the third was a silent partner) remain with the business and are fully committed to driving the systems strategy forward with the business.
The fair value of the assets acquired has been considered under IFRS 3 and a purchase price allocation exercise has been undertaken and reflected in Note 27 of the accounts.
In the period since the business has been owned by Concurrent Technologies, it delivered £0.8m revenue and contributed £0.2m profit to the Group.
Kim Garrod
Chief Financial Officer
Consolidated statement of comprehensive income for the year ended 31 December 2023
|
For the year ended 31 December 2023 |
Note |
||||
|
Year to |
Year to |
||||
|
31 December |
31 December |
||||
|
2023 |
2022 |
||||
|
£ |
£ |
||||
|
Revenue |
3 |
31,656,316 |
18,274,771 |
||
|
Cost of sales |
(16,018,368) |
(9,397,449) |
|||
|
Gross profit |
15,637,948 |
8,877,322 |
|||
|
Administrative expenses |
(11,951,314) |
(8,390,682) |
|||
|
Group operating profit |
4 |
3,686,634 |
486,640 |
||
|
Finance expense |
(86,010) |
(104,505) |
|||
|
Finance income |
5 |
68,145 |
546 |
||
|
Exceptional acquisition expenses |
27 |
(195,881) |
- |
||
|
Profit before tax |
3,472,888 |
382,681 |
|||
|
Tax credit |
6 |
400,248 |
604,344 |
||
|
Profit for the year |
3,873,136 |
987,025 |
|||
|
Other comprehensive income |
|||||
|
Exchange (losses)/gains) on translating foreign operations |
(101,340) |
69,463 |
|||
|
Other comprehensive income for the year, net of tax |
(101,340) |
69,463 |
|||
|
Total comprehensive income for the year |
3,771,796 |
1,056,488 |
|||
|
Profit for the period attributable to: |
|||||
|
Equity holders of the Parent |
3,873,136 |
987,025 |
|||
|
Total comprehensive income attributable to: |
|||||
|
Equity holders of the Parent |
3,771,796 |
1,056,488 |
|||
|
Earnings per share |
|||||
|
Basic earnings per share |
8 |
4.98p |
1.35p |
||
|
Diluted earnings per share |
8 |
4.85p |
1.35p |
All operations were continuing within the year.
This statement should be read in conjunction with accompanying notes
Consolidated Statement of Financial Position for the year ended 31 December 2023
|
For the year ended 31 December 2023 |
31 December |
31 December |
||
|
2023 |
2022 |
|||
|
£ |
£ |
|||
|
ASSETS |
||||
|
Non-current assets |
||||
|
Property, plant and equipment |
11 |
2,465,883 |
2,685,107 |
|
|
Intangible assets |
12 |
13,914,398 |
8,807,290 |
|
|
Deferred tax assets |
13 |
432,642 |
350,753 |
|
|
16,812,923 |
11,843,150 |
|||
|
Current assets |
||||
|
Inventories |
15 |
11,958,500 |
10,090,437 |
|
|
Trade and other receivables |
16 |
6,442,827 |
5,439,912 |
|
|
Current tax assets |
6 |
1,492,621 |
762,545 |
|
|
Cash and cash equivalents |
11,118,728 |
4,512,720 |
||
|
31,012,676 |
20,805,614 |
|||
|
Total assets |
47,825,599 |
32,648,764 |
||
|
LIABILITIES |
||||
|
Non-current liabilities |
||||
|
Deferred tax liabilities |
13 |
2,094,095 |
2,126,588 |
|
|
Trade and other payables |
17 |
695,273 |
1,257,820 |
|
|
Provisions |
19 |
315,135 |
304,336 |
|
|
3,104,503 |
3,688,744 |
|||
|
Current liabilities |
||||
|
Trade and other payables |
17 |
9,666,412 |
5,765,262 |
|
|
Provisions |
19 |
18,256 |
18,256 |
|
|
9,684,668 |
5,783,518 |
|||
|
Total liabilities |
12,789,171 |
9,472,262 |
||
|
Net assets |
35,036,428 |
23,176,502 |
||
|
EQUITY |
||||
|
Capital and reserves |
||||
|
Share capital |
21 |
861,692 |
739,000 |
|
|
Share premium account |
21 |
9,950,231 |
3,699,105 |
|
|
Merger reserve |
21 |
1,283,457 |
- |
|
|
Capital redemption reserve |
21 |
256,976 |
256,976 |
|
|
Cumulative translation reserve |
21 |
(129,276) |
(27,936) |
|
|
Profit-and-loss account |
22,813,348 |
18,509,357 |
||
|
Equity attributable to equity holders of the Parent |
35,036,428 |
23,176,502 |
||
|
Total equity |
35,036,428 |
23,176,502 |
This statement should be read in conjunction with accompanying notes.
Company Statement of Financial Position for the year ended 31 December 2023
|
31 December |
31 December |
||||
|
2023 |
2022 |
||||
|
£ |
£ |
||||
|
ASSETS |
|||||
|
Non-current assets |
|||||
|
Property, plant and equipment |
11 |
2,374,209 |
2,628,501 |
||
|
Intangible assets |
12 |
11,217,904 |
8,807,290 |
||
|
Deferred tax assets |
13 |
432,642 |
350,753 |
||
|
Investments |
14 |
1,572,640 |
1,446,952 |
||
|
15,597,395 |
13,233,496 |
||||
|
Current assets |
|||||
|
Inventories |
15 |
11,754,564 |
10,090,437 |
||
|
Trade and other receivables |
16 |
8,534,995 |
5,870,077 |
||
|
Current tax assets |
6 |
1,434,921 |
703,087 |
||
|
Cash and cash equivalents |
9,111,243 |
1,704,517 |
|||
|
30,835,723 |
18,368,118 |
||||
|
Total assets |
46,433,118 |
31,601,614 |
|||
|
LIABILITIES |
|||||
|
Non-current liabilities |
|||||
|
Deferred tax liabilities |
13 |
1,834,823 |
2,178,634 |
||
|
Trade and other payables |
17 |
677,607 |
1,211,405 |
||
|
Provisions |
19 |
315,135 |
304,336 |
||
|
2,827,565 |
3,694,375 |
||||
|
Current liabilities |
|||||
|
Trade and other payables |
17 |
8,890,046 |
5,171,306 |
||
|
Provisions |
19 |
18,256 |
18,256 |
||
|
8,908,302 |
5,189,562 |
||||
|
Total liabilities |
11,735,867 |
8,883,937 |
|||
|
Net assets |
34,697,251 |
22,717,677 |
|||
|
EQUITY |
|||||
|
Capital and reserves |
|||||
|
Share capital |
21 |
861,692 |
739,000 |
||
|
Share premium account |
21 |
9,950,231 |
3,699,105 |
||
|
Merger reserve |
21 |
1,283,457 |
- |
||
|
Capital redemption reserve |
21 |
256,976 |
256,976 |
||
|
Profit-and-loss account |
21 |
22,344,895 |
18,022,596 |
||
|
Equity attributable to equity holders of the Parent |
34,697,251 |
22,717,677 |
|||
|
Total equity |
34,697,251 |
22,717,677 |
This statement should be read in conjunction with accompanying notes.
Consolidated Cash Flow Statement for the year ended 31 December 2023
|
For the year ended 31 December 2023 |
Year to |
Year to |
|||
|
31 December |
31 December |
||||
|
2023 |
2022 |
||||
|
£ |
£ |
||||
|
Cash flows from operating activities |
|||||
|
Profit before tax for the period |
3,472,888 |
382,681 |
|||
|
Adjustments for: |
|||||
|
Finance income |
(68,145) |
(546) |
|||
|
Finance expense |
86,010 |
104,505 |
|||
|
Depreciation |
806,236 |
422,047 |
|||
|
Amortisation |
1,509,167 |
1,197,972 |
|||
|
Impairment loss |
31,557 |
327,526 |
|||
|
Share-based payment |
430,854 |
219,363 |
|||
|
Exchange differences |
(145,706) |
82,384 |
|||
|
Increase in inventories |
(1,868,063) |
(3,665,001) |
|||
|
Increase in trade and other receivables |
(1,029,033) |
(2,451,279) |
|||
|
Increase in trade and other payables |
2,853,322 |
2,222,123 |
|||
|
Cash generated/(used in) from operations |
6,079,087 |
(1,158,225) |
|||
|
Tax received/(paid) |
(444,210) |
267,884 |
|||
|
Net cash generated/(used in) from operating activities |
5,634,877 |
(890,341) |
|||
|
Cash flows from investing activities |
|||||
|
Interest received |
68,145 |
546 |
|||
|
Purchases of property, plant and equipment (PPE) |
(495,973) |
(1,480,394) |
|||
|
Payment of acquisition of subsidiary net of cash acquired |
(685,767) |
- |
|||
|
Capitalisation of development costs and purchases of intangible assets |
(3,977,839) |
(3,711,617) |
|||
|
Net cash used in investing activities |
(5,091,434) |
(5,191,465) |
|||
|
Cash flows from financing activities |
|||||
|
Equity dividends paid |
- |
(1,027,088) |
|||
|
Repayment of leasing liabilities |
(215,209) |
(94,842) |
|||
|
Interest paid |
(86,010) |
(104,505) |
|||
|
Issue of ordinary shares net of issue costs |
6,355,741 |
- |
|||
|
Sale of treasury shares |
- |
2,425 |
|||
|
Net cash generated/(used) in financing activities |
6,054,522 |
(1,224,010) |
|||
|
Effects of exchange-rate changes on cash and cash equivalents |
8,043 |
(21,222) |
|||
|
Net increase/(decrease) in cash |
6,606,008 |
(7,327,038) |
|||
|
Cash at beginning of period |
4,512,720 |
11,839,758 |
|||
|
Cash at the end of the period |
11,118,728 |
4,512,720 |
This statement should be read in conjunction with accompanying notes.
Consolidated Statement of Changes in Equity for the year ended 31 December 2023
|
Capital |
Cumulative |
Profit- |
||||||
|
Share |
Share |
Merger |
redemption |
translation |
and-loss |
Total |
||
|
capital |
premium |
reserve |
reserve |
reserve |
account |
equity |
||
|
£ |
£ |
£ |
£ |
£ |
£ |
£ |
||
|
Balance at 1 January 2022 |
739,000 |
3,699,105 |
- |
256,976 |
(97,399) |
18,082,077 |
22,679,759 |
|
|
Profit for the period |
- |
- |
- |
- |
- |
987,025 |
987,025 |
|
|
Exchange differences on translating foreign operations |
- |
- |
- |
- |
69,463 |
- |
69,463 |
|
|
Total comprehensive income for the period (restated) |
- |
- |
- |
- |
69,463 |
987,025 |
1,056,488 |
|
|
Share-based payment |
- |
- |
- |
- |
- |
219,363 |
219,363 |
|
|
Deferred tax on share-based payment |
- |
- |
- |
- |
- |
245,555 |
245,555 |
|
|
Dividends paid |
- |
- |
- |
- |
- |
(1,027,088) |
(1,027,088) |
|
|
Sale/purchase of treasury shares |
- |
- |
- |
- |
- |
2,425 |
2,425 |
|
|
Issue of ordinary shares |
- |
- |
- |
- |
- |
- |
- |
|
|
Balance at 31 December 2022 |
739,000 |
3,699,105 |
- |
256,976 |
(27,936) |
18,509,357 |
23,176,502 |
|
|
Profit for the period |
- |
- |
- |
- |
- |
3,873,136 |
3,873,136 |
|
|
Exchange differences on translating foreign operations |
- |
- |
- |
- |
(101,340) |
- |
(101,340) |
|
|
Total comprehensive income for the period |
- |
- |
- |
- |
(101,340) |
3,873,136 |
3,771,796 |
|
|
Share-based payment |
- |
- |
- |
- |
- |
430,854 |
430,854 |
|
|
Deferred tax on share-based payment |
- |
- |
- |
- |
- |
- |
- |
|
|
Dividends paid |
- |
- |
- |
- |
- |
0 |
0 |
|
|
Sale/purchase of treasury shares |
- |
- |
- |
- |
- |
- |
||
|
Merger reserve |
18,077 |
1,283,457 |
- |
- |
- |
1,301,534 |
||
|
Shares issued during the year |
104,615 |
6,251,126 |
- |
- |
- |
- |
6,355,741 |
|
|
Balance at 31 December 2023 |
861,692 |
9,950,231 |
1,283,457 |
256,976 |
(129,276) |
22,813,347 |
35,036,427 |
This statement should be read in conjunction with accompanying notes.
Company Statement of Changes in Equity for the year ended 31 December 2023
|
Capital |
Profit- |
|||||||
|
Share |
Share |
Merger |
redemption |
and-loss |
Total |
|||
|
capital |
premium |
reserve |
reserve |
account |
equity |
|||
|
£ |
£ |
£ |
£ |
£ |
£ |
|||
|
Balance at 1 January 2022 |
739,000 |
3,699,105 |
- |
256,976 |
17,493,403 |
22,188,484 |
||
|
Total profit and comprehensive income for the period |
- |
- |
- |
- |
1,086,851 |
1,086,851 |
||
|
Share-based payment |
- |
- |
- |
- |
221,450 |
221,450 |
||
|
Deferred tax on share-based payment |
- |
- |
- |
- |
245,555 |
245,555 |
||
|
Dividends paid |
- |
- |
- |
- |
(1,027,088) |
(1,027,088) |
||
|
Sale/purchase of treasury shares |
- |
- |
- |
- |
2,425 |
2,425 |
||
|
Issue of ordinary shares |
- |
- |
- |
- |
- |
- |
||
|
Balance at 31 December 2022 |
739,000 |
3,699,105 |
- |
256,976 |
18,022,596 |
22,717,677 |
||
|
Total profit and comprehensive income for the period |
- |
- |
- |
- |
3,632,774 |
3,632,774 |
||
|
Share-based payment |
- |
- |
- |
- |
430,854 |
430,854 |
||
|
Deferred tax on share-based payment |
- |
- |
- |
- |
- |
- |
||
|
Dividends received |
- |
- |
- |
- |
258,670 |
258,670 |
||
|
Sale/purchase of treasury shares |
- |
- |
- |
- |
- |
- |
||
|
Merger reserve |
18,077 |
1,283,457 |
- |
- |
1,301,534 |
|||
|
Shares issued during the year |
104,615 |
6,251,126 |
- |
- |
- |
6,355,741 |
||
|
Balance at 31 December 2023 |
861,692 |
9,950,231 |
1,283,457 |
256,976 |
22,344,894 |
34,697,250 |
This statement should be read in conjunction with accompanying notes.
Notes to the Financial Statements
|
Note 1 |
GENERAL INFORMATION |
|
The principal activity of Concurrent Technologies plc ('the Company') and its subsidiaries (together 'the Group') is the design, development, manufacture and marketing of single-board computers for system integrators and original equipment manufacturers. On 6 September 2023, the Group acquired 100% of the voting shares of Phillips Aerospace Limited. Please refer to Note 27 for further details. |
|
|
Concurrent Technologies plc is the Group's ultimate Parent Company. It is incorporated and domiciled in the United Kingdom. Concurrent Technologies plc's shares are listed on the Alternative Investment Market of the London Stock Exchange. |
|
|
The Group's financial statements are presented in pounds sterling (£), which is also the functional currency of the Parent Company. They have been approved for issue by the Board of Directors on 30 April 2024. |
|
|
Note 2 |
SUMMARY OF SIGNIFICANT ACCOUNTING POLICIES |
|
Basis of preparation |
These financial statements are for the year ended 31 December 2023. They have been prepared in accordance with UK-adopted international accounting standards and with the requirements of the Companies Act 2006. These financial statements have been prepared under the historical cost convention. New and amended IFRS accounting standards that are effective for the current year In the current year, the Company has applied a number of amendments to IFRS accounting standards issued by the International Accounting Standards Board (IASB) that are mandatorily effective for an accounting period that begins on or after 1 January 2023. Their adoption has not had any material impact on the disclosures or on the amounts reported in these financial statements. · IAS 1: Classifications of Liabilities as Current or Non-Current (effective for periods commencing on or after 1 January 2023) · IAS 1 and IFRS Practice Statement 2: Disclosure of Accounting Policies (effective for periods commencing on or after 1 January 2023) · IAS 8: Definition of Accounting Estimates (effective for periods commencing on or after 1 January 2023) · IAS 12: Deferred Tax Related to Assets and Liabilities Arising from a Single Transaction (effective for periods commencing on or after 1 January 2023) New and revised IFRS accounting standards in issue but not yet effective Certain standards, amendments to and interpretations of published standards have been published that are mandatory for the Group's accounting years beginning on or after 1 January 2024, or later years, and which the Group has decided not to adopt early: · IFRS 7 and IAS 7: Supplier Finance Arrangements (effective for periods commencing on or after 1 January 2024) · IAS 1: Non-Current Liabilities with Covenants (effective for periods commencing on or after 1 January 2024) None of the above listed changes are anticipated to have a material impact on the Group's financial statements. |
|
Changes in significant accounting policies There have been no changes in the year to significant accounting policies in the period. |
|
|
The Parent Company has relied on the exemption conferred by Section 408 of the Companies Act 2006 in not publishing its own profit-and-loss account. The Parent Company retained profit for the year was £3,632,774 (2022: £1,086,850). |
|
|
The policies set out below have been consistently applied to all the years presented, except where stated. |
|
|
Basis of presentation |
The consolidated financial statements are presented in accordance with IAS 1: Presentation of Financial Statements. The Group has elected to present the 'Income Statement' and 'Statement of Other Comprehensive Income' in one statement. The basis of presentation is the UK-adopted international accounting standards to FRS 101 for the Parent Company information. This has been prepared using the adapted format of the balance sheet. Disclosure exemptions taken include no cash flow statement for the Company, reduced disclosures for financial instruments, financial risk management, related party transactions, share-based payment, key management personnel and other relevant exemptions. |
|
Note 2 |
SUMMARY OF SIGNIFICANT ACCOUNTING POLICIES (CONTINUED) |
|
Going concern |
The Directors have reviewed the approved budget and projections sensitised for different scenarios through to December 2025, considering general and specific market conditions, status of suppliers, liquidity and funding requirements and the needs of subsidiary companies. The Directors have assessed the viability of the Group using extreme assumptions to reverse stress test the cash forecast. Assumptions include extreme reduction in sales, decrease in gross margin and a reduction in stock levels (as anticipated in 2024 to reduce working capital). Additionally, within these scenarios we have excluded any potential beneficial impacts such as tighter management of working capital and cost reduction measures. These have been excluded to retain headroom in the forecast and to provide a worst expected case scenario. The forecast cash balances within the Group show that there is no borrowing requirement or going concern issues, enabling the Directors to be confident the Group will be able to meet its obligations. |
|
Basis of consolidation |
The consolidated financial statements incorporate the financial statements of the Company and its subsidiary undertakings. A subsidiary is a company controlled directly by the Group. Control is achieved where the Group has the power over the investee, rights to variable returns and the ability to use the power to affect the investee's returns. The acquisition method views a business combination from the perspective of the combining entity that is identified as the acquirer. The acquirer recognises the assets acquired and liabilities and contingent liabilities assumed, including those not previously recognised by the acquiree, where recognition criteria are met. Measurement of these items is generally at fair value at acquisition date. The measurement of the acquirer's assets and liabilities is not affected by the transaction, nor are any additional assets or liabilities of the acquirer recognised as a result of the transaction, because they are not the subjects of the transaction. All subsidiaries are 100% wholly owned and are fully controlled by the Group. All intra-Group transactions, balances, income and expenses are eliminated on consolidation. |
|
Revenue recognition |
Revenue is recognised by the Group using the five-step process outlined in IFRS 15: · Identification of a contract with a customer · Identification of the performance obligations · Determination of the transaction price · Allocation of the transaction price to the performance obligations · Recognise revenue when the performance obligations are satisfied |
|
The Group's principal source of revenue is from the sale of single-board computers and associated products (which could include software products that are required by the customer to be added to the boards sold - for example, security software). Revenue from the sale of products, including any added software (this is so interlinked with the single-board computer that they are considered one performance obligation under IFRS 15) is recognised when the Group satisfies its performance obligations by transferring the promised goods to its customers. Control is considered to transfer, at the point in time when the customer takes undisputed responsibility for the goods. This depends on the terms and conditions of sale with the customer. There are three main terms for delivery: 1) The Group are responsible for the goods until delivered at the stated delivery address under the contract; 2) Free on board contract terms means the goods remain the Group's responsibility until they are placed onboard the vehicle for shipping, with export duty being the Group's responsibility as well. The customer is responsible post this point; 3) Ex-works contract terms, where the customer is responsible from the point the goods leave the factory or appropriate site, often under control of the customer's defined shipping arrangement. The Group provides a basic warranty on its products but does offer customers the opportunity to purchase an extended warranty of one, two or three years for their boards. As the customer has the option of purchasing the additional warranty separately, this is accounted for as a separate performance obligation under IFRS 15 where the Group will repair or replace faulty boards at no additional charge to the customer. Contract liabilities on these extended warranties are recognised and released to income over the warranty period until the performance obligation is satisfied. During the 12 months to 31 December 2023, £28,235 was released to profit and loss. |
|
|
Revenue recognised for systems contracts, under IFRS 15, was £1.1m (including Phillips Aerospace) for 2023 financial statements. Systems revenue will continue into 2024 and beyond. Revenue will normally be recognised over time, in accordance with IFRS 15, based on the stage of completion of the relevant performance obligations, and will be dependent on the conditions of each specific contract. |
|
Revenue recognition (continued) |
For our single-board business, invoices are raised on despatch and payment terms are usually 30 days from date of invoice. For the systems business, payment terms will be based on negotiations and could include pro-forma and 30-day payment terms, but will be subject to negotiated positions. |
|
Cost of sales |
Cost of sales consists of external purchases and stock used on delivering specific contracts, plus the direct workforce (predominantly manufacturing) related to the fulfilment of the specific contracts and direct ancillary costs such as shipping. |
|
Administrative expenses Exceptional items |
This includes all non-direct costs (e.g. general overheads such as rent, rates, sales and indirect functions.) This also includes non-direct engineering expenses. This is made up of costs incurred as a result of the acquisition of Phillips Aerospace. The Company considers these to be outside of the normal course of business so have treated these as exceptional expenses. |
|
Foreign currencies |
The functional and presentational currency of the Company is pounds sterling (GBP). Transactions in currencies other than the functional currency of the individual entities within the Group are recorded at the rates of exchange prevailing on the dates of the transactions. Foreign exchange gains and losses resulting from the settlement of such transactions and from the re-measurement of monetary items at year-end exchange rates are recognised in profit or loss. |
|
In the Group's financial statements, all assets, liabilities and transactions of Group entities with a functional currency other than GBP are translated into pounds sterling upon consolidation. The functional currencies of the entities in the Group have remained unchanged during the reporting period. |
|
|
On consolidation, assets and liabilities have been translated into GBP at the closing rate at the reporting date. Foreign exchange differences arising for intercompany transactions are charged within profit and loss. Income and expenses have been translated into GBP at the rates of exchange prevailing on the dates of the transactions over the reporting period. In line with IAS 21, an average rate is used for the period unless exchange rates fluctuate significantly and then the weighted average rate is used. Exchange differences are charged/credited to other comprehensive income and recognised in the cumulative translation reserve in equity. On disposal of a foreign operation, the cumulative translation differences recognised in equity are reclassified to profit or loss and recognised as part of the gain or loss on disposal. Goodwill and fair value adjustments arising on the acquisition of a foreign entity are treated as assets and liabilities of the foreign entity and translated into GBP at the closing rate. |
|
|
Inventories |
Inventories are stated at the lower of cost and net realisable value on a first-in first-out basis. Cost includes materials, direct labour and an attributable proportion of manufacturing overheads based on normal levels of activity. Net realisable value represents the estimated selling price after allowing for the costs of realisation and, where appropriate, the cost of conversion from their existing state into a finished condition. Provision is made where necessary for obsolete, slow-moving or defective inventories. |
|
Leases |
A lease is defined as a contract, or part of a contract, that conveys the right to use an asset (the underlying asset) for a period of time in exchange for consideration. To apply this definition, the Group assesses whether the contract meets three key evaluations, which are whether the contract contains an identified asset, which is either explicitly identified in the contract or implicitly specified by being identified at the time the asset is made available to the Group; the Group has the right to obtain substantially all of the economic benefits from use of the identified asset throughout the period of use, considering its rights within the defined scope of the contract; and the Group has the right to direct the use of the identified asset throughout the period of use. At lease commencement, the Group recognises a right of use asset and a lease liability on the balance sheet. The right of use asset is measured at cost and initial direct costs incurred by the Group. The right of use asset is then depreciated on a straight-line basis over the term of the lease or the estimated useful life of the asset if shorter. At commencement date, the Group measures the lease liability at the present value of the future lease payments, discounted using the Group's incremental borrowing rate. The Group has elected to account for short-term leases and leases of low-value assets using the recognition exemptions of IFRS 16, and payments in relation to these are recognised as an expense in the appropriate period. Right of use assets have been included in property, plant and equipment and the corresponding lease liability included in trade and other payables. Detailed lease liability information is included in Notes 17 and 20. |
|
Property, plant and equipment |
Property, plant, and equipment is stated at original historical cost, net of depreciation and any provision for impairment. Depreciation is charged so as to write off the cost of assets together with any cost directly attributable with bringing the asset into use, less estimated residual value, on a straight-line basis over their estimated useful lives in accordance with the table below: Plant and machinery 5-15 years on a straight-line basis Fixtures, fittings and equipment 3-7 years on a straight-line basis Computer equipment 3-5 years on a straight-line basis Improvements to short leasehold property 5-10 years on a straight-line basis The gain or loss arising on the disposal or retirement of an asset is determined as the difference between the sales proceeds and the carrying amount of the asset and is recognised in the statement of comprehensive income. The residual values and useful economic lives of property, plant and equipment are reviewed annually. |
|
Intangible assets |
All intangible assets are stated at cost less accumulated amortisation and any accumulated impairment losses. Goodwill Goodwill has arisen upon the acquisition of Phillips Aerospace made on 6 September 2023, which is defined as a single cash-generating unit (CGU). The assets acquired are not capable of individually generating revenue on their own, so they are deemed combined within the business as a whole to generate revenue, and therefore the business (Phillips Aerospace) is defined as a single CGU. The goodwill is the amount attributable to the excess of consideration over the fair value of the net assets acquired, including expected synergies, future growth, critical accreditations and technical knowledge of the employee, and is recorded in accordance with IFRS 3 'Business Combinations'. Goodwill is reviewed and tested annually for impairment. Research costs Research costs are charged directly to administrative expense in the statement of comprehensive income as incurred. Development costs Development costs are capitalised as intangible assets if the asset can be separately identified; it is in the control of the Group; future economic benefits will accrue to Group; it is technically feasible, the Group has adequate resources to complete the development of the asset and the costs can be reliably determined. Capitalised development costs comprise all directly attributable costs necessary to create, produce and prepare the asset to be capable of operating in the manner intended by management, including development-related overheads. Amortisation commences upon completion of the development or when the asset becomes available for commercial production. Capitalised development costs are amortised on a straight-line basis, over the estimated product life, which is generally five to seven years. The asset will be reviewed annually for indicators of impairment, and whenever indicators suggest that the carrying amount may not be recovered throughout the period in which it is being used, the asset will be subject to a full impairment review. All intangible assets, including those not yet available for use, will be reviewed for indicators of impairment. |
|
All other development costs are recorded under administrative expense in the statement of comprehensive income in the period they are incurred. The table below shows products with an NBV of £500,000 or more: |
|
Product |
NBV |
Remaining amortisation period |
|
Board A |
2,128,699 |
84 months |
|
Board B |
1,393,825 |
84 months |
|
Board C |
1,085,150 |
70 months |
|
Board D |
806,608 |
84 months |
|
Board E |
576,782 |
84 months |
|
Customer relationships Customer relationships were acquired as part of the acquisition of Phillips Aerospace on 6 September 2023 and have applied an income approach valuation using the multi-period excess earning method with a useful economic life of ten years. Other intangible assets Intangible assets purchased separately, such as software licences that do not form an integral part of hardware, are capitalised at cost and amortised over their useful lives of three to seven years. The carrying values of intangible assets with finite lives are reviewed for impairment when events or changes in circumstance indicate the carrying value may be impaired. If any such indication exists, the recoverable amount of the asset is estimated in order to determine the extent of impairment loss. The recoverable amount of the asset will be used as for all other intangible assets (e.g. backlog and pipeline opportunities), except where the asset does not generate independent cash flows, i.e. additional software packages sold as an add-on to a board. This also contains the AS9110C licence obtained as part of the acquisition of Phillips Aerospace. This has been valued using an income approach based upon the 'relief from royalty' method with a useful economic life of ten years. |
|||
|
Impairment of property, plant and equipment, and intangible assets |
At each balance sheet date, the Group reviews the carrying amounts of its tangible and intangible assets to determine whether there is any indication that those assets have suffered an impairment loss. If any such indication exists, the recoverable amount of the asset is estimated in order to determine the extent of the impairment loss. Recoverable amount is the higher of fair value less costs to sell and value in use. In assessing value in use, the estimated future cash flows (using both backlog and weighted pipeline) are discounted (8.1% rate used) to their present value. If the recoverable amount of an asset is estimated to be less than its carrying amount, the carrying amount of the asset is reduced to its recoverable amount. An impairment loss is immediately recognised as an expense in the statement of comprehensive income. Where an impairment loss subsequently reverses, the carrying amount of the asset is increased to the revised estimate of its recoverable amount, but so that the increased carrying amount does not exceed the carrying amount that would have been determined had no impairment loss been recognised for the asset in prior years. A reversal of an impairment loss is recognised as a credit to expenses immediately. |
||
|
Taxation |
Current tax is the tax currently payable based on taxable profit for the year. Current tax for current and prior periods shall, to the extent unpaid, be recognised as a liability. If the amount already paid in respect of current and prior periods exceeds the amount due for those periods, the excess shall be recognised as an asset. The tax expense for the period comprises current and deferred tax. Tax is recognised in the income statement, except to the extent that it relates to items recognised in other comprehensive income, or directly in equity. In this case, the tax is also recognised in other comprehensive income or directly in equity, respectively. The Group takes advantage of the small and medium enterprise tax scheme in respect of R&D tax credits. These are included in the taxation line and are accounted for on a receivable basis. This means the Group applies certain assumptions based on previous R&D claims and any changes to the business and applicable legislation to record a credit through profit or loss and an associated receivable on the balance sheet in the accounting period in question. Deferred income taxes are calculated using the liability method on temporary differences. Deferred tax is generally provided on the difference between the carrying amounts of assets and liabilities and their tax bases. However, deferred tax is not provided on the initial recognition of goodwill, nor on the initial recognition of an asset or liability unless the related transaction is a business combination or affects tax or accounting profit. Deferred tax on temporary differences associated with shares in subsidiaries is not provided if reversal of these temporary differences can be controlled by the Group and it is probable that reversal will not occur in the foreseeable future. In addition, tax losses available to be carried forward as well as other income tax credits to the Group are assessed for recognition as deferred tax assets. |
||
|
Deferred tax liabilities are provided in full, with no discounting. Deferred tax assets are recognised to the extent that it is probable that the underlying deductible temporary differences will be able to be offset against future taxable income. Current and deferred tax assets and liabilities are calculated at tax rates that are expected to apply to their respective period of realisation, provided they are enacted or substantively enacted at the year-end date. |
|||
|
Financial instruments |
Financial assets and financial liabilities are recognised in the balance sheet when the Group becomes a party to the contractual provisions of the instrument. |
||
|
(i) Financial assets Financial assets are held at amortised cost if the assets are held with the objective to collect contractual cash flows and where the contractual terms of the financial assets give rise to cash flows that are solely payments of principal and interest on the principal amount outstanding. After initial recognition at transaction price being the amount of consideration that is unconditional, receivable balances are measured at amortised cost using the effective interest method, less loss allowance for expected credit losses. The Group's cash and cash equivalents, other financial assets (fixed-term deposits), trade and most other receivables fall into this category of financial instruments. The Group applies the IFRS 9 simplified approach to measuring expected credit losses, which uses a lifetime expected loss allowance for all trade receivables. |
|||
|
Financial instruments (continued) |
(i) Financial liabilities Trade and other payables are not interest bearing and are initially recognised at fair value plus transaction costs directly attributable to their acquisition and then subsequently measured at amortised cost. (ii) Financial liabilities and equity Financial liabilities and equity instruments are classified according to the substance of the contractual arrangements entered into. Financial liabilities are obligations to pay cash or other financial assets and are recognised when the Group becomes a party to the contractual provisions of the instrument. They are initially recognised at fair value plus transaction costs directly attributable to their acquisition and subsequently measured at amortised cost using the effective interest method. An equity instrument is any contract that evidences a residual interest in the assets of the Group after deducting all of its liabilities. |
|
Investments in subsidiaries |
Investments in subsidiaries, as reported in the Parent Company financial statements, are included at cost less provision for impairment. |
|
Finance income |
Finance income comprises interest income accrued on a time basis, by reference to the principal outstanding at the effective interest rate applicable. |
|
Dividends |
Dividends to the Company's shareholders are recognised as a liability and deducted from shareholders' equity in the period in which the shareholders' right to receive payment is established. |
|
Employee benefits |
Retirement benefits The Company operates a defined contribution retirement benefit plan. The cost of the defined contribution plan is charged to administrative expenses in the statement of comprehensive income on the basis of contributions payable by the Company during the year. Share-based payments The Group issues equity-settled share-based payments to certain employees. Equity-settled share-based payments are measured at fair value at the date of grant. In the consolidated financial statements, the fair value determined at the grant date of equity-settled share-based payments is expensed on a straight-line basis over the vesting period based on the Group's estimate of shares, which will eventually vest, together with a corresponding increase in equity. In the financial statements of the Company, equity-settled share-based payments issued to employees of the Company are treated in the same manner as in the consolidated financial statements. Equity-settled share-based payments issued to employees of subsidiary undertakings are treated in the financial statements of the Company as an increase in investment in subsidiary companies, together with a corresponding increase in equity, over the vesting period based on the Group's estimate of shares, which will eventually vest. Fair value is measured by use of a binomial option pricing model and has been adjusted for the estimated effect of non-transferability, exercise restrictions and behavioural considerations. For options that have non-market vesting conditions, such as EPS growth, the award has been valued using the Black-Scholes model. This type of model is typically used where no market conditions are associated with the awards. Options granted from November 2021 have been valued using the Black-Scholes model. Option pre-November 2021 used the binomial option pricing model. |
|
Treasury shares |
The Company's shares that have been purchased and not cancelled are held as treasury shares and deducted from shareholders' equity. No gain or loss is recognised in profit or loss on the purchase, sale, issue or cancellation of the shares. |
|
Reserves |
Share premium account represents the difference between the price received on the sale of shares and their par value. Capital redemption reserve arose from the purchase of shares and represents their nominal value. Cumulative translation reserve arises from the consolidation of foreign subsidiaries. Share capital represents the nominal value of shares that have been issued. Merger reserve represents the difference between the price of the shares issued on acquisition of Phillips Aerospace and their par value. Profit-and-loss account includes all current and prior period retained profits and share-based payments less treasury shares held at the balance sheet date. |
|
Provisions |
Provisions are recognised when present obligations resulting from a past event will probably lead to an outflow of economic resources from the Group and amounts can be estimated reliably. Provisions reported are for non-purchased warranties (all additional purchased warranties are accounted for under contract liabilities). The obligation under IFRS 15 is for the Group to repair or replace faulty boards at no additional charge to the customer. |
|
EPS DEPS |
Basic earnings per share is calculated by dividing the profit attributable to the owners of Concurrent Technologies plc, excluding any costs of servicing equity other than ordinary shares, by the weighted average number of ordinary shares outstanding during the financial year. Diluted earnings per share is calculated by dividing the profit attributable to the owners of Concurrent Technologies plc, excluding any costs of servicing equity other than ordinary shares, by the weighted average number of ordinary shares and share options outstanding during the financial year. |
|
Key judgements and estimates |
In applying the Group's accounting policies, the Directors are required to make judgements (other than those involving estimations) that have a significant impact on the amounts recognised and to make estimates and assumptions about the carrying amounts of assets and liabilities that are not readily apparent from other sources. The estimates and associated assumptions are based on historical experience and other factors that are considered to be relevant. Actual results may differ from these estimates. Estimates and judgements are continually evaluated. Estimates The resulting accounting estimates will, by definition, seldom equal the related actual results. The estimates and assumptions that have a significant risk of creating a material adjustment to the carrying amounts of assets and liabilities are discussed below. Development costs To substantiate the carrying value of the capitalised development costs, management have applied the criteria of IAS 36 'Impairment of Assets' and have projected the future economic benefits. They are reviewed against current backlog and estimated weighted (based on probability factors, predominantly driven by stage of the opportunity), future pipeline opportunities, which will be achieved from this investment, using an estimated useful life of seven years and a value in use calculation. Management considers the review to be sufficiently robust regarding reasonable movements in discount rates (current rate used: 8.1%). A 1% increase in the discount rate would not lead to a material increase in impairment so, therefore, the discount rate is not considered to be the key source of estimation uncertainty, but it is the assumptions made around conversion of future sales that is key to the estimate. Where indicators exist, management then records judgement-based impairment charges that consider project-specific technical issues, customer feedback, opportunity for product substitution and other market factors. Estimation uncertainty relates to assumptions about future results. The Group has reviewed revenue sensitivity against our top five boards in terms of NBV. Revenue forecast would need to reduce by between 75% and 90% for the discounted cash flow to reach a breakeven position. This provides the Directors with comfort in respect of headroom in the impairment calculations. Inventory A slow-moving stock provision has been made, where necessary, where inventory has had no movement in three years or more as per our accounting policy. Items that are provided for, should they start being used again, will have the provision removed/reversed. |
|
R&D tax credits The Group takes advantage of the small and medium enterprise tax scheme in respect of R&D tax credits. These are included in the taxation line and are accounted for on a receivable basis. This means that the Group applies certain assumptions based on previous R&D claims and any changes to the business and applicable legislation to record a credit through profit or loss and an associated receivable on the balance sheet in the accounting period in question. Goodwill and intangible assets on acquisition Application of IFRS 3 During the year, the Group acquired Phillips Aerospace and accordingly reviewed the acquisition of the entity in accordance with IFRS 3 'Business Combinations'. Any assets that were identified as being separately identifiable assets have been valued using appropriate valuation techniques in order to determine the fair value of intangible assets acquired as part of the business combination aside from any goodwill arising as a result of the transaction. These are accordingly recorded as separate intangible assets in Note 12 and have been reviewed for impairment as noted in Note 12. CGU The classification of Phillips Aerospace as a single CGU is a key judgement based on the understanding of the elements that have been purchased. The assets purchased (e.g. accreditation, customer relationships, working capital etc.) are not capable of generating revenue in their own right, individually, and, therefore, they are judged to be intrinsically linked as one to define the business of Phillips Aerospace to be one single CGU. Accordingly, any goodwill arising as a result of this acquisition has been allocated to the CGU identified. The subsequent impairment and amortisation of the goodwill and assets are based on key estimates and judgements, reviewing the capability of the business from key forecasts of revenue and orders. These are tested for impairment in the same way as development costs (i.e. the use of a discounted cash flow forecast to determine the value in use of the CGU, which has been prepared in accordance with IAS 36). |
|
Key judgements and estimates (continued) |
Capitalisation of development costs IAS 38 - Intangible Assets Judgement is required when distinguishing the research and development phases of new projects and determining whether the recognition requirements for capitalisation of the development costs are met under IAS 38. Research covers pre-solution options often through feasibility studies of various technologies. Development is the application of research findings or other knowledge to plan or design for the production of new or substantially improved products before the start of commercial production. Development costs are capitalised as an intangible asset if all the following criteria are met: there is technical feasibility of completing the asset so that it will be available for use or sale; the intention is to complete the asset and use or sell it; there is an ability to use or sell the asset; the asset will generate future economic benefits and demonstrate the existence of a market or the usefulness of the asset if it is to be used internally; the availability of adequate technical, financial and other resources to complete the development and to use or sell it; and the ability to measure reliably the expenditure attributable to the intangible asset. |
|
Note 3 |
SEGMENT REPORTING |
|
The Directors consider that there is only one operating segment: design, manufacture and supply of high-end embedded computer products. The disclosures for this operating segment have already been provided in these financial statements. The Company's products can be supplied to more than one business sector and are sold on a global basis. All manufacturing is undertaken in the UK. While looking at sales by business sectors, the Executive Board members of the Company, as the Chief Operating Decision Maker, does not make decisions regarding allocation of Group resources on such a basis. The Board in its entirety, i.e. including Non-Executive members, is not involved in making operational decisions. Further, Group profits are not categorised for internal reporting purposes by sectors or geography. The historical and anticipated performance of the Group is therefore reported to the Board of Concurrent Technologies plc as a single entity. Thus, the Directors consider that there are no additional segments required to be disclosed under IFRS 8 'Operating Segments' but have provided the following geographic sales analysis. No geographical analysis of non-current assets is provided as non-current assets outside of the UK are immaterial. |
|
|
During 2023, £3.49m or 11.0% of Group revenue depended on a single customer. In 2022, £3.17m or 17.3% of Group revenue depended on a single customer. All board revenue is recognised at a point in time in relation to the terms and conditions of each contract, with systems and warranty (immaterial) revenue recognised over time. |
|
Revenue |
Year to |
Year to |
||||||
|
31 December |
31 December |
|||||||
|
2023 |
2022 |
|||||||
|
£ |
£ |
|||||||
|
United States |
13,060,691 |
6,564,816 |
||||||
|
Malaysia |
392,850 |
3,047,798 |
||||||
|
Germany |
6,450,372 |
- |
||||||
|
United Kingdom |
2,148,568 |
1,167,266 |
||||||
|
Other Europe |
4,178,401 |
4,003,849 |
||||||
|
Rest of the World |
5,425,434 |
3,491,042 |
||||||
|
31,656,316 |
18,274,771 |
|||||||
|
Note 4 |
GROUP OPERATING PROFIT |
|||||||
|
Year to 31 December 2023 |
Year to 31 December 2022 |
|||||||
|
£ |
£ |
|||||||
|
Group operating profit is stated after charging to cost of sales: |
||||||||
|
Cost of inventories recognised as expense |
14,884,586 |
8,229,285 |
||||||
|
Staff costs (see Note 10) |
1,133,781 |
815,915 |
||||||
|
Group operating profit is stated after charging/(crediting) to operating expenses: |
||||||||
|
Net foreign exchange losses/(gains) |
279,491 |
(462,900) |
||||||
|
Total expensed research and development costs |
1,930,389 |
1,096,657 |
||||||
|
Amortisation of intangible assets |
1,509,167 |
1,197,972 |
||||||
|
Impairment of intangible assets |
31,557 |
327,526 |
||||||
|
Depreciation of owned property, plant and equipment |
686,403 |
244,648 |
||||||
|
Depreciation of ROU Asset |
203,870 |
177,399 |
||||||
|
Staff costs (see Note 10) |
9,002,640 |
6,712,098 |
||||||
|
Group principal auditor's remuneration: |
||||||||
|
Audit of Group financial statements pursuant to legislation |
150,000 |
232,443 |
||||||
|
Other non-auditor remuneration relating to taxation compliance |
25,000 |
6,026 |
||||||
|
Note 5 |
FINANCE INCOME |
|
Year to 31 December 2023 |
Year to 31 December 2022 |
|||||
|
£ |
£ |
|||||
|
Interest earned on bank deposits |
68,145 |
546 |
|
Note 6 |
TAX |
|
Year to 31 December 2023 |
Year to 31 December 2022 |
|||||
|
£ |
£ |
|||||
|
Current tax expense |
- |
(723,737) |
||||
|
Current deferred tax |
401,271 |
393,695 |
||||
|
Prior year tax expense |
(4,970) |
(41,142) |
||||
|
Prior year deferred tax |
(826,969) |
(111,835) |
||||
|
Current overseas tax charge |
30,420 |
(121,325) |
||||
|
(400,248) |
(604,344) |
|
The tax assessed on the Group's profit before tax for the year is less than the standard rate of corporation tax in the UK. The applicable rate of corporation tax for the year to 31 December 2023 was 23.52% (2022: 19.00%). Within the deferred tax charge for the year is an amount of £23,747 to reflect the effect of change in the UK tax rate. The differences are explained below: |
|
Note 6 |
TAX (CONTINUED) |
|
Year to |
Year to |
|||||
|
31 December |
31 December |
|||||
|
2023 |
2022 |
|||||
|
£ |
£ |
|||||
|
Profit before tax |
3,472,888 |
382,681 |
||||
|
Corporation tax on profit before tax at standard rate |
816,823 |
72,710 |
||||
|
Expenses not deductible for tax purposes |
282,141 |
22,632 |
||||
|
UK tax credits |
(486,705) |
(502,248) |
||||
|
Effect of change in UK tax rate |
23,747 |
87,757 |
||||
|
Share options |
- |
(5,746) |
||||
|
Effects of other reliefs |
- |
(25,062) |
||||
|
Difference in overseas effective tax rates |
(24,150) |
(38,264) |
||||
|
Adjustment in respect of previous years |
(1,012,104) |
(216,123) |
||||
|
Tax (credit)/charge |
(400,248) |
(604,344) |
||||
|
Factors that may affect future tax charges are as follows: UK tax rates and any changes to R&D tax credits would have an impact on the tax position of the Group and Parent Company. The current tax asset balance on the statement of financial position is made up of £708,057 current year and £784,564 historic repayment due. |
|
Note 7 |
DIVIDEND |
|
2023 £ |
2022 £ |
2023 pence per share |
2022 pence per share |
||||||||
|
Second interim (for the previous year) |
- |
1,027,088 |
- |
1.40 |
|||||||
|
Interim |
- |
- |
- |
- |
|||||||
|
- |
1,027,088 |
- |
1.40 |
||||||||
|
Interim dividends are recognised in the financial statements in the period they are paid. The Directors have proposed a 1p dividend for the year ended 31 December 2023 as a resolution for the AGM. (Total dividend for 2022 was nil.) |
|
Note 8 |
EARNINGS PER SHARE |
|
Basic earnings per share is calculated by dividing the profit attributable to ordinary equity holders for the period by the weighted average number of ordinary shares outstanding during the period. Diluted earnings per share is calculated by adjusting the weighted average number of ordinary shares outstanding to assume conversion of all contracted dilutive potential ordinary shares. The Company only has one category of dilutive potential ordinary shares, namely the share options. The inputs to the earnings per share calculation are shown below: |
|
2023 |
2022 |
||||||
|
Earnings |
Weighted average number of shares |
Per share amount |
Earnings |
Weighted average number of shares |
Per share amount |
||
|
Earnings attributable to ordinary shareholders on continuing operations after tax |
3,873,136 |
77,833,759 |
4.98 |
987,025 |
73,363,490 |
1.35 |
|
|
Dilutive effect of share options |
- |
2,069,974 |
- |
- |
- |
- |
|
|
Diluted earnings per share |
3,873,136 |
79,903,733 |
4.85 |
987,025 |
73,363,490 |
1.35 |
|
The diluted EPS figure reflects the impact of historic grants of share options and is calculated by reference to the number of options granted for which the average share price for the year was in excess of the option exercise price.
|
Note 9 |
DIRECTORS' EMOLUMENTS |
|
Year to 31 December 2023 |
Year to 31 December 2022 |
|||||
|
£ |
£ |
|||||
|
Fees and emoluments |
1,182,172 |
769,650 |
||||
|
Pension contributions |
18,632 |
20,697 |
||||
|
1,200,804 |
790,347 |
|||||
|
The emoluments of Directors disclosed above include in respect of the highest paid Director: |
||||||
|
Fees and emoluments |
571,029 |
334,961 |
||||
|
Pension contributions |
9,847 |
13,812 |
||||
|
The number of Directors to whom retirement benefits are accruing under a defined contribution scheme is: |
2 |
2 |
||||
|
Detailed information concerning Directors' emoluments, shareholdings and options is provided in the Report of the Remuneration Committee. |
|
Note 10 |
STAFF COSTS |
|
STAFF COSTS |
Group |
Company |
Group |
Company |
|||||
|
Year to |
Year to |
Year to |
Year to |
||||||
|
31 December |
31 December |
31 December |
31 December |
||||||
|
2023 |
2023 |
2022 |
2022 |
||||||
|
£ |
£ |
£ |
£ |
||||||
|
Wages and salaries |
8,501,442 |
7,055,210 |
6,218,053 |
5,190,752 |
|||||
|
Social security costs |
958,837 |
867,527 |
704,416 |
637,174 |
|||||
|
Defined contribution pension costs |
438,431 |
418,231 |
386,181 |
370,846 |
|||||
|
Share-based payment |
430,854 |
283,761 |
219,363 |
169,859 |
|||||
|
10,329,564 |
8,624,729 |
7,528,013 |
6,368,631 |
||||||
|
Average number of employees: |
No |
No |
No |
No |
|||||
|
Production |
39 |
38 |
34 |
34 |
|||||
|
Other |
103 |
88 |
87 |
78 |
|||||
|
142 |
126 |
121 |
112 |
||||||
|
Direct employment costs capitalised for the year to 31 December 2023: £2,389,672 (2022: £1,959,447). |
|
Note 11 |
PROPERTY, PLANT AND EQUIPMENT |
|
GROUP |
Improvements to short leasehold property |
Plant, fixtures and computer equipment |
|||||||
|
Right of use asset |
Total |
||||||||
|
£ |
£ |
£ |
£ |
||||||
|
COST |
|||||||||
|
At 1 January 2022 |
293,556 |
850,707 |
4,034,955 |
5,179,218 |
|||||
|
Foreign exchange movement |
11,202 |
16,102 |
27,304 |
||||||
|
Additions |
490,613 |
635,248 |
354,533 |
1,480,394 |
|||||
|
At 31 December 2022 |
784,169 |
1,497,157 |
4,405,590 |
6,686,916 |
|||||
|
Foreign exchange movement |
(6,251) |
(8,624) |
(14,875) |
||||||
|
Additions |
227,733 |
523,184 |
750,917 |
||||||
|
Modification and amendment |
(234,905) |
(234,905) |
|||||||
|
Transfer from intangibles |
75,045 |
75,045 |
|||||||
|
At 31 December 2023 |
1,005,651 |
1,262,252 |
4,995,195 |
7,263,098 |
|||||
|
ACCUMULATED DEPRECIATION |
|||||||||
|
At 1 January 2022 |
210,371 |
269,834 |
3,080,550 |
3,560,755 |
|||||
|
Foreign exchange movement |
4,595 |
14,412 |
19,007 |
||||||
|
Charge for the year |
49,657 |
177,399 |
194,991 |
422,047 |
|||||
|
At 31 December 2022 |
260,028 |
451,828 |
3,289,953 |
4,001,809 |
|||||
|
Foreign exchange movement |
(5,193) |
1,651 |
(7,288) |
(10,830) |
|||||
|
Charge for the year |
252,370 |
203,870 |
434,033 |
890,273 |
|||||
|
Modification and amendment |
(84,037) |
(84,037) |
|||||||
|
At 31 December 2023 |
507,205 |
573,312 |
3,716,698 |
4,797,215 |
|||||
|
NET BOOK VALUE |
|||||||||
|
At 31 December 2022 |
524,141 |
1,045,329 |
1,115,637 |
2,685,107 |
|||||
|
At 31 December 2023 |
498,446 |
688,940 |
1,278,497 |
2,465,883 |
|||||
|
Note 11 |
PROPERTY, PLANT AND EQUIPMENT (CONTINUED) |
|
COMPANY |
Improvements to short leasehold property |
Plant, fixtures and computer equipment |
|||||||
|
Right of use |
|||||||||
|
asset |
Total |
||||||||
|
£ |
£ |
£ |
£ |
||||||
|
COST |
|||||||||
|
At 1 January 2022 |
289,738 |
764,917 |
3,907,981 |
4,962,636 |
|||||
|
Transfer to intangibles |
- |
||||||||
|
Additions |
490,613 |
635,248 |
347,607 |
1,473,468 |
|||||
|
At 31 December 2022 |
780,351 |
1,400,165 |
4,255,588 |
6,436,104 |
|||||
|
Additions |
60,672 |
- |
303,337 |
364,009 |
|||||
|
Modification and amendment |
(234,905) |
(234,905) |
|||||||
|
Transfer from intangibles |
75,045 |
75,045 |
|||||||
|
At 31 December 2023 |
841,023 |
1,165,260 |
4,633,970 |
6,640,253 |
|||||
|
ACCUMULATED DEPRECIATION |
|||||||||
|
At 1 January 2022 |
206,552 |
241,554 |
2,969,017 |
3,417,123 |
|||||
|
Charge for the year |
49,657 |
159,924 |
180,900 |
390,481 |
|||||
|
At 31 December 2022 |
256,209 |
401,478 |
3,149,917 |
3,807,604 |
|||||
|
Charge for the year |
94,546 |
186,393 |
261,538 |
542,477 |
|||||
|
Modification and amendment |
(84,037) |
(84,037) |
|||||||
|
At 31 December 2023 |
350,755 |
503,834 |
3,411,455 |
4,266,044 |
|||||
|
NET BOOK VALUE |
|||||||||
|
At 31 December 2022 |
524,142 |
998,687 |
1,105,671 |
2,628,500 |
|||||
|
At 31 December 2023 |
490,268 |
661,426 |
1,222,515 |
2,374,209 |
|||||
|
Note 12 |
INTANGIBLE ASSETS INCLUDING GOODWILL |
|
GROUP |
|||||||||||
|
Development |
Customer |
||||||||||
|
costs |
Goodwill |
relationships |
Other |
Total |
|||||||
|
£ |
£ |
£ |
£ |
£ |
|||||||
|
COST |
|||||||||||
|
At 1 January 2022 |
27,374,092 |
1,079,817 |
28,453,909 |
||||||||
|
Foreign exchange movement |
- |
5,378 |
5,378 |
||||||||
|
Additions |
3,687,351 |
24,266 |
3,711,617 |
||||||||
|
At 31 December 2022 |
31,061,443 |
- |
- |
1,109,461 |
32,170,904 |
||||||
|
Foreign exchange movement |
(1,106) |
(1,106) |
|||||||||
|
Additions |
3,939,539 |
38,300 |
3,977,839 |
||||||||
|
Additions on acquisition |
1,230,594 |
1,130,851 |
383,593 |
2,745,038 |
|||||||
|
Transfer between classes |
(64,413) |
64,413 |
- |
||||||||
|
Transfer to tangibles |
(75,046) |
(75,046) |
|||||||||
|
At 31 December 2023 |
34,861,523 |
1,230,594 |
1,130,851 |
1,594,661 |
38,817,629 |
||||||
|
AMORTISATION |
|||||||||||
|
At 1 January 2022 |
21,056,492 |
776,251 |
21,832,743 |
||||||||
|
Foreign exchange movement |
- |
5,373 |
5,373 |
||||||||
|
Charge for the year |
1,093,820 |
104,152 |
1,197,972 |
||||||||
|
Impairment loss |
327,526 |
327,526 |
|||||||||
|
At 31 December 2022 |
22,477,838 |
- |
- |
885,776 |
23,363,614 |
||||||
|
Foreign exchange movement |
(1,106) |
(1,106) |
|||||||||
|
Charge for the year |
1,349,203 |
36,248 |
123,716 |
1,509,167 |
|||||||
|
Impairment loss |
31,557 |
31,557 |
|||||||||
|
At 31 December 2023 |
23,858,598 |
- |
36,248 |
1,008,386 |
24,903,232 |
||||||
|
31st December 2022 |
8,583,605 |
- |
- |
223,685 |
8,807,290 |
||||||
|
At 31 December 2023 |
11,002,925 |
1,230,594 |
1,094,603 |
586,275 |
13,914,397 |
||||||
|
COMPANY |
|||||||
|
Development |
|||||||
|
costs |
Other |
Total |
|||||
|
£ |
£ |
£ |
|||||
|
COST |
|||||||
|
At 1 January 2022 |
27,374,092 |
1,079,817 |
28,453,909 |
||||
|
Foreign exchange movement |
- |
5,378 |
5,378 |
||||
|
Additions |
3,687,351 |
24,266 |
3,711,617 |
||||
|
Disposals |
- |
||||||
|
At 31 December 2022 |
31,061,443 |
1,109,461 |
32,170,904 |
||||
|
Additions |
3,939,539 |
38,300 |
3,977,839 |
||||
|
Transfer between classes |
(64,413) |
64,413 |
- |
||||
|
Transfer to tangibles |
(75,046) |
- |
(75,046) |
||||
|
At 31 December 2023 |
34,861,523 |
1,212,174 |
36,073,697 |
||||
|
AMORTISATION |
|||||||
|
At 1 January 2022 |
21,056,492 |
776,251 |
21,832,743 |
||||
|
Foreign exchange movement |
- |
5,373 |
5,373 |
||||
|
Charge for the year |
1,093,820 |
104,152 |
1,197,972 |
||||
|
Disposals |
- |
||||||
|
Impairment loss |
327,526 |
327,526 |
|||||
|
At 31 December 2022 |
22,477,838 |
885,776 |
23,363,614 |
||||
|
Charge for the year |
1,349,203 |
111,420 |
1,460,623 |
||||
|
Disposals |
- |
||||||
|
Impairment loss |
31,557 |
31,557 |
|||||
|
At 31 December 2023 |
23,858,598 |
997,196 |
24,855,794 |
||||
|
31 December 2022 |
8,583,605 |
223,685 |
8,807,290 |
||||
|
At 31 December 2023 |
11,002,925 |
214,978 |
11,217,903 |
|
Development costs can be broken down as assets under development (based on original cost): £7,428,960 (2022: £4,652,822) and assets available for use (based on original cost): £27,432,563 (2022: £26,343,643). The cost of assets transferred from assets under development to available for use in the year was £1,088,920 (2022: £2,609,098). Other intangible assets comprise purchased software used within the business and software licences. All amortisation and impairment charges (or reversals if any) are included within 'Administrative Expenses'. |
|
Note 12 |
INTANGIBLE ASSETS (CONTINUED) |
|
Impairment Loss At the end of the year, the Directors reviewed the development projects. Each project is treated as a separate CGU. Expected future cash flows ('value in use' calculation, the discount rate and cash flows were calculated on a pre-tax basis) attributable to these projects are calculated over the lower of seven years or the remaining life of the project, discounted at the applied rate of 8.1%. Where indicators for impairment exist, management considers pipeline sales volume and the relevant margin of the product along with project-specific technical issues, customer feedback, opportunity for product substitution and other market factors. Following full review of all projects, the Company impaired a number of projects totalling £112,028. These products are all older products and all costs now impaired refer to historical costs. One previously impaired project had an impairment reversal upon further review in 2023; future revenue streams have become apparent and the impairment of £80,471 was reversed. Goodwill has arisen in FY23 due to the acquisition of Phillips Aerospace on 6 September 2023, which is a single CGU. The Group has undertaken an impairment review of the carrying value of the goodwill, using detailed forecasts of revenue (based on forecast orders and contracted backlog), costs of delivery and resulting profitability. The Group has reviewed using a discounted cash flow, with a discount rate of 8.1%. A number of sensitivities have been performed against the performance, especially against revenue (which drives the profitability) and the Directors are comfortable that there is sufficient headroom to strongly support the goodwill carried on the balance and, therefore, no impairment is necessary. Revenue would need to reduce by 67% for the headroom to be nil. |
|
Note 13 |
DEFERRED TAX LIABILITY |
|
Share- |
Accelerated |
||||||||||
|
based |
capital |
Tax |
|||||||||
|
payments |
allowances |
losses |
Other |
Total |
|||||||
|
£ |
£ |
£ |
£ |
£ |
|||||||
|
GROUP |
|||||||||||
|
At 1 January 2022 |
24,139 |
(1,826,126) |
(54,026) |
6,903 |
(1,849,110) |
||||||
|
Credited/(charged) to statement of comprehensive income |
81,059 |
(345,221) |
91,825 |
57 |
(172,280) |
||||||
|
Credited to equity |
245,555 |
- |
- |
- |
245,555 |
||||||
|
At 31 December 2022 |
350,753 |
(2,171,347) |
37,799 |
6,960 |
(1,775,835) |
||||||
|
Credited/(charged) to statement of comprehensive income |
-81,889 |
529,429 |
(185,619) |
- |
425,699 |
||||||
|
Deferred tax acquired and arising from acquisition |
(311,317) |
(311,317) |
|||||||||
|
At 31 December 2023 |
432,642 |
(1,641,918) |
147,820 |
(304,357) |
(1,661,453) |
|
COMPANY |
||||||||||
|
At 1 January 2022 |
24,139 |
(1,815,715) |
- |
- |
(1,791,576) |
|||||
|
Credited/(charged) to statement of comprehensive income |
81,059 |
(362,918) |
- |
- |
(281,859) |
|||||
|
(Charged) to equity |
245,555 |
- |
- |
- |
245,555 |
|||||
|
At 31 December 2022 |
350,753 |
(2,178,633) |
- |
- |
(1,827,880) |
|||||
|
Credited/(charged) to statement of comprehensive income |
81,889 |
529,429 |
(185,619) - |
- |
425,699 |
|||||
|
At 31 December 2023 |
432,642 |
(1,649,204) |
(185,619) - |
- |
(1,402,181) |
|
Note 14 |
INVESTMENTS |
|
COMPANY |
31 December 2023 £ |
31 December 2022 £ |
||
|
Investment in subsidiary companies |
||||
|
Shares at cost |
19,705 |
19,705 |
||
|
Capital contribution |
1,361,656 |
1,361,656 |
||
|
Equity-settled share-based payment |
191,278 |
65,591 |
||
|
Total investment in subsidiary companies |
1,572,639 |
1,446,952 |
||
|
The Group has closed the R&D facility located in India. The investment in the subsidiary company has not been impaired during 2023. This will be impaired in 2024 upon formal dissolution. The investment carried in the financial statements is £12,994. Subsidiary undertakings included in these financial statements, which are all wholly owned, at 31 December 2023 are: |
|
Place of |
Class of |
Percentage |
Nature |
||||||
|
Name |
incorporation |
share |
held |
of business |
|||||
|
By Company: |
|||||||||
|
Concurrent Tech |
Bangalore, |
Ordinary |
100% |
Non-trading |
|||||
|
India Private Ltd |
India |
Company |
|||||||
|
Concurrent |
California, |
Ordinary |
100% |
Sale and service of Company products |
|||||
|
Technologies, Inc. |
USA |
and R&D services for the Company |
|||||||
|
By Concurrent Technologies, Inc.: |
|||||||||
|
Omnibyte |
Illinois, |
Ordinary |
100% |
Dormant |
|||||
|
Corporation |
USA |
||||||||
|
Phillips Machine & Welding Co., Inc. |
California, |
Ordinary |
100% |
Developer and manufacturer of industrial |
|||||
|
USA |
products and associated services |
||||||||
|
Note 15 |
INVENTORIES |
|
Group 31 Dec 2023 |
Company 31 Dec 2023 |
Group 31 Dec 2022 |
Company 31 Dec 2022 |
|||||
|
£ |
£ |
£ |
£ |
|||||
|
Raw materials |
8,357,855 |
8,153,919 |
6,637,883 |
6,637,883 |
||||
|
Work in progress |
3,407,901 |
3,407,901 |
3,193,400 |
3,193,400 |
||||
|
Finished goods |
192,744 |
192,744 |
259,154 |
259,154 |
||||
|
11,958,500 |
11,754,564 |
10,090,437 |
10,090,437 |
|
During 2023, the provision for obsolete and slow-moving inventories has been increased by £543,686 (2022: decreased by £241,310). In accordance with IAS 2, inventories are measured at the lower of cost and net realisable value. The inventory balance movement includes an obsolescence provision, which has decreased by £80,509 in the period. £236,767 has been reversed due to these items of inventory not being considered obsolete any longer and £156,257 added to the provision. This comprises obsolete stock following an in-depth analysis of the Group's inventory. In 2023, a total of £14.8m (2022: £7.4m) of inventories was included in the Consolidated Statement of Comprehensive Income as an expense. |
|
Note 16 |
TRADE AND OTHER RECEIVABLES |
|
Group |
Company |
Group |
Company |
||||||
|
2023 |
2023 |
2022 |
2022 |
||||||
|
£ |
£ |
£ |
£ |
||||||
|
Trade receivables |
5,430,181 |
2,667,667 |
4,755,594 |
3,056,417 |
|||||
|
Prepayments and accrued income |
687,535 |
577,182 |
684,318 |
606,061 |
|||||
|
Other debtors |
325,111 |
325,111 |
- |
- |
|||||
|
Loan to subsidiary |
- |
2,786,644 |
- |
- |
|||||
|
Amounts due from subsidiary undertakings |
- |
2,178,391 |
- |
2,207,599 |
|||||
|
6,442,827 |
8,534,995 |
5,439,912 |
5,870,077 |
|
The Group applies the IFRS 9 simplified approach to measuring expected credit losses, which uses a lifetime expected loss allowance for all trade receivables. Trade receivables have been grouped based on shared credit risk characteristics. The expected loss rates are based on historic performance, as well as current macroeconomic conditions. The Company has assessed the recoverability of intercompany balances and deem no issues in terms of credit losses, with all amounts being repayable on demand. There have been no previous write-offs of intercompany balances and there are sufficient cash and other current assets to cover the amount. |
ECL provision matrix
|
31 December 2023 |
Current |
More than 30 days past due |
More than 60 days past due |
More than 90 days past due |
Total |
|
Expected loss rate |
- |
- |
- |
0.001% |
|
|
Gross carrying amount |
5,282,708 |
18,712 |
128,551 |
210 |
5,430,181 |
|
Lifetime expected credit loss |
- |
- |
- |
210 |
210 |
|
As a Group, we don't have a significant amount of bad debt, and historically bad debts have been very close to nil; due to the recurring nature of orders, our customers pay what is owed so it is not necessary for us to provide for any balances as bad debt, and when considering current and future macroeconomic conditions, the anticipated loss rate is expected to remain close to nil. |
|
Group 2023 £ |
Group 2022 £ |
|||||||
|
At 1 January |
210 |
1,188 |
||||||
|
Charged/(credited) to statement of comprehensive income |
- |
(978) |
||||||
|
At 31 December |
210 |
210 |
|
Group 2023 £ |
Company 2023 £ |
Group 2022 £ |
Company 2022 £ |
|||||
|
More than 30 days |
18,712 |
17,998 |
76,881 |
76,881 |
||||
|
More than 60 days |
128,551 |
128,448 |
73,086 |
49,336 |
||||
|
More than 90 days |
125,876 |
125,096 |
8,150 |
5,934 |
||||
|
273,139 |
271,542 |
158,117 |
132,151 |
Notes to the Financial Statements (continued)
|
Note 17 |
TRADE AND OTHER PAYABLES |
|
Current |
Group 2023 £ |
Company 2023 £ |
Group 2022 £ |
Company 2022 £ |
||||
|
Trade payables |
5,707,674 |
5,608,259 |
2,977,750 |
2,880,305 |
||||
|
Contract liabilities |
1,030,449 |
1,030,449 |
681,044 |
681,044 |
||||
|
Other payables |
355,549 |
46,329 |
233,990 |
55,159 |
||||
|
Current right of use lease liability |
294,662 |
268,472 |
202,287 |
180,044 |
||||
|
Other taxes and social security costs |
207,385 |
202,605 |
188,986 |
185,557 |
||||
|
Accruals |
2,070,693 |
1,733,933 |
1,500,205 |
1,189,197 |
||||
|
9,666,412 |
8,890,047 |
5,784,262 |
5,171,306 |
|
Non-Current |
Group 2023 £ |
Company 2023 £ |
Group 2022 £ |
Company 2022 £ |
|||||
|
Right of use lease liability |
695,272 |
677,607 |
1,257,820 |
1,211,405 |
|||||
|
695,272 |
677,607 |
1,257,820 |
1,211,405 |
||||||
|
Contract liabilities have been disaggregated from other payables in the current and prior years to provide more detailed information to the reader of the accounts as to the nature of other payables. |
|
Contract liabilities |
Warranty |
End of |
End of |
Non- |
Total |
|||||
|
(Group and Company) |
life |
life |
recurring |
|||||||
|
service |
engineering |
|||||||||
|
charge |
||||||||||
|
B/fwd as 1 January 2022 |
94,556 |
445,592 |
6,941 |
133,955 |
681,044 |
|||||
|
Addition |
42,174 |
266,676 |
- |
389,685 |
698,535 |
|||||
|
Release |
(87,486) |
(121,332 ) |
(6,357) |
(133,955) |
(349,130) |
|||||
|
Closing at 31 December 2023 |
49,244 |
590,936 |
584 |
389,685 |
1,030,449 |
|
Note 18 |
FINANCIAL INSTRUMENTS |
|
Financial Instruments by category |
|
Financial assets measured at amortised cost £ |
||||
|
GROUP |
||||
|
2022 |
Non-current: |
|||
|
2022 |
Current: |
|||
|
Trade and other receivables |
4,755,594 |
|||
|
Cash and cash equivalents |
4,512,720 |
|||
|
Total for category |
9,268,314 |
|||
|
2023 |
Non-current: |
|||
|
2023 |
Current: |
|||
|
Trade and other receivables |
5,430,181 |
|||
|
Cash and cash equivalents |
11,118,728 |
|||
|
Total for category |
16,548,909 |
|||
|
Financial liabilities measured at amortised cost £ |
||||
|
GROUP |
||||
|
2022 |
Current: |
|||
|
Trade and other payables |
4,895,232 |
|||
|
2023 |
Current: |
|||
|
Trade and other payables |
8,428,578 |
|
Included in the above are trade payables, other payables, accruals and lease liabilities. All non-current liabilities, as displayed in Note 17, relate to lease liabilities, which are financial liabilities measured at amortised cost. |
|
Note 19 |
PROVISIONS |
|
GROUP AND COMPANY |
Dilapidation £ |
Product warranty £ |
||||
|
Carrying amount at 1 January 2023 |
286,080 |
36,512 |
||||
|
Increase in provisions |
10,799 |
- |
||||
|
Amount utilised |
- |
- |
||||
|
Carrying amount at 31 December 2023 |
296,879 |
36,512 |
||||
|
Provisions have been analysed between current and non-current as follows: |
||||||
|
Current |
18,256 |
|||||
|
Non-current |
315,135 |
|
Warranties are provided for on the basis of management's best estimate of the Group's liability under 24-month warranties granted on its hardware products, based on past experience. Dilapidations are provided for on the basis of management's best estimate for both the Colchester and Theale office. This is recognised over the life of each lease. |
|
Note 20 |
LEASES AND COMMITMENTS |
|
The Group leases properties for its operations in the UK and US, and the information is presented below; all leases relate to property. |
|
|||||||||||||||||||||||||||||||||||||||||||||||||||||||||||||||||||||||||||||||||||
The right of use in relation to leasehold property are disclosed as PPE (Note 11). Leases are made up of three properties, with the terms as follows: UK office (Colchester) has no remaining break clauses; UK office (Theale) has a break clause of 1 April 2028; US office has an annual automatic one-year extension unless notice is given. |
|||||||||||||||||||||||||||||||||||||||||||||||||||||||||||||||||||||||||||||||||||
|
Amounts payable under lease arrangements |
Group |
Company |
Group |
Company |
|||||||||||||||||||||||||||||||||||||||||||||||||||||||||||||||||||||||||||||||
|
2023 |
2023 |
2022 |
2022 |
||||||||||||||||||||||||||||||||||||||||||||||||||||||||||||||||||||||||||||||||
|
£ |
£ |
£ |
£ |
||||||||||||||||||||||||||||||||||||||||||||||||||||||||||||||||||||||||||||||||
|
Within one year |
(357,040) |
(325,462) |
(303,061) |
(269,641) |
|||||||||||||||||||||||||||||||||||||||||||||||||||||||||||||||||||||||||||||||
|
Within two to six years |
(757,806) |
(739,386) |
(1,433,763) |
(1,380,848) |
|||||||||||||||||||||||||||||||||||||||||||||||||||||||||||||||||||||||||||||||
|
Add unearned interest |
124,911 |
118,769 |
276,717 |
259,040 |
|||||||||||||||||||||||||||||||||||||||||||||||||||||||||||||||||||||||||||||||
|
(989,935) |
(946,079) |
(1,460,107) |
(1,391,449) |
||||||||||||||||||||||||||||||||||||||||||||||||||||||||||||||||||||||||||||||||
|
At 31 December 2023, the Group was committed to a short-term lease for the Phillips Aerospace office lease (2022: None). The Group has elected not to recognise a lease liability for short-term leases or for leases of low-value assets. Payments made on these leases are expensed on a straight-line basis and the value of these expenses in the year was £49,606. Amounts recognised in the Consolidated Statement of Comprehensive Income. |
|
Note 20 |
LEASES AND COMMITMENTS (CONTINUED) |
|
Group 2023 £ |
Group 2022 £ |
|||
|
Short-term and low-value lease expense |
49,606 |
- |
||
|
Depreciation charge |
203,870 |
195,254 |
||
|
Interest expense |
103,008 |
111,941 |
|
Amounts recognised in the Consolidated Statement of Cash Flows. |
|
Group 2023 £ |
Group 2022 £ |
|||
|
Short-term and low-value lease expense |
- |
- |
||
|
Payment of lease liabilities |
301,219 |
94,842 |
|
Capital commitments At the end of the year, the capital expenditure commitment (for a machine for the factory) was £142,008 (2022: £nil). |
|
Note 21 |
SHARE CAPITAL, SHARE PREMIUM, MERGER RESERVE AND CAPITAL REDEMPTION RESERVE |
|
31 Dec 2023 £ |
31 Dec 2022 £ |
|||
|
Allotted, issued and fully paid share capital: |
||||
|
Ordinary shares (86,169,236 of 1p each) |
861,692 |
739,000 |
Share capital
|
Balance as at 1 January 2023 |
739,000 |
|
|
Shares issued for equity raise |
104,615 |
|
|
Shares issued for acquisition |
18,077 |
|
|
Balance as at 31 December 2023 |
861,692 |
|
Share premium |
||||
|
Balance as at 1 January 2023 |
3,699,105 |
|||
|
Shares issued for equity raise less issue costs |
6,251,126 |
|||
|
Balance as at 31 December 2023 |
9,950,231 |
|||
|
Merger reserve |
|||
|
Balance as at 1 January 2023 |
- |
||
|
Shares issued for acquisition |
1,283,457 |
||
|
Balance as at 31 December 2023 |
1,283,457 |
||
|
Capital redemption reserve |
|||
|
Balance as at 1 January 2023 |
256976 |
||
|
- |
|||
|
Balance as at 31 December 2023 |
256,976 |
||
During the year, 10,461,538 shares were issued as part of an equity raise for the Company. A further 1,807,686 were issued as part of the acquisition of Phillips Aerospace.
|
At 31 December 2023, the Company held 531,522 ordinary shares (2022: 531,522) with an aggregate nominal value of £5,315 (2022: £5,315) in treasury. |
|
Treasury shares |
||||
|
Balance as at 1 January 2023 |
531,522 |
|||
|
Shares sold |
- |
|||
|
Balance as at 31 December 2023 |
531,522 |
|
Note 22 |
PENSION SCHEME |
|
The Company operates a group personal pension scheme, which all permanent employees may join. The scheme, which is a defined contribution scheme, is independent of the Company's finances. The Company's contributions are based on between 5.5% and 13.5% of members' gross salaries, dependent upon the length of service of the individual. The Company has also chosen NEST (National Employment Savings Trust) as its workplace pension scheme to meet its employer duties under the auto-enrolment rules. Contributions to the NEST scheme are at the minimum rates. The total charge to administrative expenses in the statement of comprehensive income is disclosed in Note 10 'Staff Costs'. Pension contributions payable to the schemes at the end of the year were £63,681 (2022: £55,160). |
|
Note 23 |
FINANCIAL RISK MANAGEMENT |
|
The Group is exposed to various risks in relation to financial instruments. The Group's financial assets and liabilities by category are summarised in Note 18. The main types of risks are market risk, credit risk and liquidity risk. The Group's policy in respect of financial risk management is referred to in the report on corporate governance. The Group does not actively engage in the trading or holding of financial assets for speculative purposes. The most significant financial risks to which the Group is exposed are described below. |
|
|
Market risk analysis The Group is exposed to market risk through its use of financial instruments and specifically to currency risk that results from its operating activities. |
|
|
Foreign currency sensitivity A number of transactions are conducted by companies in the Group in currencies other than their functional currency, which give rise to monetary assets and liabilities denominated in other currencies. The Group's exposure to foreign currency exchange risk is mitigated to a large extent by natural hedging, as assets in currency are matched by liabilities in the same currency. The value of monetary assets and liabilities of the Group and Company not held in functional currencies at the balance sheet date were as follows: |
|
Net foreign currency monetary assets/(liabilities) |
||||||||||||||
|
2023 US dollar £ |
2022 US dollar £ |
|||||||||||||
|
Group |
(447,522) |
(175,103) |
||||||||||||
|
2023 US dollar £ |
2022 US dollar £ |
||||||
|
If sterling had strengthened by 5% against US dollar: |
|||||||
|
Impact on net Group result and equity for the year |
21,312 |
8,338 |
|||||
|
If sterling had weakened by 5% against US dollar: |
|||||||
|
Impact on net Group result and equity for the year |
(23,555) |
(9,216) |
|
Exposures to foreign exchange rates vary during the year depending on the volume of overseas transactions. Nonetheless, the analysis above is considered to be representative of the exposure to currency risk. |
|
Credit risk analysis Credit risk is the risk that a counterparty fails to discharge an obligation to the Group. The Group is exposed to this risk from cash and cash equivalents and outstanding receivables. The Group applies the IFRS 9 simplified approach to measuring expected credit losses, which uses a lifetime expected loss allowance for all trade receivables. To measure the expected credit losses, trade receivables and contract assets have been grouped based on shared credit risk characteristics and the days past due. On that basis, the loss allowance as at 31 December 2023 and 31 December 2022 was determined as follows: |
|
Note 23 |
FINANCIAL RISK MANAGEMENT (CONTINUED) |
|
Group |
|
31 December 2023 |
Current |
More than 30 days past due |
More than 60 days past due |
More than 90 days past due |
Total |
|
Expected loss rate |
- |
- |
- |
100% |
|
|
Gross carrying amount |
5,282,708 |
18,712 |
128,551 |
210 |
5,430,181 |
|
Lifetime expected credit loss |
- |
- |
- |
210 |
210 |
|
31 December 2022 |
Current |
More than 30 days past due |
More than 60 days past due |
More than 90 days past due |
Total |
|
Expected loss rate |
- |
- |
- |
100% |
|
|
Gross carrying amount |
4,605,417 |
76,881 |
73,086 |
210 |
4,755,594 |
|
Lifetime expected credit loss |
- |
- |
- |
210 |
210 |
|
The Group loss allowances for trade receivables as at 31 December reconcile to the opening loss allowances as follows: |
|
2023 |
2022 |
|
|
£ |
£ |
|
|
Opening loss allowance at 1 January |
210 |
1,188 |
|
Loss allowance recognised during the year |
- |
(978) |
|
Closing loss allowance at 31 December |
210 |
210 |
|
The credit risk for cash and cash equivalents and fixed-term cash deposits is considered negligible since the counterparties are reputable banks with high-quality external credit ratings. |
|
Liquidity risk analysis |
|
2023 |
Current |
More than 30 days past due |
More than 60 days past due |
More than 90 days past due |
Total |
|
Trade payables |
4,747,497 |
673,864 |
154,861 |
131,452 |
5,707,674 |
|
Accruals |
2,070,693 |
2,070,693 |
|
2022 |
Current |
More than 30 days past due |
More than 60 days past due |
More than 90 days past due |
Total |
|
Trade payables |
1,446,455 |
1,331,839 |
120,802 |
78,654 |
2,977,750 |
|
Accruals |
1,500,205 |
1,500,205 |
|
Liquidity risk is that the Group might be unable to meet its obligations. The Group manages its liquidity needs by monitoring forecast cash inflows and outflows due in day-to-day business. Liquidity needs are monitored in various time bands, on a week-to-week basis and by monthly forecasting. |
|
The Group's objective is to maintain cash to meet its liquidity requirements for the foreseeable future. This objective was met for the reporting periods. Funding for long-term liquidity needs is assessed by the Board on a regular basis. The Group considers expected cash flows from financial assets in assessing and managing liquidity risk, in particular its cash resources and trade receivables. The Group's existing cash resources and trade receivables (see Note 16) exceed the current cash outflow requirements. Cash flows from trade and other receivables are all contractually due within three months. |
|
Note 24 |
CAPITAL MANAGEMENT |
|
The Group's objectives when managing capital are: (i) to ensure the Group's ability to continue as a going concern, and (ii) to provide an adequate return to shareholders by pricing products and services commensurately with the level of risk. |
|
|
The Group monitors capital on the basis of the carrying amount of equity less cash and cash equivalents as presented on the face of the Consolidated Balance Sheet. The Group manages the capital structure and makes adjustments to it in the light of changes in economic conditions and the risk characteristics of the underlying assets. In order to maintain or adjust the capital structure, the Group may adjust the number of dividends paid to shareholders, return capital to shareholders, purchase its own shares to hold in treasury, issue new shares or sell assets. There were no changes in the Group's approach to capital management during the year. Neither the Company nor any of its subsidiaries are subject to externally imposed capital requirements. Capital for the reporting periods under review is summarised as follows: |
|
Group |
Group |
|||
|
2023 |
2022 |
|||
|
£ |
£ |
|||
|
Total equity |
35,036,427 |
23,176,502 |
||
|
Cash and cash equivalents |
(11,118,728) |
(4,512,720) |
||
|
Capital |
23,917,699 |
18,663,782 |
||
|
Total equity and overall financing |
35,036,427 |
23,176,502 |
||
|
Capital to overall financing ratio |
0.68 |
0.81 |
|
Note 25 |
RELATED PARTY TRANSACTIONS |
|
The Company has taken the FRS 101 exemption given that transactions are only with other wholly owned Group companies. The are no transactions for the Group to report on under IAS 24. All intra-Group transactions are removed on consolidation. |
|
Dividends paid to Directors during the year amounted to: - 280 |
|
Transactions with key management personnel during the period: Key management personnel are the Company's Board. Key management personnel remuneration includes the following expenses: |
||||||||
|
Group 2023 £ |
Group 2022 £ |
|||||||
|
Short-term employee benefits |
1,305,205 |
869,717 |
||||||
|
Post-employment benefits |
18,632 |
20,697 |
||||||
|
Share-based payment (IFRS 2) |
287,773 |
161,114 |
||||||
|
1,611,610 |
1,051,528 |
|||||||
|
Note 26 |
SHARE-BASED PAYMENT |
|
At the beginning of 2021, the Company operated an enterprise management incentive share option scheme. During 2021, an LTIP was introduced. The LTIP scheme provides for a grant price equal to the nominal value of the Company's shares on the date of grant. Options cannot be vested until three years after grant date and vesting is conditional upon the Group achieving a compound percentage growth of the Group average basic earnings per ordinary share, for the complete years commencing 1 January of the year of grant and ending with the year most immediately prior to the vesting of the option. The latest date for exercising options is ten years after grant date and vesting of options is subject to continued employment with the Group. |
|
2023 Options No |
2023 Weighted average price pence |
2022 Options No |
2022 Weighted average price pence |
|||||||
|
Outstanding at 1 January |
2,289,797 |
31.14 |
1,467,205 |
47.29 |
||||||
|
Granted |
2,300,209 |
1.00 |
991,357 |
1.00 |
||||||
|
Exercised |
- |
- |
(5,000) |
48.50 |
||||||
|
Forfeited/Lapsed |
(35,804) |
1.00 |
(163,765) |
70.20 |
||||||
|
Outstanding at 31 December |
4,554,202 |
16.15 |
2,289,797 |
31.14 |
||||||
|
Weighted average share price at date of exercise |
- |
- |
5,000 |
48.50 |
||||||
|
Exercisable at 31 December 2023 |
Nil |
- |
Nil |
- |
||||||
|
Options outstanding at 31 December 2023 had exercise prices ranging from 1.0 pence to 101.50 pence and a weighted average remaining contractual life of 2.49 years (2022: 3.97 years). The inputs to the Black-Scholes model for options granted over the period were as follows: |
|
Grant date |
23 Oct 2023 |
20 Nov 2023 |
|||
|
Share price at grant date |
£0.67 |
£0.71 |
|||
|
Exercise price |
£0.01 |
£0.01 |
|||
|
Dividend yield |
2.85% |
2.85% |
|||
|
Risk-free interest rate |
4.50% |
4.17% |
|||
|
Volatility |
36.00% |
36.10% |
The share-based payment charge for 2023 was £430,854 (2022: £219,363).
|
Note 27 |
BUSINESS COMBINATIONS |
Acquisition in 2023
Acquisition of Phillips Aerospace
During the year, on 6 September 2023, the Group acquired 100% of the voting shares of Phillips Aerospace Limited, a non-listed company based in the US and specialising in the development and manufacture of industrial products and associated services, in exchange for the Company's shares and cash. The Group acquired Phillips Aerospace Limited because its strategy was to use the Phillips business and diversify it into actual systems, offering it additionally to the Group's customer base, as well as gaining Phillips' customer relationships. These expansion, growth and export opportunities provide an established presence in North America.
Assets acquired and liabilities assumed
The fair values of the identifiable assets and liabilities of Phillips Aerospace Limited as at the date of acquisition were:
|
At acquisition |
|
|
£ |
|
|
Tangible fixed assets |
20,039 |
|
Trade and other receivables |
251,984 |
|
Cash acquired |
146,660 |
|
Current liabilities |
(111,377) |
|
Long-term liabilities |
(1,007,336) |
|
Net assets on acquisition |
(700,030) |
|
Separately identifiable intangible assets on acquisition |
1,538,429 |
|
Goodwill on acquisition |
1,269,443 |
|
Total investment in subsidiary |
2,107,843 |
|
Initial consideration - cash |
832,427 |
|
Share consideration |
1,301,534 |
|
Escrow |
(26,118) |
|
Total investment in subsidiary |
2,107,843 |
The deferred tax liability comprises the tax effect of the accelerated depreciation for tax purposes of tangible and intangible assets.
There was additional cash transferred as part of the acquisition of £667,347 to pay off outstanding loan balances within Phillips Aerospace.
Separately identifiable intangible assets comprise customer relationships £1,148,761 and licences £389,668.
The goodwill of £1,294,255 comprises the value of expected synergies arising from the acquisition, the assembled workforce and technological know-how, which is not separately recognised.
From the date of acquisition, Phillips Aerospace Limited contributed £819,500 of revenue and £201,000 to profit before tax from continuing operations of the Group.
Phillips Aerospace revenue for the year was £1,584,587 and £36,680 profit before tax.
£195,881 of exceptional acquisition expenses were incurred as a direct result of the Group acquiring Phillips Aerospace.
The creation of a merger reserve of £1,283,457 is a result of acquiring Phillips Aerospace in accordance with s612 CA06. In total 1,807,686 shares were issued in relation to the acquisition.
|
Note 28 |
ULTIMATE CONTROLLING PARTY |
|
The Directors have assessed that there is no ultimate controlling party. |