

22 June 2023
MANOLETE PARTNERS PLC
("Manolete" or the "Company")
Audited results for the year ended 31 March 2023
Manolete (AIM:MANO), the leading UK-listed insolvency litigation financing company, today announces its audited results for the year ended 31 March 2023.
Steven Cooklin, Chief Executive Officer, commented:
"The annual results for FY23 mask a picture of two very different six-month periods for the Company: the first half of the trading year was subdued, as the Company had only just begun to emerge from the ending, in April 2022, of the temporary suspension of certain important insolvency laws that the UK Government had instigated in June 2020 in response to the COVID-19 pandemic. While normal insolvency laws resumed at the start of the financial year, there is always a natural time lag between insolvencies commencing and the associated litigation claims being referred to Manolete, as Liquidators and Administrators need time to conduct their regulatory investigations before they can assemble cases for consideration by us. The second half saw a strong resumption of the growth that the Company had exhibited prior to the pandemic, as the UK Insolvency Market returned to normal operations with a strong recovery in cases being referred to us.
Given the fact that we enjoyed only the latter six months of more "normal" trading, the results are highly commendable given the loss made in H1 and recovery in H2. We had a record number of 798 new case enquiries and a record number of 263 new case investments; gross cash receipts from completed cases were at a record level of £26.7m and a new record was also set with 193 cases being legally completed in the 12-month period. We ended the year with another record number of 351 live cases in progress and the Company returning to profitability in the second half.
These positive KPIs have continued into the current FY24 - with signed cases for the first two months of FY24 being 154% higher than the first two trading months of the FY23. Consequently, we have added, and continue to add, to our expert in-house legal and financial analyst teams to address the increased level of demand for our insolvency litigation solutions. With prevalent headwinds of inflation and significantly higher interest rates facing the UK economy, the Company is well set for continued growth over the foreseeable future".
Financial (statutory and non-statutory) highlights:
· Realised revenues on completed cases were £26.8m, an increase of 76% (FY22: £15.2m) although FY23 contained an exceptionally large funded case completion of which £4.9m was recorded in realised revenue (total settlement £9.5m).
· 129% of total revenues represented by realised revenues on fully completed cases (FY22: 77%) offset by negative unrealised revenues.
· Increase in the valuation of the cartel cases contributed £1.2m to gross profit in FY23 (FY22: £5.1m).
· EBIT reduced by 159% to a loss of £(3.1)m (FY22: £5.3m) a result of pressure on valuations in H1 FY23 on existing cases and a single rare larger case loss at trial.
· The Company made a loss before tax of £(4.0)m (FY22: £4.5m profit).
· Gross cash receipts from completed cases were £26.7m, an increase of 72% (FY22: £15.5m).
· The Company's retained share of gross cash receipts from completed cases (after all legal costs and payments to Insolvent Estates) was £13.1m, an increase of 47% (FY22: £8.9m).
· Cash generated from operations (after all completed case costs and all overheads but before new case investments and taxation) was £8.0m (FY22: £4.4m).
· Gross cash of £0.6m and borrowings of £10.5m (FY22: £2.2m and £13.5m) as at 31 March 2023 and £14.5m unutilised funds available on the Revolving Credit Facility with HSBC.
· Final dividend of nil per share.
Operational highlights:
· New case investments in UK insolvency cases, an increase of 65%: 263 in FY23 (FY22: 159).
· Based on unaudited internal management information: ROI of 125% and Money Multiple of 2.2x from 689 completed cases since inception
· Based on unaudited internal management information: 193 cases were completed in FY23 (FY22: 139 cases), with an average duration per case of 15.5 months (FY22: 13.2 months), generating a Money Multiple of 1.9x (FY22: 1.87) and an IRR of 131% (FY22: 132%)
· Average case duration across the full portfolio of 689 completed cases is 12.8 months
· 29% increase in live cases: 351 in process as at 31 March 2023 (272 as at 31 March 2022)
A copy of the annual report and accounts will be available on the Company's website shortly and will be posted to shareholders in due course.
For further information please contact:
|
Manolete Partners |
via Instinctif Partners |
|
Steven Cooklin (Chief Executive Officer) |
|
|
Peel Hunt (NOMAD and Broker) |
+44 (0)20 7418 8900 |
|
Paul Shackleton |
|
|
Instinctif Partners |
+44 (0)78 3767 4600 |
|
Tim Linacre Victoria Hayns |
I am delighted to present my second report as your Chairman.
Overview
I am pleased to report the Company has delivered a performance that generated growth in the second half of the year, following a first half of the year which remained subdued. Despite this second half performance, the business recorded a loss for the year as a whole.
In terms of new business generated, 263 new case investments were signed in the year to 31 March 2023 which represents a new record number (FY22:159).
Financial results
Revenues for the year to 31 March 2023 increased by 2% to £20.8m (FY22: £20.4m) and Loss before Tax was (£4.0m) compared to a Profit before Tax of £4.5m in the prior year. The loss was largely the result of fair value write downs in H1 FY23, including a large case loss at trial.
There were 193 case completions (FY22: 139) which is a record for the company. Completed cases generated gross cash receipts of £26.7m (FY22: £15.5m) and contributed to a growth in receivables balances to £24.4m (FY22: £20.3m). Gross profit of £3.7m (FY22: £10.4m) was generated by profits on realised cases of £9.7m (FY22: £5.2m) and unrealised gross loss of (£6.0m) (FY22: gross profit of £5.2m).
We have drawn down a total of £10.5m (FY22: £13.5m) of our £25m Banking Facility with HSBC to support the growth of the business. This Revolving Credit Facility is until 1 July 2025 with a £10m accordion. Details are set out in the CFO's report.
Strategy
We remain focused on strengthening the profile of Manolete, and an important component to our strategy is to continue to build upon our network of established Insolvency Practitioner and insolvency lawyer contacts throughout the UK.
The Covid pandemic resulted in the UK Government enacting the Corporate Insolvency and Governance Act 2020 ("temporary measures") to protect employment and businesses which led to a fall in corporate insolvencies. Whilst the pandemic is now behind us, the tail of these measures continued to impact the business in H1 FY23. In H2 FY23, we have expanded the business to take advantage of the increasing number of corporate insolvencies, now that the pandemic-era Government support measures have come to an end.
Dividend
The Board has reviewed the dividend policy and no final dividend is recommended.
Corporate Governance
The Board of Directors is committed to good corporate governance. The Company has adopted the ten principles of the 2018 Version of the Corporate Governance Code as set out by the Quoted Companies Alliance. Our arrangements are further described in our Corporate Governance Statement on pages 33 to 37.
The Audit Committee report on pages 39 to 40 and the Remuneration Committee report on pages 41 to 43 describe the remits and approaches of those committees to fulfilling their governance responsibilities. A statement on corporate governance is also provided on our website (https://investors.manolete-partners.com/company-information/corporate-governance).
People
On behalf of the Board and shareholders, I would like to thank our team, which is comprised of highly dedicated, extremely knowledgeable and focused staff, for their commitment and hard work during a very demanding year. My particular thanks to Steven Cooklin for providing strong leadership to the team.
Board
The Board represents a balanced mix of individuals who have now had a year together in the current Board structure and are working effectively for the benefit of the Company. I was pleased to welcome Mena Halton onto the Board earlier in the year, as Managing Director, to provide greater legal expertise from the executive team.
I note that following the disappointing trial result of a single large case in H1 FY23, the Board now reviews all cases that could potentially go forward to trial, in order to provide guidance in this area.
Outlook
Following a strong H2 FY23, we look forward to a period of growth in FY24 reflecting the increasing number of corporate insolvencies in the UK. The Company is preparing for growth with the recruitment of additional legal staff and support staff to allow this opportunity to be seized.
I also note the exciting opportunity with respect to the Bounce Back Loans (BBLs) pilot with Barclays Bank plc which will evolve during the coming year.
Lord Leigh
Non-Executive Chairman
21 June 2023
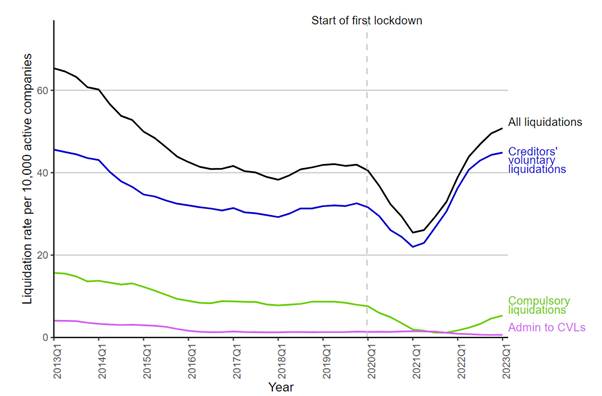
CEO's StatementFY23 painted a picture of two highly contrasting half years. The first half of the trading year was, as expected, subdued. Following a temporary material suppression of UK insolvency laws during the Covid-19 pandemic, the UK Government returned the laws substantially back to their pre-pandemic status on 1 April 2023 (coincidentally, the start of the Company's FY23 trading year). As can be seen from the graph below, insolvency activity rose in anticipation of a return to normal insolvency laws and then increased above pre-pandemic levels. However, as the Board has explained, there is always a time-lag (of approximately seven months) between insolvency numbers and cases being referred to the Company: this is because Liquidators and Administrators require this period to properly investigate claims, before being able to present claims to the Company.
The following graph issued by the Insolvency Service on 28 April 2023, clearly illustrates the impact of these measures on the UK insolvency industry.
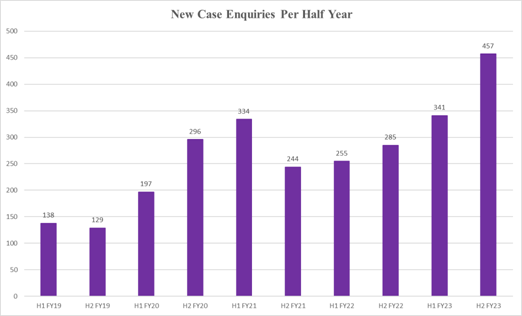
This time lag can be seen clearly feeding into the Company's Key Performance Indicators:
(i) Manolete New Case Enquiries
The graph below shows a slowly recovering level of new case enquiries in H1 FY23 as UK insolvency numbers rose. Then, having got past the seven-month time lag for claim investigations to occur, H2 showed a strong increase in the level of new enquiries, giving the Company a record level of new case enquiries for that latter six-month period.
(ii) New Case Investments
The time lag between new case enquiries coming into the Company and those qualifying cases being signed up as new case investments is very much shorter. Our Net Worth Reporting team are able to analyse the financial assessment of the proposed defendants on a claim within a few days. If the Net Worth Report is positive, our in-house legal team are then usually able to report to the Company's Investment Committee within 7-10 days, with offers being sent to office holders (Liquidators or Administrators) the next day. Office holders are usually in a position to decide on our offer within a week or so.
Therefore, the new case investments graph below, quickly starts to mirror the shape of the new case enquiries:
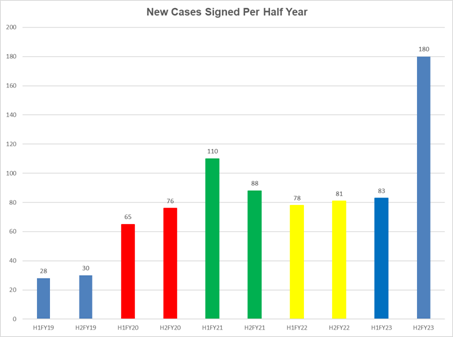
This shows the stark contrast in trading between H1 FY23 and H2 FY23. As all cases have to be given a value the impact on the financial performance of the Company is clear: a challenging first half, followed by a sharply improved second half of FY23.
Despite the Company operating under subdued trading conditions for the first half and the loss for the full year, the Company performed well over the year as a whole in many key areas compared to FY22. Thanks to the strong second half trading:
· Invested in record number of 263 new UK insolvency claims, an increase of 65% (FY22: 159).
· A record number of 193 cases were completed, an increase of 39% (FY22: 139).
· Realised revenues on completed cases were £26.8m, an increase of 76% (FY22: £15.2m) although FY23 contained an exceptionally large funded case completion of which £4.9m was recorded in realised revenue (total settlement £9.5m) - our second largest ever completed case and one where all the cash was received within just a few weeks of completing the case.
· Gross cash receipts from completed cases were £26.7m, an increase of 72% (FY22: £15.5m).
· The Company's retained share of gross cash receipts from completed cases (after all legal costs and payments to Insolvent Estates) was £13.1m, an increase of 47% (FY22: £8.9m).
· Cash generated from operations (after all completed case costs and all overheads but before new case investments and taxation) was £8.0m (FY22: £4.4m).
· EBIT reduced by 159% to a loss of (£3.1m) (FY22: profit of £5.3m) a result of the H1 loss caused by the subdued H1 trading environment, a review of case valuations on existing cases precipitated by the worsening UK economic environment and a rare adverse opinion on a large case.
· Increase in the valuation of the cartel cases contributed £1.2m to gross profit in FY23 (FY22: £5.1m).
The Company had net debt of £9.7m as at 31 March 2023 in comparison to £11.1m in FY22. The Company has a £35m funding package with HSBC on attractive terms: a Revolving Credit Facility ("RCF") of £25m over an initial three-year period to 1 July 2024, which was extended by 1 year to 1 July 2025 in July 2022. The RCF also offers the Company an additional approved but uncommitted £10m accordion, if ever required. Management would require approval from HSBC before gaining access to these additional funds. The interest rate is a maximum 3.7% over SONIA. During the period, management has amended the existing loan facility with HSBC to provide more lenient covenants.
Overall, for FY23, 129% of total revenues (FY22: 75%) of £20.7m (FY22: £20.4m) and 264% of total gross profit (FY22: 50%) of £3.7m (FY22: £10.4m) were from realised completed cases. 74% of total revenues derived from purchased cases (FY22: 93%) and 26% from funded cases (FY22: 7%) - the large £9.5m case (£4.9m of which was Manolete's share) referred to earlier was a rare funded case. It is the Company's ability to purchase (and therefore fully control) its legal claims that fundamentally distinguishes it from almost all other litigation funding companies. Of the 263 new cases signed in FY23, 93% were purchased cases and 7% were funded cases. This is in line with the Company's expectations of a continuing greater acceptance of the Company's core business model in the insolvency industry.
Cash Generation
Cash generation was very strong throughout FY23. Overall gross cash receipts rose 72% to a record £26.7m for FY23. It should be noted that 83% of those cash receipts came from cases completed in FY23 whereas 11% derived from cases that completed in FY22 and the balance of 6% coming from earlier case investment vintages. The £26.7m of cash generated derived from 235 separate cases (FY22: £15.5m from 183 historic cases), which highlights the wide diversity and granularity of the Company's cash income.
For the first time in our history the Company generated positive net cash income after all operating, investment, taxation and interest costs but excluding net borrowing movements: FY23: £1.4m (FY22: net cash outflow (£3.2m)).
Cartel Cases
There have been material developments relating to the Company's cartel cases in recent months. Early in this calendar year 2023, the judgments for the large truck cartel cases relating to British Telecom Plc and Royal Mail Plc (the "first wave") were handed down with significant damages and interest being awarded to the Claimants. The two key important aspects of the judgments were that the overcharge was assessed at 5% and the discount for pass on was rejected. Interest was awarded on a simple basis at base rate plus 2%. Our external expert cartel case valuation advisers, Fideres, accordingly updated their valuations of the Company's 22 similar truck cartel claims and this supported the net book carrying value of those cases as at 31 March 2023.
The "second wave" of truck cartel cases settled soon after the judgments on the first wave. Terms were not made public but the fact that the defendants are clearly willing to engage in settlement discussions on some significant claims is a further encouragement. The third wave of trials is awaited, and we are currently reviewing the litigation strategy on our group of 22 truck cartel cases, which are currently stayed, with our expert legal advisers.
UK Bounce Back Loans ("BBLs")
As previously reported, we have been working closely with Barclays Bank Plc and also assisted in the reporting to the British Business Bank, in designing an effective way to recover loans made under the UK Government's Bounce Back Loan initiative. This initiative provided around £47bn of Government guaranteed loans to c. 1.6 million UK businesses in the early months of the Covid-19 pandemic in 2020. Most loans were for £50k to UK SMEs. While the majority of these loans were used for proper business purposes, a significant minority of loans were misappropriated by the owner-managers of those businesses ("misappropriated BBLs"). Those misappropriated BBLs have not been repaid, at a potentially significant cost to the UK taxpayer.
Having recovered minimal amounts using other traditional debt recovery methods, towards the end of 2022, Barclays initiated a pilot scheme of 119 misappropriated BBLs, putting those companies into a Compulsory Liquidation process. Some Directors of those target companies did settle directly with Barclays at the start of this process but the large majority were put into compulsory liquidation. In FY23, 48 of these cases were assigned to Manolete (starting in January 2023) and a further 20 have been assigned to the Company in FY24 as at 31 May 2023. The returns from the Manolete cases have been outstanding and often achieved within a matter of a few weeks, with almost all settlements (8 cases have closed at 31 May 2023) with Directors at the full value of the BBL.
The Company has commenced discussions with a number of other financial institutions with the possibility that they may follow with their own pilot schemes. Others are likely to wait until the full, or a larger number of, outcomes can be seen from the Barclays pilot. Manolete has retained the services of Lord Agnew, Minister of State at the Cabinet Office and Her Majesty's Treasury from 2020 to 2022 with responsibility for counter fraud, to advise the Company on its strategy in this area.
Investment Returns
Our investment track record, by vintage, continues to demonstrate outstanding results. All vintages, up to and including FY19, have been completed. FY20 cases are now 91% complete, FY21 80% complete and well over half of the FY22 cases are legally completed. Manolete's model is characterised by short case durations, high ROIs (Return on Investment), exceptional Money Multiples and IRRs. The Company calculates case duration from the date we sign the investment agreement to the date the case is legally concluded. On average, cash collection takes around 12.8 months after legal completion.
|
Case |
No. of |
No. |
% |
No |
Open case investments |
Closed case investments |
Total |
Total |
Total |
IP |
Manolete |
Duration completed cases |
ROI |
MoM |
IRR |
|
|
Vintage |
No |
No |
% total |
No |
£'000 |
£'000 |
£'000 |
£'000 |
£'000 |
£'000 |
£'000 |
Months |
% |
% |
% |
|
|
2010 |
3 |
3 |
100% |
0 |
0 |
52 |
52 |
28 |
(24) |
10 |
(34) |
7.0m |
(65%) |
.3x |
0% |
|
|
2011 |
0 |
0 |
- |
0 |
0 |
0 |
0 |
0 |
0 |
0 |
0 |
0.0m |
0% |
.0x |
0% |
|
|
2012 |
8 |
8 |
100% |
0 |
0 |
763 |
763 |
2,524 |
1,761 |
580 |
1,181 |
18.0m |
155% |
2.5x |
258% |
|
|
2013 |
10 |
10 |
100% |
0 |
0 |
174 |
174 |
780 |
606 |
316 |
290 |
7.1m |
166% |
2.7x |
147% |
|
|
2014 |
42 |
42 |
100% |
0 |
0 |
594 |
594 |
3,884 |
3,290 |
2,427 |
863 |
10.0m |
145% |
2.5x |
455% |
|
|
2015 |
39 |
39 |
100% |
0 |
0 |
1,404 |
1,404 |
7,029 |
5,625 |
3,290 |
2,335 |
12.8m |
166% |
2.7x |
502% |
|
|
2016 |
36 |
36 |
100% |
0 |
0 |
1,936 |
1,936 |
9,393 |
7,457 |
4,164 |
3,293 |
15.0m |
170% |
2.7x |
180% |
|
|
2017 |
31 |
31 |
100% |
0 |
0 |
1,446 |
1,446 |
4,469 |
3,023 |
1,905 |
1,118 |
14.1m |
77% |
1.8x |
462% |
|
|
2018 |
29 |
29 |
100% |
0 |
0 |
3,960 |
3,960 |
23,714 |
19,754 |
12,972 |
6,782 |
16.9m |
171% |
2.7x |
70% |
|
|
2019 |
59 |
59 |
100% |
0 |
0 |
2,737 |
2,737 |
14,855 |
12,118 |
7,530 |
4,588 |
17.4m |
168% |
2.7x |
99% |
|
|
2020 |
141 |
129 |
91% |
12 |
1,010 |
6,279 |
7,289 |
16,737 |
10,458 |
6,599 |
3,859 |
16.1m |
61% |
1.6x |
98% |
|
|
2021 |
198 |
158 |
80% |
40 |
1,470 |
6,900 |
8,370 |
22,540 |
15,640 |
8,367 |
7,273 |
12.9m |
105% |
2.1x |
142% |
|
|
2022 |
159 |
101 |
64% |
58 |
1,523 |
1,793 |
3,316 |
6,788 |
4,995 |
2,356 |
2,639 |
9.0m |
147% |
2.5x |
321% |
|
|
2023 |
263 |
44 |
17% |
219 |
1,556 |
555 |
2,111 |
3,366 |
2,810 |
1,397 |
1,413 |
4.1m |
254% |
3.5x |
6288% |
|
|
Total (exc. Cartel cases) |
1,018 |
689 |
67.7% |
329 |
5,560 |
28,593 |
34,151 |
116,106 |
87,513 |
51,913 |
35,600 |
12.8m |
125% |
2.2x |
131% |
(i) The vintages table excludes 22 cartel cases and is net of deductions for bad debt provisions (excluding ECL provisions).
(ii) Ongoing cases includes partial realisations.
(iii) The large case completion in FY21 is presented net of discounting.
(iv) IRR's are presented for vintages where there are 12 or more months of historical cashflow information.
Note: Vintage table above is unaudited
The more mature vintages of FY18, FY19, FY20 and FY21 all have total case recoveries of well over £10m per year and IRRs ranging from 70% to 142%. Recoveries for cases that commenced in FY22 total £6.8m with an IRR of 321%.
Industry Recognition
During the year, the Company was named, for the second time, as the only company in the insolvency litigation funding section to be ranked in Band 1 of the legal industry's prestigious Chambers Guide. The Band 1 ranking is a great testament to the tremendous work of all the Company's employees.
Current Trading
FY24 has started very well, in the same vein as H2 FY23. It is noticeable that the headline claim values of new case enquiries coming into the Company are starting to increase, as the challenges in the UK economy spread from SMEs to larger enterprises. We have recently added to both our in-house legal team and our Net Worth Report team, to address the increased demand we are seeing across all regions.
People and Stakeholders
I am hugely indebted to our outstanding staff. The multiple awards we have received in the Insolvency, Legal and Financial sectors are a direct reflection of their excellence. The in-house Legal and Net Worth teams have been skilfully built-out by Mena Halton. Reflecting her important role in running these teams day-to-day, which constitute the core engine of the Company, Mena was appointed to the Board as Managing Director in June 2022.
Our professional relationships, built over the last 13 years, with hundreds of Insolvency Practitioners, expert external insolvency solicitors and barristers, R3, the Insolvency Practitioners Association, the ICAEW, the Insolvency Service and HMRC are fundamental to the success and growth of the Company. These were pivotal to us achieving the tremendous milestone of 1,000 lifetime signed UK insolvency cases in February of this year. Although there is still much to do.
Steven Cooklin
Chief Executive Officer
21 June 2023
CFO's Statement I am pleased to give my review of the Company's audited results for the year to 31 March 2023..|
Financial overview: |
31 March 2023 |
31 March 2022 |
YoY |
|
|
Financial KPIs |
£000s |
£000s |
% |
|
|
Revenue |
20,753 |
20,443 |
2% |
|
|
Gross profit |
3,672 |
10,381 |
(65%) |
|
|
Gross margin % |
17.7% |
50.8% |
||
|
EBIT |
(3,121) |
5,304 |
(159%) |
|
|
EBIT % |
(15%) |
26% |
||
|
(Loss)/Profit after tax |
(3,124) |
3,678 |
(185%) |
|
|
Investment valuation |
36,462 |
45,718 |
(20%) |
|
|
Non-financial KPIs |
||||
|
New cases |
263 |
159 |
||
|
Completed cases* |
193 |
139 |
||
|
Live cases at year end** |
351 |
272 |
*including 9 partially completed cases (7 partial completions FY22)
**including 22 cartel cases and 42 BBL cases in FY23 (22 cartel cases and zero BBL cases in FY22)
|
Revenue |
31 March 2023 |
31 March 2022 |
||
|
£000s |
% |
£000s |
% |
|
|
Realised revenue |
26,790 |
129 |
15,243 |
75 |
|
Unrealised revenue |
(6,037) |
(29) |
5,200 |
25 |
|
Revenue |
20,753 |
20,443 |
|
31 March 2023 |
31 March 2022 |
YOY |
||
|
£000s |
£000s |
% |
||
|
Realised Gross Profit |
9,798 |
5,182 |
89 |
|
|
Realised Gross Margin |
36.2% |
34.0% |
Revenues can be classified into realised revenue (actual completions) of £26.8m in FY23 (FY22: £15.2m) and unrealised revenue (valuations of new and live cases) £(6.0)m FY23 (FY22: £5.2m).
Realised revenue increased by 76% to £26.8m (FY22: £15.2m) mainly driven by the significant increase in the number of case completions in FY23 which included a single significant case completion contributing revenue of £4.9m itself. The Company recorded a record number of case completions in FY23 of 193 (FY22: 139).
Unrealised revenue of £(6.0)m FY23 (FY22: £5.2m) was partly a result of write down of fair values of live cases during the first half of the year, as reported at our Interim Results for September 2022 as well as the high level of completions which are removed from unrealised and recorded as realised revenue. The write down in fair value of cases was a one-off exercise that reflected the harsher economic climate and resulting likely outcomes of cases.
For comparison purposes, it should be noted that the prior year, unrealised revenue included a £5.1m uplift in the cartel valuation whilst in FY23 there was only an uplift of £1.2m.
Gross profit H1 v H2
|
30 September 2022 - H1 |
31 March 2023 - H2 |
Total FY23 |
||
|
£000s |
£000s |
£000s |
||
|
Realised revenue |
13,596 |
13,194 |
26,790 |
|
|
Unrealised revenue |
(8,082) |
2,045 |
(6,037) |
|
|
Total revenue |
5,514 |
15,239 |
20,753 |
|
|
Other costs, including office costs |
(7,701) |
(9,380) |
(17,081) |
|
|
Gross profit |
(2,187) |
5,859 |
3.672 |
|
|
Non-financial KPIs |
||||
|
New cases |
83 |
180 |
263 |
|
|
Completed cases* |
95 |
98 |
193 |
|
|
Live cases at end of period** |
264 |
351 |
351 |
*including 9 partially completed cases (7 partial completions FY22)
**including 22 cartel cases and 42 BBL cases in FY23 (22 cartel cases and zero BBL cases in FY22)
Revenue of £20.8m FY23 represented growth of 2% year on year whilst gross profit decreased by 65% to £3.7m (FY22 £10.4m). To understand the FY23 results, it is necessary both to review the difference in H2 v H1 performance, as growth in case numbers increased in H2 FY23 and to acknowledge the impact of a single large case, which was lost at trial.
There was a significant upturn in volumes and financial performance in H2 FY23 as compared to H1 FY23. A gross profit of £5.9m was recorded in H2 FY23 compared to a loss of (£2.2m) in H1 FY23.
In H1 FY23 lower volumes of new cases as a result of the drag effect of the covid restrictions continued to impact the business. However this was no longer the case in H2 FY23 when higher insolvencies across the economy resulted in higher new case numbers reaching the business.
Impact of single large case lost at trial
Very few cases proceed to trial each year and in FY23, a large case was found against us and our appeal was dismissed. This result had the following impact on our trading results in FY23 (of which £2.3m was taken to the Statement of comprehensive income in H1 and £0.5m in H2).
|
£000s |
|
|
Initial consideration |
(75) |
|
Legal costs |
(915) |
|
Fair value write down |
(1,800) |
|
Total |
(2,790) |
Whilst from time to time, we will lose cases at trial, we do not expect such a large case loss to be repeated. If we add back the large case lost at trial, see below for proforma results.
|
Impact on financials |
31 March 2023 Reported |
31 March 2023 Adjusted |
||||
|
£000s |
£000s |
|||||
|
Revenue |
20,753 |
22,553 |
||||
|
Gross profit |
3,672 |
6,462 |
||||
|
Gross margin |
17.7% |
28.7% |
||||
|
EBIT |
(3,121) |
(331) |
||||
|
Administrative expenses |
31 March 2023 |
31 March 2022 |
YoY growth |
|||
|
£000s |
£000s |
% |
||||
|
Wages and salaries |
3,737 |
3,519 |
6% |
|||
|
Bad debt expense |
1,534 |
321 |
378% |
|||
|
Professional fees |
512 |
479 |
7% |
|||
|
Marketing |
344 |
222 |
55% |
|||
|
Other costs, including office costs |
666 |
536 |
24% |
|||
|
Administrative costs |
6,793 |
5,077 |
34% |
|||
Administrative expenses increased by 34% to £6.8m in FY23 (FY22: £5.0m). The increase in administration expenses was primarily a result of an increase in bad debt expense to £1.5m (FY22: £0.3m) following a thorough review of receivables given the current economic environment. The bad debt expense primarily relates to a small number of debtors who have either entered into bankruptcy or whose assets have been hidden overseas as well as an increase in the ECL provision.
Salaries increased by 6% per annum consistent with annual salary reviews. Professional fee expenses of £0.5m (FY22: £0.5m) have been well managed and consist of mostly recurring items such as audit, tax and PR services.
Marketing costs of £0.3m (FY22: £0.2m) have increased since FY22 as expected following an increase in business development activities as Covid-19 restrictions have been removed. Other costs have increased due to a short-term lease on our London offices which had previously been accounted for as a Right of Use asset under IFRS 16.
Operating loss (Earnings Before Interest and Tax)
The Company reported an operating loss of £(3.1)m in comparison to an operating profit of £5.3m in FY22, a decrease of 159%.
Finance costs
The Company extended the length of its debt facility with HSBC in July 2022 from 1 July 2024 to 1 July 2025 to facilitate the expected growth of its case load in the future. The Company pays a 0.7% commitment fee on any unused facility with HSBC. As at 31 March 2023, £10.5m of the £25m HSBC facility has been drawn down (FY22: £13.5m).
The Company also entered into an amended loan agreement in March 2023 with more lenient covenant tests for the following three quarter ends, which would allow the period of losses in H1 FY23 to be excluded from the leverage covenant calculation (which includes a 12 months look-back in its EBTIDA figure).
BBL pilot
As at 31st March 2023, the Company has signed 48 Bounce back loan cases (BBLs), of which 6 have already completed. The 42 live BBL cases have had a positive impact on the Profit and loss account via valuation of £495k and the six completed BBL cases have contributed a realised gross profit to the Company of £108k in FY23 (after deduction of initial purchase cost and external cost and profit share) i.e. an average profit per BBL case for Manolete of £18k.
Loss after tax
Loss after tax of (£3.1m) was recorded in FY23 (FY22: £3.7m profit). The post-tax margin has decreased from 18% to (15)%.
Earnings per share
As disclosed in Note 12, earnings per share decreased by 188% from 8.0 pence to (7.0) pence.
Balance sheet restatement
During the year we restated the contract asset / liability that related to the large case settlement that completed in FY21. Following a review of the contractual terms of the contract asset and liability, the directors concluded that these balances should have been presented as long term. The adjustments to the Statement of Financial Position as at 31 March 2021 and 31 March 2022 are shown in Note 30.
Balance sheet - Investment in Cases
The Company was managing 351 live case investments as at 31 March 2023, compared to 272 live cases as at 31 March 2022, a net increase of 79 cases, or 29%. The total investment in cases amounted to £36.5m as at 31 March 2023 a decrease of 20% (FY22: £45.7m). This reduction in Investment value of cases was due to a one-off exercise in H1 FY23 to reduce the valuation of open cases to reflect the economic realities of settlements being reached as well as a number of larger cases settling during the year. The valuation includes the investment in the cartel cases as at 31 March 2023 of £13.4m, an increase of £1.2m from £12.2m in FY22. Investment in cases is shown at fair value, based on the Company's estimate of the likely future realised gross profit, plus costs incurred.
Management, following discussion on a case-by-case basis with the in-house legal team, amend valuations of cases each month end to accurately reflect management's view of fair value. In addition, at the interim and final reporting periods, a sample of material valuations are corroborated with the external lawyers working on the case, who provide updated legal opinions as to the current status of the case. The Company does not capitalise any of its internal costs, such as salaries, these are fully expensed to the Statement of Comprehensive Income as incurred.
|
Cashflow |
31 March 2023 |
31 March 2022 |
|
£000s |
£000s |
|
|
Gross cash receipts |
26,708 |
15,549 |
|
IP share & legal costs on completed cases |
(13,608) |
(6,632) |
|
Cashflows from completed cases |
13,100 |
8,917 |
|
Overheads |
(5,092) |
(4,499) |
|
Net cash generated from operations before investment in cases and corporation tax |
8,008 |
4,418 |
|
Corporation tax |
(354) |
(833) |
|
Net cash generated from operations after corporation tax and before investment in new cases |
7,654 |
3,585 |
|
Investment in cases |
(5,806) |
(6,470) |
|
Net cash generated from/(used in) operations |
1,848 |
(2,885) |
|
% growth in case cash investments |
(13%) |
10% |
Gross cash receipts
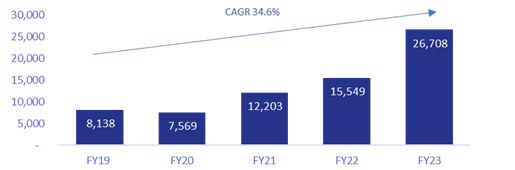
Gross cash receipts increased strongly year on year, to £26.7m in FY23 (FY22: £15.5m) by 72% and importantly, cash generated from operations before investment in cases and corporation tax has increased from a cash inflow of £4.4m in FY22 to a cash inflow of £8.0m in FY23 which has been partly reinvested in the portfolio and partly utilised for repayment of debt balances. Furthermore, net cash generated prior to investment in cases (new and existing) was £7.7m FY23 compared to £3.6m FY22. The increase in cash generation at this level demonstrates the business has become self-funding in case investments. Cash receipts are being generated both from payment schedules of prior year completions as well as from current year case completions.
The graph below shows the growth in gross cash generation (including both IP share and Manolete share of cash receipts) year on year. As the business matures, its ability to generate cash and ultimately be self-funding is a key characteristic.
Overheads & Corporation Tax
Excluding non-cash items (including bad debt expense), spending incurred on overheads has increased from £4.5m FY22 to £5.1m FY23 principally as result of an increase in headcount, annual salary increases and bonuses.
As corporation tax is paid on unrealised as well as realised profits, the Company effectively pre-pays an element of its corporation tax liability. In FY23, the Company generated unrealised losses of £(6.0)m (FY22: £5.2m) which has helped contribute to the year end tax receivable position.
Investment in cases
We have continued to invest in existing and new cases with total capital of £5.8m deployed during FY23 compared with £6.5m in FY22 which has been funded through cash receipts from completed cases.
Working Capital
Absorption of £5.9m into working capital during FY23 is primarily due to increased trade receivables, itself a factor of increased realised revenues. This increase in net trade receivables will generate cash in FY24 and beyond. Debtor days on a countback basis stayed static at 335 in FY23 (FY22: 335).
|
31 March 2023 |
31 March 2022 |
||
|
Net working capital |
£000s |
£000s |
|
|
Net working capital |
16,115 |
10,158 |
|
|
Change in net working capital |
(5,957) |
(1,950) |
|
|
DSO (Days sales outstanding) basic |
365 |
507 |
|
|
DSO countback |
335 |
335 |
Debt Financing
The Company has drawn down £10.5m (FY22: £13.5m) of its £25m HSBC loan facility and has continued to deploy loan capital during the year to finance investment in cases. Hence a repayment of £3.0m in the HSBC loan compared to 31 March 2022. The Company held cash reserves of £0.6m as at 31 March 2023 which are available to deploy on new case investment.
The Company agreed a waiver with HSBC in respect of the leverage covenant for the quarters ending 30 June 2022, 30 September 2022 and 31 December 2022 as losses incurred in H1 FY23 were resulting in a breach of the leverage covenant. Following this event, the Company has agreed an amendment to the loan agreement with a revised leverage covenant for the three quarters ending 31 March 2023, 30 June 2023 and 30 September 2023 to avoid any short-term breach of the leverage covenant due to the count back nature of the calculation (calculation amended to exclude the period of EBIT losses in H1).
Mark Tavener
Chief Financial Officer
21 June 2023
Strategic Report
The Directors present their strategic report for the year ended 31 March 2023.
Strategy and Business Model
The Company's strategy for growth and its business model are described in detail on the Company's website, www.manolete-partners.com and at the start of this report.
On pages 25 to 26, we have set out the principal risks which may present challenges in executing the business model and delivering the strategy.
As the UK Government's extraordinary temporary measures to materially reduce the number of insolvencies and bankruptcies during the Covid-19 pandemic were concluded at the end of the prior financial year, elements of the financial statements for the year ended 31 March 2023 represent a satisfactory out-turn for the business. Year-on-year revenues increased by 2%, driven by an increase in realised revenues offset by a decrease in unrealised revenue (see table below). Operating profits declined by 159% to an operating loss of (£3.1m) and net assets decreased 8% to £39.2m. The loss is largely attributable to the first half of FY23 (EBIT loss of £5,3m for H1 FY23), whereas the business rebounded strongly in H2 FY23 with a positive EBIT contribution of £2.2m.
The number of employees was 25 (FY22: 22) at the end of the financial year. As demand has increased significantly for our UK insolvency litigation financing products over the last six months and is likely to remain so, we are selectively adding to our expert in-house legal and Net Worth Report teams. Despite recruitment challenges in some areas of the UK, the Company is not experiencing any problems attracting new recruits.
The business has grown significantly following the difficult trading conditions of the previous two years. At the financial year-end the cumulative number of signed litigation investments has grown to 1,040 cases, with a record 351 live, in-progress cases at as 31 March 2023.
|
Year Ended 31 March 2023 |
Year Ended 31 March 2022 |
% change |
||
|
Financial KPIs |
£000s |
£000s |
||
|
Realised revenue |
26,790 |
15,243 |
76% |
|
|
Unrealised revenue |
(6,037) |
5,200 |
(216%) |
|
|
Total revenue |
20,753 |
20,443 |
2% |
|
|
Gross profit |
3,672 |
10,381 |
(65%) |
|
|
Operating (loss)/profit |
(3,121) |
5,304 |
(159%) |
|
|
(Loss)/profit after tax |
(3,124) |
3,678 |
(185%) |
|
|
Value of investments |
36,462 |
45,718 |
(20%) |
|
|
Non-financial KPIs |
||||
|
Number of lifetime signed litigation investments |
1,040 |
777 |
34% |
|
|
Live cases at end of reporting period |
351 |
272 |
29% |
|
|
New cases |
263 |
159 |
65% |
|
|
Completed cases |
193 |
139 |
39% |
The movements in key performance indicators is analysed in the Report of the Chief Executive Officer on pages 12 to 16 and the Report of the Chief Financial Officer on pages 17 to 22.
Outlook and Current Trading
We are confident we have invested in a portfolio of cases that will produce attractive returns for the Company. The Government measures to suppress UK insolvencies have now ended as have the wider UK economic support measures, which give us confidence in our future prospects. Many respected market commentators are predicting a sustained period of elevated insolvency figures in the UK.
The Board has considered the Going Concern status of the business both in relation to Covid-19 and the general wider economic environment and has concluded that it is appropriate for the accounts to be prepared on a going concern basis. The £25m RCF plus £10m accordion on attractive terms with HSBC provides the Company with substantial finance going forward. Further detail on the board's consideration of going concern is included on page 53.
We believe the business is very well-positioned to consolidate its leading position in the insolvency litigation financing market. Since the start of the 2023 calendar year, the Company has added additional members to its in-house legal team, in anticipation of continuing increase in the level of new case enquiries.
The Company has made a good start to FY24 and we look forward to a promising future.
On behalf of the Board:
Steven Cooklin
Chief Executive Officer
21 June 2023
Statement of Comprehensive Income
|
31 March 2023 |
31 March 2022 |
|||
|
Note |
£'000s |
£'000s |
||
|
Revenue |
4 |
20,753 |
20,443 |
|
|
Cost of sales |
(17,081) |
(10,062) |
||
|
Gross profit |
3,672 |
10,381 |
||
|
Administrative expenses |
8 |
(6,793) |
(5,077) |
|
|
Operating (loss)/profit |
6 |
(3,121) |
5,304 |
|
|
Finance income |
9 |
7 |
- |
|
|
Finance expense |
9 |
(839) |
(796) |
|
|
(Loss)/Profit before tax |
(3,953) |
4,508 |
||
|
Taxation |
11 |
829 |
(830) |
|
|
(Loss)/Profit and total comprehensive income for the year attributable to the equity owners of the company |
(3,124) |
3,678 |
||
|
Earnings per share |
||||
|
Basic (pence per share) |
12 |
(£0.07) |
£0.08 |
|
|
Diluted (pence per share) |
12 |
(£0.07) |
£0.08 |
The above results were derived from continuing operations.
The notes at the end of this announcement form part of these financial statements.
Statement of financial position
|
Company Number: 07660874 |
31 March 2023 |
31 March 2022 - restated |
||
|
Note |
£'000s |
£'000s |
||
|
Non-current assets |
||||
|
Investments |
13 |
13,389 |
12,198 |
|
|
Intangible assets |
14 |
- |
13 |
|
|
Trade and other receivables |
16 |
12,315 |
12,331 |
|
|
Deferred tax asset |
19 |
267 |
95 |
|
|
Right-of-use asset |
15 |
- |
86 |
|
|
Total non-current assets |
25,971 |
24,723 |
||
|
Current assets |
||||
|
Investments |
13 |
23,073 |
33,520 |
|
|
Trade and other receivables |
16 |
12,063 |
7,944 |
|
|
Corporation tax receivable |
11 |
735 |
- |
|
|
Cash and cash equivalents |
17 |
636 |
2,256 |
|
|
Total current assets |
36,507 |
43,720 |
||
|
Total assets |
62,478 |
68,443 |
||
|
EQUITY AND LIABILITIES |
||||
|
Equity |
||||
|
Share capital |
21 |
175 |
175 |
|
|
Share premium |
22 |
157 |
142 |
|
|
Share based payment reserve |
22 |
699 |
429 |
|
|
Special reserve |
22 |
- |
5 |
|
|
Retained earnings |
22 |
38,130 |
41,468 |
|
|
Total equity attributable to the equity owners of the company |
39,161 |
42,219 |
||
|
Non-current liabilities |
||||
|
Trade and other payables |
18 |
7,393 |
7,699 |
|
|
Borrowings |
20 |
10,381 |
13,285 |
|
|
Total non-current liabilities |
17,774 |
20,984 |
||
|
Current liabilities |
||||
|
Trade and other payables |
18 |
5,543 |
4,748 |
|
|
Current tax liabilities |
11 |
- |
396 |
|
|
Lease liability |
15/20 |
- |
96 |
|
|
Total current liabilities |
5,543 |
5,240 |
||
|
Total liabilities |
23,317 |
26,224 |
||
|
Total equity and liabilities |
62,478 |
68,443 |
The notes at the end of this announcement form part of these financial statements.
The financial statements were approved by the Board of Directors and authorised for issue on 21 June 2023.
Steven Cooklin
Chief Executive Officer
Statement of Changes in Equity
|
Share Capital |
Share Premium |
Share based reserve |
Special reserve |
Retained Earnings |
Total Equity* |
|
|
£'000s |
£'000s |
£'000s |
£'000s |
£'000s |
£'000s |
|
|
As at 1 April 2021 |
174 |
4 |
349 |
178 |
38,223 |
38,928 |
|
Comprehensive income |
||||||
|
Profit for the year |
- |
- |
- |
- |
3,678 |
3,678 |
|
Transactions with owners |
||||||
|
Dividends |
- |
- |
- |
- |
(606) |
(606) |
|
Transfer in relation to creditors paid |
- |
- |
- |
(173) |
173 |
- |
|
Share based payment expense |
- |
- |
169 |
- |
- |
169 |
|
Share options exercised |
1 |
138 |
(138) |
- |
- |
1 |
|
Deferred tax on share-based payments |
- |
- |
49 |
- |
- |
49 |
|
As at 31 March 2022 |
175 |
142 |
429 |
5 |
41,468 |
42,219 |
|
Comprehensive income |
||||||
|
Loss for the year |
- |
- |
- |
- |
(3,124) |
(3,124) |
|
Transactions with owners |
||||||
|
Dividends |
- |
- |
- |
- |
(219) |
(219) |
|
Transfer in relation to creditors paid |
- |
- |
- |
(5) |
5 |
- |
|
Share based payment expense |
- |
- |
150 |
- |
- |
150 |
|
Share options exercised |
- |
15 |
- |
- |
- |
15 |
|
Deferred tax on share-based payments |
- |
- |
120 |
- |
- |
120 |
|
As at 31 March 2023 |
175 |
157 |
699 |
- |
38,130 |
39,161 |
*attributable to the equity owners of the Company.
The notes at the end of this announcement form part of these financial statements.
Statement of Cash Flows
|
31 March 2023 |
31 March 2022 |
|||
|
Note |
£'000s |
£'000s |
||
|
(Loss)/profit before tax |
(3,953) |
4,508 |
||
|
Adjustments for other operating items: |
||||
|
Adjustments for non-cash items: |
26 |
15,554 |
(444) |
|
|
Operating cashflows before movements in working capital |
11,601 |
4,064 |
||
|
Changes in working capital: |
||||
|
Net increase in trade and other receivables |
(4,105) |
(1,926) |
||
|
Net increase in trade and other payables |
512 |
2,280 |
||
|
Net cash generated from operations before corporation tax and investments |
8,008 |
4,418 |
||
|
Corporation tax paid |
(353) |
(833) |
||
|
Investment in cases |
13 |
(5,806) |
(6,470) |
|
|
Net cash generated from/(used in) operating activities |
1,849 |
(2,885) |
||
|
Cash flows from investing activities |
||||
|
Finance income received |
9 |
7 |
- |
|
|
Net cash generated from investing activities |
7 |
- |
||
|
Cash flows from financing activities |
||||
|
(Repayments)/Proceeds from borrowings |
20 |
(3,000) |
5,500 |
|
|
Dividends paid |
10 |
(219) |
(606) |
|
|
Interest paid |
(160) |
(703) |
||
|
Repayment of lease liabilities |
15 |
(97) |
(194) |
|
|
Net cash (used in)/generated from financing activities |
(3,476) |
3,997 |
||
|
Net (decrease)/increase in cash and cash equivalents |
(1,620) |
1,112 |
||
|
Cash and cash equivalents at the beginning of the year |
2,256 |
1,144 |
||
|
Cash and cash equivalents at the end of the year |
636 |
2,256 |
||
The notes at the end of this announcement form part of these financial statements.
Notes forming part of the Financial Statements
1. Company information
Manolete Partners PLC (the "Company") is a public company limited by shares incorporated in England and Wales. The Company is domiciled in England and its registered office is 2-4 Packhorse Road, Gerrards Cross, Buckinghamshire, SL9 7QE. The Company's ordinary shares are traded on the AIM Market.
The principal activity of the Company is that of acquiring and funding insolvency litigation cases.
2. Summary of significant accounting policies
The principal accounting policies applied in the preparation of these financial statements are set out below. The policies have been consistently applied to all the years presented, unless otherwise stated.
2.1 Basis of preparation
The financial statements have been properly prepared in accordance with UK adopted International Accounting Standards and in conformity with the requirements of the Companies Act 2006. Under company law the directors must not approve the financial statements unless they are satisfied that they give a true and fair view of the state of affairs the Company and of the profit or loss of the Company for that period.
Measurement bases
The financial statements have been prepared under the historical cost convention. Historical cost is generally based on the fair value of the consideration given in exchange for assets.
The preparation of the financial statements in compliance with UK adopted International Accounting Standards requires the use of certain critical accounting estimates and management judgements in applying the accounting policies. The significant estimates and judgements that have been made and their effect is disclosed in note 3.
2.2 Going concern
Given current trading levels, in particular new cases volumes being signed with a steady flow of completions along with the general level of insolvencies in the economy as a whole, the Directors of the Company have a reasonable expectation that the Company has adequate resources to continue in operational existence for the foreseeable future and for at least one year from the date of the signed financial statements.
Management has updated its forecasts for the business with particular focus on the next 12 - 18 months and based on current trading levels and the existing HSBC debt financing, the Directors are of the opinion that the Company has adequate financial resources to continue in operation and meet its liabilities as they fall due, for the foreseeable future. In addition, more lenient covenants have been agreed with HSBC for the three quarters, 31 March 2023, 30 June 2023 and 30 September 2023. Hence, the Directors believe it is appropriate to adopt the going concern basis in preparing the financial statements.
For these reasons, they continue to adopt the going concern basis in preparing the Company's financial statements.
2.3 Functional and presentation currency
The financial information is presented in the functional currency, pounds sterling ("£") except where otherwise indicated.
2.4 New standards, amendments and interpretations
New and amended IFRS Standards that are effective for the current year:
· Amendments to IFRS 3 Reference to the Conceptual Framework Amendments to IAS 16 Property, Plant and Equipment-Proceeds before Intended Use
· Amendments to IAS 37 Onerous Contracts - Cost of Fulfilling a Contract Annual Improvements to IFRS Standards 2018-2020 Cycle
· Amendments to IFRS 1 First-time Adoption of International Financial Reporting Standards, IFRS 9 Financial Instruments, IFRS 16 Leases, and IAS 41 Agriculture
New and revised IFRS Standards in issue but not yet effective:
At the date of authorisation of these financial statements, the Group has not applied the following new and revised IFRS Standards that have been issued but are not yet effective:
· Amendments to IAS 12 Clarification of accounting for deferred tax on transactions
The directors do not expect that the adoption of the Standards listed above will have a material impact on the financial statements of the Group in future periods.
2.4 Revenue recognition
Revenue comprises two elements: the movement in fair value of investments and realised consideration.
Realised consideration occurs when a case is settled or a Court judgement received. This is an agreed upon and documented figure.
The movement in the fair value of investments is recognised as unrealised gains within revenue. This is Management's assessment of the increase or decrease in valuation of an open case, the inclusion of value for a new case and the removal of the fair value of a completed case. These valuations are estimated following the progress of a case towards completion and also reflect the judgement of the legal team working on the case (see Note 3. Significant Judgements and Estimates). Hence, unrealised revenue is the movement in the fair value of the investments in open cases over a period of time.
When a case is completed the carrying value is a deduction to unrealised income and the actual settlement value is recorded as realised revenue.
Revenue recognition differs between a purchased case, where full recognition of the settlement is recognised as revenue (including the insolvent estate's share) and a funded case where only the company's share of a settlement is recognised as revenue. This differing treatment arises because the Company owns the rights to the purchased case.
As revenue relates entirely to financing arrangements, revenue is recognised under the classification and measurement provisions of IFRS 9.
2.5 Finance expense and income
Finance expense
Finance expense comprises interest on bank loans and other interest payable. Interest on bank loans and other interest is charged to the Statement of Comprehensive Income over the term of the debt using the effective interest rate method so that the amount charged is at a constant rate on the carrying amount. Issue costs are initially recognised as a reduction in the proceeds of the associated capital instrument.
Finance income
Finance income comprises interest receivable on funds invested and other interest receivable. Interest income is recognised in profit or loss as it accrues using the effective interest method.
2.6 Employee benefits: Pension obligations
The Company operates a defined contribution plan. A defined contribution plan is a pension plan under which the Company pays fixed contributions into a separate entity. The Company has no legal or constructive obligations to pay further contributions if the fund does not hold sufficient assets to pay all employees the benefits relating to employee service in the current and prior periods.
The Company has no further payment obligations once the contributions have been paid. The contributions are recognised as employee benefit expense when they are due. Prepaid contributions are recognised as an asset to the extent that a cash refund or a reduction in the future payments is available.
2.7 Intangible assets
Intangible assets are measured at cost and are amortised on a straight-line basis over their estimated finite useful lives. Amortisation is charged within administrative expenses in the Statement of Comprehensive Income so as to write off the cost of assets over their estimated useful lives, on the following basis:
Website development costs: 33.3% of cost.
2.8 Financial assets
Classification
The Company classifies its financial assets at amortised cost or fair value through profit or loss. Financial assets do not comprise prepayments. Management determines the classification of its financial assets at initial recognition.
Financial assets at amortised cost
The Company's financial assets held at amortised cost comprise trade and other receivables and cash in the Statement of Financial Position.
These assets are non-derivative financial assets with fixed or determinable payments that are not quoted in an active market. They arise principally through the provision of goods and services to customers (e.g. trade receivables), but also incorporate other types of contractual monetary assets. They are initially recognised at fair value plus transaction costs that are directly attributable to their acquisition or issue and are subsequently carried at amortised cost using the effective interest method, less provision for impairment.
Impairment of financial assets
Impairment provisions are recognised when there is objective evidence (such as significant financial difficulties on the part of the counterparty or default or significant delay in payment) that the Company will be unable to collect all of the amounts due under the terms receivable, the amount of such a provision being the difference between the net carrying amount and the present value of the future expected cash flows associated with the impaired asset.
Impairment provisions for trade receivables are recognised specifically against receivables where Management have identified default or delays to payment in addition to the simplified approach within IFRS 9 using lifetime expected credit losses. The Company applies the simplified approach in providing for expected credit losses under IFRS 9 which allows the use of the lifetime expected credit loss provision for all trade receivables. In measuring the expected credit losses, trade receivables have been stratified by settlement type and days past due. Expected lifetime credit loss rates are based on payment profiles of completed cases from January 2019 (post IPO). For trade receivables which are reported net, such provisions are recorded in a separate provision account with the loss being recognised within administrative expenses in the Statement of Comprehensive Income. On confirmation that the trade receivables will not be collectable, the gross carrying value of the asset is written off against the associated provision.
Investments
Investments in cases are categorised at fair value through profit or loss. Fair values are determined on the specifics of each investment and will typically change upon an investment progressing through a key stage in the litigation or arbitration process in a manner that, in the Directors' opinion, would result in a third party being prepared to pay an amount different to the original sum invested for the Company's rights in connection with the investment. Positive material progression of an investment will give rise to an increase in fair value and an adverse progression a decrease. Management identifies and selects a number of material case valuations for external opinion. As such at any year-end, the valuation of a sample of material investments was underpinned by an external legal opinion, which supports the Directors' valuation.
Valuation of investments
Determining the value of purchased and funded litigation requires an estimation of the value of such assets upon acquisition and at each reporting date. The future income generation of such litigation is estimated from known information and the opinion of external senior specialist counsel and solicitors. Valuations of each case, at the balance sheet date, are therefore arrived at by the Directors, considering counsel's, or external lawyer's, assessment of the chances of a successful outcome, the state of progress of the matter through the legal system and the Directors' assessment of all other risks specific to the case.
Contract assets are initially recognised in respect of earned interest revenue earned on completed cases but where the settlement will be paid to the Company over a significant period of time (i.e there is a significant financing component implicit in the transaction).
2.10 Financial liabilities
The Company classifies its financial liabilities in the category of financial liabilities at amortised cost. All financial liabilities are recognised in the statement of financial position when the Company becomes a party to the contractual provision of the instrument. Trade and other payables and borrowings are included in this category.
Borrowings
Borrowings are recognised initially at fair value, net of transaction costs incurred. Borrowings are subsequently carried at amortised cost; any difference between the proceeds (net of transaction costs) and the redemption value is recognised in the income statement over the period of the borrowings using the effective interest method.
Borrowings are de-recognised from the balance sheet when the obligation specified in the contract is discharged, is cancelled or expires. The difference between the carrying amount of a financial liability that has been extinguished or transferred to another party and the consideration paid, including any non-cash assets transferred or liabilities assumed, is recognised in profit or loss as other operating income or finance costs.
Borrowings are classified as current liabilities unless the Company has an unconditional right to defer settlement of the liability for at least 12 months after the reporting period.
Whilst the original arrangement fees in relation to a £25m loan facility with HSBC set up in June 2021 were capitalised and amortised over the length of the agreement, initially 3 years. Fees in relation to an amendment of the loan agreement in March 2023 were expensed to the Statement of Comprehensive Income in FY23.
These capitalised costs of £119,426 as at 31 March 2023 (31 March 2022: £215,959) have been netted off against borrowings in the Statement of Financial Position. Amendment fees of £62,500 were expensed to the Statement of Comprehensive Income in March 2023.
Trade and other payables
Trade and other payables are initially recognised at fair value and subsequently measured at amortised cost. Accounts payable are classified as current liabilities if payment is due within one year or less. If not, they are presented as non-current liabilities.
Lease liabilities
A lease liability is recognised at the commencement date of a lease. The lease liability is initially recognised at the present value of the lease payments to be made over the term of the lease, discounted using the interest rate implicit in the lease or, if that rate cannot be readily determined, the Company's incremental borrowing rate. Lease payments comprise of fixed payments less any lease incentives received.
Lease liabilities are measured at amortised cost using the effective interest method. The carrying amounts are remeasured if there is a change in the following: future lease payments arising from a change in an index or a rate used; residual guarantee; lease term; certainty of a purchase option and termination penalties. When a lease liability is remeasured, an adjustment is made to the corresponding right-of use asset, or to profit or loss if the carrying amount of the right-of-use asset is fully written down.
Contract liabilities
Contract liabilities represent the Company's obligation to transfer goods or services to a customer and are recognised when a customer pays consideration, or when the Company recognises a receivable to reflect its unconditional right to consideration (whichever is earlier) before the consolidated entity has transferred the goods or services to the customer.
2.11 Provisions
A provision is recognised in the balance sheet when the Company has a present legal or constructive obligation as a result of a past event, and it is probable that an outflow of economic benefits will be required to settle the obligation. If the effect is material, provisions are determined by discounting the expected future cash flows at a pre-tax rate that reflects current market assessments of the time value of money and, when appropriate, the risks specific to the liability. The increase in the provision due to the passage of time is recognised in finance costs.
2.12 Share capital
Ordinary shares are classified as equity. There is one class of ordinary share in issue, as detailed in note 21. Incremental costs directly attributable to the issue of new shares are shown in share premium as a deduction from the proceeds, net of tax.
2.13 Income tax
Income tax for the years presented comprises current and deferred tax. Income tax is recognised in profit or loss except to the extent that it relates to items recognised directly in equity, in which case it is recognised in equity
Deferred income tax is recognised on temporary differences arising between the tax bases of assets and liabilities and their carrying amounts.
Temporary differences are not recognised if they arise from a) the initial recognition of goodwill, and b) for the initial recognition of other assets or liabilities in a transaction other than a business combination that at the time of the transaction affects neither accounting nor taxable profit or loss. The amount of deferred tax provided is based on the expected manner of realisation or settlement of the carrying amount of assets and liabilities, using tax rates enacted or substantively enacted at the balance sheet date.
Deferred income tax assets and liabilities are offset when there is a legally enforceable right to offset current tax assets against current tax liabilities and when the deferred income taxes assets and liabilities relate to income taxes levied by the same taxation authority on either the taxable entity or different taxable entities where there is an intention to settle the balances on a net basis.
2.14 Right-of-use-assets
A right-of-use asset is recognised at the commencement date of a lease. The right-of-use asset is measured at cost, which comprises the initial amount of the lease liability, adjusted for, as applicable, any lease payments made at or before the commencement date, net of any lease incentives received, any initial direct costs incurred, and, except where included in the cost of inventories, an estimate of costs expected to be incurred for dismantling and removing the underlying asset, and restoring the site or asset.
Right-of-use assets are depreciated on a straight-line basis over the unexpired period of the lease or the estimated useful life of the asset, whichever is the shorter. Right-of use assets are subject to impairment or adjusted for any remeasurement of lease liabilities. Depreciation is charged to administrative expenses in the Statement of Comprehensive Income.
2.15 Share-based payments
Equity-settled and cash-settled share-based compensation benefits are provided to employees.
Equity-settled transactions are awards of shares, or options over shares, that are provided to employees in exchange for the rendering of services.
The cost of equity-settled transactions are measured at fair value on grant date. Fair value is independently determined using the Black-Scholes option pricing model that takes into account the exercise price, the term of the option, the impact of dilution, the share price at grant date and expected price volatility of the underlying share, the expected dividend yield and the risk free interest rate for the term of the option, together with non-vesting conditions that do not determine whether the consolidated entity receives the services that entitle the employees to receive payment. No account is taken of any other vesting conditions.
The cost of equity-settled transactions are recognised as an expense with a corresponding increase in equity over the vesting period. The cumulative charge to profit or loss is calculated based on the grant date fair value of the award, the best estimate of the number of awards that are likely to vest and the expired portion of the vesting period. The amount recognised in profit or loss for the period is the cumulative amount calculated at each reporting date less amounts already recognised in previous periods.
2.16 Earnings per share
Basic earnings per share
Basic earnings per share is calculated by dividing the profit attributable to the owners of the Company, excluding any costs of servicing equity other than ordinary shares, by the weighted average number of ordinary shares outstanding during the financial year.
Diluted earnings per share
Diluted earnings per share adjusts the figures used in the determination of basic earnings per share to take into account the after income tax effect of interest and other financing costs associated with dilutive potential ordinary shares and the weighted average number of shares assumed to have been issued for no consideration in relation to dilutive potential ordinary shares.
2.17 Dividends
Dividends are recognised when declared during the financial year.
3. Significant judgements and estimates
The preparation of the Company's financial statements under UK adopted International Accounting Standards requires the directors to make estimates and assumptions that affect the reported amounts of assets and liabilities at the statement of financial position date, amounts reported for revenues and expenses during the year, and the disclosure of contingent liabilities, at the reporting date. However, uncertainty about these assumptions and estimates could result in outcomes that could require a material adjustment to the carrying amount of the assets or liability affected in the future.
Estimates and judgements are continually evaluated and are based on historical experiences and other factors, including expectations of future events that are believed to be reasonable under the circumstances.
The Company makes estimates and assumptions concerning the future. The resulting accounting estimates will, by definition, seldom equal the related actual results. The estimates and assumptions that have a significant risk of causing a material adjustment to the carrying amounts of assets and liabilities within the next financial year are detailed below.
Valuation of investments
Investments in cases are categorised as fair value through the Statement of Comprehensive Income. Fair values are determined on the specifics of each investment and will typically change upon an investment progressing through a key stage in the litigation or arbitration process in a manner that, in the directors' opinion, would result in a third party being prepared to pay an amount different to the original sum invested for the company's rights in connection with the investment. Due to the nature of Manolete's business model, an unrealised fair value gain will be recognised on initial investment in a case. Thereafter, positive material progression of an investment will give rise to an increase in fair value and an adverse progression a decrease.
The key stages that an individual case passes through typically includes: initial review on whether to make a purchase or funding offer, correspondence from the Company in-house lawyer, usually via externally retained solicitors, to the opposing party notifying them of the Company's assignment or funding of the claim, a fully particularised Letter Before Action and an invitation to without prejudice settlement meetings or mediation, if the opposing party does not respond then legal proceedings are issued. Further evidence may be gathered to support the claim. Eventually a court process may be entered into. The progress of a case feeds into the Director's valuation of that case each month, as set out below.
In accordance with IFRS 9 and IFRS 13, the Company is required to recognise live case investments at fair value at the half year and year end reporting periods, at 30 September and 31 March each year.
The Company undertakes the following steps:
• On a weekly basis, the internal legal team report developments into the Investment Committee on a case-by-case basis in writing. Full reviews then take place on a monthly basis to review progress on all live cases, on a case-by-case basis.
• On a monthly basis, the directors adjust case fair values depending upon objective case developments, for instance: an offer to settle, mediation agreed, positive or negative legal advice. These adjustments to fair value may be an increase or decrease in value or no change required;
• At reporting period ends, a sample of open case investments for which written assessments are obtained from external solicitors or primary counsel working on the case on behalf of the Company.
In all cases, a headline valuation is the starting point of a valuation from which a discount is applied to reflect legal advice obtained, strength of defendant's case, the likely amount a defendant might be able to pay to settle the case, progress of the case through the legal process and settlement offers.
Movements in fair value on investments in cases are included within revenue in the Statement of Comprehensive Income. Fair value gains or losses are unrealised until a final outcome or stage is reached. At the year-end there were 351 open cases, of these 300 had a valuation of less than £100k. These cases are not expected to have an individually material impact on the business when they are settled. The remaining 51 cases make up £23.9m of the Investments and are material to the business, the significant judgements and estimates in their valuations at the balance sheet date were as follows:
1. Judgements:
1.1 The amount that cases are discounted to recognise cases being settled before they are taken to Court, based on the facts of each case and management's judgement of the likely outcome.
1.2 Litigation is inherently uncertain. The Company seeks to mitigate its risk by: rejecting the majority of cases referred to it because the merits of the claim are considered weak or the defendant is considered not to have sufficient net worth and seeking to settle cases as early as possible. Nevertheless, the risk and uncertainty can never be completely removed. The key inputs are: the headline claim value, the likely settlement value, the opposing party's ability to pay and the likely costs in achieving judgement. These inputs are inter-related to an extent.
1.3 Excluding the large case completion in FY21, the Company does not consider there to be any significant concentration risk within trade receivables.
1.4 The Company accrues for future legal costs on the basis that cases will be settled before trial which is how the vast majority of cases completed to date have been settled. When it becomes clear a case will progress all the way to trial then the additional costs are accrued at this point on a case-by-case basis.
2. Estimates:
2.1 All cases will be subject to the internal key stages and regular fair value review processes as described above. For the avoidance of doubt, the fair value review requires an estimate to be made by senior management based upon the facts and progress of the case and their experience. For a sample selected by Management and confirmed by the external auditors, an external opinion is requested from counsel or a solicitor who is working on the case which provides an independent description of the merits of the case.
These assessments include various assumptions that could change over time and lead to different assessments over the next 12 months.
2.2 Future legal costs have been estimated on the estimated time the case will take to complete, ranging between 3 to 24 months (excluding the Cartel cases) and whether it will go to Court. Future results could be materially impacted if these original estimates change either positively or negatively.
2.3 Recovery of debts is based on the Company's ability to recover assets owned by the counterparty. Prior to case acceptance, a net worth review of the defendant is undertaken to assess whether they own sufficient assets to support the claim value. Cases that are settled without going to Court typically recover in full, whilst those that result in Court cases are less predictable in terms of full recovery.
2.4 The valuations assume that there is no recovery for interest and costs. If cases go to Court and result in a judgement in the Company's favour, it is likely that the Company will be awarded interest and costs.
Sensitivity analysis has not been included in the financial statements, due to the vast amount of inputs and number of variables which are inherently specific to each case, making it impossible to provide meaningful data. Whilst the Board considers the methodologies and assumptions adopted in the valuation are supportable, reasonable and robust, because of the inherent uncertainty of valuation, it is reasonably possible, on the basis of existing knowledge, that outcomes within the next financial year that are different from the assumptions could require a material adjustment to the carrying amount of the £36.5m of investments disclosed in the balance sheet (Note 13). However, as an indication we note that a 10% increase/(decrease) in the fair value of our top 20 cases would result in an increase/(decrease) in the fair value investment of +/- £1.9m.
Approach to cartel case valuation:
Following publication of the ruling in respect of an EU Competition test case (the "BT / Royal Mail" case) we requested that our independent expert valuation firm apply the assumptions contained within the test case ruling to the valuation of Manolete's 22 cartel cases. Following the ruling and the receipt of further case data, the directors consider that additional discounting, or the use of a "tier based" system is no longer required and the year-end valuation therefore represents Manolete's percentage ownership of the overall case valuation. The cartel case carrying valuation of £13.4m, an increase of £1.2m from the prior year, is set out in Note 13 to the accounts.
Recoverability of trade receivables
The Company's business model involves the provision of services for credit. The Company normally receives payment for services it has provided once a claim has been pursued and settled or decided in Court. The average time from taking on a case to settlement is c.12.8 months although this can vary significantly from case to case. As part of the settlement agreement, the timing of payment of the award by the defendant to the Company is agreed and this is a legally binding document. Settlements can be received in full on the day of settlement or (at Management's discretion) paid in instalments over a defined settlement plan.
As such, Management applies a number of estimates and judgements in the recording of trade receivables, for example: in relation to default judgements Management assess the likely recoverability and do not necessarily recognise the full judgement.
The Company applies the simplified approach in providing for expected credit losses under IFRS 9 which allows the use of the lifetime expected credit loss provision for all trade receivables. In measuring the expected credit losses, trade receivables have been stratified by settlement type and days past due. Expected lifetime expected credit loss rates are based on the payment profiles of sales from January 2019 (post IPO). The Company attempts to assess the probability of credit losses but seeks to mitigate its credit risk by undertaking rigorous net worth checks before taking on a case. Occasionally credit defaults do occur when counterparties default on an agreed settlement payable by instalments. There is a concentration risk in relation to the trade receivable of £7.8m which relates to a large case completion in FY21. Repayments to date have been made according to the agreed schedule. Based on Management's assessment of the receivable no provision has been recognised against this balance.
Recovery of receivables is closely monitored by Management and action, where appropriate, will be taken to pursue any overdue payments. The Company seeks to obtain charging orders over the property of trade receivables as security where possible. The receivables' ageing analysis is also evaluated on a regular basis for potential doubtful debts. Where potential doubtful debts are identified specific bad debt provisions are held against these. It is the Directors' opinion that no further provision for doubtful debts is required. Please see note 16 of the accounts.
4. Segmental reporting
During the year ended 31 March 2023, revenue was derived from cases funded on behalf of the insolvent estate and cases purchased from the insolvent estate, which are wholly undertaken within the UK. Where cases are funded, upon conclusion, the Company has the right to its share of revenue; whereas for purchased cases, it has the right to receive all revenue, from which a payment to the insolvent estate is made. Revenues arising from funded cases and purchased cases are considered one business segment and are considered to be the one principal activity of the Company. All revenues derive from continuing operations and are not seasonal in nature.
Net realised gains on investments in cases represents realised revenue on completed cases.
Fair value movements include the increase / (decrease) in fair value of open cases, the removal of the carrying fair value of realised cases (in the period when a case is completed and recognised as realised revenue) and the addition of the fair value of new cases.
|
31 March 2023 |
31 March 2022 |
||
|
£000s |
£000s |
||
|
Net realised gains on investments in cases |
26,790 |
15,243 |
|
|
Fair value movements (net of transfers to realisations) - Note 13 |
(6,037) |
5,200 |
|
|
20,753 |
20,443 |
|
31 March 2023 |
31 March 2022 |
||
|
£000s |
£000s |
||
|
Arising from: |
|||
|
Purchased cases |
15,321 |
18,955 |
|
|
Funded cases |
5,432 |
1,488 |
|
|
20,753 |
20,443 |
5. Directors and employees
Staff costs for the Company during the year:
|
31 March 2023 |
31 March 2022 |
||
|
Staff costs (including directors): |
£000s |
£000s |
|
|
Wages and salaries |
3,031 |
2,814 |
|
|
Social security costs |
429 |
390 |
|
|
Other pension costs and benefits |
277 |
314 |
|
|
Total staff costs |
3,737 |
3,518 |
The average monthly number of employees (including executive and non-executive directors) employed by activity was:
|
31 March 2023 |
31 March 2022 |
||
|
No. |
No. |
||
|
Directors (executive and non-executive) |
6 |
5 |
|
|
Management and administration |
18 |
17 |
|
|
Average headcount |
24 |
22 |
The aggregate amount charged in the accounts for key management personnel (including employer's National Insurance contributions), being the directors of the company, were as follows:
|
Directors' emoluments: |
31 March 2023 |
31 March 2022 |
|
|
£000s |
£000s |
||
|
Salaries and fees |
1,404 |
1,042 |
|
|
Other pension costs and benefits |
16 |
16 |
|
|
1,420 |
1,058 |
Directors remuneration is detailed in the Remuneration report.
|
31 March 2023 |
31 March 2022 |
||
|
£000s |
£000s |
||
|
Highest paid director: |
|||
|
Salaries and fees |
529 |
514 |
|
|
Other pension costs and benefits |
6 |
7 |
|
|
535 |
521 |
Management consider the directors to be the key management personnel.
6. Operating profit
Is stated after charging:
|
31 March 2023 |
31 March 2022 |
||
|
£000s |
£000s |
||
|
Bad debt expenses |
1,534 |
321 |
|
|
Share based payments |
150 |
169 |
|
|
Depreciation of right of use asset |
86 |
171 |
|
|
Amortisation of intangible assets |
13 |
22 |
7. Auditor remuneration
Amounts payable to RSM UK Audit LLP and its related entities in respect of both audit and non-audit services are set out below.
|
31 March 2023 |
31 March 2022 |
||
|
£000s |
£000s |
||
|
Fee payable to Company's auditor and its associates for the statutory audit of the Company's financial statements |
110 |
80 |
|
|
Fees payable to Company's auditor and its associates for other services: |
|||
|
Interim agreed upon procedures |
11 |
10 |
|
|
Total |
121 |
90 |
8. Analysis of expenses by nature
Internal legal costs are included within administrative expenses whereas external legal costs are either capitalised as Investments for open cases or recognised as cost of sales on completed cases.
The breakdown by nature of administrative expenses is as follows:
|
31 March 2023 |
31 March 2022 |
||
|
£000s |
£000s |
||
|
Staff costs, including pension and healthcare costs |
3,737 |
3,519 |
|
|
Bad debts including expected credit losses |
1,534 |
321 |
|
|
Professional fees |
512 |
479 |
|
|
Marketing costs |
344 |
222 |
|
|
Other costs, including office costs |
666 |
536 |
|
|
Total administrative expenses |
6,793 |
5,077 |
9. Finance income and finance expense
|
31 March 2023 |
31 March 2022 |
||
|
£000s |
£000s |
||
|
Bank interest |
7 |
- |
|
|
Total finance income |
7 |
- |
|
31 March 2023 |
31 March 2022 |
||
|
£000s |
£000s |
||
|
Lease liability interest |
1 |
6 |
|
|
Other loan interest |
251 |
142 |
|
|
Bank loan charges |
587 |
648 |
|
|
Total finance expense |
839 |
796 |
10. Dividends
Dividends paid during the financial year were as follows.
|
31 March 2023 |
31 March 2022 |
||
|
Declared during the year |
£000s |
£000s |
|
|
Final dividend for the year ended 31 March 2022 of 0.5p per share, paid in October 2022 (October 2021: 1.00p) |
219 |
436 |
|
|
Interim dividend for the year ended 31 March 2023, of 0.0p per share (December 2021: 0.39p) |
- |
170 |
|
|
Total dividends paid during FY23 |
219 |
606 |
|
|
Proposed after the end of year and not recognised as a liability |
|||
|
Final dividend for the year ended 31 March 2023: 0.0p per share (31 March 2022: 0.5p per share) |
- |
219 |
11. Taxation
|
31 March 2023 |
31 March 2022 |
||
|
Analysis of (credit)/charge in year |
£000s |
£000s |
|
|
Current tax (credit)/charge on losses/profits for the year |
(735) |
850 |
|
|
Adjustments in respect of prior periods |
(42) |
2 |
|
|
Income tax (credit)/charge |
(777) |
852 |
|
|
Deferred tax |
(52) |
(22) |
|
|
Total tax (credit)/charge |
(829) |
830 |
The tax (credit)/charge for the year differs from the standard rate of corporation tax in the UK of 19%. (2022: 19%). The differences are explained below.
|
31 March 2023 |
31 March 2022 |
||
|
£000s |
£000s |
||
|
(Loss)/Profit on ordinary activities before tax |
(3,953) |
4,508 |
|
|
(Loss)/Profit on ordinary activities multiplied by the rate of corporation tax in the UK as above |
(751) |
857 |
|
|
Effects of: |
|||
|
Expenses not deductible |
44 |
39 |
|
|
Other differences |
(28) |
(45) |
|
|
Adjustments to current tax in respect of previous periods |
(42) |
2 |
|
|
Deferred tax charged directly to equity |
120 |
(49) |
|
|
Temporary differences not recognised in the computation |
(108) |
26 |
|
|
Remeasurement of deferred tax for change in tax rates |
(64) |
- |
|
|
Total taxation (credit)/charge |
(829) |
830 |
12. Earnings per share
The basic earnings per share is calculated by dividing the profit/(loss) attributable to ordinary equity holders by the weighted average number of ordinary shares outstanding during the year. Diluted earnings per share is calculated by dividing the profit/(loss) after tax by the weighted average number of shares in issue during the year, adjusted for potentially dilutive share options.
The following reflects the income and share data used in the earnings per share calculation:
|
31 March 2023 |
31 March 2022 |
||||
|
£000s |
£000s |
||||
|
(Loss)/Profit for the period attributable to equity holders of the Company |
(3,255) |
3,678 |
|||
|
Weighted average number of ordinary shares |
43,756,351 |
43,601,037 |
|||
|
Earnings per share |
(0.07) |
0.08 |
|||
Basic Earnings Per Share is based on the profit for the year attributable to the equity holders of the Company dividend by the weighted average number of ordinary shares during the period.
|
31 March 2023 |
31 March 2022 |
||
|
£000s |
£000s |
||
|
(Loss)/Profit for the period attributable to equity holders of the Company |
(3,255) |
3,678 |
|
|
Diluted weighted average number of ordinary shares |
45,442,219 |
44,907,949 |
|
|
Diluted earnings per share |
(0.07) |
0.08 |
Reconciliation of number of shares and diluted shares at year end:
|
31 March 2023 |
31 March 2022 |
||
|
£000s |
£000s |
||
|
Weighted average number of shares for Basic Earnings Per Share |
43,756,351 |
43,601,037 |
|
|
Adjustments for calculation of Diluted Earnings Per Share: |
|||
|
Options over ordinary shares |
1,685,868 |
1,306,912 |
|
|
Weighted average number of shares for Diluted Earnings Per Share |
45,442,219 |
44,907,949 |
The earnings per share is diluted by options over ordinary shares, as detailed in note 23.
13. Investments
Non-current investments and current asset investments comprise the costs incurred in bringing funded and purchased cases to the position that they have reached at the balance sheet date. In addition, where an event has occurred that causes the Directors to revalue the amount invested, a fair value adjustment is made by the Directors based on Counsel's and the Directors' opinion, which can either be positive or negative (see Note 3 on accounting estimates).
|
31 March 2023 |
31 March 2022 |
||
|
£000s |
£000s |
||
|
As at 1 April 2022 |
45,718 |
37,508 |
|
|
Prepaid cost additions |
5,806 |
6,470 |
|
|
Realised prepaid costs |
(9,025) |
(3,460) |
|
|
Fair value movement (net of transfers to realisations) |
(6,037) |
5,200 |
|
|
As at 31 March 2023 |
36,462 |
45,718 |
|
31 March 2023 |
31 March 2022 |
||
|
£000s |
£000s |
||
|
Current |
23,073 |
33,520 |
|
|
Non-current |
13,389 |
12,198 |
|
|
As at 31 March 2023 |
36,462 |
45,718 |
Analysis of fair value movements
|
31 March 2023 |
31 March 2022 |
||
|
£000s |
£000s |
||
|
New case investments |
9,659 |
7,370 |
|
|
Increase in existing case fair value (excl. cartel cases) |
134 |
956 |
|
|
Decrease in existing case fair value (excl. cartel cases) |
(2,519) |
(3,693) |
|
|
Case completions - transferred to realisations |
(14,503) |
(4,539) |
|
|
Increase in fair value of cartel cases |
1,192 |
5,106 |
|
|
Fair value movement (net of transfers to realisations) |
(6,037) |
5,200 |
14. Intangible assets
Intangible assets comprised the costs of developing the Company's website. The website developments costs are amortised over the useful life of the website, which is estimated to be three years.
|
Website development costs |
31 March 2023 |
31 March 2022 |
|
|
£000s |
£000s |
||
|
As at 1 April 2022 |
13 |
35 |
|
|
Amortisation charge |
(13) |
(22) |
|
|
As at 31 March 2023 |
- |
13 |
15. Right of use asset
The Company held one lease, an office property lease for 21 Gloucester Place, London which expired in September 2022. The new lease relating to this office is short term and therefore not covered under IFRS 16.
|
31 March 2023 |
31 March 2022 |
||
|
£000s |
£000s |
||
|
As at 1 April 2022 |
86 |
257 |
|
|
Depreciation |
(86) |
(171) |
|
|
As at 31 March 2023 |
- |
86 |
|
|
Current |
- |
86 |
|
|
As at 31 March 2023 |
- |
86 |
|
31 March 2023 |
31 March 2022 |
||
|
Lease liability |
£000s |
£000s |
|
|
Current |
- |
96 |
|
|
Non-current |
- |
- |
|
|
As at 31 March 2023 |
- |
96 |
The incremental borrowing rate used in the calculation of the lease liability was 3% (FY22: 3%). The maturity analysis of the finance lease liability is included in note 27.
|
Amounts recognised in the Statement of Comprehensive Income |
31 March 2023 |
31 March 2022 |
|
|
£000s |
£000s |
||
|
Total interest expense |
1 |
6 |
|
Amounts recognised in the Statement of Cashflows |
31 March 2023 |
31 March 2022 |
|
|
£000s |
£000s |
||
|
Total cash outflow |
(97) |
(194) |
16. Trade and other receivables
|
31 March 2023 |
31 March 2022 - restated |
||
|
£000s |
£000s |
||
|
Amounts falling due in excess of one year: |
|||
|
Trade receivables |
10,270 |
11,086 |
|
|
Contract asset |
2,045 |
1,245 |
|
|
Total trade and other receivables due in excess of one year |
12,315 |
12,331 |
|
|
Amounts falling due within one year: |
|||
|
Gross trade receivables |
16,505 |
10,096 |
|
|
Less: |
|||
|
Specific provisions |
(2,881) |
(1,464) |
|
|
Allowance for expected credit losses |
(1,794) |
(865) |
|
|
Trade receivables |
11,830 |
7,767 |
|
Prepayments |
233 |
177 |
|
|
Total trade and other receivables due within one year |
12,063 |
7,944 |
Trade receivables are amounts due from settled cases in the ordinary course of business. Trade receivables are recognised initially at the amount of consideration that is unconditional, unless they contain significant financing components, when they are recognised at fair value. The Company holds the trade receivables with the objective of collecting the contractual cash flows and therefore measures them subsequently at amortised cost using the effective interest method. Ageing of the expected credit loss allowance us included in note 27.
The contract asset relates to the unwinding of the discounting applied to the present value of the settlement of a large case in FY21. See note 30 for more information regarding the restatement of 31 March 2022.
No impairment provision has been recognised in respect of contract assets as there is no past history of impairment losses and future losses are not anticipated.
Movements in the allowance for expected credit losses (ECL) are as follows:
|
31 March 2023 |
31 March 2022 |
||
|
ECL Provision |
£000s |
£000s |
|
|
At 1 April 2022 |
865 |
560 |
|
|
Increase in provisions for impairment |
929 |
305 |
|
|
As at 31 March 2023 |
1,794 |
865 |
The Company applies the simplified approach in providing for expected credit losses under IFRS 9 which allows the use of the lifetime expected credit loss provision for all trade receivables. In measuring the expected credit losses, trade receivables have been stratified by settlement type and days past due. Expected lifetime credit loss rates are based on the payment profiles of completions from January 2019 (post IPO).
17. Cash and cash equivalents
|
31 March 2023 |
31 March 2022 |
||
|
£000s |
£000s |
||
|
Cash at bank and in hand |
636 |
2,256 |
All bank balances are denominated in pounds sterling.
18. Trade and other payables
|
31 March 2023 |
31 March 2022 - restated |
||
|
£000s |
£000s |
||
|
Amounts falling due in excess of one year: |
|||
|
Accruals - direct costs |
5,982 |
6,853 |
|
|
Contract liability |
1,411 |
846 |
|
|
Total trade and other payables due in excess of one year |
7,393 |
7,699 |
|
|
Amounts falling due in one year: |
|||
|
Trade payables |
802 |
734 |
|
|
Accruals - direct costs |
3,984 |
3,273 |
|
|
Other creditors |
645 |
622 |
|
|
Other taxation and social security |
112 |
119 |
|
|
Total trade and other payables due within one year |
5,543 |
4,748 |
18. Trade and other payables
Trade payables are unsecured and are usually paid within 30 days of recognition. The carrying value of trade and other payables approximates their fair value, as the impact of discounting is not significant.
Accruals - direct costs relate primarily to accrued amounts due to Insolvency Practitioners on the Company's completed cases and accrued legal costs of completed cases. Of the £6.6m shown as non-current, £5.6m relates to the amounts payable to the Insolvency Practitioner due in more than one year in respect of the large case completion in FY21.
The contract liability relates to the unwinding of the discounting applied to the present value of amounts payable to the insolvency practitioner following the settlement of a large case in FY21. See note 30 for more information regarding the restatement of 31 March 2022.
19. Deferred tax asset
|
31 March 2023 |
31 March 2022 |
||
|
£000s |
£000s |
||
|
At 1 April 2022 |
95 |
121 |
|
|
Deferred tax charged in the income statement for the period |
292 |
23 |
|
|
Deferred tax included directly in equity |
(120) |
(49) |
|
|
At 31 March 2023 |
267 |
95 |
Deferred tax has been charged to equity reserve because these movements in deferred tax assets relate to releases and creation of share options.
20. Borrowings
|
31 March 2023 |
31 March 2022 |
||
|
£000s |
£000s |
||
|
Non-current |
|||
|
Bank loans |
10,381 |
13,285 |
|
|
Total non-current borrowings |
10,381 |
13,285 |
|
|
Current |
|||
|
Lease liability |
- |
96 |
|
|
Total current borrowings |
- |
96 |
Arrangement fees in relation to a £25m loan facility set up with HSBC in June 2021 are capitalised and amortised over the length of the loan facility, period of three years. There is an option to extend for a further year.
Gross borrowings are £10.5m as at 31 March 2023 (FY22: £13.5m) but are presented net of HSBC set-up amortised costs of £119k above which are being amortised over 3 years. Maturity analysis of bank loans is included in note 27.
The Company agreed on 22 June 2021, a new RCF for £25m over an initial three-year period to 1 July 2024, with an option to extend by a further year. In July 2022 the Company chose to take the extension to 1 July 2025. The new RCF also offers the Company an additional approved but uncommitted £10m accordion, if ever required. The interest rate is a maximum 3.7% over SONIA. Under terms of the agreement, Steven Cooklin is required to maintain a minimum shareholding of 5% of the issued share capital of the Company and is subject to a change in control clause such that no investor may hold more than 30 percent of the voting rights of the Company.
The Company agreed a waiver with HSBC in respect of the leverage covenant for the quarters ending 30th June 2022, 30th September 2022 and 31st December 2022. Following this event, the Company has agreed an amendment to the loan agreement with a revised leverage covenant for the three quarters (ending 31st March 2023, 30th June 2023 and 30th September 2023) to avoid any short-term breach of the leverage covenant due to the count back nature of the calculation (calculation amended to exclude the period of EBIT losses in H1). A condition of this amendment is that no dividend should be paid in respect of FY23 year end. This restriction is lifted in FY24 if the Company is trading profitably.
Reconciliation of liabilities arising from financing activities:
|
1 April 2022 |
Cash flows |
Non-cash changes |
31 March 2023 |
|
|
£000s |
£000s |
£000s |
£000s |
|
|
Bank borrowings |
13,285 |
(3,000) |
96 |
10,381 |
|
Lease liabilities |
96 |
(97) |
1 |
- |
|
Total liabilities from financing activities |
13,381 |
(3,097) |
97 |
10,381 |
|
1 April 2021 |
Cash flows |
Non-cash changes |
31 March 2022 |
|
|
£000s |
£000s |
£000s |
£000s |
|
|
Bank borrowings |
7,698 |
5,500 |
87 |
13,285 |
|
Lease liabilities |
285 |
(194) |
5 |
96 |
|
Total liabilities from financing activities |
7,983 |
5,306 |
92 |
13,381 |
The Directors consider the carrying value of all financial liabilities to be equivalent to their fair value.
Commitments in relation to leases are payable as follows:
|
31 March 2023 |
31 March 2022 |
||
|
£000s |
£000s |
||
|
Within one year |
- |
97 |
|
|
Total |
- |
97 |
|
|
Future finance charges |
- |
(1) |
|
|
Total lease liability |
- |
96 |
21. Share capital
|
31 March 2023 |
31 March 2022 |
||
|
Allotted and issued |
No. |
No. |
|
|
Ordinary shares of £0.004 each |
43,761,305 |
43,694,740 |
Voting rights
The holders of ordinary shares are entitled to one voting right per share.
Dividends
The holders of ordinary shares are entitled to dividends out of the profits of the Company available for distribution.
22. Reserves
Share premium
Includes all current and prior year premiums received on issue of share capital.
Share based payment reserve
Includes amounts recognised for the fair value of share options granted in accordance with IFRS 2.
Special non-distributable reserve
A special non-distributable reserve was created in FY19 to ensure there was sufficient reserves held within the Company to satisfy creditors at the time of a conversion of share premium to distributable reserves to allow a dividend to be paid in FY19. The balance on this reserve was reduced to nil in FY23.
Retained earnings
Includes all current and prior periods retained profits and losses.
23. Share options
The Company operates a number of share-based payment schemes as follows:
CSOP Share Scheme
The Board has adopted the Manolete Partners Share Option Plan (CSOP) to enable conditional share awards to be granted, which may be subject to achievement of performance criteria and the awards are exercisable between three and ten years following their grant. There are no cash-settlement alternatives and the awards are therefore accounted for under IFRS 2 as equity settled share-base payments.
Year ended 31st March 2023
|
Grant date |
Vesting Date |
Exercise price |
Balance brought forward |
Granted during the year |
Exercised during the year |
Lapsed/ forfeited |
Balance carried forward |
|
21/11/2019 |
21/11/2021 |
1.12 |
384,038 |
- |
(13,232) |
- |
370,806 |
|
08/07/2019 |
08/07/2022 |
4.45 |
50,557 |
- |
- |
- |
50,557 |
|
29/11/2019 |
29/11/2022 |
4.65 |
16,127 |
- |
- |
- |
16,127 |
|
09/12/2019 |
09/12/2022 |
4.30 |
193,781 |
- |
- |
- |
193,781 |
|
27/07/2020 |
27/07/2023 |
4.15 |
21,684 |
- |
- |
(7,228) |
14,456 |
|
16/11/2022 |
16/11/2025 |
2.58 |
- |
34,950 |
- |
- |
34,950 |
|
666,187 |
34,950 |
(13,232) |
(7,228) |
680,677 |
|||
|
Exercisable at the end of the year |
- |
- |
- |
- |
- |
||
|
Weighted average exercise price |
2.48 |
2.58 |
1.12 |
4.15 |
2.50 |
||
Year ended 31st March 2022
|
Grant date |
Vesting Date |
Exercise price |
Balance brought forward |
Granted during the year |
Exercised during the year |
Lapsed/ forfeited |
Balance carried forward |
|
|
21/11/2019 |
21/11/2021 |
1.12 |
507,352 |
- |
(123,314) |
- |
384,038 |
|
|
08/07/2019 |
08/07/2022 |
4.45 |
50,557 |
- |
- |
- |
50,557 |
|
|
29/11/2019 |
29/11/2022 |
4.65 |
16,127 |
- |
- |
- |
16,127 |
|
|
09/12/2019 |
09/12/2022 |
4.30 |
193,781 |
- |
- |
- |
193,781 |
|
|
27/07/2020 |
27/07/2023 |
4.15 |
21,684 |
- |
- |
- |
21,684 |
|
|
15/03/2021 |
15/03/2024 |
2.70 |
11,111 |
- |
- |
(11,111) |
- |
|
|
800,612 |
- |
(123,314) |
(11,111) |
666,187 |
||||
|
Exercisable at the end of the year |
- |
- |
- |
- |
- |
|||
|
Weighted average exercise price |
2.45 |
- |
1.12 |
2.70 |
2.48 |
|||
Options outstanding at 31 March 2023 are exercisable at prices ranging between £1.12 and £4.65 (FY22 £1.12 and £4.65) and the weighted average contractual life of the options outstanding at the reporting date is 17 months (FY22: 7.6 months) as analysed in the table below:
|
Number of share options |
Weighted average remaining contractual life (months) |
||||
|
Exercise price range |
FY23 |
FY22 |
FY23 |
FY22 |
|
|
£1.12 - £1.99 |
370,806 |
384,038 |
- |
- |
|
|
£2.00 - £3.99 |
34,950 |
- |
31 |
- |
|
|
£4.00 - £4.65 |
274,921 |
282,149 |
3 |
7.6 |
|
|
680,677 |
666,187 |
17 |
7.6 |
||
|
Number of share options |
Average exercise price £ |
||||
|
FY23 |
FY22 |
FY23 |
FY22 |
||
|
CSOP Options |
168,938 |
141,216 |
3.01 |
3.18 |
|
|
Unapproved Options |
511,739 |
524,971 |
2.32 |
2.29 |
|
|
Total |
680,677 |
666,187 |
2.50 |
2.48 |
|
Fair value calculations
The fair value of the CSOP share options plans are calculated at the date of the grant using the Black-Scholes option pricing model. Expected volatility was determined by calculating the historical volatility of the Company's share price over an appropriate period. The following table presents the inputs used in the option pricing model for the share options granted in the year ended 31 March 2023 based on information at the date of grant.
|
Grant date of award |
Share price at grant date |
Exercise price |
Expected volatility |
Dividend yield |
Risk-free interest rate |
Fair value at grant date |
|
16/11/2022 |
2.52 |
2.58 |
32% |
0% |
1.87% |
0.92 |
No performance conditions were included in the fair value calculations for CSOP awards granted during the year.
Long-term incentive plan
In FY21 the Company introduced an equity-settled long-term incentive plan (LTIP) scheme for the executive directors and other senior executives. Performance is measured at the end of the three-year performance period. If the required minimum Earnings Per Share (EPS) performance conditions have been satisfied, 25% of the shares will vest, increasing to 100% of shares if the maximum EPS target is achieved. Straight-line vesting will apply of performance falls between two points. FY23 LTIP scheme is split evenly over three performance conditions; EPS, Strategy performance and Share Price. Options awarded will expire ten years from the date of grant and are issued at the nominal value of the Company's share capital pf £0.004p but the Company's remuneration committee may waive the requirement at their discretion.
The following table summarises the movements in LTIP options during the year:
Year ended 31st March 2023
|
Grant date |
Expiry Date |
Exercise price |
Balance brought forward |
Granted during the year |
Exercised during the year |
Lapsed/ forfeited |
Balance carried forward |
|
30/09/2020 |
30/03/2022 |
0.004 |
53,333 |
- |
- |
- |
53,333 |
|
30/09/2020 |
30/09/2023 |
0.004 |
321,334 |
- |
- |
- |
321,334 |
|
02/12/2021 |
02/12/2024 |
0.004 |
357,806 |
- |
- |
- |
357,806 |
|
02/12/2021 |
30/03/2022 |
0.004 |
53,333 |
- |
(53,333) |
- |
- |
|
29/07/2022 |
29/07/2025 |
0.004 |
- |
349,800* |
- |
- |
349,800 |
|
29/07/2022 |
29/07/2023 |
0.004 |
- |
16,054* |
- |
- |
16,054 |
|
785,806 |
365,854 |
(53,333) |
- |
1,098,327 |
|||
|
Weighted average exercise price |
0.004 |
0.004 |
0.004 |
- |
0.004 |
||
Year ended 31st March 2022
|
Grant date |
Expiry Date |
Exercise price |
Balance brought forward |
Granted during the year |
Exercised during the year |
Lapsed/ forfeited |
Balance carried forward |
|
30/09/2020 |
30/03/2022 |
0.004 |
53,333 |
- |
- |
- |
53,333 |
|
30/09/2020 |
30/09/2023 |
0.004 |
321,334 |
- |
- |
- |
321,334 |
|
02/12/2021 |
02/12/2024 |
0.004 |
- |
357,806* |
- |
357,806 |
|
|
02/12/2021 |
30/03/2022 |
0.004 |
- |
53,333* |
- |
- |
53,333 |
|
374,667 |
411,139 |
- |
- |
785,806 |
|||
|
Weighted average exercise price |
0.004 |
0.004 |
- |
- |
0.004 |
||
*The LTIP amounts above are the maximum potential conditional share awards that may vest subject to the performance measures.
53,333 options were exercised during the period and no options were modified. The weighted average remaining contractual life of these options is 20.6 months (FY22: 22.8 months). No LTIP options were in issue prior to the 1 April 2020.
Fair value calculations
The fair value of the LTIP share options plans are calculated at the date of the grant using the Black-Scholes option pricing model. Expected volatility was determined by calculating the historical volatility of the Company's share price over an appropriate period. The following table presents the inputs used in the option pricing model for the share options granted in the years ended 31 March 2023 and 31 March 2022 based on the information at the date of grant:
|
Grant date of award |
Share price at grant date |
Exercise price |
Expected volatility |
Dividend yield |
Risk-free interest rate |
Fair value at grant date |
|
02/12/2021 |
2.55 |
0.004 |
56.3% |
0% |
0.82% |
2.55 |
|
02/12/2021 |
2.55 |
0.004 |
33.6% |
0% |
0.82% |
2.55 |
|
29/07/2022 |
2.78 |
0.004 |
52.3% |
0% |
1.87% |
2.34 |
|
29/07/2022 |
2.78 |
0.004 |
31.7% |
0% |
1.87% |
2.34 |
LTIP awards granted during the year ended 31 March 2023 are subject to the Earnings Per Share performance, Strategy performance and share price conditions.
24. Retirement benefits
The Company operates a defined contribution pension scheme for all qualifying employees. During the year, the Company charged £82,774 (FY22: £78,824) as employer's pension contributions. The outstanding pension creditor as at 31 March 2023 was £5,339 (FY22: £4,933).
25. Financial instruments - classification and measurement
Financial assets
Financial assets measured at amortised cost comprise trade receivables, contract assets and cash, as follows:
|
31 March 2023 |
31 March 2022 |
||
|
£000s |
£000s |
||
|
Trade receivables |
22,100 |
18,853 |
|
|
Contract assets |
2,045 |
1,245 |
|
|
Cash and cash equivalents |
636 |
2,256 |
|
|
Total |
24,781 |
22,354 |
Financial assets measured at fair value through profit or loss comprise of investments;
|
31 March 2023 |
31 March 2022 |
||
|
£000s |
£000s |
||
|
Investments |
36,462 |
45,718 |
|
|
Total |
36,462 |
45,718 |
Financial liabilities
Financial liabilities measured at amortised cost comprise of trade and other payables, bank loans, and lease liabilities, as follows:
|
31 March 2023 |
31 March 2022 |
||
|
£000s |
£000s |
||
|
Trade and other payables |
12,936 |
12,447 |
|
|
Bank loans |
10,381 |
13,285 |
|
|
Lease liabilities |
- |
96 |
|
|
Total |
23,317 |
25,828 |
Fair value
The fair value of investments is determined as set out in the accounting policies in Note 2. The fair value hierarchy of financial instruments measured at fair value is provided below:
|
31st March 2023 |
Level 1 |
Level 2 |
Level 3 |
|
£000s |
£000s |
£000s |
|
|
Investments |
- |
- |
36,462 |
|
Total |
- |
- |
36,462 |
|
31st March 2022 |
Level 1 |
Level 2 |
Level 3 |
|
£000s |
£000s |
£000s |
|
|
Investments |
- |
- |
45,718 |
|
Total |
- |
- |
45,718 |
26. Cashflow information
(A) Non-cash adjustments to cashflows generated from operations
|
31 March 2023 |
31 March 2022 |
||
|
£000s |
£000s |
||
|
Fair value movements |
6,037 |
(5,200) |
|
|
Legal costs on realised cases |
9,024 |
3,460 |
|
|
Finance expense |
236 |
796 |
|
|
Depreciation & amortisation |
99 |
193 |
|
|
Share based payments |
260 |
218 |
|
|
Deferred tax |
(95) |
89 |
|
|
Finance income |
(7) |
- |
|
|
Non-cash adjustments to cashflows generated from/(used in) operations |
15,554 |
(444) |
(B) Net debt reconciliation
|
31 March 2023 |
31 March 2022 |
||
|
£000s |
£000s |
||
|
Cash and cash equivalents |
636 |
2,256 |
|
|
Borrowings - repayable after one year |
(10,381) |
(13,285) |
|
|
Net debt excluding leases |
(9,745) |
(11,029) |
|
|
Current lease liability |
- |
(96) |
|
|
Net debt including leases |
(9,745) |
(11,125) |
27. Financial instruments - risk management
The Company's activities expose it to a variety of financial risks: market risk (including cash flow interest rate risk), investment risk, liquidity risk and credit risk. Risk management is carried out by the Board of Directors. The Company uses financial instruments to provide flexibility regarding its working capital requirements and to enable it to manage specific financial risks to which it is exposed.
The Company finances its operations through a mixture of equity finance, bank debt, cash and liquid resources and various items such as trade receivables and trade payables which arise directly from the Company's operations.
Interest rate risk
Interest rate risk is the risk that the fair value of future cash flows associated with the instrument will fluctuate due to changes in market interest rates. Interest bearing assets including cash and cash equivalents are short-term liquid assets. It is the Company's policy to settle trade payables within the credit terms allowed and the Company does therefore not incur interest on overdue balances. No sensitivity analysis has been prepared as the impact on the financial statements would not be significant.
The interest rate profile of the Company's borrowings is shown below:
|
31 March 2023 |
31 March 2022 |
||||
|
Debt |
Interest |
Debt |
Interest |
||
|
£000s |
Rate |
£000s |
Rate |
||
|
Floating rate borrowings |
|||||
|
Bank loans |
10,500 |
SONIA and Margin of 3.7% |
13,500 |
LIBOR and Margin of 2.9% |
|
Liquidity risk
The Company seeks to maintain sufficient cash balances. Management reviews cash flow forecasts on a regular basis to determine whether the Company has sufficient cash reserves to meet future working capital requirements and to take advantage of business opportunities.
Unused borrowing facilities at the reporting date:
|
31 March 2023 |
31 March 2022 |
||
|
£000s |
£000s |
||
|
Bank loans |
14,500 |
11,500 |
The following table details the Company's remaining contractual maturity for the Company's non-derivative financial liabilities with agreed maturity periods. The table is presented based on the undiscounted cashflows of the financial liabilities based on the earliest date on which the Company can be required to pay which may differ from the carrying liabilities at the reporting date.
|
At 31 March 2023 |
Less than one year |
Between 1 and 2 years |
Between 2 and 5 years |
Greater than 5 years |
Total contractual cashflows |
Carrying amount of liabilities |
|
£000s |
£000s |
£000s |
£000s |
£000s |
£000s |
|
|
Trade and other payables |
6,435 |
1,856 |
4,451 |
3,906 |
16,648 |
12,936 |
|
Bank borrowings |
- |
- |
10,500 |
- |
10,500 |
10,381 |
|
Lease liabilities |
- |
- |
- |
- |
- |
- |
|
Total |
6,435 |
1,856 |
14,951 |
3,906 |
27,148 |
23,317 |
|
At 31 March 2022 |
Less than one year |
Between 1 and 2 years |
Between 2 and 5 years |
Greater than 5 years |
Total contractual cashflows |
Carrying amount of liabilities |
|
£000s |
£000s |
£000s |
£000s |
£000s |
£000s |
|
|
Trade and other payables |
4,925 |
1,382 |
4,289 |
5,223 |
15,819 |
12,447 |
|
Bank borrowings |
- |
- |
13,500 |
- |
13,500 |
13,285 |
|
Lease liabilities |
97 |
- |
- |
- |
97 |
96 |
|
Total |
5,022 |
1,382 |
17,789 |
5,223 |
29,416 |
25,828 |
The contractual maturity classifications of trade and other payables have been restated in respect of FY2022 following a review of the contractual terms of a specific liability, as reported further in Note 30.
In addition, the classification of the bank borrowings figure of £13.5m has been restated in respect of FY2022 to correctly reflect the terms of repayment in place as at 31 March 2022
Capital risk management
The Company is both equity and debt funded, and these two elements combine to make up the capital structure of the business. Equity comprises share capital, share premium and retained earnings and is equal to the amount shown as 'Equity' in the balance sheet. Debt comprises bank loans which are set out in further detail above and in note 20. The Company initially raised funds through an IPO in December 2018 and has drawn down £10.5m of a HSBC loan facility (FY22: £13.5m), the total facility is a £25m revolving credit facility with HSBC.
The Company's current objectives when maintaining capital are to:
· Safeguard the Company's ability to operate as a going concern so that it can continue to pursue its growth plans.
· Provide a reasonable expectation of future returns to shareholders.
· Maintain adequate financial flexibility to preserve its ability to meet financial obligations, both current and long term.
The Company sets the amount of capital it requires in proportion to risk. The Company manages its capital structure and adjusts it in the light of changes in economic conditions and the risk characteristics of underlying assets. In order to maintain or adjust the capital structure, the Company may issue new shares or sell assets to reduce debt.
During the year ended 31 March 2023 the Company's strategy remained unchanged.
Credit risk and impairment
Credit risk refers to the risk that a counterparty will default on its contractual obligations resulting in financial loss to the Company. The maximum exposure to credit risk is the carrying value of its financial assets recognised at the reporting date, as summarised below:
|
31 March 2023 |
31 March 2022 |
||
|
£000s |
£000s |
||
|
Trade and other receivables |
24,378 |
20,275 |
|
|
Total |
24,378 |
20,275 |
The Company applies the simplified approach in providing for expected credit losses under IFRS 9 which allows the use of the lifetime expected credit loss provision for all trade receivables. In measuring the expected credit losses, trade receivables have been stratified by settlement type and days past due. Expected lifetime credit loss rates are based on the payment profiles of sales from January 2019 (post IPO).
The Company attempts to assess the probability of credit losses but seeks to mitigate its credit risk by undertaking rigorous net worth checks before taking on a new case. Occasionally, credit defaults do occur when counterparties default on an agreed settlement, payable by instalments.
There is a concentration risk in relation to the trade receivable of £7.8m in relation to a single case which completed in FY21. Repayments to date have been made according to the agreed schedule. Excluding this balance, the Company does not consider any concentration of risk within either trade or other receivables to be significant. The Company seeks to obtain charging orders over the property of trade receivables as security where possible. The receivables' ageing analysis is also evaluated on a regular basis for potential doubtful debts. It is the Directors' opinion that no further provision for doubtful debts is required.
The following table contains an analysis of our total gross trade receivables segmented by settlement type.
|
31 March 2023 |
31 March 2022 |
||
|
£000s |
£000s |
||
|
Settlement agreements |
18,850 |
15,717 |
|
|
Judgements |
5,044 |
4,001 |
|
|
Specific provisions |
2,881 |
1,464 |
|
|
Gross carrying amount after specific provisions |
26,775 |
21,182 |
|
|
Loss allowance |
(4,675) |
(2,329) |
|
|
Trade receivables carrying amount |
22,100 |
18,853 |
Analysis of trade receivables stratified by settlement type, is as follows:
|
Past due at 31 March 2023 |
Current £000s |
0-1 months £000s |
1-3 months £000s |
3-6 months £000s |
6-12 months £000s |
>12 months £000s |
Total £000s |
|
Gross receivables |
|||||||
|
Settlement agreements |
17,578 |
55 |
716 |
593 |
138 |
552 |
19,632 |
|
Judgements |
659 |
2 |
- |
1,609 |
619 |
4,254 |
7,143 |
|
Total |
18,237 |
57 |
716 |
2,202 |
757 |
4,806 |
26,775 |
|
Loss allowance |
|||||||
|
Settlement agreements - ECL |
(163) |
(5) |
(125) |
(276) |
(78) |
(180) |
(827) |
|
Judgements - ECL |
(68) |
(1) |
- |
(352) |
(172) |
(374) |
(967) |
|
Settlement agreements - Specific provisions |
(87) |
(2) |
(280) |
(7) |
(33) |
(373) |
(782) |
|
Judgements - Specific provisions |
- |
- |
- |
(154) |
(100) |
(1,845) |
(2,099) |
|
Total |
(318) |
(8) |
(405) |
(789) |
(383) |
(2,772) |
(4,675) |
|
Expected loss rate % |
|||||||
|
Settlement agreements |
2% |
10% |
29% |
47% |
75% |
95% |
4% |
|
Judgements* |
12% |
28% |
33% |
34% |
35% |
64% |
14% |
|
Specific provisions |
100% |
100% |
100% |
100% |
100% |
100% |
100% |
|
Total |
2% |
14% |
57% |
36% |
51% |
58% |
17% |
*Expected judgement loss rates are shown net of deductions where the Company has secured charging orders over properties owned by the debtors.
Credit risk on cash and cash equivalents is considered to be very low as the counterparties are all substantial banks with high credit ratings.
Investment risk
Investment risk refers to the risk that the Company's case investments may increase or decrease in value.
Sensitivity analysis has not been included in the financial statements, due to the vast amount of inputs and number of variables which are inherently specific to each case, making it impossible to provide meaningful data. Whilst the Board considered the methodologies and assumptions adopted in the valuation are supportable, reasonable and robust, because of the inherent uncertainty of valuation, it is reasonably possible, on the basis of existing knowledge that outcomes within the next financial year that are different from the assumptions could require a material adjustment to the carrying amount of the £36.5m of investments disclosed in the balance sheet. However, as an indication we note that a 10% increase/(decrease) in the fair value or our top 20 cases (including Cartel cases) would result in an increase/(decrease) in the fair value investment of +/- £1.9m.
Currency risk
The Company is not exposed to any currency risk at present.
28. Related party transactions
Director and key management remuneration is disclosed in Note 5.
Dividends of £36,251 were paid to the directors during the year based on their individual shareholdings disclosed in the Remuneration Committee report as follows:
|
31 March 2023 £000s |
31 March 2022 £000s |
|
|
Steven Cooklin |
34 |
95 |
|
Mark Tavener |
- |
- |
|
Lord Howard Leigh |
1 |
1 |
|
Mena Halton |
1 |
- |
|
Stephen Baister |
- |
0.5 |
|
Total dividends paid to the directors |
36 |
97 |
29. Ultimate controlling party
The Company has no ultimate controlling party.
30. Restatement of Statement of Financial position
The contract asset and contract liability balances relate to the discount unwinding on the present value of the receivable and accrued IP costs from the large case that completed in FY21. Following a review of the contractual terms of the contract balance and contract liability, the directors concluded that these balances should have been presented as long term. The adjustments to the Statement of Financial Position as at 31 March 2021 and 31 March 2022 are shown below. This had no impact upon the Statement of Comprehensive Income, Statement of Changes in Equity or Statement of Cash Flows in the current or prior financial year.
Statement of Financial Position as at 31 March 2022
|
Previously reported at 31 March 2022 |
Adjustment |
As restated at 31 March 2022 |
|
|
£000s |
£000s |
£000s |
|
|
Non-current assets |
|||
|
Trade and other receivables |
11,086 |
1,245 |
12,331 |
|
Current assets |
|||
|
Trade and other receivables |
9,189 |
(1,245) |
7,944 |
|
Non-current liabilities |
|||
|
Trade and other payables |
6,853 |
846 |
7,699 |
|
Current liabilities |
|||
|
Trade and other payables |
5,594 |
(846) |
4,748 |
Statement of Financial Position as at 31 March 2021
|
Previously reported at 31 March 2021 |
Adjustment |
As restated at 31 March 2021 |
|
|
£000s |
£000s |
£000s |
|
|
Non-current assets |
|||
|
Trade and other receivables |
10,660 |
431 |
11,091 |
|
Current assets |
|||
|
Trade and other receivables |
7,688 |
(431) |
7,257 |
|
Non-current liabilities |
|||
|
Trade and other payables |
6,602 |
291 |
6,893 |
|
Current liabilities |
|||
|
Trade and other payables |
3,565 |
(291) |
3,274 |