
SUPERMARKET INCOME REIT
(the "Group" or the "Company")
AUDITED RESULTS FOR THE YEAR ENDED 30 JUNE 2024
STABLE VALUATIONS AND STRONG BALANCE SHEET UNDERPIN CAPACITY TO PURSUE ACCRETIVE ACQUISITIONS AND DRIVE EARNINGS GROWTH
The Board of Directors of Supermarket Income REIT plc (LSE: SUPR), the real estate investment trust with secure, inflation-linked, long-dated income from grocery property, reports its audited consolidated results for the Group for the year ended 30 June 2024.
FINANCIAL HIGHLIGHTS
|
12 months to 30-June-24 |
12 months to 30-June-23 |
Change |
|
|
Annualised passing rent1 |
£113.1m |
£100.6m |
+12% |
|
Adjusted earnings per share1 |
6.1 pence |
5.8 pence |
+4% |
|
IFRS earnings per share |
(1.7) pence |
(11.7) pence |
+85% |
|
Dividend per share declared |
6.1 pence |
6.0 pence |
+1% |
|
Dividend cover2 |
1.01x |
0.97x2 |
n/a |
|
EPRA cost ratio1 |
14.7% |
15.5% |
n/a |
|
30-June-24 |
30-June-23 |
Change |
|
|
Portfolio valuation |
£1,776m |
£1,693m |
+5% |
|
Portfolio net initial yield1 |
5.9% |
5.6% |
n/a |
|
EPRA NTA per share1 |
87 pence |
93 pence |
-6% |
|
IFRS NAV per share |
90 pence |
98 pence |
-8% |
|
Loan to value1 |
37% |
37% |
n/a |
Secure and growing income
· 12% increase in annualised passing rent to £113.1 million, reflecting:
o 4% average like-for-like rental uplift
o Accretive acquisitions in the year
· 100% occupancy and 100% rent collection since IPO
o 75% of rental income from Tesco and Sainsbury's
· 4.4% increase in adjusted EPS to 6.08 pence driven by rental growth and accretive acquisitions
· Fully covered FY24 dividend
· FY25 target dividend increased to 6.12 pence per share
Earnings accretive acquisitions
· Acquired 20 assets in UK and France for £135.8 million before costs at an average NIY of 6.7% (UK: 7.0%, France: 6.3%)
· Earnings growth further supported through maintaining tight control of costs, achieving an EPRA cost ratio of 14.7% with further cost efficiencies targeted in FY25
Strong grocery sector growth
· UK grocery market sales forecast to increase by 5.8% to £251.6 billion in 20243
o Tesco and Sainsbury's increased sales and market share in the year with a combined 43% market share4
o Online market share at 12% and growing following post pandemic reset4
· French grocery market sales forecast to increase by 2.1% to €290 billion in 20245
o Carrefour has a 19.6% market share in France6
o Carrefour is targeting 3x online sales growth to €10 billion by 2026 (base year: 2021)7 with its online grocery channel forecast to grow 8.25% in 20248
o Online market share is currently at 10% and is one of the fastest growing channels9
Strategic transaction with Carrefour
· One of the largest grocery operators in the world
· Investment grade rated (BBB)10
· Acquisition of 17 omnichannel Carrefour stores in relationship led sale and lease back transaction for a consideration of €75.3 million before costs
· Acquired at a 6.3% NIY versus 4.4% funding cost
· Carrefour's second ever sale and lease back transaction in France and first in 12 years
· Carrefour now represents 4% of portfolio GAV
· Highly affordable rents with uncapped inflation linked uplifts11
Supermarket property valuations stabilised
· Portfolio independently valued at £1.78 billion, inclusive of acquisitions of £135.8 million
· Net Initial Yield ("NIY") of 5.9% (30 June 2023: 5.6%)
· Following a decline in valuations in 2023, like-for-like valuations were broadly flat in H2, up 0.1%
· Strong level of transactional activity across the sector with return of traditional institutional participants to the market
· Operator store buybacks, particularly Tesco, demonstrating mission critical nature of large format stores
Proactively managing balance sheet
· LTV of 37% as at 30 June 2024 (30 June 2023: 37%)
· Strong debt covenant headroom supporting acquisition led growth
· 100% of drawn debt fixed or hedged at a weighted average finance cost of 3.8%, including post balance sheet events (30 June 2023: 3.1%)
· Fitch BBB+ investment grade rating reaffirmed providing access to attractively priced long-dated debt
· New £104.5 million unsecured facility with SMBC at a weighted average margin of 1.45% with a maturity of three-years and two one-year extension options
· Post balance sheet:
o New £100 million unsecured facility with ING at a margin of 1.55% over SONIA with a maturity of three years and two one-year extension options
o Oversubscribed 7-year Euro private placement at 4.4% fixed all-in cost, providing natural currency hedge for Carrefour portfolio acquisition
Further progress on key sustainability initiatives
· EV charging operational at 30% of sites and solar arrays across 20% of stores
· Science Based Targets validated and approved by the Science Based Targets initiative including a commitment to reach net zero by 2050
· Strong tenant net zero commitments driving significant tenant capital expenditure on stores
· Prepared and submitted EPRA Sustainability Best Practices Recommendations disclosures for the first time
Nick Hewson, Chair of Supermarket Income REIT plc, commented:
"The Company's operational performance has been resilient with 100% occupancy and 100% rent collection despite the broader market and macro-economic challenges of the past years. We have taken a disciplined approach to capital deployment and have recently begun to see opportunities to add accretive acquisitions in the UK and France. We continue to monitor opportunities to recycle capital via asset sales and joint ventures.
Looking ahead, we remain optimistic that the improving interest rate environment should provide positive tailwinds for the Company. We are pleased to recommend another increased dividend of 6.12 pence per share for FY25 and remain focused on delivering a progressive dividend for shareholders."
PRESENTATION FOR ANALYSTS
The Company will be holding an in-person presentation for analysts at 08.30am today at FTI Consulting's offices, 200 Aldersgate, Aldersgate Street, London, EC1A 4HD. To register to attend in-person, please contact FTI Consulting: SupermarketIncomeREIT@fticonsulting.com. There will also be a webcast available. To join the presentation via the webcast, please register using the following link:
Supermarket Income REIT - Full Year Results Presentation 2024 | SparkLive | LSEG
The results presentation is available in the Investor Centre section of the Group's website.
|
FOR FURTHER INFORMATION |
|
|
Atrato Capital Limited |
+44 (0)20 3790 8087 |
|
Rob Abraham / Mike Perkins / Chris McMahon |
|
|
Stifel Nicolaus Europe Limited |
+44 (0)20 7710 7600 |
|
Mark Young / Rajpal Padam / Madison Kominski |
|
|
Goldman Sachs International Tom Hartley / Hannah Mackey |
+44 (0)20 7774 1000 |
|
FTI Consulting |
+44 (0)20 3727 1000 |
|
Dido Laurimore / Eve Kirmatzis / Andrew Davis |
NOTES TO EDITORS:
Supermarket Income REIT plc (LSE: SUPR) is a real estate investment trust dedicated to investing in grocery properties which are an essential part of the feed the nation infrastructure. The Company focuses on grocery stores which are omnichannel, fulfilling online and in-person sales. The Company's supermarkets are let to leading supermarket operators in the UK and Europe, diversified by both tenant and geography.
The Company's assets earn long-dated, secure, inflation-linked, growing income. The Company targets a progressive dividend and the potential for capital appreciation over the longer term.
The Company is listed on the Closed-ended investment funds category of the FCA's Official List and its Ordinary Shares are traded on the LSE's Main Market.
Atrato Capital Limited is the Company's Investment Adviser.
Further information is available on the Company's website www.supermarketincomereit.com
LEI: 2138007FOINJKAM7L537
Stifel Nicolaus Europe Limited, which is authorised and regulated in the United Kingdom by the Financial Conduct Authority, is acting exclusively for Supermarket Income REIT plc and no one else in connection with this announcement and will not be responsible to anyone other than the Company for providing the protections afforded to clients of Stifel Nicolaus Europe Limited nor for providing advice in connection with the matters referred to in this announcement.
Goldman Sachs International, which is authorised by the Prudential Regulation Authority and regulated by the Financial Conduct Authority and the Prudential Regulation Authority in the United Kingdom, is acting exclusively for Supermarket Income REIT plc and no one else in connection with this announcement and will not be responsible to anyone other than the Company for providing the protections afforded to clients of Goldman Sachs International nor for providing advice in connection with the matters referred to in this announcement.
CHAIR'S STATEMENT
Dear Shareholder,
I am pleased to report another resilient year for the Company. Occupancy on our portfolio of grocery stores was 100%, as was rent collection, and indeed annualised passing rent grew year on year by 12%, due to accretive acquisitions and inflation protection in over 80% of our leases. Our vigilance on our cost base was again notable and we have one of the lowest EPRA cost ratios of our peers. We expect our cost ratio to reduce over the next 12 months as we focus on further operational efficiencies across the business. Once again, we are benefitting from our interest rate hedging strategy and we expect the interest rate backdrop to be more supportive from this point in the cycle.
All of this is permitting us to recommend a further, if modest, increase to our dividend for the coming year to 6.12 pence per share (2024: 6.06 pence per share). This is in the context of our stated aim to deliver sustainable, long-term, growing income from the grocery real estate industry. The last three years have seen some challenging macroeconomic headwinds but we have weathered the storm and increased the dividend every year. We believe we have now seen the worst of it. Our job is to maximise our earnings and continue to increase the dividend on a covered basis, and benefit from the inherent affordability of the rents our grocery tenants pay us.
The background to the challenging nature of the last three years has been the fact that we have all had to get used to operating in a higher interest rate environment compared to that in the 2010s. Those higher interest rates seem to have peaked during the summer of 2023, with 5-year swap rates exceeding 5% in July 2023. At that time, the Company prudently paid down debt to run at a lower LTV of 33%. This strategically conservative approach to leverage has, however, meant that 2024 earnings growth has been modest. On the other hand, we believe that property valuations reached a floor in December 2023. Consequently, we have been confident in 2024 to increase leverage, including through our oversubscribed debut Private Placement debt issuance, to help drive earnings growth through acquisitions which will benefit future years.
In growing through acquisitions, the Investment Adviser's position as a sector specialist gives the Company unique access to off-market opportunities to acquire these assets at yields which are above the cost of our debt financing. We have been highly selective in our acquisitions and maintain our focus of investing in top trading omnichannel stores let to the strongest grocery operators.
While continuing to pursue our core UK strategy, we have also sought to broaden our investible universe and enhance the diversity and covenant strength of our tenant base through a highly selective expansion into Europe.
In April, we made our first investment into the €290 billion French grocery sector with an off-market, direct sale and leaseback of 17 omnichannel stores with Carrefour. The transaction was the culmination of over 12 months of discussions, leveraging the Investment Adviser's deep grocery expertise and long-standing sector relationships. This was Carrefour's first sale and leaseback in France in 12 years and underlines the Company's credentials as a trusted and expert counterparty.
The transaction highlights the attractive opportunities to acquire and finance omnichannel supermarkets let to high-quality covenants with highly affordable rents in Europe. The acquisition was made at a 6.3% net initial yield and financed at an accretive 4.4% fixed cost of funding in Euros. However, this was a tentative exploration into non-UK property assets, representing some 4% of the portfolio.
We continue to see interesting opportunities such as this and if we decide to increase further our exposure to continental European grocery assets, we will first consult with shareholders and seek shareholder approval to revise our Investment Policy accordingly.
Our thesis at IPO in 2017 was focussed on the mission critical nature of omnichannel stores as last mile fulfilment hubs and the long-term attractiveness of owning these infrastructure-like assets. This thesis is as valid as ever in 2024 in both the UK and France.
The strong performance of the UK and French grocery sectors and our omnichannel stores within them means our stores benefit from higher sales densities. This ensures rents remain affordable for our tenants. Rent to Turnover ("RTO") at store level is the key affordability measure in the sector. The Company's UK portfolio is at an average 4% RTO which is in-line with the long-standing industry standard level for high-quality stores.
The discount to EPRA NTA at which the Company's shares have traded through the year is a frustration for the Board and closing this discount is a key focus for the Company. We continually review how best to allocate our shareholders' capital. The Board believes that over the medium term, earnings growth and the sustainability of the dividend will serve to narrow the discount. We are also focused on capital recycling opportunities through the sale of individual stores or larger JV opportunities.
We regularly assess the use of share buybacks and at a certain price and in sufficient quantity they make mathematical sense if one can achieve both at the same time. However, the Board has given the Investment Adviser a mandate to achieve growth, on the basis that growing earnings through a selective approach to acquisitions will generate a higher return than that offered by share buybacks over the medium to long term. This position has remained under continuous review over the past year and will continue to be debated while our shares trade at a discount to EPRA NTA.
I am particularly pleased this year with the progress being made on the Company's sustainability activities. A key milestone has been achieved with the validation and approval of the Company's science-based targets by the Science Based Target initiative ("SBTi"). We have also seen the continued addition of EV charging and solar panels at a number of our stores. Our tenants have also made ambitious net zero commitments and a benefit of owning mission critical real estate is the continuing capital expenditure our tenants make into our stores to meet their own commitments particularly in the area of refrigeration. Our Task Force on Climate-Related Financial Disclosures ("TCFD") compliant annual report is accompanied by our second standalone sustainability report published today. The Company has prepared EPRA Sustainability Best Practices Recommendations ("sBPR") disclosures for the first time and is also currently preparing its first net zero transition plan.
In the coming months we also expect to proceed with a secondary listing on the Johannesburg Stock Exchange ("JSE"). Based on positive investor feedback following a non-deal roadshow undertaken in February 2024, we believe that the secondary listing will help improve trading liquidity and the diversity of our shareholder base. Such listings require minimal additional reporting and have relatively low ongoing costs to maintain. I look forward to welcoming South African investors to the shareholder register and in time we hope that these investors will grow to represent a strong and supportive addition to the Company's register.
As part of Board's succession planning, we appointed Sapna Shah as head of the Nominations Committee and as Senior Independent Director ("SID"). She, along with the other members of the Nominations Committee, will be determining the process for identifying and recruiting three new NEDs over the coming two years including a new Audit Chair and a new Chair. We thank Vince Prior for his service as Chair of the Nominations Committee and SID.
Outlook
In the context of the recently challenging macro headwinds, we can now begin to consider the possibility of a more favourable interest rate environment. Market expectations of modest interest rate cuts over the coming months, albeit not returning to the levels of the 2010s, provide confidence that we have now seen the floor in this current cycle. We have a balance sheet and asset portfolio which will enable us to deliver sustainable, long-term, earnings growth even at these new 'normal' interest rate levels. I am hopeful that as the equity markets re-focus on the attractiveness of real estate, the quality of our assets and the secure nature of our growing income stream will once again be recognised.
In the meantime, due to our sector specialism, we continue to be able to selectively add attractive assets to our portfolio to grow earnings and ultimately dividend. Due to the prudent steps taken to run lower leverage throughout 2023, the Company has had the balance sheet capacity during 2024 to take advantage as these opportunities arise. Earnings will also be enhanced through our programme of even stricter cost control delivering a low EPRA cost ratio of 14.7% which we expect to reduce further over the next 12 months, in search of our goal to be the company with the lowest EPRA cost ratio of our externally managed peers.
Nick Hewson
Chair
17 September 2024
A conversation with Justin King about the future of the UK grocery sector
Justin King is a senior adviser to Atrato Capital, the Group's Investment Adviser. Justin is recognised as one of the UK's most successful grocery sector leaders, having served as CEO of Sainsbury's for over a decade and previously held senior roles at Marks & Spencer, Asda, PepsiCo and Mars.
He is currently Non-Executive Director of Marks & Spencer and Chairman of Allwyn Entertainment which operates the National Lottery licence, Ovo Energy and Dexters, London's leading estate agent. Justin also advises a series of high-profile consumer-focused companies including Itsu Grocery and Snappy Shopper. Justin is an advocate for responsible business, has been instrumental in launching several charitable concerns including the charity Made by Sport, which championed the power of sport to change young lives. Justin brings an unrivalled wealth of grocery sector experience and a deep understanding of grocery property strategy.
Question 1: The Carrefour sale and leaseback provided a unique entry point into the French grocery market. Do you consider this this market to be very different to the UK market?
It's less different than many think! It's a significant €290 billion market12, with supermarkets being the most dominant channel and the four top grocers holding over 70% of the market. Just like the UK, this operator concentration has been achieved through very well-located shops, great customer service, well-developed supply chains and an increasing focus on omnichannel business models.
Carrefour is one of the largest grocers in the world, has a 19.6%13 share of the French grocery market and provides an excellent addition to SUPR's portfolio, further diversifying its tenant mix. So, taken all together, the transaction capitalises on the opportunity to leverage the Company's grocery specialism in generating attractive investment prospects whilst also being highly complementary to the existing portfolio and strategy.
Of course, entering any new market comes with risk. I believe an essential component to managing that risk is through developing strong partnerships with leading operators. It is noteworthy that Atrato has entered this market via a direct sale and leaseback with Carrefour, benefiting from the insights derived from this relationship-based model which has always been a core part of the Company's strategy.
Question 2: You mention the benefits of leveraging sector specialism. How important do you think Atrato's deep knowledge of the omnichannel model will be when considering investing in grocery property markets like France?
Firstly, it's important to remember that the UK's grocers were early pioneers in online grocery, resulting in one of the highest penetration rates for online grocery sales globally. This success was driven by an early transition to multi-channel stores which have been able to provide seamless integration between online and offline channels. I think it's fair to say that operators across the world have long looked at the UK as a template and we are seeing a global convergence to the omnichannel model.
SUPR is the largest landlord of omnichannel grocery stores in the UK. That makes the Company an attractive property partner for grocers looking to capitalise on the online opportunity thorough transitioning toward omnichannel trading strategies. It also provides a valuable pathway to source attractive future investment opportunities.
Carrefour's objective of growing its omnichannel customer base to 30% and online sales to €10 billion annually by 202614 is a clear recognition of the additional value to be captured through leveraging its supermarket estate and I know this was a key consideration in Carrefour selecting SUPR as its partner in the sale and leaseback transaction.
Question 3: How should the market think about affordability of rent on grocery property and how that impacts market rents in particular?
For grocery operators, a key metric for determining the affordability of rent is the ratio of rent to store turnover, with c.4% being the long-standing industry benchmark in the UK. This equates to roughly two weeks of store sales and is considered affordable by operators, comparing favourably to other asset classes such as retail parks at c.12%, hotels at c.20% and shopping centres at c.25%.
Whilst it's important to note that the grocery sector has lower margins than some of these comparable retail or leisure sectors, it is also important to note that typical EBITDAR margins at the store level are around 12%. This provides approximately 3x cover of rent at the market standard rent to turnover, which makes rents highly sustainable at that level.
Currently, SUPR's portfolio sits at c.4% rent to turnover and is therefore considered to be approximately rack rented from a UK grocery property perspective.
I believe the affordability of rent is one of the reasons that supermarket property investment performance over the last 15 years has been a stand-out positive performer relative to other asset classes despite multiple periods of macro-economic uncertainty. Having said that, not all supermarket property is equal and specialists like the Atrato Capital team are essential to ensure the right asset selection for the long term.
Question 4: Like-for-like sales growth in 2024 is lower than 2023 with staffing costs rising, does this signal margin pressure for the multichannel grocers?
A key point here is that disinflation rather than deflation is taking effect across the grocery sector - prices are rising more slowly, rather than falling. In the four weeks to July 2024, the rate was 1.6%, the lowest rate since September 2021 and far below the recent peak of 19.0% seen in March last year. Against that backdrop, like-for-like sales growth will be naturally subdued verses the inflation-fuelled comparatives.
However, living standards for the average customer are gradually improving, with wage growth outpacing price inflation for several quarters, which will in turn feed both enhanced sales volumes and improved product mix for the grocers. We are clearly seeing the benefits of that in the latest grocery market share data with Tesco and Sainsbury's capturing a further 100bps combined market share over their rivals and reaffirming their profit targets.
This is why traditional grocers carry an extensive range and mix in their supermarkets to cater for the changing needs and buying trends of the customers' shopping basket and that customer focus has sustained the success of the grocers for the last 100 years
KEY PERFORMANCE INDICATORS
We set out below our key performance indicators for the Company.
|
KPI |
Definition |
Performance |
|
1. Total Shareholder Return |
Shareholder return is one of the Group's principal measures of performance. Total Shareholder Return ("TSR") is measured by reference to the growth in the Group's share price over a period, plus dividends declared for that period. |
8% for the year to 30 June 2024 |
|
2. WAULT |
WAULT measures the average unexpired lease term of the Property Portfolio, weighted by the Portfolio valuations. |
12 years WAULT as at 30 June 2024 (31 December 2023: 13 years, 30 June 2023: 14 years) |
|
3. EPRA NTA per share |
The value of our assets (based on an independent valuation) less the book value of our liabilities, attributable to Shareholders and calculated in accordance with EPRA guidelines. EPRA states three measures of NAV to be used; of which the Group deem EPRA NTA as the most meaningful measure. See Note 27 for more information. |
87 pence per share as at 30 June 2024 (31 December 2023: 88p, 30 June 2023: 93p) |
|
4. Net Loan to Value |
The proportion of our Portfolio gross asset value that is funded by borrowings calculated as balance sheet borrowings less cash balances divided by total investment properties valuation. |
37% as at 30 June 2024 (31 December 2023: 33%, 30 June 2023: 37%) |
|
5. Adjusted EPS* |
EPRA earnings adjusted for company specific items to reflect the underlying profitability of the business. |
6.1 pence per share for the year ended 30 June 2024 (31 December 2023: 2.9p, 30 June 2023: 5.8p) |
Adjusted earnings is a performance measure used by the Board to assess the Group's financial performance and dividend payments. The metric adjusts EPRA earnings by deducting one-off items such as debt restructuring costs and adding back finance income on derivatives held at fair value through profit and loss. Adjusted Earnings is considered a better reflection of the measure over which the Board assesses the Group's trading performance and dividend cover. Finance income received from derivatives held at fair value through profit and loss are added back to EPRA earnings as this reflects the cash received from the derivative hedges in the period and therefore gives a better reflection of the Group's net finance costs. Debt restructuring costs relate to the acceleration of unamortised arrangement fees following the refinancing of the Group's debt facilities during the year.
Adjusted EPS reflects the adjusted earnings defined above attributable to each shareholder.
The Group uses alternative performance measures including the European Public Real Estate ("EPRA") Best Practice Recommendations ("BPR") to supplement its IFRS measures as the Board considers that these measures give users of the annual report and financial information the best understanding of the underlying performance of the Group's property portfolio. The EPRA measures are widely recognised and used by public real estate companies and investors and seek to improve transparency, comparability and relevance of published results in the sector.
Reconciliations between EPRA measures and the IFRS financial statements can be found in Notes 11 and 27 to the financial information.
EPRA PERFORMANCE INDICATORS
The table below shows additional performance measures, calculated in accordance with the Best Practices Recommendations of the European Public Real Estate Association. We provide these measures to aid comparison with other European real estate businesses.
For a full reconciliation of all EPRA performance indicators, please see the Notes to EPRA measures within the supplementary section of the financial information.
|
Measure |
Definition |
Performance |
|
1. EPRA EPS |
A measure of EPS designed by EPRA to present underlying earnings from core operating activities. |
4.3 pence per share for the year ended 30 June 2024 (30 June 2023: 4.6p) |
|
2. EPRA Net Reinstatement Value ("NRV") per share |
An EPRA NAV per share metric which assumes that entities never sell assets and aims to represent the value required to rebuild the entity. |
97 pence per share as at 30 June 2024 (30 June 2023: 103p) |
|
3. EPRA Net Tangible Assets ("NTA") per share |
An EPRA NAV per share metric which assumes entities buy and sell assets, thereby crystallising certain levels of unavoidable deferred tax. |
87 pence per share as at 30 June 2024 (30 June 2023: 93p) |
|
4. EPRA Net Disposal Value ("NDV") per share |
An EPRA NAV per share metric which represents the Shareholders' value under a disposal scenario, where deferred tax, financial instruments and certain other adjustments are calculated to the full extent of their liability, net of any resulting tax. |
90 pence per share as at 30 June 2024 (30 June 2023: 98p) |
|
5. EPRA Net Initial Yield ("NIY") & EPRA "Topped-Up" Net Initial Yield |
Annualised rental income based on the cash rents passing at the balance sheet date, less non-recoverable property operating expenses, divided by the market value of the property, increased with (estimated) purchasers' costs. |
5.9% as at 30 June 2024 (30 June 2023: 5.5%) |
|
6. EPRA Vacancy Rate |
Estimated Market Rental Value ("ERV") of vacant space divided by ERV of the whole portfolio. |
0.5% as at 30 June 2024 (30 June 2023: 0.4%) |
|
7. EPRA Cost Ratio (Including direct vacancy costs) |
Administrative & operating costs (including costs of direct vacancy) divided by gross rental income. |
14.7% for the year ended 30 June 2024 (30 June 2023: 15.5%) |
|
8. EPRA Cost Ratio (Excluding direct vacancy costs) |
Administrative & operating costs (excluding costs of direct vacancy) divided by gross rental income. |
14.4% for the year ended 30 June 2024 (30 June 2023: 15.2%) |
|
9. EPRA LTV |
Net debt divided by total property portfolio and other eligible assets. |
38.8% as at 30 June 2024 (30 June 2023: 35.2%) |
|
10. EPRA Like-for-like Rental Growth |
Changes in net rental income for those properties held for the duration of both the current and comparative reporting period. |
Rental increase of 2.1% for the year ended 30 June 2024 (30 June 2023: 2.7%) |
|
11. EPRA Capital Expenditure |
Amounts spent for the purchase and development of investment properties (including any capitalised transaction costs). |
£146.2 million for the year ended 30 June 2024 (30 June 2023: £377.3 million) |
INVESTMENT ADVISER'S REPORT
Atrato is the Company's Investment Adviser. Ben Green (Principal) and Robert Abraham (Fund Manager) discuss SUPR's performance and the long-term outlook for the business.
SUPR's performance remains strong at the operational level
The Company's operational performance remains strong. It has been another year in which SUPR has achieved 100% rent collection and 100% occupancy from its tenant base of leading supermarket operators. Coupled with this, the Company has achieved 4.0% like-for-like rental growth on leases that have been subject to review in the year, driven by inflation-linked contractual uplifts.
Our key tenants continue to perform strongly with impressive revenue growth. This is particularly true of the types of the omnichannel stores that SUPR owns in the UK and France. Sainsbury's and Tesco, which represent 77% of the portfolio by value have reported like-for-like sales growth of 10.3%15 and 7.7%16 respectively in their full year results. They reported even higher sales growth figures from their large format stores, like those owned by SUPR, up by 11.0%15 and 8.2%16 respectively. Importantly, such revenue growth remains ahead of rental increases, which ensures that rents remain affordable. Our newest tenant Carrefour has also performed strongly in its home market in France with ROI margins up 6.2%17, underpinned by accelerated price investments which have been more than offset by cost discipline.
Proactively positioning SUPR for a higher interest rate world
Our strong operational performance has been largely offset by higher financing costs due to the higher interest rate environment and our decision to reduce leverage. This has led to lower earnings growth and only a modest increase in dividend as we and the Board seek to position SUPR with a sustainable, long-term, progressive dividend.
We took two key steps to position the Company for a higher interest rate world. First, we fixed SUPR's cost of debt through the period of highest expected interest rates. Second, we recycled the proceeds from the final tranche of the Sainsbury's Reversion Portfolio disposal in July 2023 into reducing debt.
Through the second half of the year, as debt costs reduced, we had the opportunity to grow earnings through accretive acquisitions. As a result of the prudent actions taken to protect the balance sheet the Company has been in a strong position to take advantage of these opportunities.
Taken together with our contracted rental growth and rigorous cost control, we have positioned SUPR to deliver a sustainable, progressive dividend in the new higher interest rate environment.
In our view, valuations have bottomed out
We saw a valuation decline as at the December balance sheet date due to the impact on the grocery property market of higher interest rate expectations. The sterling 5-year swap rate peaked in July 2023 and this negatively impacted the investment market in the first half of our financial year.
Valuations held flat over the second half of the year with the market now having adjusted to expectations of a long-term UK base rate of around 3.5%. Investment returns at current market yields look attractive, particularly when considering the defensive characteristics of grocery.
We have observed a similar dynamic in the French market with reducing interest rate pressure and valuations at the bottom of the cycle.
We are of the view that the next movement in valuations, when it comes, should be positive.
Supermarket rents, affordability and ERVs
Within the UK supermarket sector, 4% rent to turnover is seen as the affordable rental level that operators are willing to pay to secure long-term occupation for strong trading stores.
Increasing store turnover, has improved the affordability of supermarket rents and has resulted in SUPR's portfolio having a ratio of 4% RTO.
Our view is that the valuers systematically underestimate the rents that UK grocers are willing to pay to secure trading from a site. This is important for two reasons. First, it provides us with value opportunities at the point of acquisition because vendors often underestimate rental potential. Second, we believe that there is significant embedded value in the Portfolio which is not reflected in the valuation or the NAV.
A detailed case study on this topic is available on pages 30 to 32.
Valuation yield metrics for the SUPR portfolio
|
Measure |
Jun-23 |
Dec-23 |
June-24 |
|
Portfolio |
|||
|
NIY |
5.6% |
5.8% |
5.9% |
|
UK supermarkets |
|||
|
NIY |
5.4% |
5.7% |
5.8% |
|
NRY |
4.6% |
5.0% |
5.1% |
|
NEY |
5.5% |
5.7% |
5.8% |
The Net Reversionary Yield ("NRY") provided by our valuer for our UK supermarkets applies an average ERV of £22 per square foot ("per sq.ft.") to SUPR's portfolio which is broadly in-line with the UK average.
In practice we expect our leases to be extended (regeared) prior to expiry and at a level which would be higher than this average, due to the strong performing nature of the stores owned by SUPR.
Assuming UK supermarket rents regeared to 4% of turnover it would produce an NRY closer to the 5.9% current NIY on the portfolio, demonstrating the potential reversionary upside that can be achieved on the portfolio.
As an off-market sale and leaseback transaction, our Carrefour rents are set at 2.1% RTO, versus the average of 2.5% in France.
Attractiveness of French grocery market and Carrefour
The Company's entry into the €290 billion French grocery market18 was the most strategically significant development of the year.
The European grocery property market provides the Company the opportunity to benefit from a diversification of the portfolio, an increased exposure to investment grade tenant covenants and lower cost of financing. Due to the size of the European market, we can be highly selective in assessing investment opportunities.
The French market has attractive similarities to the UK. Supermarkets are the primary grocery sales channel and the French market is dominated by a small number of operators. France also has Europe's largest online grocery market, which is primarily serviced by an omnichannel store network and is growing rapidly.
Carrefour is one of the largest grocery operators in the world with forecast annual global sales of €100.4 billion in 202419. In France, Carrefour holds a similar position to Sainsbury's in the UK as the second largest operator with 19.6% of grocery sales20. As part of its 2026 strategic plan outlined in 2022, Carrefour has set ambitious online growth targets to increase online sales to 30% of total sales by 2026, and its online channel is forecast to grow by 8.25% in 202421.
Growing earnings through highly selective, accretive acquisitions
1) First international acquisition via a sale and lease back transaction with Carrefour
In April 2024, SUPR acquired a sale and leaseback portfolio of 17 strong trading omnichannel stores in France through a direct transaction with Carrefour.
The stores were selected based on a detailed analysis including trading performance, local demographics and competition. The stores have highly affordable rents and were acquired at an attractive 6.3% NIY.
The transaction was financed through an existing revolving credit facility with HSBC, and post period end was refinanced via a Euro denominated private placement at a cost of 4.4%. The positive cash yield is accretive to the portfolio and supportive of earnings growth through long-term, index-linked leases. A case study on the transaction is provided on pages 20 to 22.
We were able to leverage our deep sector relationships and reputation as a trusted counterparty to leading grocery operators, to work with Carrefour on this off-market transaction. This was only the second ever sale and leaseback transaction conducted by Carrefour in France, and the first in 12 years.
2) The continued attractiveness of the UK, albeit a reduced addressable market
With the UK grocery market continuing to perform strongly, we see attractive opportunities in the UK supermarket space, albeit now focused on Tesco and Sainsbury's due to comparatively less attractive covenants of the more highly leveraged multichannel operators, Asda and Morrisons.
In the UK we have focused on shorter lease assets, particularly those which we view as being mispriced by the market due to an underestimation of affordable market rent. The target assets are let to strong tenant covenants (i.e., Tesco or Sainsbury's), with an attractive yield providing an accretive spread to the current cost of debt. These opportunities are currently more accretive to earnings than longer lease, rack rented assets, which are currently pricing more keenly. An example transaction is Tesco Stoke, acquired in March 2024 and on which there is a case study on pages 16 to 17.
A tale of two halves for the UK investment market, while operator activity across both sale and leaseback and store buybacks has been prominent
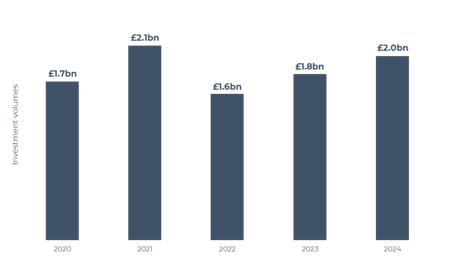
Investment market volumes for the 12 months remained broadly in line with the £1.7 billion average since the Company's IPO, as liquidity for the asset class remains strong. Unlike other sectors which have seen volumes fall away in a higher interest rate environment, through rapid repricing and continued investor demand, supermarket volumes have remained consistent. Supermarkets are a defensive asset class with investment appetite from a broad range of purchasers from institutions through to high net worth individuals.
5 yearly supermarket investment volumes22
We are however beginning to see more limited supply - particularly of stock in the UK which is suitable for SUPR in terms of being accretive to the cost of debt and therefore to earnings, whilst maintaining tenant quality.
2024 transactions breakdown22
|
Vendors |
Value (£m) |
Purchasers |
Value (£m) |
||||||
|
Asda |
650 |
Realty Income Corporation |
825 |
||||||
|
Morrisons |
196 |
Tesco Plc |
127 |
||||||
|
Abrdn |
162 |
M&G |
125 |
||||||
|
Lothbury IM |
133 |
ICG |
103 |
||||||
|
Waitrose |
125 |
MDSR |
98 |
||||||
|
Other |
723 |
Other |
711 |
||||||
|
Total |
1,989 |
Total |
1,989 |
||||||
In the UK, the two largest sellers of assets during the year were operators. Asda (£650 million) and Morrisons (£196 million) both sold stores to Realty Income, subject to 20-year inflation linked leases. Waitrose also undertook a £125 million sale & leaseback with M&G. Each of these transactions attracted a lot of institutional interest. Asda and Morrisons also separately sold off their petrol forecourts to reduce leverage. We believe that the capital raised in these processes makes further significant sale and leaseback activity from these operators unlikely.
Tesco spent £127 million during the year buying back stores, including a 111,000 sq.ft. store in Sutton Coldfield for c.£40 million - a large format omnichannel store, highlighting the strategic importance of such assets. We continue to see Tesco selectively participate in the investment market, depending on capital made available to the property team at any given time. Our tenants' competing demands for capital dictate their level of activity in the buyback market - this means that we continue to be able to buy some of Tesco's best performing stores. However, we do have the risk of a shrinking opportunity, as each store bought back by an operator is unlikely to return to the leasehold market in the future.
In addition to M&G, this year has also seen the return of other traditional institutional supermarket landlords as buyers in L&G (£46 million), Abrdn (£18 million), and DTZ Investors (£56 million).
Investment volumes in France were below average in 2023 totalling €320 million. However, volumes in H1 2024 reached €306 million which is a 135% increase year-on-year and 13% ahead of average since H1 2014. New retail development is at a 20 year low, a trend which we think will continue due to the net artificialisation (ZAN) of land by 2050. We expect a shift towards redevelopment of existing assets into mixed-use spaces rather than new developments. This will therefore reduce the amount of retail space making existing assets more valuable.
Tight control of costs delivering one of the lowest EPRA cost ratios in the sector
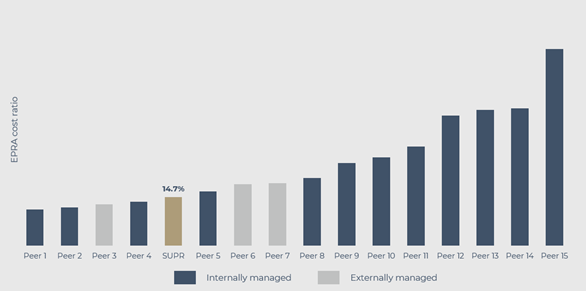
In seeking to drive earnings growth we also maintain a tight control of costs. The Company's cost base is already one of the lowest across FTSE 350-listed REITs, with an EPRA cost ratio of 14.7% and is targeting a lower EPRA cost ratio in the coming year, in line with our goal of having the lowest cost ratio amongst the externally managed FTSE 350-listed REITs.
EPRA cost ratios (including direct vacancy costs): FTSE 350-listed REITs23
Defensive nature of supermarket real estate continues to prove attractive to debt markets
During the year we agreed new debt facilities with SMBC of £104.5 million. Post balance sheet we agreed a new £100 million unsecured facility with ING and a private placement of €83 million loan notes at an all in fixed cost of 4.4% for seven years.
Both of the bank facilities are attractively priced at an average margin of 1.5% over SONIA. We have fully fixed the cost of these financings through hedging.
The cost of the private placement is fixed at 4.4% and is highly attractive when compared to the yield on our French supermarket assets. In addition, the Euro denomination provides a natural hedge for the Company's investment in the Carrefour portfolio acquisition in France.
These transactions, along with our BBB+ Fitch rating, underscore the Company's strong balance sheet, high-quality assets and tenants and our ongoing ability to secure debt from financially strong international lenders.
The ability to raise debt has allowed the Company to cautiously increase leverage up to 37% to enable it to take advantage of attractive acquisition opportunities, while maintaining significant headroom in debt covenants.
Including post balance sheet events, the Company has 100% of drawn debt fixed or hedged at a weighted average finance cost of 3.8% (30 June 2023: 3.1%).
Continued progress on sustainability reporting
Investing responsibly for long-term value creation remains at the heart of the Company's business model. The Company has continued to refine its approach this year improving ESG data processes and setting long-term targets for the Company.
The Company's refreshed sustainability strategy consists of three key pillars:
1. Climate and Environment
2. Tenant and Community Engagement
3. Responsible Business
These pillars are underpinned by the UN Sustainable Development Goals the Company has identified as most material to the business, and by the Investment Adviser's ongoing responsible investment commitments including in respect of the Net Zero Asset Managers initiative, UN Global Compact and UN Principles for Responsible Investment.
The Company has published its second standalone Sustainability Report which details its sustainability performance and progress against the three pillars of the sustainability strategy and plans for the year ahead. Highlights from the Sustainability Report, beyond the Company's science-based target setting, include the Company's first donation to the Atrato Foundation, improvements in ESG data sharing with tenants and further environmental asset management initiatives to benefit occupiers and communities. For the first time the Company has also undertaken external assurance over its reported location-based Scope 1, 2 and 3 GHG figures for FY24. The Assurance Report is available on the Sustainability section of the Company's website.
In addition to the Company's Sustainability Report, disclosures in line with the TCFD recommended disclosures and the Company's Streamlined Energy and Carbon Reporting ("SECR"), have been included within the Annual Report on pages 39 to 51.
Secondary listing on the Johannesburg Stock Exchange ("JSE")
The Company is in the process of applying for a secondary inward listing on the Main Board of the Johannesburg Stock Exchange by introduction. The listing of the Company on the JSE is expected to become effective by the end of the calendar year, subject to various regulatory approvals in South Africa.
The Company will not place or issue any new shares in connection with its application for a secondary listing on the JSE and will remain listed on the Closed-ended investment funds category of the FCA's Official List and traded on the LSE's Main Market. PSG Capital Proprietary Limited has been appointed as Corporate Advisor and Sponsor in South Africa.
The Company believes that admission to trading of the shares on the JSE will be beneficial to the Company and its shareholders. The secondary listing should contribute to liquidity in the Group's shares through its increased profile and improved accessibility in the South African market, where a number of investors have already shown strong interest in investing in the Company, driven by its high-quality portfolio of omnichannel supermarkets and secure income providing an attractive dividend.
Outlook
We remain resolutely focused on delivering sustainable earnings growth for the Company in our role as Investment Adviser. Whilst acknowledging the ongoing impact of macro factors such as interest rates which are ultimately outside of our control, we continue to drive strong performance at an operational level. We believe this will translate into positive momentum for the Company.
In the Company's core UK market we see accretive opportunities that meet our disciplined approach to capital deployment, albeit in a reduced addressable market. France offers an extension of this strategy and an attractive potential further source of earnings growth. Opportunities in geographies outside of the UK will only be considered where asset quality can be maintained and where we see attractive relative value. Should we look to further increase the Company's exposure to this market, we would first consult with shareholders and revisit the Company's Investment Policy.
Following receipt of the final portion of the Sainsbury's Reversion Portfolio disposal proceeds received at the beginning of the year, the most prudent decision was to pay down debt rather than deploy that capital into new assets and expose the Company to higher leverage and potential valuation decline. As valuations have stabilised and market sentiment has improved, we are more comfortable in gradually normalising leverage levels.
We continue to consider all options for the Company to achieve earnings growth. We are also exploring disposal and JV opportunities which present capital recycling opportunities, the benefit of which comes both through proving the portfolio NAV in the open market and through opportunities to redeploy sales proceeds in the most earnings accretive manner for shareholders at that time.
We currently consider that the Company's debt finance capacity is best deployed into accretive acquisitions to grow earnings. However, the option of share buybacks is continuously under review by the Investment Adviser and the Board.
In summary, we are focused on delivering earnings accretion through a rigorous approach to capital allocation. This, combined with tight cost controls in the business, as evidenced through the Company's continually decreasing EPRA cost ratio, should deliver efficient earnings growth and increased returns to shareholders.
THE COMPANY'S PORTFOLIO
The Company has built a portfolio of strong trading, 'mission critical' omnichannel supermarkets backed by leading grocery operators.
The central pillar of the Company's investment policy is to acquire omnichannel supermarkets that form a key part of our tenants' last mile fulfilment networks. These stores offer both an online provision and in-store shopping, helping to capture a greater share of the grocery market. Currently 93% of our supermarket assets are omnichannel, by value.
The portfolio benefits from long unexpired lease terms with predominantly upwards only, index linked leases, helping to provide long-term income with contractional rental growth.
Within the UK, operators typically look at the affordability of rent based on a benchmark of c.4% rent to turnover, simply seen as two weeks of trade. The Group's UK supermarkets average rent to turnover is 4%, which equates to £24 per sq.ft. We have highly secure income with 100% rent collection during the year and Tesco and Sainsbury's accounting for 75% of the Company's rent roll.
During the year, the Group acquired a hand-picked portfolio of Carrefour supermarkets in an off market, direct sale and leaseback with the operator. The assets form a key part of Carrefour's omnichannel operation with 15 stores operating Drive "Click & Collect". This channel accounts for 80% of online grocery in France.
The standalone stores are subject to annual, uncapped inflation-linked rent reviews with 12 year unexpired lease terms (tenant only break at year 10) and are let on low and affordable rents of €7 per sq.ft. with an average RTO of 2.1%, below the RTO average of 2.5% in France. The rents produce a low capital value of €110 per sq.ft. The transaction helps to increase the Group's exposure to strong tenant covenants, further diversifies the portfolio and promotes further income growth through index-linked rent reviews.
As part of the Company's investment strategy to acquire high-quality, strong trading supermarkets, it is sometimes necessary to acquire complementary non-grocery units that are co-located with the store. These units often create a retail destination helping to drive further footfall into the supermarket. Non-grocery assets represent 6% of the Portfolio by value.
During the year, the Company selectively strengthened its Portfolio with the addition of 20 supermarkets for a combined total of £135.8 million24.
· July 2023: A Sainsbury's in Gloucester, for £17.4 million24. The store has a 15-year unexpired lease term25 and is subject to 5-yearly upwards only, open market rent reviews.
· July 2023: A Sainsbury's in Derby, for £19.0 million24. The store has a 15-year unexpired lease term25 and is subject to 5-yearly upwards only, open market rent reviews.
· March 2024: A Tesco in Stoke-on-Trent, for £34.7 million24. The store has a 11-year unexpired lease term and is subject to annual upwards only RPI-linked rent reviews.
· April 2024: A portfolio of 17 Carrefour supermarkets located in north and north west France, for £64.7 million24. The portfolio was a direct sale and leaseback with Carrefour with 12-year unexpired lease terms25 and subject to annual, uncapped inflation-linked, rent review.
The acquisitions during the year were purchased at an average net initial yield of 6.7% (7.0% UK, 6.3% EUR) providing an attractive spread to the Group's incremental cost of debt and were immediately accretive to earnings. The increased exposure to index-linked income also generates further contractual earnings growth underpinned by strong tenants.
Acquisitions during the year were financed using existing headroom within our debt facilities and subsequently through the €83 million private placement which was announced in July 2024.
For more information on financing arrangements refer to note 19 of the financial information.
|
Tenant |
Exposure by rent roll |
Exposure by Valuation |
|
Tesco |
48% |
48% |
|
Sainsbury's |
27% |
29% |
|
Morrisons |
5% |
5% |
|
Waitrose |
4% |
4% |
|
Carrefour |
4% |
4% |
|
Asda |
2% |
2% |
|
Aldi |
1% |
1% |
|
M&S |
1% |
1% |
|
Non-food |
8% |
6% |
|
Total |
100% |
100% |
The Portfolio's weighting towards investment grade tenants provides secure long-term income with a weighted average unexpired lease term of 12 years. In addition, the portfolio is heavily weighted towards upwards only inflation-linked rent reviews. The average cap on our inflation-linked leases' rental uplifts is 4%.
The Portfolio's weighting towards upwards only, inflation-linked rent reviews is 80% with 58% of the Portfolio being reviewed annually.
|
Indexation |
Income mix by |
|
RPI |
70% |
|
CPI |
6% |
|
ILC |
4% |
|
Fixed |
2% |
|
OMV |
18% |
|
Total |
100% |
|
Rent review |
Income mix by |
|
Annual |
58% |
|
5 yearly |
41% |
|
7 yearly |
1% |
|
Total |
100% |
|
UK rental caps |
% of UK supermarket index-linked portfolio |
|
0-1 % |
0% |
|
1-2 % |
1% |
|
2-3 % |
13% |
|
3-4 % |
64% |
|
4-5 % |
22% |
|
Total |
100% |
The rent profile of the supermarkets is broadly in line with the market at 4% RTO. The rental maturity profile is well dispersed with the first material regear in 2029.
|
WAULT |
WAULT breakdown |
WAULT |
WAULT |
|
0-1 yrs |
0.0% |
- |
0 |
|
1-2 yrs |
0.0% |
- |
0 |
|
2-3 yrs |
0.2% |
0.2 |
1 |
|
3-4 yrs |
0.0% |
- |
0 |
|
4-5 yrs |
0.0% |
- |
0 |
|
5-6 yrs |
3.0% |
3.1 |
1 |
|
6-7 yrs |
4.4% |
4.6 |
2 |
|
7-8 yrs |
6.1% |
6.4 |
4 |
|
8-9 yrs |
4.8% |
5.0 |
5 |
|
9-10 yrs |
12.1% |
12.6 |
21 |
|
10+ yrs |
69.4% |
72.3 |
39 |
|
Total |
100.0% |
104.2 |
73 |
The environmental efficiency of our stores continues to be a key priority for our asset management initiatives, selective acquisitions and is supported by the ongoing investment by grocery tenants into respective store estates. A breakdown of our supermarket EPC ratings can be seen below:
|
Supermarket EPC breakdown |
|
|
EPC rating |
% of UK supermarket Portfolio by value |
|
A |
4% |
|
B |
52% |
|
C |
31% |
|
D |
13% |
|
Total |
100% |
Active asset management delivering additional value and improving sustainability of sites
The Company continues to seek sustainability and value creation initiatives at our larger sites which are not fully demised to the core supermarket tenants and therefore benefit from greater landlord control.
Alongside our tenants, we are looking at ways to increase the number of Electric Vehicle ("EV") charging points at larger sites. We now have 58 EV charging bays across five sites, all completed at zero capex cost to the Company. Current EV sites:
· Morrisons, Workington
· Morrisons, Wisbech
· Tesco, Bradley Stoke
· Tesco, Chineham
· Tesco, Beaumont Leys
Works were completed at Tesco, Thetford in partnership with Atrato Onsite Energy plc where Tesco entered into a 20-year Power Purchase Agreement ("PPA") for a new solar installation on the rooftop at the store. The EPC rating was re-assessed post installation and improved from a C to a B.
Opportunities to add complementary discount grocery operators continue to progress. At Tesco, Chineham, the existing planning consent was successfully implemented and terms are agreed with a discount grocery retailer. We have had three additional offers for new discount food stores across the portfolio.
At Tesco, Chineham, McDonald's has commenced fit out works of a unit with a new 25-year lease. In addition to this, Pets Corner is upsizing into a new unit. At Tesco, Bradley Stoke, works are currently being undertaken to amalgamate two units, one of which was vacant at acquisition and the other let on a concessionary basis, with B&M committing to a new 10-year lease, rendering the site 100% let.
Other developments are being considered at Sainsbury's, Newcastle, Morrisons, Workington and Tesco, Bradley Stoke and various negotiations are ongoing with potential tenants for those sites.
Portfolio valuation
Cushman & Wakefield valued the Portfolio as at 30 June 2024, in accordance with the RICS Valuation - Global Standards which incorporate the International Valuation Standards and the RICS UK Valuation Standards edition current at the valuation date.
The properties were valued individually without any premium/discount applying to the Portfolio as a whole. The Portfolio market value was £1,775.7 million, an increase of £82.8 million reflecting a valuation decline of £53.0 million (including currency exchange movements), which was offset by new acquisitions of £135.8 million pre acquisition costs. This valuation reflects a net initial yield of 5.9% and a like-for-like valuation decline of 3.2% since 30 June 2023. The benchmark MSCI All Property Capital Index during the same period was down 4.5%.
The decline in valuation reflects the outward shift in property yields applied by valuers across the real estate sector as a result of higher interest rates and the macroeconomic environment. This was largely recognised in the first half of the year, with a like-for-like valuation decline of 3.2% reported in the Company's valuation as at 31 December 2023. Valuations remained broadly flat in the second half of the year.
The valuation decline in the year has however been partially mitigated by our contractual inflation-linked rental uplifts. The average annualised increase in rent from rent reviews performed during the year was 4.0%. 82% of the Company's leases benefit from contractual rental uplifts, with 80% linked to inflation and 2% with fixed uplifts.
THE GROCERY MARKET
UK
Non-discretionary grocery market continuing to experience strong growth
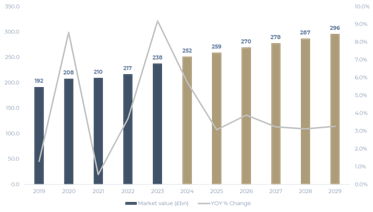
The UK grocery market has highlighted its defensive, non-discretionary characteristics this year with sales growth of 5.8% against a very strong inflation-led comparator of 9.2% for 2023. Total grocery market sales are forecast to be £251.6 billion in 2024, an increase of £59.6 billion or 31% since pre-pandemic levels in 2019.
While the sector growth will continue to ease as inflation moderates in 2025 in year-on-year percentage terms, IGD projects continued healthy absolute sales growth in the coming years. With forecast annual growth of around 3% to 2029, the UK grocery market is expected to reach £296 billion in the same year.
The growth from 2019 out to IGD's projected total sales figure would represent a 4.4% compound annual growth rate. The future projected growth is in line with long run RPI/CPI projections and underlines the grocers' ability to efficiently pass through inflation to consumers. The increased sales revenue at the store level will support higher rents over the medium term.
Institute of Grocery Distribution ("IGD") UK Grocery Market Value 2019-2029 (forecast)
This track record of strong growth in the sector has attracted new institutional investors into the grocery real estate investment market and has also seen a continued programme of store buybacks by Tesco with four stores purchased by the grocery operator in the year.
Online grocery channel returned to growth following a rebase post pandemic
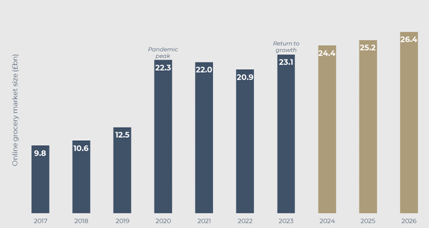
Online grocery now accounts for 12% of the total market. Online market share has fallen back from the pandemic peak of 15%, but having rebased to 12%, it is still one of the fastest growing channels according to Kantar. The online channel was permanently enlarged throughout the pandemic - over 50% of online grocery shoppers during 2020 were new to the channel26 and much of this change in consumer behaviour has been sticky.
Omnichannel stores are optimally placed to benefit from the combined growth of both in store sales and online. Operators are able to increase online capacity at low cost and benefit from shorter drive times due to their existing omnichannel stores' proximity to customers. This results in a greater number of deliveries per hour and drives greater profitability than the centralised fulfilment (or 'dark store') model. Tesco recently announced that online sales participation is stable at 13% of UK sales with basket sizes up 4.2% and online sales up 10%. The return to growth of the online channel is evident in the latest IGD forecast which predicts growth of 27% (£6 billion) by 2029.
Online grocery spend (UK) (2017 to 2023 actual, 2024 to 2026 forecasted)
Omnichannel stores capture the largest share of growth
Large format omnichannel stores, such as those which the Company targets, have captured the largest share of sales growth in the sector since 201927. In that time the total UK grocery sector has increased from £192 billion in 2019 to £252 billion, with omnichannel supermarkets accounting for £20 billion of that growth.
Importantly, this growth is being generated from existing store estates meaning this is like-for-like sales growth, resulting in improved sales densities and enhanced profitability at the store level. From a landlord perspective, this ensures that rents remain affordable for tenants, particularly as sales growth has been running ahead of capped rental uplifts. It also provides a strong backdrop for higher rents in the future.
Large format stores have the scale to offer the full product range giving customers the widest product choice, whilst also offering the best value to customers through in-store only and loyalty scheme product offers. In the current inflationary environment shoppers are looking to achieve best value on their purchases. Tesco and Sainsbury's loyalty schemes which offer attractive discounts to members, have been very successful Sainsbury's reporting that nine out of ten £80+ weekly shopping baskets are sold to customers using their Nectar loyalty card.
Tesco and Sainsbury's maintained market share whilst discounter growth begins to slow
The UK grocery market is highly consolidated with the six leading operators accounting for 83% of the market. These operators can be divided into two groups: the four multichannel (in-store and online) operators, Tesco, Sainsbury's, Asda and Morrisons, and two limited range in-store only discounters, Aldi and Lidl.
5-year operator market share (UK) (June 2019 - June 2024)28
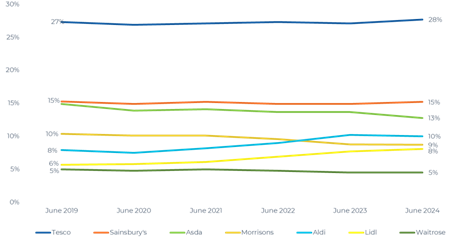
Tesco and Sainsbury's, the Company's key tenants, continue to be the leading players in the UK grocery space with 27.7% and 15.2% market share respectively. Both operators have increased market share in the last 12 months and are seeing the benefit of investments in their stores, product ranges and loyalty schemes. Asda and Morrisons (12.8% and 8.7% market share respectively) have continued to lose market share following their highly leveraged takeovers in 2020 and in the face of competition from the limited range discounters.
Discounter portfolio size (UK), 2017-2023
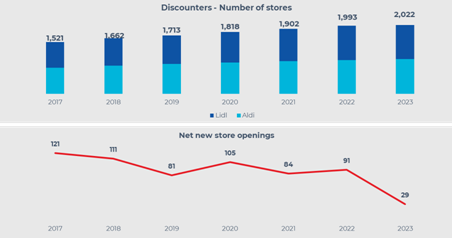
While Aldi and Lidl achieved impressive growth which accelerated in the period from 2020 to 2023, with Aldi's market share growing from 7.5% to 10.2% and Lidl's growing from 5.8% to 8.1% in the period, this growth appears to have slowed. In the case of Aldi, this growth reversed in 2024 with market share marginally declining to 10.0% while Lidl increased market share at a lower annual rate to 8.1%. This lower growth can be linked to several factors including a reduced rate of store openings which had previously been the key driver of market share growth.
The challenge for the discounters will be achieving further growth whilst maintaining profitability. 98% of the Company's UK portfolio already has a discounter present within a 10-minute drivetime. We expect new store opening by the discounters to cannibalise existing discounter trade and therefore the marginal profit of new stores will be diluted.
Lower inflation expected to drive grocery profitability
Grocery price inflation has driven significantly higher revenues for supermarkets in recent years. Whilst the ability for supermarkets to pass through inflation to consumers highlights the non-discretionary nature of grocery, there has of course been an impact on consumers' shopping habits. Cost of living pressures have decreased consumer purchasing power, which has resulted in a trading down to supermarkets' own brand and value ranges. Through investment in cost reduction programmes and improved efficiency, coupled with product price increases, operators have largely been able to preserve squeezed margins.
As food price inflation begins to moderate, we expect consumers to again adjust their behaviour, driving volume growth. However, the operators will continue to benefit from the cost efficiencies the high inflation rates of recent years have required and therefore we see volume growth in the coming years being a driver of increased profitability.
The highly competitive and ultra-low margin nature of the Discount market has meant Aldi and Lidl have had to increase prices faster than other operators in order to protect thin margins of 1-2%. Whilst the Discount channel has seen increasing market share, this has primarily been driven by increasing prices with Lidl and Aldi inflating prices by 25.7% and 23.1% respectively over the three months to April 202329.
ONS: Grocery inflation (Jun 2020 - Jun 2024)
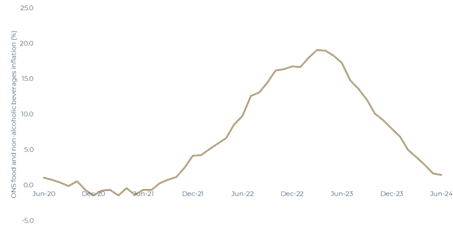
With inflation beginning to moderate, grocery volumes are expected to increase as household cost pressures reduce, encouraging higher spending and purchasing a broader range of products, including non-essentials and premium items.
Tesco and Sainsbury's have both recently announced a return to volume growth with increased basket sizes.
FRANCE
France Grocery Market Value (2019-2023, 2024-2028 (forecast))30
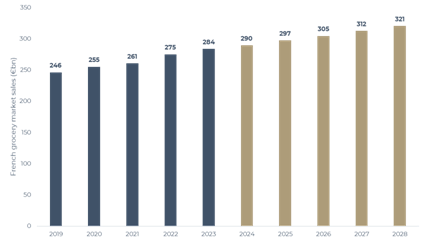
The French grocery market, one of the largest in the world by total value, has shown consistent growth over a prolonged period. The defensive and non-discretionary sector has experienced YoY sales growth of 2.1% against a strong average inflation-led comparator of 5.6% for 2023. Total market sales are forecasted to be €290 billion in 2024, an increase of €44 billion or 18% since 2019. The French grocery sector is expected to reach €321 billion by 2028 representing an annual increase of c.3%.
Insee: Grocery inflation (Jun 2020 - Jun 2024)
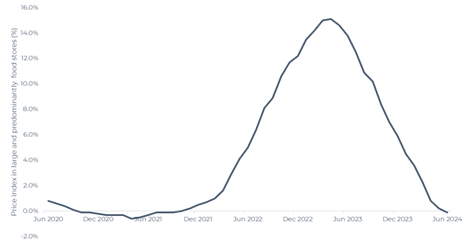
Similar to the UK, France has seen significant inflation pressure in recent years, helping to drive revenue growth at the expense of volumes as consumers changed purchasing habits to manage budgets. Grocery inflation increased to an all-time high of over 15% in 2023, up from 0.8% in 2020. As inflationary pressures ease, we expect to see volumes increase and consumers return to more traditional shopping habits.
French grocery market share (July 2024)31
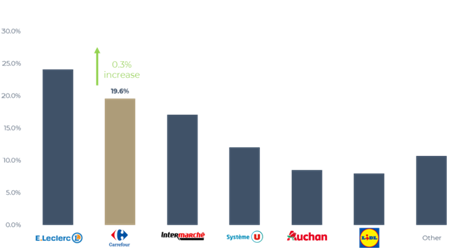
The French grocery market is highly consolidated with 60% of total market share controlled by three grocery operators; E.Leclerc, Carrefour and Intermarche. Over the last 6 months, Carrefour has increased market share by 0.3% to 19.6%. It has accelerated its price investment programme, the effect of which has been to increase market share in the face of competition from cheaper alternative grocers, while preserving profitability. Carrefour's increase in market share was also driven by volume growth as consumers return to traditional shopping habits and the effects of inflation subside.
French Online grocery spend (2017 to 2023 actual, 2024 to 2026 forecasted)
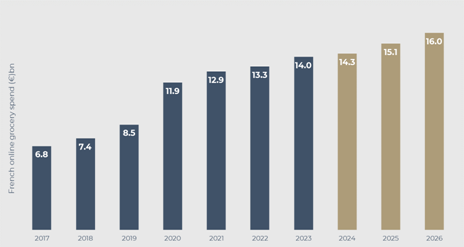
Online market share in France has been permanently enlarged due to an increase in take up throughout the pandemic. The channel has grown by 93% between 2018 and 2024. The channel has been further strengthened by investment programmes by operators such as Carrefour which, across the group, is planning to invest €3 billion in the online channel32 and for omnichannel customers to represent 30% of all customers by 202633.
Due to geographic differences between the UK and France, 80% of online sales are fulfilled via Click & Collect vs 20% in the UK. Operators will use large fulfilment centres 'hubs' to pick and pack dry goods which are then delivered to stores which operate as 'spokes'. These stores are responsible for picking fresh goods with the combined order collected by the customer in the car park.
Whilst the French online model is different, it is built around mission critical omnichannel stores, in strong locations which provide last mile fulfilment to consumers.
FINANCIAL OVERVIEW
Atrato Capital Limited, the Investment Adviser to the Group, is pleased to report the financial results of the Group for the 12 months ended 30 June 2024.
Financial results
|
30 June 2024 |
30 June 2023 |
|
|
£'000 |
£'000 |
|
|
Net rental income |
107,232 |
95,244 |
|
Administrative expenses |
(15,218) |
(15,429) |
|
Net income from joint ventures |
- |
11,746 |
|
Net finance expenses34 |
(16,192) |
(19,162) |
|
Adjusted earnings |
75,822 |
72,399 |
Net rental income
In the year, the portfolio generated net rental income of £107.2 million (30 June 2023: £95.2 million), representing an increase of £12.0 million or 12.6% compared to the prior year. The growth in net rental income was driven by a full period of rental income from property acquisitions and the effect of contracted rent reviews.
On a like-for-like basis, EPRA net rental income increased by 2.1%. During the year we successfully completed 22 rent reviews increasing annualised passing rent by £2.9 million, with the reviews being settled on average 4.8% ahead of previous passing rent (or 4.0% on an annualised basis).
Net service charge expenditure remained broadly flat at £0.6 million (30 June 2023: £0.6 million), however our gross to net margin continues to be among the highest in the sector at 99.4% (30 June 2023: 99.4%), reflecting the strength of our core single-let strategy and further highlighting the covenant quality of our tenant base.
Rent collection rates were 100% for the year to 30 June 2024 (30 June 2023: 100%), as our focus on top trading stores and covenant quality provided exceptional income security.
Administrative and other expenses and EPRA cost ratio
Administrative and other expenses, which include all operational costs of running the business, decreased by £0.2 million to £15.2 million (30 June 2023: £15.4 million). We continue to monitor the operational efficiency of the Group through its EPRA cost ratio, which is among the lowest in the sector, and improved by 80bps to 14.7%.
|
30 June |
30 June |
|
|
2024 |
2023 |
|
|
EPRA cost ratio including direct vacancy costs |
14.7% |
15.5% |
|
EPRA cost ratio excluding direct vacancy costs |
14.4% |
15.2% |
Net finance expenses35
During the year, the Group received £134.9 million following the divestment of its interest in the Sainsbury's Reversion Portfolio Joint Venture. Part of the proceeds were utilised to pay down debt, subsequent to which the Group increased its debt facilities with a new SMBC facility.
Net finance expenses reduced by £3.0 million to £16.2 million compared to the prior year, primarily due to the short-term loan in relation to the Joint Venture in the prior year and a lower average debt cost.
Adjusted earnings
The Directors consider adjusted earnings a key measure of the Company's underlying operating results, and a reference through which the Board measures dividend cover. Adjusted earnings therefore excludes one-off items which are non-recurring in nature and includes finance income on derivatives held at fair value through profit on loss. Adjusted earnings for the year to 30 June 2024 were £75.8 million (30 June 2023: £72.4 million). On a per share basis, adjusted earnings increased by 0.3 pence per share to 6.1 pence for the year to 30 June 2024, an increase of 4% (30 June 2023: 5.8 pence).
A full reconciliation between IFRS and Adjusted earnings can be found in note 11 of the financial information.
Dividend
In the financial year ended 30 June 2024, the Company paid the following interim dividends:
|
Declared |
Amount pence per share |
In respect of the financial year ended |
Paid/ to be paid |
|
6 July 2023 |
1.500p |
30 June 2023 |
4 August 2023 |
|
5 October 2023 |
1.515p |
30 June 2024 |
16 November 2023 |
|
4 January 2024 |
1.515p |
30 June 2024 |
14 February 2024 |
|
4 April 2024 |
1.515p |
30 June 2024 |
16 May 2024 |
Post period end, the Company declared an interim dividend in respect of the financial year ended 30 June 2024 of 1.515 pence per Ordinary Share (the "Fourth Quarterly Dividend"). The Fourth Quarterly Dividend was paid on 16 August 2024 as a Property Income Distribution ("PID") to shareholders on the register as of 12 July 2024. The Company has now declared four quarterly dividends totalling 6.06 pence per Ordinary Share in respect of the financial year ended 30 June 2024.
EPRA net tangible assets and IFRS net asset
|
30 June 2024 |
30 June 2023 |
||
|
£'000 |
£'000 |
||
|
Investment property |
1,768,216 |
1,685,690 |
|
|
Bank and other borrowings |
(694,168) |
(667,465) |
|
|
Cash |
38,691 |
37,481 |
|
|
Other net (liabilities)/assets |
(28,207) |
100,828 |
|
|
EPRA net tangible assets |
1,084,532 |
1,156,534 |
|
|
Fair value of interest rate derivatives |
31,449 |
57,583 |
|
|
Fair value adjustment for financial assets held at amortised cost |
3,493 |
3,609 |
|
|
IFRS net assets |
1,119,474 |
1,217,726 |
EPRA net tangible assets ("EPRA NTA") is considered to be the most relevant asset measure for the Group, and includes both income and capital returns, but excludes the fair value of interest rate derivatives and includes a revaluation to fair value of investment properties held at amortised cost.
At 30 June 2024, EPRA NTA was £1,085 million (30 June 2023: £1,157 million), representing an EPRA NTA per share of 87 pence, a decrease of 6.3% since 30 June 2023 primarily due to the portfolio revaluation deficit of £65.8 million or 5 pence per share.
Portfolio Valuation
The value of the portfolio at 30 June 2024, including the fair value of investment properties held at amortised cost, was £1,776 million (30 June 2023: £1,693 million). During the Year, the Group invested £135.8 million in 20 omnichannel supermarkets (excluding transaction costs). On a like-for-like basis, the portfolio recognised a revaluation deficit of £53.8 million, or 3.2%, which reflects the outward shift in property yields applied by valuers across the real estate sector as a result of higher interest rates and the macroeconomic environment.
Cash Flow and Net Debt
Cash flows from operating activities before changes in working capital increased by £12.6 million to £89.6 million, primarily due to increased rental income received from rent reviews and property acquisitions.
During the year, the Group received £134.9 million following the disposal of its interest in the Sainsbury's Reversion Portfolio Joint Venture. Part of the proceeds were used to acquire two omnichannel supermarkets with a combined acquisition cost of £36.4 million (excluding transaction costs), providing earnings growth in line with the Group's strategy, with the remaining proceeds used to reduce drawn debt.
In the second half of the year, the Group drew down £106.8 million from facilities with existing lenders, to fund the acquisition of 18 supermarkets.
Net debt increased by £25.5 million over the year to 30 June 2024, to £655.5 million, and represents a loan to value of 37% (30 June 2023: 37%). The Group continues to maintain a conservative leverage policy, with a medium-term target LTV of 30-40%.
Financing
|
30 June 2024 |
30 June 2023 |
||
|
Undrawn facilities36 |
£104m |
£190m |
|
|
Loan to value |
37% |
37% |
|
|
Net debt / EBITDA ratio |
7.1x |
7.9x |
|
|
Weighted average cost of debt37,38 |
3.8% |
2.9% |
|
|
Interest cover |
6.2x |
4.1x |
|
|
Average debt maturity39,42 |
4.0 years |
3.7 years |
|
|
% of drawn debt which is fixed/hedged37 |
100% |
100% |
In the first half of the year, the Group completed a comprehensive debt refinancing exercise, completing a new £67 million unsecured facility with Sumitomo Mitsui Banking Corporation, at the same time reducing its HSBC facility from £150 million to £50 million and cancelling its Barclays/RBC facility of £77.5 million.
In the second half of the year, the Group increased its unsecured facility with Sumitomo Mitsui Banking Corporation by £37.5 million to £104.5 million, to facilitate the acquisition of a Tesco omnichannel supermarket in Stoke-on-Trent.
In April 2024, the Group drew down €81.7 million from its existing HSBC revolving credit facility, having also increased the total size of the facility by £25 million. The funds were used to acquire a portfolio of 17 supermarket stores from Carrefour.
At 30 June 2024, the Group has gross borrowings of £698 million diversified across eight lenders, including £415 million of unsecured borrowings and £283 million of secured borrowings. In addition, the Group has available undrawn facilities of £104 million (which includes a £50 million accordion) and plenty of headroom under banking covenants, providing the capacity to execute opportunistic transactions as they arise.
Post year end, the Group announced the completion of a £170 million refinancing through its first private placement issuance and a new unsecured bank facility.
As part of the refinancing, the Company completed an agreement with a group of institutional investors for a private placement of €83 million new senior unsecured notes, which have a maturity of 7 years and a fixed rate coupon of 4.44%.
In addition, the Group also refinanced its existing £97 million secured debt facility with Deka through a new £100 million unsecured debt facility with ING Bank N.V., London Branch. The facility comprises a £75 million term loan and a £25 million revolving credit facility, which has a maturity of three-years and has two one-year extension options. Following the refinancing, the Company has a weighted average debt maturity of 4 years, a weighted average debt cost of 3.8% and available undrawn facilities of £176 million (including £50 million accordion).
The Group's interest rate risk is mitigated through a combination of fixed debt and derivative interest rate swaps and caps. During the year, the Group utilised the value of its existing in-the-money interest rate hedges to extend the term of its hedging arrangements by 12 months through terminating existing derivatives and acquiring new instruments that aligned with the expiry of the Group's debt portfolio. This exercise was performed at no additional cost to the Company.
The Group maintains good long-term relationships with all lenders and is currently in discussions regarding refinancing requirements over the next financial year.
The Group continues to monitor its banking covenants and maintains significant headroom on its LTV and ICR covenants. As at 30 June 2024, property values would need to fall by around 38% before breaching the unsecured gearing covenant. Similarly, net rental income would need to fall by 72% before breaching the unsecured interest cover covenant.
Fitch Ratings, as part of its annual review, reaffirmed the Group's BBB+ rating with a stable outlook.
TCFD COMPLIANT REPORT
Energy and Carbon Foreword
The Company recognises the urgent need to address climate change and is committed to supporting the required transition to a net zero economy.
This year, the Company reached a significant milestone with the Climate and Environment pillar of its Sustainability Strategy, with the setting of a formalised 2050 net-zero commitment and associated GHG emissions reduction targets. These targets were approved by the SBTi in March 2024, and include a commitment by the Company to reduce Scope 1 and 2 emissions 42% by 2030 and to reduce Scope 1, 2 and 3 emissions 90% by 2050 (from a FY23 base year).
The Company's Board and the Investment Adviser recognise the importance of transparent, decision-useful sustainability reporting to improve our accountability to stakeholders. As such, the Company's SECR and TCFD Report can be found below on pages 39 to 51. In addition, the Company has published a standalone Sustainability Report covering its wider ESG performance.
The Company remains committed to further progressing its climate-related strategy and emissions reductions activities, as it continues to identify opportunities to reduce operational carbon and energy use and contribute towards a net zero future.
Streamlined Energy and Carbon Reporting
The below table and supporting narrative summarise the SECR disclosure. As a listed entity, Supermarket Income REIT plc is required to comply with the SECR regulations under the Companies (Directors' Report) and Limited Liability Partnerships (Energy and Carbon Report) Regulations 2018. Data for the year 2022-2023 and 2023-2024 is included as this is the Company's second year of SECR.
Compared to the previous reporting year (2022-2023), there has been a slight increase in Scope 1 fuel consumption and a decrease in Scope 2 purchased electricity consumption. Overall, this has resulted in a decrease in total Scope 1 and 2 emissions from 111 tCO2e in the previous reporting year to 103 tCO2e (7% reduction) in the current reporting year. Due to this overall decrease in the Company's Scope 1 and 2 emissions, emissions from Fuel and Energy related activities ("FERA") (Scope 3 category 3) have also decreased from 37 to 32 tCO2e (14% reduction) for this reporting year.40 Emissions from Purchased Goods and Services (Scope 3 category 1) have decreased from 3,132 to 2,215 tCO2e (30% reduction) for this reporting year, due to a decrease in total included spend as exclusions were more rigorous this year. This year exclusions from spend include service charge costs and costs that are recharged to tenants in full. This is due to a spend-based approach being used for the Scope 3 Purchased Goods and Services, which supports the Company in prioritising its suppliers for engagement on decarbonisation. This year no newly built properties have been added to the portfolio; therefore, no emissions are attributed to Capital Goods (Scope 3 category 2) this year.
Two new supermarket sites have been acquired by the Company in this reporting year. Even with the two new sites acquired, Scope 3 energy consumption and resultant emissions from Downstream Leased Assets (Scope 3 category 13), which includes tenant Scope 1 and 2 emissions, have decreased from 83,794 to 81,931 tCO2e (1% decrease) for this reporting year due to improved estimation methods. Overall, total Scope 1, 2 and 3 emissions have decreased from 87,537 tCO2e in the previous reporting year to 84,281 tCO2e (4% reduction) in the current reporting year.
An error in the supermarket refrigerant emission calculation was found for the previous reporting year (2022-2023), resulting in missing Scope 3 downstream leased asset emissions reported last year. This has now been rectified and restated figures are included in the table below. The correction has resulted in an 8% increase in total emissions for the reporting year 2022-2023. In April 2024, the Company acquired a portfolio of Carrefour omnichannel supermarkets in France through a sale and leaseback transaction. Given the timing of this transaction, full year energy and carbon data has not yet been collected for these French assets. Therefore, the disclosures in this SECR Report focus on the energy and carbon performance of the Company's UK portfolio only. However, the Company intends to collect the required energy and carbon performance data from these French assets over the next reporting period to ensure the Company's next SECR Report covers both UK and French assets.
|
Report |
Previous reporting year: 1st July 2022 - 30th June 2023 |
As restated: 1st July 2022 - 30th June 2023 |
Current reporting year: 1st July 2023 - 30th June 2024 |
|
Location |
UK |
UK |
UK |
|
Emissions from the combustion of fuel and operation of facilities (tCO2e) (Scope 1) |
10 |
10 |
11 |
|
Emissions from purchase of electricity (location-based) (tCO2e) (Scope 2) |
101 |
101 |
92 |
|
Emissions from business travel in rental cars or employee-owned vehicles where company is responsible for purchasing the fuel (tCO2e) (Scope 3)41 |
N/A |
N/A |
N/A |
|
Total mandatory emissions (tCO2e)42 |
111 |
111 |
103 |
|
Voluntary: Emissions from Fuel and Energy related activity (location-based) (tCO2e) (Scope 3) |
37 |
37 |
32 |
|
Voluntary: Emissions from Purchased Goods and Services (tCO2e) (Scope 3) |
3,132 |
3,132 |
2,215 |
|
Voluntary: Emissions from Capital Goods (tCO2e) (Scope 3) |
463 |
463 |
N/A |
|
Voluntary: Emissions from Downstream Leased Assets (tCO2e) (Scope 3)43 |
77,274 |
83,794 |
81,931 |
|
Total gross emissions (tCO2e)44 |
81,017 |
87,537 |
84,281 |
|
Energy consumption used to calculate Scope 1 emissions (kWh) |
606,629 |
52,726 |
56,568 |
|
Energy consumption used to calculate Scope 2 emissions (kWh) |
521,321 |
521,321 |
443,555 |
|
Energy consumption used to calculate Scope 3 emissions (kWh)45 |
186,704,059 |
187,756,005 |
174,876,336 |
|
Total energy consumption (kWh) |
187,832,009 |
188,330,052 |
175,376,459 |
|
Intensity ratio: tCO2e (gross Scope 1 + 2) per m2 of floor area46 |
0.00045 |
0.00045 |
0.00037 |
|
Intensity ratio: tCO2e (gross Scope 1, 2 + 3) per m2 of floor area47 |
0.14 |
0.14 |
0.10 |
Methodology
The 2023/24 footprint within the scope of SECR reporting is equivalent to 84,281 tCO2e, including voluntary emissions, with the largest portion being made up of emissions from downstream leased assets at 81,931 tCO2e.
Anthesis has calculated the above GHG emissions to cover all material sources of emissions for which the Company is responsible. The methodology used was that of the GHG Protocol: A Corporate Accounting and Reporting Standard (revised edition, 2015). Responsibility for emissions sources was determined using the operational control approach. All emissions sources required under The Companies (Directors' Report) and Limited Liability Partnerships (Energy and Carbon Report) Regulations 2018 are included.
Raw data captured in spreadsheets including energy spend and consumption data has been collected by the Company. Where actual consumption data was available for natural gas and electricity use, this was used. To address data gaps, the most appropriate proxy was applied by using either previous year's data, actual data to calculate average monthly consumption, or by applying the average floor area intensity from sites with actual data. Fuel oil was estimated by applying the average 2023 UK fuel oil price to the budgeted spend for fuel oil. Energy was then converted to GHG emissions using the UK Government's GHG Conversion Factors for Company Reporting 2023. Scope 3 emissions have been calculated for relevant material categories using consumption data, spend data, floor area and EPC data. Fuel and Energy related activities includes well-to-tank ("WTT") and transmission and distribution ("T&D") upstream emissions from Scope 1&2. For Purchased Goods and Services, Environmentally Extended Input Output ("EEIO") has been used. Spend data was provided per supplier and mapped to 2023 DEFRA Input/Output ("IO") categories. No newly built sites were acquired during this reporting year, therefore there were no Capital Goods this year. Where actual data was not available for Downstream Leased Assets, a combination of CIBSE benchmarks were used against EPC data on energy use and heating type. Publicly available air conditioning ("AC") certificates were used to determine the type and amount of refrigerants. Where this was not available, other similar sites were used as proxies. As per EPA data, the size of the air conditioning equipment used was dependent on the amount of refrigerant used and the floor area. Supermarket refrigeration and non-food air conditioning was estimated using an intensity estimate from EPA data as no activity data was available. Refrigerant loss rate for refrigeration was taken from Direct Emissions from Use of Refrigeration, Air Conditioning Equipment and Heat Pumps from DEFRA.
The Company continued its efforts to improve energy efficiency across landlord-controlled areas and to support tenant-led energy efficiency measures between 1 July 2023 and 30 June 2024. A number of sites have been identified for LED lighting upgrades across car park and communal areas which will have a positive impact on the Company's Scope 2 emissions. Tenant-led investments in store upgrades have also focused on energy efficiency and resulted in EPC rating improvements, as discussed in the Sainsbury's Cheltenham case study above.
Approach to GHG emissions restatements
To improve its GHG reporting, the Company may restate previously reported data to provide a more accurate representation of previous performance and its decarbonisation journey, should a significant change or error be identified, such as:
· Significant changes in company structure and activities
· Methodology changes such as improvements in emissions factors, data access and calculation methodologies
· Discovery of significant error(s) in previously reported data
The Company will restate the baseline used for its Scope 1, 2 and 3 emissions reductions targets if any of the changes above result in a change of 5% or more, in line with the requirements of the SBTi. The Company will review the impact of the Carrefour portfolio acquisition on its SBT baseline once full year energy and carbon data is collected for these French assets.
Taskforce on Climate-Related Financial Disclosures (TCFD)
Introduction
The following report contains the Company's voluntary climate-related financial disclosures for the reporting period 1 July 2023 - 30 June 2024 in relation to governance, strategy, risk management and metrics and targets. It addresses all four core elements and 11 Recommended Disclosures as detailed in "Recommendations of the Task Force on Climate-Related Financial Disclosures".48
Governance
Describe how the board exercises oversight of climate-related risks and opportunities:
The Board is responsible for setting the Company's sustainability strategy and overseeing the Company's approach to climate-related risks and opportunities affecting the business.
Both the Board and JTC Global AIFM Solutions Limited, the Company's Alternative Investment Fund Manager (the "AIFM"), are responsible for the investment decisions of the Company and directing the delivery of services by the Investment Adviser to ensure that climate-related priorities are incorporated into the execution of the investment strategy. In support of this objective, the Board established its ESG Committee in May 2022, whose role helps to ensure that sustainability issues, including climate change, are discussed in sufficient detail and given appropriate focus at the Board level. The ESG Committee, which is Chaired by Frances Davies and attended by all of the Company's Directors, meets at least four times a year and has responsibility for overseeing the delivery of the Company's Sustainability Strategy, including identification and management of climate-related risks. The Board is primarily informed of climate-related issues by the Investment Adviser through the meetings of the ESG Committee. The Board also considers climate-related issues when making decisions on acquisitions and this process is described below under the managing climate-related risks section of this report. See Figure 1 for an overview of the Company's governance structure related to climate-related risks and opportunities.
Figure 1 | Governance structure related to climate-related risks and opportunities
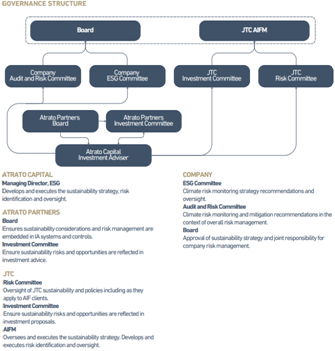
The Board reviewed and approved a refreshed Sustainability Strategy for the Company in March 2024, of which "Climate and Environment" is one of three key pillars. The ESG Committee receives a report and verbal update from the Investment Adviser at every quarterly meeting in relation to this aspect of the strategy, and the other two pillars (namely, Tenant and Community Engagement and Responsible Business). The ESG Committee update includes the Company's quarterly performance against environmental measures outlined in the Company's last TCFD Report (reporting period 1 July 2022 to 30 June 2023). The update also covers the broader delivery of the Company's sustainability strategy, including activities such as the roll-out of rooftop solar photovoltaic ("PV") and EV charging, improvement of Energy Performance Certificate ("EPC") ratings, ESG-related investor engagement and climate transition planning. These updates allow the ESG Committee to oversee the Investment Adviser's performance against the agreed deliverables under the sustainability strategy, as well as holding it to account for non-performance. In addition, at the annual Board strategy day event, sustainability strategy is included as a core agenda item. The ESG Committee is also involved in the review process and ultimate approval of the Company's TCFD Report. The Investment Adviser's Managing Director, ESG, is responsible for leading the delivery of these services to the ESG Committee on behalf of the Investment Adviser.
The Board is committed to ongoing improvement of the Company's climate-related disclosures. During the reporting year, sustainability consultancy Anthesis was again engaged to provide external support to help shape the Company's response and alignment to the TCFD recommendations. As part of this support, Anthesis conducted an independent peer review. In addition, they provided analysis of and recommendations on the Company's final disclosures to further advance its progress against best practice approaches and identify focus areas for the Company to address in upcoming disclosures. The Board is invested in enhancing the Company's understanding of climate risks and opportunities and, as part of this, approved budget allocation for ongoing climate-related activities, for the next reporting year. This facilitates forward planning and preparation of ESG matters targeted for the next reporting year.
The Board recognises that appropriate training and upskilling is a key enabler to ensure successful implementation of the Company's sustainability strategy and, specifically, the integration of sustainability factors into the investment process. In 2023 and 2024, Climate Risk training was delivered to the Investment Adviser and the Board respectively, to improve understanding of climate-related risks and opportunities and their tracking and oversight in order to support the management of these issues in the Company's activities.
Describe management's role in assessing and managing climate-related risks and opportunities:
Investment Adviser
The Investment Adviser is responsible for the day-to-day delivery of the sustainability strategy as approved by the Board on behalf of the Company, including the assessment, management and reporting of climate-related risks and opportunities.
Steve Windsor, Principal and Sustainability Champion at the Investment Adviser, is responsible for oversight, monitoring and management of sustainability risks and opportunities including those related to climate change. The Investment Adviser's Managing Director, ESG, is responsible for the operational delivery of climate-related risks and opportunities measures within the Investment Adviser's operations and leads the provision of climate risk advice to the Company.
The Investment Adviser's Managing Director, ESG, and Fund Management team meet fortnightly to discuss ESG issues impacting the Company, and climate risk is a standing agenda item as part of these meetings. The Managing Director, ESG is also a standing attendee at the Investment Adviser's Investment Committee, assuming responsibility for implementation and alignment with the Investment Adviser's sustainability systems and controls, co-ordination of third-party service providers, and management of the Company's sustainability activities including climate-related reporting.
Where the Company has appointed a third-party service provider, the Investment Adviser will require and hold regular project progress meetings with the service provider, where delivery is tracked against an agreed project timeline. The results of the progress will be communicated to the ESG Committee by the Investment Adviser in the context of its progress against the agreed sustainability strategy. In order to formalise oversight of the TCFD reporting process, the Investment Adviser plans to formally establish a dedicated Climate Risk and TCFD Working Group in the next reporting period. This Working Group will be led by the Investment Adviser's Managing Director, ESG, and consist of members of the wider Investment Adviser team, including from fund management and finance, to ensure appropriate assignment of climate-related responsibilities and monitoring of climate-related issues.
Strategy
Describe the climate-related risks and opportunities the organization has identified over the short, medium, and long term.
In accordance with TCFD recommended disclosures, the Company has identified climate-related risks and opportunities across two key categories: (1) physical risks related to the physical impacts of climate change (acute and chronic) and (2) transition risks related to the transition to a low carbon economy (policy, legal, technology, and market).
The Company considered these risks over three key time periods: from now until 2030 (near-term), from 2030 to 2050 (medium-term) and 2050 to 2100 (long-term).
|
Time Horizon |
Details |
|
Near-term (until 2030) |
The near-term time horizon (2024-2030) aligns to both the Company's near-term Science Based Target (2030) and the anticipated compliance deadline for the proposed Minimum Energy Efficiency Standards ("MEES") regulation. The Investment Adviser anticipates 2030 as the target year for a minimum B EPC ratings. Due to the 12 year weighted average unexpired lease term ("WAULT") of its portfolio, the Company expects that there will be a limited number of lease renewals and few changes to its existing leases during this time period. |
|
Medium-term (from 2030 to 2050) |
The medium-term time horizon (from 2030) aligns with a period of current lease renewals for the majority of the Company's assets, during which physical and transition risks associated with the Company's portfolio may have greater influence on lease agreements with existing and new tenants. |
|
Long-term (2050 to 2100) |
The long-term time horizon aligns with both the Company's long-term / net-zero Science Based Target and with a potential increase in the likelihood and severity of physical climate risks impacting the Company's portfolio. This allows for the creation of long-term strategies and planning regarding portfolio management in response to these risks. |
The Company considered two key temperature scenarios as part of its scenario analysis conducted this year:
|
Scenario |
Details |
|
1.5°C / REMIND / SSP2 / Orderly ("1.5°C Net Zero") |
Net Zero 2050 is an ambitious scenario that limits global warming to 1.5 °C through stringent climate policies and innovation, reaching net zero CO₂ emissions around 2050. |
|
3°C / REMIND / SSP2 / "3°C: Current Policies" |
Current Policies Scenario. No additional climate policies are applied leading to significant global warming (exceeding 3°C) with severe physical risks and irreversible impacts like sea-level rise. |
Further details on the hazard level model and data sets used as part of the Company's scenario analysis is included in the appendix of this TCFD Report.
The Company has utilised the MSCI Real Assets (Real Estate) Climate Risk Tool (the "MSCI tool") and associated Climate Value at Risk ("Climate VaR") outputs to quantify the physical risks across the post-2050 (long-term) time horizon.49 The outputs provide a qualitative risk assessment using set Financial Risk Categories determined based on the asset's Climate VaR. For each hazard and for the transition risk, the Climate VaR is classified into one of seven buckets as shown in Figure 2 below50:
Figure 2 | Financial Risk Category
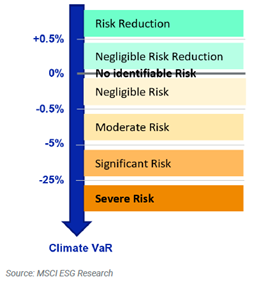
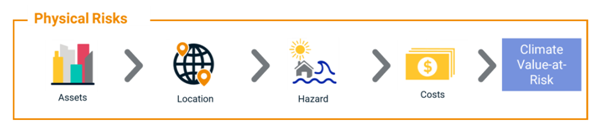
The Company recognises the MSCI tool is only one of many different scenario analysis tools currently available on the market. In addition, such tools and the underlying data models and inputs they utilise are constantly evolving as climate research and available data sets continue to advance. Therefore, the Company has adopted this method of scenario analysis as an efficient way to review its portfolio, but any findings will require further investigation to establish their accuracy. The Company's plans in this respect are outlined in more detail under the 3°C (Current Policies) temperature scenario results shared below on page 45. The Company also intends to collaborate with MSCI, and other data providers that may be used in future, to provide feedback on the tools and data inputs and to challenge assumptions and outputs when necessary.
In FY23 the sustainability consultancy, Anthesis, was engaged to conduct a preliminary climate risk assessment and qualitative scenario analysis as part of preparing the Company's 2023 TCFD Report. During this assessment, the following risks were considered as potentially most material to the Company determined based on their relative likelihood and potential financial impact:
1. Physical Risk:
a. Flooding (Acute & Chronic): Increased insurance premiums and increased capital expenditure required on adaptative or remediation measures.
b. Extreme Heat (Acute): Increasing operating costs for tenants through increased energy demand required for cooling; supply chain disruption, stock damage and write off. This may increase capital expenditure, repairs and maintenance, and reduced tenant demand and/or rent premiums for less energy efficient buildings.
2. Transition Risk
a. Policy and Legal Risk: Currently represented by the proposed MEES regulation, but could include new or additional regulations. Any properties not compliant with MEES could reduce tenant demand, reduce rent premiums or result in fines.
b. Market: Energy costs may increase for tenants, shifting preferences for more energy efficient buildings and renewables.
c. Reputation: Tenants demand preferences may shift to lower carbon, highly energy efficient buildings, due to Net Zero commitments and their customer demands, reducing tenant demand and/or rent premiums.
This initial analysis has been expanded on in this reporting year with further qualitative and quantitative analysis undertaken over three potential risks, namely:
· Physical risk of flooding (both coastal and pluvial);
· Extreme heat; and
· Transition risks related to MEES, as discussed in the Strategy section above
These risks were selected due to their potential impact over different time horizons, with the proposed MEES regulations identified as a key near-term risk and flooding and extreme heat identified as potential longer-term risks, allowing a broader assessment of the Company's strategic response and resilience. The Company will look to further explore market and reputation related transition risks (both longer term transition risks) in the next reporting period.
In FY23, the Company also identified the following climate-related opportunity:
1. Climate-related opportunities:
a. Market: By accelerating deployment of energy efficient measures, setting a Science Based Target ("SBT") and better aligning with tenant preferences, the Company could gain a competitive advantage relative to other commercial landlords who are not as progressive on in their climate and sustainability related ambitions. This could enable increased tenant demand and rent premiums.
During the reporting period, the Company has acted on both the opportunity to set a SBT and continued deployment of energy efficient measures - including progressing roll out of rooftop solar PV and installation of EV across the portfolio. These measures and the Company's targets in relation to climate-related opportunities are discussed in more detail under the Metrics and Targets section of this report, in Tables B and E.
As identified above, a key progress milestone in the maturity of the Company's climate risk processes achieved in this reporting period is the adoption of the MSCI tool. The Company has used this tool to assist with quantitative scenario analysis and an assessment of the portfolio's exposure to climate-related physical risks and associated value at risk. The Physical Risk model integrated within the MSCI tool assesses the cost of physical risks on buildings, using climate data for the given locations of assets incorporating the hazards of extreme heat, extreme cold, fluvial and coastal flooding, tropical cyclones and wildfire (see Figure 3). A summary of the key climate data sets integrated into the MSCI Physical Risk model is included in the appendix of this TCFD Report.
Figure 3 | Physical Risk Hazards:
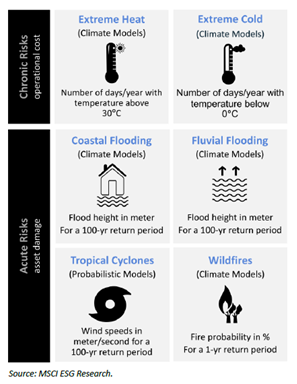
In addition to other result outputs considered, the MSCI tool was also used to conduct a physical risk assessment, identifying the percentage of the Company's assets at above negligible risk51. The assessment was undertaken against the two key physical risks that were qualitatively analysed in the Company's 2023 TCFD analysis, namely flood risk and extreme heat.
This is the first stage in the Company's project to develop plans to mitigate any material climate risks at an asset level.
The outputs of this assessment under the high emissions 3°C (Current Policies) temperature scenario (aggressive outcome)52 highlighted the following results for the portfolio53:
· When considering both flood and extreme heat independently, the majority of the Company's portfolio properties are exposed to negligible (>0 to 0.5% VaR) or no identifiable risk. The same can be said when considering aggregate physical risk overall.
· In terms of coastal flood risk, 89% of the portfolio properties has either no identifiable or negligible exposure to coastal flooding risk.
· In terms of fluvial flood risk, 83% of the portfolio properties has either no identifiable or negligible exposure to fluvial flooding risk.
· In terms of extreme heat risk, the results showed that no assets in the portfolio face more than negligible exposure to extreme heat under this scenario. Therefore, highlighting flood risk rather than extreme heat as a priority for further analysis. This is in line with the benchmark of MSCI UK Quarterly Supermarket Index which also identifies extreme heat as a negligible risk under this scenario.
These risks reduce under an Average Outcome 3°C (Current Policies) temperature scenario, and further reduce under a 1.5°C (Orderly) temperature scenario (under both an Aggressive and Average Outcome).
Over the next reporting cycle, the Company will undertake the next phase of its risk mitigation project and look to conduct further analysis over the outputs from this assessment. This will involve specific review into the assets identified from this assessment as being at above negligible exposure to flooding, including:
· Further investigation into the results through review of any historic flood or extreme heat events;
· Comparison against UK GOV flood risk scores and other publicly available research; and
· Review of any existing tenant or local government adaptation plans.
Through this ongoing work, the Company will aim to validate the results and to determine an appropriate strategic response and any planning required to address any identified risks, for example, the development of site-specific flood management plans or engagement of further environmental surveys.
While the outputs from the MSCI tool in terms of heat risk showed that this risk is financially immaterial at a direct asset level, the Company recognises that extreme heat still poses a potential indirect risk to the Company through the potential impact on its tenants and their supply chains.
In terms of transition risk, policy and legal risk related to the proposed MEES regulation was chosen as the key risk for the Company's transition risk analysis. Over the next reporting period, the Company intends to conduct a high-level assessment of the cost to retrofit our current portfolio to achieve compliance with the proposed MEES regulations in lieu of expected tenant-led investment. The Company also has a project underway to develop its first Transition Plan which will further outline the Company's actions and resources associated with its transition to net zero and actions to reduce the Company's GHG emissions in line with its science-based emissions reductions targets.
Going forward, the Company intends to take an iterative approach to scenario analysis as a strategic planning tool over time, as external tools and analytical choices evolve and the Company's analysis further matures.
Describe the impact of climate-related risks and opportunities on the organization's businesses, strategy, and financial planning.
The Company has identified two material risks, one per transition and physical, from the outputs of the scenario analysis conducted over this reporting period. The impact of each risk is likely to vary in magnitude across different time horizons and climate scenarios (as listed in Table A), and so the Company will continue to monitor and analyse these risks to better understand how they may unfold.
Table A below provides a description of each risk and the Company's assessment of potential impact and risk management strategy (including mitigating actions).
Table A | Climate-related risks summary
|
TCFD Risk Category |
Risk Description |
Time Horizon |
Potential Impact and Strategy (including mitigating actions) |
|
Transition Risk: Policy and Legal |
Proposed MEES regulation requiring portfolio assets to achieve a minimum of EPC B rating by 2030. |
Near-term (from now until 2030) |
1.5°C scenario (Net Zero): higher risk 3°C (Current Policies) scenario: lower risk The proposed MEES regulation is expected to require all commercial property to be a minimum EPC B by 2030. 56% of the Company's portfolio is currently rated B or above. This risk (and other policy and legal risks) is higher under a 1.5°C scenario which assumes the implementation of stringent climate policies required to reach net zero. The direct impact of the proposed regulation is reduced given the Full Repairing and Insuring ("FRI") nature of the leases54, and the ambitious emissions reduction and associated energy efficiency targets of the Company's major tenants. 75% of the UK portfolio is leased to Tesco and Sainsbury's, with both these tenants having set net zero by 2050 science-based targets, supported by commitments to retrofit their stores to improve energy efficiency over the near and medium-term. This tenant-led investment in energy efficiency measures (including upgrades to heating and cooling systems and refrigeration units) not reduces energy consumption but has also led to EPC rating improvements at no cost to the Company. In addition, SUPR has introduced a policy under which no asset with an EPC below C can be acquired unless a demonstrable EPC improvement plan is developed, the cost of which is reflected in the investment case for the asset acquisition. Opportunities for the installation of energy efficiency and renewable technology in support of the Net Zero transition (such as rooftop solar PV and EV charging) are also considered as part of the investment case. |
|
Physical Risk: Flooding |
Impact of acute physical risk of fluvial and coastal flooding. |
Long-term (2050 to 2100) |
1.5°C scenario (Net Zero): lower risk 3°C (Current Policies) scenario: higher risk The key potential impact of fluvial and coastal flooding is asset damage (building damage costs). This risk is higher under a 3°C scenario which assumes no additional climate policies are applied leading to significant global warming (exceeding 3°C) with severe physical risks including from sea-level rise, intense rainfall and associated flooding. The direct impact of flooding risk on the Company is reduced given the majority of the assets are on FRI leases, meaning the tenants have full insurance obligations. Flood risk is a key risk assessed as part of the Company's acquisition due diligence process. The Company has expanded upon its assessment of flood risk from initial UK Government online Flood Risk tool assessments to also utilise the flood risk assessment within the MSCI tool. If flood risk is identified in an acquisition opportunity further due diligence will be undertaken, for example additional site surveys and analysis, and consideration of any adaptation measures. The Company has identified the assets exposed to above negligible risk of flooding under different scenarios. The Company will explore how further changes to its strategy and financial planning may be required in light of this information, over the next reporting period. The Company's focus on investing in strong performing stores and the long-dated nature of the Company's leases already creates an incentive for the Company's tenants to build physical climate-resilience considerations into their own long-term management strategies for the stores they occupy. As the Company continues to enhance its climate-related engagement with tenants, it will also look to engage further on adaptation planning and tenants' plans in this respect. |
Describe the resilience of the organisation's strategy, taking into consideration different climate-related scenarios, including a 2°C or lower scenario.
The Company's scenario analysis outputs have highlighted the following findings:
· Overall, the current portfolio is not highly exposed to physical risks given the location of the assets.
· Of the physical risks assessed, flood risk is the most material risk for the portfolio.
· The impact of climate-related physical risks to the portfolio is expected to become more relevant in the long term under a high emissions scenario.
· Transitional risks are expected to be higher in the short term under a 1.5°C scenario driven by policy and legal changes, such as minimum EPC rating requirements, whereas under a 3°C scenario transition risks remain low over the short to medium-term until the point whereby policy and legal changes (particularly adaptation measures) are required to address increasing physical impacts.
The Company recognises that its strategy and financial planning regarding climate related risks and opportunities, will need to continue to evolve over the long term, particularly under a high emissions climate scenario. However, a benefit of owning mission critical real estate is that the Company's tenants make significant investments in maintaining, upgrading and decarbonising the Company's store estate. These investments are linked to the ambitious net zero targets and associated energy efficiency commitments of the Company's largest tenants. Not only do these investments drive improvements in energy consumption at the store level, they have also helped the Company to see an improvement in EPC ratings, supporting the Company with progress against its EPC-related improvement targets. In addition to acting as a transition risk mitigant, these decarbonisation investments and the long-dated nature of the Company's leases also create an incentive for the Company's tenants to build physical climate-resilience considerations into their own long-term management strategies for the stores they occupy.
During the reporting period, the Company has undertaken a range of initiatives aimed at enhancing its resilience to climate-related risks and capitalising on climate-related opportunities. This includes an ESG data sharing initiative, focused on gaining a better understanding of the energy consumption performance of the Company's tenants. For the first time, as outlined above, the Company has also conducted quantitative climate scenario analysis as part of the Company's efforts to better understand and manage the portfolio's exposure to climate-related risks and opportunities.
A key climate-related milestone for the Company has been the development of science-based emissions reduction targets. These targets were approved and validated by the SBTi at the beginning of 2024, they include a commitment to reduce our Scope 1 and 2 emissions by 42% by 2030 and to reduce Scope 1, 2 and 3 emissions 90% by 2050 (from a FY23 baseline). More details on the Company's SBTs are provided under the Metrics & Targets section of this report on page 48. As part of the development of the targets, the Company engaged external consultants, Anthesis, to prepare a high-level decarbonisation plan. The Company is currently building upon this initial plan through the development of its first Transition Plan. During the reporting period, the Company continued to seek out other opportunities to enhance the environmental performance of its assets and contribute to the net zero transition. This includes the continued roll out of EV charging and rooftop solar across the portfolio and the Company's efforts to encourage energy efficiency improvements by its tenants.
Risk Management
Describe the organisation's processes for identifying and assessing climate-related risks.
The Company's approach to risk assessment is as set out in the Our Principal Risks Section on pages 52 to 54.
The Board and the AIFM together have joint overall responsibility for the Company's risk management and internal controls, with the Audit and Risk Committee reviewing the effectiveness of the Board's risk management processes on its behalf. The ESG Committee is responsible under the delegated authority of the Board for the identification and monitoring of climate-related risks which are incorporated into the risk management process.
The ESG Committee considers both physical and transition climate-related risks, including existing and emerging regulatory requirements related to climate change.
The climate-related risks included in SUPR's Risk Register have since been updated to reflect the findings from this climate risk assessment.
Climate risk is also a standing agenda item at the fortnightly ESG meetings held between the Investment Adviser's Managing Director, ESG, and its Fund Management team. Additionally, the Investment Adviser seeks to ensure climate-related issues are a standing item when engaging with the Company's tenants. This includes discussion on topics such as any planned tenant-led investments in store refurbishments and energy efficiency upgrades, energy consumption data sharing and improvements to EPC ratings. Such engagement occurs multiple times per year and more frequently with larger site tenants.
Describe the organisation's processes for managing climate-related risks.
As part of the acquisition due diligence process, the Investment Adviser undertakes an assessment of each asset against a set of sustainability criteria. This includes consideration of climate-related risk, such as flood risk (using both the UK Government online Flood Risk tool and the MSCI tool) and assessing the emissions reduction targets of tenants to assess alignment with SUPR's own targets, as part of each transition review. The Company also obtains external environmental surveys on all acquisitions, which address the short-term risk of climate related damage to group properties. A summary of the climate-related risk assessments undertaken is included as part of each Investment Committee paper.
The Company will not recommend the acquisition of assets with an EPC of below a C unless a deliverable EPC improvement plan is prepared to improve an asset to an EPC rating of C or better. The cost of delivering the EPC Improvement plan forms part of the acquisition investment case. EPC rating assessments for existing assets in the portfolio are conducted on a rolling basis when there are known sustainable improvements to assets, on expiry or following a change to EPC calculation methodology. These ratings, as the Company's responsibility, are undertaken by the Company's consultants when required.
Both physical and transition climate risks associated with the Company's portfolio are assessed and included in the risk register. Materiality and prioritisation determinations are made through impact, likelihood, and risk scoring as a part of the risk register. Inherent and residual probabilities are assigned to each risk, from which a risk score is derived. Mitigating actions are described in detail in the risk register, laying out governance structure and processes in place aimed at mitigating each risk. Finally, actions taken to mitigate risks are tracked and recorded in the register.
Describe how processes for identifying, assessing, and managing climate-related risks are integrated into the organization's overall risk management.
The Company's approach to risk assessment is as set out in the Our Principal Risks Section on pages 52 to 54.
The Company manages its risk related to its emissions, and associated regulatory risk, by monitoring, measuring, and disclosing its Scope 1, 2, and 3 GHG emissions, and identifying available decarbonisation levers. This includes the preparation of the Company's first Transition Plan, currently under development, which builds off the decarbonisation analysis completed to prepare the Company's SBTs.
Tenant engagement is a core pillar of the Company's Sustainability Strategy and includes engagement on energy efficiency measures and support of tenants' own decarbonisation efforts and targets. As part of Scope 3 emissions initiatives over the last reporting period the Company has undertaken increased engagement efforts with tenants on energy consumption and other ESG performance data.
Should there be an incidence of flood, it is anticipated that a flooding report would be submitted by the tenants to the Investment Adviser. These can be consulted to inform the Company's risk and investment strategy.
Metrics and Targets
Disclose the metrics used by the organization to assess climate-related risks and opportunities in line with its strategy and risk management process.
To better understand and manage its climate-related risks and opportunities in line with its strategy and risk management process, the Company measures a number of climate-related metrics, see Table B below.
Table B | Climate-related metrics
|
Metric category |
Metric |
FY23 |
FY24 |
|
Transition risks |
% EPCs of UK supermarkets B or above (by valuations) |
50%55 |
56% |
|
% EPCs of UK ancillary units B or above (by valuations) |
35%55 |
53% |
|
|
% of actual energy consumption data from UK supermarket tenants used for GHG Inventory (vs estimated data) |
14% |
26%56 |
|
|
Physical risks |
% of UK supermarket assets in the portfolio screened for physical climate hazards |
Screening only at acquisition |
95%57 |
|
Climate-related opportunities |
% of UK supermarket assets with on-site renewable energy generation |
20%55 |
20% |
|
% of UK supermarket assets with on-site EV charging |
20% |
30% |
The Company has set ambitious climate-related targets, including both near-term and long-term/net zero emissions reduction targets. The Company is committed to ongoing reporting of progress against these targets as a means of transparency and accountability. A summary of the Company's science based targets and other core climate-related targets is provided in Table D and E.
Disclose Scope 1, Scope 2, and, if appropriate, Scope 3 GHG emissions, and the related risks.
The Company engaged external consultants, Anthesis, to prepare its GHG inventory for FY24, covering Scope 1, 2 and 3 emissions. The Company's full GHG inventory, prepared in line with the GHG Protocol methodology is disclosed below in Table C (see Appendix A for further details of the methodology).
Table C | GHG Inventory58
|
FY23 (as restated)59 |
FY24 |
|||
|
Location-based tCO2e |
Location-based tCO2e |
Market-based tCO2e |
Market-based (S1&2 & DLA) tCO2e |
|
|
Scope 1 Total |
10.49 |
11.46 |
11.46 |
11.46 |
|
Scope 2 Total |
100.81 |
91.87 |
162.38 |
162.38 |
|
1: Purchased Goods and Services |
3,131.50 |
2,214.70 |
2,214.70 |
2,214.70 |
|
2: Capital Goods |
463.49 |
0 |
0 |
0 |
|
3: Fuel- and Energy-Related Activities |
37.46 |
32.15 |
45.16 |
45.16 |
|
13: Downstream Leased Assets ("DLA") |
72,902.93 |
72,030.53 |
72,030.53 |
67,008.85 |
|
Scope 3 Total |
76,535.38 |
74,277.38 |
74,290.39 |
69,268.71 |
|
Scope 1,2,3 Total |
76,646.68 |
74,380.71 |
74,464.23 |
69,442.55 |
|
Intensity ratio: tCO2e (gross Scope 1 & 2) per m2 of floor area |
0.00047 |
0.00037 |
0.00062 |
0.00062 |
|
Intensity ratio: tCO2e (gross Scope 1, 2 & 3) per m2 of floor area |
0.09201 |
0.08345 |
0.08355 |
0.07791 |
The Company's scope 1, 2 and 3 emissions total 74,381 tCO2e (location-based) in its FY24 reporting year. Scope 3 accounts for the vast majority of the Company's emissions at more than 99%, totalling 74,277 tCO2e (location-based). This is to be expected as the Company's scope 1 and 2 emissions from the communal spaces of its assets is relatively immaterial, producing 103 tCO2e (location-based) collectively. The majority of the Company's emissions come from their leased properties which sit under scope 3, category 13 downstream leased assets.
The GHG Inventory figures have removed FERA emissions that are categorised under Scope 3 category 13: Downstream Leased Assets ("DLA") to align with the SBTi minimum boundary alignment. These FERA emissions are associated with the tenants Scope 1 and 2 emissions that are also categorised under Scope 3 DLA. The figures reported in SECR Report above account for a fuller view of DLA emissions by including FERA emissions under Scope 3 DLA. Therefore, Scope 3 DLA and consequentially, total Scope 3 figures reported in the SECR Report are higher than figures reported for TCFD due to the exclusion of Scope 3 FERA under DLA in TCFD.
[The Company engaged Grant Thornton UK LLP to provide independent limited assurance over the Company's location-based GHG emission data disclosed in the table above, using the assurance standard ISAE 3000 (Revised) and ISAE 3410, for the year ending 30 June 2024. Grant Thornton has issued an unqualified opinion over the selected data and the full assurance report is available on the Sustainability page of the Company's website: Sustainability - Supermarket Income REIT].
Improving the quantity of actual (vs. estimated) energy consumption data, has been a priority for the Company over the reporting period. As a result, the amount of estimated data has reduced, from 84% estimated in FY23 to 71% estimated data for this reporting period. The majority of the Company's emissions from downstream leased assets come from assets leased out to supermarkets. Therefore, the Company has prioritised engagement on data sharing with its supermarket tenants. As a result of these engagement efforts with supermarket tenants specifically the following improvements have been made:
· The amount of actual purchased electricity data in FY23 was 23%, improving to 52% actual data in FY24;
· The amount of actual natural gas consumption data in FY23 was 27%, improving to 70% actual data in FY24.
This has subsequently improved the overall accuracy of the Company's emissions disclosures on prior year. This is a marked improvement from FY22 where 100% of emissions were estimated. This was achieved through a combination of measures including the development of new tenant data request template, aligned to the reporting requirements of EPRA sBPR and the Sustainability Accounting Standards Board ("SASB") real estate standard. The Company has identified engagement with supermarket tenants on refrigeration gas data, which is currently 100% estimated, as a key priority over the next reporting year. Details of the remaining assumptions and proxies used to complete the Company's GHG inventory where actual data was not available, are outlined in the Appendix A.
During the reporting period, the Company worked with external consultants, Anthesis, to prepare and submit science-based emissions reductions targets to the SBTi, see Table D below. These targets were validated and approved by the SBTi at the beginning of 2024.
Table D | - Science Based Targets
|
Target |
Description |
|
Near-term |
The Company commits to reduce scope 1 and scope 2 emissions 42% by 2030 from a FY23 baseline. |
|
Long-term |
The Company commits to reduce scope 1, 2 and 3 emissions 90% by 2050 from a FY23 baseline. |
|
Net Zero |
The Company commits to reach net-zero by 2050. |
Describe the targets used by the organization to manage climate-related risks and opportunities and performance against targets.
In addition to the Company's science-based targets, a number of other climate-related targets are used by the Company to manage climate-related risks and opportunities, see Table E below. These targets have been developed to link to the transition and physical risks identified as part of the Company's TCFD reporting.
Table E | - Climate-related targets linked to metrics
|
Metric category |
Metric |
Target |
|
Transition risks |
% EPCs of UK supermarkets B or above (by valuations) |
All UK supermarkets60 B or above by 2030 |
|
% EPCs of UK ancillary units B or above (by valuations) |
All UK ancillary units61 B or above by 2030 |
|
|
% of actual energy consumption data from UK supermarket tenants used for GHG Inventory (vs estimated data) |
YoY increase in % actual energy consumption data from UK supermarket tenants used for GHG Inventory |
|
|
Physical risks |
% of UK supermarket assets in the portfolio screened for physical climate hazards |
All assets included in annual portfolio climate risk analysis |
|
Climate-related opportunities |
% of UK supermarket assets with on-site renewable energy generation |
YoY increase in % of supermarket assets with on-site renewable energy generation |
|
% of UK supermarket assets with on-site EV charging |
YoY increase in % of supermarket assets with on-site EV charging |
Given the FRI nature of the majority of the Company's lease arrangements and associated limitations to site control, the Company has not yet set further specific targets with regards to the percentage of on-site solar PV installed and on-site EV charging. However, the Company is committed to increasing the number of assets with both on-site solar PV installed and on-site EV charging and continues to actively engage with tenants on such opportunities and to support installations wherever feasible.
During the reporting year, the Company achieved the following two climate-related targets that were included in its FY23 TCFD Report:
|
Target |
Metric |
Status |
|
100% of Investment Adviser staff receive training on climate risks and opportunities by end of 2023 |
Percentage of staff trained |
100%. Target achieved. |
|
Five sites with Company-owned and managed car parks with electronic vehicle charging |
Number of EV charging stations |
5 of 5. Target achieved. |
Additional climate-related training will continue be rolled out on an ad-hoc basis to the Investment Adviser team and to new joiners. Most recently, this has covered topics such as quantitative scenario analysis and transition planning fundamentals. The Company will review its selection of climate-related metrics and targets over the next reporting period to ensure that it continues to measure and manage its climate-related risks and evolve its approach to meet best practice guidance and stakeholder expectations.
Appendix A: Methodology notes for GHG inventory
Methodology and Assumptions
The 2022 Conversion Factors published by the UK Department for Energy Security and Net Zero ("DESNZ") and Department for Business, Energy, and Industrial Strategy ("BEIS") was the main source used for emission factors. All relevant categories have been included and any exclusions are described below.
Scope 1 & 2
For electricity and natural gas, some actual consumption data was provided for communal areas where energy consumption is controlled by SUPR. Where there were gaps, estimations were made using the data from previous year or floor area intensities (based on similar sites within the portfolio) as proxies. For fuel oil, spend was used as a proxy due to a lack of activity data.
Scope 3 (1. Purchased Goods & Services)
This category was estimated using spend as a proxy and applying Department for Environment, Food & Rural Affairs ("DEFRA") input-output factors kgCO2/GBP) to expenditure.
Scope 3 (13. Downstream Leased Assets)
The majority of emissions relate to tenant energy use, particularly for supermarket branches. Some supermarket tenants, including Tesco, Sainsbury's and M&S provided actual consumption data for electricity and heating. Where no consumption data was available, estimations were made using benchmark intensity data based on floor area. The majority of refrigerant consumption was estimated for all sites.
A smaller amount of emissions arises from the communal areas of sites where the Company owns the land but is not responsible for paying for the energy. These emissions were estimated using the floor area intensities of similar sites with actual data.
MSCI Physical Risk Model Data Inputs
Hazard Level Main Models and Datasets:
|
Hazard |
Type |
Severity |
Resolution |
Main Models and Datasets |
|
Extreme Cold |
Chronic |
Number of days <0°C and <-10°C |
56km v 42km |
· CMIP6 climate models: GFDL-ESM4, IPSL-CM6A-LR, MPI-ESM1-2-HR, MRI-ESM2-0, UKESM1-0-LL · Climate projections are bias-adjusted |
|
Extreme Heat |
Chronic |
Number of days >30°C and >35°C |
56km v 42km |
|
|
Coastal Flooding |
Acute |
Inundation depth (metres) Flood distribution from 1yr to >10,000yr event |
90m x 70m |
· Regional sea level rise projections from Integrated Climate Data Center · Elevation data from Coastal DEM (upgraded Digital Elevation Model - Climate Central / NASA) |
|
Fluvial Flooding |
Acute |
Inundation depth (metres) Flood distribution from 1yr to >10,000yr event |
90m x 70m |
· Dailing fluvial flooding timeseries provided by Potsdam Institute for Climate Impact Research · Elevation data from Coastal DEM from Climate Central which is complemented by data from SRTM |
|
Tropical Cyclones |
Acute |
Wind speed (metres/second) Cyclone distribution from 1yr to >10,000yr event |
11km x 9km |
· CLIMADA · International Best Track Archive for Climate Stewardship (IBTRaCS) |
|
Wildfire |
Acute |
Fire probability (% annual) |
460m x 355m |
· 4 components: fire weather, fire ignition, fire spread and fire intensity · Fire weather & ignition: Canadian Forest Fire Weather Index (FWI) · Fire spread: Global Land Cover 2000 dataset; Elevation is derived from the GMTED2010 dataset · Fire intensity: Global Fire Atlas |
Principal Risks and Uncertainties
The Board and JTC Global AIFM Solutions Limited, the Company's Alternative Investment Fund Manager (the "AIFM"), together have joint overall responsibility for the Company's risk management and internal controls, with the Audit and Risk Committee reviewing the effectiveness of the Board's risk management process on its behalf.
To ensure that risks are recognised and appropriately managed, the Board has agreed a formal risk management framework. This framework sets out the mechanisms through which the Board identifies, evaluates and monitors its principal risks and the effectiveness of the controls in place to mitigate them.
The Board and the AIFM recognise that effective risk management is key to the Group's success. Risk management ensures a defined approach to decision making that seeks to decrease the uncertainty surrounding anticipated outcomes, balanced against the objective of creating value for shareholders.
The Board determines the level of risk it will accept in achieving its business objectives and this has not changed during the year. We have no appetite for risk in relation to regulatory compliance or the health, safety and welfare of our tenants, service providers and the wider community in which we work. We continue to have a moderate appetite for risk in relation to activities which drive revenues and increase financial returns for our investors.
There are a number of potential risks and uncertainties which could have a material impact on the Company's performance over the forthcoming financial year and could cause actual results to differ materially from expected and historical results.
The risk management process includes the Board's identification, consideration and assessment of those emerging risks which may impact the Group.
Emerging risks are specifically covered in the risk framework, with assessments made both during the regular risk review and as potential significant risks arise. The assessment includes input from the Investment Adviser and review of information by the AIFM prior to consideration by the Audit and Risk Committee.
During the year, the Audit and Risk Committee, together with the AIFM and Investment Adviser, undertook a review of the risk management reporting framework. As a result of this exercise, the Board reviewed all risks and decided to rationalise the principal risks from 17 risks, as set out in the 2023 Annual Report, to 10 risks.
The matrix below illustrates our assessment of the impact and the probability of the principal risks identified. The rationale for the perceived increases and decreases in the risks identified is contained in the commentary for each risk category.
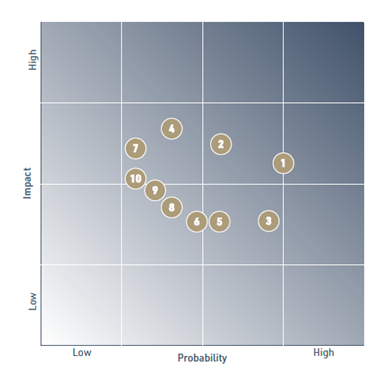
|
Key |
|
|
1 |
There can be no guarantee that the dividend will grow in line with inflation. |
|
2 |
The lower-than-expected performance of the property portfolio leading to a significant fall in property valuations. |
|
3 |
Shareholders may not be able to realise their shares at a price above or the same as they paid for the shares or at all. |
|
4 |
The default of one or more of our grocery tenants would reduce revenue and may affect our ability to pay dividends. |
|
5 |
Inflationary pressure on the valuation of the portfolio. |
|
6 |
Ability to source assets may be affected by competition for investment properties in the supermarket sector. |
|
7 |
The Company is reliant on the continuance of the Investment Adviser. |
|
8 |
Impact of geopolitical conflict / major events. |
|
9 |
Changes in regulatory policy could lead to our assets becoming unlettable. |
|
10 |
We operate as a UK REIT and have a tax-efficient corporate structure. Loss of REIT status could have adverse tax consequences for UK shareholders. |
|
Risk |
Impact |
Mitigation |
Change in Year |
|
1. There can be no guarantee that the dividend will grow in line with inflation. |
The Company has a stated ambition to grow its dividend progressively and its prospectus refers to providing investors with inflation protection. Although the Company has received 100% of rent demanded, has increased rents in line with its contractual rent reviews and has one of the lowest EPRA cost ratios in the sector, it has been unable to increase its earnings and dividend in line with inflation. This has been caused primarily by the cap on rental uplifts in the majority of the Company's leases and the increase in cost of debt due to higher interest rates. Increases in interest rates result in higher cost of debt and lower earnings. |
The Company has entered into interest rate swaps and caps to manage its exposure to further increases in interest rates. Interest rates have started to decline from their highs last year which, if continued, would be supportive of earnings and dividend growth over the long term beyond expiry of current interest rate hedges. The Company is proactively pursuing a number of measures to grow earnings, such as accretive acquisitions and cost reductions. |
 |
|
2. The lower-than-expected performance of the property portfolio leading to a significant fall in property valuations. |
An adverse change in our property valuations may lead to a breach of our banking covenants. Market conditions may also reduce the revenues we earn from our property assets, which affect our ability to pay dividends to shareholders. A severe fall in values may result in us selling assets to repay our loan commitments, resulting in a fall in our net asset value. |
Our portfolio is 99.5% let (100% of supermarket units are let) with long weighted unexpired lease terms and let to institutional-grade tenants. We own a portfolio of handpicked, high-quality supermarkets which deliver low-risk and growing income returns that are resilient through economic cycles. We manage our activities to operate within our banking covenants and constantly monitor our covenant headroom on loan to value and interest cover. |
|
|
3. Shareholders may not be able to realise their shares at a price above or the same as they paid for the shares or at all. |
The Company's ordinary shares have continued to be traded at a discount to net tangible assets ("NTA"). This is largely a function of supply and demand for the ordinary shares in the market and cannot therefore be controlled by the Board. |
The Company may seek to address any significant discount to NTA at which its ordinary shares may be trading by purchasing its own ordinary shares in the market on an ad-hoc basis. Ordinary shares will be repurchased only at prices below the prevailing NTA per Ordinary share, which should have the effect of increasing the NTA per Ordinary share for remaining shareholders. Investors should note that the repurchase of Ordinary shares is entirely at the discretion of the Board and no expectation or reliance should be placed on such discretion being exercised on any one or more occasions or as to the proportion of Ordinary shares that may be repurchased. |
|
|
4. The default of one or more of our grocery tenants would reduce revenue and may affect our ability to pay dividends. |
Our focus on supermarket property means we directly rely on the performance of supermarket operators. Insolvencies could affect our revenues earned and property valuations. |
Our investment policy requires the Group to derive at least 60% of its rental income from a portfolio let to the largest four supermarket operators in the UK by market share. Focusing our investments on assets let to tenants with strong financial covenants and limiting exposure to smaller operators in the sector decreases the probability of a tenant default. At 30 June 2024, 75% of SUPR's income was from assets let to Tesco and Sainsbury's who are deemed investment grade credit quality. The portfolio continues to be geographically diversified with no individual tenant operating within more than 10-15 minutes of one of the Group's assets in any single geographical area. Our investment strategy is to acquire assets in strong trading grocery locations, which in many cases have been supermarkets for between 30 and 50 years. Our investment underwriting targets strong tenants with strong property fundamentals (good location, large sites with low site cover) and which should be attractive to other occupiers or have strong alternative use value should the current occupier fail. |
|
|
5. Inflationary pressure on the valuation of the portfolio. |
Continued high inflation may cause rents to exceed market levels and result in the softening of valuation yields. Where leases have capped rental uplifts, high inflation may cause rent reviews to cap out at maximum values, causing rental uplifts to fall behind inflation. |
Inflation is monitored closely by the Investment Adviser. The Group's portfolio rent reviews include a mixture of fixed, upward only capped as well as open market rent reviews, to hedge against a variety of inflationary outcomes. |
|
|
6. Ability to source assets may be affected by competition for investment properties in the supermarket sector. |
The Company faces competition from other property investors. Competitors may have greater financial resources than the Company and a greater ability to borrow funds to acquire properties. The supermarket investment market continues to be considered a safe asset class for investors seeking long-term secure cash flows which is maintaining competition for quality assets. This has led to increased demand for supermarket assets without a comparable increase in supply, which potentially increases prices and makes it more difficult to deploy capital. |
The investment Adviser has extensive contacts in the sector and we often benefit from off-market transactions. They also maintain close relationships with a number of investors and agents in the sector, giving us the best possible opportunity to secure future acquisitions for the Group. The Company has acquired assets which are anchored by supermarket properties but which also have ancillary retail on site, and these acquisitions allow the Company to access quality supermarket assets whilst providing additional asset management opportunities. We are not exclusively reliant on acquisitions to grow the portfolio. Our leases contain upward-only rent review clauses, which mean we can generate additional income and value from the current portfolio. We also have the potential to add value through active asset management and we are actively exploring opportunities for all our sites. We maintain a disciplined approach to appraising and acquiring assets, engaging in detailed due diligence and do not engage in bidding wars which drive up prices in excess of underwriting. |
|
|
7. The Company is reliant on the continuance of the Investment Adviser. |
We rely on the Investment Adviser's services and reputation to execute our investment strategy. Our performance will depend to some extent on the Investment Adviser's ability and the retention of its key staff. |
The interests of the Company and the Investment Adviser are aligned due to (a) key staff of the Investment Adviser having personal equity investments in the Company and (b) any fees paid to the Investment Adviser in shares of the Company are due to be held for a minimum period of 12 months. The Board can pay up to 25% of the Investment Adviser's fee in shares of the Company. The Management Engagement Committee assesses the performance of the Investment Adviser and ensures the Company maintains a positive working relationship. The AIFM receives and reviews regular reporting from the Investment Adviser and reports to the Board on the Investment Adviser's performance. The AIFM also reviews and makes recommendations to the Board on any investments or significant asset management initiatives proposed by the Investment Adviser. |
|
|
8. Impact of geopolitical conflict / major events. |
Global, regional and national events, such as terrorism, pandemics, and geopolitical conflict could adversely impact the Company, and present challenges to our tenants resulting in impairment of asset values and/or a reduction in revenue. |
Supermarket operators have historically been able to successfully pass on inflationary increases through price increases to the end consumer. Whilst sales volumes may fall in a recessionary environment, the nature of food means that demand is relatively inelastic. Our tenants have strong balance sheets with robust and diversified supply chains. The tenants are therefore well positioned to deal with any disruption that may occur. |
|
|
9. Changes in regulatory policy could lead to our assets becoming unlettable. |
Changes in regulations (currently represented by Minimum Energy Efficiency Standards (MEES)) could lead to the possibility of our assets becoming unlettable. Any properties not compliant with MEES could attract reduced tenant demand, reduced rental income and/or be subject to fines. |
The ESG committee stays informed about changes in legislation by working closely with the Investment Adviser and seeks input from specialist ESG experts where necessary. Proposed updates to MEES, together with updates on businesses to develop Net Zero transition plans are being closely monitored. |
|
|
10. We operate as a UK REIT and have a tax-efficient corporate structure, with advantageous consequences for UK shareholders. |
If the Company fails to remain a REIT for UK tax purposes, our profits and gains will be subject to UK corporation tax. |
The Board takes direct responsibility for ensuring we adhere to the UK REIT regime by monitoring REIT compliance. The Board has also engaged third-party tax advisers to help monitor REIT compliance requirements and the AIFM monitors compliance by the Company with the REIT regime. |
|


SECTION 172(1) STATEMENT
The Directors consider that in conducting the business of the Company over the course of the year ended 30 June 2024, they have acted to promote the long-term success of the Company for the benefit of shareholders, whilst having regard to the matters set out in section 172(1)(a-f) of the Companies Act 2006 (the "Act").
Details of our key stakeholders and how the Board engages with them can be found on pages 56 to 59. Further details of the Board activities and principal decisions are set out on pages 72 to 73 providing insight into how the Board makes decisions and their link to strategy.
Other disclosures relating to our consideration of the matters set out in s172(1)(a-f) of the Act have been noted as follows:
|
s.172 Factor |
Our approach |
Relevant disclosures |
|
A. The likely consequences of any decision in the long-term |
The Board has regard to its wider obligations under Section 172 of the Act. As such strategic discussions involve careful considerations of the longer-term consequences of any decisions and their implications on shareholders and other stakeholders and the risk to the longer-term success of the business. Any recommendation is supported by detailed cash flow projections based on various scenarios, which include: availability of funding; borrowing; as well as the wider economic conditions and market performance. |
Key decisions of the Board during the year on page 73. Our Key Stakeholder Relationships on pages 56 to 59. Board Activities during the year on pages 72. |
|
B. The interests of the Company's employees |
The Group does not have any employees as a result of its external management structure. The Board's main working relationship is with the Investment Adviser. Consequently, the Directors have regard to the interests of the individuals who are responsible for delivery of the investment advisory services to the Company to the extent that they are able to do so. |
Our Key Stakeholder Relationships on pages 56 to 59. Culture on page 69. |
|
C. The need to foster the Company's business relationships with suppliers, customers and others |
The Company's key service providers and customers include the Investment Adviser, professional firms such as lenders, property agents, accounting and law firms, tenants with which we have longstanding relationships and transaction counterparties which are generally large and sophisticated businesses or institutions. |
Our Key Stakeholder Relationships on pages 56 to 59. |
|
D. The impact of the Company's operations on the community and the environment |
As an owner of assets located in communities across the UK and France, we aim to ensure that our buildings and their surroundings provide safe and comfortable environments for all users. The Board and the Investment Adviser have committed to limiting the impact of the business on the environment where possible and engage with tenants to seek to improve the ESG credentials of the properties owned by the Company. |
Our Key Stakeholder Relationships on pages 56 to 59. Details of the ESG policy and strategy are included on pages 39 to 51. The Board's approach to sustainability is also explained in the Company's standalone sustainability report available on the Company website. |
|
E. The desirability of the Company maintaining a reputation for high standards of business conduct |
The Board is mindful that the ability of the Company to continue to conduct its investment business and to finance its activities depends in part on the reputation of the Board, the Investment Adviser and Investment Advisory Team. The risk of falling short of the high standards expected and thereby risking business reputation is included in the Audit and Risk Committee's review of the Company's risk register, which is conducted at least annually. |
Chair's Letter on Corporate Governance on page 63. Our Principal Risks and Uncertainties on pages 52 to 54. Our Culture on page 69. |
|
F. The need to act fairly as between members of the Company |
The Board recognises the importance of treating all members fairly and oversees investor relations initiatives to ensure that views and opinions of shareholders can be considered when setting strategy. |
Chair's Letter on Corporate Governance on pages 63. Our Key Stakeholder Relationships on pages 56 to 59. |
Going Concern and Viability Statement
The Directors have considered on the appropriateness of adopting the going concern basis in preparing the Group's and Company's financial statements for the year ended 30 June 2024. In assessing the going concern basis of accounting, the Directors have considered the prospects of the Group over the period up to 30 September 2025.
Liquidity
At 30 June 2024, the Group generated net cash flow from operating activities of £92.1 million, held cash of £38.7 million and undrawn committed facilities totalling £104.2 million (including £50 million accordion) with no capital commitments or contingent liabilities.
After the year end, the Group also increased its debt capacity from £752.0 million to £825.4 million (see Note 19 for more information), leaving undrawn committed facilities of £176.0 million available (including £50 million accordion).
The Directors are of the belief that the Group continues to be well funded during the going concern period with no concerns over its liquidity.
Refinancing events
At the date of signing the financial statements, the Wells Fargo £39 million loan facility (of which £30 million is drawn) and £50 million of the syndicate unsecured term loan fall due for repayment during the going concern period. It is intended that the facilities will be refinanced prior to maturity, or if required, paid down in full utilising the Group's available cash balances and undrawn committed facilities of over £117 million (including post balance sheet events). All lenders have been supportive during the year and have expressed commitment to the long-term relationship they wish to build with the Company.
Covenants
The Group's debt facilities include covenants in respect of LTV and interest cover, both projected and historic. All debt facilities, except for the unsecured facilities, are ring-fenced with each specific lender.
The Directors have evaluated a number of scenarios as part of the Group's going concern assessment and considered the impact of these scenarios on the Group's continued compliance with debt covenants. The key assumptions that have been sensitised within these scenarios are falls in rental income and increases in administrative cost inflation.
As at the date of issuance of this financial information 100% of contractual rent for the period has been collected. The Group benefits from a secure income stream from its property assets that are let to tenants with excellent covenant strength under long leases that are subject to upward only rent reviews.
The list of scenarios are below and are all on top of the base case model which includes prudent assumptions on valuations and cost inflation. The Group is 100% fixed or hedged (including post period end refinancings). No sensitivity for movements in interest rates have been modelled for the hedged debt during the going concern assessment period.
|
Scenario |
Rental Income |
Costs |
|
Base case scenario (Scenario 1) |
100% contractual rent received when due and rent reviews based on forward looking inflation curve, capped at the contractual rate of the individual leases. |
Investment adviser fee based on terms of the signed agreement (percentage of NAV as per note 27), other costs in line with contractual terms. |
|
Scenario 2 |
Rental income to fall by 20% |
Costs expected to remain the same as the base case. |
|
Scenario 3 |
Rental Income expected to remain the same as the base case. |
10% increases on base case costs to all administrative expenses |
The Group continues to maintain covenant compliance for its LTV and ICR thresholds throughout the going concern assessment period under each of the scenarios modelled. The lowest amount of ICR headroom experienced in the worst-case stress scenarios was 42%. Based on the latest bank commissioned valuations, property values would have to fall by more than 26% before LTV covenants are breached, and 19% against 30 June 2024 Company valuations. Similarly, the strictest interest cover covenant within each of the ring-fenced banking groups is 225%, where the portfolio is forecast to have an average interest cover ratio of 425% during the going concern period.
Having reviewed and considered the scenarios, the Directors consider that the Group has adequate resources in place for at least 12 months from the date of these results and have therefore adopted the going concern basis of accounting in preparing the Annual Report.
Assessment of viability
The period over which the Directors consider it feasible and appropriate to report on the Group's viability is the five-year period to 30 June 2029. This period has been selected because it is the period that is used for the Group's medium-term business plans and individual asset performance forecasts. The assumptions underpinning these forecast cash flows and covenant compliance forecasts were sensitised to explore the resilience of the Group to the potential impact of the Group's significant risks, or a combination of those risks. The principal risks on pages 52 to 54 summarise those matters that could prevent the Group from delivering on its strategy. A number of these principal risks, because of their nature or potential impact, could also threaten the Group's ability to continue in business in its current form if they were to occur. The Directors paid particular attention to the risk of a deterioration in economic outlook which could impact property fundamentals, including investor and occupier demand which would have a negative impact on valuations, and give rise to a reduction in the availability of finance.
The sensitivities performed were designed to be severe but plausible; and to take full account of the availability of mitigating actions that could be taken to avoid or reduce the impact or occurrence of the underlying risks.
Viability Statement
The Board has assessed the prospects of the Group over the five years from the balance sheet date to 30 June 2029, which is the period covered by the Group's medium-term financial projections.
The Board considers the resilience of projected liquidity, as well as compliance with secured debt covenants and UK REIT rules, under a range of inflation and property valuation assumptions.
The principal risks and the key assumptions that were relevant to this assessment are as follows:
|
Risk |
Assumption |
|
Borrowing risk |
The Group continues to comply with all relevant loan covenants. The Group is able to refinance all debt falling due within the viability assessment period on acceptable terms. |
|
Interest Rate Risk |
The increase in variable interest rates are managed by reduction of variable debt from cash inflows and utilising interest rate derivatives to limit the exposure to variable debt. |
|
Liquidity risk |
The Group continues to generate sufficient cash to cover its costs while retaining the ability to make distributions. |
|
Tenant risk |
Tenants (or guarantors where relevant) comply with their rental obligations over the term of their leases and no key tenant suffers an insolvency event over the term of the review. |
Based on the work performed, the Board has a reasonable expectation that the Group will be able to continue in business over the five-year period of its assessment.
Other disclosures
Disclosures in relation to the Company's business model and strategy have been included within the Investment Adviser's Report on pages 14 to 22. Disclosures in relation to the main industry trends and factors that are likely to affect the future performance and position of the business have been included within The UK Grocery Market on pages 25 to 33. Disclosures in relation to environmental and social issues have been included within the TCFD Report on pages 39 to 51. Employee diversity disclosures have not been included as the Directors do not consider these to be relevant to the Company.
Key Performance Indicators (KPIs)
The KPIs and EPRA performance measures used by the Group in assessing its strategic progress have been included on pages 34 to 35.
The Strategic Report was approved by the Board and signed on its behalf by:
Nick Hewson
Chair
17 September 2024
DIRECTORS' REPORT
The Directors present their report together with the audited financial information for the year ended 30 June 2024. The Corporate Governance Statement on pages 74 to 75 forms part of this report.
Principal activities and status
The Company is registered as a UK public limited company under the Companies Act 2006. It is an Investment Company as defined by Section 833 of the Companies Act 2006 and has been established as a Closed-ended investment company with an indefinite life. The Company has a single class of shares in issue which were traded during the year on the on the Closed-ended investment funds category of the LSE's Main Market. The Group has entered the Real Estate Investment Trust regime for the purposes of UK taxation.
The Company is a member of the Association of Investment Companies (the "AIC").
Results and dividends
The results for the year are set out in the attached financial information. It is the policy of the Board to declare and pay dividends as quarterly interim dividends.
In respect of the 30 June 2024 financial year, the Company has declared the following interim dividends amounting to 6.06 pence per share (2023: 6.00 pence per share).
|
Relevant Period |
Dividend per share (pence) |
Ex-dividend date |
Record date |
Date paid |
|
Quarter ended 30 September 2023 |
1.515 |
12 October 2023 |
13 October 2023 |
16 November 2023 |
|
Quarter ended 31 December 2023 |
1.515 |
11 January 2024 |
12 January 2024 |
14 February 2024 |
|
Quarter ended 31 March 2024 |
1.515 |
11 April 2024 |
12 April 2024 |
16 May 2024 |
|
Quarter ended 30 June 2024 |
1.515 |
11 July 2024 |
12 July 2024 |
16 August 2024 |
Dividend policy
Subject to market conditions and performance, financial position and outlook, it is the Directors' intention to pay an attractive level of dividend income to shareholders on a quarterly basis. The Company intends to grow the dividend progressively through investment in supermarket properties with upward-only, predominantly inflation-protected, long-term lease agreements.
Directors
The names of the Directors who served in the year ended 30 June 2024 are set out in the Board of Directors section on pages 64 to 65 together with their biographical details and principal external appointments.
Powers of Directors
The Board will manage the Company's business and may exercise all the Company's powers, subject to the Articles, the Companies Act and in certain circumstances, are subject to the authority being given to the Directors by shareholders in the general meeting.
The Board's role is to provide entrepreneurial leadership of the Company within a framework of prudent and effective controls that enable risk to be assessed and managed. It also sets up the Group's strategic aims, ensuring that the necessary resources are in place for the Group to meet its objectives and review investment performance. The Board also sets the Group's values, standards and culture. Further details on the Board's role can be found in the Corporate Governance Report on page 63.
Appointment and replacement of Directors
All Directors were elected or re-elected at the AGM on 7 December 2023. In accordance with the AIC Code, all the Directors will retire and those who wish to continue to serve will offer themselves for election or re-election at the forthcoming Annual General Meeting.
Directors' indemnity
The Company maintains £35 million of Directors' and Officers' Liability Insurance cover for the benefit of the Directors, which was in place throughout the year. The level of cover was increased to £40 million on 4 July 2024 and continues in effect at the date of this report.
Significant shareholdings
The table below shows the interests in shares notified to the Company in accordance with Chapter 5 of the Disclosure Guidance and Transparency Rules issued by the Financial Conduct Authority who have a disclosable interest of 3% or more in the ordinary shares of the Company as at 30 June 2024.
|
Number of shares |
Percentage of issued share capital |
|
|
Blackrock Inc. |
68,196,517 |
5.46% |
|
Schroders Plc |
63,131,941 |
5.08% |
|
Close Brothers Asset Management |
62,147,569 |
4.99% |
|
Quilter Plc |
62,058,617 |
4.99% |
|
Ameriprise Financial, Inc. |
61,728,272 |
4.98% |
Since the year end, and up to 17 September 2024, the Company has not received any further notifications of changes of interest in its ordinary shares in accordance with DTR 5. The information provided is correct as at the date of notification.
Donations and contributions
The Group approved a donation of £120,000 to The Atrato Foundation during the year which was settled post year end.
Branches outside the UK
The Company has no branches outside the UK.
Financial risk management
The Group's exposure to, and management of, capital risk, market risk and liquidity risk is set out in note 21 to the Group's financial information.
Amendments to the Articles
The Articles may only be amended with shareholders' approval in accordance with the relevant legislation.
Employees
The Group has no employees and therefore no employee share scheme or policies for the employment of disabled persons or employee engagement.
Anti-bribery policy
The Company has a zero-tolerance policy towards bribery and is committed to carrying out its business fairly, honestly and openly. The anti-bribery policies and procedures apply to all its Directors and to those who represent the Company.
Human Rights
The Company has a zero-tolerance approach to modern slavery and human trafficking and is committed to ensuring its organisation and business partners operate with the same values. The Company's modern slavery and human trafficking statement can be found on the Company's website.
Research and development
No expenditure on research and development was made during the period.
Related party transactions
Related party transactions for the year ended 30 June 2024 can be found in note 28 of the financial information.
Annual General Meeting
The Annual General Meeting of the Company will be held on 3 December 2024.
Greenhouse gas emissions
As a listed entity, the Company is required to comply with the SECR regulations under the Companies (Directors' Report) and Limited Liability Partnerships (Energy and Carbon Report) Regulations 2018. Information regarding emissions arising from the Group's activities are included within the TCFD aligned report on pages 39 to 51.
Disclosure of information to auditor
All of the Directors have taken all the steps that they ought to have taken to make themselves aware of any information needed by the auditor for the purposes of their audit and to establish that the Auditor is aware of that information. The Directors are not aware of any relevant audit information of which the auditor is unaware.
Significant agreements
There are no agreements with the Company or a subsidiary in which a Director is or was materially interested or to which a controlling shareholder was party.
Share capital structure
As at 30 June 2024, the Company's issued share capital consisted of 1,246,239,185 ordinary shares of one penny each, all fully paid and listed on the Closed-ended investment funds category of the FCA's Official List of the LSE's Main Market. Further details of the share capital, including changes throughout the year are summarised in note 22 of the financial information.
Subject to authorisation by Shareholder resolution, the Company may purchase its own shares in accordance with the Companies Act 2006. At the Annual General Meeting held in 2023, shareholders authorised the Company to make market purchases of up to 186,811,253 Ordinary Shares. The Company has not repurchased any of its ordinary shares under this authority, which is due to expire at the AGM in 2024 and appropriate renewals will be sought.
There are no restrictions on transfer or limitations on the holding of the ordinary shares. None of the shares carry any special rights with regard to the control of the Company. There are no known arrangements under which financial rights are held by a person other than the holder of the shares and no known agreements on restrictions on share transfers and voting rights.
Post balance sheet events
For details of events since the year end date, please refer to note 29 of the consolidated financial information.
Corporate Governance
The Company's statement on corporate governance can be found in the Corporate Governance Report on pages 74 to 75 of this Annual Report. The Corporate Governance Report forms part of this directors' report and is incorporated into it by cross-reference.
Information included in the strategic report
The information that fulfils the reporting requirements relating to the Group's business during the year and likely future developments can be found on pages 14 to 38.
This Directors' Report was approved by the Board and is signed on its behalf by:
Nick Hewson
Chair
17 September 2024
ALTERNATIVE INVESTMENT FUND MANAGER'S REPORT
Background
The Alternative Investment Fund Managers Directive (the "AIFMD") came into force on 22 July 2013. The objective of the AIFMD was to ensure a common regulatory regime for funds marketed in or into the EU which are not regulated under the UCITS regime. This was primarily for investors' protection and also to enable European regulators to obtain adequate information in relation to funds being marketed in or into the EU to assist their monitoring and control of systemic risk issues.
The AIFM is a non-EU Alternative Investment Fund Manager (a "Non-EU AIFM"), the Company is a non-EU Alternative Investment Fund (a "Non-EU AIF") and the Company is marketed primarily into the UK, but also into the EEA. Although the AIFM is a non-EU AIFM, so the depositary rules in Article 21 of the AIFMD do not apply, the transparency requirements of Articles 22 (Annual report) and 23 (Disclosure to investors) of the AIFMD do apply to the AIFM and therefore to the Company. In compliance with those articles, the following information is provided to the Company's shareholders by the AIFM.
1. Material Changes in the Disclosures to Investors
During the financial year under review, there were no material changes to the information required to be made available to investors before they invest in the Company under Article 23 of the AIFMD from that information set out in the Company's prospectus dated 1 October, 2021, save as updated in the supplementary prospectus dated 7 April, 2022, as disclosed below and in certain sections of the Strategic Report, those being the Chair's Statement, Investment Adviser's Report, TCFD Compliant Report, Our Principal Risks and the Section 172(1) Statement, together with the Corporate Governance Report in this annual financial report.
2. Risks and Risk Management Policy
The current principal risks facing the Company and the main features of the risk management systems employed by AIFM and the Company to manage those risks are set out in the Strategic Report (Our Principal Risks and Risk and Going Concern), the Audit and Risk Committee Report and the Directors' Report.
3. Leverage and borrowing
The Company is entitled to employ leverage in accordance with its investment policy and as described in the Chair's Statement, the sections entitled "Financial Highlights" and "Financial Overview" in the Strategic Report and the notes to the financial information. Other than as disclosed therein, there were no changes in the Company's borrowing powers and policies.
4. Environmental, Social and Governance (ESG) Issues and Regulation (EU) 2019/2099 on Sustainability-Related Disclosures in the Financial Services Sector (the "SFDR")
As a member of the JTC group of Companies, the AIFM's ultimate beneficial owner and controlling party is JTC Plc, a Jersey-incorporated company whose shares have been admitted to the Official List of the UK's Financial Conduct Authority and to trading on the London Stock Exchange's Main Market for Listed Securities (mnemonic JTC LN, LEI 213800DVUG4KLF2ASK33). In the conduct of its own affairs, the AIFM is committed to best practice in relation to ESG matters and has therefore adopted JTC Plc's ESG framework, which can be viewed online at https://www.jtcgroup.com/esg/. JTC Plc's sustainability report can also be viewed online in its annual financial report located at https://www.jtcgroup.com/investor-relations/annual-review/.
As at the date of this report, JTC Plc is a signatory of the U.N. Principles for Responsible Investment. The JTC group is also carbon neutral and works to support the achievement of ten of the U.N.'s Sustainable Development Goals. JTC Plc reports under TCFD and under the SASB framework. JTC Plc also reported publicly to the Carbon Disclosure Project in 2023 and selected the Science Based Targets initiative as its chosen net zero framework.
From the perspective of the SFDR, although the AIFM is a non-EU AIFM, the Company is marketed into the EEA, so that the AIFM is required to comply with the SFDR in so far as it applies to the Company and the AIFM's management of the Company, which the Company has classified as being within the scope of Article 6 of the SFDR.
The AIFM and Atrato Capital Limited ("Atrato") as the Company's Alternative Investment Fund Manager and Investment Adviser respectively do consider ESG matters in their respective capacities, as explained in SUPR's prospectus dated 1 October 2021, as updated by SUPR's supplementary prospectus dated 7 April 2022. Copies of both of those documents can be viewed on the AIFM's website at https://jtcglobalaifmsolutions.com/clients/supermarket-income-reit-plc/.
Since the publication of those documents, the AIFM, Atrato and the Company have continued to enhance their collective approach to ESG matters and detailed reporting on (a) enhancements made to each party's policies, procedures and operational practices and (b) our collective future intentions and aspirations is included in the TCFD Compliant Report included in the Strategic Report and the ESG Committee Report in this annual financial report. The Company is also publishing a separate Sustainability Report alongside this report which is available on the website.
The AIFM also has a comprehensive risk matrix (the "Matrix"), which is used to identify, monitor and manage material risks to which the Company is exposed, including ESG and sustainability risks, the latter being an environmental, social or governance event or condition that, if it occurred, could cause an actual or a potential material negative impact on the value of an investment. We also consider sustainability factors, those being environmental, social and employee matters, respect for human rights, anti-corruption and anti-bribery matters.
The AIFM is cognisant of the announcement published by H.M. Treasury in the UK of its intention to make mandatory by 2025 disclosures aligned with the recommendations of the Task Force on Climate-related Financial Disclosures, with a significant proportion of disclosures mandatory by 2023. The AIFM also notes the roadmap and interim report of the UK's Joint Government-Regulator TCFD Taskforce published by H.M. Treasury on 9 November 2020. The AIFM continues to monitor developments and intends to comply with the UK's regime to the extent either mandatory or desirable as a matter of best practice.
5. Remuneration of the AIFM's Directors and Employees
During the financial year under review, no separate remuneration was paid by the AIFM to two of its executive directors, Graham Taylor and Kobus Cronje, because they were both employees of the JTC group of companies, of which the AIFM forms part. The third executive director, Matthew Tostevin, is paid a fixed fee of £10,000 for acting as a director. Mr Tostevin is paid additional remuneration on a time spent basis for services rendered to the AIFM and its clients. Other than the directors, the AIFM has no employees. The Company has no agreement to pay any carried interest to the AIFM. During the year under review, the AIFM paid £10,000 in fixed fees and £46,211 in variable remuneration to Mr Tostevin.
6. Remuneration of the AIFM Payable by the Company
The AIFM was during the year under review paid a fee of 0.04% per annum of the net asset value of the Company up to £1 billion and 0.03% of the Company's net asset value in excess of £1 billion, subject to a minimum of £50,000 per annum, such fee being payable quarterly in arrears. The total fees paid to the AIFM during the year under review were £0.44 million.
JTC Global AIFM Solutions Limited
Alternative Investment Fund Manager
17 September 2024
CONSOLIDATED STATEMENT OF COMPREHENSIVE INCOME
For the year ended 30 June 2024
|
Notes |
Year to 30 June 2024 £'000 |
Year to 30 June 2023 £'000 |
|
|
Gross rental income |
4 |
107,851 |
95,823 |
|
Service charge income |
4 |
6,822 |
5,939 |
|
Service charge expense |
5 |
(7,441) |
(6,518) |
|
Net Rental Income |
107,232 |
95,244 |
|
|
Administrative and other expenses |
6 |
(15,218) |
(15,429) |
|
Operating profit before changes in fair value of investment properties and share of income and profit on disposal from joint venture |
92,014 |
79,815 |
|
|
Changes in fair value of investment properties |
13 |
(65,825) |
(256,066) |
|
Share of income from joint venture |
- |
23,232 |
|
|
Profit on disposal of joint venture |
- |
19,940 |
|
|
Operating profit/(loss) |
26,189 |
(133,079) |
|
|
Finance income |
9 |
23,781 |
14,626 |
|
Finance expense |
9 |
(40,043) |
(39,315) |
|
Changes in fair value on interest rate derivatives |
18 |
(31,251) |
10,024 |
|
Profit on disposal of interest rate derivatives |
- |
2,878 |
|
|
Loss before taxation |
(21,324) |
(144,866) |
|
|
Tax credit / (charge) for the year |
10 |
140 |
- |
|
Loss for the year |
(21,184) |
(144,866) |
|
|
Items to be reclassified to profit or loss in |
|||
|
Fair value movements in interest rate derivatives |
18 |
(1,765) |
1,068 |
|
Foreign exchange movement |
32 |
- |
|
|
Total comprehensive expense for the year |
(22,917) |
(143,798) |
|
|
Total comprehensive expense for the year attributable to ordinary Shareholders |
(22,917) |
(143,798) |
|
|
Earnings per share - basic and diluted |
11 |
(1.7) pence |
(11.7) pence- |
CONSOLIDATED STATEMENT OF FINANCIAL POSITION
As at 30 June 2024
|
Notes |
As at 30 June 2024 £'000 |
As at 30 June 2023 £'000 |
||
|
Non-current assets |
||||
|
Investment properties |
13 |
1,768,216 |
1,685,690 |
|
|
Financial asset arising from sale and leaseback transactions |
15 |
11,023 |
10,819 |
|
|
Interest rate derivatives |
18 |
15,741 |
37,198 |
|
|
Total non-current assets |
1,794,980 |
1,733,707 |
||
|
Current assets |
||||
|
Interest rate derivatives |
18 |
15,708 |
20,384 |
|
|
Trade and other receivables |
16 |
11,900 |
142,155 |
|
|
Deferred tax asset |
20 |
140 |
- |
|
|
Cash and cash equivalents |
38,691 |
37,481 |
||
|
Total current assets |
66,439 |
200,020 |
||
|
Total assets |
1,861,419 |
1,933,727 |
||
|
Non-current liabilities |
||||
|
Bank borrowings |
19 |
597,652 |
605,609 |
|
|
Trade and other payables |
1,045 |
- |
||
|
Total non-current liabilities |
598,697 |
605,609 |
||
|
Current liabilities |
||||
|
Bank borrowings due within one year |
19 |
96,516 |
61,856 |
|
|
Deferred rental income |
24,759 |
21,557 |
||
|
Trade and other payables |
17 |
21,973 |
26,979 |
|
|
Total current liabilities |
143,248 |
110,392 |
||
|
Total liabilities |
741,945 |
716,001 |
||
|
Net assets |
1,119,474 |
1,217,726 |
||
|
Equity |
||||
|
Share capital |
22 |
12,462 |
12,462 |
|
|
Share premium reserve |
22 |
500,386 |
500,386 |
|
|
Capital reduction reserve |
22 |
629,196 |
704,531 |
|
|
Retained earnings |
(24,141) |
(2,957) |
||
|
Cash flow hedge reserve |
23 |
1,539 |
3,304 |
|
|
Other reserves |
32 |
- |
||
|
Total equity |
1,119,474 |
1,217,726 |
||
|
Net asset value per share - basic and diluted |
27 |
90 pence |
98 pence |
|
|
EPRA NTA per share |
27 |
87 pence |
93 pence |
|
The consolidated financial information was approved and authorised for issue by the Board of Directors on 17 September 2024 and were signed on its behalf by Nick Hewson (Chair).
CONSOLIDATED STATEMENT OF CHANGES IN EQUITY
For the year ended 30 June 2024
|
Share capital £'000 |
Share premium reserve £'000 |
Cash flow hedge reserve £'000 |
Other reserve £'000 |
Capital reduction reserve £'000 |
Retained earnings £'000 |
Total £'000 |
|
|
As at 1 July 2023 |
12,462 |
500,386 |
3,304 |
- |
704,531 |
(2,957) |
1,217,726 |
|
Comprehensive income for the year: |
|||||||
|
Loss for the year |
- |
- |
- |
- |
- |
(21,184) |
(21,184) |
|
Recycled from comprehensive loss to profit and loss |
- |
- |
(1,154) |
- |
- |
- |
(1,154) |
|
Other comprehensive loss |
- |
- |
(611) |
32 |
- |
- |
(579) |
|
Total comprehensive loss for the year |
- |
- |
(1,765) |
32 |
- |
(21,184) |
(22,917) |
|
Transactions with owners |
|||||||
|
Interim dividends paid (note 12) |
- |
- |
- |
- |
(75,335) |
- |
(75,335) |
|
As at 30 June 2024 |
12,462 |
500,386 |
1,539 |
32 |
629,196 |
(24,141) |
1,119,474 |
For the year ended 30 June 2023
|
Share capital £'000 |
Share premium reserve £'000 |
Cash flow hedge reserve £'000 |
Capital reduction reserve £'000 |
Retained earnings £'000 |
Total £'000 |
|
|
As at 1 July 2022 |
12,399 |
494,174 |
5,114 |
778,859 |
141,909 |
1,432,455 |
|
Comprehensive income for the year |
||||||
|
Loss for the year |
- |
- |
- |
- |
(144,866) |
(144,866) |
|
Cash flow hedge reserve to profit for the year on disposal of interest rate derivatives |
- |
- |
(2,878) |
- |
- |
(2,878) |
|
Other comprehensive income |
- |
- |
1,068 |
- |
- |
1,068 |
|
Total comprehensive loss for the year |
- |
- |
(1,810) |
- |
(144,866) |
(146,676) |
|
Transactions with owners |
||||||
|
Ordinary shares issued at a premium during the year |
63 |
6,301 |
- |
- |
- |
6,364 |
|
Share issue costs |
- |
(89) |
- |
- |
- |
(89) |
|
Interim dividends paid (note 12) |
- |
- |
- |
(74,328) |
- |
(74,328) |
|
As at 30 June 2023 |
12,462 |
500,386 |
3,304 |
704,531 |
(2,957) |
1,217,726 |
CONSOLIDATED CASH FLOW statement
For the year ended 30 June 2024
|
Notes |
Year to 30 June 2024 £'000 |
Year to 30 June 2023 £'000 |
|
|
Operating activities |
|||
|
Loss for the year (attributable to ordinary shareholders) |
(21,184) |
(144,866) |
|
|
Adjustments for: |
|||
|
Tax credit |
(140) |
- |
|
|
Changes in fair value of interest rate derivatives measured at fair value through profit and loss |
31,251 |
(10,024) |
|
|
Changes in fair value of investment properties and associated rent guarantees |
13 |
65,825 |
256,066 |
|
Movement in rent smoothing and lease incentive adjustments |
4 |
(2,434) |
(2,763) |
|
Amortisation of lease fees |
18 |
- |
|
|
Finance income |
9 |
(23,781) |
(14,626) |
|
Finance expense |
9 |
40,043 |
39,281 |
|
Share of income from joint venture |
- |
(23,232) |
|
|
Profit on disposal of interest rate derivative |
- |
(2,878) |
|
|
Profit on disposal of Joint Venture |
- |
(19,941) |
|
|
Cash flows from operating activities before changes |
89,598 |
77,017 |
|
|
(Increase) in trade and other receivables |
(2,996) |
(548) |
|
|
Decrease in rent guarantee receivables |
- |
191 |
|
|
Increase in deferred rental income |
3,202 |
5,198 |
|
|
Increase in trade and other payables |
2,252 |
2,461 |
|
|
Net cash flows from operating activities |
92,056 |
84,319 |
|
|
Investing activities |
|||
|
Disposal of Property, Plant & Equipment |
- |
222 |
|
|
Acquisition and development of investment properties |
13 |
(136,184) |
(362,630) |
|
Capitalised acquisition costs |
(10,266) |
(14,681) |
|
|
Bank interest received |
78 |
- |
|
|
Receipts from other financial assets |
290 |
290 |
|
|
Investment in joint venture |
- |
(189,528) |
|
|
Settlement of Joint Venture carried interest |
(7,500) |
- |
|
|
Proceeds from disposal of Joint Venture |
134,912 |
292,636 |
|
|
Net cash flows used in investing activities |
(18,670) |
(273,691) |
|
|
Notes |
Year to 30 June 2024 £'000 |
Year to 30 June 2023 £'000 |
|
|
Financing activities |
|||
|
Costs of share issues |
- |
(89) |
|
|
Bank borrowings drawn |
19 |
217,560 |
912,114 |
|
Bank borrowings repaid |
19 |
(191,077) |
(598,486) |
|
Loan arrangement fees paid |
(1,318) |
(5,010) |
|
|
Bank interest paid |
(35,275) |
(22,408) |
|
|
Settlement of interest rate derivatives |
21,182 |
8,646 |
|
|
Settlement of Joint Venture Carried Interest |
- |
(8,066) |
|
|
Sale of interest rate derivatives |
18 |
38,482 |
2,878 |
|
Purchase of interest rate derivative |
18 |
(45,364) |
(44,255) |
|
Bank commitment fees paid |
(1,031) |
(1,708) |
|
|
Dividends paid to equity holders |
(75,335) |
(67,963) |
|
|
Net cash flows (used in) / from financing activities |
(72,176) |
175,653 |
|
|
Net movement in cash and cash equivalents in the year |
1,210 |
(13,719) |
|
|
Cash and cash equivalents at the beginning of the year |
37,481 |
51,200 |
|
|
Cash and cash equivalents at the end of the year |
38,691 |
37,481 |
NOTES TO THE CONSOLIDATED FINANCIAL STATEMENTS
1. Basis of preparation
General information
Supermarket Income REIT plc (the "Company") is a company registered in England and Wales with its registered office at The Scalpel, 18th Floor, 52 Lime Street, London, EC3M 7AF. The principal activity of the Company and its subsidiaries (the "Group") is to provide its Shareholders with an attractive level of income together with the potential for capital growth by investing in a diversified portfolio of supermarket real estate assets in the UK.
At 30 June 2024 the Group comprised the Company and its wholly owned subsidiaries as set out in Note 14.
Basis of preparation
The consolidated financial information set out in this preliminary announcement covers the year to 30 June 2024, with comparative figures relating to the year to 30 June 2023, and includes the results and net assets of the Group. The financial information has been prepared on the basis of the accounting policies set out in the financial statements for the year ended 30 June 2024. Whilst the financial information included in this announcement has been computed in accordance with the recognition and measurement requirements of UK adopted international accounting standards this announcement does not itself contain sufficient information to comply with IFRS.
The financial information does not constitute the Group's financial statements for the years ended 30 June 2024 or 30 June 2023, but is derived from those financial statements. Those financial statements give a true and fair view of the assets, liabilities, financial position and results of the Group. Financial statements for the year ended 30 June 2023 have been delivered to the Registrar of Companies and those for the year ended 30 June 2024 will be delivered following the Company's AGM. The auditors' reports on both the 30 June 2024 and 30 June 2023 financial statements were unqualified; did not draw attention to any matters by way of emphasis; and did not contain statements under section 498 (2) or (3) of the Companies Act 2006.
The principal accounting policies applied in the preparation of the consolidated financial statements are set out below. These policies have been consistently applied to all years presented, other than where new policies have been adopted.
Going concern
In light of the current macroeconomic backdrop, the Directors have placed a particular focus on the appropriateness of adopting the going concern basis in preparing the Group's and Company's financial statements for the year ended 30 June 2024. In assessing the going concern basis of accounting, the Directors have considered the prospects of the Group over the period up to 30 September 2025.
Liquidity
At 30 June 2024, the Group generated net cash flow from operating activities of £92.1 million, held cash of £38.7 million and undrawn committed facilities totalling £54.2 million with no capital commitments or contingent liabilities.
After the year end, the Group also increased its debt capacity from £752.0 million to £825.4 million (see Note 19 for more information), leaving undrawn committed facilities of £176.0 million available (including £50.0 million accordion).
The Directors are of the belief that the Group continues to be well funded during the going concern period with no concerns over its liquidity.
Refinancing events
At the date of signing the financial statements, the Wells Fargo facility and £50 million of the syndicate unsecured term loan fall due for repayment during the going concern period. It is intended that the facilities will be refinanced prior to maturity, or if required, paid down in full utilising the Group's available cash balances and undrawn committed facilities of over £117 million (including post balance sheet events). All lenders have been supportive during the year and have expressed commitment to the long-term relationship they wish to build with the Company.
Covenants
The Group's debt facilities include covenants in respect of LTV and interest cover, both projected and historic. All debt facilities, except for the unsecured facilities, are ring-fenced with each specific lender.
The Directors have evaluated a number of scenarios as part of the Group's going concern assessment and considered the impact of these scenarios on the Group's continued compliance with debt covenants. The key assumptions that have been sensitised within these scenarios are falls in rental income and increases in administrative cost inflation.
As at the date of issuance of this Annual Report 100% of contractual rent for the period has been collected. The Group benefits from a secure income stream from the majority of its property assets that are let to tenants with excellent covenant strength under long leases that are subject to upward only rent reviews.
The list of scenarios are below and are all on top of the base case model which includes prudent assumptions on valuations and cost inflation. The Group is 100% hedged (including post balance sheet events), no sensitivity for movements in interest rates have been modelled for the hedged debt during the going concern assessment period.
|
Scenario |
Rental Income |
Costs |
|
Base case scenario (Scenario 1) |
100% contractual rent received when due and rent reviews based on forward looking inflation curve, capped at the contractual rate of the individual leases. |
Investment adviser fee based on terms of the signed agreement (percentage of NAV as per note 27), other costs in line with contractual terms. |
|
Scenario 2 |
Rental income to fall by 20%. |
Costs expected to remain the same as the base case. |
|
Scenario 3 |
Rental Income expected to remain the same as the base case. |
10% increases on base case costs to all administrative expenses. |
The Group continues to maintain covenant compliance for its LTV and ICR thresholds throughout the going concern assessment period under each of the scenarios modelled. The lowest amount of ICR headroom experienced in the worst-case stress scenarios was 42%. Based on the latest bank commissioned valuations, property values would have to fall by more than 26% before LTV covenants are breached, and 19% against 30 June 2024 Company valuations. Similarly, the strictest interest cover covenant within each of the ring-fenced banking groups is 225%, where the portfolio is forecast to have an average interest cover ratio of 425% during the going concern period.
Having reviewed and considered three modelled scenarios, the Directors consider that the Group has adequate resources in place for at least 12 months from the date of issue of this annual report and have therefore adopted the going concern basis of accounting in preparing the Annual Report.
Accounting convention and currency
The consolidated financial information (the "financial information") has been prepared on a historical cost basis, except that investment properties, rental guarantees and interest rate derivatives measured at fair value.
The financial information is presented in Pounds Sterling and all values are rounded to the nearest thousand (£'000), except where otherwise indicated. Pounds Sterling is the functional currency of the Company and the presentation currency of the Group.
Euro denominated results of the French operation have been converted to Sterling at the average exchange rate for the period from acquisition to 30 June 2024 of €1:£0.85, which is considered not to produce materially different results from using the actual rates at the date of the transactions. Year end balances have been converted to sterling at the 30 June 2024 exchange rate of €1:£0.85. The accounting policy for foreign currency translation is in note 2.
Adoption of new and revised standards
There were a number of new standards and amendments to existing standards which are required for the Group's accounting period beginning on 1 July 2023.
The following amendments are effective for the period beginning 1 July 2023:
- IFRS 17 Insurance Contracts
- Amendments to IAS 1 and IFRS Practice Statement 2 - Disclosure of accounting policies
- Definition of Accounting Estimates (Amendments to IAS 8 Accounting policies, Changes in Accounting Estimates and Errors)
- Amendments to IAS 12 - Deferred tax related to assets and liabilities arising from a single transaction
- International Tax Reform - Pillar Two Model Rules (Amendments to IAS 12 - International tax reform - Pillar Two model rules)
There was no material effect from the adoption of the above-mentioned amendments to IFRS effective in the period. They have no significant impact to the Group as they are either not relevant to the Group's activities or require accounting which is already consistent with the Group's current accounting policies.
In the current financial year, the Group has adopted a number of minor amendments to standards effective in the year issued by the IASB as adopted by the UK Endorsement Board, none of which have had a material impact on the Group.
There was no material effect from the adoption of other amendments to IFRS effective in the year. They have no significant impact on the Group as they are either not relevant to the Group's activities or require accounting which is consistent with the Group's current accounting policies.
Standards and interpretations in issue not yet adopted
The following are new standards, interpretations and amendments, which are not yet effective, and have not been early adopted in this financial information, that will or may have an effect on the Group's future financial statements:
· Amendments to IAS 1 which are intended to clarify the requirements that an entity applies in determining whether a liability is classified as current or non-current. The amendments are intended to be narrow-scope in nature and are meant to clarify the requirements in IAS 1 rather than modify the underlying principles (effective for periods beginning on or after 1 January 2024).
The amendments include clarifications relating to:
- How events after the end of the reporting period affect liability classification
- What the rights of an entity must be in order to classify a liability as non-current
- How an entity assesses compliance with conditions of a liability (e.g. bank covenants)
- How conversion features in liabilities affect their classification
The amendment is not expected to have an impact on the presentation or classification of the liabilities in the Group based on rights that are in existence at the end of the reporting period.
· IFRS S1 General Requirements for Disclosure of Sustainability-related Financial Information. IFRS S1 sets out general requirements for the disclosure of material information about sustainability-related financial risks and opportunities and other general reporting requirements (periods beginning after 1 January 2024).
· IFRS S2 Climate-related Disclosures. IFRS S2 sets out disclosure requirements that are specific to climate-related matters (periods beginning after 1 January 2024).
· IFRS 18 - Presentation and Disclosure in Financial Statements. IFRS 18 sets out significant new requirements for how financial statements are presented, with particular focus on the statement of profit or loss, including requirements for mandatory sub-totals to be presented, aggregation and disaggregation of information, as well as disclosures related to management-defined performance measures. This new standard will first be effective for the Group for the period commencing 1 July 2027.
The Group expects to review and determine the impact of the new standard on the Group's reporting and financial information over the coming financial year.
The Group acknowledges the issue of these new standards by the International Sustainability Standards Board's ("ISSB") will monitor the consultation and decision process being undertaken by the UK Government and FCA in determining how these standards are implemented by UK companies.
There are other new standards and amendments to standards and interpretations which have been issued that are effective in future accounting periods, and which the Group has decided not to adopt early. None of these are expected to have a material impact on the condensed consolidated financial statements of the Group.
Significant accounting judgements, estimates and assumptions
The preparation of this financial information in accordance with IFRS requires the Directors of the Company to make judgements, estimates and assumptions that affect the reported amounts recognised in the financial information.
Key estimate: Fair value of investment properties
The fair value of the Group's investment properties is determined by the Group's independent valuer on the basis of market value in accordance with the RICS Valuation - Global Standards (the "Red Book"). Recognised valuation techniques are used by the independent valuer which are in accordance with those recommended by the International Valuation Standard Committee and compliant with IFRS 13 'Fair Value Measurement.'
The independent valuer did not include any material valuation uncertainty clause in relation to the valuation of the Group's investment property for 30 June 2024 or 30 June 2023.
The independent valuer is considered to have sufficient current local and national knowledge of the supermarket property market and the requisite skills and understanding to undertake the valuation competently.
In forming an opinion as to fair value, the independent valuer makes a series of assumptions, which are typically market-related, such as those in relation to net initial yields and expected rental values. These are based on the independent valuer's professional judgement. Other factors taken into account by the independent valuer in arriving at the valuation of the Group's investment properties include the length of property leases, the location of the properties and the strength of tenant covenants.
The fair value of the Group's investment properties as determined by the independent valuer, along with the significant methods and assumptions used in estimating this fair value, are set out in note 13.
Key judgement: Acquisition of investment properties
The Group has acquired and intends to acquire further investment properties. At the time of each purchase the Directors assess whether an acquisition represents the acquisition of an asset or the acquisition of a business.
Under the Definition of a Business (Amendments to IFRS 3 "Business Combinations"), to be considered as a business, an acquired set of activities and assets must include, at a minimum, an input and a substantive process that together significantly contribute to the ability to create outputs. The optional 'concentration test' is also applied, where if substantially all of the fair value of gross assets acquired is concentrated in a single asset (or a group of similar assets), the assets acquired would not represent a business.
During the year, the group completed four acquisitions; this includes the acquisition of 17 French properties in a single transaction. In four cases the concentration test was applied and met, resulting in the acquisitions being accounted for as asset purchases.
All £135.8 million of acquisitions during the year were accounted for as asset purchases.
Key judgement: Sale and leaseback transactions
The Group acquires properties under a sale and leaseback arrangement. At the time of the purchase the Directors assess whether the acquisition represents a true sale to determine whether the assets can be accounted for as Investment Properties under IFRS 16.
Under IFRS 15, for the transfer of an asset to be accounted for as a true sale, satisfying a performance obligation of transferring control of an asset must be met for this to be deemed a property transaction and accounted for under IFRS 16.
During the year, the Group acquired 17 stores in France under sale and leaseback arrangements. The terms of the sale and underlying lease were reviewed for indicators of control and deemed that the significant risks and rewards to ownership were transferred to the Group and will therefore be accounted for as an investment property acquisition.
2. Summary of material accounting policies
The material accounting policies applied in the preparation of the consolidated financial information is set out below.
2.1. Basis of consolidation
The consolidated financial information comprises the financial information of the Company and all of its subsidiaries drawn up to 30 June 2024.
Subsidiaries are those entities including special purpose entities, directly or indirectly controlled
by the Company. Control exists when the Company is exposed or has rights to variable returns from
its investment with the investee and has the ability to affect those returns through its power over
the investee. In assessing control, potential voting rights that presently are exercisable are taken
into account.
The financial information of subsidiaries are included in the consolidated financial information from
the date that control commences until the date that control ceases.
In preparing the consolidated financial information, intra group balances, transactions and unrealised gains or losses are eliminated in full.
Uniform accounting policies are adopted for all entities within the Group.
2.2. Rental income
Rental income arising on investment properties is accounted for in profit or loss on a straight-line basis over the lease term, as adjusted for the following:
· Any rental income from fixed and minimum guaranteed rent review uplifts is recognised on
a straight-line basis over the lease term, variable lease uplift calculations are not rebased when a rent review occurs and the variable payment becomes fixed;
· Lease incentives and initial costs to arrange leases are spread evenly over the lease term, even if payments are not made on such a basis. The lease term is the non-cancellable period of the lease together with any further term for which the tenant has the option to continue the lease, where, at the inception of the lease, the Directors are reasonably certain that the tenant will exercise that option.
Contingent rents, such as those arising from indexed-linked rent uplifts or market based rent reviews, are recognised in the period in which they are earned.
Where income is recognised in advance of the related cash flows due to fixed and minimum guaranteed rent review uplifts or lease incentives, an adjustment is made to ensure that the carrying value of the relevant property, including the accrued rent relating to such uplifts or lease incentives, does not exceed the external valuation.
Rental income is invoiced in advance with that element of invoiced rental income that relates to a future period being included within deferred rental income in the consolidated statement of financial position.
Surrender premiums received in the period are included in rental income.
Leases classified under IFRS 9 as financial assets recognise income received from the tenant between finance income and a reduction of the asset value, based on the interest rate implicit in the lease.
2.3. Service charge income
Service charge income represents amounts billed to tenants for services provided in conjunction with leased properties based on budgeted service charge expenditure for a given property over a given service charge year. The Company recognises service charge income on a straight-line basis over the service charge term.
2.4. Service charge expense
Service charge expense represents a wide range of costs related to the operation and upkeep of the leased properties. These costs are allocated and charged to tenants based on agreed terms and calculations as outlined in the lease agreements with a portion being borne by the landlord where agreed.
2.5. Finance income
Finance income consists principally of interest receivable from interest rate derivatives and income from financial assets held at amortised cost. An adjustment is applied to reclassify amounts received upon periodic settlement of interest rate derivatives assets from change in fair value to interest income.
2.6. Finance expense
Finance expenses consist principally of interest payable and the amortisation of loan arrangement fees.
Loan arrangement fees are expensed using the effective interest method over the term of the relevant loan. Interest payable and other finance costs, including commitment fees, which the Group incurs in connection with bank borrowings, are expensed in the period to which they relate.
2.7. Administrative and other expenses
Administrative and other expenses, including the investment advisory fees payable to the Investment Adviser, are recognised as a profit or loss on an accruals basis.
2.8. Dividends payable to Shareholders
Dividends to the Company's Shareholders are recognised when they become legally payable, as a reduction in equity in the financial information. Interim equity dividends are recognised when paid. Final equity dividends will be recognised when approved by Shareholders at an AGM.
2.9. Taxation
Non-REIT taxable income
Taxation on the Group's profit or loss for the year that is not exempt from tax under the UK-REIT regulations comprises current and deferred tax, as applicable. Tax is recognised in profit or loss except to the extent that it relates to items recognised as direct movements in equity, in which case it is similarly recognised as a direct movement in equity.
Deferred tax is provided in full using the Balance Sheet liability method on temporary differences between the carrying amounts of assets and liabilities for financial reporting purposes and the amounts used for taxation purposes. Deferred tax is determined using tax rates that have been enacted or substantively enacted by the reporting date and are expected to apply when the asset is realised or the liability is settled.
Deferred tax assets are recognised to the extent that it is probable that suitable taxable profits will be available against which deductible temporary differences can be utilised.
Current tax is tax payable on any non-REIT taxable income for the year, using tax rates enacted or substantively enacted at the end of the relevant period.
Entry to the UK-REIT regime
The Group obtained its UK-REIT status effective from 21 December 2017. Entry to the regime results in, subject to continuing relevant UK-REIT criteria being met, the profits of the Group's property rental business, comprising both income and capital gains, being exempt from UK taxation.
The Group intends to ensure that it complies with the UK-REIT regulations on an on-going basis and regularly monitors the conditions required to maintain REIT status.
2.10. Investment properties
Investment properties consist of land and buildings which are held to earn income together with the potential for capital growth.
Investment properties are recognised when the risks and rewards of ownership have been transferred and are measured initially at cost, being the fair value of the consideration given, including transaction costs. Where the purchase price (or proportion thereof) of an investment property is settled through the issue of new ordinary shares in the Company, the number of shares issued is such that the fair value of the share consideration is equal to the fair value of the asset being acquired. Transaction costs include transfer taxes and professional fees for legal services. Any subsequent capital expenditure incurred in improving investment properties is capitalised in the period incurred and included within the book cost of the property. All other property expenditure is written off in profit or loss as incurred.
After initial recognition, investment properties are measured at fair value, with gains and losses recognised in profit or loss in the period in which they arise.
Gains and losses on disposals of investment properties will be determined as the difference between the net disposal proceeds and the carrying value of the relevant asset. These will be recognised in profit or loss in the period in which they arise.
Initially, rental guarantees are recognised at their fair value and separated from the purchase price on initial recognition of the property being purchased. They are subsequently measured at their fair value at each reporting date with any movements recognised in the profit or loss.
2.11. Foreign currency transactions
Foreign currency transactions are translated to the respective functional currency of Group entities at the foreign exchange rate ruling on the transaction date. Foreign exchange gains and losses resulting from settling these, or from retranslating monetary assets and liabilities held in foreign currencies, are booked in the Income Statement. The exception is for foreign currency loans and derivatives that hedge investments in foreign subsidiaries, where exchange differences are booked in other reserves until the investment is realised.
Assets and liabilities of foreign entities are translated into sterling at exchange rates ruling at the Balance Sheet date. Their income, expenses and cash flows are translated at the average rate for the period or at spot rate for significant items. Resultant exchange differences are booked in Other Comprehensive Income and recognised in the Group Income Statement when the operation is sold.
Exchange difference on non-monetary items measured at fair value through profit or loss, being the value movement of the investment properties, are recognised as part of the total fair value movement for the portfolio.
2.12. Financial assets and liabilities
Financial assets and liabilities are recognised when the relevant Group entity becomes a party to the unconditional contractual terms of an instrument. Unless otherwise indicated, the carrying amounts
of financial assets and liabilities are considered by the Directors to be reasonable estimates of their
fair values.
Financial assets
Financial assets are recognised initially at their fair value. All of the Group's financial assets, except interest rate derivatives, are held at amortised cost using the effective interest method, less any impairment.
For assets where changes in cash flows are linked to changes in an inflation index, the Group updates the effective interest rate at the end of each reporting period and this is reflected in the carrying amount of the asset each reporting period until the asset is derecognised.
Cash and cash equivalents
Cash and cash equivalents consist of cash in hand and short-term deposits in banks with an original maturity of three months or less.
Trade and other receivables
Trade and other receivables, including rents receivable, are recognised and carried at the lower of their original invoiced value and recoverable amount. Provisions for impairment are calculated using an expected credit loss model. Balances will be written-off in profit or loss in circumstances where the probability of recovery is assessed as being remote.
Trade and other payables
Trade and other payables are recognised initially at their fair value and subsequently at amortised cost.
Bank borrowings
Bank borrowings are initially recognised at fair value net of attributable transaction costs. After initial recognition, bank borrowings are subsequently measured at amortised cost, using the effective interest method. The effective interest rate is calculated to include all associated transaction costs.
In the event of a modification to the terms of a loan agreement, the Group considers both the quantitative and qualitative impact of the changes. Where a modification is considered substantial, the existing facility is treated as settled and the new facility is recognised. Where the modification is not considered substantial, the carrying value of the liability is restated to the present value of the cash flows of the modified arrangement, discounted using the effective interest rate of the original arrangement. The difference is recognised as a gain or loss on refinancing through the statement of comprehensive income.
Derivative financial instruments and hedge accounting
The Group's derivative financial instruments currently comprise of interest rate swaps/caps. Derivatives designated as hedging instruments utilise hedge accounting under IAS 39. Derivatives not designated under hedge accounting are accounted for under IFRS 9.
These instruments are used to manage the Group's cash flow interest rate risk.
The instruments are initially recognised at fair value on the date that the derivative contract is entered into, being the cost of any premium paid at inception, and are subsequently re-measured at their fair value at each reporting date.
Fair value measurement of derivative financial instruments
The fair value of derivative financial instruments is the estimated amount that the Group would receive or pay to terminate the agreement at the period end date, taking into account current interest rate expectations and the current credit rating of the relevant group entity and its counterparties.
The Group uses valuation techniques that are appropriate in the circumstances and for which sufficient data is available to measure fair value, maximising the use of relevant observable inputs and minimising the use of unobservable inputs significant to the fair value measurement as a whole.
A number of assumptions are used in determining the fair values including estimations over future interest rates and therefore future cash flows. The fair value represents the net present value of the difference between the cash flows produced by the contract rate and the valuation rate.
Hedge accounting
At the inception of a hedging transaction, the Group documents the relationship between hedging instruments and hedged items, as well as its risk management objectives and strategy for undertaking the hedging transaction.
The Group also documents its assessment, both at hedge inception and on an ongoing basis, of whether the derivatives that are used in hedging transactions are highly effective in offsetting changes in fair values or cash flows of hedged items.
Assuming the criteria for applying hedge accounting continue to be met the effective portion of gains and losses on the revaluation of such instruments are recognised in other comprehensive income and accumulated in the cash flow hedging reserve. Any ineffective portion of such gains and losses will be recognised in profit or loss within finance income or expense as appropriate. The cumulative gain or loss recognised in other comprehensive income is reclassified from the cash flow hedge reserve to profit or loss (finance expense) at the same time as the related hedged interest expense is recognised.
Interest rate derivatives that do not qualify under hedge accounting are carried in the Group Statement of Financial Position at fair value, with changes in fair value recognised in the Group Statement of Comprehensive Income, net of interest receivable/payable from the derivatives shown in the finance income or expense line.
2.13. Equity instruments
Equity instruments issued by the Company are recorded at the amount of the proceeds received, net of directly attributable issue costs. Costs not directly attributable to the issue are immediately expensed in profit or loss.
No shares were issued in the period.
2.14. Fair value measurements and hierarchy
Fair value is the price that would be received on the sale of an asset, or paid to transfer a liability,
in an orderly transaction between market participants at the measurement date. The fair value measurement is based on the presumption that the transaction takes place either in the principal market for the asset or liability, or in the absence of a principal market, in the most advantageous market. It is based on the assumptions that market participants would use when pricing the asset
or liability, assuming they act in their economic best interest. A fair value measurement of a non-financial asset takes into account the best and highest value use for that asset.
The fair value hierarchy to be applied under IFRS 13 is as follows:
Level 1: Quoted (unadjusted) market prices in active markets for identical assets or liabilities.
Level 2: Valuation techniques for which the lowest level input that is significant to the fair value measurement is directly or indirectly observable.
Level 3: Valuation techniques for which the lowest level input that is significant to the fair value measurement is unobservable.
For assets and liabilities that are carried at fair value and which will be recorded in the financial information on a recurring basis, the Group will determine whether transfers have occurred between levels in the hierarchy by reassessing categorisation at the end of each reporting period.
3. Operating Segments
Operating segments are identified on the basis of internal financial reports about components of the Group that are regularly reviewed by the chief operating decision maker (which in the Group's case is the Board, comprising the Non-Executive Directors, and the Investment Adviser) in order to allocate resources to the segments and to assess their performance.
The internal financial reports contain financial information at a Group level as a whole and there are no reconciling items between the results contained in these reports and the amounts reported in the consolidated financial information. These internal financial reports include the IFRS figures but also report the non-IFRS figures for the EPRA and alternative performance measures as disclosed in Notes 11, 27 and the Additional Information.
The Group's property portfolio comprises investment property. The Board considers that all the properties have similar economic characteristics. Therefore, in the view of the Board, there is one reportable segment.
The geographical split of revenue and material applicable non-current assets was:
|
Revenue |
Year to 30 June 2024 £'000 |
Year to 30 June 2023 £'000 |
|
UK |
107,063 |
95,823 |
|
France |
788 |
- |
|
107,851 |
95,823 |
|
|
Investment Properties |
As at 30 June 2024 £'000 |
As at 30 June 2023 £'000 |
|
UK |
1,704,280 |
1,685,690 |
|
France |
63,936 |
- |
|
1,768,216 |
1,685,690 |
4. Gross rental income
|
Year to 30 June 2024 £'000 |
Year to 30 June 2023 £'000 |
|
|
Rental income - freehold property |
58,345 |
53,119 |
|
Rental income - long leasehold property |
49,063 |
42,669 |
|
Lease surrender income |
443 |
35 |
|
Gross rental income |
107,851 |
95,823 |
|
Year to 30 June 2024 £'000 |
Year to 30 June 2023 £'000 |
|
|
Property insurance recoverable |
621 |
585 |
|
Service charge recoverable |
6,201 |
5,354 |
|
Total property insurance and service charge income |
6,822 |
5,939 |
|
Total property income |
114,673 |
101,762 |
Included within rental income is a £2,197,000 (2023: £2,512,000) rent smoothing adjustment that arises as a result of IFRS 16 'Leases' requiring that rental income in respect of leases with rents increasing by a fixed percentage be accounted for on straight-line basis over the lease term. During the year this resulted in an increase in rental income and an offsetting entry being recognised in profit or loss as an adjustment to the investment property revaluation.
Also included in rental income is a £237,000 (year to 30 June 2023: £499,000) adjustment for lease incentives. Tenant lease incentives are recognised on a straight-line basis over the lease term as an adjustment to rental income. During the year this resulted in an increase in rental income and an offsetting entry being recognised in profit or loss as an adjustment to the investment property revaluation.
On an annualised basis, rental income comprises £54,258,000 (2023: £49,620,000) relating to the Group's largest tenant and £30,790,000 (2023: £27,194,000) relating to the Group's second largest tenant. There were no further tenants representing more than 10% of annualised gross rental income during either year.
5. Service charge expense
|
Year to 30 June 2024 £'000 |
Year to 30 June 2023 £'000 |
|
|
Property insurance expenses |
714 |
715 |
|
Service charge expenses |
6,727 |
5,803 |
|
Total property insurance and service charge expense |
7,441 |
6,518 |
6. Administrative and other expenses
|
Year to 30 June 2024 £'000 |
Year to 30 June 2023 £'000 |
|
|
Investment Adviser fees (Note 28) |
9,472 |
10,292 |
|
Directors' remuneration (Note 8) |
410 |
364 |
|
Corporate administration fees |
1,049 |
1,108 |
|
Legal and professional fees |
1,475 |
1,626 |
|
Other administrative expenses |
2,812 |
2,039 |
|
Total administrative and other expenses |
15,218 |
15,429 |
7. Operating profit/(loss)
Operating profit/(loss) is stated after charging fees for:
|
Year to 30 June 2024 £'000 |
Year to 30 June 2023 £'000 |
|
|
Audit of the Company's consolidated and individual financial statements |
292 |
260 |
|
Audit of subsidiaries, pursuant to legislation |
88 |
95 |
|
Total audit services |
380 |
355 |
|
Audit related services: interim review |
42 |
38 |
|
Total audit and audit related services |
422 |
393 |
Not included in the table above is £95,000 of additional audit fees paid to BDO relating to the year ended 30 June 2023.
The Group's auditor also provided the following services in relation to corporate finance services:
|
Year to 30 June 2024 £'000 |
Year to 30 June 2023 £'000 |
|
|
Other non-audit services: corporate finance services |
- |
65 |
|
Total other non-audit services |
- |
65 |
|
Total fees charged by the Group's auditor |
422 |
458 |
8. Directors' remuneration
The Group had no employees in the current or prior year. The Directors, who are the key management personnel of the Company, are appointed under letters of appointment for services. Directors' remuneration, all of which represents fees for services provided, was as follows:
|
Year to 30 June 2024 £'000 |
Year to 30 June 2023 £'000 |
|
|
Directors' fees |
371 |
330 |
|
Employer's National Insurance Contribution |
39 |
34 |
|
Total Directors' remuneration |
410 |
364 |
The highest paid Director received £75,000 (2023: £75,000) for services during the year.
9. Finance income and expense
|
Finance income |
Year to 30 June 2024 £'000 |
Year to 30 June 2023 £'000 |
|
Interest received on bank deposits |
306 |
53 |
|
Income from financial assets held at amortised cost (note 15) |
494 |
483 |
|
Finance income on unwinding of discounted receivable |
203 |
2,376 |
|
Finance income on settlement of interest rate derivatives (note 18) |
22,778 |
11,714 |
|
Total finance income |
23,781 |
14,626 |
|
Finance expense |
Year to 30 June 2024 £'000 |
Year to 30 June 2023 £'000 |
|
Interest payable on bank borrowings |
36,823 |
29,707 |
|
Commitment fees payable on bank borrowings |
817 |
1,571 |
|
Amortisation of loan arrangement fees* |
2,403 |
8,037 |
|
Total finance expense |
40,043 |
39,315 |
*This includes a non-recurring exceptional charge of £70,000 (June 2023: £1.52 million), relating to the acceleration of unamortised arrangement fees in respect of the modification of loan facilities under IFRS 9. Prior year also included a one-off loan arrangement fee for the short-term J.P. Morgan loan of £4.0 million.
The above finance expense includes the following in respect of liabilities not classified as fair value through profit and loss:
|
Year to 30 June 2024 £'000 |
Year to 30 June 2023 £'000 |
|
|
Total interest expense on financial liabilities held at amortised cost |
39,226 |
37,744 |
|
Fee expense not part of effective interest rate for financial liabilities held at amortised cost |
817 |
1,571 |
|
Total finance expense |
40,043 |
39,315 |
10. Taxation
A) Tax charge in profit or loss
|
Year to 30 June 2024 £'000 |
Year to 30 June 2023 £'000 |
|
|
UK Corporation tax |
- |
- |
|
France Corporation Tax |
- |
- |
|
UK deferred tax |
- |
- |
|
France deferred tax (note 20) |
(140) |
- |
|
(140) |
- |
|
|
B) Total tax expense |
||
|
Tax (credit)/charge in profit and loss as per the above |
(140) |
- |
|
Share of tax expense of equity accounted joint ventures |
- |
(400) |
|
Total tax (credit)/expense |
(140) |
(400) |
The Company and its subsidiaries operate as a UK Group REIT. Subject to continuing compliance with certain rules, the UK REIT regime exempts the profits of the Group's property rental business from UK corporation tax. To operate as a UK Group REIT a number of conditions had to be satisfied in respect of the Company, the Group's qualifying activity and the Group's balance of business. Since the 21 December 2017 the Group has met all such applicable conditions.
The reconciliation of the loss before tax multiplied by the standard rate of corporation tax for the year of 25% (2023: 20.4%) to the total tax charge is as follows:
|
C) Reconciliation of the total tax charge for the year |
Year to 30 June 2024 £'000 |
Year to 30 June 2023 £'000 |
|
Loss on ordinary activities before taxation |
(21,324) |
(144,866) |
|
Theoretical tax at UK standard corporation tax rate of 25% (2023: 20.4%) |
(5,331) |
(29,553) |
|
Effects of: |
||
|
Investment property and derivative revaluation not taxable |
24,269 |
49,680 |
|
Disposal of interest rate derivative |
- |
(587) |
|
Residual business losses |
2,481 |
4,428 |
|
French subsidiary allowable expenses |
(140) |
- |
|
Other non-taxable items |
- |
(8,807) |
|
REIT exempt income |
(21,419) |
(15,161) |
|
Share of tax expense of equity accounted joint ventures |
- |
(400) |
|
Total tax (credit)/expense for the year |
(140) |
(400) |
UK REIT exempt income includes property rental income that is exempt from UK corporation tax in accordance with Part 12 of CTA 2010.
No deferred tax asset has been recognised in respect of the Group's residual carried forward tax losses of £43.4 million (2023: £36.2 million) as, given the Group's REIT status, it is considered unlikely that these losses will be utilised. The Group is subject to French Corporation tax on its French property rental business at a rate of 25%.
11. Earnings per share
Earnings per share ("EPS") amounts are calculated by dividing the profit or loss for the period attributable to ordinary equity holders of the Company by the weighted average number of ordinary shares in issue during the period. As there are no dilutive instruments outstanding, basic and diluted earnings per share are identical.
The European Public Real Estate Association ("EPRA") publishes guidelines for calculating on a comparable basis. EPRA EPS is a measure of EPS designed by EPRA to enable entities to present underlying earnings from core operating activities, which excludes fair value movements on investment properties and derivatives.
The Company has also included an additional earnings measure called "Adjusted Earnings" and "Adjusted EPS." Adjusted earnings62 is a performance measure used by the Board to assess the Group's financial performance and dividend payments. The metric adjusts EPRA earnings by deducting one-off items such as debt restructuring costs and the Joint Venture acquisition loan arrangement fee which are non-recurring in nature and adding back finance income on derivatives held at fair value through profit and loss. Adjusted Earnings is considered a better reflection of the measure over which the Board assesses the Group's trading performance and dividend cover.
Finance income received from derivatives held at fair value through profit and loss are added back to EPRA earnings as this reflects the cash received from the derivatives in the period and therefore gives a better reflection of the Group's net finance costs.
Debt restructuring costs relate to the acceleration of unamortised arrangement fees following the restructuring of the Group's debt facilities during the period.
The reconciliation of IFRS Earnings, EPRA Earnings and Adjusted Earnings is shown below:
|
Year to |
Year to |
||
|
£' 000 |
£' 000 |
||
|
Net (loss) attributable to ordinary shareholders |
(21,184) |
(144,866) |
|
|
EPRA adjustments: |
|||
|
Changes in fair value of investment properties and rental guarantees |
65,825 |
256,066 |
|
|
Changes in fair value of interest rate derivatives measured at fair value through profit and loss |
31,251 |
(10,024) |
|
|
Profit on disposal of interest rate derivatives |
- |
(2,878) |
|
|
Group share of changes in fair value of joint venture investment properties |
- |
(11,486) |
|
|
Gain on disposal of investments in joint venture |
- |
(19,940) |
|
|
Deferred tax credit |
(140) |
- |
|
|
Finance income received on interest rate derivatives held at fair value through profit and loss |
(22,469) |
(9,671) |
|
|
EPRA Earnings |
53,283 |
57,201 |
|
|
Adjustments for: |
|||
|
Finance income received on interest rate derivatives held at fair value through profit and loss |
22,469 |
9,671 |
|
|
Restructuring costs in relation to the acceleration of unamortised arrangement fees |
70 |
1,518 |
|
|
Joint Venture acquisition loan arrangement fee |
- |
4,009 |
|
|
Adjusted Earnings |
75,822 |
72,399 |
|
|
Number1 |
Number1 |
||
|
Weighted average number of ordinary shares |
1,246,239,185 |
1,242,574,505 |
|
1 Based on the weighted average number of ordinary shares in issue
|
Year to |
Year to |
|
|
Pence per share ('p') |
Pence per share ('p') |
|
|
Basic and Diluted EPS |
(1.7) |
(11.7) |
|
EPRA adjustments: |
||
|
Changes in fair value of interest rate derivatives measured at FVTPL |
2.5 |
(0.8) |
|
Changes in fair value of investment properties |
5.3 |
20.6 |
|
Group share of changes in fair value of joint venture investment properties |
- |
(0.9) |
|
Profit on disposal of interest rate derivatives |
- |
(0.2) |
|
Group share of gain on disposal of joint venture investment properties |
- |
(1.6) |
|
Deferred tax credit |
- |
- |
|
Finance income received on interest rate derivatives held at fair value through profit and loss |
(1.8) |
(0.8) |
|
EPRA EPS |
4.3 |
4.6 |
|
Adjustments for: |
||
|
Finance income received on interest rate derivatives held at fair value through profit and loss |
1.8 |
0.8 |
|
One-off restructuring costs in relation to the acceleration of unamortised arrangement fees |
- |
0.1 |
|
Joint Venture acquisition loan arrangement fee |
- |
0.3 |
|
Adjusted EPRA EPS |
6.1 |
5.8 |
12. Dividends
|
Year to 30 June 2024 £'000 |
Year to 30 June 2023 £'000 |
|
|
Amounts recognised as a distribution to ordinary Shareholders in the year: |
||
|
Dividends |
75,335 |
74,328 |
On 6 July 2023, the Board declared a fourth interim dividend for the year ended 30 June 2023 of 1.500 pence per share, which was paid on 4 August 2023 to shareholders on the register on 14 July 2023.
On 5 October 2023 the Board declared a first interim dividend for the year ending 30 June 2024 of 1.515 pence per share, which was paid on 16 November 2023 to shareholders on the register on 13 October 2023.
On 4 January 2024 the Board declared a second interim dividend for the year ending 30 June 2024 of 1.515 pence per share, which was paid on 14 February 2024 to shareholders on the register on 12 January 2024.
On 4 April 2024 the Board declared a third interim dividend for the year ending 30 June 2024 of 1.515 pence per share, which was paid on 16 May 2024 to shareholders on the register on 12 April 2024.
On 4 July 2024, the Board declared a fourth interim dividend for the year ending 30 June 2024 of 1.515 pence per share, which was paid on 16 August 2024 to shareholders on the register on 12 July 2024. This has not been included as a liability as at 30 June 2024.
13. Investment properties
In accordance with IAS 40 "Investment Property", the Group's investment properties have been independently valued at fair value by Cushman & Wakefield, an accredited independent valuer with
a recognised and relevant professional qualification and with recent experience in the locations and categories of the investment properties being valued. The valuations have been prepared in accordance with the RICS Valuation - Global Standards and incorporate the recommendations
of the International Valuation Standards Committee which are consistent with the principles set out
in IFRS 13.
The independent valuer in forming its opinion on valuation makes a series of assumptions. As explained in note 2, all the valuations of the Group's investment property at 30 June 2024 are classified as 'level 3' in the fair value hierarchy defined in IFRS 13.
The valuations are ultimately the responsibility of the Directors. Accordingly, the critical assumptions used in establishing the independent valuation are reviewed by the Board.
|
Freehold £'000 |
Long Leasehold £'000 |
Total £'000 |
|
|
At 1 July 2023 |
899,440 |
786,250 |
1,685,690 |
|
Property additions |
101,104 |
34,700 |
135,804 |
|
Capitalised acquisition costs |
8,093 |
2,317 |
10,410 |
|
Currency exchange movement |
(874) |
- |
(874) |
|
Revaluation movement |
(35,747) |
(27,067) |
(62,814) |
|
Valuation at 30 June 2024 |
972,016 |
796,200 |
1,768,216 |
|
At 1 July 2022 |
903,850 |
657,740 |
1,561,590 |
|
Property additions |
131,600 |
231,030 |
362,630 |
|
Capitalised acquisition costs |
4,132 |
10,549 |
14,681 |
|
Revaluation movement |
(140,142) |
(113,069) |
(253,211) |
|
Valuation at 30 June 2023 |
899,440 |
786,250 |
1,685,690 |
|
Reconciliation of Investment Property to Independent Property Valuation |
Year to 30 June 2024 £'000 |
Year to 30 June 2023 £'000 |
|
Investment Property at fair value per Group Statement of Financial Position |
1,768,216 |
1,685,690 |
|
Market Value of Property classified as Financial Assets held at amortised cost (Note 15) |
7,530 |
7,210 |
|
Total Independent Property Valuation |
1,775,746 |
1,692,900 |
There were four property acquisitions during the year, all of which were direct purchases of the assets and not acquisition of a corporate structure. They are all treated as asset purchases.
Included within the carrying value of investment properties at 30 June 2024 is £10,920,000 (2023: £8,724,000) in respect of the smoothing of fixed contractual rent uplifts as described in note 4. The difference between rents on a straight-line basis and rents actually receivable is included within the carrying value of the investment properties but does not increase that carrying value over fair value.
Included within the carrying values of investment properties at 30 June 2024 is £1,033,000 (year to 30 June 2023: £251,000) in respect of the lease incentives with tenants in the form of rent free debtors as described in note 4 and capitalised letting fees.
The effect of these adjustments on the revaluation movement during the year is as follows:
|
Year to 30 June 2024 £'000 |
Year to 30 June 2023 £'000 |
|
|
Revaluation movement per above |
(62,814) |
(253,211) |
|
Rent smoothing adjustment (note 4) |
(2,197) |
(2,512) |
|
Movements in associated rent guarantees |
- |
(343) |
|
Movement in Lease incentives |
(564) |
- |
|
Movements in capitalised letting fees |
(218) |
- |
|
Foreign exchange movement through OCI |
(32) |
- |
|
Change in fair value recognised in profit or loss |
(65,825) |
(256,066) |
Valuation techniques and key unobservable inputs
Valuation techniques used to derive fair values
The valuations have been prepared on the basis of market value which is defined in the RICS Valuation Standards as 'the estimated amount for which an asset or liability should exchange on the date of
the valuation between a willing buyer and a willing seller in an arm's length transaction after proper marketing wherein the parties had each acted knowledgeably, prudently and without compulsion'. Market value as defined in the RICS Valuation Standards is the equivalent of fair value under IFRS.
The yield methodology approach is used when valuing the Group's properties which uses market rental values capitalised with a market capitalisation rate. This is sense-checked against the market comparable method (or market comparable approach) where a property's fair value is estimated based on comparable transactions in the market.
Unobservable inputs
Significant unobservable inputs include: the estimated rental value ("ERV") based on market conditions prevailing at the valuation date and net initial yield. Other unobservable inputs include but are not limited to the future rental growth - the estimated average increase in rent based on both market estimations and contractual situations, and the physical condition of the individual properties determined by inspection.
A decrease in ERV would decrease the fair value. A decrease in net initial yield would increase the
fair value.
Sensitivity of measurement of significant valuation inputs
As described in note 2 the determination of the valuation of the Group's investment property portfolio is open to judgement and is inherently subjective by nature.
Sensitivity analysis - impact of changes in net initial yields and rental values
Year ended 30 June 2024
|
UK |
France |
Total |
|
|
Fair value |
£1,704.3m |
£63.9m |
£1,768.2 |
|
Range of Net Initial Yields |
4.6% - 8.0% |
4.2% - 6.8% |
4.6% - 8.0% |
|
Range of Rental values (passing rents or ERV as relevant) of Group's Investment Properties |
£0.3m - £5.1m |
£0.6m - £0.8m |
£0.3m - £5.1m |
|
Weighted average of Net Initial Yields |
5.9% |
6.3% |
5.9% |
|
Weighted average of Rental values (passing rents or ERV as relevant) of Group's Investment Properties |
£2.9m |
£0.7m |
£2.9m |
Year ended 30 June 2023
|
UK |
France |
Total |
|
|
Fair value |
£1,685.7m |
- |
£1,685.7m |
|
Range of Net Initial Yields |
4.7% - 7.4% |
- |
4.7% - 7.4% |
|
Range of Rental values (passing rents or ERV as relevant) of Group's Investment Properties |
£0.3m - £5.1m |
- |
£0.3m - £5.1m |
|
Weighted average of Net Initial Yields |
5.6% |
- |
5.6% |
|
Weighted average of Rental values (passing rents or ERV as relevant) of Group's Investment Properties |
£2.8m |
- |
£2.8m |
The table below analyses the sensitivity on the fair value of investment properties for changes in rental values and net initial yields:
|
+2% Rental value £m |
-2% Rental value £m |
+0.5% Net Initial Yield £m |
-0.5% Net Initial Yield £m |
|
|
(Decrease)/increase in the fair value of investment properties as at 30 June 2024 |
35.4 |
(35.4) |
(138.1) |
164.1 |
|
(Decrease)/increase in the fair value of investment properties as at 30 June 2023 |
33.7 |
(33.7) |
(139.9) |
168.1 |
14. Subsidiaries
The entities listed in the following table were the subsidiary undertakings of the Company at 30 June 2024 all of which are wholly owned. All but those noted as Jersey or French entities below are subsidiary undertakings incorporated in England.
|
Company name |
Holding type |
Nature of business |
|
Supermarket Income Investments UK Limited+ |
Direct |
Intermediate parent company |
|
Supermarket Income Investments (Midco2) UK Limited+ |
Direct |
Intermediate parent company |
|
Supermarket Income Investments (Midco3) UK Limited+ |
Direct |
Intermediate parent company |
|
Supermarket Income Investments (Midco4) UK Limited+ |
Direct |
Intermediate parent company |
|
SII UK Halliwell (MIDCO) LTD+ |
Direct |
Intermediate parent company |
|
Supermarket Income Investments UK (Midco6) Limited+ |
Direct |
Intermediate parent company |
|
Supermarket Income Investments UK (Midco7) Limited+ |
Direct |
Intermediate parent company |
|
Supermarket Income Investments UK (Midco8) Limited*+ |
Direct |
Intermediate parent company |
|
SUPR Green Energy Limited+ |
Direct |
Energy provision company |
|
SUPR Finco Limited+ |
Direct |
Holding company |
|
Supermarket Income Investments UK (NO1) Limited+ |
Indirect |
Property investment |
|
Supermarket Income Investments UK (NO2) Limited+ |
Indirect |
Property investment |
|
Supermarket Income Investments UK (NO3) Limited+ |
Indirect |
Property investment |
|
Supermarket Income Investments UK (NO4) Limited+ |
Indirect |
Property investment |
|
Supermarket Income Investments UK (NO5) Limited+ |
Indirect |
Property investment |
|
Supermarket Income Investments UK (NO6) Limited+ |
Indirect |
Property investment |
|
Supermarket Income Investments UK (NO7) Limited+ |
Indirect |
Property investment |
|
Supermarket Income Investments UK (NO8) Limited+ |
Indirect |
Property investment |
|
Supermarket Income Investments UK (NO9) Limited+ |
Indirect |
Property investment |
|
Supermarket Income Investments UK (NO10) Limited+ |
Indirect |
Property investment |
|
Supermarket Income Investments UK (NO11) Limited+ |
Indirect |
Property investment |
|
Supermarket Income Investments UK (NO12) Limited+ |
Indirect |
Property investment |
|
Supermarket Income Investments UK (NO16) Limited+ |
Indirect |
Property investment |
|
Supermarket Income Investments UK (NO16a) Limited+ |
Indirect |
Property investment |
|
Supermarket Income Investments UK (NO16b) Limited+ |
Indirect |
Property investment |
|
Supermarket Income Investments UK (NO16c) Limited+ |
Indirect |
Property investment |
|
Supermarket Income Investments UK (NO17) Limited+ |
Indirect |
Property investment |
|
TPP Investments Limited+ |
Indirect |
Property investment |
|
T (Partnership) Limited+ |
Indirect |
Property investment |
|
The TBL Property Partnership |
Indirect |
Property investment |
|
Supermarket Income Investments UK (NO19) Limited+ |
Indirect |
Property investment |
|
Supermarket Income Investments UK (NO20) Limited+ |
Indirect |
Property investment |
|
Supermarket Income Investments UK (NO21) Limited+ |
Indirect |
Property investment |
|
Supermarket Income Investments UK (NO22) Limited+ |
Indirect |
Property investment |
|
Supermarket Income Investments UK (NO23) Limited+ |
Indirect |
Property investment |
|
Supermarket Income Investments UK (NO24) Limited+ |
Indirect |
Property investment |
|
Supermarket Income Investments UK (NO25) Limited+ |
Indirect |
Property investment |
|
Supermarket Income Investments UK (NO26) Limited+ |
Indirect |
Property investment |
|
Supermarket Income Investments UK (NO27) Limited+ |
Indirect |
Property investment |
|
Supermarket Income Investments UK (NO28) Limited+ |
Indirect |
Property investment |
|
Supermarket Income Investments UK (NO29) Limited+ |
Indirect |
Property investment |
|
Supermarket Income Investments UK (NO30) Limited+ |
Indirect |
Property investment |
|
Supermarket Income Investments UK (NO31) Limited+ |
Indirect |
Property investment |
|
Supermarket Income Investments UK (NO32) Limited+ |
Indirect |
Property investment |
|
Supermarket Income Investments UK (NO33) Limited+ |
Indirect |
Property investment |
|
Supermarket Income Investments UK (NO34) Limited+ |
Indirect |
Property investment |
|
Supermarket Income Investments UK (NO35) Limited^- |
Indirect |
Property investment |
|
Supermarket Income Investments UK (NO36) Limited+ |
Indirect |
Property investment |
|
Supermarket Income Investments UK (NO37) Limited+ |
Indirect |
Property investment |
|
Supermarket Income Investments UK (NO38) Limited+ |
Indirect |
Property investment |
|
Supermarket Income Investments UK (NO39) Limited^- |
Indirect |
Property investment |
|
Supermarket Income Investments UK (NO40) Limited+ |
Indirect |
Property investment |
|
Supermarket Income Investments UK (NO41) Limited+ |
Indirect |
Property investment |
|
Supermarket Income Investments UK (NO42) Limited+ |
Indirect |
Property investment |
|
Supermarket Income Investments UK (NO43) Limited+ |
Indirect |
Property investment |
|
Supermarket Income Investments UK (NO44) Limited+ |
Indirect |
Property investment |
|
Supermarket Income Investments UK (NO45) Limited+ |
Indirect |
Property investment |
|
Supermarket Income Investments UK (NO47) Limited+ |
Indirect |
Property investment |
|
Supermarket Income Investments UK (NO48) Limited*+ |
Indirect |
Property investment |
|
Supermarket Income Investments UK (NO49) Limited*+ |
Indirect |
Property investment |
|
The Brookmaker Unit Trust^- |
Indirect |
Property investment |
|
Brookmaker Limited Partnership# |
Indirect |
Property investment |
|
Brookmaker (GP) Limited# |
Indirect |
Property investment |
|
Brookmaker (Nominee) Limited# |
Indirect |
Property investment |
|
Horner (GP) Limited^- |
Indirect |
Property investment |
|
Horner (Jersey) Limited Partnership^- |
Indirect |
Property investment |
|
Horner REIT^- |
Indirect |
Property investment |
|
Supermarket Income Investments France 1"*¨ |
Indirect |
Property investment |
|
Supermarket Income Investments France 2"*¨ |
Indirect |
Property investment |
|
Supermarket Income Investments France 3"*¨ |
Indirect |
Property investment |
|
Supermarket Income Investments France 4"*¨ |
Indirect |
Property investment |
|
Supermarket Income Investments France 5"*¨ |
Indirect |
Property investment |
|
Supermarket Income Investments France 6"*¨ |
Indirect |
Property investment |
|
SII UK Halliwell (No1) LTD+ |
Indirect |
Investment in Joint venture |
|
SII UK Halliwell (No2) LTD+ |
Indirect |
Property investment |
|
SII UK Halliwell (No3) LTD+ |
Indirect |
Investment in Joint venture |
|
SII UK Halliwell (No4) LTD+ |
Indirect |
Investment in Joint venture |
|
SII UK Halliwell (No5) LTD+ |
Indirect |
Investment in Joint venture |
|
SII UK Halliwell (No6) LTD+ |
Indirect |
Investment in Joint venture |
* New subsidiaries incorporated during the year ended 30 June 2024
** Subsidiaries acquired during the year ended 30 June 2024
^ Jersey registered entity
" France registered entity
+ Registered office: The Scalpel 18th Floor, 52 Lime Street, London, United Kingdom, EC3M 7AF
- Registered office: 3rd Floor, Gaspe House, 66-72 Esplanade, St Helier, Jersey, JE1 2LH
# Registered office: 8th Floor 1 Fleet Place, London, United Kingdom, EC4M 7RA
¨ Registered office: Tour Pacific, 11-13 Cours Valmy, 92977 Paris La Défense Cedex
The following subsidiaries will be exempt from the requirements of the Companies Act 2006 relating to the audit of individual accounts by virtue of Section 479A of that Act.
|
Company name |
Companies House Registration Number |
|
SII UK Halliwell (MIDCO) LTD |
12473355 |
|
SUPR Green Energy Limited |
12890276 |
|
SII UK Halliwell (No1) LTD |
12475261 |
|
SII UK Halliwell (No2) LTD |
12475599 |
|
SII UK Halliwell (No3) LTD |
12478141 |
|
SII UK Halliwell (No4) LTD |
12604032 |
|
SII UK Halliwell (No5) LTD |
12605175 |
|
SII UK Halliwell (No6) LTD |
12606144 |
|
SUPR Finco Limited |
14292760 |
15. Financial asset arising from sale and leaseback transactions
|
Year to 30 June 2024 £'000 |
Year to 30 June 2023 £'000 |
|
|
At start of year |
10,819 |
10,626 |
|
Additions |
- |
- |
|
Interest income recognised in profit and loss (note 9) |
494 |
483 |
|
Lease payments received during the period |
(290) |
(290) |
|
At end of period |
11,023 |
10,819 |
On 8 June 2022, the Group acquired an Asda store in Carcroft, via a sale and leaseback transaction for £10.6 million, this has been recognised in the Statement of Financial Position as a Financial asset in accordance with IFRS 9. The financial asset is measured using the amortised cost model, which recognises the rental payments as financial income and reductions of the asset value based on the implicit interest rate in the lease. As at 30 June 2024 the market value of the property was estimated at £7.5 million (2023: £7.2 million).
Assets held at amortised cost are assessed annually for impairment with any impairment recognised as an allowance for expected credit losses measured at an amount equal to the lifetime expected credit losses. The Group considers historic, current and forward-looking information to determine expected credit losses arising from either a change in the interest rate implicit in the lease or factors impacting the customer's ability to make lease payments. Based on the information currently available the Group does not expect any credit losses and the asset has not been impaired in the period.
16. Trade and other receivables
|
As at 30 June 2024 £'000 |
As at 30 June 2023 £'000 |
|
|
Interest receivable on settlement of derivatives |
4,946 |
3,122 |
|
Other receivables |
6,077 |
1,601 |
|
Receivable from joint venture disposal |
- |
136,582 |
|
Prepayments and accrued income |
877 |
850 |
|
Total trade and other receivables |
11,900 |
142,155 |
The Group applies the IFRS 9 simplified approach to measuring expected credit losses using a lifetime expected credit loss provision for trade receivables. To measure expected credit losses on a collective basis, trade receivables are grouped based on similar credit risk and ageing. The expected loss rates are based on the Group's historical credit losses experienced over the period from incorporation to 30 June 2024. The historical loss rates are then adjusted for current and forward-looking information on macro-economic factors affecting the Group's customers. Both the expected credit loss provision and the incurred loss provision in the current and prior year are immaterial. No reasonable possible changes in the assumptions underpinning the expected credit loss provision would give rise to a material expected credit loss.
17. Trade and other payables
|
As at 30 June 2024 £'000 |
As at 30 June 2023 £'000 |
|
|
Accrued interest payable |
8,072 |
6,524 |
|
Other corporate accruals |
9,516 |
15,945 |
|
VAT payable |
4,385 |
4,510 |
|
Total trade and other payables |
21,973 |
26,979 |
18. Interest rate derivatives
|
As at 30 June 2024 £'000 |
As at 30 June 2023 £'000 |
|
|
Non-current asset: Interest rate swaps |
12,499 |
35,601 |
|
Non-current asset: Interest rate caps |
3,242 |
1,597 |
|
Current Asset: Interest rate swaps |
13,456 |
16,800 |
|
Current Asset: Interest rate cap |
2,252 |
3,584 |
31,449 57,583
The rate swaps are remeasured to fair value by the counterparty bank on a quarterly basis.
|
The fair value at the end of year comprises: |
Year to 30 June 2024 £'000 |
Year to 30 June 2023 £'000 |
|
At start of year (net) |
57,583 |
5,114 |
|
Interest rate derivative premium paid on inception |
47,494 |
44,255 |
|
Disposal of interest rate derivatives |
(40,612) |
(2,878) |
|
Changes in fair value of interest rate derivative in the year (P&L) |
(8,782) |
19,695 |
|
Changes in fair value of interest rate derivative in the year (OCI) |
(1,456) |
3,111 |
|
(Credit)/Charge to the income statement (P&L) (note 9) |
(22,469) |
(9,671) |
|
(Credit)/Charge to the income statement (OCI) (note 9) |
(309) |
(2,043) |
|
Fair value at end of year (net) |
31,449 |
57,583 |
To partially mitigate the interest rate risk that arises as a result of entering into the floating rate debt facilities referred to in note 19, the Group has entered into derivative interest rate swaps and caps.
A summary of these derivatives as at 30 June 2024 are shown in the table below:
|
Issuer |
Derivative Type |
Notional amount £m |
Premium Paid £m |
Mark to Market 30 June 2024 £m |
Average Strike Rate |
Effective Date |
Maturity Date |
|
|
BLB |
Interest Rate Swap |
£37.3 |
£1.7 |
£1.2 |
2.58% |
Mar-23 |
Mar-26 |
|
|
BLB |
Interest Rate Swap |
£22.2 |
£1.0 |
£0.7 |
2.58% |
Mar-23 |
Mar-26 |
|
|
BLB |
Interest Rate Swap |
£27.4 |
£1.2 |
£0.9 |
2.58% |
Mar-23 |
Mar-26 |
|
|
Wells Fargo |
Interest Rate Swap |
£30.0 |
£2.3 |
£1.1 |
1.33% |
Sep-23 |
Jul-25 |
|
|
SMBC |
Interest Rate Swap |
£50.0 |
£3.7 |
£1.7 |
1.33% |
Sep-23 |
Jul-25 |
|
|
SMBC |
Interest Rate Swap |
£67.0 |
£6.5 |
£3.7 |
1.73% |
Sep-23 |
Sep-26 |
|
|
Barclays |
Interest Rate Cap |
£96.6 |
£2.9 |
£2.8 |
1.40% |
Aug-24 |
Jul-25 |
|
|
Wells Fargo |
Interest Rate Swap |
£204.3 |
£22.2 |
£12.9 |
1.96% |
Sep-23 |
Jul-27 |
|
|
Wells Fargo |
Interest Rate Swap |
£50.0 |
£4.8 |
£2.7 |
1.66% |
Sep-23 |
Jul-26 |
|
|
Wells Fargo |
Interest Rate Swap |
£3.2 |
£0.4 |
£0.4 |
0.00% |
Feb -24 |
Jul-27 |
|
|
SMBC |
Interest Rate Cap |
£96.6 |
£1.4 |
£1.3 |
1.40% |
Jul-25 |
Jan-26 |
|
|
SMBC |
Interest Rate Cap |
£30.0 |
£0.4 |
£0.4 |
1.40% |
Jul-25 |
Jan-26 |
|
|
SMBC |
Interest Rate Cap |
£50.0 |
£0.8 |
£0.7 |
1.40% |
Jul-25 |
Jan-26 |
|
|
SMBC |
Interest Rate Cap |
£3.0 |
£0.4 |
£0.3 |
1.21% |
Nov-23 |
Jun-27 |
|
|
SMBC |
Interest Rate Swap |
£37.5 |
£0.6 |
£0.6 |
3.61% |
Mar-24 |
Sep-26 |
|
|
Total |
£50.3 |
£31.4 |
- |
- |
- |
90% of the Group's outstanding debt as at 30 June 2024 was hedged through the use of fixed rate debt or financial instruments (30 June 2023: 100%). It is the Group's target to hedge at least 50% of the Group's total debt at any time using fixed rate loans or interest rate derivatives.
The Group restructured its derivatives during the year to match the changes in its borrowings, the movements in the Group's fair value derivatives are recognised in the profit and loss. There was one derivative terminated in the year that hedged the Wells facility and was accounted for under hedge accounting; on derecognition of hedge accounting, the cash flow hedge reserve is recycled to the profit and loss over the remaining term of the Wells Fargo facility.
The derivatives have been valued in accordance with IFRS 13 by reference to interbank bid market rates as at the close of business on the last working day prior to each balance sheet date. The fair values are calculated using the present values of future cash flows, based on market forecasts of interest rates and adjusted for the credit risk of the counterparties. The amounts and timing of future cash flows are projected on the basis of the contractual terms.
All interest rate derivatives are classified as level 2 in the fair value hierarchy as defined under IFRS 13 and there were no transfers to or from other levels of the fair value hierarchy during the year.
19. Bank borrowings
|
Amounts falling due within one year: |
As at 30 June 2024 £'000 |
As at 30 June 2023 £'000 |
|
Secured debt |
96,560 |
- |
|
Unsecured debt |
- |
62,090 |
|
Less: Unamortised finance costs |
(44) |
(234) |
|
Bank borrowings per the consolidated statement of financial position |
96,516 |
61,856 |
|
Amounts falling due after more than one year: |
||
|
Secured debt |
186,225 |
291,551 |
|
Unsecured debt |
414,981 |
318,508 |
|
Less: Unamortised finance costs |
(3,554) |
(4,450) |
|
Bank borrowings per the consolidated statement of financial position |
597,652 |
605,609 |
|
Total bank borrowings |
694,168 |
667,465 |
A summary of the Group's borrowing facilities as at 30 June 2024 are shown below:
|
Lender |
Facility |
Expiry |
Expiry[63] |
Credit Margin |
Variable/ hedged^ |
Loan commitment £m |
Amount drawn 30 June 2024 £m |
|
HSBC |
Revolving credit facility |
Sep 2026 |
Sep 2028 |
1.7% |
EURIBOR - 3.71% |
£75.0 |
£69.3 |
|
Deka |
Term Loan |
Aug 2024 |
Aug 2024 |
1.35% |
0.54% |
£47.6 |
£47.6 |
|
Deka |
Term Loan |
Aug 2024 |
Aug 2024 |
1.35% |
0.70% |
£29.0 |
£29.0 |
|
Deka |
Term Loan |
Aug 2024 |
Aug 2024 |
1.40% |
0.32% |
£20.0 |
£20.0 |
|
BLB |
Term Loan |
Mar 2026 |
Mar 2026 |
1.65% |
SWAP - 2.58% |
£86.9 |
£86.9 |
|
Wells Fargo |
Revolving credit facility |
Jul 2025 |
Jul 2025 |
2.00% |
SWAP - 1.33% |
£30.0 |
£30.0 |
|
Wells Fargo |
Revolving credit facility |
Jul 2025 |
Jul 2025 |
2.00% |
SONIA - 5.20% |
£9.0 |
- |
|
Syndicate |
Revolving credit facility |
Jul 2027 |
Jul 2029 |
1.50% |
SWAP - 1.92% |
£250.0 |
£210.5 |
|
Syndicate |
Term Loan |
Jul 2025 |
Jul 2026 |
1.50% |
SWAP - 1.33% |
£50.0 |
£50.0 |
|
Syndicate |
Term Loan |
Jul 2026 |
Jul 2027 |
1.50% |
SWAP - 1.66% |
£50.0 |
£50.0 |
|
SMBC |
Term Loan |
Sep 2026 |
Sept 2028 |
1.40% |
SWAP - 1.73% |
£67.0 |
£67.0 |
|
SMBC |
Term Loan |
Sep 2026 |
Sept 2028 |
1.55% |
SWAP - 3.61% |
£37.5 |
£37.5 |
|
Total |
£752.0 |
£697.8 |
*Includes extension options that can be utilised following approval from all parties.
^ Average rate from 1 July 2024 to expiry of the debt excluding extension options.
The Group has been in compliance with all of the financial covenants across the Group's bank facilities as applicable throughout the periods covered by this financial information.
Any associated fees in arranging the bank borrowings that are unamortised as at the end of the year are offset against amounts drawn under the facility as shown in the table above. The debt is secured
by charges over the Group's investment properties and by charges over the shares of certain Group undertakings, not including the Company itself. There have been no defaults of breaches of any loan covenants during the current year or any prior period.
The Group's borrowings carried at amortised cost are considered to be approximate to their fair value.
Post year end, the Deka facility matured in August 2024, the Group announced the arrangement of a new £100.0 million unsecured facility with ING Bank to replace the Deka facility. The Group also completed an agreement with a group of institutional investors for a private placement of €83.0 million of new senior unsecured notes. For more information see note 29.
20. Deferred tax
The deferred tax asset relates entirely to unutilised trading losses on the Group's French resident companies.
|
Audited |
Audited |
|
|
Year to |
Year to |
|
|
30 June 2024 |
30 June 2023 |
|
|
£'000 |
£'000 |
|
|
At the start of the year |
- |
- |
|
Deferred tax on unutilised French trading losses |
(140) |
- |
|
Net credit to income statement (note 10) |
(140) |
- |
|
At the end of the year |
(140) |
- |
Deferred tax has been calculated based on local rates applicable under local legislation substantively enacted at the balance sheet date.
A deferred tax asset of £0.1 million has been recognised for unutilised trading losses arising on the French Companies in the period. It is the expectation that these losses will be offset against trading profits for the French companies to reduce French Corporation Tax charges in future years. Included in the investment property revaluation movement in the period is a £6.1 million decrease in the fair value of the French properties relating to capitalised acquisition costs. No deferred tax asset has been recognised in respect of unrealised capital losses that would be available on disposal of the properties at a loss at the current market value as it is considered there would not be additional French properties to benefit against the capital loss.
21. Categories of financial instruments
|
As at 30 June 2024 £'000 |
As at 30 June 2023 £'000 |
|
|
Financial assets |
||
|
Financial assets at amortised cost: |
||
|
Financial asset arising from sale and leaseback transaction |
11,023 |
10,819 |
|
Cash and cash equivalents |
38,691 |
37,481 |
|
Trade and other receivables |
11,023 |
141,305 |
|
Financial assets at fair value: |
||
|
Interest rate derivative |
31,449 |
54,278 |
|
Derivatives in effective hedges: |
||
|
Interest rate derivative |
- |
3,304 |
|
Total financial assets |
92,186 |
247,187 |
|
Financial liabilities |
||
|
Financial liabilities at amortised cost: |
||
|
Secured debt |
281,635 |
289,736 |
|
Unsecured debt |
412,533 |
377,729 |
|
Trade and other payables (note 17) |
18,634 |
22,469 |
|
Total financial liabilities |
712,802 |
689,934 |
At the year end, all financial assets and liabilities were measured at amortised cost except for the interest rate derivatives which are measured at fair value. The interest rate derivative valuation is classified as 'level 2' in the fair value hierarchy as defined in IFRS 13 and its fair value was calculated using the present values of future cash flows, based on market forecasts of interest rates and adjusted for the credit risk of the counterparties.
Financial risk management
Through the Group's operations and use of debt financing it is exposed to certain risks. The Group's financial risk management objective is to minimise the effect of these risks, for example by using interest rate cap and interest rate swap derivatives to partially mitigate exposure to fluctuations in interest rates, as described in note 18.
The exposure to each financial risk considered potentially material to the Group, how it arises and the policy for managing it is summarised below.
Market risk - Interest rate risk
Market risk is defined as the risk that the fair value or future cash flows of a financial instrument will fluctuate because of changes in market prices. The Group's market risk arises from open positions in interest bearing assets and liabilities, to the extent that these are exposed to general and specific market movements.
The Group's interest-bearing financial instruments comprise cash and cash equivalents and bank borrowings. 90% of the borrowings are hedged and therefore at a fixed rate. Changes in market interest rates therefore effects the value of the derivatives for the hedged debt and for the unhedged portion it affects the Group's finance income and costs. The Group's sensitivity to changes in interest rates, calculated on the basis of a ten-basis point increase in the three-month SONIA daily rate/ EURIBOR, was as follows:
|
Year to 30 June 2024 £'000 |
Year to 30 June 2023 £'000 |
|
|
Effect on profit |
1,187 |
1,383 |
|
Effect on other comprehensive income and equity |
- |
58 |
Trade and other receivables and payables are interest free as long as they are paid in accordance with their terms, and have payment terms of less than one year, so it is assumed that there is no material market risk associated with these financial instruments.
Market risk - currency risk
The Group prepares its financial information in Sterling. 4% of the Group's Investment Properties are denominated in Euros and as a result the group is subject to foreign currency exchange risk. This risk is partially hedged because within the Group's French operations, rental income, interest costs and the majority of both assets and liabilities are Euro denominated. An unhedged currency risk remains on the value of the Group's net investment in, and net returns from, its French operations.
The Group's sensitivity to changes in foreign currency exchange rates, calculated on a 10% increase in average and closing Sterling rates against the Euro, was as follows, with a 10% decrease having the opposite effect:
|
Year to 30 June 2024 £'000 |
Year to 30 June 2023 £'000 |
|
|
Increase/(decrease) in net assets |
(580) |
- |
|
Increase in profit/(loss) for the year |
(584) |
- |
Market risk - inflation
Inflation risk arises from the impact of inflation on the Group's income and expenditure. The majority of the Group's passing rent at 30 June 2024 is subject to inflation-linked rent reviews. Consequently, the Group is exposed to movements in the Retail Prices Index ("RPI"), which is the relevant inflation benchmark. However, all RPI-linked rent review provisions provide those rents will only be subject to upwards review and never downwards. As a result, the Group is not exposed to a fall in rent in deflationary conditions.
The Group does not expect inflation risk to have a material effect on the Group's administrative expenses, with the exception of the investment advisory fee which is determined as a function of the reported net asset value of the Group.
Credit risk
Credit risk is the risk of financial loss to the Group if a counterparty fails to meet its contractual obligations. The principal counterparties are the Group's tenants (in respect of rent receivables arising under operating leases) and banks (as holders of the Group's cash deposits).
The credit risk of rent receivables is considered low because the counterparties to the operating leases are considered by the Board to be high quality tenants and any lease guarantors are of appropriate financial strength. Rent collection dates and statistics are monitored to identify any problems at an early stage, and if necessary rigorous credit control procedures will be applied to facilitate the recovery of rent receivables. The credit risk on cash deposits is limited because the counterparties are banks with credit ratings which are acceptable to the Board and are kept under review each quarter.
Liquidity risk
Liquidity risk arises from the Group's management of working capital and the finance costs and principal repayments on its secured debt. It is the risk that the Group will not be able to meet its financial obligations as they fall due.
The Group seeks to manage its liquidity risk by ensuring that sufficient cash is available to meet its foreseeable needs. These liquidity needs are relatively modest and are capable of being satisfied by the surplus available after rental receipts have been applied in payment of interest as required by the credit agreement relating to the Group's secured debt.
Before entering into any financing arrangements, the Board assesses the resources that are expected to be available to the Group to meet its liabilities when they fall due. These assessments are made on the basis of both base case and downside scenarios. The Group prepares detailed management accounts which are reviewed by the Board at least quarterly to assess ongoing liquidity requirements and compliance with loan covenants. The Board also keeps under review the maturity profile of the Group's cash deposits in order to have reasonable assurance that cash will be available for the settlement of liabilities when they fall due.
The following table shows the maturity analysis for financial assets and liabilities. The table has been drawn up based on the undiscounted cash flows of non-derivative financial instruments, including future interest payments, based on the earliest date on which the Group can be required to pay and assuming that the SONIA daily and EURIBOR rate remains at the 30 June 2024 rate. Interest rate derivatives are shown at fair value and not at their gross undiscounted amounts.
|
As at 30 June 2024 |
Less than one year £'000 |
One to two years £'000 |
Two to five years £'000 |
More than five years £'000 |
Total £'000 |
|
Financial assets: |
|||||
|
Cash and cash equivalents |
38,691 |
- |
- |
- |
38,691 |
|
Trade and other receivables |
11,023 |
- |
- |
- |
11,023 |
|
Amortised cost asset |
290 |
290 |
946 |
74,602 |
76,128 |
|
Interest rate derivatives |
15,708 |
12,209 |
3,532 |
- |
31,449 |
|
Total financial assets |
65,712 |
12,499 |
4,478 |
74,602 |
157,291 |
|
Financial liabilities: |
|||||
|
Bank borrowings |
119,810 |
186,374 |
443,364 |
- |
749,548 |
|
Trade and other payables |
17,589 |
- |
- |
1,045 |
18,634 |
|
Total financial liabilities |
137,399 |
186,374 |
443,364 |
1,045 |
768,182 |
|
As at 30 June 2023 |
Less than one year £'000 |
One to two years £'000 |
Two to five years £'000 |
More than five years £'000 |
Total £'000 |
|
Financial assets: |
|||||
|
Cash and cash equivalents |
37,481 |
- |
- |
- |
37,481 |
|
Trade and other receivables |
141,305 |
- |
- |
- |
141,305 |
|
Amortised cost asset |
290 |
290 |
908 |
74,930 |
76,418 |
|
Interest rate derivatives |
20,384 |
20,564 |
16,635 |
- |
57,583 |
|
Total financial assets |
199,460 |
20,854 |
17,543 |
74,930 |
312,787 |
|
Financial liabilities: |
|||||
|
Bank borrowings |
81,545 |
94,080 |
549,575 |
- |
725,200 |
|
Trade and other payables |
22,469 |
- |
- |
- |
22,469 |
|
Total financial liabilities |
104,014 |
94,080 |
549,575 |
- |
747,669 |
Capital risk management
The Board's primary objective when monitoring capital is to preserve the Group's ability to continue as a going concern, while ensuring it remains within its debt covenants so as to safeguard secured assets and avoid financial penalties.
Bank borrowings on secured facilities are secured on the Group's property portfolio by way of fixed charges over property assets and over the shares in the property-owning subsidiaries and any intermediary holding companies of those subsidiaries.
At 30 June 2024, the capital structure of the Group consisted of bank borrowings (note 19), cash and cash equivalents, and equity attributable to the Shareholders of the Company (comprising share capital, retained earnings and the other reserves referred to in notes 22 to 24).
In managing the Group's capital structure, the Board considers the Group's cost of capital. In order to maintain or adjust the capital structure, the Group keeps under review the amount of any dividends or other returns to Shareholders and monitors the extent to which the issue of new shares or the realisation of assets may be required.
Reconciliation of financial liabilities relating to financing activities
|
Total bank borrowings £'000 |
Interest and commitment fees payable £'000 |
Interest rate derivatives £'000 |
Total £'000 |
|
|
As at 1 July 2023 |
667,465 |
6,837 |
(57,583) |
616,719 |
|
Cash flows: |
||||
|
Debt drawdowns in the year |
217,560 |
- |
- |
217,560 |
|
Debt repayments in the year |
(191,077) |
- |
- |
(191,077) |
|
Interest and commitment fees paid |
- |
(36,305) |
- |
(36,305) |
|
Loan arrangement fees paid |
(1,318) |
- |
- |
(1,318) |
|
Interest rate premium paid |
- |
- |
(45,364) |
(45,364) |
|
Interest rate derivative disposal |
- |
- |
38,482 |
38,482 |
|
Non-cash movements: |
||||
|
Finance costs in the statement of comprehensive income |
2,403 |
37,605 |
- |
40,008 |
|
Finance income in the statement of comprehensive income |
- |
- |
22,778 |
22,778 |
|
Fair value changes |
- |
- |
10,238 |
10,238 |
|
Foreign exchange movement |
(865) |
- |
- |
(865) |
|
As at 30 June 2024 |
694,168 |
8,137 |
(31,449) |
670,856 |
|
As at 1 July 2022 |
348,546 |
1,939 |
(5,114) |
345,371 |
|
Cash flows: |
||||
|
Debt drawdowns in the year |
912,114 |
- |
- |
912,114 |
|
Debt repayments in the year |
(598,486) |
- |
- |
(598,486) |
|
Interest and commitment fees paid |
- |
(24,116) |
- |
(24,116) |
|
Loan arrangement fees paid |
(5,010) |
- |
- |
(5,010) |
|
Interest rate premium paid |
- |
- |
(44,255) |
(44,255) |
|
Interest rate derivative disposal |
- |
- |
2,878 |
2,878 |
|
Non-cash movements: |
||||
|
Finance costs in the statement of comprehensive income |
10,301 |
29,014 |
(22,806) |
16,509 |
|
Fair value changes |
- |
- |
11,714 |
11,714 |
|
As at 30 June 2023 |
667,465 |
6,837 |
(57,583) |
616,719 |
Movements in respect to share capital are disclosed in note 22 below.
The interest and commitment fees payable are included within the corporate accruals balance in note 17. Cash flow movements are included in the consolidated statement of cash flows and the non-cash movements are included in note 9. The movements in the interest rate derivative financial liabilities can be found in note 18.
22. Share capital
|
Ordinary Shares of 1 pence Number |
Share capital £'000 |
Share premium reserve £'000 |
Capital reduction reserve £'000 |
Total £'000 |
|
|
As at 1 July 2023 |
1,246,239,185 |
12,462 |
500,386 |
704,531 |
1,217,379 |
|
Dividend paid in the period (note 12) |
(75,335) |
(75,335) |
|||
|
As at 30 June 2024 |
1,246,239,185 |
12,462 |
500,386 |
629,196 |
1,142,044 |
|
As at 1 July 2022 |
1,239,868,420 |
12,399 |
494,174 |
778,859 |
1,285,432 |
|
Scrip Dividends issued and fully paid - 22 August 2022 |
1,898,161 |
19 |
2,316 |
- |
2,335 |
|
Scrip Dividends issued and fully paid - 16 November 2022 |
866,474 |
9 |
869 |
- |
878 |
|
Scrip Dividends issued and fully paid - 23 February 2023 |
729,198 |
7 |
721 |
- |
728 |
|
Scrip Dividends issued and fully paid - 26 May 2023 |
2,876,932 |
28 |
2,395 |
- |
2,423 |
|
Share issue costs |
- |
- |
(89) |
- |
(89) |
|
Dividend paid in the period (note 12) |
- |
- |
- |
(74,328) |
(74,328) |
|
As at 30 June 2023 |
1,246,239,185 |
12,462 |
500,386 |
704,531 |
1,217,379 |
23. Cash flow hedge reserve
|
Year to 30 June 2024 £'000 |
Year to 30 June 2023 £'000 |
|
|
At start of the period |
3,304 |
5,114 |
|
Recycled comprehensive loss to profit and loss |
(1,154) |
- |
|
Cash flow hedge reserve taken to profit or loss for the period on disposal of interest rate derivatives |
- |
(2,878) |
|
Fair value movement of interest rate derivatives in effective hedges |
(611) |
1,068 |
|
At the end of the period |
1,539 |
3,304 |
During the period, a previously hedge accounted derivative in relation to the Wells Fargo facility was terminated. The residual balance of the derivative is recycled to the income statement over the remaining period of the Wells Fargo facility to July 2025.
24. Reserves
The nature and purpose of each of the reserves included within equity at 30 June 2024 are as follows:
· Share premium reserve: represents the surplus of the gross proceeds of share issues over the nominal value of the shares, net of the direct costs of equity issues
· Cash flow hedge reserve: represents cumulative gains or losses, net of tax, on effective cash flow hedging instruments
· Capital reduction reserve: represents a distributable reserve created following a Court approved reduction in capital less dividends paid
· Retained earnings represent cumulative net gains and losses recognised in the statement
of comprehensive income.
· Other reserves represents cumulative gains or losses, net of tax, of foreign currency exchange rate differences recognised in a period as other comprehensive income.
The only movements in these reserves during the year are disclosed in the consolidated statement of changes in equity.
25. Capital commitments
The Group had no capital commitments outstanding as at 30 June 2024 and 30 June 2023.
26. Operating leases
The Group's principal assets are investment properties which are leased to third parties under non-cancellable operating leases. The weighted average remaining lease term based on rental income at 30 June 2024 is 12.4 years (2023: 13.6 years). The leases contain predominately fixed or inflation-linked uplifts.
The future minimum lease payments receivable under the Group's leases, are as follows:
|
As at 30 June 2024 £'000 |
As at 30 June 2023 £'000 |
|
|
Year 1 |
112,127 |
100,156 |
|
Year 2 |
111,887 |
98,941 |
|
Year 3 |
111,048 |
98,614 |
|
Year 4 |
108,241 |
97,552 |
|
Year 5 |
106,936 |
97,177 |
|
Year 6-10 |
475,626 |
452,219 |
|
Year 11-15 |
281,725 |
310,150 |
|
Year 16-20 |
62,285 |
94,875 |
|
Year 21-25 |
20,626 |
23,358 |
|
More than 25 years |
9,998 |
12,743 |
|
Total |
1,400,499 |
1,385,785 |
27. Net asset value per share
NAV per share is calculated by dividing the Group's net assets as shown in the consolidated statement of financial position, by the number of ordinary shares outstanding at the end of the year. As there are no dilutive instruments outstanding, basic and diluted NAV per share are identical.
The Group uses EPRA Net Tangible Assets as the most meaningful measure of long-term performance and the measure which is being adopted by the majority of UK REITs, establishing it as the industry standard benchmark. It excludes items that are considered to have no impact in the long-term, such as the fair value of derivatives.
NAV and EPRA NTA per share calculation are as follows:
|
As at 30 June 2024 £'000 |
As at 30 June 2023 £'000 |
|
|
Net assets per the consolidated statement of financial position |
1,119,474 |
1,217,726 |
|
Fair value of financial assets at amortised cost |
(3,493) |
(3,609) |
|
Fair value of interest rate derivatives |
(31,449) |
(57,583) |
|
EPRA NTA |
1,084,532 |
1,156,534 |
|
Ordinary shares in issue at 30 June |
1,246,239,185 |
1,246,239,185 |
|
NAV per share - Basic and diluted (pence) |
90p |
98p |
|
EPRA NTA per share (pence) |
87p |
93p |
28. Transactions with related parties
Details of the related parties to the Group in the year and the transactions with these related parties were as follows:
a. Directors
Directors' fees
The table below shows the fees per annum for the roles performed by the Board for the year ended 30 June 2024:
|
Role |
Jon Austen |
Frances Davies |
Nick Hewson |
Vince Prior |
Sapna Shah |
Cathryn Vanderspar |
|
|
Chair of Board of Directors |
- |
- |
£75,000 |
- |
- |
- |
|
|
Director |
£52,500 |
£52,500 |
- |
£52,500 |
£52,500 |
£52,500 |
|
|
Audit and Risk Committee Chair |
£9,000 |
- |
- |
- |
- |
- |
|
|
Nomination Committee Chair* |
- |
- |
- |
£4,000 |
£4,000 |
- |
|
|
Senior Independent Director* |
- |
- |
- |
£5,000 |
£5,000 |
- |
|
|
Remuneration Committee Chair |
- |
- |
- |
- |
- |
£5,000 |
|
|
ESG Committee Chair |
- |
£5,000 |
- |
- |
- |
- |
|
|
Management Engagement Committee Chair* |
- |
- |
- |
£5,000 |
£5,000 |
- |
*From 21 May 2024, Sapna Shah became Senior Independent Director and Nomination Committee Chair in place of Vince Prior. Vince Prior became Management Engagement Committee Chair in place of Sapna Shah.
The table below shows the total fees received by each member of the Board for the year ended 30 June 2024:
|
Year to 30 June 2024 £'000 |
Year to 30 June 2023 £'000 |
|
|
Nick Hewson |
75 |
75 |
|
Jon Austen |
62 |
62 |
|
Vince Prior |
61 |
62 |
|
Cathryn Vanderspar |
58 |
58 |
|
Frances Davies |
58 |
58 |
|
Sapna Shah* |
58 |
18 |
* Appointed 1 March 2023
The total remuneration payable to the Directors in respect of the current year and previous year are disclosed in note 8.
Directors' interests
Details of the direct and indirect interests of the Directors and their close families in the ordinary shares of one pence each in the Company at 30 June 2024 and at the date of the signing of the accounts were as follows:
· Nick Hewson: 1,330,609 shares (0.11% of issued share capital)
· Jon Austen: 305,339 shares (0.02% of issued share capital)
· Vince Prior: 213,432 shares (0.02% of issued share capital)
· Cathryn Vanderspar: 125,802 shares (0.01% of issued share capital)
· Frances Davies: 36,774 shares (0.00% of issued share capital)
· Sapna Shah: 70,081 shares (0.01% of issued share capital)
b. Investment Adviser
Investment advisory and accounting fees
The investment adviser to the Group, Atrato Capital Limited (the "Investment Adviser"), is entitled to certain advisory fees under the terms of the Investment Advisory Agreement (the "Agreement") dated 14 July 2021.
The entitlement of the Investment Adviser to advisory fees is by way of what are termed 'Monthly Management Fees' and 'Semi-Annual Management Fees' both of which are calculated by reference to the net asset value of the Group at particular dates, as adjusted for the financial impact of certain investment events and after deducting any uninvested proceeds from share issues up to the date of the calculation of the relevant fee (these adjusted amounts are referred to as 'Adjusted Net Asset Value' for the purpose of calculation of the fees in accordance with the Agreement).
Until the Adjusted Net Value of the Group exceeds £1,500 million, the entitlements to advisory fees can be summarised as follows:
· Monthly Management Fee payable monthly in arrears: 1/12th of 0.7125% per calendar month of Adjusted Net Asset Value up to or equal to £500 million, 1/12th of 0.5625% per calendar month of Adjusted Net Asset Value above £500 million and up to or equal to £1,000 million and 1/12th of 0.4875% per calendar month of Adjusted Net Asset Value above £1,000 and up to or equal to £1,500 million.
· Semi-Annual Management Fee payable semi-annually in arrears: 0.11875% of Adjusted Net Asset Value up to or equal to £500 million, 0.09375% of Adjusted Net Asset Value above £500 million and up to or equal to £1,000 million and 0.08125% of Adjusted Net Asset Value above £1,000 million and up to or equal to £1,500 million.
For the year to 30 June 2024 the total advisory fees payable to the Investment Adviser were £9,472,218 (2023: £10,292,302) of which £1,745,960 (2023: £1,845,144) is included in trade and other payables in the consolidated statement of financial position as at 30 June 2024.
The Investment Adviser is also entitled to an annual accounting and administration service fee equal to: £54,107; plus (i) £4,386 for any indirect subsidiary of the Company and (ii) £1,702 for each direct subsidiary of the Company. A full list of the Company and its direct and indirect subsidiary undertakings is listed in Note 14 of this financial information.
For the year to 30 June 2024 the total accounting and administration service fee payable to the Investment Adviser was £363,869 (2023: £297,475) of which £91,950 (2023: £83,614) is included in trade and other payables in the consolidated statement of financial position as at 30 June 2024.
Introducer Services
Atrato Partners, an affiliate of the Investment Adviser, is entitled to fees in relation to the successful introduction of prospective investors in connection with subscriptions for ordinary share capital in
the Company.
The entitlement of the Investment Adviser to introducer fees is by fees and/or commission which can be summarised as follows:
· Commission basis: 1% of total subscription in respect of ordinary shares subscribed for
by any prospective investor introduced by Atrato Partners.
For the year to 30 June 2024 the total introducer fees payable to the affiliate of the Investment Adviser were £nil (2023: £nil).
Interest in shares of the Company
Details of the direct and indirect interests of the Directors of the Investment Adviser and their close families in the ordinary shares of one pence each in the Company at 30 June 2024 were as follows:
· Ben Green: 2,337,286 shares (0.19% of issued share capital)
· Steve Windsor: 1,764,679 shares (0.14% of issued share capital)
· Steven Noble: 246,885 shares (0.02% of issued share capital)
· Natalie Markham: 71,039 shares (0.01% of issued share capital)
On 9 September 2024, the Company announced that Steven Noble stepped down as Chief Investment Officer of the Company's Investment Adviser, Atrato Capital Limited.
Charitable donations
The Company approved a policy to make charitable donations of £150,000 per annum. During the year £120,000 was approved by the Board and paid post year end (2023: Nil). The donations will be made to the Atrato Foundation, a corporate charity registered with the Charity Commission and Companies House, whose Trustees are Lara Townsend (COO of the Investment Adviser) and Natalie Markham (CFO of the Investment Adviser). The donations will be made in the form of a restricted grant, the funds will be directed to charitable causes specified by the Board of the Company. For further information on the Company's charitable activities, please refer to page 11.
29. Subsequent events
Debt financing
· In July 2024, the Group announced the arrangement of a new £100.0 million facility with ING bank at a margin of 1.55% over SONIA. The facility comprises a £75.0 million term loan and a £25.0 million revolving credit facility. The term of the loan is for three-years with two further one-year extension options.
· In July 2024, the Group announced the completed an agreement with a group of institutional investors for a private placement of €83.0 million of new senior unsecured notes. The notes have a term of 7 years and a fixed rate coupon of 4.4%.
· In August 2024, the Deka facility of £96.6 million matured and was settled with the proceeds of the new ING facility.
COMPANY STATEMENT OF FINANCIAL POSITION
As at 30 June 2024
Registered number: 10799126
|
Notes |
As at 30 June 2024 £'000 |
As at 30 June 2023 £'000 |
|
|
Non-current assets |
|||
|
Investments in subsidiaries |
D |
1,139,114 |
1,564,226 |
|
Intercompany receivables |
D |
491,566 |
- |
|
Interest rate derivatives |
14,312 |
29,318 |
|
|
Total non-current assets |
1,644,992 |
1,593,544 |
|
|
Current assets |
|||
|
Interest rate derivatives |
13,258 |
13,397 |
|
|
Trade and other receivables |
E |
4,013 |
11,412 |
|
Cash and cash equivalents |
382 |
2,928 |
|
|
Total current assets |
17,653 |
27,737 |
|
|
Total assets |
1,662,645 |
1,621,281 |
|
|
Current liabilities |
|||
|
Bank Borrowings |
G |
- |
61,856 |
|
Trade and other payables |
F |
227,194 |
127,027 |
|
Total current liabilities |
227,194 |
188,883 |
|
|
Non-Current liabilities |
|||
|
Bank borrowings |
G |
412,533 |
315,873 |
|
Total liabilities |
639,727 |
504,756 |
|
|
Total net assets |
1,022,918 |
1,116,525 |
|
|
Equity |
|||
|
Share capital |
H |
12,462 |
12,462 |
|
Share premium reserve |
500,386 |
500,386 |
|
|
Capital reduction reserve |
629,196 |
704,531 |
|
|
Retained earnings |
(119,126) |
(100,854) |
|
|
Total equity |
1,022,918 |
1,116,525 |
The notes on pages 140 to 141 form part of these financial statements.
The Company has taken advantage of the exemption within section 408 of the Companies Act 2006 not to present its own profit and loss account. The accumulated loss for the year dealt with the financial statements of the Company was £18,272,000 (2023: loss £164,541,000). As at 30 June 2024 the Company has distributable reserves of £510.0 million (2023: £603.7 million).
The Company financial statements were approved and authorised for issue by the Board of Directors on 17 September 2024 and were signed on its behalf by Nick Hewson (Chair).
COMPANY STATEMENT OF CHANGES IN EQUITY
For the year ended 30 June 2024
|
Share capital £'000 |
Share premium reserve £'000 |
Capital reduction reserve £'000 |
Retained earnings £'000 |
Total £'000 |
|
|
As at 1 July 2023 |
12,462 |
500,386 |
704,531 |
(100,854) |
1,116,525 |
|
Loss and total comprehensive loss for the year |
- |
- |
- |
(18,272) |
(18,272) |
|
Transactions with owners |
|||||
|
Interim dividends paid |
- |
- |
(75,335) |
- |
(75,335) |
|
As at 30 June 2024 |
12,462 |
500,386 |
629,196 |
(119,126) |
1,022,918 |
|
As at 1 July 2022 |
12,399 |
494,174 |
778,859 |
63,687 |
1,349,119 |
|
Loss and total comprehensive loss for the year |
- |
- |
- |
(164,541) |
(164,541) |
|
Transactions with owners |
|||||
|
Ordinary shares issued at a premium during the year |
63 |
6,301 |
- |
- |
6,364 |
|
Transfer to capital reduction reserve |
|||||
|
Share issue costs |
- |
(89) |
- |
- |
(89) |
|
Interim dividends paid |
- |
- |
(74,328) |
- |
(74,328) |
|
As at 30 June 2023 |
12,462 |
500,386 |
704,531 |
(100,854) |
1,116,525 |
NOTES TO THE COMPANY FINANCIAL STATEMENTS
A. Basis of preparation
The Company's financial statements have been prepared in accordance with FRS 102, the Financial Reporting Standard applicable in the United Kingdom and the Republic of Ireland.
The principal accounting policies relevant to the Company are as follows:
· Investments in subsidiaries are recognised at cost less provision for any impairment
· Loans and receivables are recognised initially at fair value plus transaction costs less provision for impairment
· Trade payables are recognised initially at fair value and subsequently at amortised cost
· Equity instruments are recognised as the value of proceeds received net of direct issue
costs
· Dividends are recognised as a financial liability and deduction from equity in the period in which they are declared
In preparing the Company's financial statements, advantage has been taken of the following disclosure exemptions available in FRS 102:
· No cash flow statement has been presented
· Disclosures in respect of the Company's financial instruments have not been presented as equivalent disclosures have been provided in respect of the Group
· No reconciliation of the number of shares outstanding at the beginning and end of the year has been presented as it is identical to the reconciliation for the Group shown in note 22
to the Group financial statements
· No disclosure has been given for the aggregate remuneration of the key management personnel of the Company as their remuneration is shown in note 8 to the Group
financial statements
In the year to 30 June 2024, the Company intends to continue to use these disclosure exemptions unless objections are received from Shareholders.
B. Significant accounting judgements, estimates and assumptions
In preparing the financial statements of the Company, the Directors have made the following judgements:
· Determine whether there are any indicators of impairment of the investments in subsidiary undertakings. Factors taken into consideration in reaching such a decision include the financial position and expected future performance of the subsidiary entity. Where indicators of impairment are identified the carrying value of investments in subsidiaries will be compared to their recoverable amount and an impairment charge recognised where this is lower than carrying value. The net asset value of the individual subsidiary entities is considered to be a reasonable proxy for fair value less costs to sell as the underlying investment properties held within these entities is carried at fair value.
C. Auditor's remuneration
The remuneration of the auditor in respect of the audit of the Company's consolidated and individual financial statements for the year was £292,150 (2023: £260,000). Fees payable for audit and non-audit services provided to the Company and the rest of the Group are disclosed in note 7 to the Group financial statements.
D. Investment in subsidiary undertakings
The Company's wholly owned direct subsidiaries are Supermarket Income Investments UK Limited, Supermarket Income Investments (Midco2) UK Limited, Supermarket Income Investments (Midco3) UK Limited, Supermarket Income Investments (Midco4) UK Limited, SII UK Halliwell (Midco) Limited, Supermarket Income Investments (Midco 6) UK Limited , Supermarket Income Investments (Midco7) UK Limited, Supermarket Income Investments (Midco 8), SUPR Finco Limited and SUPR Green Energy Limited all of which are incorporated and operating in England with a registered address of The Scalpel 18th Floor, 52 Lime Street, London, United Kingdom, EC3M 7AF. The full list of subsidiary entities directly and indirectly owned by the Company is disclosed in note 14 to the Consolidated Financial Statements.
The movement in the year was as follows:
|
Year to 30 June 2024 £'000 |
|
|
Opening balance |
1,564,226 |
|
Additions |
1 |
|
Disposals |
(359,865) |
|
Closing balance |
1,204,362 |
|
Impairments of investments in subsidiaries |
(65,248) |
|
As at 30 June 2024 |
1,139,114 |
|
Non-current loans receivable |
491,566 |
|
Closing balance as at 30 June 2024 |
1,630,680 |
During the year a number of the Company's subsidiaries undertook buybacks of their own shares. The proceeds of these buybacks were left outstanding as intercompany loans provided by the Company to the respective subsidiaries. These transactions are responsible for the increase in the Company's intercompany loan receivable balance as at 30 June 2024.
|
Year to 30 June 2023 £'000 |
|
|
Opening balance |
1,329,108 |
|
Additions |
1,066,634 |
|
Closing balance |
2,395,742 |
|
Impairments of investments in subsidiaries |
(831,516) |
|
As at 30 June 2023 |
1,564,226 |
An impairment of investments in subsidiaries was recognised during both the current and previous year following the payment of upstream dividends to the Company. Following the payment of dividends, the net assets of certain dividend paying subsidiaries no longer support the carrying value of the Company's investment in those entities and thus an impairment charge was recognised to bring the carrying value of the investments in line with the recoverable amount, which was also considered to be its value in use.
|
E. Trade and other receivables |
As at 30 June 2024 £'000 |
As at 30 June 2023 £'000 |
|
Intercompany receivables |
3,645 |
9,345 |
|
Prepayments and accrued income |
209 |
223 |
|
VAT receivable |
159 |
- |
|
Other receivables |
- |
1,844 |
|
Total trade and other receivables |
4,013 |
11,412 |
|
F. Trade and other payables |
||
|
Trade creditors |
2,120 |
2,235 |
|
Corporate accruals |
6,491 |
5,122 |
|
VAT payable |
- |
114 |
|
Intercompany payables |
218,583 |
119,556 |
|
Total trade and other payables |
227,194 |
127,027 |
G. Bank Borrowings
|
As at 30 June 2024 £'000 |
As at 30 June 2023 £'000 |
|
|
Amounts falling due within one year: |
||
|
Unsecured debt |
- |
62,090 |
|
Less: Unamortised finance costs |
- |
(234) |
|
Bank borrowings per the Company's statement of financial position |
- |
61,856 |
|
Amounts falling due after more than one year: |
||
|
Unsecured debt |
414,981 |
318,508 |
|
Less: Unamortised finance costs |
(2,448) |
(2,635) |
|
Bank borrowings per the Company's statement of financial position |
412,533 |
315,873 |
|
Total bank borrowings |
412,533 |
377,729 |
Any associated fees in arranging the bank borrowings that are unamortised as at the end of the year are offset against amounts drawn under the facility as shown in the table above.
Details of the bank borrowings of the Company are disclosed in note 19 to the Group financial statements.
H. Share capital
Details of the share capital of the Company are disclosed in note 22 to the Group financial statements.
I. Related party transactions
Details of related party transactions are disclosed in note 28 to the Group financial statements.
Notes to EPRA and other Key Performance Indicators
1. EPRA Earnings and Adjusted Earnings per Share
|
For the period from 1 July 2023 to 30 June 2024 |
Net profit attributable £'000 |
Weighted average number of ordinary shares1 Number |
Earnings/ per share Pence |
|
Net (loss) attributable to ordinary Shareholders |
(21,184) |
1,246,239,185 |
(1.7) |
|
Adjustments to remove: |
|||
|
Changes in fair value of investment properties and associated rent guarantees |
65,825 |
5.3 |
|
|
Changes in fair value of interest rate derivatives measured at FVTPL |
31,251 |
2.5 |
|
|
Deferred Tax |
(140) |
- |
|
|
Finance income received on interest rate derivatives held at fair value through profit and loss |
(22,469) |
(1.8) |
|
|
EPRA earnings |
53,283 |
1,246,239,185 |
4.3 |
|
Add finance income received on interest rate derivatives held at fair value through profit and loss |
22,469 |
1.8 |
|
|
Add accelerated finance costs |
70 |
- |
|
|
Adjusted EPRA earnings |
75,822 |
1,246,239,185 |
6.1 |
1 Based on the weighted average number of ordinary shares in issue in the year ended 30 June 2024.
|
For the period from 1 July 2022 to 30 June 2023 |
Net profit attributable £'000 |
Weighted average number of ordinary shares1 Number |
Earnings/ per share Pence |
|
Net (loss) attributable to ordinary Shareholders |
(144,866) |
1,242,574,505 |
(11.7) |
|
Adjustments to remove: |
|||
|
Changes in fair value of investment properties and associated rent guarantees |
256,066 |
- |
20.6 |
|
Changes in fair value of interest rate derivatives measured at FVTPL |
(10,024) |
- |
(0.8) |
|
Profit on disposal of interest rate derivatives |
(2,878) |
- |
(0.2) |
|
Group share of changes in fair value of joint venture investment properties |
(11,486) |
- |
(0.9) |
|
Profit on disposal of groups interest in joint venture |
(19,940) |
- |
(1.6) |
|
Finance income received on interest rate derivatives held at fair value through profit and loss |
(9,671) |
- |
(0.8) |
|
EPRA earnings |
57,201 |
1,242,574,505 |
4.6 |
|
Add finance income received on interest rate derivatives held at fair value through profit and loss |
9,671 |
- |
0.8 |
|
Add accelerated finance costs |
1,518 |
- |
0.1 |
|
Add Joint Venture acquisition loan arrangement fee |
4,009 |
- |
0.3 |
|
Adjusted EPRA earnings |
72,399 |
1,242,574,505 |
5.8 |
2 Based on the weighted average number of ordinary shares in issue in the year ended 30 June 2023.
2. EPRA NTA per share
EPRA NTA is considered to be the most relevant measure for the Group and is now the primary measure of net assets, replacing the previously reported EPRA Net Asset Value metric. For the current period EPRA NTA is calculated as net assets per the consolidated statement of financial position excluding the fair value of interest rate derivatives.
|
30 June 2024 |
EPRA NTA £'000 |
EPRA NRV £'000 |
EPRA NDV £'000 |
|
|
IFRS NAV attributable to ordinary Shareholders |
1,119,474 |
1,119,474 |
1,119,474 |
|
|
Fair value of Financial asset held at amortised cost |
(3,493) |
(3,493) |
(3,493) |
|
|
Fair value of interest rate derivatives |
(31,449) |
(31,449) |
- |
|
|
Purchasers' costs |
- |
120,239 |
- |
|
|
Fair value of debt |
- |
- |
149 |
|
|
EPRA metric |
1,084,532 |
1,204,771 |
1,116,130 |
|
|
EPRA metric per share |
87p |
97p |
90p |
|
|
30 June 2023 |
EPRA NTA £'000 |
EPRA NRV £'000 |
EPRA NDV £'000 |
|
|
IFRS NAV attributable to ordinary Shareholders |
1,217,726 |
1,217,726 |
1,217,726 |
|
|
Fair value of interest rate derivatives |
(3,609) |
(3,609) |
(3,609) |
|
|
Fair value of Financial asset held at amortised cost |
(57,583) |
(57,583) |
- |
|
|
Intangibles |
- |
- |
- |
|
|
Purchasers' costs |
- |
122,990 |
- |
|
|
Fair value of debt |
- |
- |
4,876 |
|
|
EPRA metric |
1,156,534 |
1,279,524 |
1,218,993 |
|
|
EPRA metric per share |
93p |
103p |
98p |
|
3. EPRA Net Initial Yield (NIY) and EPRA "topped up" NIY
|
As at 30 June 2024 £'000 |
As at 30 June 2023 £'000 |
|
|
Investment Property - wholly owned (note 13) |
1,768,216 |
1,685,690 |
|
Investment Property - share of joint ventures |
- |
- |
|
Completed Property Portfolio |
1,768,216 |
1,685,690 |
|
Allowance for estimated purchasers' costs |
120,239 |
122,990 |
|
Grossed up completed property portfolio valuation (B) |
1,888,455 |
1,808,680 |
|
Annualised passing rental income - wholly owned |
112,338 |
99,910 |
|
Annualised non-recoverable property outgoings |
(1,116) |
(1,117) |
|
Annualised net rents (A) |
111,222 |
98,793 |
|
Rent expiration of rent-free periods and fixed uplifts |
440 |
447 |
|
Topped up annualised net rents (C) |
111,662 |
99,240 |
|
EPRA NIY (A/B) |
5.89% |
5.46% |
|
EPRA "topped up" NIY (C/B) |
5.91% |
5.49% |
All rent free periods expire within the year to 30 June 2024
4. EPRA Vacancy Rate
|
EPRA Vacancy Rate |
As at 30 June 2024 £'000 |
As at 30 June 2023 £'000 |
|
Estimated rental value of vacant space |
591 |
439 |
|
Estimated rental value of the whole portfolio |
113,660 |
100,797 |
|
EPRA Vacancy Rate |
0.5% |
0.4% |
The EPRA vacancy rate is calculated as the ERV of the unrented, lettable space as a proportion of the total rental value of the Investment Property portfolio. This is expected to continue to be a highly immaterial percentage as the majority of the portfolio is let to the largest supermarket operators in the UK.
5. EPRA Cost Ratio
|
As at 30 June 2024 £'000 |
As at 30 June 2023 £'000 |
|
|
Administration expenses per IFRS |
15,218 |
15,429 |
|
Service charge income |
(6,822) |
(5,939) |
|
Service charge costs |
7,441 |
6,518 |
|
Net Service charge costs |
619 |
579 |
|
Share of joint venture expenses |
- |
938 |
|
Total costs (including direct vacant property costs) (A) |
15,837 |
16,946 |
|
Vacant property costs |
(331) |
(328) |
|
Total costs (excluding direct vacant property costs) (B) |
15,506 |
16,618 |
|
Gross rental income per IFRS |
107,851 |
95,823 |
|
Less: service charge components of gross rental income |
- |
- |
|
Add: Share of Gross rental income from Joint Ventures |
- |
13,529 |
|
Gross rental income (C) |
107,851 |
109,352 |
|
EPRA Cost ratio (including direct vacant property costs) (A/C) |
14.7% |
15.50% |
|
EPRA Cost ratio (excluding vacant property costs) (B/C) |
14.4% |
15.20% |
1. The Company does not have any overhead costs capitalised as it has no assets under development.
6. EPRA LTV
|
As at |
As at |
|
|
30 June 2024 £'000 |
30 June 2023 £'000 |
|
|
Group Net Debt |
||
|
Borrowings from financial institutions |
694,168 |
667,465 |
|
Net payables |
34,832 |
- |
|
Less: Cash and cash equivalents |
(38,691) |
(37,481) |
|
Group Net Debt Total (A) |
690,309 |
629,984 |
|
Group Property Value |
||
|
Investment properties at fair value |
1,768,216 |
1,685,690 |
|
Intangibles |
- |
- |
|
Net receivables |
- |
93,620 |
|
Financial assets |
11,023 |
10,819 |
|
Total Group Property Value (B) |
1,779,239 |
1,790,129 |
|
Group LTV (A-B) |
38.80% |
35.19% |
|
Share of Joint Ventures Debt |
||
|
Bond loans |
- |
- |
|
Net payables |
- |
- |
|
JV Net Debt Total (A) |
- |
- |
|
Group Property Value |
||
|
Owner-occupied property |
||
|
Investment properties at fair value |
- |
- |
|
Total JV Property Value (B) |
- |
- |
|
JV LTV (A-B) |
0.00% |
0.00% |
|
Combined Net Debt (A) |
690,309 |
629,984 |
|
Combined Property Value (B) |
1,779,239 |
1,790,129 |
|
Combined LTV (A-B) |
38.80% |
35.19% |
7. EPRA Like-for-Like Rental Growth
|
Sector |
Year ended 30 June 2024 £'000 |
Year ended 30 June 2023 £'000 |
Like-for-Like rental growth % |
|
UK |
82,003 |
80,329 |
2.1% |
The like-for-like rental growth is based on changes in net rental income for those properties which have been held for the duration of both the current and comparative reporting. This represents a portfolio valuation, as assessed by the valuer of £1.30 billion (30 June 2023: £1.35 billion).
8. EPRA Property Related Capital Expenditure
|
As at |
As at |
|
|
30 June 2024 £'000 |
30 June 2023 £'000 |
|
|
Group |
||
|
Acquisitions |
145,834 |
377,311 |
|
Development |
380 |
- |
|
Investment properties |
- |
- |
|
Group Total CapEx |
146,214 |
377,311 |
|
Joint Venture |
||
|
Acquisitions |
- |
- |
|
Development |
- |
- |
|
Investment properties |
- |
- |
|
Joint Venture CapEx |
- |
- |
|
Total CapEx |
146,214 |
377,311 |
Acquisitions relate to purchase of investment properties in the year and includes capitalised acquisition costs. Development relates to capitalised costs in relation to development expenditure on the property portfolio.
9. Total Shareholder Return
|
Total Shareholder Return |
Year to 30 June 2024 Pence per share ('p') |
Year to 30 June 2023 Pence per share ('p') |
|
Share price at start of the year |
73.00 |
119.50 |
|
Share price at the end of the year |
72.50 |
73.00 |
|
Increase in share price |
(0.50) |
(46.50) |
|
Dividends declared for the year |
6.06 |
6.00 |
|
Increase / (decrease) in share price plus dividends |
5.56 |
(40.50) |
|
Share price at start of year |
73.00 |
119.50 |
|
Total Shareholder Return |
8% |
(34%) |
10. Net loan to value ratio
The proportion of our gross asset value that is funded by borrowings calculated as statement of financial position borrowings less cash balances divided by total investment properties valuation.
|
Net loan to value |
As at 30 June 2024 £'000 |
As at 30 June 2023 £'000 |
|
Bank borrowings |
694,168 |
667,465 |
|
Less cash and cash equivalents |
(38,691) |
(37,481) |
|
Net borrowings |
655,477 |
629,984 |
|
Investment properties valuation |
1,768,216 |
1,685,690 |
|
Net loan to value ratio |
37% |
37% |
11. Annualised passing rent
Annualised passing rent is the annualised cash rental income being received as at the stated date.
GLOSSARY
|
AGM |
Annual General Meeting |
|
AIFMD |
Alternative Investment Fund Managers Directive |
|
EPRA |
European Public Real Estate Association |
|
EPS |
Earnings per share, calculated as the profit for the period after tax attributable to members of the parent company divided by the weighted average number of shares in issue in the period |
|
FCA |
Financial Conduct Authority of the United Kingdom |
|
FRI |
A lease granted on an FRI basis means that all repairing and insuring obligations are imposed on the tenant, relieving the landlord from all liability for the cost of insurance and repairs |
|
IFRS |
UK adopted international accounting standards |
|
IPO |
An initial public offering (IPO) refers to the process of offering shares of a corporation to the public in a new stock issuance |
|
LSE |
London Stock Exchange |
|
LTV |
Loan to Value: the outstanding amount of a loan as a percentage of property value |
|
NAV |
Net Asset Value |
|
Net Initial Yield |
Annualised net rents on investment properties as a percentage of the investment property valuation, less assumed purchaser's costs of 6.8% |
|
Net Loan to Value or Net LTV |
LTV calculated on the gross loan amount less cash balances |
|
Omnichannel |
Stores offering both instore picking and online fulfilment |
|
REIT |
Real Estate Investment Trust |
|
Running yield |
The anticipated Net Initial Yield at a future date, taking account of any rent reviews in the intervening period |
|
Sainsbury's Reversion Portfolio (SRP) |
A portfolio consisting of the freehold interest in 26 geographically diverse high quality Sainsbury's supermarkets |
|
Total Shareholder Return (TSR) |
The movement in share price over a period plus dividends declared for the same period expressed as a percentage of the share price at the start of the Period |
|
WAULT |
Weighted Average Unexpired Lease Term. It is used by property companies as an indicator of the average remaining life of the leases within their portfolios |
CONTACTS INFORMATION
|
Directors |
Nick Hewson (Non-Executive Chair) Vince Prior (Chair of Management Engagement Committee) Jon Austen (Chair of Audit and Risk Committee) Cathryn Vanderspar (Chair of Remuneration Committee) Frances Davies (Chair of ESG Committee) Sapna Shah (Chair of Nomination Committee & Senior Independent Director) |
|
Company Secretary |
Hanway Advisory Limited The Scalpel 18th Floor, 52 Lime Street, London, United Kingdom, EC3M 7AF |
|
Registrar |
Link Asset Services The Registry, 34 Beckenham Road, Beckenham, Kent, BR3 4TU |
|
AIFM |
JTC Global AIFM Solutions Limited Ground floor, Dorey Court, Admiral Park, St Peter Port, Guernsey, Channel Islands, GY1 2HT |
|
Investment Adviser |
Atrato Capital Limited 3rd Floor, 10 Bishops Square, London E1 6EG |
|
Financial adviser, Joint Corporate Broker and Placing Agent |
Stifel Nicolaus Europe Limited 150 Cheapside, London, EC2V 6ET |
|
Joint Corporate Broker |
Goldman Sachs International Plumtree Court, 25 Shoe Lane, London, EC4A 4AU |
|
Auditors |
BDO LLP 55 Baker Street, London, W1U 7EU |
|
Property Valuers |
Cushman & Wakefield 125 Old Broad Street, London, EC2N 1AR |
|
Financial PR Advisers |
FTI 200 Aldersgate Street, London, EC1A 4HD |
|
Website |
|
|
Registered Office |
The Scalpel 18th Floor, 52 Lime Street, London, EC3M 7AF |
|
Stock exchange ticker ISIN |
SUPR GB00BF345X11 |
This report will be available on the Company's website.
[1] The alternative performance measures used by the Group have been defined and reconciled to the IFRS financial statements within the unaudited supplementary information
[2] Calculated as Adjusted earnings divided by dividends paid during the year
[3] IGD UK Grocery Market Value forecasts
[4] Kantar - UK Grocery Market Share Data (12 weeks ending 09 June 2024)
[5] IGD France Grocery Market Value forecasts
[6] Kantar - France Grocery Market Share Data (12 weeks ending 07 July 2024)
[7] Carrefour "Digital Retail 2026" strategy
[8] IGD Research, "Strategic outlook for Carrefour" (April 2024)
[9] Kantar - France Grocery Market Share Data (March 2024)
[10] Standard & Poor's
[11] Annual ILC-linked rent reviews
[12] IGD French Grocery Market (2024 forecast)
[13] Kantar France Grocery Market Share (12 weeks ending 07 July 2024)
[14] Carrefour "Digital Retail 2026" strategy
[15] Tesco FY23/24 Results
[16] Sainsbury's FY23/24 Results
[17] Carrefour Q2/H1 Sales and Results 2024
[18] IGD French Grocery Market Value (2024 forecast)
[19] IGD Research 2024, Strategic outlook for Carrefour
[20] Kantar France Grocery Market Share (12 weeks ending July 2024)
[21] IGD Research 2024
[22] Years ending 30 June Source: Knight Frank, Savills, MSCI, operator announcements Atrato Capital research
[23] Based on most recent company accounts where disclosed
[24] Excluding acquisition costs
[25] With a break option at year 10
[26]"Winning in Grocery during and after Covid", OC&C, Nectar 360
[27] IGD Grocery Market channel data (2019 actual, 2024 forecast)
[28] Kantar UK Grocery Market Share (12 weeks ending June 2024)
[29] Which? Supermarket food price inflation tracker, June 2024
[30] IGD
[31] Kantar France Grocery Market Share (12 weeks ending 07 July 2024)
[32] Carrefour "Digital Day - Digital Acceleration for Retail & Ecommerce"
[33] "Carrefour 2026" Strategic Plan
[34] Net finance expense is adjusted for finance income from derivatives held at fair value through profit and loss and non-recurring debt restructuring costs
[35] Net finance expense is adjusted for finance income from derivatives held at fair value through profit and loss and non-recurring debt restructuring costs.
[36] Undrawn facilities for June 2024 includes a £50 million accordion option
[37] Including post balance sheet events
[38] Includes rates fixed through interest rate derivatives
[39] Including extension options at lenders' discretion
[40] FERA emissions includes the well-to-tank (WTT) and transmission and distribution (T&D) upstream emissions from Scope 1 and 2.
[41] Emissions not calculated due to lack of data and immateriality (<1% of total emissions). SUPR does not have an office or employees. The only travel is quarterly travel by non-exec directors, the majority of which is local travel in London.
[42] Values have been rounded.
[43] Emissions in downstream leased assets includes emission from tenant electricity, fuel and refrigerant consumption. FERA emissions associated with leased assets are included in Scope 3: Downstream Leased Assets
[44] Values have been rounded.
[45] Tenant energy consumption from fuels and electricity only.
[46] Normalised to Scope 1 + 2 floor area: 281,291 m2 FY24
[47] Normalised to Scope 3 floor area: 609,984 m2 FY24
[48] Task Force on Climate-related Financial Disclosures, "Final Report: Recommendations of the Task Force on Climate-related Financial Disclosures" (June 2017). https://assets.bbhub.io/company/sites/60/2021/10/FINAL-2017-TCFD-Report.pdf
[49] Physical Climate VaR is defined as the net present value of the future costs attached to physical risk (cost of damage due to extreme weather), expressed as a % of the asset's Capital Value. Calculated for a given carbon emissions reduction scenario or climate change scenario, with a given scenario outcome (aggressive or average) in case of physical risk. Discount rate of 7.4% rate (average long-term total return of MSCI Global Property Index).
[50] Financial Risk Categories include: Severe Risk (VaR<-25%), Significant Risk (VaR<-5%), Moderate Risk (VaR<-0.5%), Negligible Risk (VaR<0%), No Identifiable Risk (VaR=0%), Negligible Risk Reduction (VaR>0%), Risk Reduction (VaR>0.5%).
[51] The exposure assessment adopted the Climate VaR financial risk thresholds of negligible, moderate, significant and severe risk, with severe the highest financial risk category.
[52] 3°C | REMIND | Current Policies (default) by 2100 time horizon. The Aggressive Outcome reflects the severe downside physical risk of a given climate change scenario and is computed from the 95th percentile of the distribution of Discounted Costs reflecting uncertainty about the climate system and modelling assumptions. The Aggressive Outcome (or worst case/95th percentile) was selected to better stress test the Company's strategy.
[53] Percentages by count of total properties in the portfolio. Three assets were excluded from the MSCI tool to avoid distorting the results. This was due to their acquisition dates meaning no full year energy consumption data from prior year was available to upload into the tool and available proxy data within the tool was deemed inconsistent with the actual data results.
[54] The nature of FRI leases means the tenants have responsibility for the maintenance and operation of the assets (including the heating and cooling of the building) during the term of the lease.
[55] As at 30 June 2023 including post balance sheet events
[56] The majority of estimates are attributed to refrigerant gasses which were 100% estimated. 52% of purchased electricity emissions and 70% of natural gas emissions were calculated based on actual data in FY24, an improvement from 23% and 27% actual data respectively in FY23.
[57] Three assets were excluded from the MSCI tool to avoid distorting the results. This was due to their acquisition dates meaning no full year energy consumption data from prior year was available to upload into the tool and available proxy data within the tool was deemed inconsistent with the actual data results.
[58] FERA emissions associated with tenant activities under Scope 3 downstream leased assets are not included in the figures reported.
[59] FY23 figures (1 July 2022 - 30 June 2023) as restated due to an error identified in the supermarket refrigerant emission calculation for FY23.
[60] Excludes supermarkets located in Scotland, due to differing EPC calculation methodology used, making the sites non-comparable.
[61] Excludes ancillary units located in Scotland, due to differing EPC calculation methodology used, making the sites non-comparable.
[62] The Directors have identified certain measures that they believe will assist the understanding of the performance of the business. The measures are not defined under IFRS and they may not be directly comparable with other companies' adjusted measures. The non-GAAP measures are not intended to be a substitute for, or superior to, any IFRS measures of performance, but they have been included as the Directors consider them to be important comparable and key measures used within the business for assessing performance. The key non-GAAP measures identified by the Group have been defined in the supplementary information and, where appropriate, reconciliation to the nearest IFRS measure has been given.
[63] Including uncommitted extension options.