

26 February 2026
MACFARLANE GROUP PLC
("MACFARLANE GROUP", "THE COMPANY", "THE GROUP")
ANNUAL RESULTS 2025
Group profit in line with revised market consensus
FINANCIAL HIGHLIGHTS
|
2025 £000 |
2024 £000 |
Increase/ % |
|
|
(Decrease) |
|||
|
£000 |
£000 |
% |
|
|
Statutory measures |
|||
|
Revenue |
300,810 |
270,437 |
11% |
|
Gross profit |
112,171 |
105,372 |
6% |
|
Operating profit |
12,495 |
23,597 |
(47%) |
|
Profit before tax |
8,050 |
20,896 |
(61%) |
|
Profit for the year |
6,316 |
15,530 |
(59%) |
|
Interim and proposed final dividend (pence) |
3.66p |
3.66p |
- |
|
Diluted earnings per share (pence) |
3.98p |
9.74p |
(59%) |
|
Alternative performance measures 1 |
|||
|
Adjusted operating profit |
19,689 |
27,402 |
(28%) |
|
Adjusted profit before tax |
15,573 |
24,969 |
(38%) |
|
Adjusted diluted earnings per share (pence) |
7.62p |
11.56p |
(34%) |
1 See below for reconciliation of Alternative Performance Measures to Statutory Measures.
Key Financial Highlights
· Group revenue increased by 11% to £300.8m (2024: £270.4m) and operating profit reduced to £12.5m (2024: £23.6m).
· Group adjusted operating profit reduced by 28% to £19.7m (2024: £27.4m).
· Group adjusted operating profit as a percentage of revenue decreased to 6.5% (2024: 10.1%).
· No provision has been made in respect of the outcome of the investigation into the Pitreavie incident.
· Basic and diluted earnings per share were 3.99p per share (2024: 9.76p per share) and 3.98p per share (2024: 9.74p per share) respectively.
· The Board proposes to maintain the final dividend at 2.70p per share (2024: 2.70p per share) payable on 12 June 2026, taking the total dividend for 2025 to 3.66p per share (2024: 3.66p per share).
· Packaging Distribution generated revenues of £229.2m (2024: £228.8m) with adjusted operating profit of £11.4m (2024: £20.2m).
· Manufacturing Operations generated revenues of £78.5m (2024: £47.5m) with adjusted operating profit of £8.3m (2024: £7.2m).
· Net cash inflow from operating activities of £24.8m (2024: £25.4m) reflects continued effective management of working capital.
· Net bank debt was £16.2m on 31 December 2025, following a net cash outflow of £14.2m in the year, after £25.3m (2024: £21.1m) attributable to acquisitions, the share buyback, dividends and net capital expenditure.
· The Group is operating well within its bank facility of £40.0m which runs until November 2028, with an option to extend to November 2029.
· As we prepare the pension scheme for buy-in, a non-recurring charge of £1.9m was accrued in 2025 to recognise an increase in the expected cost of historic equalisation of pensions. The pension scheme surplus, after reflecting the charge, was £6.0m at 31 December 2025 (31 December 2024: £9.6m).
CHAIR'S STATEMENT
2025 was a difficult year for the Group, however revenue increased 11% and profit, although below 2024, was in line with the revised market expectations.
We were deeply saddened to report in October 2025 the loss of one of our colleagues in a tragic incident at the corrugate manufacturing facility of The Pitreavie Group Limited ("Pitreavie"), acquired in early 2025. Our thoughts remain with all those affected and we continue to provide support to ensure their wellbeing. The incident remains under investigation by the authorities.
During the year we experienced economic headwinds and uncertainty creating a particularly competitive trading environment and material increases in operating costs which, together with the impact of the Pitreavie incident, resulted in a marked impact on the Group's financial performance.
Trading Performance
Packaging Distribution profits were significantly below 2024 as the business experienced weaker-than-expected demand, delays in new business decision making, pressure on gross margins from a more intense trading environment and increased labour and property-related costs. The business continued to invest in strengthening its management and sales teams during 2025.
Manufacturing Operations, excluding Pitreavie, performed well. The performance was driven by a good contribution from the acquisition of Polyformes Limited ("Polyformes") in July 2024 combined with stronger demand from customers, particularly in the defence, space and aerospace sectors.
Pitreavie was acquired to strengthen our business in Scotland and offer in-house corrugate supply. We expected Pitreavie to be a significant contributor to the Group in 2025, but its performance was well below expectations, mainly due to the impact of the tragic incident. The recently announced £1.2m investment in new equipment will return the business to full operational capacity in Q2 2026, helping to accelerate the process of recovery and support future growth.
Cash Flow and Bank Borrowings
The Group's strong operating cash flows enabled the allocation of capital to invest in the business, fund acquisitions, purchase shares and to support our dividend policy with a low level of net bank debt. The Group extended its borrowing facility of £40m with Bank of Scotland PLC and HSBC UK Bank plc to November 2028 and retains options to extend by one further year and to increase the facilities by up to £20m.
Pension Scheme
The Group is positioning the pension scheme for a possible buy-in to reduce future risk and minimise any further requirement for cash contributions. As part of this process, a non-recurring charge of £1.9m was accrued in 2025 to recognise an increase in the expected cost of historic equalisation of pensions.
Capital Allocation
The Board proposes to maintain the final dividend at 2.70 pence per share, amounting to a full-year dividend of 3.66 pence per share (2024: 3.66 pence per share). Subject to the approval of shareholders at the Annual General Meeting on Tuesday 12 May 2026, the final dividend will be paid on Friday 12 June 2026 to those shareholders on the register on Friday 15 May 2026 (ex-dividend date 14 May 2026).
The Group has spent £2.1m by 31 December 2025 of the £4m share buyback programme which commenced in June 2025.
Sustainability
In 2025, the Group achieved a reduction in its Scope 1 and 2 carbon emissions. The Group is committed to reducing its direct impact on the environment through electrification of our delivery fleet and expanding the use of renewable energy through the installation of solar panels at more of our operating locations.
We continued to work with our customers to reduce the environmental impact of their packaging operations with a particular focus in 2025 on supporting our customers in the retail sector to navigate the challenges of the Extended Producer Responsibility ("EPR") regulations that came into effect during the year.
Outlook
In 2026 we anticipate markets and the competitive environment to remain challenging.
Management is focused on actions to improve the performance of Packaging Distribution, to recover the Pitreavie business and to continue the development of our specialist Manufacturing Operations. Management priorities for 2026, which are expected to accrue benefits weighted towards the second half of the year, are to:
· Focus new business development primarily in industrial markets to optimise the benefits of our product/ service offer for customers
· Improve operational efficiency through targeted cost savings
· Refine our sourcing model to reduce input pricing
· Recover the Pitreavie performance, benefitting from the recently announced replacement investment in corrugate production capacity
Whilst acquisitions are not anticipated in the short term, the Group continues to work on the acquisition pipeline for the future.
The Board is confident that effective execution of the key priorities identified will create forward momentum for the Group.
The table below reconciles alternative performance measures to statutory financial measures.
|
Alternative Performance Measures |
Amortisation £000 |
Goodwill Impairment |
Deferred Contingent Consideration Adjustments |
IAS19 Past Service Cost Adjustment |
Tax |
Statutory Measures |
||
|
£000 |
£000 |
£000 |
£000 |
£000 |
£000 |
£000 |
||
|
Year to 31 December 2025 |
||||||||
|
Adjusted operating profit |
19,689 |
(5,171) |
(1,625) |
1,532 |
(1,930) |
- |
12,495 |
Operating profit |
|
Adjusted profit before tax |
15,573 |
(5,171) |
(1,625) |
1,203 |
(1,930) |
- |
8,050 |
Profit before tax |
|
Adjusted diluted earnings per share (pence) |
7.62p |
(3.26)p |
(1.03)p |
0.76p |
(1.22)p |
1.11p |
3.98p |
Diluted earnings per share (pence) |
|
Year to 31 December 2024 |
||||||||
|
Adjusted operating profit |
27,402 |
(4,610) |
- |
805 |
- |
- |
23,597 |
Operating profit |
|
Adjusted profit before tax |
24,969 |
(4,610) |
- |
537 |
- |
- |
20,896 |
Profit before tax |
|
Adjusted diluted earnings per share (pence) |
11.56p |
(2.89)p |
- |
0.34p |
- |
0.73p |
9.74p |
Diluted earnings per share (pence) |
Further enquiries: |
Macfarlane Group |
Tel: 0141 333 9666 |
|
Aleen Gulvanessian Chair |
||
|
Peter Atkinson Chief Executive |
||
|
Ivor Gray Finance Director |
||
|
|
Spreng Thomson |
|
|
Callum Spreng |
Mob: 07803 970103 |
Legal Entity Identifier (LEI): 213800LVRYDERSJAAZ73
Notes to Editors:
· Macfarlane Group PLC has been listed on the Premium segment of the Main Market of the London Stock Exchange (LSE: MACF) since 1973 with over 75 years' experience in the UK packaging industry.
· Through its two divisions, Macfarlane Group services a broad range of business customers, supplying them with high quality protective packaging products which help customers reduce supply chain costs, improve operational efficiencies and sustainability and enhance their brand presentation. The divisions are:
o Packaging Distribution - Macfarlane Packaging Distribution is the leading UK distributor of a comprehensive range of protective packaging products; and
o Manufacturing Operations - Macfarlane Design and Manufacture is a UK market leader in the design and production of protective packaging for high value and fragile products.
· Headquartered in Glasgow, Scotland, Macfarlane Group employs over 1,200 people at 42 sites, principally in the UK, as well as in Ireland, Germany and the Netherlands.
· Macfarlane Group supplies more than 20,000 customers, principally in the UK and Europe.
· In partnership with over 2,000 suppliers, Macfarlane Group distributes and manufactures to a wide range of sectors, including: logistics; electronics; defence; medical; automotive; aerospace; retail e-commerce; and food.
BUSINESS REVIEW
Group
Group revenue increased by 11% and adjusted operating profit reduced by 28% in 2025. This reflects:
· the challenging economic conditions in our Packaging Distribution business,
· the under performance of the Pitreavie business acquired in January 2025 and the impact of the tragic incident at its manufacturing site in Cumbernauld,
· a strong performance from our Manufacturing Operations underpinned by the Polyformes acquisition in 2024.
The Group has also made good progress against its ESG objectives, details of which will be set out in the Annual Report and Accounts 2025.
|
Group performance |
Revenue 2025 £000 |
Adjusted operating profit 1 2025 £000 |
Operating profit 2025 £000 |
Revenue 2024 £000 |
Adjusted operating profit 2024 £000 |
Operating profit 2024 £000 |
|
Segment |
||||||
|
Packaging Distribution |
229,150 |
11,373 |
6,678 |
228,763 |
20,158 |
17,331 |
|
Manufacturing Operations |
71,660 |
8,316 |
5,817 |
41,674 |
7,244 |
6,266 |
|
|
|
|
|
|
|
|
|
Group total |
300,810 |
19,689 |
12,495 |
270,437 |
27,402 |
23,597 |
|
|
|
|
|
|
|
|
|
% of Revenue |
6.5% |
4.2% |
10.1% |
8.7% |
||
1 See above for reconciliation of Alternative Performance Measures to Statutory Measures.
BUSINESS REVIEW
Macfarlane Group's trading activities comprise Packaging Distribution and Manufacturing Operations.
Macfarlane's Packaging Distribution business is the UK's leading specialist distributor of protective packaging materials, with a growing presence in Europe. Macfarlane operates in the UK, Ireland, the Netherlands and Germany from 26 Regional Distribution Centres ("RDCs") and three satellite sites, supplying industrial and retail customers with a comprehensive range of protective packaging materials on a local, regional, national and international basis.
Competition in the packaging distribution market is from local and regional protective packaging specialist companies as well as national and international distribution generalists who supply a range of products including protective packaging materials.
Macfarlane competes effectively on a local basis through its strong focus on customer service, its breadth and depth of product offering and through the recruitment and retention of high-quality staff with good local market knowledge. On a national and international basis, Macfarlane has market focus, expertise and a breadth of product and service knowledge, all of which enable it to compete effectively against non-specialist packaging distributors.
Packaging Distribution benefits its customers by enabling them to ensure their products are cost-effectively protected in transit and storage through the supply of a comprehensive product range, single source stock-and-serve supply, just-in-time delivery, tailored stock management programmes, electronic trading and independent advice on both packaging materials and packing processes. Through the 'Significant Six' 1 sales approach we reduce our customers' 'Total Cost of Packaging', improve their sustainability performance and reduce their carbon footprint. This is achieved through supplying effective packaging solutions, optimising warehousing and transportation, reducing damages and returns and improving packaging efficiency.
1 "Significant Six" represents the six key costs in a customers' packing process being transport, warehousing, administration, damages and returns, productivity and customer experience.
|
Packaging Distribution |
2025 |
2024 |
2025 |
|
£000 |
£000 |
Change |
|
|
Revenue |
229,150 |
228,763 |
- |
|
Cost of sales |
(148,372) |
(143,890) |
3% |
|
|
|
||
|
Gross margin |
80,778 |
84,873 |
(5%) |
|
Operating expenses |
(69,405) |
(64,715) |
7% |
|
|
|
||
|
Adjusted operating profit 2 |
11,373 |
20,158 |
(44%) |
|
Amortisation |
(2,803) |
(3,082) |
|
|
Deferred contingent consideration |
(128) |
255 |
|
|
IAS19 past service cost |
(1,764) |
- |
|
|
|
|
||
|
Operating profit |
6,678 |
17,331 |
(61%) |
|
|
|
2 See above for reconciliation of Alternative Performance Measures to Statutory Measures.
The main features of Packaging Distribution's performance in 2025 were:
· Organic revenue marginally ahead of 2024, despite weak customer demand across most sectors, more tactical buying behaviour from customers and the impact of the EPR legislation on our retail customers.
· New business, at £11.9m, 20% lower than 2024 despite a strong pipeline, reflecting delays in customer decision-making.
· A reduction in gross margin to 35.3% from elevated levels in 2024 of 37.1% due to competitive pressure on selling prices and one of the Group's second-tier suppliers going into administration.
· Adjusted operating expenses at 30.3% of revenue (2024: 28.3%) due to investment in the quality of our sales team, launch of the new website, the well-documented increases in National Insurance and National Minimum Wage, additional property costs relating to higher-than-expected rent increases and excess costs associated with the East Midlands consolidation completed in H2 2025.
· Reduction in adjusted operating profit as a percentage of revenue to 5.0% (2024: 8.8%).
BUSINESS REVIEW
Future
The priorities for Packaging Distribution in 2026 are focused on growing revenue and improving profitability through the actions set out below:
· Reduce operating costs through efficiency programmes in sales, logistics and administration.
· Accelerate and convert new business momentum in industrial sectors where we can most effectively implement the benefits of our leading sales tools, processes, World Class Sales training and the recent sales recruitment programme.
· Refine our sourcing model to reduce input pricing.
· Realise the benefits of the new distribution centre in the East Midlands.
· Accelerate the progress we have made in Europe through our "Follow the Customer" programme.
· Support our customers to manage the impact of Extended Producer Responsibility legislation and reduce their carbon footprint through offering more sustainable packaging solutions.
· Strengthen our key supplier relationships, both nationally and locally.
· Develop both sales and cost synergies through the relationship with our Manufacturing Operations.
· Achieve benefits from information technology investments and our relaunched web-based solutions offer to provide customers with more effective online access to our full range of products and services.
· Continue to develop a pipeline of high-quality acquisitions in the UK and Europe to be well-positioned to recommence acquisitions from 2027 onwards.
· Maintain our focus on working capital management to facilitate future investment and manage effectively the ongoing risk within the current weak economic environment.
Manufacturing Operations comprises our 11 Macfarlane Packaging Design and Manufacture business units which are focused on the design, manufacture and assembly of bespoke protective packaging solutions for customers requiring cost-effective methods of protecting high value products in storage and transit.
The main materials we use are corrugate, timber and foam and we also design specialist cases. The businesses supply both directly to customers and through the national RDC network of the Packaging Distribution business.
Key market sectors are aerospace, space, defence, medical equipment, electronics, automotive, e-commerce retail, household equipment and food and drink. The markets we serve are highly fragmented, with a range of locally based competitors. We differentiate our market offering through technical expertise, design capability, industry accreditations and national coverage through the Packaging Distribution business.
BUSINESS REVIEW
|
Manufacturing Operations |
Excluding Pitreavie 2025 |
Pitreavie 2025 |
Manufacturing Operations 2025 |
2024 |
2025 |
|
£000 |
£000 |
£000 |
£000 |
Change |
|
|
Revenue |
53,308 |
25,164 |
78,472 |
47,458 |
65% |
|
Inter-segment revenue |
(5,277) |
(1,535) |
(6,812) |
(5,784) |
18% |
|
|
|
|
|
||
|
External revenue |
48,031 |
23,629 |
71,660 |
41,674 |
72% |
|
Cost of sales |
(24,671) |
(15,596) |
(40,267) |
(21,175) |
90% |
|
|
|
|
|
||
|
Gross margin |
23,360 |
8,033 |
31,393 |
20,499 |
53% |
|
Operating expenses |
(14,890) |
(8,187) |
(23,077) |
(13,255) |
74% |
|
|
|
|
|
||
|
Adjusted operating profit 1 |
8,470 |
(154) |
8,316 |
7,244 |
15% |
|
Amortisation |
(1,775) |
(593) |
(2,368) |
(1,528) |
|
|
Deferred contingent consideration |
- |
1,660 |
1,660 |
550 |
|
|
Goodwill impairment |
- |
(1,625) |
(1,625) |
||
|
IAS19 past service cost |
(166) |
- |
(166) |
- |
|
|
|
|
|
|
||
|
Operating profit |
6,529 |
(712) |
5,817 |
6,266 |
(7%) |
|
|
|
|
|
1 See above for reconciliation of Alternative Performance Measures to Statutory Measures.
The main features of Manufacturing Operations performance in 2025 were:
· An improvement in adjusted operating profit of £1.2m, excluding Pitreavie, due to:
· An increase in revenue of £5.8m, £4.5m from Polyformes acquired in 2024 and £1.3m organic growth.
· Improvement in gross margin to 43.8% (2024: 43.2%).
· Higher operating expenses, due to the impact of the Polyformes acquisition and inflation in employee costs, primarily National Insurance and National Minimum Wage.
· An increase in adjusted operating profit of 16.9% and improvement in adjusted operating profit as a percentage of revenue to 15.9% (2024: 15.3%).
· An adjusted operating loss of £0.2m from Pitreavie due to:
· The impact of weaker demand from customers and resultant pressure on gross margins.
· The tragic incident in October 2025 which has resulted in one-off costs of £0.4m and a material reduction in gross margin due to the outsourcing of manufacturing to third party suppliers.
The priorities for Manufacturing Operations in 2026 are to:
· Install and commission new equipment at Pitreavie in Q2 2026 with £1.2m of committed investment to restore the business to full operational capacity and accelerate the recovery back to profit.
· Continue strengthening the relationship with our Packaging Distribution businesses to create both sales and cost synergies.
· Increase momentum of new business growth in target sectors, e.g., medical, defence, aerospace and space.
· Work with our customers to effectively manage raw material price changes.
· Achieve both sales and cost synergies through closer working with the acquired businesses.
BUSINESS REVIEW
RISKS AND UNCERTAINTIES
The principal risks and uncertainties faced by the Group and the factors mitigating these risks are detailed below. These risks are addressed within an overall governance framework including clear and delegated authorities, business performance monitoring and appropriate insurance cover for a wide range of potential risks. There is a dependence on good quality local management, which is supported by an investment in training and development and ongoing performance evaluation.
Risks are identified and assessed through a range of "top down" and "bottom up" analyses that are updated on a regular basis. This in turn provides the basis for making informed risk-based decisions regarding the scope and focus of assurance work, as described in the report of the Audit Committee in the Annual Report 2025. Details on how the Group is managing the Provision 29 requirements of the Corporate Governance Code 2024 and the associated Directors' declaration on risk management and internal control, which come into effect from 1 January 2026, and how they relate to the Principal Risks and Uncertainties are set out in the report of the Audit Committee in the Annual Report 2025. In addition to scheduled updates from Finance, Health and Safety, IT, Sales, Procurement, Sustainability and other business functions, the Board and Audit Committee may seek assurance work in other areas relevant to the Principal Risks and Uncertainties from time to time, either from internal sources or through externally commissioned work.
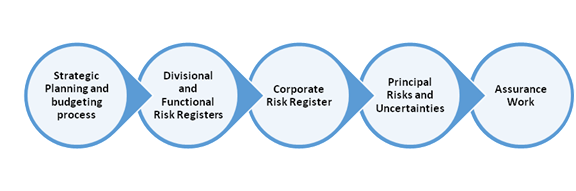
We continue to evolve our risk management processes to ensure they are robust, effective, and integrated within our decision-making and governance and internal control processes. We have included a brief description of how we assess that each risk level has changed in the last year. For risks shown as [ç è] the risk level is broadly similar between 2024 and 2025. If the risk is shown as [é ê] the risk level has increased or decreased respectively during 2025 and is being addressed accordingly through mitigating actions by management.
We recognise the need to constantly review the risks and uncertainties faced by the Group and ensure that any emerging risks are being identified and actions being taken to mitigate them as appropriate. The Group's risk in relation to health and safety has been elevated from a key divisional risk to a key corporate risk following the fatal incident at Pitreavie during 2025.
|
Risk Description |
Mitigating Factors |
Change in Risk Level |
|
Uncertain economic environment Given the range of prolonged geopolitical and economic uncertainties within the UK and other markets, there is an ongoing risk this will adversely affect our ability to deliver upon agreed strategic initiatives. We may also need to adapt our business quickly to limit the impact upon the Group's results, prospects and reputation. This risk is monitored through regular review of trading forecasts and market conditions, considered at executive management and Board level. |
· To mitigate this risk, executive management monitors monthly revenue and cost performance and market trends closely and has action plans to respond to any significant or prolonged trading pressures. · We have a strong customer proposition that enables us to provide them with more effective cost saving support during uncertain economic times. The benefit of our 'stock-and-serve' model is also important for customers as it aids their effective management of working capital. · In the event of a significant and sustained reduction in customer demand the Group would take rigorous actions to reduce operating costs and working capital investment. · The Group has scope to curtail capital expenditure and acquisition investment, reduce dividends and pause/suspend share buybacks to preserve cash, if required. · Mitigating factors set out in the financial liquidity, debt covenants and interest rates risk set out below also apply to the uncertain economic environment risk. |
Increase é · Although inflationary pressures are softening, the UK and EU economies have continued to experience challenging economic conditions during 2025, and the Group has experienced weakened demand for its products across many of the markets in which it operates. · The Group has experienced challenges in the Distribution business where management is responding through control of operating costs, effective management of input prices, investment in quality sales resource to accelerate new business performance and a focus on stable and growing industrial markets. · Our cost base can be flexed subject to demand however we will continue to target reductions in fixed costs during 2026 to improve this flexibility. · The Group has secured an extension to its £40m banking facility for one year to November 2028. |
|
Risk Description |
Mitigating Factors |
Change in Risk Level |
|
Impact of environmental changes The markets we operate in are changing, with: · customers increasingly aware of the environmental impact of their packaging; · environmental regulatory requirements for packaging suppliers, such as the Plastic Tax introduced in 2022 and the introduction of the Extended Producer Responsibility ("EPR") levy during 2025; · possibility of disruption to the operations of the Group through extreme weather events such as flooding, storm damage and water stress, impacting the business directly and disrupting supply chains; · investors looking to invest in companies that demonstrate strong environmental credentials; and · UK Government's commitment to net zero carbon emissions by 2050 and the profound changes that are likely to drive across the economy. If the Group is not proactive and transparent in how it is responding to this agenda, this could lead to a loss of employees, customers and investors. Additionally, there is a transition risk, i.e. that we do not progress our strategy at the right pace, or we take actions that prove to be incorrect as technology advances and markets transition. The Executive interact with investors twice per annum giving them the opportunity to assess the Group's progress against their expectations. The key measure the Group monitors is Scope 1, Scope 2 and Scope 3 CO2 emissions. |
· Sustainability is central to our value proposition, utilising our resource, expertise and business assets to support customers to use less and better-performing packaging and provide more sustainable alternatives through our Significant Six selling proposition and customer engagement through our Innovation Labs. · The Group has a sustainability strategy setting out the key priorities that are most relevant to the business and which will be key to mitigating both the transition and physical risks in this area, as set out in the Sustainability Report in the Annual Report 2025. · The Group has a Head of Sustainability who chairs the Environment, Social and Governance ("ESG") committee consisting of senior leaders from across the Group. · Regular reviews of our sustainability strategy are carried out at Board level to challenge performance against key milestones, as well as to ensure that priorities are aligned with stakeholder objectives. This is overseen via Key Performance Indicators and regular reporting from the Head of Sustainability to the Executive on progress against our priorities. · The ESG committee oversees progress against the strategy and the associated targets, addressing challenges proactively. The committee reports directly to the Board. · Compliance readiness for EPR and other regulations is supported by a dedicated working group; · Progress is monitored through Scope 1, 2 and 3 emissions reporting and TCFD-aligned disclosures. |
No change ç è · The Group recognises the significance of our environmental obligations and has continued to make progress, including: · extending the introduction of fully electric trucks to our fleet to 10 in 2025 (2024: 9); · appointing a Supply Chain Compliance Manager to support growing compliance demands and to support data quality improvement across the Group; · utilising the Innovation Labs to support customers in meeting their specific sustainability requirements and providing educational seminars focused on key environmental issues, including new regulations such as EPR; · ongoing actions to support our customers to reduce their CO2 emissions, including using our 'Packaging Optimiser' tool; · the Group's Head of Sustainability leading on the impact of environmental regulatory change, focusing on preparing the business for compliance with the UK's EPR regulations and building the Group's capability to support customers. See the detailed Sustainability Report in the Annual Report 2025. |
|
Risk Description |
Mitigating Factors |
Change in Risk Level |
|
Strategic changes in the market Failure to respond to strategic shifts in the market, including the impact of weaknesses in the economy as well as disruptive behaviour from competitors, changing customer needs (e.g. changing customer priorities between online and physical buying) and the increasing regulatory interventions targeted at improving sustainability could limit the Group's ability to continue to grow revenues or potentially contribute to a failure to meet market expectations. Emerging trends such as automation, AI-driven solutions and returnable packaging also present challenges and opportunities that require timely adaption. We monitor this through Net Promoter Score, an annual customer satisfaction survey and regular interaction with customers including at our Innovation Labs. In addition, the Board monitors strategic market developments including significant regulatory changes. Strategic changes in the market related to sustainability are covered above. |
· The Group maintains a well-diversified customer base, providing resilience against changes in specific industry sectors, as well as a flexible business model with a strong value proposition to meet the changing needs of customers. · The Group strives to maintain high service levels for customers ensuring that customer needs are met. While enhancing its service offering and range of products, the Group continues to invest in design, testing and information technology. These tools are intended to strengthen our business model by supporting customer service teams in managing the complex and changing needs of customers and to respond to the increasingly competitive and dynamic operating environment. · The Group maintains strong partnerships with key suppliers to ensure that a broad range of products is available to respond to customers' requirements, including any changes in their environmental and sustainability priorities. Maintaining close relationships with key suppliers in the protective packaging market enables us to understand and evaluate key trends and adapt our business model accordingly |
No change ç è · Group businesses, particularly Distribution, have continued to be impacted by weak demand for packaging in a number of key markets. Competitive pressures have intensified during 2025, including from corrugate manufacturers entering the distribution space as well as increasing benchmarking activity from major customers. · Regulatory interventions such as the Plastic Tax and Extended Producer Responsibility (EPR) have added complexity to the trading environment. · During 2026, the Group expects to grow revenues with a strong new business pipeline supported by investment in new UK National and European sales resource, World Class Sales training and continued development of our sales tools which demonstrate our value proposition. · The Group will also focus on strong cost control and continue the effective management of changes in input prices. · The Group is responding to strategic changes in the market through: · developing supply chain security as we continue to see consolidation in our supply base. This includes identifying new suppliers, strategic partnerships and increasing the level of in-house sourcing. · refining our acquisition pipeline to support future growth opportunities; · continued focus on our 'Follow the Customer' programme in Europe; and · the continued development of our website to drive growth in our online offering. |
|
Risk Description |
Mitigating Factors |
Change in Risk Level |
|
Supply Chain The Group's businesses are impacted by disruption to our supply chains as well as inflationary pressures. In particular, changes to commodity-based raw material prices, manufacturer energy costs, foreign exchange movements as well as increased bureaucracy, freight and tariff costs related to imports lead to increases to supplier input pricing and the potential for erosion of profitability within the Group's businesses, if we are unable to pass these onto customers. This risk is monitored through our procurement teams interacting with key suppliers and management regularly reviewing the effectiveness of our price change programmes by monitoring gross margins by customer. |
· The Group works closely with its supplier and customer base to effectively manage the scale and timing of price changes and any resultant impact on profit. Our IT systems monitor and measure effectiveness in these changes. · Where possible, alternative supplier relationships are maintained to minimise supplier dependency. · We continue to benchmark our supplier base to ensure we have a broad view across the packaging sector. · We work with customers to redesign packs and reduce packing cost to mitigate the impact of cost increases, including switching to alternative products to minimise the impact of packaging regulation including the Plastics Tax and EPR legislation. · The Group has a well-established supplier relationship management process which is subject to periodic management review and internal audit. |
No change ç è · Group businesses have been impacted by a sustained period of inflation. This has led to numerous commodity-based raw material price increases and additional manufacturer uplifts related to fuel/energy and other inflationary pressures. · However, the strength of our gross margin performance demonstrates the effectiveness of our price management disciplines. · Future pricing trends remain uncertain due to the general weak market demand. · There has been significant consolidation and change in ownership/leadership within the supply chain in 2025. We expect the effects of this to continue to be felt in 2026. To address this we are prioritising the identification of new suppliers, strengthen relationships with our key strategic suppliers as well as developing our in-house capabilities. · We continue to support our customers on Total Cost Management as the method to add value/reduce costs. |
|
Risk Description |
Mitigating Factors |
Change in Risk Level |
|
Health and safety The business is exposed to significant health and safety risks across its manufacturing and distribution operations. A recent fatality at Pitreavie's corrugate manufacturing site has highlighted the critical importance of reinforcing safety culture and operational controls. As people are our most valuable resource, failure to protect their health, safety, and wellbeing could lead to severe human, legal, financial, and reputational consequences. The Group has zero tolerance for health and safety breaches and is committed to achieving industry-leading standards to protect its people. |
· Health and safety induction undertaken for all new employees, agency workers and contractors. · Health and safety audit plan ensures all sites are assessed cyclically, or in the event of a specific risk arising. · Health and safety risk reporting system in place - which includes the reporting and review requirements for incidents, near misses and other safety related observations. · Investigation and review procedures are in place. · Onsite reviews conducted regularly by senior managers with monthly inspections that are documented. · During 2026, two key initiatives are planned to add to our existing mitigations. Firstly, we plan to replace our health and safety reporting system to improve the visibility of hazards and to strengthen the proactive identification of risk. Secondly, we plan to embed a new Maintenance Management system to track all statutory and planned preventative maintenance across our machinery and equipment. |
Increase é The fatal incident at our Pitreavie site has underlined that the risk to the business from health and safety remains significant. The Group has established mitigating factors - including comprehensive training, structured inductions, machinery guarding, risk assessments and safe operating procedures. In addition, our operations are primarily people-led, making behavioural safety and cultural engagement essential to risk reduction. We continue to cooperate fully in relation to the ongoing investigation into the fatality at Pitreavie. We continue to integrate human factors into all aspects of our processes, while continuing to engineer out hazards wherever possible to reduce risk. A full post incident review of all manufacturing machinery operating across the Group was undertaken and action taken to reduce potential risks identified. |
|
Risk Description |
Mitigating Factors |
Change in Risk Level |
|
Cyber security The increasing frequency and sophistication of cyber attacks is a risk which potentially threatens the confidentiality, integrity and availability of the Group's data and IT systems. These attacks could also cause reputational damage and fines in the event of personal data being compromised. This risk is monitored through an ongoing program of compliance and controls auditing with input from external advisors. |
· The Group continually invests in its IT infrastructure to protect against cyber security threats. This includes regular testing of IT Disaster Recovery Plans. · We engage the services of a cyber security partner to perform penetration tests to assess potential vulnerabilities within our security arrangements. · This is complemented by a program of cyber security awareness training to ensure that all staff are aware of the potential threats caused by deliberate and unauthorised attempts to gain access to our systems and data. |
No change ç è · With increasing geo-political uncertainties, the frequency and sophistication of cyber attacks is anticipated to continue to evolve, and the Group is committed to continually investing in upgrading its infrastructure to respond to the changing threats. · The Group continues to invest in prevention/detection software and education programmes to mitigate the risks of cyber security attacks. · The Group was awarded Cyber Essentials Plus by the National Security Centre during 2025, which builds on our Cyber Essentials award during 2024 This demonstrates the Group's commitment to continuous improvement. · The Group continues to perform regular assessments of its cyber security resilience and make changes to our defences. |
|
Risk Description |
Mitigating Factors |
Change in Risk Level |
|
Acquisitions The Group's growth strategy has included a number of acquisitions in recent years. There is a risk that such acquisitions may not be available on acceptable terms in the future. It is possible that acquisitions will not be successful due to the loss of key people or customers following acquisition or acquired businesses not performing at the level expected. This could potentially lead to impairment of the carrying value of the related goodwill and other intangible assets. Execution risks around the failure to successfully integrate acquisitions following conclusion of the earn-out period also exist. This is monitored through regular reporting of acquisition prospects and post-acquisition performance by executive management, with reporting to the Board. |
· The Group carefully reviews potential acquisition targets, ensuring that the focus is on high-quality businesses which complement the Group's existing profile and provide good opportunities for growth. · Having completed a number of acquisitions in recent years, the Group has well-established due diligence and integration processes and procedures. · The Group strengthened its European management team with the appointment of a Managing Director in January 2025, with significant experience running European operations and successfully executing acquisitions. · The Group's management information system enables effective monitoring of post-acquisition performance, with earn-out mechanisms also mitigating risk in the post-acquisition period. · Goodwill and other intangible assets are tested annually for impairment. |
No change ç è · The Group has made 21 acquisitions since 2014, including two in 2024 as well as concluding the Pitreavie acquisition in January 2025. · Pitreavie has performed well below expectations with strong actions in place to recover profits back to the levels expected when the business was acquired. · The Group will continue to develop strong pipeline of potential protective packaging acquisition opportunities in both the UK and Northern Europe. However, the focus in 2026 will be on the recovery of the Pitreavie business. · European acquisitions are inherently higher risk due to the potential effects of cultural differences, challenges in realising operational synergies and having less depth in local management and support compared to UK-based acquisitions. However, there are also important strategic opportunities for the Group in terms of extending service coverage with our organic "Follow the Customer" programme as well as other integration synergies. · Our bank funding arrangements provide flexibility for the potential funding of future acquisitions alongside debt and shareholder funding options. |
|
Risk Description |
Mitigating Factors |
Change in Risk Level |
|
Property The Group has a property portfolio comprising 1 owned site, 1 long leasehold and 55 short leasehold sites. This multi-site portfolio gives rise to risks in relation to ongoing lease costs, dilapidations, and fluctuations in value. There is a risk that properties aligned with the strategy and business needs of the Group may not be available both from a timing and commercial perspective. This risk is monitored on a regular basis and reported to the Board through internal reporting and input from external advisors. |
· The Group adopts a proactive approach to managing property costs and exposures. · Where a site is non-operational the Group seeks to assign, sell or sub-lease the building to mitigate the financial impact. · If this is not possible, rental voids are provided on vacant properties taking into consideration the likely period of vacancy and incentives to re-let. · The Group engages with external property advisers to assess the level of provisioning required for dilapidations and negotiate to minimise the final costs. |
Increase é · Our property consolidation strategy has continued during 2025. There is no outstanding work on finalising exit costs following the expiry of leases. Provisions have been established to cover all known and anticipated exit costs. · The Group currently has no vacant or sub-let properties. · The Group is managing its exposure to dilapidations and similar property costs. However, the risk to the Group's future strategy and performance in relation to property matters is increasing. The availability of suitable properties of the size and quality that the Group requires is becoming increasingly challenging. · In addition, rent reviews on existing properties have ranged from 8% to 61% during 2025, resulting in increases to operating costs. Additionally, local authorities are continuing to recover funds through substantial rates increases. These are particularly difficult to forecast and quoted increases are approximately 20%. |
|
Risk Description |
Mitigating Factors |
Change in Risk Level |
|
Financial liquidity, debt covenants and interest rates The Group needs access to funding to meet its trading obligations, to support organic growth and execute acquisitions. There is a risk that the Group may be unable to obtain funds and that such funds will only be available on unfavourable terms. The Group's borrowing facility comprises a committed facility of £40m. This includes requirements to comply with specified covenants, with a breach potentially resulting in Group borrowings being subject to more onerous conditions and the potential for immediate repayment of outstanding loans. The Group regularly monitors net bank debt and forecast cash flows to ensure that it will be able to meet its financial obligations as they fall due. |
· The Group's borrowing facility comprises a committed facility of £40m plus an additional 'accordion' facility of £20m if required, available until November 2028 with an option to extend a further year, which finances our trading requirements and supports controlled expansion, providing a medium-term funding platform for growth. The Pitreavie business also has a £3.25m invoice discounting facility renewed annually. · A twice yearly viability assessment and sensitivity analyses is performed by management. · Compliance with covenants is monitored on a monthly basis and sensitivity analysis is applied to forecasts to assess the impact on covenant compliance. · The Board reviews the Group's capital allocation strategy and policy on a regular basis. |
No change ç è · The Group continued to generate strong operating cash flows in 2025, which were invested in replacement and value-adding capital expenditure, earnings accretive acquisitions, dividends to shareholders and a share buyback programme with the Group operating well within its bank facilities throughout the year. · The £40m banking facility plus additional £20m if required, was extended one year during 2025 to November 2028. This facility combined with the conservative management of cash means the risk of not having available funds or breaching covenants is relatively low. · The main risk to the availability and cost of funding is maintaining a strong and consistent rolling 12-month EBITDA and continuing to effectively manage working capital. · As at 31 December 2025 the rolling 12-month EBITDA was £19.9m, with net borrowings of £16.2m (gross borrowing £30.5m being £28.0m drawn down on the £40m Group facility and £2.5m on the £3.25m Pitreavie facility) and therefore operating well within the available facilities and covenant requirements. · Interest rates payable by the Group have reduced in 2025 but are expected to remain high for some time. |
|
Risk Description |
Mitigating Factors |
Change in Risk Level |
|
Working capital The Group has a significant investment in working capital in the form of trade receivables and inventories. There is a risk that this investment is not fully recovered. This risk is monitored through detailed reporting to local and executive management, which is reviewed in summary form by the Board. |
· Inventory levels and order patterns are regularly reviewed and risks arising from holding bespoke stocks are managed by obtaining contract or order cover from customers. · Customers who operate in sectors that are likely be significantly impacted by the current economic challenges, particularly those exposed to reduced consumer demand and increases in operating costs, are closely monitored. Where necessary, actions are taken to reduce our exposure to potential bad debts or stock write-offs. · Credit risk is controlled by applying rigour to the management of trade receivables by the Head of Credit Control and the credit control team and is subject to additional scrutiny from the Group Finance Director and Group Financial Controller in line with the Group's credit risk process. · All aged debts are assessed using the Expected Credit Loss model, and appropriate provisions are made. |
No change ç è · Although the risk level is broadly similar to 2024, this remains a high risk given the high level of bespoke customer solutions we provide as well as the varied customers and industries we service, given the ongoing challenging UK economic trading environment. · Excluding the impact of the Pitreavie acquisition, aged stock over 6 months old has decreased in 2025. The Group is continually working to reduce stock over 6 months and has adequate provisioning to cover any potential stock obsolescence. · Bad debt write-offs in 2025 were below 2024 and remain at a relatively low level. The Expected Credit Loss allowance reflects the low level of historic bad debts in the Group. · The economic environment is expected to remain challenging in 2026. Management will continue to take all appropriate steps to mitigate this risk and limit the need for additional provisions or write-offs. |
|
Risk Description |
Mitigating Factors |
Change in Risk Level |
|
Defined benefit pension scheme The Group's defined benefit pension scheme is sensitive to a number of key factors including volatility in bond/gilt markets, the discount rates and inflation assumptions used to calculate the scheme's liabilities. Small changes in these assumptions could cause significant movements in the pension surplus. This risk is monitored through regular input from external pension advisors, including six monthly IAS19 reviews and triennial actuarial valuations. There is potential for increased defined benefit obligations as a result of the Virgin Media case although this is now expected to be mitigated by pending legislation. This is monitored through specific interaction with external advisors. Given the well-funded position of the Scheme the associated risks have reduced significantly. However, given the complexity and age of the Scheme there remains some likelihood of unknown events that could result in a reassessment of the Scheme's defined benefit obligations (particularly as the Scheme is being prepared for a possible buy-in as a precursor to buy-out) when the Scheme's liabilities are audited and adjusted, if the basis of any previous estimations are reassessed. The revision of estimated obligations due to historic equalisation is an example of such reassessment. |
· The scheme was closed to new members in 2002. Benefits for active members were amended by freezing pensionable salaries at April 2009 levels. The scheme was closed to future accrual during 2022. · A Pension Increase Exchange option is available to offer flexibility to new pensioners in both the level of pension at retirement and the rate of future increases. · The investment profile is regularly reviewed to ensure continued matching of investments with the scheme's liability profile. · The scheme invests in Liability Driven Investments ("LDI") which hedge the scheme against movements in the discount rate and inflation. These are leveraged instruments which require active investments and divestments to maintain the level of leverage. · The Group uses external advisers to provide guidance and support, where required. · Based on legal opinion provided, the Group has an unconditional right to a refund of surplus assets assuming the full settlement of plan liabilities in the event of a wind up of the Scheme. Furthermore, in the ordinary course of business the trustees have no rights to unilaterally wind up the Scheme, or otherwise augment the benefits due to members of the Scheme. Based on these rights, any net surplus in the Scheme is recognised in full. |
No change ç è · The IAS 19 valuation of the Group's defined benefit pension scheme as at 31 December 2025 estimated the scheme surplus to be £6.0m, compared to a surplus of £9.6m at 31 December 2024 due primarily to a non-recurring cost for historic equalisation in 2025. · The triennial actuarial valuation at 1 May 2023 was completed in February 2024. Due to the positive funding position of the scheme, there is no requirement for the Group to make further deficit repair contributions. · The Group is working with trustees to prepare the scheme for a possible buy-in. As part of this process, a revision of estimated obligations due to historic equalisation has been charged as a non-recurring cost in 2025. · Approval will be required from the Group's Board before a decision to proceed with a possible buy-in. The decision at that time will be based on any requirement for: · Additional cash contributions which will be dependent largely on market pricing. · Indemnities required to cover any uncertainties. |
There are a number of other risks that we manage which are not considered key risks. These are mitigated in ways common to all businesses and not specific to Macfarlane Group.
BUSINESS REVIEW
Viability statement
The Board is required to formally assess that the Group has adequate resources to continue in operational existence for the foreseeable future and as such can continue to adopt the going concern basis of accounting. The Board is also required to state that it has a reasonable expectation that the Group will continue in operation and meet its longer-term liabilities as they fall due.
To support this statement, the Board is required to consider the Group's current financial position, its strategy, the market outlook and its principal risks. The Board's assessment of the principal risks facing the Group and how these risks affect the Group's prospects are set out on pages 28 to 39. The review also includes consideration of how these risks could prevent the Group from achieving its strategic plan and the potential impact these risks could have on the Group's business model, future performance, solvency, and liquidity over the next three years (starting from 1 January 2026).
The Board considers the Group's viability as part of its ongoing programme to manage risk. Each year the Board reviews the Group's strategic plan for the forthcoming three-year period and challenges the Executive team on the plan's risks. The plan reflects the Group's businesses, which have a broad spread of customers across a range of different sectors. The assessment period of three years is consistent with the Board's review of the Group strategy, including assumptions around future growth rates for our business and acceptable levels of performance.
Financial modelling and scenarios
The Group's existing bank facilities comprise a £40m committed facility with Bank of Scotland PLC and HSBC UK Bank plc, which is available until November 2028 with an option to extend to November 2029. The Group has experienced challenging market conditions and been impacted by the Pitreavie incident, resulting in a marked reduction in profit during 2025, notably in the Distribution and Pitreavie businesses. The profit expectations for 2026 to 2028 have been reset, based on the lower 2025 profit and reflecting gradual improvement in the Distribution business, a return to profitability in the Pitreavie business and stability in the balance of Manufacturing Operations. The Directors have also considered the longer-term economic outlook for the UK. Given the current uncertainty of the economic outlook we have modelled a 'severe but plausible downside' scenario as described below. In forming conclusions, the Directors have also considered potential mitigating actions that the Group could take to preserve liquidity and ensure compliance with its financial covenants.
A detailed financial model covering a three-year period is maintained and regularly updated. This model enables sensitivity analysis, which includes flexing the main assumptions, including future revenue growth, gross margins, operating costs, finance costs, working capital management and relevant contingent liabilities. The results of flexing these assumptions, both individually and in aggregate, are used to determine whether additional bank facilities will be required during the three-year period and whether the Group will remain in compliance with the covenants relating to the current facility. Whilst the current facilities are committed until November 2028 we have assumed the Group will take up the option to extend the existing facility for a further year which will be on the same terms currently in place.
We have modelled a range of scenarios, including a base case, a downside scenario, a severe but plausible downside and a reverse stress test, over the three-year horizon. The 'severe but plausible downside' scenario is conservative in assuming, compared to the base case, revenue reductions of 5% and gross margin reductions at the rate of 2% in each of the three years, with no reduction in operating expenses. In this scenario, the Group's management would take reasonable mitigating actions to reduce operating expenses in isolation by c 2.2% or c 1.5% in combination with a 25% curtailment of capital allocated to capital expenditure and dividends to remain in compliance with all financial covenants throughout the three-year period and not require any additional sources of financing.
The Group has also modelled a reverse stress test scenario. This models the decline in revenue that the Group would be able to absorb before breaching any financial covenants. Such a scenario, and the sequence of events that could lead to it, is considered to be unlikely, as it requires revenue reductions of c 8% (a 60% additional decrease to the 'severe but plausible downside' scenario of a 5% reduction in revenue), compared to the base case, before there is a breach in financial covenants in the period under review and is calculated before reflecting any mitigating actions.
BUSINESS REVIEW
Viability statement
Conclusions
Even in the severe but plausible scenario, Macfarlane Group is forecast to have sufficient liquidity to continue trading, comfortably meeting its financial covenants and operating within the level of its facilities for the foreseeable future. However, in this scenario, management would also be able to take significant mitigating actions to reduce its costs and conserve cash.
For this reason, the Board considers it appropriate for the Group to adopt the going concern basis in preparing its financial statements.
The Board also has a reasonable expectation that the Group will continue in operation and meet its longer-term liabilities as they fall due.
Cautionary Statement
The Chair's Statement and the Business Review set out above have been prepared to provide additional information to members of the Company to assess the Group's strategy and the potential for the strategy to succeed. It should not be relied on by any other party or for any other purpose.
This report and the financial statements contain certain forward-looking statements relating to operations, performance and financial status. By their nature, such statements involve risk and uncertainty because they relate to events and depend upon circumstances that will occur in the future. There are a number of factors, including both economic and business risk factors, that could cause actual results or developments to differ materially from those expressed or implied by these forward-looking statements.
These statements are made by the Directors in good faith based on the information available to them up to the time of their approval of this report. Nothing in this Preliminary Announcement should be construed as a profit forecast or an invitation to deal in the securities of the Group.
Responsibility Statement of the Directors
The responsibility statement below has been prepared in connection with the Company's full annual report for the year ending 31 December 2025. Certain parts of the full Annual Report are not included within this announcement.
The Directors of Macfarlane Group PLC are
A. Gulvanessian Chair
P.D. Atkinson Chief Executive
I. Gray Finance Director
J.W.F. Baird Non-Executive Director and Senior Independent Director
D.L. Whyte Non-Executive Director
D.B. Stirling Non-Executive Director
To the best of the knowledge of the Directors (whose names and functions are set out above):
· The financial statements, prepared in accordance with UK adopted International Financial Reporting Standards, give a true and fair view of the assets, liabilities, financial position and profit for the Company and the undertakings included in the consolidation taken as a whole;
· The Strategic Report, incorporated into the Directors' Report in the Annual Report, includes a fair review of the development and performance of the business and the position of the Company and the undertakings included in the consolidation taken as a whole, together with a description of the principal risks and uncertainties that they face; and
· Pursuant to Disclosure and Transparency Rules, Chapter 4, the Directors consider that the Company's annual report and financial statements, taken as a whole, are fair, balanced and understandable and provide information necessary for the shareholders to assess the Company's and the Group's position and performance, business model and strategy.
Peter Atkinson Ivor Gray
Chief Executive Finance Director
26 February 2026 26 February 2026
Macfarlane Group PLC
Consolidated income statement
For the year ended 31 December 2025
|
Note |
2025 £000 |
2024 £000 |
|
|
Continuing operations |
|||
|
Revenue |
3 |
300,810 |
270,437 |
|
Cost of sales |
(188,639) |
(165,065) |
|
|
|
|
||
|
Gross profit |
112,171 |
105,372 |
|
|
Distribution costs |
(13,464) |
(11,165) |
|
|
Administrative expenses |
(86,212) |
(70,610) |
|
|
|
|
||
|
Operating profit |
3 |
12,495 |
23,597 |
|
Net finance costs |
4 |
(4,445) |
(2,701) |
|
|
|
||
|
Profit before tax |
8,050 |
20,896 |
|
|
Tax |
5 |
(1,734) |
(5,366) |
|
|
|
||
|
Profit for the year |
6,316 |
15,530 |
|
|
|
|
||
Earnings per share from continuing operations |
|||
|
Basic |
7 |
3.99p |
9.76p |
|
|
|
||
|
Diluted |
7 |
3.98p |
9.74p |
|
|
|
Consolidated statement of comprehensive income
For the year ended 31 December 2025
|
Note |
2025 £000 |
2024 £000 |
|
|
Items that may be reclassified to profit or loss |
|||
|
Foreign currency translation differences - foreign operations |
282 |
(150) |
|
|
Items that will not be reclassified to profit or loss |
|||
|
Remeasurement of pension scheme liability |
10 |
(1,943) |
(362) |
|
Tax recognised in other comprehensive income |
|||
|
Tax on remeasurement of pension scheme liability |
11 |
486 |
91 |
|
|
|
||
|
Other comprehensive expense for the year, net of tax |
(1,175) |
(421) |
|
|
Profit for the year |
6,316 |
15,530 |
|
|
|
|
||
|
Total comprehensive income for the year |
5,141 |
15,109 |
|
|
|
|
Macfarlane Group PLC
Consolidated statement of changes in equity
For the year ended 31 December 2024
|
Note |
Share Capital £000 |
Share Premium £000 |
Capital Redemption Reserve £000 |
Revaluation Reserve £000 |
Own Shares £000 |
Translation Reserve £000 |
Retained Earnings £000 |
Total £000 |
|
|
At 1 January 2024 |
39,738 |
13,981 |
- |
70 |
(16) |
171 |
60,632 |
114,576 |
|
|
Comprehensive income |
|||||||||
|
Profit for the year |
- |
- |
- |
- |
- |
- |
15,530 |
15,530 |
|
|
Foreign currency translation differences on overseas subsidiaries |
- |
- |
- |
- |
- |
(150) |
- |
(150) |
|
|
Remeasurement of pension scheme surplus |
10 |
- |
- |
- |
- |
- |
- |
(362) |
(362) |
|
Tax on remeasurement of pension scheme surplus |
11 |
- |
- |
- |
- |
- |
- |
91 |
91 |
|
Total comprehensive income |
- |
- |
- |
- |
- |
(150) |
15,259 |
15,109 |
|
|
Transactions with shareholders |
|||||||||
|
Dividends |
6 |
- |
- |
- |
- |
- |
- |
(5,750) |
(5,750) |
|
New shares issued |
162 |
515 |
- |
- |
(21) |
- |
(656) |
- |
|
|
Purchase of own shares |
- |
- |
- |
- |
(392) |
- |
- |
(392) |
|
|
Share-based payments |
- |
- |
- |
- |
- |
- |
(270) |
(270) |
|
|
Total transactions with shareholders |
162 |
515 |
- |
- |
(413) |
- |
(6,676) |
(6,412) |
|
|
At 31 December 2024 |
39,900 |
14,496 |
- |
70 |
(429) |
21 |
69,215 |
123,273 |
Macfarlane Group PLC
Consolidated statement of changes in equity
For the year ended 31 December 2025
|
Note |
Share Capital £000 |
Share Premium £000 |
Capital Redemption Reserve £000 |
Revaluation Reserve £000 |
Own Shares £000 |
Translation Reserve £000 |
Retained Earnings £000 |
Total £000 |
||||||||
|
At 31 December 2024 |
39,900 |
14,496 |
- |
70 |
(429) |
21 |
69,215 |
123,273 |
||||||||
|
Comprehensive income |
||||||||||||||||
|
Profit for the year |
- |
- |
- |
- |
- |
- |
6,316 |
6,316 |
||||||||
|
Foreign currency translation differences on overseas subsidiaries |
- |
- |
- |
- |
- |
282 |
- |
282 |
||||||||
|
Remeasurement of pension scheme surplus |
10 |
- |
- |
- |
- |
- |
- |
(1,943) |
(1,943) |
|||||||
|
Tax on remeasurement of pension scheme surplus |
11 |
- |
- |
- |
- |
- |
- |
486 |
486 |
|||||||
|
Total comprehensive income |
- |
- |
- |
- |
- |
282 |
4,859 |
5,141 |
||||||||
|
Transactions with shareholders |
||||||||||||||||
|
Dividends |
6 |
- |
- |
- |
- |
- |
- |
(5,822) |
(5,822) |
|||||||
|
Purchase of own shares |
(581) |
- |
581 |
- |
(47) |
- |
(2,083) |
(2,130) |
||||||||
|
Share-based payments |
- |
- |
- |
- |
116 |
- |
(16) |
100 |
||||||||
|
Total transactions with shareholders |
(581) |
- |
581 |
- |
69 |
- |
(7,921) |
(7,852) |
||||||||
|
At 31 December 2025 |
39,319 |
14,496 |
581 |
70 |
(360) |
303 |
66,153 |
120,562 |
||||||||
Macfarlane Group PLC
Consolidated balance sheet at 31 December 2025
|
Note |
2025 £000 |
2024 £000 |
|
|
Non-current assets |
|||
|
Goodwill and other intangible assets |
104,933 |
97,970 |
|
|
Property, plant and equipment |
14,945 |
10,607 |
|
|
Right of Use assets |
56,257 |
41,077 |
|
|
Other receivables |
35 |
35 |
|
|
Deferred tax assets |
11 |
276 |
145 |
|
Retirement benefit obligations |
10 |
6,036 |
9,636 |
|
|
|
||
|
Total non-current assets |
182,482 |
159,470 |
|
|
|
|
||
|
Current assets |
|||
|
Inventories |
21,234 |
19,049 |
|
|
Trade and other receivables |
58,193 |
55,015 |
|
|
Current tax asset |
1,502 |
469 |
|
|
Cash and cash equivalents |
9 |
14,383 |
12,928 |
|
|
|
||
|
Total current assets |
95,312 |
87,461 |
|
|
|
|
||
|
Total assets |
3 |
277,794 |
246,931 |
|
|
|
||
|
Current liabilities |
|||
|
Trade and other payables |
55,592 |
50,263 |
|
|
Provisions |
138 |
1,044 |
|
|
Current tax liability |
604 |
1,035 |
|
|
Lease liabilities |
9 |
9,904 |
7,223 |
|
Bank borrowings |
9 |
30,544 |
14,846 |
|
|
|
||
|
Total current liabilities |
96,782 |
74,411 |
|
|
|
|
||
|
Net current assets |
(1,470) |
13,050 |
|
|
|
|
||
|
Non-current liabilities |
|||
|
Deferred tax liabilities |
11 |
11,092 |
10,937 |
|
Deferred contingent consideration |
- |
2,330 |
|
|
Provisions |
441 |
327 |
|
|
Lease liabilities |
9 |
48,917 |
35,653 |
|
|
|
||
|
Total non-current liabilities |
60,450 |
49,247 |
|
|
|
|
||
|
Total liabilities |
3 |
157,232 |
123,658 |
|
|
|
||
|
Net assets |
120,562 |
123,273 |
|
|
|
|
||
|
Equity |
|||
|
Share capital |
12 |
39,319 |
39,900 |
|
Share premium |
12 |
14,496 |
14,496 |
|
Capital redemption reserve |
581 |
- |
|
|
Revaluation reserve |
70 |
70 |
|
|
Own shares |
(360) |
(429) |
|
|
Translation reserve |
303 |
21 |
|
|
Retained earnings |
66,153 |
69,215 |
|
|
|
|
||
|
Total equity |
3 |
120,562 |
123,273 |
|
|
|
Macfarlane Group PLC
Consolidated cash flow statement
For the year ended 31 December 2025
|
Note |
2025 £000 |
2024 £000 |
|
|
Profit before tax |
8,050 |
20,896 |
|
|
Adjustments for: |
|||
|
Amortisation of intangible assets |
5,238 |
4,610 |
|
|
Depreciation of property, plant and equipment and ROU assets |
12,831 |
10,757 |
|
|
Deferred contingent consideration adjustment |
(1,532) |
(805) |
|
|
Goodwill impairment |
1,625 |
- |
|
|
Loss on disposal of property, plant and equipment |
229 |
39 |
|
|
Share-based credit |
- |
(270) |
|
|
Net finance costs |
4,445 |
2,701 |
|
|
|
|
||
|
Operating cash flows before movements in working capital |
30,886 |
37,928 |
|
|
Increase in inventories |
(929) |
(646) |
|
|
Decrease in receivables |
1,297 |
1,883 |
|
|
Increase/(decrease) in payables |
1,345 |
(2,233) |
|
|
Decrease in provisions |
(980) |
(359) |
|
|
Other non-cash movements |
325 |
(150) |
|
|
Pension scheme administration costs and past service charge |
2,180 |
361 |
|
|
|
|
||
|
Cash generated by operations |
34,124 |
36,784 |
|
|
Deferred contingent consideration paid |
- |
(1,492) |
|
|
Income taxes paid |
(4,878) |
(6,773) |
|
|
Net finance costs paid |
(4,466) |
(3,091) |
|
|
|
|
||
|
Cash inflow from operating activities |
24,780 |
25,428 |
|
|
|
|
||
|
Investing activities |
|||
|
Acquisitions, net of cash acquired |
8 |
(12,897) |
(10,600) |
|
Proceeds on disposal of property, plant and equipment |
187 |
45 |
|
|
Purchase of software development |
(81) |
- |
|
|
Purchases of property, plant and equipment |
(4,573) |
(2,925) |
|
|
|
|
||
|
Cash outflow from investing activities |
(17,364) |
(13,480) |
|
|
|
|
||
|
Financing activities |
|||
|
Dividends paid |
6 |
(5,822) |
(5,750) |
|
Purchase of own shares |
(2,130) |
(392) |
|
|
Drawdown bank borrowings |
68,500 |
8,386 |
|
|
Repayment of bank borrowings |
(57,243) |
- |
|
|
Repayments of leases |
(9,266) |
(8,251) |
|
|
|
|
||
|
Cash outflow from financing activities |
(5,961) |
(6,007) |
|
|
|
|
||
|
Net increase in cash and cash equivalents |
1,455 |
5,941 |
|
|
Cash and cash equivalents at beginning of year |
12,928 |
6,987 |
|
|
|
|
||
|
Cash and cash equivalents at end of year |
14,383 |
12,928 |
|
|
|
|
Macfarlane Group PLC
Notes to the financial information
For the year ended 31 December 2025
1. General information
The financial information set out herein does not constitute the Company's statutory accounts as defined in Section 435 of the Companies Act 2006 and has been extracted from the full statutory accounts for the years ended 31 December 2025 and 2024.
The financial statements for 2025 were approved by the Board of Directors on 26 February 2026. The auditor's report on the statutory financial statements for the year ended 31 December 2025 was unqualified pursuant to Section 498 of the Companies Act 2006 and did not contain a statement under sub-section 498 (2) or (3) of that Act.
The financial information for 2024 is derived from the statutory accounts for 2024 which have been delivered to the registrar of companies. The auditor has reported on the 2024 accounts; their report was (i) unqualified, (ii) did not include a reference to any matters to which the auditor drew attention by way of emphasis without qualifying their report and (iii) did not contain a statement under section 498 (2) or (3) of the Companies Act 2006.
2. Basis of preparation
The Group's business activities, together with the factors likely to affect its future development, performance and financial position are set out above.
The Group's principal financial risks in the medium term relate to liquidity and credit risk. Liquidity risk is managed by ensuring that the Group's day-to-day working capital requirements are met by having access to committed banking facilities with suitable terms and conditions to accommodate the requirements of the Group's operations. Credit risk is managed by applying considerable rigour in managing the Group's trade receivables. The Directors believe that the Group is adequately placed to manage its financial risks effectively, despite any economic uncertainty.
The Group's has a committed borrowing facility of £40m with Bank of Scotland PLC and HSBC Bank UK plc in place until November 2028. The facility bears interest at normal commercial rates and carries standard financial covenants in relation to interest cover and leverage.
The Directors are of the opinion that the Group's cash forecasts and revenue projections, which they believe are based on appropriate market data and past experience taking account of reasonably possible changes in trading performance given current market and economic conditions, show that the Group should be able to operate within the current facility and comply with its banking covenants. The Directors have modelled a range of scenarios, including a base case, a downside scenario, a severe but plausible downside and a reverse stress test, over the three-year horizon, as set out in the Viability Statement above.
After making enquiries, the Directors have a reasonable expectation that the Company and the Group have adequate resources to continue in operational existence at least for the next twelve months. For this reason, they continue to adopt the going concern basis in preparing the financial statements for the year ended 31 December 2025.
Key sources of estimation uncertainty
The preparation of financial statements requires management to make estimates and assumptions that affect the amounts reported for assets and liabilities as at the balance sheet date and the amounts reported for revenues and expenses during the year. Due to the nature of estimation, the actual outcomes may well differ from these estimates. The Directors have assessed the impact of climate change and consider that this does not have a significant impact on these financial statements. The key sources of estimation uncertainty that have a significant effect on the carrying amounts of assets and liabilities in the next twelve months are discussed below:
Retirement benefit obligations
The determination of any defined benefit pension scheme liability is based on assumptions determined with independent actuarial advice. The key assumptions used include discount rate, inflation rate and mortality, for which a sensitivity analysis is provided in Note 10. The Directors consider that those sensitivities represent reasonable sensitivities which could occur in the next financial year.
Macfarlane Group PLC
Notes to the financial information
For the year ended 31 December 2025
2. Basis of preparation (continued)
Key sources of estimation uncertainty (continued)
Valuation of deferred contingent consideration
The valuation of deferred contingent consideration at both acquisition date and the balance sheet date is measured at fair value. This involves the assessment of forecast future cash flows against earn-out targets agreed with the sellers of acquired businesses over a period of up to two years. This assessment is based on the Directors' best estimate using the information available at the relevant dates. However, there remains a risk that the actual payment differs from the amount assumed as consideration within the PPA accounting as detailed in note 8 and from the amount recorded as a liability at the balance sheet date. Deferred contingent considerations are recognised as a liability in trade and other payables and are remeasured to fair value of £2.5m at the balance sheet date, all due within one year, based on a range of outcomes between £Nil and £3.6m. Trading in the post-acquisition period supports the remeasured value of £2.5m.
Goodwill impairment
The determination of the value in use of the Pitreavie CGU is based on assumptions that have inherent uncertainty. At 31 December 2025 the under performance of the business post-acquisition has resulted in an impairment charge of £1.6m against the carrying amount of goodwill of Pitreavie. The Directors have identified the following assumptions as key sources of uncertainty within the Pitreavie CGU.
|
Assumption |
Used at 31 December 2025 |
Sensitivity |
|
2026 revenue growth rate 1 |
11.3% |
Increase or decrease of 1% in the 2026 revenue growth rate would decrease or increase the impairment charge by £0.9m respectively |
|
2027 to 2030 revenue growth rate |
4.0% |
Increase or decrease of 1% in the 2027 to 2030 revenue growth rate would decrease or increase the impairment charge by £1.6m and £2.5m respectively |
|
Growth rate in perpetuity |
1.0% |
Increase or decrease of 1% in the growth in perpetuity would decrease or increase the impairment charge by £1.2m and £1.0m respectively |
|
WACC rate |
12.25% |
Increase in the WACC rate by 1% would increase the impairment charge by £1.4m |
1 The 2026 revenue growth of 11.3% reflects the recovery of the Pitreavie CGU post the incident (note 27) supported by £1.2m of investment in new equipment due to be installed and commissioned in Q1 2026.
Macfarlane Group PLC
Notes to the financial information
For the year ended 31 December 2025
2. Basis of preparation (continued)
Critical accounting judgements
Property provisions of £0.6m have been recognised as at 31 December 2025 (2024: £1.4m), representing the Directors' best estimate of dilapidations on property leases. The Directors have made the judgement that no provision is required for certain property leases where there is no intention to exit, having considered a number of factors including the extent of modifications to the property, the terms of the lease agreement, and the condition of the property.
As detailed in note 15 based on information available to date and taking into account there is very limited information from which to estimate the possible magnitude or timing of any resultant payments, management currently believes that the foregoing is not expected to have a material adverse impact on the Group's Financial Statements. Consequently, no provision has been recognised in these financial statements in respect of this matter.
Goodwill and other intangible assets acquired through business combinations have been allocated, for impairment testing purposes, to groups of cash generating units (CGUs). The identification of the groups of CGUs used for impairment testing is considered a critical accounting judgement. The grouped CGUs are Distribution, Manufacturing (excluding Pitreavie), and Pitreavie. This is also the lowest level at which the Group monitors the value of goodwill and other intangible assets for internal management purposes. Changes to the Group's organisational structure, integration of acquisitions, or changes in management reporting may require the reassessment of CGU groups.
No other significant critical judgements have been made in the current or prior year.
Alternative performance measures
In measuring the financial performance and position, the financial measures used in certain limited cases are derived from the reported results in order to eliminate factors which due to their unusual nature and size distort year-on-year comparisons to a material extent and/or provide useful information to stakeholders. Where such items arise, the Directors will classify such items as separately disclosed and provide details of these items to enable users of the accounts to understand the impact on the financial statements.
To the extent that a measurement under Generally Accepted Accounting Principles ("GAAP") is adjusted for a separately disclosed item, this is referred to as an Alternative Performance Measure ("APM"). We believe that the APMs defined below, and the comparable GAAP measurement, provides a useful basis for measuring the underlying financial performance and position of the Group and its businesses when compared to similar companies.
Adjusted operating profit is defined as operating profit before customer relationships and brand values amortisation, goodwill impairment, deferred contingent consideration adjustments and IAS19 past service costs.
Adjusted profit before tax is defined as profit before tax, customer relationships and brand values amortisation, goodwill impairment, deferred contingent consideration adjustments and IAS19 past service costs.
Adjusted diluted earnings per share is defined as diluted earnings per share before, customer relationships and brand values amortisation per share, goodwill impairment per share, deferred contingent consideration adjustments per share, IAS19 past service costs per share and related tax per share.
Macfarlane Group PLC
Notes to the financial information
For the year ended 31 December 2025
2. Basis of preparation (continued)
Alternative performance measures (continued)
|
Alternative Performance Measures |
Amortisation £000 |
Goodwill Impairment |
Deferred Contingent Consideration Adjustments |
IAS19 Past Service Cost Adjustment |
Tax |
Statutory Measures |
||
|
£000 |
£000 |
£000 |
£000 |
£000 |
£000 |
£000 |
||
|
Year to 31 December 2025 |
||||||||
|
Adjusted operating profit |
19,689 |
(5,171) |
(1,625) |
1,532 |
(1,930) |
- |
12,495 |
Operating profit |
|
Adjusted profit before tax |
15,573 |
(5,171) |
(1,625) |
1,203 |
(1,930) |
- |
8,050 |
Profit before tax |
|
Adjusted diluted earnings per share (pence) |
7.62p |
(3.26)p |
(1.03)p |
0.76p |
(1.22)p |
1.11p |
3.98p |
Diluted earnings per share (pence) |
|
Year to 31 December 2024 |
||||||||
|
Adjusted operating profit |
27,402 |
(4,610) |
- |
805 |
- |
- |
23,597 |
Operating profit |
|
Adjusted profit before tax |
24,969 |
(4,610) |
- |
537 |
- |
- |
20,896 |
Profit before tax |
|
Adjusted diluted earnings per share (pence) |
11.56p |
(2.89)p |
- |
0.34p |
- |
0.73p |
9.74p |
Diluted earnings per share (pence) |
Net bank funds/(debt) also represents an APM as defined and reconciled to the statutory measure in note 9.
Macfarlane Group PLC
Notes to the financial information
For the year ended 31 December 2025
3. Segmental information
The Group's principal business segment is Packaging Distribution, comprising the distribution of packaging materials and supply of storage and warehousing services in the UK. This comprises 76% of Group revenue and 53% of Group operating profit. The Group's Manufacturing Operations segment comprises the design, manufacture and assembly of timber, corrugated and foam-based packaging materials in the UK. This comprises 24% of Group revenue and 47% of Group operating profit.
|
2025 £000 |
2024 £000 |
||
|
Packaging Distribution |
|||
|
Total and external revenue |
229,150 |
228,763 |
|
|
Cost of sales |
(148,372) |
(143,890) |
|
|
|
|
||
Gross profit |
80,778 |
84,873 |
|
|
Net operating expenses |
(69,405) |
(64,715) |
|
|
|
|
||
|
Adjusted operating profit |
11,373 |
20,158 |
|
|
Amortisation |
(2,803) |
(3,082) |
|
|
Deferred contingent consideration adjustments |
(128) |
255 |
|
|
IAS19 past service charge |
(1,764) |
- |
|
|
|
|
||
|
Operating Profit |
6,678 |
17,331 |
|
|
|
|
||
|
2025 £000 |
2024 £000 |
||
|
Manufacturing Operations |
|||
|
Total revenue |
78,472 |
47,458 |
|
|
Inter-segment revenue |
(6,812) |
(5,784) |
|
|
|
|
||
|
External revenue |
71,660 |
41,674 |
|
|
Cost of sales |
(40,267) |
(21,175) |
|
|
|
|
||
Gross profit |
31,393 |
20,499 |
|
|
Net operating expenses |
(23,077) |
(13,255) |
|
|
|
|
||
|
Adjusted operating profit |
8,316 |
7,244 |
|
|
Amortisation |
(2,368) |
(1,528) |
|
|
Deferred contingent consideration adjustments |
1,660 |
550 |
|
|
Goodwill impairment |
(1,625) |
- |
|
|
IAS19 past service charge |
(166) |
- |
|
|
|
|
||
|
Operating profit |
5,817 |
6,266 |
|
|
|
|
||
Macfarlane Group PLC
Notes to the financial information
For the year ended 31 December 2025
3. Segmental information (continued)
|
2025 |
2024 |
||
|
Group Total |
£000 |
£000 |
|
|
Packaging Distribution |
6,678 |
17,331 |
|
|
Manufacturing Operations |
5,817 |
6,266 |
|
|
|
|
||
|
Operating profit |
12,495 |
23,597 |
|
|
Finance costs |
(4,445) |
(2,701) |
|
|
|
|
||
|
Profit before tax |
8,050 |
20,896 |
|
|
Tax |
(1,734) |
(5,366) |
|
|
|
|
||
|
Profit for the year |
6,316 |
15,530 |
|
|
|
|
||
|
Assets |
Liabilities |
Net assets |
|
|
£000 |
£000 |
£000 |
|
|
Group segments |
|||
|
Packaging Distribution |
193,825 |
(131,331) |
62,494 |
|
Manufacturing Operations |
83,969 |
(25,901) |
58,068 |
|
|
|
|
|
|
Net assets 2025 |
277,794 |
(157,232) |
120,562 |
|
|
|
|
|
|
Assets |
Liabilities |
Net assets |
|
|
£000 |
£000 |
£000 |
|
|
Packaging Distribution |
189,768 |
(110,832) |
78,936 |
|
Manufacturing Operations |
57,163 |
(12,826) |
44,337 |
|
|
|
|
|
|
Net assets 2024 |
246,931 |
(123,658) |
123,273 |
|
|
|
|
Macfarlane Group PLC
Notes to the financial information
For the year ended 31 December 2025
|
4. Net finance costs |
2025 £000 |
2024 £000 |
||||||
|
Interest on bank borrowings |
1,767 |
950 |
||||||
|
Interest on leases |
2,872 |
1,921 |
||||||
|
Net interest income on retirement benefit obligation (see note 10) |
(523) |
(438) |
||||||
|
Finance charge relating to deferred contingent consideration |
329 |
268 |
||||||
|
|
|
|||||||
|
Net finance costs |
4,445 |
2,701 |
||||||
|
|
|
|||||||
|
5. Tax |
2025 £000 |
2024 £000 |
||||||
|
Current tax |
||||||||
|
United Kingdom corporation tax at 25.0% (2024: 25.0%) |
3,540 |
5,363 |
||||||
|
Foreign tax |
276 |
795 |
||||||
|
Adjustments in respect of prior years |
(215) |
(58) |
||||||
|
|
|
|||||||
|
Total current tax |
3,601 |
6,100 |
||||||
|
|
|
|||||||
|
Deferred tax |
||||||||
|
Current year |
(1,867) |
(899) |
||||||
|
Adjustments in respect of prior years |
- |
165 |
||||||
|
|
|
|||||||
|
Total deferred tax (see note 11) |
(1,867) |
(734) |
||||||
|
|
|
|||||||
|
Total tax charge |
1,734 |
5,366 |
||||||
|
|
|
|||||||
The standard rate of tax based on the UK average rate of corporation tax is 25.0% (2024: 25.0%). Taxation for other jurisdictions is calculated at the rates prevailing in these jurisdictions.
The actual tax charge for the current and previous year varies from the standard rate of tax on the results in the consolidated income statement for the reasons set out in the following reconciliation:
|
2025 £000 |
2024 £000 |
|
|
Profit before tax |
8,050 |
20,896 |
|
|
|
|
|
Tax on profit at 25.0% (2024: 25.0%) |
2,012 |
5,224 |
|
Factors affecting tax charge for the year:- |
||
|
Deferred contingent consideration adjustments not allowable for tax |
(301) |
(134) |
|
Goodwill impairment not deductible for tax |
406 |
- |
|
Non-deductible expenses |
224 |
100 |
|
Non-taxable income |
(398) |
- |
|
Difference on overseas tax rates |
6 |
69 |
|
Changes in estimates related to prior years |
(215) |
107 |
|
|
|
|
|
Tax charge for the year |
1,734 |
5,366 |
|
|
|
|
|
Effective rate of tax for the year |
21.5% |
25.7% |
|
|
|
Macfarlane Group PLC
Notes to the financial information
For the year ended 31 December 2025
|
6. Dividends |
2025 £000 |
2024 £000 |
|
Amounts recognised as distributions to equity holders in the year: |
||
|
Final dividend for the year ended 31 December 2024 of 2.70 per share (2023 - 2.65p per share) |
4,302 |
4,221 |
|
Interim dividend for the year ended 31 December 2025 of 0.96p per share (2024 - 0.96p per share) |
1,520 |
1,529 |
|
|
|
|
|
5,822 |
5,750 |
|
|
|
|
A proposed dividend of 2.70p per share totalling £4,246,000 will be paid on 12 June 2026 to those shareholders on the register at 15 May 2026 (ex-dividend date 14 May 2026). This is subject to approval by shareholders at the Annual General Meeting on 12 May 2026 and therefore has not been included as a liability in these financial statements.
7. Earnings per share
The calculation of the basic and diluted earnings per share is based on the following data:
|
2025 £000 |
2024 £000 |
||
|
Earnings for the purposes of earnings per share Profit for the year |
6,316 |
15,530 |
|
|
|
|
||
|
Number of shares in issue for the purposes of calculating basic and diluted earnings per share |
2025 No. of shares '000 |
2024 No. of shares '000 |
|
|
Weighted average number of shares in issue |
158,774 |
159,461 |
|
|
Less shares held by the EBT |
(287) |
(278) |
|
|
|
|
||
|
Weighted average number of shares in issue for the purposes of basic earnings per share |
158,487 |
159,183 |
|
|
Effect of Long-Term Incentive Plan awards in issue |
116 |
340 |
|
|
|
|
||
|
Weighted average number of shares in issue for the purposes of calculating diluted earnings per share |
158,603 |
159,523 |
|
|
|
|
||
|
Basic Earnings per share |
3.99p |
9.76p |
|
|
|
|
||
|
Diluted Earnings per share |
3.98p |
9.74p |
|
|
|
|
||
Macfarlane Group PLC
Notes to the financial information
For the year ended 31 December 2025
8. Acquisitions
On 10 January 2025, MGUK acquired 100% of The Pitreavie Group Limited ("Pitreavie"), for £10.6m as set out below. In addition, there is potential contingent consideration of £4.0m payable in the first quarters of 2026 and 2027, subject to certain trading targets being met in the twelve-month period ending on 31 December 2025 and 31 December 2026 respectively.
The impact of the acquisition of Pitreavie on 2025 results and if the acquisitions had been completed on the first day of 2025 are set out below:
|
From date of acquisition |
If completed 1 January 2025 |
|||
|
Revenue £000 |
Loss £000 |
Revenue £000 |
Loss £000 |
|
|
Pitreavie |
25,164 |
(668) |
25,533 |
(668) |
Fair values assigned to net assets acquired and consideration paid and payable are set out below:
|
Pitreavie £000 |
Prior Year Acquisitions £000 |
2025 Total £000 |
||
|
Net assets acquired |
||||
|
Other intangible assets |
6,937 |
- |
6,937 |
|
|
Tangible assets (inc. ROU assets) |
7,490 |
- |
7,490 |
|
|
Inventories |
1,256 |
- |
1,256 |
|
|
Trade and other receivables |
4,475 |
- |
4,475 |
|
|
Current tax asset |
111 |
111 |
||
|
Cash and bank balances (note 9) |
1,093 |
- |
1,093 |
|
|
Bank borrowings (note 9) |
(4,441) |
- |
(4,441) |
|
|
Trade and other payables |
(4,486) |
- |
(4,486) |
|
|
Lease liabilities (note 9) |
(4,477) |
- |
(4,477) |
|
|
Deferred tax liabilities (note 11) |
(2,377) |
- |
(2,377) |
|
|
|
|
|
||
|
Net assets acquired |
5,581 |
5,581 |
||
|
Goodwill arising on acquisition (note 9) |
6,557 |
- |
6,557 |
|
|
|
|
|
||
|
Total consideration |
12,138 |
- |
12,138 |
|
|
Contingent consideration on acquisitions |
||||
|
Current year |
(1,577) |
- |
(1,577) |
|
|
Prior years |
- |
3,429 |
3,429 |
|
|
|
|
|
||
|
Total cash consideration |
10,561 |
3,429 |
13,990 |
|
|
|
|
|
||
|
Net cash outflow arising on acquisitions |
||||
|
Cash consideration |
(10,561) |
(3,429) |
(13,990) |
|
|
Cash and bank balances acquired |
1,093 |
- |
1,093 |
|
|
|
|
|
||
|
Net cash outflow - acquisitions |
(9,468) |
(3,429) |
(12,897) |
|
|
|
|
|
||
|
Per Cash Flow Statement |
||||
|
Net cash outflow from investing activities |
(9,468) |
(3,429) |
(12,897) |
|
|
|
|
|
||
Macfarlane Group PLC
Notes to the financial information
For the year ended 31 December 2025
9. Analysis of changes in net debt
|
Cash & cash equivalents £000 |
Bank borrowing £000 |
Lease liabilities £000 |
Net debt £000 |
|
|
At 1 January 2025 |
12,928 |
(14,846) |
(42,876) |
(44,794) |
|
Cash movements |
362 |
(11,257) |
9,266 |
(1,629) |
|
Non-cash movements |
||||
|
New leases Acquisitions Disposal Lease modifications Exchange movements |
- 1,093 - - - |
- (4,441) - - - |
(9,397) (4,477) 990 (12,271) (56) |
(9,397) (7,825) 990 (12,271) (56) |
|
|
|
|
|
|
|
At 31 December 2025 |
14,383 |
(30,544) |
(58,821) |
(74,982) |
|
|
|
|
|
|
Due within one year |
14,383 |
(30,544) |
(9,904) |
(26,065) |
||||||
|
Due after more than one year |
- |
- |
(48,917) |
(48,917) |
||||||
|
|
|
|
|
|||||||
|
At 31 December 2025 |
14,383 |
(30,544) |
(58,821) |
(74,982) |
||||||
|
|
|
|
|
|||||||
|
Net bank debt 2025 |
14,383 |
(30,544) |
(16,161) |
|||||||
|
|
|
|
||||||||
|
Net bank debt 2024 |
12,928 |
(14,846) |
(1,918) |
|||||||
|
|
|
|
||||||||
Cash and cash equivalents (which are presented as a single class of asset on the face of the balance sheet) comprise cash at bank and other short-term highly liquid investments with maturity of three months or less. Total financing liabilities are equal to £89,365,000 (2024: £57,722,000).
10. Pension scheme
Macfarlane Group PLC sponsors a defined benefit pension scheme for former UK employees - the Macfarlane Group PLC Pension & Life Assurance Scheme (1974) ("the Scheme"). One of the trading subsidiaries, Macfarlane Group UK Limited is also a sponsoring employer of the Scheme. The Scheme is currently in surplus and disclosure of the respective proportions of the Group surplus are included and disclosed in the financial statements of each of the two participating employers.
The Scheme is an HMRC registered pension scheme, administered by a Board of Trustees composed of employer-nominated representatives and member-nominated Trustees which is legally separate from the Group. The Scheme's investments are held separately from those of the Group in managed funds under the supervision of the Trustees. The Trustees are required by law to act in the interest of all classes of beneficiary in the Scheme and are responsible for investment policy and the administration of benefits. Macfarlane Group PLC, based on legal opinion provided, has an unconditional right to a refund of surplus assets assuming the full settlement of plan liabilities in the event of a wind up of the Scheme. Furthermore, in the ordinary course of business the trustees have no rights to unilaterally wind up the Scheme, or otherwise augment the benefits due to members of the Scheme. Based on these rights, any net surplus in the Scheme is recognised in full.
The Scheme provides qualifying employees with an annual pension of 1/60 of pensionable salary for each completed years' service on attainment of a normal retirement age of 65. Pensionable salaries were frozen for the remaining active members at the levels current at 30 April 2009 with the change taking effect from 30 April 2010. As a result no further salary inflation applies for active members who elected to remain in the Scheme. Active members' benefits also include life assurance cover, with the payment of these benefits at the discretion of the Trustees of the Scheme. The Scheme was closed to new entrants during 2002. The Scheme was closed to future accrual on 30 November 2022 with the 3 remaining active members transferring to the Group's defined contribution pension scheme.
Macfarlane Group PLC
Notes to the financial information
For the year ended 31 December 2025
10. Pension scheme (continued)
On leaving active service a deferred member's pension is revalued from the time of withdrawal until the pension is drawn. Revaluation in deferment is statutory and since 2010 has been revalued on the Consumer Price Index ("CPI") measure of inflation. Revaluation of pensions in payment is a blend of fixed increases and inflationary increases depending on the relevant periods of accrual of benefit. For pensions in payment, the inflationary increase is currently based on the Retail Price Index ("RPI") measure of inflation or based on Limited Price Indexation ("LPI") for certain defined periods of service.
During 2012, Macfarlane Group PLC agreed with the Board of Trustees to amend benefits for pensioner, deferred and active members in the Scheme by offering a Pension Increase Exchange ("PIE") option to pensioner members and a PIE option to all other members at retirement after 1 May 2012.
In June 2023, the UK High Court issued a ruling in the case of Virgin Media Limited v NTL Pension Trustees II Limited and other ("the Virgin Media case") relating to the validity of certain historical pension changes. The ruling was upheld at the Court of Appeal in July 2024. After seeking external legal advice in 2024 the Group concluded that they are not aware of any issues that would require any adjustment to the defined benefit obligations and no further action is required at this stage. Further, the Department of Work and Pensions announced in 2025 that it will introduce legislation to allow retrospective confirmation of historic benefit changes which will significantly reduce the impact of the Virgin Media case on pension schemes. The legislation is expected to be enacted during 2026.
Balance sheet disclosures
The Scheme's qualified actuary from Aon carries out triennial valuations using the Projected Unit Credit Method to determine the level of deficit/surplus. For the most recent triennial valuation at 1 May 2023, the results of this valuation showed that the market value of the relevant investments of the Scheme was £71,900,000 and represented 109% of the actuarial value of benefits that had accrued to members.
The investment classes held by the Scheme and the Scheme surplus, based on the results of the actuarial valuation as at 1 May 2023, updated to the year-end are as shown below:
|
2025 £000 |
2024 £000 |
|
|
Investment class |
||
|
Multi-asset diversified funds |
- |
2,879 |
|
Liability-driven investment funds |
37,216 |
32,589 |
|
Multi-asset credit funds |
3,048 |
10,234 |
|
Securitised credit funds |
16,157 |
16,895 |
|
Other (cash and similar assets) |
5,779 |
1,511 |
|
|
|
|
|
Fair value of Scheme investments |
62,200 |
64,108 |
|
Present value of Scheme liabilities |
(56,164) |
(54,472) |
|
|
|
|
|
Scheme surplus |
6,036 |
9,636 |
|
|
|
All investments are quoted except cash.
The Trustees review the investments of the Scheme on a regular basis and consult with the Company regarding any proposed changes to the investment profile. Liability-Driven Investment Funds are intended to provide a match of 100% against the impact of movements in inflation on pension liabilities and against the impact of movements in interest-rates on pension liabilities. During 2025 adjustments were made between investments to maintain the overall allocations in line with the Trustees' strategic asset allocation.
Macfarlane Group PLC
Notes to the financial information
For the year ended 31 December 2025
10. Pension scheme (continued)
The ability to realise the Scheme's investments at, or close to, fair value was considered when setting the investment strategy. 100% (2024: 100%) of the Scheme's investments can be realised at fair value on a daily or weekly basis. The remaining investments have monthly or quarterly liquidity. However, whilst the regular income from these helps to meet the Scheme's cash flow needs, they are not expected to be realised at short notice from a strategic perspective. The present value of the Scheme liabilities is derived from cash flow projections and the expected return of the assets over a long period and is thus inherently uncertain.
The Scheme's liabilities were calculated on the following bases as required under IAS 19:
Assumptions |
2025 |
2024 |
|
Discount rate |
5.45% |
5.50% |
|
Rate of increase in salaries |
0.00% |
0.00% |
|
Inflation assumption (RPI) |
2.90% |
3.20% |
|
Inflation assumption (CPI) |
2.60% |
2.80% |
|
Life expectancy beyond normal retirement age of 65 |
||
|
Male currently aged 55 (years) |
22.7 |
22.3 |
|
Female currently aged 55 (years) |
24.2 |
24.1 |
|
Male currently aged 65 (years) |
22.2 |
21.8 |
|
Female currently aged 65 (years) |
23.5 |
23.4 |
|
2025 |
2024 |
|
|
Movement in scheme surplus |
£000 |
£000 |
|
At 1 January |
9,636 |
9,921 |
|
Administration costs incurred |
(250) |
(361) |
|
Net finance income (see note 4) |
523 |
438 |
|
Past service cost |
(1,930) |
- |
|
Remeasurement of pension scheme surplus |
(1,943) |
(362) |
|
|
|
|
|
At 31 December |
6,036 |
9,636 |
|
|
|
Pre-2012 Barber Equalisation
Following the Barber judgement in 1990 to equalise normal retirement ages for men and women the Macfarlane Group PLC Pension & Life Assurance Scheme (1974) ("the Scheme") initially adopted the service credit method to equalise pensions for those members with service in the Barber window (17 May 1990 and 19 June 1995). After taking legal advice in 2011, the better of the service credit or tranching approach ("better off approach") was adopted for all retirements after 1 June 2012. In preparing the pension scheme for a potential buy-in legal advice was received in 2025 that advised the trustees to correct the benefits of any members who retired prior to 1 June 2012 with service in the Barber window where the better off approach would have resulted in a higher benefit than the service credit approach. As a result, an estimated liability of £1,930,000, comprising £1,360,000 to adjust historic pensions paid and £570,000 to adjust future benefit payments, has been assessed which has been charged as a non-recurring charge in 2025.
Funding
UK pension legislation requires that pension schemes are funded prudently. Following the triennial actuarial valuation of the Scheme at 1 May 2023, the Company agreed with the Pension Scheme Trustees, that no contributions were required. The next triennial actuarial valuation is due at 1 May 2026.
Macfarlane Group PLC
Notes to the financial information
For the year ended 31 December 2025
10. Pension scheme (continued)
Sensitivity to key assumptions
The key assumptions used for IAS 19 are discount rate, inflation and mortality. If different assumptions were used, then this could have a material effect on the results disclosed. Assuming all other assumptions are held static then a movement in the following key assumptions would affect the level of the deficit as shown below:
|
Assumptions |
2025 £000 |
2024 £000 |
|
Discount rate movement of +1.0% |
5,152 |
4,997 |
|
Inflation rate movement of +0.25% |
(181) |
(176) |
|
Mortality movement of +1 year in age rating |
(2,311) |
(2,241) |
Positive figures reflect a reduction in the Scheme liabilities and therefore a reduction in the Scheme deficit or increase in the Scheme surplus. The sensitivity information has been prepared using the same method as adopted when adjusting the results of the latest funding valuation to the balance sheet date and is consistent with the approach adopted in previous years.
The sensitivities shown reflect average movements in the assumptions in the last three years. All information assumes that the average duration of Scheme liabilities is twelve years.
|
11. Deferred tax |
2025 £000 |
2024 £000 |
|
At 1 January |
(10,792) |
(9,137) |
|
Transfer to Corporation Tax |
||
|
Acquisitions (note 8) |
(2,377) |
(2,480) |
|
Credited in income statement (see note 5) |
1,867 |
734 |
|
Credited in other comprehensive income Remeasurement of pension scheme liability |
486 |
91 |
|
|
|
|
|
At 31 December |
(10,816) |
(10,792) |
|
|
|
|
|
Deferred tax assets |
||
|
On accelerated capital allowances/timing differences |
276 |
145 |
|
|
|
|
|
Disclosed as deferred tax assets |
276 |
145 |
|
|
|
|
|
Deferred tax liabilities |
||
|
On accelerated capital allowances/timing differences |
(2,044) |
(1,406) |
|
On retirement benefit obligations |
(1,509) |
(2,409) |
|
On other intangible assets |
(7,539) |
(7,122) |
|
|
|
|
|
Disclosed as deferred tax liabilities |
(11,092) |
(10,937) |
|
|
|
|
|
|
|
|
|
At 31 December |
(10,816) |
(10,792) |
|
|
|
Macfarlane Group PLC
Notes to the financial information
For the year ended 31 December 2025
|
12. Share capital |
2025 £000 |
2024 £000 |
|
Allotted, issued and fully paid: |
||
|
At 1 January |
39,900 |
39,738 |
|
Issued during the year |
- |
162 |
|
Cancelled during the year |
(581) |
- |
|
|
|
|
|
At 31 December |
39,319 |
39,900 |
|
|
|
|
|
Share premium |
||
|
At 1 January |
14,496 |
13,981 |
|
Issued during the year |
- |
515 |
|
|
|
|
|
At 31 December |
14,496 |
14,496 |
|
|
|
|
|
Capital redemption reserve |
||
|
At 1 January |
- |
- |
|
Cancelled during the year |
581 |
- |
|
|
|
|
|
At 31 December |
581 |
- |
|
|
|
The Company has one class of ordinary shares of 25p each, which carry no right to fixed income. Each ordinary share carries one vote in any General Meeting of the Company.
The decrease in share capital relates to the £4,000,000 share buyback programme launched on 15 May 2025 with the programme to be completed in four quarterly tranches of £1,000,000 starting from 2 June 2025 and all shares purchased being cancelled. In the period to 31 December 2025 £2,083,234 was spent on purchasing of 2,325,509 shares, at an average price per share of 89.58p.
13. Related party transactions
Transactions between the Company and its subsidiaries, which are related parties, have been eliminated on consolidation and are not disclosed.
Details of individual and collective remuneration of the Company's Directors and dividends received by the Directors for calendar year 2025 will be disclosed in the Group's 2025 Annual Report and Accounts.
The Directors are satisfied that there are no other related party transactions occurring during the year which require disclosure.
The Group will continue to monitor the progress of the investigation and will recognise a provision if and when it becomes probable that an outflow of economic benefits will be required to settle an obligation, and a reliable estimate can be made.
14. Post balance sheet events
There are no post balance sheet events to be disclosed.
Macfarlane Group PLC
Notes to the financial information
For the year ended 31 December 2025
15. Contingent liability
One of the Group's subsidiaries, Pitreavie Packaging Limited ("Pitreavie"), is subject to an ongoing investigation by the authorities in relation to an incident on 7 October 2025 at its Cumbernauld manufacturing facility, which tragically resulted in the death of an employee. The investigation is in its early stages and Pitreavie management has not received any notification or indication of the likely outcome. The authorities have the power to issue enforcement notices or to initiate legal prosecution for breach of health and safety law which, if found to apply in this case, could result in significant fines.
Based on information available to date and taking into account there is very limited information from which to estimate the possible magnitude or timing of any resultant payments, management currently believes that the foregoing is not expected to have a material adverse impact on the Group's Financial Statements.
The Group will continue to monitor the progress of the investigation and will recognise a provision if and when it becomes probable that a material outflow of economic benefits will be required to settle an obligation, and a reliable estimate can be made.
16. Posting to shareholders and Annual General Meeting
The Annual Report and Accounts will be sent to shareholders on Friday 10 April 2026 and will be available to members of the public at the Company's Registered Office from Friday 1 May 2026.
The Annual General Meeting will take place at 12 noon on Tuesday 12 May 2026.