

23 February 2023
MACFARLANE GROUP PLC
("MACFARLANE GROUP", "THE COMPANY", "THE GROUP")
ANNUAL RESULTS 2022
Results ahead of market expectations and 2021
FINANCIAL HIGHLIGHTS
|
2022 £000 |
2021 £000 |
Increase % |
|
|
Continuing operations |
|||
|
Revenue |
290,431 |
264,465 |
10% |
|
Operating profit before amortisation1 |
25,073 |
23,366 |
7% |
|
Operating profit |
21,496 |
20,055 |
7% |
|
Profit before tax |
19,934 |
18,665 |
7% |
|
Continuing and discontinued 2 operations |
|||
|
Profit for the year |
15,637 |
12,598 |
24% |
|
Interim and proposed Final dividend (pence) |
3.42p |
3.20p |
7% |
|
Basic earnings per share (pence) |
9.89p |
7.98p |
24% |
· Revenue from continuing operations grew by 10% versus 2021 to £290.4m.
· Profit before tax from continuing operations at £19.9m increased by 7% which is reflected in the increase in dividend.
· Basic and diluted earnings per share were 9.89p per share (2021: 7.98p per share) and 9.78p per share (2021: 7.90p per share) respectively.
Packaging Distribution
· Packaging Distribution achieved revenue growth of 8% to £259.7m (2021: £239.5m) through the recovery of input prices and the benefits from the acquisitions of Carters Packaging in March 2021 and PackMann in May 2022 which offset reduced demand from e-commerce customers.
· In line with our strategy to support our customers by increasing our geographic coverage we acquired PackMann in Germany in May 2022. PackMann revenues are in line with our expectations, but operating profit has been impacted by higher input costs.
· Gross margins are stable at 32.1% (2021: 32.4%) reflecting effective recovery of input price inflation.
· Operating profit before amortisation only increased by 1% to £19.9m (2021: £19.7m) due to cost increases. The key areas where costs have increased were start-up costs related to the new North-West of England distribution centre, strategic IT investments and inflationary pressures primarily in labour, energy and logistics costs.
Manufacturing Operations
· Manufacturing Operations delivered an excellent performance in 2022 with revenues growing by 23% to £30.8m (2021: £25.0m) and operating profit before amortisation increasing 42% to £5.2m (2021: £3.7m). GWP, acquired in February 2021, continued to perform well. The Macfarlane Design and Manufacture business benefited from recovery in the aerospace sector and the strengthening of its partnership with Packaging Distribution.
· The Group sold its Labels business in December 2021 and this has been classified as a discontinued operation. Labels recorded a loss before tax of £0.1m in 2022 (2021: Loss £0.9m) related to finalisation of completion accounts.
FINANCIAL HIGHLIGHTS
Group
· Net cash inflow from operating activities of £18.0m (2021: £23.8m) reflects the timing of payments at the year end to suppliers and higher 2021 employee incentive payments paid in 2022.
· Net bank debt on 31 December 2022 was £3.4m, a net cash outflow of £5.9m from 31 December 2021, including £8.7m of investment in acquisitions and a higher level of capital expenditure of £3.3m related primarily to the fit-out of the new distribution centre in the North-West of England (£1.3m). The Group is operating well within its existing bank facility of £30.0m and relevant covenants which runs until 31 December 2025.
· The Pension Scheme surplus increased to £10.2m at 31 December 2022 (31 December 2021: £8.3m). This improvement is due to continued contributions from the Group and an increase in the discount rate offset by a decline in the value of investments during the year. This is against the backdrop of considerable volatility in the markets, in particular government gilt yields.
· The Board is proposing a final dividend of 2.52p per share (2021: 2.33p per share) which would take the total dividend for 2022 to 3.42p per share (2021: 3.20p per share) up 7% on 2021.
1 See notes to the financial information below for reconciliation of Alternative Performance Measure operating profit before amortisation to operating profit.
2 In accordance with IFRS5, the 2021 and 2022 results of the Labels business, sold on 31 December 2021, have been stated as a discontinued operation. The loss for the year from the discontinued operation was £0.1m (2021: £1.1m).
CHAIR'S STATEMENT
In my first statement as Chair of Macfarlane Group, I am pleased to report that the Group results for the year ended 31 December 2022 were ahead of both the previous year and market expectations.
Trading
Our performance in 2022 was achieved against a background of a marked slowdown in spend from the e-commerce sector, following strong growth during the 2021 Covid-19 lockdown periods, and inflationary pressures on operating costs.
Our Packaging Distribution business achieved revenue growth of 8% through the benefit of acquisitions, good progress from our "Follow the Customer" strategy in Europe and the recovery of raw material price inflation. Profitability was only slightly higher than 2021 due to the start-up costs for our new distribution centre in the North-West of England, strategic investments in our IT capability and inflationary increases in operating costs.
Our Manufacturing Operations have had an excellent year, with strong growth in sales and operating profit. We benefited from the 2021 acquisition of GWP, demand recovery in certain industrial markets and the partnership with our Packaging Distribution business continued to strengthen.
We were able to fund £11.9m (2021: £14.4m) of acquisition and capital investment activity through our existing bank facilities due to the continued strong operating cash flows and reinvesting the proceeds from the sale of our Labels business in December 2021.
The pension scheme remains in surplus, with the Directors working in close co-operation with the trustees and their advisers to manage investments successfully through volatility in the markets in the second half of 2022.
The dedication and commitment of all our colleagues has been critical to our success and I thank them for all their hard work in 2022.
Environment, Social and Governance ("ESG")
The Group has made good progress in 2022 on its ESG commitments. We have commenced the programme to electrify our fleet of delivery vehicles, continued to introduce solar panels at our sites, worked with our customers to move to more sustainable plastic products and invested in an additional Innovation Lab to help our customers reduce their carbon footprint. The Board is now more diverse and we have increased our level of engagement with the local communities in which we operate.
CHAIR'S STATEMENT
Board Changes
As set out in the Interim Report 2022, Stuart Paterson stood down as Chair at the end of September 2022 and the Board would like to thank Stuart for his valuable contribution as Chair and prior to that as a Non-Executive Director.
On 1 October 2022, Laura Whyte was appointed to the Board as an independent Non-Executive Director and Chair of the Remuneration Committee. Laura brings extensive commercial and human resources experience to the Board.
Proposed Dividend
The Board is proposing a final dividend of 2.52 pence per share, amounting to a full year dividend of 3.42 pence per share (2021: 3.20 pence per share), an increase of 7%. Subject to the approval of shareholders at the Annual General Meeting on Tuesday 9 May 2023 the final dividend will be paid on Thursday 1 June 2023 to those shareholders on the register at Friday 12 May 2023.
Outlook
We anticipate that 2023 will be another challenging year with uncertainty over the impact of the increase in the cost of living on customer demand, rising operating costs, particularly related to labour and energy, and increasing interest costs. Despite these challenges, with the effectiveness of our strategy, the resilience of our business model and the experience and commitment of our people, we expect Macfarlane Group to continue to deliver further growth in 2023.
"Follow the Customer" is the Group's strategy to provide UK customers with access to its products and services in mainland Europe.
Further enquiries: |
Macfarlane Group |
Tel: 0141 333 9666 |
|
Aleen Gulvanessian Chair |
||
|
Peter Atkinson Chief Executive |
||
|
Ivor Gray Finance Director |
||
|
|
Spreng Thomson |
Tel: 0141 548 5191 |
|
Callum Spreng |
Mob: 07803 970103 |
Legal Entity Identifier (LEI): 213800LVRYDERSJAAZ73
Notes to Editors:
· Macfarlane Group PLC has been listed on the Premium segment of the Main Market of the London Stock Exchange (LSE: MACF) since 1973 with over 70 years' experience in the UK packaging industry.
· Through its two divisions Macfarlane Group services a broad range of business customers, supplying them high quality protective packaging which help customers reduce supply chain costs, improve their operational efficiencies and enhance their brand presentation. The divisions are:
o Packaging Distribution - Macfarlane Packaging Distribution is the leading UK distributor of a comprehensive range of protective packaging products; and
o Manufacturing Operations - Macfarlane Design and Manufacture who design and produce protective packaging for high value and fragile products.
· Headquartered in Glasgow, Scotland, Macfarlane Group employs over 1,000 people at 37 sites, principally in the UK, as well as in Ireland, Germany and the Netherlands.
· Macfarlane Group supplies more than 20,000 customers principally in the UK and Europe.
· In partnership with 1,700 suppliers, Macfarlane Group distributes and manufactures 600,000+ lines across a wide range of sectors, including: retail e-commerce; consumer goods; food; logistics; mail order; electronics; defence, automotive and aerospace.
BUSINESS REVIEW
Macfarlane Group's trading activities comprise Packaging Distribution and Manufacturing Operations.
Macfarlane's Packaging Distribution business is the UK's leading specialist distributor of protective packaging materials, with a growing presence in Europe. Macfarlane operates a stock and serve supply model in the UK, Ireland, the Netherlands and Germany from 27 Regional Distribution Centres ("RDCs") and three satellite sites, supplying industrial and retail customers with a comprehensive range of protective packaging materials on a local, regional and national basis.
Competition in the packaging distribution market is from local and regional protective packaging specialist companies as well as national/international distribution generalists who supply a range of products, including protective packaging materials. Macfarlane competes effectively on a local basis through its strong focus on customer service, its breadth and depth of product offer and through the recruitment and retention of high-quality staff with good local market knowledge. On a national basis, Macfarlane has market focus, expertise and a breadth of product and service knowledge, all of which enable it to compete effectively against non-specialist packaging distributors.
Packaging Distribution benefits its customers by enabling them to ensure their products are cost-effectively protected in transit and storage through the supply of a comprehensive product range, single source stock and serve supply, just-in-time delivery, tailored stock management programmes, electronic trading and independent advice on both packaging materials and packing processes. Through the 'Significant Six' sales approach we reduce our customers' 'Total Cost of Packaging' and their carbon footprint. This is achieved through supplying effective packaging solutions, optimising warehousing and transportation, reducing damages and returns and improving packaging efficiency.
"Significant Six" represents the six key costs in a customers' packing process being transport, warehousing, administration, damages and returns, productivity and customer experience.
|
Packaging Distribution |
2022 |
2021 |
2022 |
|
£000 |
£000 |
Change |
|
|
Revenue |
259,651 |
239,508 |
8% |
|
Cost of sales |
176,193 |
161,896 |
9% |
|
|
|
||
|
Gross margin |
83,458 |
77,612 |
8% |
|
Operating expenses |
63,590 |
57,915 |
10% |
|
|
|
||
|
Operating profit before amortisation |
19,868 |
19,697 |
1% |
|
Amortisation |
2,774 |
2,642 |
|
|
|
|
||
|
Operating profit |
17,094 |
17,055 |
-% |
|
|
|
See notes to the financial information below for reconciliation of Alternative Performance Measure operating profit before amortisation to operating profit.
The main features of Packaging Distribution's performance in 2022 were:
· Increase in revenue of £20.1m:
· Organic revenue growth in the UK and Ireland of £8.4m has been achieved through recovery in some industrial sectors, particularly in aerospace, engineering and hospitality, and inflation in pricing offset by a marked reduction in demand from e-commerce customers, most of which benefited from the Covid-19 lockdowns in H1 2021.
· Our 'Follow the Customer' strategy in Northern Europe achieved £2.9m of incremental sales through the Group subsidiary in the Netherlands, with the business now generating profits.
· Sales growth of £8.8m was achieved from the acquisitions of Carters Packaging, Cornwall, in March 2021 and PackMann, Germany, in May 2022. The PackMann pre-acquisition costs of £0.2m were expensed in 2022.
· New business in 2022 at £8.9m was lower than 2021. Following the supply chain challenges of 2020/21 customers were less inclined to switch supply and our sales team prioritised the management of input price increases with our customers.
· The acquisition of PackMann was an important strategic step and complements our "Follow the Customer" programme in Europe.
· Effective management of significant input price increases across all product categories in H2 2021 and H1 2022 has enabled us to broadly maintain gross margin at 32.1% (2021: 32.4%).
· Overhead costs in 2022 were £5.7m higher than 2021. This is attributable to the effect of acquisitions, strategic IT investments, the start-up costs for our new distribution centre in the North-West of England and the impact of inflation on labour, energy and logistics costs.
BUSINESS REVIEW
Future
Our plans for 2023 are focused on continuing to grow sales and improving profitability through the following actions:
· Prioritise engagement with potential new customers in sectors where we see future growth opportunities such as e-commerce retail, medical, scientific, and third-party logistics.
· Continue to effectively manage input price changes and supply chain challenges as they arise.
· Maximise the benefits from our "Packaging Optimiser" which was launched to our sales teams to better demonstrate our ability to add value for customers through our "Significant Six" sales approach.
· Achieve benefits from our information technology investments in Microsoft Dynamics, Slimstock and Warehouse Management.
· Refine and extend our product range to ensure we continue to offer our customers sustainable packaging solutions that reduce their carbon footprint.
· Introduce improvements to our web-based solutions to allow customers access to our full range of products and services more easily.
· Accelerate the progress we have made in Europe through our "Follow the Customer" programme and our recent acquisition of PackMann.
· Reduce operating costs through efficiency programmes in sales, logistics and administration.
· Realise the benefits from our new distribution centre in the North-West of England, including the new Innovation Lab due to open in March 2023.
· Plan our second major site consolidation in the East Midlands.
· Maintain the focus on working capital management to facilitate future investment and manage effectively the ongoing bad debt risk within the current economic environment.
· Supplement organic growth through progressing further high-quality acquisitions in the UK and Europe.
Packaging Optimiser is a Macfarlane developed software tool that measures the financial and carbon benefits of the Significant Six selling approach.
Manufacturing Operations comprises our Packaging Design and Manufacture business and GWP, acquired in February 2021.
Manufacturing Operations designs, manufactures, assembles and distributes bespoke packaging solutions for customers requiring cost-effective methods of protecting high value products in storage and transit. The primary raw materials are corrugate, timber and foam. The businesses operate from four manufacturing sites, in Grantham, Westbury, Swindon and Salisbury, supplying both directly to customers and through the national RDC network of the Packaging Distribution business.
Key market sectors are defence, aerospace, medical equipment, electronics, automotive, e-commerce retail and household equipment. The markets we serve are highly fragmented, with a range of locally based competitors. We differentiate our market offering through technical expertise, design capability, industry accreditations and national coverage through the Packaging Distribution business.
|
Manufacturing Operations |
2022 |
2021 |
2022 |
|
£000 |
£000 |
Change |
|
|
Revenue |
30,780 |
24,957 |
23% |
|
Cost of sales |
16,181 |
13,102 |
24% |
|
|
|
||
|
Gross margin |
14,599 |
11,855 |
23% |
|
Operating expenses |
9,394 |
8,186 |
15% |
|
|
|
||
|
Operating profit before amortisation |
5,205 |
3,669 |
42% |
|
Amortisation |
803 |
669 |
|
|
|
|
||
|
Operating profit |
4,402 |
3,000 |
47% |
|
|
|
See notes to the financial information below for reconciliation of Alternative Performance Measure operating profit before amortisation to operating profit.
BUSINESS REVIEW
The impressive growth in operating profit of 47% in Manufacturing Operations has been achieved through:
· Organic sales growth of 15% (£1.4m), due mainly to recovery in the aerospace (defence and commercial) sector and inflation in pricing.
· Sales growth of £4.4m achieved from the acquisition of GWP in February 2021, which has benefited from strong demand from its industrial customers and inflation in pricing.
· Strengthening of the partnership between Manufacturing Operations and Packaging Distribution.
· Effective management of increasing input prices with our customers to maintain gross margin; and
· Good control of operating costs, against a backdrop of inflation in logistics, labour and energy costs.
Future
Priorities for Manufacturing Operations in 2023 are to:
· Focus the sales team on new business growth in target sectors e.g., medical and defence.
· Prioritise new sales activity on our higher added-value bespoke composite pack product range.
· Work with our customers to effectively manage material price changes to minimise the impact on gross margins.
· Continue to strengthen the relationship with our Packaging Distribution businesses to create both sales and cost synergies.
· Commence the process of GWP working more closely with the Macfarlane Packaging Design and Manufacture and Packaging Distribution businesses.
· Supplement organic growth through progressing further high-quality acquisitions in the UK.
Group
The Group has achieved sales growth of 10% and operating profit growth 7% in 2022 while making significant investments in the future of the business including the first major site consolidation, upgrading our information technology and making our first acquisition outside the UK to supplement our "Follow the Customer" programme in Europe.
|
Group performance |
Revenue 2022 £000 |
Operating profit/ (loss) before amortisation 2022 £000 |
Operating profit/ (loss) 2022 £000 |
Revenue 2021 £000 |
Operating profit before amortisation 2021 £000 |
Operating profit 2021 £000 |
|
Segment |
||||||
|
Packaging Distribution |
259,651 |
19,868 |
17,094 |
239,508 |
19,697 |
17,055 |
|
Manufacturing Operations |
30,780 |
5,205 |
4,402 |
24,957 |
3,669 |
3,000 |
|
|
|
|
|
|
|
|
|
Continuing operations |
290,431 |
25,073 |
21,496 |
264,465 |
23,366 |
20,055 |
|
|
|
|
|
|
|
|
|
% of Revenue |
8.6% |
7.4% |
8.8% |
7.6% |
||
|
Discontinued operations |
- |
(87) |
(87) |
21,220 |
372 |
372 |
|
|
|
|
|
|
|
|
|
Group Total |
290,431 |
24,986 |
21,409 |
285,685 |
23,738 |
20,427 |
|
|
|
|
|
|
|
See notes to the financial information below for reconciliation of Alternative Performance Measure operating profit before amortisation to operating profit.
BUSINESS REVIEW
2023 Outlook
The Group's businesses all have strong market positions with low customer concentration and differentiated product and service offerings, providing both value and sustainability to our customers. We have a flexible business model and proven effective implementation of our strategic plan, which is reflected in consistent profit and cash generation over a sustained period.
Our future performance continues to depend on our effectiveness in growing sales, increasing efficiencies and bringing high quality acquisitions into the Group. There will continue to be significant challenges in 2023, with rising costs and uncertainties over demand in some sectors. However, our strategy and business model have proved to be resilient and we expect to deliver further growth in 2023.
BUSINESS REVIEW
RISKS AND UNCERTAINTIES
The principal risks and uncertainties faced by the Group and the factors mitigating these risks are detailed below. These risks are addressed within an overall governance framework including clear and delegated authorities, business performance monitoring and appropriate insurance cover for a wide range of potential risks. There is a dependence on good quality local management, which is supported by an investment in training and development and ongoing performance evaluation.
Risks are identified and assessed through a range of "top down" and "bottom up" analyses that are updated on a regular basis. This in turn provides the basis for making informed risk-based decisions regarding the scope and focus of assurance work, as described in the report of the Audit Committee in the 2022 Annual Report. In addition to scheduled updates from Finance, Health & Safety, IT, Sales, Procurement and other business functions, the Board and Audit Committee may seek assurance work in other areas from time to time, either from internal sources or externally commissioned work.
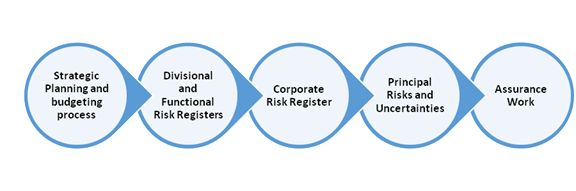
We continue to evolve our risk management processes to ensure they are robust, effective and integrated within our decision-making processes. We have included a brief description of how we assess that each risk level has changed. For risks shown as [ ç è ] the risk level is broadly similar between 2021 and 2022. If the risk is shown as [ é ê ] the risk level has increased or decreased respectively during 2022 and is being addressed accordingly through mitigating actions by management.
The business has added the Uncertain Economic Environment as a new risk in 2022. Due to a range of prolonged geopolitical and economic uncertainties within the UK and other markets, there is an increased risk that we are entering into a recessionary trading environment.
|
Risk Description |
Mitigating Factors |
C hange in Risk Level |
||
|
Strategic changes in the market Failure to respond to strategic shifts in the market, including the impact of weaknesses in the economy as well as disruptive behaviour from competitors and changing customer needs (e.g. the move towards online retail) could limit the Group's ability to continue to grow revenues. We monitor this through Net Promoter Score, an annual customer satisfaction survey and interaction with customers at our Innovation Lab. |
The Group has a well-diversified customer base giving protection from changes in specific industry sectors as well as a flexible business model with a strong value proposition to meet the changing needs of customers. The Group strives to maintain high service levels for customers ensuring that customer needs are met. The Group continues to invest in information technology, including its new Customer Relationship Management System being rolled out across the Group, while also enhancing its service offering. The Group maintains strong partnerships with key suppliers to ensure that a broad range of products is available to respond to customers' requirements, including any changes in their environmental and sustainability priorities. |
No change ç è The Group's supply chain challenges experienced in 2021 have stabilised in 2022 with lead times returning to normal levels. However, the Group has continued to experience volatility in input prices across all product categories which is being managed effectively. During 2022 the Group has experienced weaker demand from customers, particularly in the e-commerce retail sector. During 2023 the Group expects to realise some of the benefits of the new Customer Relationship Management system which will help the customer service teams in managing the complex and changing needs of our customers in an increasingly competitive environment. |
||
|
Impact of environmental, social and governance ("ESG") changes Customers are increasingly focused on the environmental impacts of packaging, changing their buying behaviours in response to climate and sustainability concerns. Investors are looking to invest in companies that demonstrate strong ESG credentials. There is increasing regulatory focus around reporting disclosures and new requirements, such as the Plastic Tax introduced from April 2022. The Plastic Tax cost £0.9m in 2022. This cost is recharged directly onto our customers. If the Group is not proactive and transparent in how it is responding to environmental changes, this could lead to a loss of employees, customers and investors. The key measure the Group monitors is Scope 1 and 2 CO2 emissions. |
The Group has an ESG working group to examine specifically how we can reduce our impact on the environment. The working Group is focused on measuring the CO2 footprint and setting and monitoring progress against reduction targets for TCFD (Taskforce for Climate-related Financial Disclosures). A full-time Head of Sustainability was appointed and started in January 2023. The Group has committed to the development of a transition plan towards net-zero and, on an ongoing basis, reviews all relevant developments and available technologies to support that transition. Regular reviews of our environmental strategy are carried out at Board level to challenge performance against key milestones, as well as to ensure that priorities are aligned with stakeholder objectives. |
No change ç è The Group recognises the increased significance of our ESG obligations. Our plans include actions to reduce our own carbon footprint, including; · the introduction of electric trucks to our fleet in 2022/2023; · investment in solar panels at sites with high energy use; and · ongoing actions to support our customers to reduce their CO2 emissions, including using our 'Packaging Optimiser' tool. The Group has actively engaged with customers to minmise the impact of the Plastic Tax by switching to alternative products. |
||
|
Raw material prices The Group's businesses are impacted by commodity-based raw material prices and manufacturer energy costs, with profitability sensitive to input price changes including currency fluctuations. The principal components are corrugated paper, polythene films, timber and foam, with changes to paper and oil prices having a direct impact on the price we pay to our suppliers. This risk is monitored through our procurement teams interacting with key suppliers and management regularly reviewing gross margin by customer. |
The Group works closely with its supplier and customer base to manage effectively the scale and timing of price changes and any resultant impact on profit. Our IT systems monitor and measure effectiveness in these changes. Where possible, alternative supplier relationships are maintained to minimise supplier dependency. We work with customers to redesign packs and reduce packing cost to mitigate the impact of cost increases including switching to alternative products to minimise the impact of the Plastic Tax introduced in April 2022. The Group has a well-established supplier relationship management process which is subject to periodic management review and internal audit. |
Increased risk é Input prices have continued to change throughout 2022 primarily due to volatility in timber, paper and polymer prices and the impact of rising fuel and energy costs. The business has managed these challenges robustly and gross margins have remained strong throughout 2022, reflecting the effort of our teams to mitigate these increases. The Group expects input prices to stabilise and potentially soften in 2023. However, this remains uncertain due to the general economic landscape and inflationary pressures on suppliers operating costs. |
||
|
Acquisitions The Group's growth strategy has included a number of acquisitions in recent years. There is a risk that such acquisitions may not be available on acceptable terms in the future. It is possible that acquisitions will not be successful due to the loss of key people or customers following acquisition or acquired businesses not performing at the level expected. This could potentially lead to impairment of the carrying value of the related goodwill and other intangible assets. Execution risks around the failure to successfully integrate acquisitions following conclusion of the earn-out period also exist. This is monitored through regular reporting of acquisition prospects and post-acquisition performance by executive management, with reporting to the Board. |
The Group carefully reviews potential acquisition targets, ensuring that the focus is on high-quality businesses which complement the Group's existing profile and provide good opportunities for growth. Having completed a number of acquisitions in recent years, the Group has well-established due diligence and integration processes and procedures, while only acquiring well-established quality businesses which will perform well in the Group. The Group's management information system enables effective monitoring of post-acquisition performance with earn-out mechanisms also mitigating risk in the post-acquisition period. Goodwill and other intangible assets are tested annually for impairment. |
No change ç è The Group has made 15 acquisitions since 2014, including one in 2022. The acquisition made in 2022 of PackMann, based in Germany, was the Group's first investment in Europe. This is inherently a higher risk acquisition due to cultural differences and less depth in local management expertise and support when compared to previous UK-based acquisitions. However, there are also important strategic opportunities for the Group in terms of extending service coverage for existing and new customers as well as integration synergies. The Group has a strong pipeline of potential protective packaging acquisition opportunities in both the UK and Northern Europe. |
||
|
Property The Group has a property portfolio comprising 1 owned site and 48 leased sites. This multi-site portfolio gives rise to risks in relation to ongoing lease costs, dilapidations and fluctuations in value. This risk is monitored on a regular basis and reported to the Board through internal reporting and input from external advisors. |
The Group adopts a proactive approach to managing property costs and exposures. Where a site is non-operational the Group seeks to assign, sell or sub-lease the building to mitigate the financial impact. If this is not possible, rental voids are provided on vacant properties taking into consideration the likely period of vacancy and incentives to re-let. The Group engages with external property advisers to assess the level of provisioning required for dilapidations and negotiate to minimise the final costs. |
No change ç è Our property consolidation strategy has continued during 2022. Work is ongoing to finalise exit costs following the expiry of two leases and there are known future exits from another five existing operating sites. Provisions have been established to cover the anticipated exit costs. The Group currently has no vacant or sub-let properties. |
||
|
Cyber-security The increasing frequency and sophistication of cyber-attacks is a risk which potentially threatens the confidentiality, integrity and availability of the Group's data and IT systems. These attacks could also cause reputational damage and fines in the event of personal data being compromised. This risk is monitored through an ongoing program of compliance and controls auditing with input from external advisors. |
The Group continually invests in its IT infrastructure to protect against cyber-security threats. This includes regular testing of IT Disaster Recovery Plans. We engage the services of a cyber-security partner to perform regular penetration tests to assess potential vulnerabilities within our security arrangements. This is complemented by a program of cyber-security awareness training to ensure that all staff are aware of the potential threats caused by deliberate and unauthorised attempts to gain access to our systems and data. |
No change ç è Remote working practices are the norm, with the Group adopting hybrid home/office flexibility for its employees. This is a feature within the Group's risk to cyber-security attacks. The Group continues to invest in prevention/detection software and education programmes to mitigate the risks of cyber-security attacks. The frequency and sophistication of cyber-attacks is anticipated to continue to evolve, and the Group is committed to continually investing in upgrading its' infrastructure to respond to the changing threats. |
||
|
Financial liquidity, debt covenants and interest rates The Group needs continuous access to funding to meet its trading obligations and to support organic growth and acquisitions. There is a risk that the Group may be unable to obtain funds and that such funds will only be available on unfavourable terms. The Group's borrowing facility comprises a committed facility of up to £30m. This includes requirements to comply with specified covenants, with a breach potentially resulting in Group borrowings being subject to more onerous conditions. |
The Group's borrowing facility comprises a committed facility of £30m with Lloyds Bank PLC, which finances our trading requirements and supports controlled expansion, providing a medium-term funding platform for growth. The Group regularly monitors net bank debt and forecast cash flows to ensure that it will be able to meet its financial obligations as they fall due. Compliance with covenants is monitored on a monthly basis and sensitivity analysis is applied to forecasts to assess the impact on covenant compliance. |
No change ç è The Group has proved to be strongly cash generative in 2022 and has operated well within its existing bank facilities throughout the year. Interest rates have increased from 2.00% at 31 December 2021 to 5.25% at 31 December 2022 and are expected to increase further in 2023. The increase in rates, which are in line with the market, do not increase the risk of the Group being unable to obtain funds and the Group operates well within the specific covenant related to interest i.e. 3 times EBITDA to interest. |
||
|
Working capital The Group has a significant investment in working capital in the form of trade receivables and inventories. There is a risk that this investment is not fully recovered. This risk is monitored through detailed reporting to local and executive management, which is reviewed in summary form by the Board. |
Credit risk is controlled by applying rigour to the management of trade receivables by Head of Credit Control and the credit control team and is subject to additional scrutiny from the Group Finance Director and Group Financial Controller in line with the Group's credit risk process. All aged debts are assessed using the Expected Credit Loss model, and appropriate provisions are made. Customers in sectors likely be significantly impacted by the current economic challenges, particularly those exposed to reduced consumer demand and significant increases in operating costs e.g. energy, fuel etc are closely monitored and where necessary actions taken to reduce exposure to potential bad debts or stock write-offs. Inventory levels and order patterns are regularly reviewed and risks arising from holding bespoke stocks are managed by obtaining order cover from customers. |
Increase é Bad debt write-offs in 2022 have increased from 2021, albeit still at a relatively low level. This is reflected in the Expected Credit Loss allowance being increased accordingly. Aged stock over 6 months old has increased in 2022 due to a slowdown in demand particularly from the e-commerce retail sector. The Group is working to reduce stock over 6 months and has invested in a new IT system, Slimstock to support this initiative. The current economic environment is likely to increase the risk of bad debts and stock write-offs in 2023, although management will continue to take all appropriate steps to mitigate this risk and limit the need for additional provisions or write-offs. |
||
|
Defined benefit pension scheme The Group's defined benefit pension scheme is sensitive to a number of key factors including investment returns, the discount rates used to calculate the scheme's liabilities and mortality assumptions. Small changes in these assumptions could cause significant movements in the pension surplus/deficit. This risk is monitored through regular input from external pension advisors, including six monthly IAS19 reviews and triennial actuarial valuations. |
The scheme was closed to new members in 2002. Benefits for active members were amended by freezing pensionable salaries at April 2009 levels. A Pension Increase Exchange option is available to offer flexibility to new pensioners in both the level of pension at retirement and the rate of future increases. The investment profile is regularly reviewed to ensure continued matching of investments with the scheme's liability profile. The scheme invests in Liability Driven Investments ("LDI") which hedge the scheme against movements in the discount rate and inflation. These are leveraged instruments which require active investments and divestments to maintain the level of leverage. The scheme was closed to future accrual during 2022. |
No change ç è The IAS 19 valuation of the Group's defined benefit pension scheme as at 31 December 2022 estimated the scheme surplus to be £10.2m, compared to a surplus of £8.3m at 31 December 2021. Deficit repair contributions were set at £1.3m per annum following the triennial actuarial valuation at 1 May 2020. The Group is committed to making these contributions until May 2024. The Group paid £0.7m into the scheme in 2022 to satisfy the debt agreed with the trustees in relation to the cessation of Macfarlane Labels Limited as a sponsoring employer. 2022 saw unprecedented levels of volatility in gilt markets. Longer dated yields rose from approximately 1.6% at the beginning of the year to 4.3% at the recent peak. Whilst this significantly decreased the schemes liabilities it required additional collateral payments into the LDIs to preserve the hedging the LDIs provide against movements in interest and inflation. The leverage on the LDIs was also lowered to reduce the likelihood of collateral calls from the scheme's LDI manager. |
||
|
Uncertain economic environment Due to a range of prolonged geopolitical and economic uncertainties within the UK and other markets, there is an increased risk that we are entering into a challenging trading environment. If this materialises, the length and depth of such an environment is unknown and may adversely affect our ability to deliver upon agreed strategic initiatives. We may also need to adapt our business quickly in order to limit the impact upon the Group's results, prospects and reputation. This risk is monitored through regular review of trading forecasts and market conditions, considered at executive management and Board level. |
A twice yearly viability assessment and sensitivity analyses is performed by management. The Group's borrowing facility comprises a committed facility of £30 million with Lloyds Bank PLC, which finances our trading requirements and supports controlled expansion, providing a medium-term funding platform for growth. The Group regularly monitors net bank debt and forecast cash flows to ensure that it will be able to meet its financial obligations as they fall due. Compliance with covenants is monitored on a monthly basis and sensitivity analysis is applied to forecasts to assess the impact on covenant compliance. The Group has scope to curtail capital expenditure and acquisition investment to preserve cash, if required. In the event of a significant reduction in customer demand the Group would take rigorous actions to reduce operating costs and working capital investment. |
Increase é New risk in 2022 It is predicted that the UK economy will experience a challenging economic environment during 2023. The Group could potentially experience a reduction in demand for its products in 2023 if the impact of rising costs of living and interest rates slows down the economy. The Group is experiencing rising operating costs particularly, energy, fuel and employee costs and increased interest rates. To mitigate this risk, executive management monitors monthly revenue and cost performance and market trends closely, and has detailed action plans to respond to any significant or prolonged trading pressures. |
||
|
|
|
|
|
|
There are a number of other risks that we manage which are not considered key risks. These are mitigated in ways common to all businesses and not specific to Macfarlane Group.
BUSINESS REVIEW
Viability statement
The Board is required to formally assess that the Group has adequate resources to continue in operational existence for the foreseeable future and as such can continue to adopt the going concern basis of accounting. The Board is also required to state that it has a reasonable expectation that the Group will continue in operation and meet its longer-term liabilities as they fall due.
To support this statement, the Board is required to consider the Group's current financial position, its strategy, the market outlook and its principal risks. The Board's assessment of the principal risks facing the Group and how these risks affect the Group's prospects are set out above. The review also includes consideration of how these risks could prevent the Group from achieving its strategic plan and the potential impact these risks could have on the Group's business model, future performance, solvency and liquidity over the next three years.
The Board considers the Group's viability as part of its ongoing programme to manage risk. Each year the Board reviews the Group's strategic plan for the forthcoming three-year period (starting from 1 January) and challenges the Executive team on the plan's risks. The plan reflects the Group's businesses, which have a broad spread of customers across a range of different sectors with some longer-term contracts in place. The assessment period of three years is consistent with the Board's review of the Group strategy, including assumptions around future growth rates for our business and acceptable levels of performance.
Financial modelling and scenarios
The Group's existing bank facilities comprise a £30m committed facility with Lloyds Banking Group, which is available until December 2025. The Group has performed well during 2022, despite the ongoing challenging market conditions, which gives confidence in the strength of the underlying business model. The Directors have also considered the longer-term economic outlook for the UK. Given the current uncertainty of the economic outlook we have modelled a 'severe but plausible downside' scenario as described below. In forming conclusions, the Directors have also considered potential mitigating actions that the Group could take to preserve liquidity and ensure compliance with its financial covenants.
A detailed financial model covering a three-year period is maintained and regularly updated. This model enables sensitivity analysis, which includes flexing the main assumptions, including future revenue growth, gross margins, operating costs, finance costs and working capital management. The results of flexing these assumptions, both individually and in aggregate, are used to determine whether additional bank facilities will be required during the three-year period and whether the Group will remain in compliance with the covenants relating to the current facility.
We have modelled a range of scenarios, including a central case, a downside scenario, a severe but plausible downside and a reverse stress test, over the three-year horizon. The 'severe but plausible downside' scenario is conservative in assuming, compared to the central case, revenue reductions of 10% and gross margin reductions at the rate of 2% in each of the three years, with no reduction in costs. Even under this scenario, and before reflecting any mitigating actions available to Group management, the Group forecasts compliance with all financial covenants throughout the period and would not require any additional sources of financing.
The Group has also modelled a reverse stress test scenario. This models the decline in sales that the Group would be able to absorb before breaching any financial covenants. Such a scenario, and the sequence of events that could lead to it, is considered to be remote, as it requires sales reductions of c.15% per annum between 2023 and 2025, compared to the central case, before there is a breach in financial covenants in the period under review and is calculated before reflecting any mitigating actions.
Even in the severe but plausible scenario, Macfarlane Group is forecast to have sufficient liquidity to continue trading, comfortably meeting its financial covenants and operating within the level of its facilities for the foreseeable future. The reverse stress test modelling has shown that a c.27% reduction in sales in 2023 compared to 2022 could lead to a breach of covenants in the period under review. However, in this scenario, management would also be able to take significant mitigating actions to reduces its costs and conserve cash.
Conclusions
For this reason, the Board considers it appropriate for the Group to adopt the going concern basis in preparing its financial statements.
The Board also has a reasonable expectation that the Group will continue in operation and meet its longer-term liabilities as they fall due.
Cautionary Statement
The Chair's Statement and the Business Review set out above have been prepared to provide additional information to members of the Company to assess the Group's strategy and the potential for the strategy to succeed. It should not be relied on by any other party or for any other purpose.
This report and the financial statements contain certain forward-looking statements relating to operations, performance and financial status. By their nature, such statements involve risk and uncertainty because they relate to events and depend upon circumstances that will occur in the future. There are a number of factors, including both economic and business risk factors that could cause actual results or developments to differ materially from those expressed or implied by these forward-looking statements.
These statements are made by the Directors in good faith based on the information available to them up to the time of their approval of this report. Nothing in this Preliminary Announcement should be construed as a profit forecast or an invitation to deal in the securities of the Group.
Responsibility Statement of the Directors
The responsibility statement below has been prepared in connection with the Company's full annual report for the year ending 31 December 2022. Certain parts of the full Annual Report are not included within this announcement.
The Directors of Macfarlane Group PLC are
A. Gulvanessian Chair (from 1 October 2022)
P.D. Atkinson Chief Executive
I. Gray Finance Director
R. McLellan Non-Executive Director and Senior Independent Director
J.W.F. Baird Non-Executive Director
L.D. Whyte Non-Executive Director (from 1 October 2022)
To the best of the knowledge of the Directors (whose names and functions are set out above), the financial statements, prepared in accordance with International Financial Reporting Standards, give a true and fair view of the assets, liabilities, financial position and profit for the Company and the undertakings included in the consolidation taken as a whole.
The Strategic Report, incorporated into the Directors' Report in the Annual Report, includes a fair review of the development and performance of the business and the position of the Company and the undertakings included in the consolidation taken as a whole, together with a description of the principal risks and uncertainties that they face; and
Pursuant to Disclosure and Transparency Rules, Chapter 4, the directors consider that the Company's annual report and financial statements, taken as a whole, are fair, balanced and understandable and provide information necessary for the shareholders to assess the Company's and the Group's position and performance, business model and strategy.
Peter Atkinson Ivor Gray
Chief Executive Finance Director
23 February 2023 23 February 2023
Macfarlane Group PLC
Consolidated income statement
For the year ended 31 December 2022
|
Note |
2022 £000 |
2021 £000 |
|
|
Continuing operations |
|||
|
Revenue |
3 |
290,431 |
264,465 |
|
Cost of sales |
(192,374) |
(174,998) |
|
|
|
|
||
|
Gross profit |
98,057 |
89,467 |
|
|
Distribution costs |
(10,736) |
(8,651) |
|
|
Administrative expenses |
(65,825) |
(60,761) |
|
|
|
|
||
|
Operating profit |
3 |
21,496 |
20,055 |
|
Finance costs |
4 |
(1,562) |
(1,390) |
|
|
|
||
|
Profit before tax |
19,934 |
18,665 |
|
|
Tax |
5 |
(4,210) |
(4,917) |
|
|
|
||
|
Profit for the year from continuing operations |
8 |
15,724 |
13,748 |
|
|
|
||
|
Discontinued operations Loss from discontinued operations |
6 |
(87) |
(1,150) |
|
|
|
||
|
Profit for the year |
15,637 |
12,598 |
|
|
|
|
||
Earnings per share from continuing operations |
|||
|
Basic |
8 |
9.94p |
8.71p |
|
|
|
||
|
Diluted |
8 |
9.84p |
8.62p |
|
|
|
||
Earnings per share from continuing and discontinued operations |
|||
|
Basic |
8 |
9.89p |
7.98p |
|
|
|
||
|
Diluted |
8 |
9.78p |
7.90p |
|
|
|
Consolidated statement of comprehensive income
For the year ended 31 December 2022
|
Note |
2022 £000 |
2021 £000 |
|
|
Items that may be reclassified to profit or loss |
|||
|
Foreign currency translation differences - foreign operations |
45 |
(120) |
|
|
Items that will not be reclassified to profit or loss |
|||
|
Remeasurement of pension scheme liability |
11 |
(82) |
8,212 |
|
Tax recognised in other comprehensive income |
|||
|
Tax on remeasurement of pension scheme liability Corporation tax rate change on deferred tax |
12 |
21 - |
(2,054) 88 |
|
|
|
||
|
Other comprehensive (expense)/income for the year, net of tax |
(16) |
6,126 |
|
|
Profit for the year |
15,637 |
12,598 |
|
|
|
|
||
|
Total comprehensive income for the year |
15,621 |
18,724 |
|
|
|
|
Macfarlane Group PLC
Consolidated statement of changes in equity
For the year ended 31 December 2022
|
Note |
Share Capital £000 |
Share Premium £000 |
Revaluation Reserve £000 |
Own Shares £000 |
Translation Reserve £000 |
Retained Earnings £000 |
Total £000 |
|
|
At 1 January 2021 |
39,453 |
13,148 |
70 |
- |
291 |
26,816 |
79,778 |
|
|
|
|
|
|
|
|
|
||
|
Comprehensive income |
||||||||
|
Profit for the year |
- |
- |
- |
- |
- |
12,598 |
12,598 |
|
|
Foreign currency translation differences |
- |
- |
- |
- |
(120) |
- |
(120) |
|
|
Remeasurement of pension liability |
11 |
- |
- |
- |
- |
- |
8,212 |
8,212 |
|
Tax on remeasurement of pension liability |
12 |
- |
- |
- |
- |
- |
(2,054) |
(2,054) |
|
Corporation tax rate change on deferred tax |
12 |
- |
- |
- |
- |
- |
88 |
88 |
|
|
|
|
|
|
|
|
||
|
Total comprehensive income |
- |
- |
- |
- |
(120) |
18,844 |
18,724 |
|
|
|
|
|
|
|
|
|
||
|
Transactions with shareholders |
||||||||
|
Dividends |
7 |
- |
- |
- |
- |
- |
(4,293) |
(4,293) |
|
Credit for share-based payments |
- |
- |
- |
- |
- |
685 |
685 |
|
|
|
|
|
|
|
|
|
||
|
Total transactions with shareholders |
- |
- |
- |
- |
- |
(3,608) |
(3,608) |
|
|
|
|
|
|
|
|
|
||
|
At 31 December 2021 |
39,453 |
13,148 |
70 |
- |
171 |
42,052 |
94,894 |
|
|
|
|
|
|
|
|
|
||
|
Comprehensive income |
||||||||
|
Profit for the year |
- |
- |
- |
- |
- |
15,637 |
15,637 |
|
|
Foreign currency translation differences |
- |
- |
- |
- |
45 |
- |
45 |
|
|
Remeasurement of pension liability |
11 |
- |
- |
- |
- |
- |
(82) |
(82) |
|
Tax on remeasurement of pension liability |
12 |
- |
- |
- |
- |
- |
21 |
21 |
|
|
|
|
|
|
|
|
||
|
Total comprehensive income |
- |
- |
- |
- |
45 |
15,576 |
15,621 |
|
|
|
|
|
|
|
|
|
||
|
Transactions with shareholders |
||||||||
|
Dividends |
7 |
- |
- |
- |
- |
- |
(5,102) |
(5,102) |
|
New shares issued |
131 |
425 |
- |
(7) |
- |
(549) |
- |
|
|
Credit for share-based payments |
- |
- |
- |
- |
- |
607 |
607 |
|
|
|
|
|
|
|
|
|
||
|
Total transactions with shareholders |
131 |
425 |
- |
(7) |
- |
(5,044) |
(4,495) |
|
|
|
|
|
|
|
|
|
||
|
|
|
|
|
|
|
|
||
|
At 31 December 2022 |
39,584 |
13,573 |
70 |
(7) |
216 |
52,584 |
106,020 |
|
|
|
|
|
|
|
|
|
||
Macfarlane Group PLC
Consolidated balance sheet at 31 December 2022
|
Note |
2022 £000 |
2021 £000 |
|
|
Non-current assets |
|||
|
Goodwill and other intangible assets |
75,685 |
74,902 |
|
|
Property, plant and equipment |
7,863 |
6,101 |
|
|
Right of Use assets |
33,938 |
34,718 |
|
|
Other receivables |
38 |
35 |
|
|
Deferred tax assets |
12 |
105 |
19 |
|
Retirement benefit obligations |
11 |
10,199 |
8,267 |
|
|
|
||
|
Total non-current assets |
127,828 |
124,042 |
|
|
|
|
||
|
Current assets |
|||
|
Inventories |
22,608 |
21,269 |
|
|
Trade and other receivables |
59,347 |
58,541 |
|
|
Current tax asset |
675 |
- |
|
|
Cash and cash equivalents |
10 |
5,706 |
12,315 |
|
|
|
||
|
Total current assets |
88,336 |
92,125 |
|
|
|
|
||
|
Total assets |
3 |
216,164 |
216,167 |
|
|
|
||
|
Current liabilities |
|||
|
Trade and other payables |
54,577 |
60,975 |
|
|
Provisions |
1,769 |
1,730 |
|
|
Current tax liability |
304 |
771 |
|
|
Lease liabilities |
10 |
6,641 |
6,364 |
|
Bank borrowings |
10 |
9,143 |
9,840 |
|
|
|
||
|
Total current liabilities |
72,434 |
79,680 |
|
|
|
|
||
|
Net current assets |
15,902 |
12,445 |
|
|
|
|
||
|
Non-current liabilities |
|||
|
Deferred tax liabilities |
12 |
8,222 |
7,472 |
|
Trade and other payables |
- |
3,695 |
|
|
Provisions |
1,560 |
1,848 |
|
|
Lease liabilities |
10 |
27,928 |
28,578 |
|
|
|
||
|
Total non-current liabilities |
37,710 |
41,593 |
|
|
|
|
||
|
Total liabilities |
3 |
110,144 |
121,273 |
|
|
|
||
|
Net assets |
106,020 |
94,894 |
|
|
|
|
||
|
Equity |
|||
|
Share capital |
13 |
39,584 |
39,453 |
|
Share premium |
13 |
13,573 |
13,148 |
|
Revaluation reserve |
70 |
70 |
|
|
Own shares |
(7) |
- |
|
|
Translation reserve |
216 |
171 |
|
|
Retained earnings |
52,584 |
42,052 |
|
|
|
|
||
|
Total equity |
3 |
106,020 |
94,894 |
|
|
|
Macfarlane Group PLC
Consolidated cash flow statement
For the year ended 31 December 2022
|
Note |
2022 £000 |
2021 £000 |
|
|
Profit/(loss) before tax from: |
|||
|
Continued operations |
19,934 |
18,665 |
|
|
Discontinued operations |
(87) |
(938) |
|
|
|
|
||
|
Total Operations |
19,847 |
17,727 |
|
|
Adjustments for: |
|||
|
Amortisation of intangible assets |
3,577 |
3,311 |
|
|
Impairment of goodwill in discontinued operations |
- |
987 |
|
|
Depreciation of property, plant and equipment and ROU assets |
9,040 |
9,271 |
|
|
Loss on disposal of property, plant and equipment |
71 |
43 |
|
|
Loss on disposal of subsidiaries |
87 |
232 |
|
|
Share-based payments |
607 |
685 |
|
|
Finance costs |
1,562 |
1,390 |
|
|
|
|
||
|
Operating cash flows before movements in working capital |
34,791 |
33,646 |
|
|
Decrease/(increase) in inventories |
1,025 |
(4,848) |
|
|
Decrease/(increase) in receivables |
285 |
(7,892) |
|
|
(Decrease)/increase in payables |
(9,027) |
8,905 |
|
|
(Decrease)/increase in provisions |
(249) |
1,884 |
|
|
Adjustment for pension scheme funding |
(1,838) |
(1,533) |
|
|
|
|
||
|
Cash generated by operations |
24,987 |
30,162 |
|
|
Income taxes paid |
(5,251) |
(4,975) |
|
|
Interest paid |
(1,738) |
(1,383) |
|
|
|
|
||
|
Cash inflow from operating activities |
17,998 |
23,804 |
|
|
|
|
||
|
Investing activities |
|||
|
Acquisitions, net of cash acquired |
9 |
(8,655) |
(12,238) |
|
Proceeds from sale of subsidiaries |
166 |
5,212 |
|
|
Proceeds on disposal of property, plant and equipment |
181 |
199 |
|
|
Purchases of property, plant and equipment |
(3,285) |
(2,132) |
|
|
|
|
||
|
Cash outflow from investing activities |
(11,593) |
(8,959) |
|
|
|
|
||
|
Financing activities |
|||
|
Dividends paid |
7 |
(5,102) |
(4,293) |
|
(Repayment)/drawdown on bank borrowing facility |
(865) |
3,889 |
|
|
Repayments of leases |
(7,215) |
(7,539) |
|
|
|
|
||
|
Cash outflow from financing activities |
(13,182) |
(7,943) |
|
|
|
|
||
|
Net (decrease)/increase in cash and cash equivalents |
(6,777) |
6,902 |
|
|
Cash and cash equivalents at beginning of year |
12,123 |
5,221 |
|
|
|
|
||
|
Cash and cash equivalents at end of year |
5,346 |
12,123 |
|
|
|
|
|
Reconciliation to consolidated cash flow statement |
2022 £000 |
2021 £000 |
|
|
Cash and cash equivalents per the consolidation balance sheet |
10 |
5,706 |
12,315 |
|
Bank overdraft |
(360) |
(192) |
|
|
|
|
||
|
Balances per consolidated cash flow statement |
5,346 |
12,123 |
|
|
|
|
Bank overdrafts are included in cash and cash equivalents because they form an integral part of the Group's cash management.
Macfarlane Group PLC
Notes to the financial information
For the year ended 31 December 2022
1. General information
The financial information set out herein does not constitute the Company's statutory accounts as defined in Section 435 of the Companies Act 2006 and has been extracted from the full statutory accounts for the years ended 31 December 2022 and 2021.
The financial statements for 2022 were approved by the Board of Directors on 23 February 2023. The auditor's report on the statutory financial statements for the year ended 31 December 2022 was unqualified pursuant to Section 498 of the Companies Act 2006 and did not contain a statement under sub-section 498 (2) or (3) of that Act.
The financial information for 2021 is derived from the statutory accounts for 2021 which have been delivered to the registrar of companies. The auditor has reported on the 2021 accounts; their report was (i) unqualified, (ii) did not include a reference to any matters to which the auditor drew attention by way of emphasis without qualifying their report and (iii) did not contain a statement under section 498 (2) or (3) of the Companies Act 2006.
2. Basis of preparation
The Group's business activities, together with the factors likely to affect its future development, performance and financial position are set out on set out above.
The Group's principal financial risks in the medium term relate to liquidity and credit risk. Liquidity risk is managed by ensuring that the Group's day-to-day working capital requirements are met by having access to committed banking facilities with suitable terms and conditions to accommodate the requirements of the Group's operations. Credit risk is managed by applying considerable rigour in managing the Group's trade receivables. The Directors believe that the Group is adequately placed to manage its financial risks effectively, despite any economic uncertainty.
The Group's has a committed borrowing facility of £30m with Lloyds Banking Group PLC in place until December 2025. The facility bears interest at normal commercial rates and carries standard financial covenants in relation to interest cover and levels of headroom over certain trade receivables of the Group.
The Directors are of the opinion that the Group's cash forecasts and revenue projections, which they believe are based on appropriate market data and past experience taking account of reasonably possible changes in trading performance given current market and economic conditions, show that the Group should be able to operate within the current facility and comply with its banking covenants. The Directors have modelled a range of scenarios, including a central case, a downside scenario, a severe but plausible downside and a reverse stress test, over the three-year horizon, as set out in the Viability statement on set out above.
After making enquiries, the directors have a reasonable expectation that the Company and the Group have adequate resources to continue in operational existence for at least the next twelve months. For this reason, they continue to adopt the going concern basis in preparing the financial statements for the year ended 31 December 2022.
Key sources of estimation uncertainty
The preparation of financial statements requires management to make estimates and assumptions that affect the amounts reported for assets and liabilities as at the balance sheet date and the amounts reported for revenues and expenses during the year. Due to the nature of estimation, the actual outcomes may well differ from these estimates. The directors have assessed the impact of climate change and consider that this does not have a significant impact on these financial statements. The key sources of estimation uncertainty that have a significant effect on the carrying amounts of assets and liabilities are discussed below:
Retirement benefit obligations
The determination of any defined benefit pension scheme liability is based on assumptions determined with independent actuarial advice. The key assumptions used include discount rate and inflation rate, for which a sensitivity analysis is provided in Note 11. The directors consider that those sensitivities represent reasonable sensitivities which could occur in the next financial year.
Macfarlane Group PLC
Notes to the financial information
For the year ended 31 December 2022
2. Basis of preparation (continued)
Key sources of estimation uncertainty (continued)
Valuation of trade receivables
The provision held against trade receivables is based on applying an expected credit loss model and related estimates of recoverable amounts. Whilst every attempt is made to ensure that the provision held against doubtful trade receivables is as accurate as possible, there remains a risk that the provision may not match the level of debt which ultimately proves uncollectable. For illustration only, an increase in the average default rate of overdue trade receivables from 1.44% to 2.43% above the historic loss rates observed would lead to an increase of £540,000 in the provision required.
Critical accounting judgements
Property provisions
Property provisions of £3.3m have been recognised as at 31 December 2022 (2021: £3.6m), representing the directors' best estimate of dilapidations on property leases. The directors have made the judgement that no provision is required for certain property leases where there is no intention to exit, having considered a number of factors including the extent of modifications to the property, the terms of the lease agreement, and the condition of the property.
No other significant critical judgements have been made in the current or prior year.
Alternative performance measures
In measuring the financial performance and position, the financial measures used in certain limited cases include those which have been derived from the reported results in order to eliminate factors which due to their unusual nature and size distort year-on-year comparisons to a material extent and/or provide useful information to stakeholders. Where such items arise, the directors will classify such items as separately disclosed non-recurring items and provide details of these items to enable users of the accounts to understand the impact on the financial statements.
To the extent that a measurement under Generally Accepted Accounting Principles ("GAAP") is adjusted for a separately disclosed non-recurring item, this is referred to as an Alternative Performance Measure ("APM"). We believe that the APM defined below, and the comparable GAAP measurement provides a useful basis for measuring the financial performance and position.
In addition to the various performance measures defined under IFRS the Group reports operating profit before amortisation as a measure to assist in understanding the underlying performance of the Group and its businesses when compared to similar companies. Operating profit before amortisation is not defined under IFRS and, as a result, does not comply with Generally Accepted Accounting Practice ("GAAP") and is therefore known as an alternative profit measure. Accordingly, this measure, which is not designed to be a substitute for any of the IFRS measures of performance, may not be directly comparable with other companies' alternative performance measures. Operating profit before amortisation is defined as operating profit before customer relationships and brand values amortisation reconciled in the table below.
|
Continuing operations |
2022 £000 |
2021 £000 |
|
Operating profit before amortisation |
25,073 |
23,366 |
|
Customer relationships/brand values amortisation |
(3,577) |
(3,311) |
|
|
|
|
|
Operating profit |
21,496 |
20,055 |
|
|
|
Net bank funds/(debt) also represents an Alternative Performance Measure as defined and reconciled to the statutory measure in note 10.
Macfarlane Group PLC
Notes to the financial information
For the year ended 31 December 2022
3. Segmental information
The Group's principal business segment is Packaging Distribution, comprising the distribution of packaging materials and supply of storage and warehousing services in the UK. This comprises over 85% of Group revenue and 80% of Group operating profit. The Group's Manufacturing Operations segment comprises the design, manufacture and assembly of timber, corrugated and foam-based packaging materials in the UK.
|
Continuing operations |
2022 £000 |
2021 £000 |
|
|
Group segment -Revenue |
|||
|
Packaging Distribution |
259,651 |
239,508 |
|
|
Manufacturing Operations |
35,045 |
28,527 |
|
|
Inter-segment revenue Manufacturing Operations |
(4,265) |
(3,570) |
|
|
|
|
||
|
External revenue |
290,431 |
264,465 |
|
|
|
|
|
Packaging Distribution |
19,868 |
19,697 |
|
|
Manufacturing Operations |
5,205 |
3,669 |
|
|
|
|
||
|
Operating profit before amortisation |
25,073 |
23,366 |
|
|
|
|
||
|
Packaging Distribution |
17,094 |
17,055 |
|
|
Manufacturing Operations |
4,402 |
3,000 |
|
|
|
|
||
|
Operating profit |
21,496 |
20,055 |
|
|
Finance costs |
(1,562) |
(1,390) |
|
|
|
|
||
|
Profit before tax |
19,934 |
18,665 |
|
|
Tax |
(4,210) |
(4,917) |
|
|
|
|
||
|
Profit for the year from continuing operations |
15,724 |
13,748 |
|
|
Loss for the year from discontinued operations |
(87) |
(1,150) |
|
|
|
|
||
|
Profit for the year |
15,637 |
12,598 |
|
|
|
|
||
|
Assets |
Liabilities |
Net assets |
|||
|
£000 |
£000 |
£000 |
|||
|
Group segments |
|||||
|
Packaging Distribution |
188,866 |
(102,937) |
85,929 |
||
|
Manufacturing Operations |
27,298 |
(7,207) |
20,091 |
||
|
|
|
|
|||
|
Net assets 2022 |
216,164 |
(110,144) |
106,020 |
||
|
|
|
|
|||
|
Assets |
Liabilities |
Net assets |
|||
|
£000 |
£000 |
£000 |
|||
|
Packaging Distribution |
185,111 |
(110,212) |
74,899 |
||
|
Manufacturing Operations |
31,056 |
(11,061) |
19,995 |
||
|
|
|
|
|||
|
Net assets 2021 |
216,167 |
(121,273) |
94,894 |
||
|
|
|
|
|||
|
|
|
|
|
|
|
Macfarlane Group PLC
Notes to the financial information
For the year ended 31 December 2022
3. Segmental information (continued)
|
2022 £000 |
2021 £000 |
|
|
Packaging Distribution |
||
|
Revenue |
259,651 |
239,508 |
|
Cost of sales |
(176,193) |
(161,896) |
|
|
|
|
Gross profit |
83,458 |
77,612 |
|
Net operating expenses |
(63,590) |
(57,915) |
|
|
|
|
|
Operating profit before amortisation |
19,868 |
19,697 |
|
Amortisation |
(2,774) |
(2,642) |
|
|
|
|
|
Operating Profit |
17,094 |
17,055 |
|
|
|
|
|
Manufacturing Operations |
2022 £000 |
2021 £000 |
|
Revenue |
30,780 |
24,957 |
|
Cost of sales |
(16,181) |
(13,102) |
|
|
|
|
Gross profit |
14,599 |
11,855 |
|
Net operating expenses |
(9,394) |
(8,186) |
|
|
|
|
|
Operating profit before amortisation |
5,205 |
3,669 |
|
Amortisation |
(803) |
(669) |
|
|
|
|
|
Operating profit |
4,402 |
3,000 |
|
|
|
|
4. Finance costs |
2022 £000 |
2021 £000 |
|
Interest on bank borrowings |
616 |
414 |
|
Interest on leases |
1,122 |
969 |
|
Net interest (income)/expense on retirement benefit obligation (see note 11) |
(176) |
7 |
|
|
|
|
|
Total finance costs from continuing operations |
1,562 |
1,390 |
|
|
|
Macfarlane Group PLC
Notes to the financial information
For the year ended 31 December 2022
|
5. Tax |
2022 £000 |
2021 £000 |
|
Current tax |
||
|
United Kingdom corporation tax at 19.0% |
3,680 |
3,672 |
|
Foreign tax |
253 |
245 |
|
Adjustments in respect of prior years |
(21) |
72 |
|
|
|
|
|
Total current tax |
3,912 |
3,989 |
|
|
|
|
|
Deferred tax |
||
|
Current year |
207 |
1,140 |
|
Adjustments in respect of prior years |
91 |
- |
|
|
|
|
|
Total deferred tax (see note 12) |
298 |
1,140 |
|
|
|
|
|
Total tax charge |
4,210 |
5,129 |
|
|
|
The standard rate of tax based on the UK average rate of corporation tax is 19.0%. Taxation for other jurisdictions is calculated at the rates prevailing in these jurisdictions.
The actual tax charge for the current and previous year varies from the standard rate of tax on the results in the consolidated income statement for the reasons set out in the following reconciliation:-
|
2022 £000 |
2021 £000 |
|
|
Profit before tax from continuing operations |
19,934 |
18,665 |
|
Loss before tax from discontinued operations |
(87) |
(938) |
|
|
|
|
|
Profit before tax from total operations |
19,847 |
17,727 |
|
|
|
|
|
Tax on profit at 19.0% |
3,771 |
3,368 |
|
Factors affecting tax charge for the year:- |
||
|
Change in rate for deferred tax from 19% to 25% |
- |
1,282 |
|
Difference in rate for deferred tax (25%) on pensions |
120 |
- |
|
Non-deductible expenses |
189 |
408 |
|
Difference on overseas tax rates |
60 |
(37) |
|
Changes in estimates related to prior years |
70 |
108 |
|
|
|
|
|
Tax charge for the year |
4,210 |
5,129 |
|
|
|
|
|
Tax attributable to continuing operations |
4,210 |
4,917 |
|
Tax attributable to discontinued operations |
- |
212 |
|
|
|
|
|
Tax charge for the year |
4,210 |
5,129 |
|
|
|
|
|
Effective rate of tax for the year |
21.2% |
28.9% |
|
|
|
Macfarlane Group PLC
Notes to the financial information
For the year ended 31 December 2022
6. Discontinued Operations
On 31 December 2021, the Group entered into a sale agreement to dispose of Macfarlane Labels Limited and its subsidiaries Macfarlane Group Ireland (Labels & Packaging) Limited and Macfarlane Group Sweden AB (collectively "Macfarlane Labels"). Macfarlane Labels designs and prints high quality self-adhesive and resealable labels, principally for FMCG companies. The proceeds from the sale have been strategically invested in the continuing growth of the Group's protective packaging businesses.
The results of the discontinued operations, which have been included as a single item of loss from discontinued operations for the year, were as follows:
|
2022 £000 |
2021 £000 |
|
|
Revenue |
- |
21,220 |
|
Expenses |
(87) |
(22,158) |
|
|
|
|
|
Loss before tax |
(87) |
(938) |
|
Attributable tax expense |
- |
(212) |
|
|
|
|
|
Loss after tax |
(87) |
(1,150) |
|
|
|
Macfarlane Group PLC
Notes to the financial information
For the year ended 31 December 2022
|
7. Dividends |
2022 £000 |
2021 £000 |
|
Amounts recognised as distributions to equity holders in the year: |
||
|
Final dividend for the year ended 31 December 2021 of 2.33 per share (2020 - 1.85p per share) |
3,677 |
2,920 |
|
Interim dividend for the year ended 31 December 2022 of 0.90p per share (2021 - 0.87p per share) |
1,425 |
1,373 |
|
|
|
|
|
5,102 |
4,293 |
|
|
|
|
A proposed dividend of 2.52p per share will be paid on 1 June 2023 to those shareholders on the register at 12 May 2023. This is subject to approval by shareholders at the Annual General Meeting on 9 May 2023 and therefore has not been included as a liability in these financial statements.
8. Earnings per share
The calculation of the basic and diluted earnings per share is based on the following data:
|
2022 £000 |
2021 £000 |
|
|
Earnings for the purposes of earnings per share Profit for the year from continuing operations |
15,724 |
13,748 |
|
|
|
|
|
Loss from discontinued operations |
(87) |
(1,150) |
|
|
|
|
|
Profit for the year from continuing and discontinued operations |
15,637 |
12,598 |
|
|
|
|
|
Number of shares in issue for the purposes of calculating basic and diluted earnings per share |
2022 No. of shares '000 |
2021 No. of shares '000 |
|
Weighted average number of shares in issue for the purposes of basic earnings per share |
||
|
Weighted average number of shares in issue |
158,162 |
157,812 |
|
Effect of Long-Term Incentive Plan awards in issue |
1,661 |
1,627 |
|
|
|
|
|
Weighted average number of shares in issue for the purposes of calculating diluted earnings per share |
159,823 |
159,439 |
|
|
|
|
|
Basic Earnings per share from continuing operations |
9.94p |
8.71p |
|
|
|
|
|
Diluted Earnings per share from continuing operations |
9.84p |
8.62p |
|
|
|
|
|
Basic Earnings per share from discontinued operations |
(0.06)p |
(0.73)p |
|
|
|
|
|
Diluted Earnings per share from discontinued operations |
(0.05)p |
(0.72)p |
|
|
|
|
|
Basic Earnings per share from continuing and discontinued operations |
9.89p |
7.98p |
|
|
|
|
|
Diluted Earnings per share from continuing and discontinued operations |
9.78p |
7.90p |
|
|
|
Macfarlane Group PLC
Notes to the financial information
For the year ended 31 December 2022
9. Acquisitions
On 17 May 2022, Macfarlane Group PLC acquired 100% of PackMann Gessellschaft für Verpackungen und Dienstleistungen mbH ("PackMann"), for a maximum consideration, excluding cash/bank balances and bank borrowings acquired, of £7.4m. £5.9m was paid in cash on acquisition, in addition to cash/bank balances and bank borrowings retained by Macfarlane Group PLC, and the deferred consideration of £1.5m is payable in the second quarters of 2023 and 2024, subject to certain trading targets being met in the two twelve-month periods ending on 31 May 2023 and 2024 respectively. The trading targets set for the two twelve month periods are an enhancement over the profit levels being achieved in the period prior to acquisition and they are considered unlikely to be achieved. Therefore the directors do not consider it probable that deferred consideration will be payable. A recovery for closing balance sheet adjustments of £0.6m was received on 30 August 2022.
£2.2m was paid in 2022 to the sellers of GWP Holdings Limited, acquired in 2021, as the profit target was met for the twelve month period ending 28 February 2022 and deferred consideration of £2.9m is payable in the first quarter of 2023, subject to profit targets being met in the twelve-month period ending 28 February 2023.
£0.7m was paid in 2022 to the sellers of Carters (Cornwall) Limited, acquired in 2021, as the profit target was met for the twelve month period ending 31 March 2022 and deferred consideration of £0.8m is payable in the second quarter of 2023, subject to profit targets being met in the twelve-month period ending 31 March 2023.
Contingent considerations are recognised as a liability in trade and other payables and are remeasured to fair value of £3.7m at the balance sheet date based on a range of outcomes between £Nil and £5.2m. Trading in the post-acquisition period supports the remeasured value of £3.7m.
The impact of the acquisition of PackMann on 2022 results was revenue for the year of £7.8m and profit of £0.2m. If the PackMann acquisition had been completed on the first day of 2022, revenues for the year would have been £13.4m and profit would have been £0.3m.
Fair values assigned to net assets acquired and consideration paid and payable are set out below:-
Macfarlane Group PLC
Notes to the financial information
For the year ended 31 December 2022
9. Acquisitions (continued)
Fair values assigned to net assets acquired and consideration paid and payable are set out below:-
|
|
2022 £000 |
||
|
Net assets acquired |
|||
|
Other intangible assets |
1,386 |
||
|
Property, plant and equipment |
1,770 |
||
|
Inventories |
2,364 |
||
|
Trade and other receivables |
1,347 |
||
|
Cash and bank balances |
290 |
||
|
Bank borrowings |
(730) |
||
|
Trade and other payables |
(1,899) |
||
|
Current tax liabilities |
(196) |
||
|
Lease liabilities |
(1,634) |
||
|
Deferred tax liabilities (see note 12) |
(387) |
||
|
|
|||
|
Net assets acquired |
2,311 |
||
|
Goodwill arising on acquisition |
2,974 |
||
|
|
|||
|
Total consideration |
5,285 |
||
|
Contingent consideration on acquisitions |
|||
|
Prior years |
2,930 |
||
|
|
|||
|
Cash consideration |
8,215 |
||
|
|
|||
|
Cash consideration |
(8,215) |
||
|
Cash and bank balances acquired |
(440) |
||
|
|
|||
|
Net cash outflow |
(8,655) |
||
|
|
|||
|
|
|
|
|
Macfarlane Group PLC
Notes to the financial information
For the year ended 31 December 2022
10. Analysis of changes in net debt
|
Cash &cash equivalents £000 |
Bank borrowing £000 |
Lease liabilities £000 |
Total debt £000 |
|
|
At 1 January 2022 |
12,315 |
(9,840) |
(34,942) |
(32,467) |
|
Cash movements |
(6,609) |
697 |
7,215 |
1,303 |
|
Non-cash movements |
||||
|
New leases Acquisitions Disposal Lease modifications |
- - - - |
- - - - |
(4,546) (1,634) 237 (899) |
(4,546) (1,634) 237 (899) |
|
|
|
|
|
|
|
At 31 December 2022 |
5,706 |
(9,143) |
(34,569) |
(38,006) |
|
|
|
|
|
|
Net bank funds 2022 |
5,706 |
(9,143) |
(3,437) |
|
|
Net bank debt 2021 |
12,315 |
(9,840) |
2,475 |
Cash and cash equivalents (which are presented as a single class of asset on the face of the balance sheet) comprise cash at bank and other short-term highly liquid investments with maturity of three months or less.
11. Pension scheme
Macfarlane Group PLC sponsors a defined benefit pension scheme for former UK employees - the Macfarlane Group PLC Pension & Life Assurance Scheme (1974) ("the Scheme"). One of the trading subsidiaries, Macfarlane Group UK Limited is also a sponsoring employer of the Scheme. Macfarlane Labels Limited was a sponsoring employer until 31 December 2021 when the company was sold and ceased to be a sponsoring member. The Group paid £0.7m into the pension scheme in 2022 to satisfy the debt agreed with the trustees in relation to the cessation of Macfarlane Labels Limited as a sponsoring employer. The Scheme is currently in surplus and disclosure of the respective proportions of the Group surplus are included and disclosed in the financial statements of each of the two participating employers.
The Scheme is an HMRC registered pension scheme, administered by a Board of Trustees composed of employer-nominated representatives and member-nominated Trustees which is legally separate from the Group. The Scheme's investments are held separately from those of the Group in managed funds under the supervision of the Trustees. The Trustees are required by law to act in the interest of all classes of beneficiary in the Scheme and are responsible for investment policy and the administration of benefits. Macfarlane Group PLC, based on legal opinion provided, has an unconditional right to a refund of surplus assets assuming the full settlement of plan liabilities in the event of a wind up of the Scheme. Furthermore, in the ordinary course of business the trustees have no rights to unilaterally wind up the Scheme, or otherwise augment the benefits due to members of the Scheme. Based on these rights, any net surplus in the Scheme is recognised in full.
The Scheme provides qualifying employees with an annual pension of 1/60 of pensionable salary for each completed years' service on attainment of a normal retirement age of 65. Pensionable salaries were frozen for the remaining active members at the levels current at 30 April 2009 with the change taking effect from 30 April 2010. As a result no further salary inflation applies for active members who elected to remain in the Scheme. Active members' benefits also include life assurance cover, with the payment of these benefits at the discretion of the Trustees of the Scheme. The Scheme was closed to new entrants during 2002. The Scheme was closed to future accrual on 30 November 2022 with the 3 remaining active members transferring to the Group's defined contribution pension scheme.
Macfarlane Group PLC
Notes to the financial information
For the year ended 31 December 2022
11. Pension scheme (continued)
On leaving active service a deferred member's pension is revalued from the time of withdrawal until the pension is drawn. Revaluation in deferment is statutory and since 2010 has been revalued on the Consumer Price Index ("CPI") measure of inflation. Revaluation of pensions in payment is a blend of fixed increases and inflationary increases depending on the relevant periods of accrual of benefit. For pensions in payment, the inflationary increase is currently based on the Retail Price Index ("RPI") measure of inflation or based on Limited Price Indexation ("LPI") for certain defined periods of service.
During 2012, Macfarlane Group PLC agreed with the Board of Trustees to amend benefits for pensioner, deferred and active members in the Scheme by offering a Pension Increase Exchange ("PIE") option to pensioner members and a PIE option to all other members at retirement after 1 May 2012.
Balance sheet disclosures
The fair value of scheme investments, the present value of scheme liabilities and expected rates of return are based on the provisional results of the actuarial valuation as at 1 May 2020, updated to the year-end.
|
2022 £000 |
2021 £000 |
|
|
Investment class |
||
|
Equities |
20,287 |
26,402 |
|
Multi-asset diversified funds |
12,674 |
29,113 |
|
Liability-driven investment funds |
23,352 |
30,531 |
|
Secured property income fund |
5,670 |
6,995 |
|
European loan fund |
6,546 |
6,778 |
|
Other (cash and similar assets) |
1,957 |
604 |
|
|
|
|
|
Fair value of Scheme investments |
70,486 |
100,423 |
|
Present value of Scheme liabilities |
(60,287) |
(92,156) |
|
|
|
|
|
Scheme surplus |
10,199 |
8,267 |
|
|
|
The Trustees review the investments of the Scheme on a regular basis and consult with the Company regarding any proposed changes to the investment profile. Liability-Driven Investment Funds are intended to provide a match of 100% against the impact of movements in inflation on pension liabilities and against the impact of movements in interest-rates on pension liabilities. During 2022 adjustments were made between investments to maintain the overall allocations in line with the Trustees' strategic asset allocation.
The ability to realise the Scheme's investments at, or close to, fair value was considered when setting the investment strategy. 83% (2021: 86%) of the Scheme's investments can be realised at fair value on a daily or weekly basis. The remaining assets have monthly or quarterly liquidity, however, whilst the income from these helps to meet the Scheme's cash flow needs, they are not expected to require to be realised at short notice.
The present value of the Scheme liabilities is derived from cash flow projections over a long period of time and is thus inherently uncertain.
Macfarlane Group PLC
Notes to the financial information
For the year ended 31 December 2022
11. Pension scheme (continued)
The Scheme's liabilities were calculated on the following bases as required under IAS 19:
Assumptions |
2022 |
2021 |
|
Discount rate |
4.80% |
1.90% |
|
Rate of increase in salaries |
0.00% |
0.00% |
|
Inflation assumption (RPI) |
3.40% |
3.40% |
|
Inflation assumption (CPI) |
2.80% |
2.90% |
|
Life expectancy beyond normal retirement age of 65 |
||
|
Male currently aged 55 (years) |
22.6 |
22.8 |
|
Female currently aged 55 (years) |
24.2 |
24.4 |
|
Male currently aged 65 (years) |
22.0 |
22.3 |
|
Female currently aged 65 (years) |
23.4 |
23.6 |
|
2022 |
2021 |
|
|
Movement in scheme surplus/(deficit) |
£000 |
£000 |
|
At 1 January |
8,267 |
(1,471) |
|
Current service costs |
(42) |
(126) |
|
Past service cost (curtailed due to closure of scheme/disposal of business) |
(111) |
(333) |
|
Employer contributions |
1,991 |
1,992 |
|
Net finance income/(cost) (see note 4) |
176 |
(7) |
|
Remeasurement of pension scheme liability |
(82) |
8,212 |
|
|
|
|
|
At 31 December |
10,199 |
8,267 |
|
|
|
Funding
UK pension legislation requires that pension schemes are funded prudently. Following the triennial actuarial valuation of the Scheme at 1 May 2020, the Company agreed a new schedule of contributions with the Pension Scheme Trustees, which assumed a recovery plan period of 4 years. The next triennial actuarial valuation is due at 1 May 2023.
Sensitivity to key assumptions
The key assumptions used for IAS 19 are discount rate, inflation and mortality. If different assumptions were used, then this could have a material effect on the results disclosed. Assuming all other assumptions are held static then a movement in the following key assumptions would affect the level of the deficit as shown below:-
|
Assumptions |
2022 £000 |
2021 £000 |
|
Discount rate movement of +3.0% |
14,101 |
28,740 |
|
Inflation rate movement of +0.25% |
(375) |
(765) |
|
Mortality movement of +0.1 year in age rating |
88 |
180 |
Positive figures reflect a reduction in the Scheme liabilities and therefore a reduction in the Scheme deficit or increase in the Scheme surplus. The sensitivity information has been prepared using the same method as adopted when adjusting the results of the latest funding valuation to the balance sheet date and is consistent with the approach adopted in previous years.
The sensitivities shown reflect average movements in the assumptions in the last three years. All information assumes that the average duration of Scheme liabilities is twelve years.
Macfarlane Group PLC
Notes to the financial information
For the year ended 31 December 2022
|
12. Deferred tax |
2022 £000 |
2021 £000 |
|
At 1 January |
(7,453) |
(2,676) |
|
Transfer to Corporation Tax |
- |
(168) |
|
Acquisitions |
(387) |
(1,875) |
|
Disposals |
- |
372 |
|
Charged in income statement (see note 5) |
(298) |
(1,140) |
|
Credited/(Charged) in other comprehensive income Remeasurement of pension scheme liability Corporation tax rate change |
21 - |
(2,054) 88 |
|
|
|
|
|
At 31 December |
(8,117) |
(7,453) |
|
|
|
|
|
Deferred tax assets |
||
|
On accelerated capital allowances/timing differences |
94 |
- |
|
Corporation tax losses |
11 |
19 |
|
|
|
|
|
Disclosed as deferred tax assets |
105 |
19 |
|
|
|
|
|
Deferred tax liabilities |
||
|
On accelerated capital allowances/timing differences |
(908) |
(338) |
|
On retirement benefit obligations |
(2,551) |
(2,069) |
|
On other intangible assets |
(4,763) |
(5,065) |
|
|
|
|
|
Disclosed as deferred tax liabilities |
(8,222) |
(7,472) |
|
|
|
|
|
|
|
|
|
At 31 December |
(8,117) |
(7,453) |
|
|
|
|
13. Share capital |
2022 £000 |
2021 £000 |
|
Allotted, issued and fully paid: |
||
|
At 1 January |
39,453 |
39,453 |
|
New shares issued |
131 |
- |
|
|
|
|
|
At 31 December |
39,584 |
39,453 |
|
|
|
|
|
Share premium |
||
|
At 1 January |
13,148 |
13,148 |
|
New shares issued |
425 |
- |
|
|
|
|
|
At 31 December |
13,573 |
13,148 |
|
|
|
The Company has one class of ordinary shares of 25p each, which carry no right to fixed income. Each ordinary share carries one vote in any General Meeting of the Company.
On 16 May 2022, the Company issued 525,000 ordinary shares of 25p at a value of 106.00p to settle 2019 share awards under the Company's 2016 Performance Share Plan.
Macfarlane Group PLC
Notes to the financial information
For the year ended 31 December 2022
14. Related party transactions
Transactions between the Company and its subsidiaries, which are related parties, have been eliminated on consolidation and are not disclosed.
Details of individual and collective remuneration of the Company's Directors and dividends received by the Directors for calendar year 2022 will be disclosed in the Group's 2022 Annual Report and Accounts.
The directors are satisfied that there are no other related party transactions occurring during the year which require disclosure.
15. Post balance sheet events
There are no post balance sheet events to be disclosed.
16. Posting to shareholders and Annual General Meeting
The Annual Report and Accounts will be sent to shareholders on Friday 31 March 2023 and will be available to members of the public at the Company's Registered Office from Friday 21 April 2023.
The Annual General Meeting will take place at 12 noon on Tuesday 9 May 2023.