Sun Healthcare — Investor Presentation (November 2006)
25 slides from Sun Healthcare's investor presentation, Nov 8, 2006
Slide 1: Investor Presentation
Investor Presentation Presented by: Rick Matros, Chief Executive Officer Bryan Shaul, Chief Financial Officer
Slide 2: Forward Looking Statements
Forward Looking Statements Statements made in this presentation may contain "forward-looking" information, such as forecasts of future financial performance. Such statements involve risks and uncertainties and are subject to change at any time. Factors that could cause actual results to differ mater
Slide 3: Company Overview
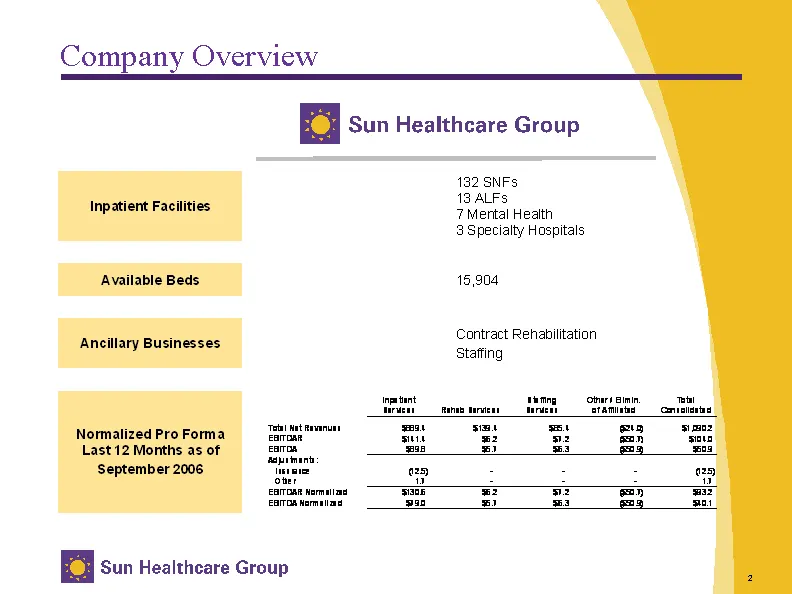
Company Overview @; Sun Healthcare Group Inpatient Facilities Available Beds Ancillary Businesses “oat evant Normalized Pro Forma mre Last 12 Months as of sarah September 2006 & Sun Healthcare Group 132 SNFS 13 ALFs 7 Mental Health 3 Specialty Hospitals, 16,904 Contract Rehabilitation Staffing Conar
Slide 4: Sun Recent Events
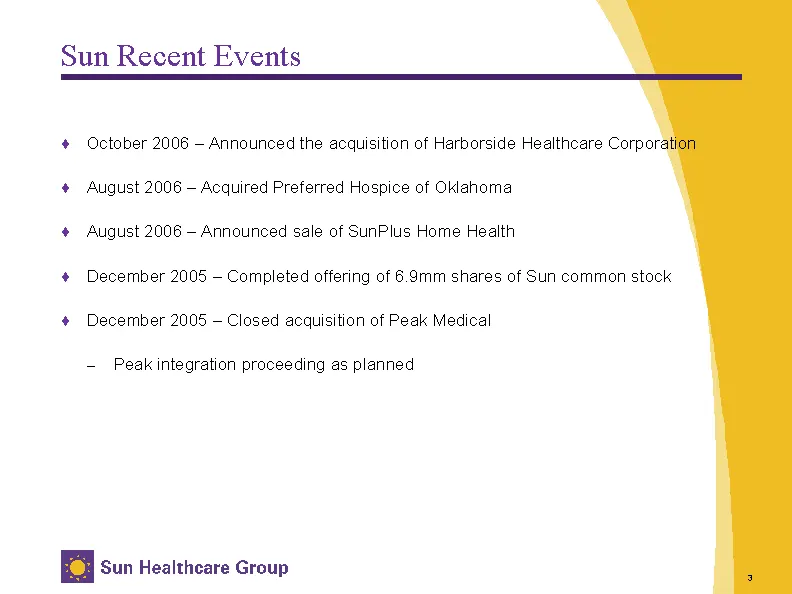
Sun Recent Events October 2006 - Announced the acquisition of Harborside Healthcare Corporation August 2006 - Acquired Preferred Hospice of Oklahoma August 2006 - Announced sale of SunPlus Home Health December 2005 - Completed offering of 6.9mm shares of Sun common stock December 2005 - Closed acqui
Slide 5: 2006 Initiatives
2006 Initiatives Improvement of same store sales with focus on high acuity patients Execution of process improvement initiative Continued focus on opportunities to improve balance sheet Value creation through continued assessment of existing portfolio Pursuit of appropriate acquisition opportunities
Slide 6: Q3 Highlights
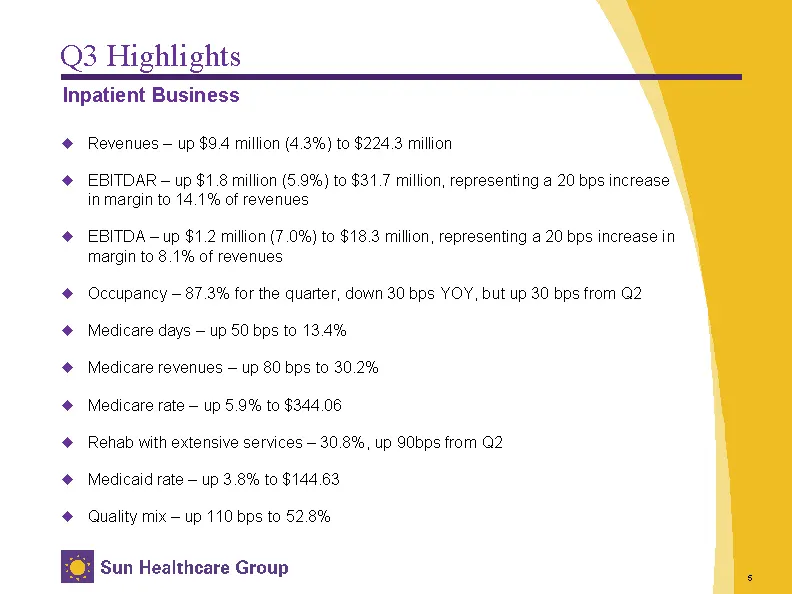
Q3 Highlights Revenues - up $9.4 million (4.3%) to $224.3 million EBITDAR - up $1.8 million (5.9%) to $31.7 million, representing a 20 bps increase in margin to 14.1% of revenues EBITDA - up $1.2 million (7.0%) to $18.3 million, representing a 20 bps increase in margin to 8.1% of revenues Occupancy
Slide 7: Medicare Revenue
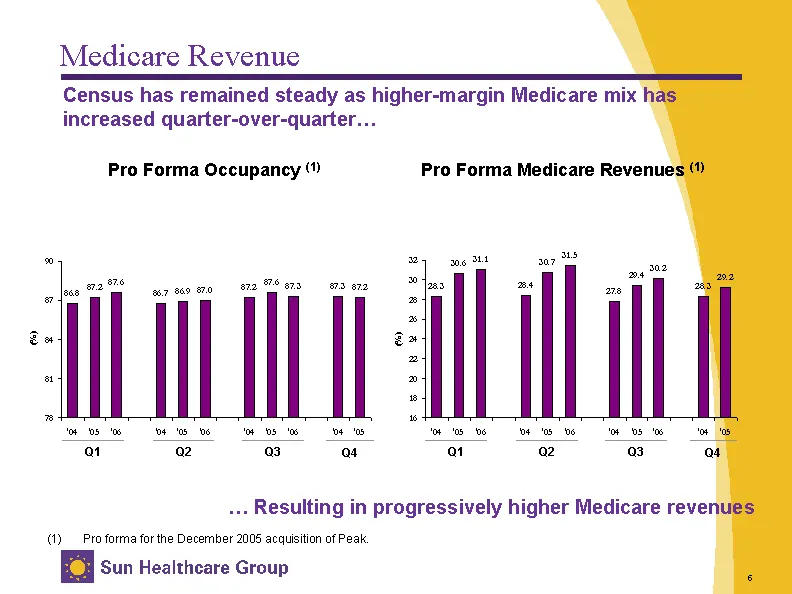
Medicare Revenue Pro Forma Occupancy (1) Pro Forma Medicare Revenues (1) Census has remained steady as higher-margin Medicare mix has increased quarter-over-quarter... .... Resulting in progressively higher Medicare revenues Q1 Q4 Q2 Q3 Q4 Q2 Q3 Pro forma for the December 2005 acquisition of Peak.
Slide 8: High Acuity Strategy
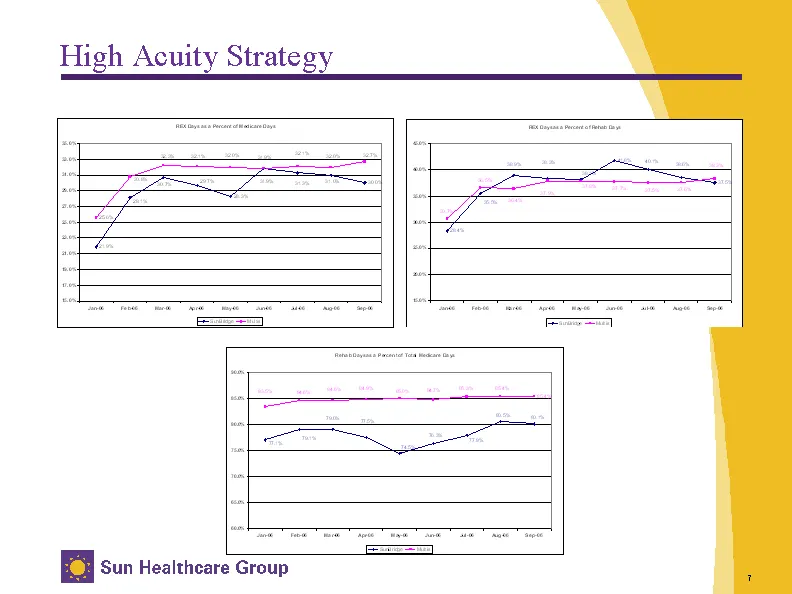
High Acuity Strategy & Sun Healthcare Group
Slide 9: Inpatient Locations
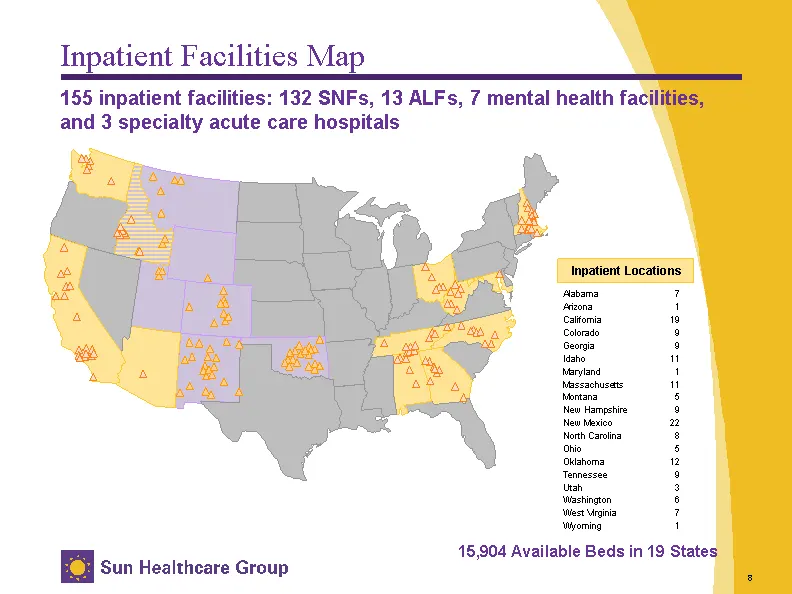
Inpatient Locations Alabama 7 Arizona 1 California 19 Colorado 9 Georgia 9 Idaho 11 Maryland 1 Massachusetts 11 Montana 5 New Hampshire 9 New Mexico 22 North Carolina 8 Ohio 5 Oklahoma 12 Tennessee 9 Utah 3 Washington 6 West Virginia 7 Wyoming 1 15,904 Available Beds in 19 States Inpatient Facilitie
Slide 10: Ancillary Businesses - How Do We Create Value? (Rehab)
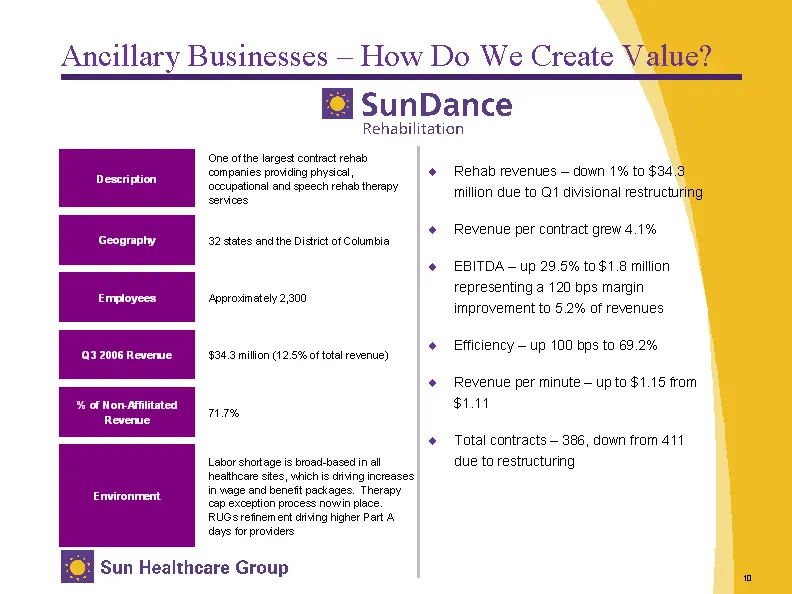
Ancillary Businesses - How Do We Create Value? Rehab revenues - down 1% to $34.3 million due to Q1 divisional restructuring Revenue per contract grew 4.1% EBITDA - up 29.5% to $1.8 million representing a 120 bps margin improvement to 5.2% of revenues Efficiency - up 100 bps to 69.2% Revenue per minu
Slide 11: Ancillary Businesses - How Do We Create Value? (Staffing)
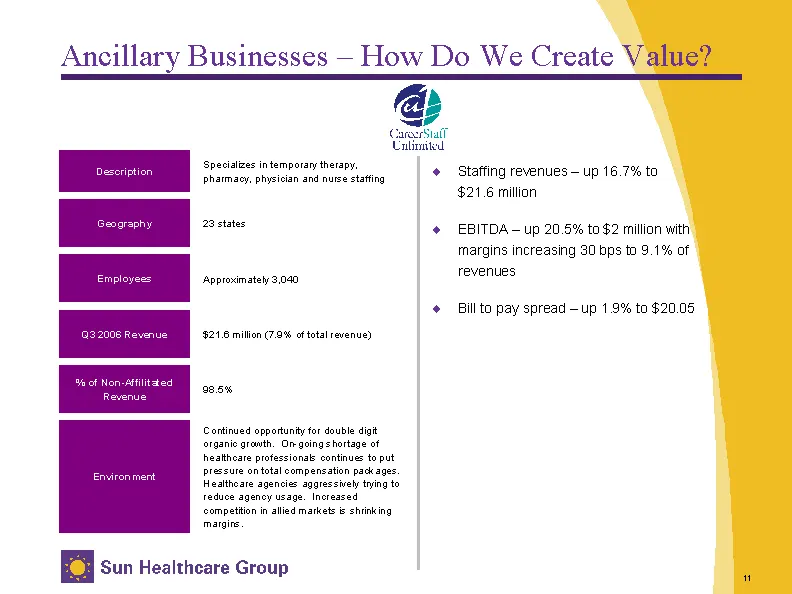
Ancillary Businesses - How Do We Create Value? Staffing revenues - up 16.7% to $21.6 million EBITDA - up 20.5% to $2 million with margins increasing 30 bps to 9.1% of revenues Bill to pay spread - up 1.9% to $20.05
Slide 12: Ancillary Services Map
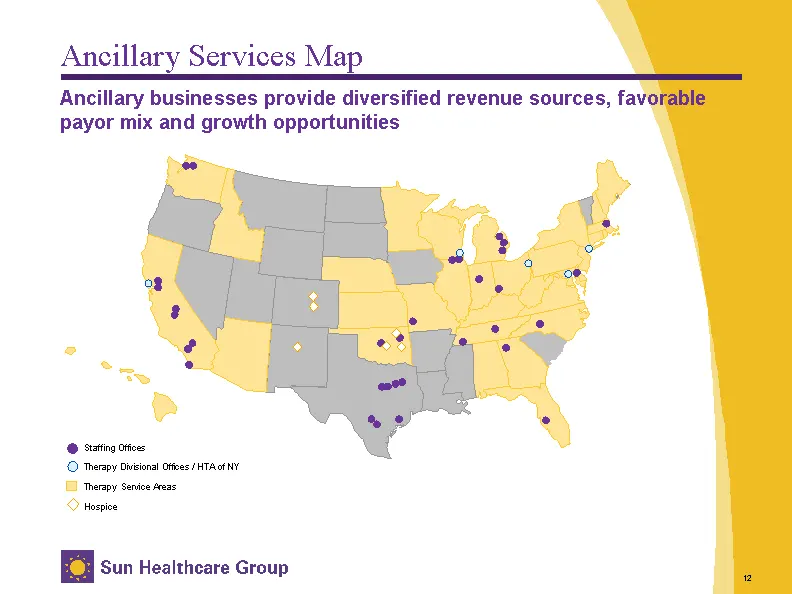
Ancillary Services Map Ancillary businesses provide diversified revenue sources, favorable payor mix and growth opportunities Staffing Offices Therapy Divisional Offices / HTA of NY Therapy Service Areas Hospice
Slide 13: Harborside Acquisition
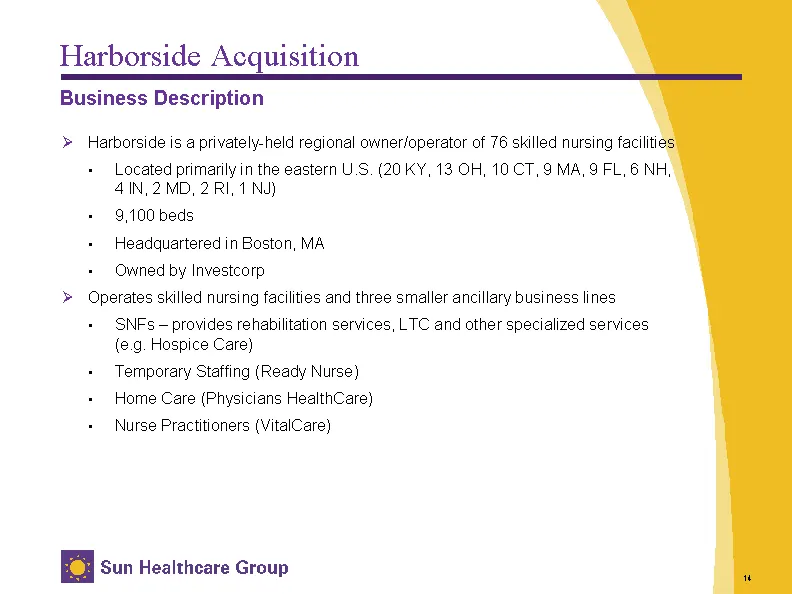
Harborside Acquisition Harborside is a privately-held regional owner/operator of 76 skilled nursing facilities Located primarily in the eastern U.S. (20 KY, 13 OH, 10 CT, 9 MA, 9 FL, 6 NH, 4 IN, 2 MD, 2 RI, 1 NJ) 9,100 beds Headquartered in Boston, MA Owned by Investcorp Operates skilled nursing fac
Slide 14: Harborside Acquisition - Transaction Rationale
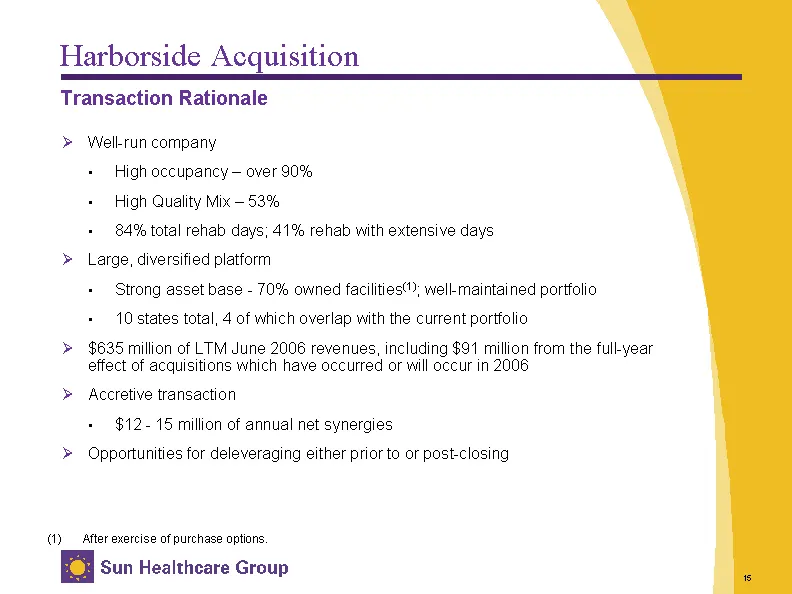
Harborside Acquisition Well-run company High occupancy - over 90% High Quality Mix - 53% 84% total rehab days; 41% rehab with extensive days Large, diversified platform Strong asset base - 70% owned facilities(1); well-maintained portfolio 10 states total, 4 of which overlap with the current portfol
Slide 15: Harborside Acquisition Pro Forma Long-Term Care Portfolio
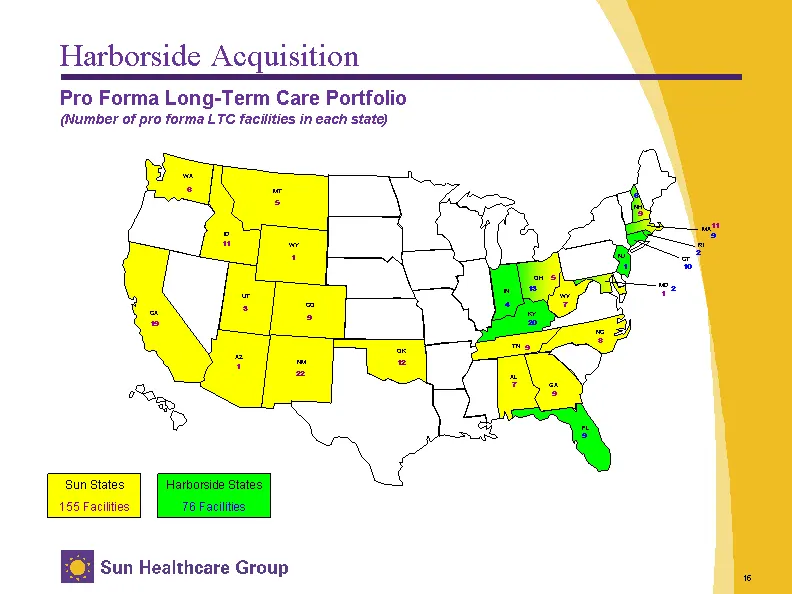
Harborside Acquisition Pro Forma Long-Term Care Portfolio (Number of pro forma LTC facilities in each state) CA GA AL TN NC WV OH MD 7 19 9 1 11 8 5 7 9 AZ 1 ID 11 9 NH 6 WA NM 22 OK 12 CO 9 MT 5 WY 1 UT 3 Harborside States 76 Facilities Sun States 155 Facilities FL KY 9 20 NJ 1 CT 10 2 9 6 RI 2 13
Slide 16: Harborside Acquisition Transaction Summary
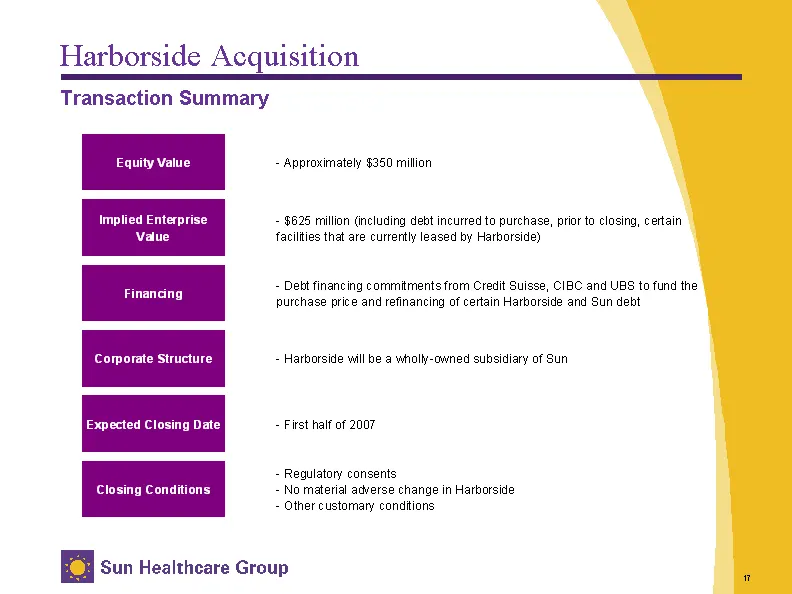
Harborside Acquisition Transaction Summary
Slide 17: Financials
Financials (1) Excludes Home Health.
Slide 18: Financial Overview - Pro Forma
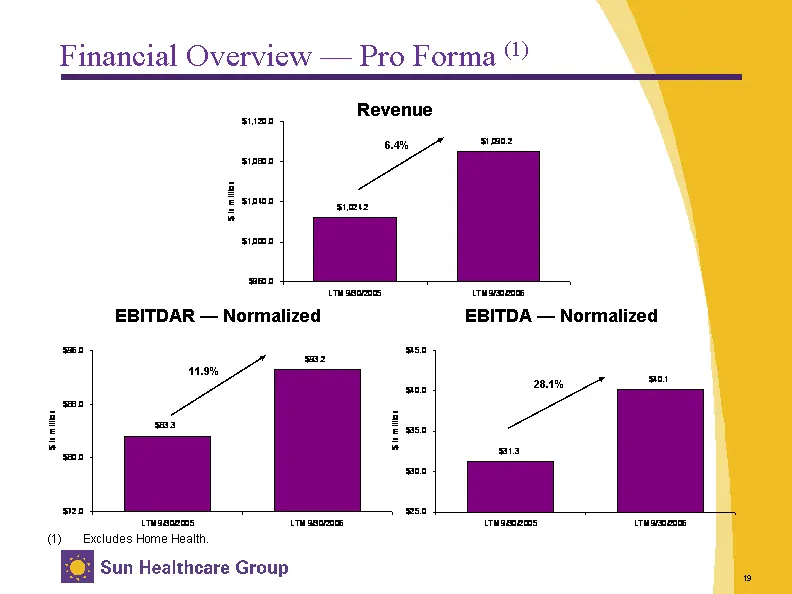
Financial Overview - Pro Forma (1) Revenue EBITDAR - Normalized EBITDA - Normalized 6.4% 11.9% 28.1% Excludes Home Health.
Slide 19: Operating Efficiency Initiatives
Operating Efficiency Initiatives Actively working on process improvement initiatives Recently developed an IT roadmap - additional efficiencies over the next several years Acquisitions will further leverage current infrastructure Peak reduced corporate G&A as a % of revenues from 4.6% (pro forma) fo
Slide 20: Capitalization Table
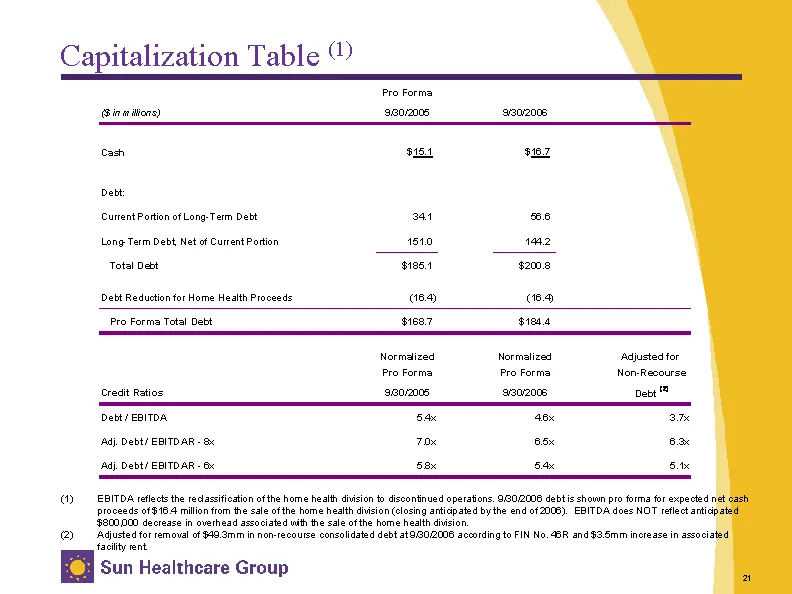
Capitalization Table (1) EBITDA reflects the reclassification of the home health division to discontinued operations. 9/30/2006 debt is shown pro forma for expected net cash proceeds of $16.4 million from the sale of the home health division (closing anticipated by the end of 2006). EBITDA does NOT
Slide 21: 2006 Guidance
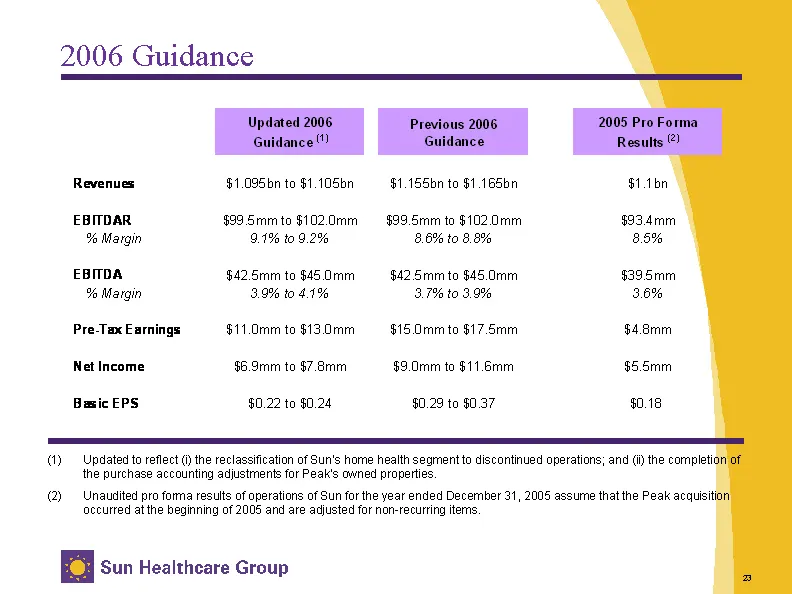
2006 Guidance 2006 Guidance Updated to reflect (i) the reclassification of Sun's home health segment to discontinued operations; and (ii) the completion of the purchase accounting adjustments for Peak's owned properties. Unaudited pro forma results of operations of Sun for the year ended December 31
Slide 22: Reconciliations
:@: Sun Healthcare Grou Reconciliations & Sun Healthcare Group
Slide 23: Reconciliation Section - Definitions of EBITDA and EBITDAR
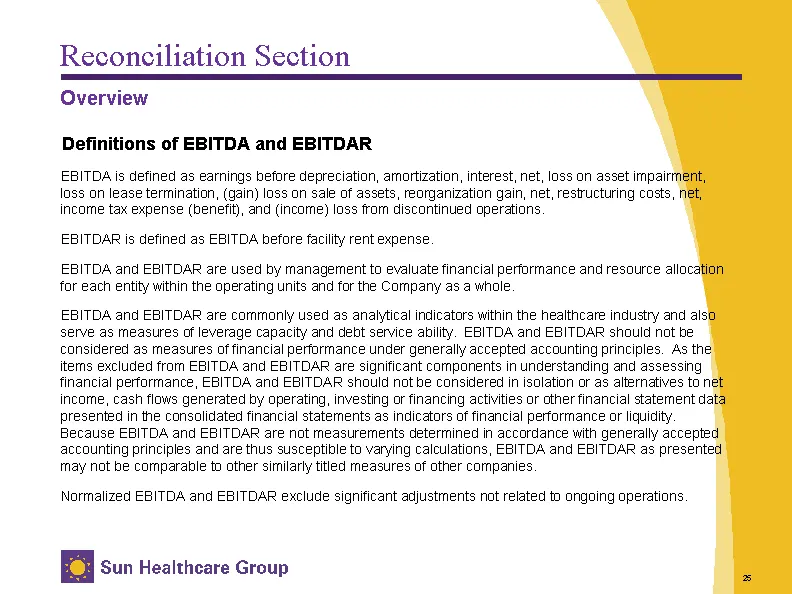
Reconciliation Section Definitions of EBITDA and EBITDAR EBITDA is defined as earnings before depreciation, amortization, interest, net, loss on asset impairment, loss on lease termination, (gain) loss on sale of assets, reorganization gain, net, restructuring costs, net, income tax expense (benefit
Slide 24: Reconciliation to Normalized Pro Forma Sun EBITDAR
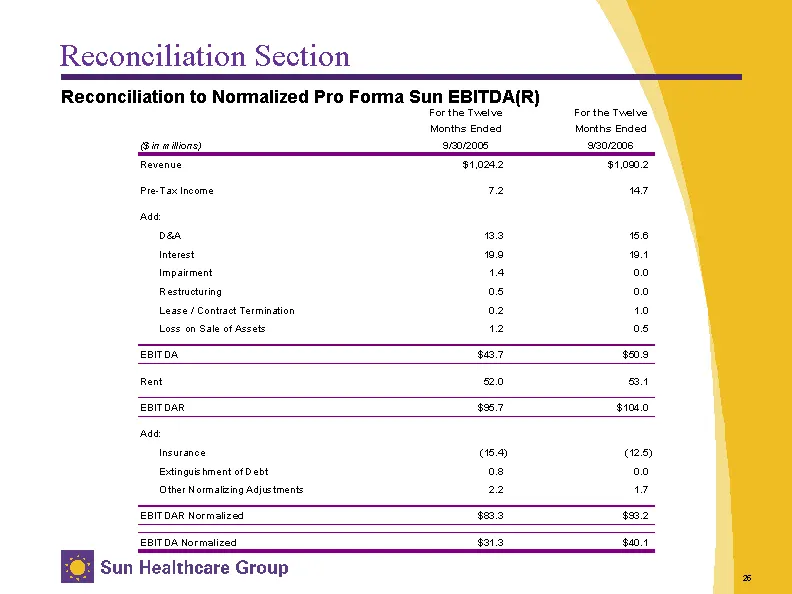
Reconciliation Section Reconciliation to Normalized Pro Forma Sun EBITDA(R)
Slide 25: Sun Healthcare Group
Sun Healthcare Group
Source: SEC EDGAR · 8-K filed Nov 8, 2006
More decks from Sun Healthcare Group Inc
 Jefferies 2012 Global Healthcare Conference17 slides · Jun 6, 2012
 J.P. Morgan Healthcare Conference 201219 slides · Jan 10, 2012
 Investor Presentation (March 2011)36 slides · Mar 29, 2011
 JPMorgan Healthcare Conference (January 2011)27 slides · Jan 10, 2011
 Non-Deal Roadshow (July 2010)33 slides · Jul 12, 2010
 Wells Fargo Securities 2010 Healthcare Conference25 slides · Jun 24, 2010