Provident Bankshares — Southern Financial Bancorp — Merger or Acquisition (February 2004)
45 slides from Provident Bankshares's merger presentation, Feb 4, 2004

Slide 1: Provident Bankshares Corporation 2003 Summary
Filed by Provident Bankshares Corporation Pursuant to Rule 425 under the Securities Act of 1933 and deemed filed pursuant to Rule 14a-12 of the Securities Exchange Act of 1934 Subject Company: Southern Financial Bancorp, Inc. Commission File No.: 0-22836 The following is a presentation by Provident

Slide 2: Additional information and forward-looking statements
Provident Bankshares Corporation and Southern Financial Bancorp, Inc. will be filing a joint proxy statement/prospectus and other relevant documents concerning the merger with the United States Securities and Exchange Commission (the “SEC”). WE URGE INVESTORS TO READ THE JOINT PROXY STATEMENT/PROSPE
Slide 3: History, Provident Distinction, Key Strategies, Southern Financial Merger
HISTORY THE PROVIDENT DISTINCTION KEY STRATEGIES SOUTHERN FINANCIAL MERGER IMPROVE FINANCIAL FUNDAMENTALS
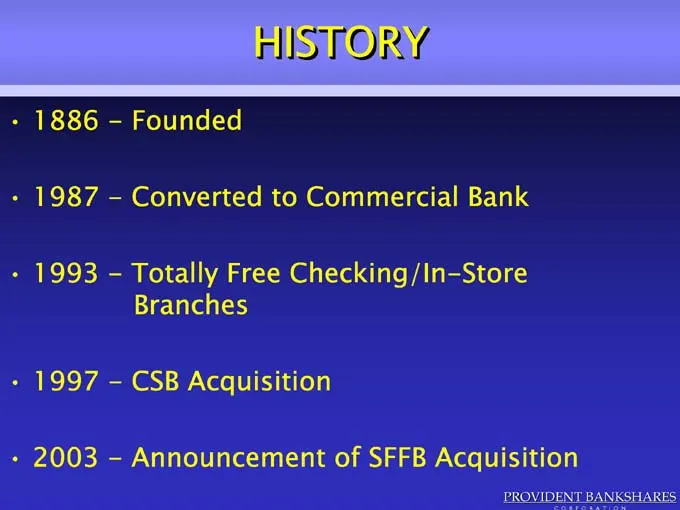
Slide 4: History
HISTORY • 1886—Founded • 1987—Converted to Commercial Bank • 1993—Totally Free Checking/In-Store Branches • 1997—CSB Acquisition • 2003—Announcement of SFFB Acquisition PROVIDENT BANKSHARES CORPORATION

Slide 5: The Provident Distinction
THE PROVIDENT DISTINCTION
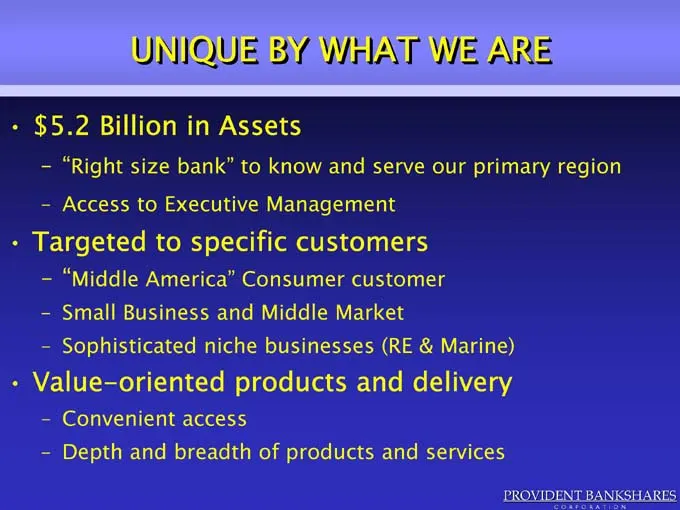
Slide 6: Unique by What We Are
UNIQUE BY WHAT WE ARE • $5.2 Billion in Assets – “Right size bank” to know and serve our primary region – Access to Executive Management • Targeted to specific customers – “Middle America” Consumer customer – Small Business and Middle Market – Sophisticated niche businesses (RE & Marine) • Value-ori
Slide 7: Key Strategies
KEY STRATEGIES • Build on Consumer Banking Success • Grow Market Share and Expand in the Washington Metro and Virginia Markets • Grow Commercial Banking Market Share in the Maryland and Virginia Markets • Improve Financial Fundamentals PROVIDENT BANKSHARES CORPORATION

Slide 8: Build on Consumer Banking Success
BUILD ON CONSUMER BANKING SUCCESS PROVIDENT BANKSHARES CORPORATION
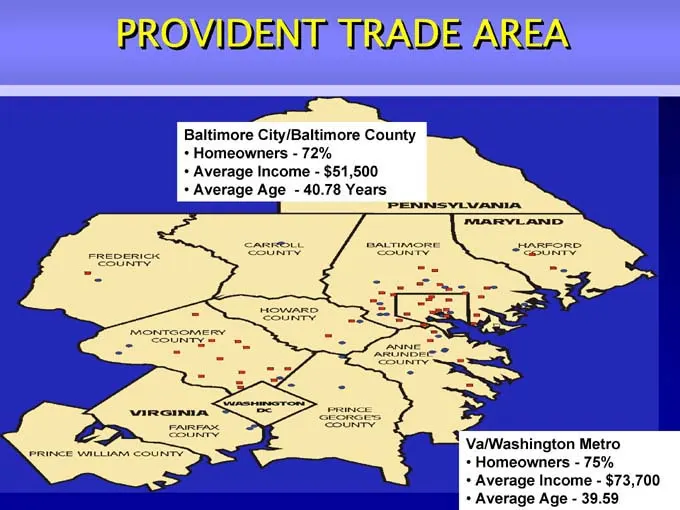
Slide 9: Provident Trade Area
PROVIDENT TRADE AREA Baltimore City/Baltimore County • Homeowners—72% • Average Income—$51,500 • Average Age—40.78 Years Va/Washington Metro • Homeowners—75% • Average Income—$73,700 • Average Age—39.59
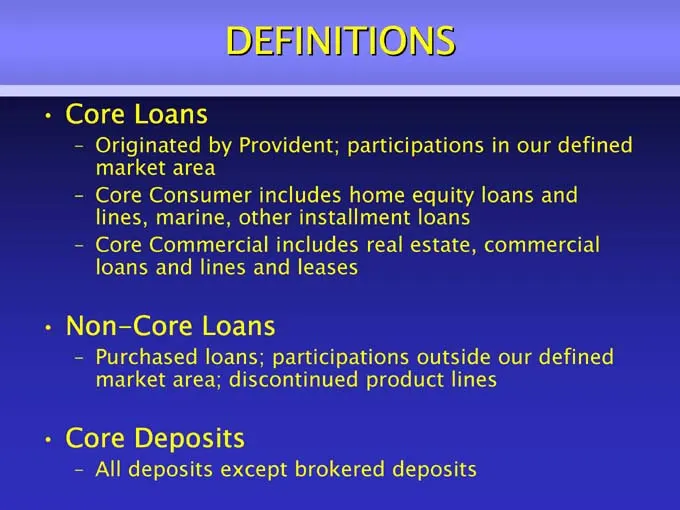
Slide 10: Definitions
DEFINITIONS • Core Loans – Originated by Provident; participations in our definedmarket area – Core Consumer includes home equity loans and lines, marine, other installment loans – Core Commercial includes real estate, commercialloans and lines and leases • Non-Core Loans – Purchased loans; particip
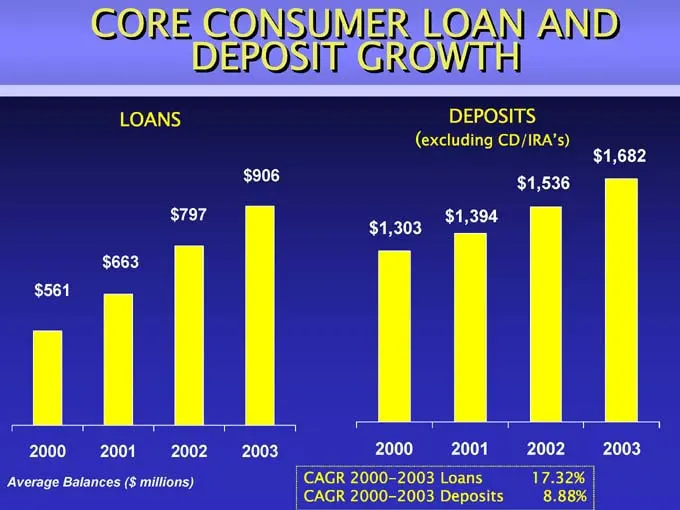
Slide 11: Core Consumer Loan and Deposit Growth
CORE CONSUMER LOAN AND DEPOSIT GROWTH LOANS DEPOSITS (excluding CD/IRA’s) Average Balances ($ millions) CAGR 2000-2003 Loans 17.32% CAGR 2000-2003 Deposits 8.88%
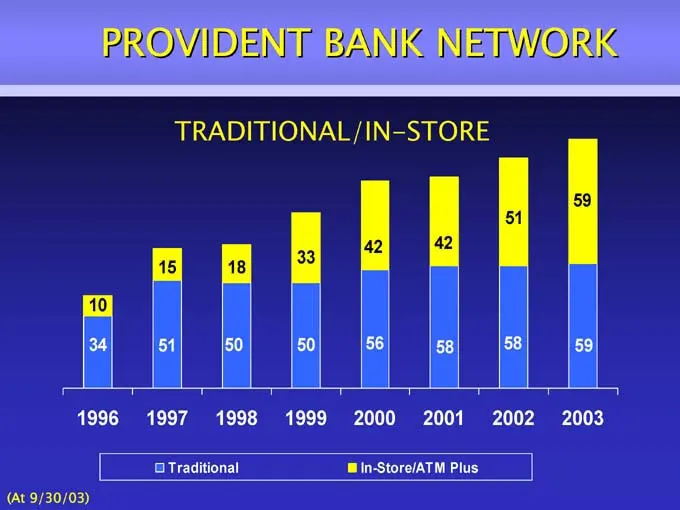
Slide 12: Provident Bank Network
PROVIDENT BANK NETWORK TRADITIONAL/IN-STORE (At 9/30/03)

Slide 13: Provident's In-Store Difference
PROVIDENT’S IN-STORE DIFFERENCE *PEOPLE* *PARTNERS *PRODUCT* *PROGRAM*
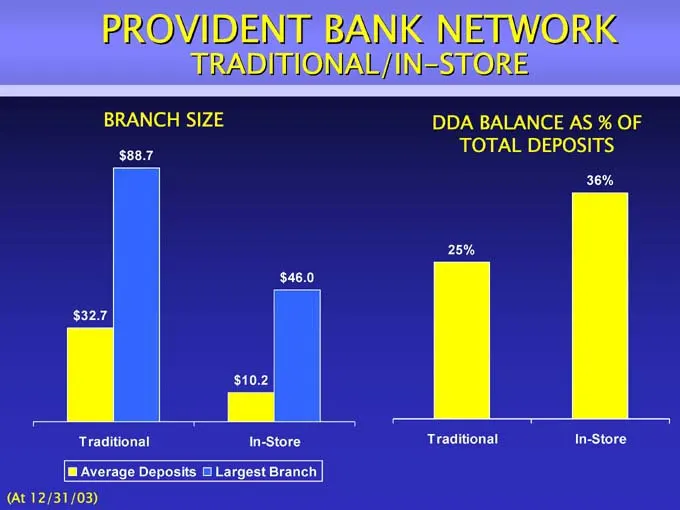
Slide 14: Provident Bank Network: Branch Size and DDA Balances
PROVIDENT BANK NETWORK TRADITIONAL/IN-STORE BRANCH SIZE DDA BALANCE AS % OF TOTAL DEPOSITS (At 12/31/03)
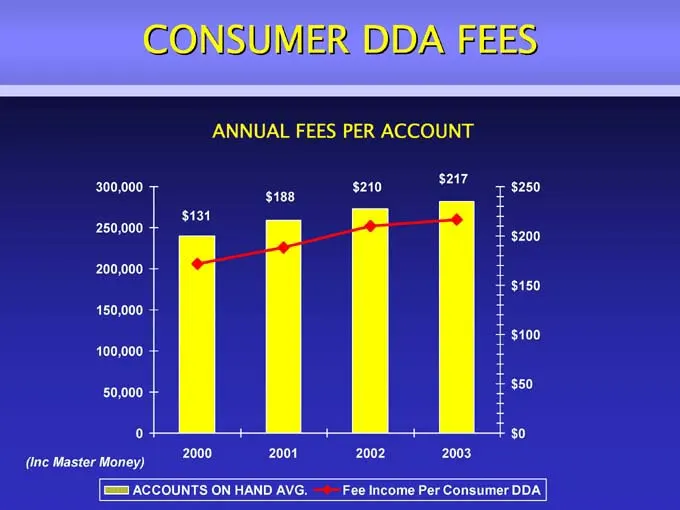
Slide 15: Consumer DDA Fees
CONSUMER DDA FEES ANNUAL FEES PER ACCOUNT (Inc Master Money)

Slide 16: Grow Market Share and Expand in Washington Metro and Virginia
GROW MARKET SHARE AND EXPAND IN THE WASHINGTON METRO AND VIRGINIA MARKETS PROVIDENT BANKSHARES CORPORATION
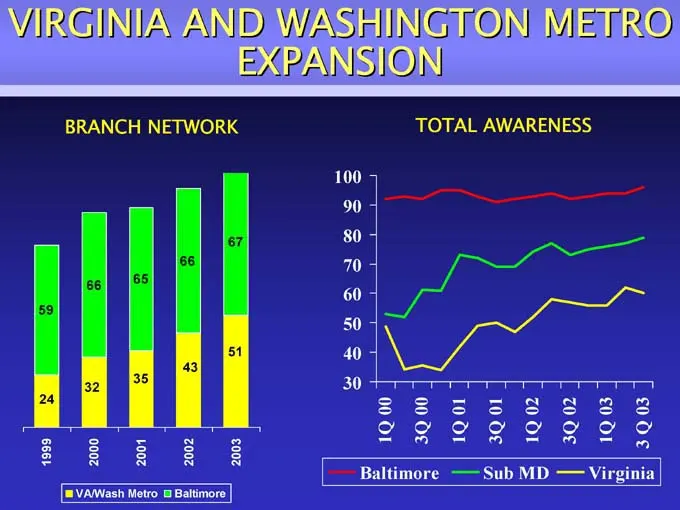
Slide 17: Virginia and Washington Metro Expansion
VIRGINIA AND WASHINGTON METRO EXPANSION BRANCH NETWORK TOTAL AWARENESS
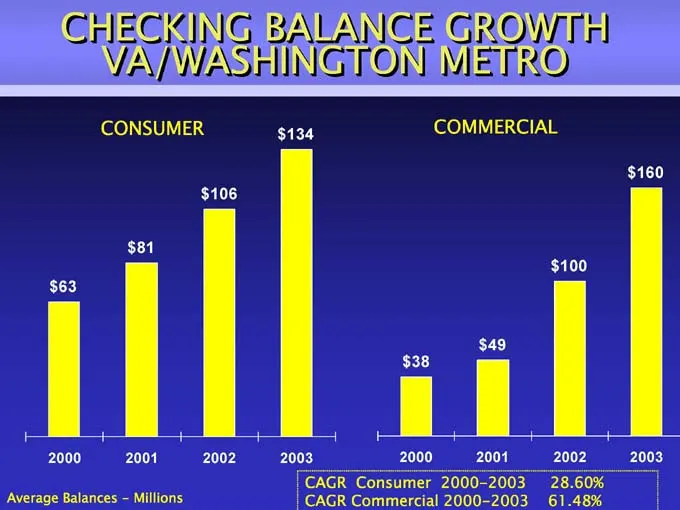
Slide 18: Checking Balance Growth VA/Washington Metro
CHECKING BALANCE GROWTH VA/WASHINGTON METRO CONSUMER COMMERCIAL CAGR Consumer 2000-2003 28.60% CAGR Commercial 2000-2003 61.48%
Slide 19: Grow Commercial Banking Market Share in Maryland and Virginia
GROW COMMERCIAL BANKINGMARKET SHARE IN THE MARYLAND AND VIRGINIA MARKETS PROVIDENT BANKSHARES CORPORATION
Slide 20: Core Commercial Loan and Deposit/Repo Growth
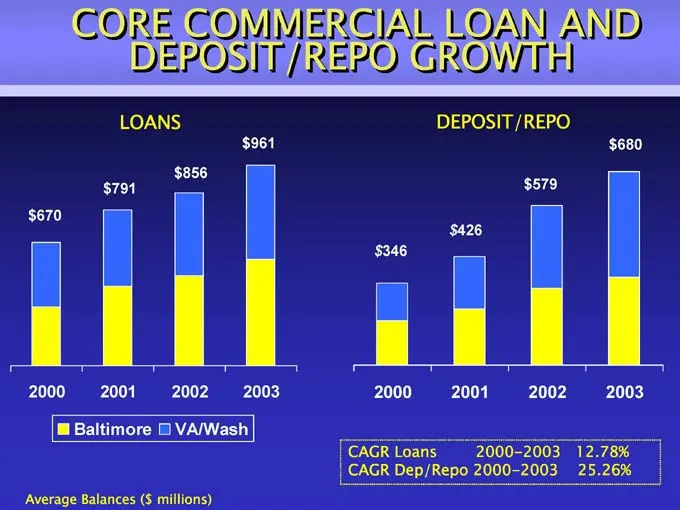
CORE COMMERCIAL LOAN AND DEPOSIT/REPO GROWTH LOANS DEPOSIT/REPO CAGR Loans 2000-2003 12.78% CAGR Dep/Repo 2000-2003 25.26% Average Balances ($ millions)

Slide 21: Strategic Merger: Southern Financial Bank
STRATEGIC MERGER Southern Financial Bank
Slide 22: Southern Financial Bancorp, Inc.
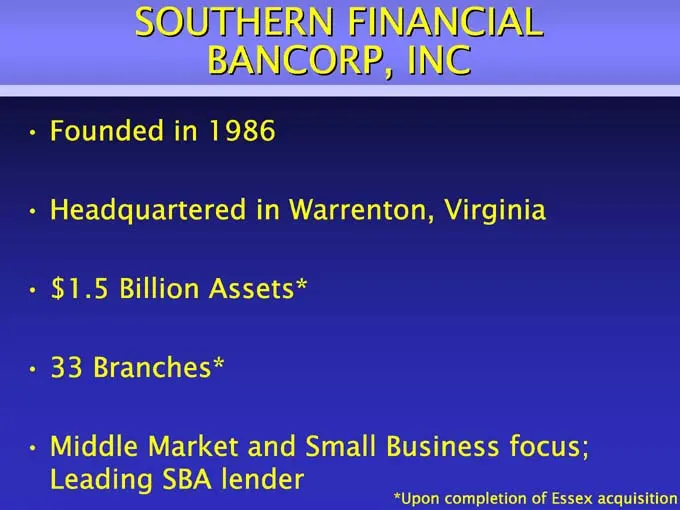
SOUTHERN FINANCIALBANCORP, INC • Founded in 1986 • Headquartered in Warrenton, Virginia • $1.5 Billion Assets* • 33 Branches* • Middle Market and Small Business focus; Leading SBA lender *Upon completion of Essex acquisition
Slide 23: Transaction Strengths
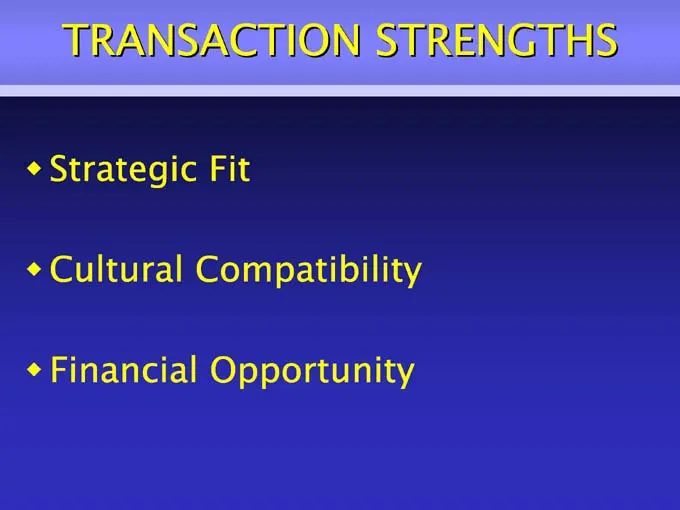
TRANSACTION STRENGTHS Strategic Fit Cultural Compatibility Financial Opportunity
Slide 24: Strategic Fit
STRATEGIC FIT Continues Provident’s market share expansion in the high growth markets of Virginia
Slide 25: Virginia: Strong Banking Market
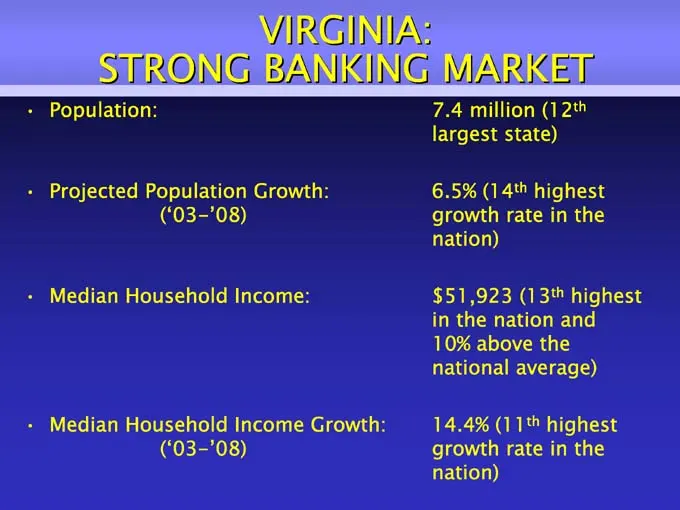
VIRGINIA: STRONG BANKING MARKET • Population: 7.4 million (12th largest state) • Projected Population Growth: 6.5% (14th highest (‘03-’08) growth rate in the nation) • Median Household Income: $51,923 (13th highest in the nation and 10% above the national average) • Median Household Income Growth: 1
Slide 26: Pro Forma Franchise
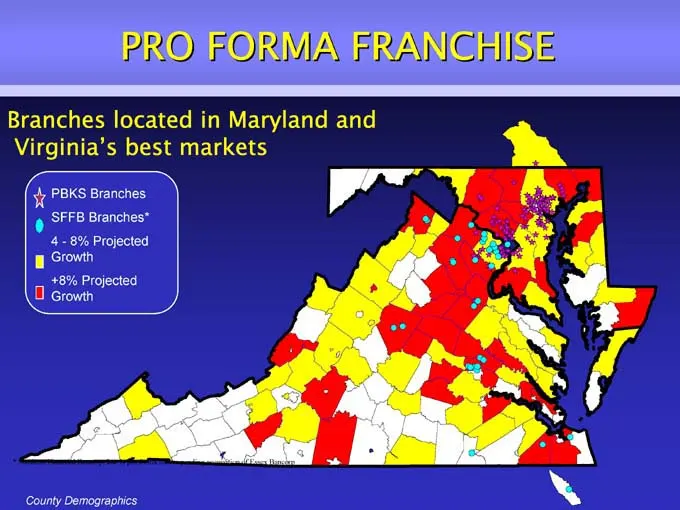
PRO FORMA FRANCHISE Branches located in Maryland and Virginia’s best markets PBKS Branches SFFB Branches* 4—8% Projected Growth +8% Projected Growth County Demographics
Slide 27: Strategic Fit: Online Banking Services
STRATEGIC FIT Adds significant competitive advantage for business banking companies with a powerful integrated suite of online banking services
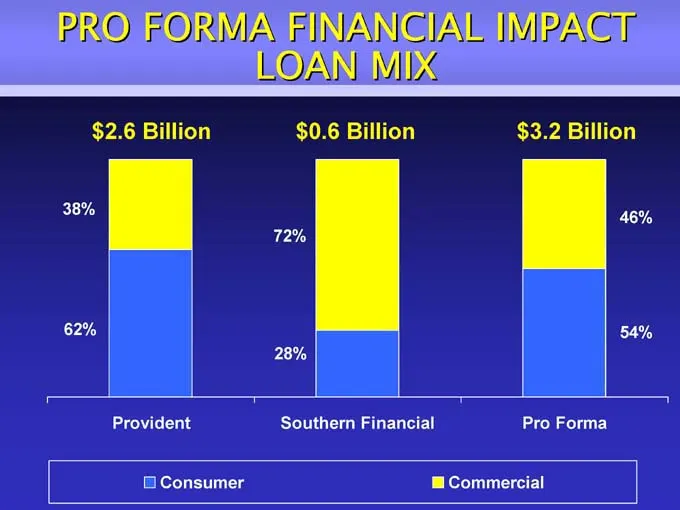
Slide 28: Pro Forma Financial Impact: Loan Mix
PRO FORMA FINANCIAL IMPACT LOAN MIX $2.6 Billion $0.6 Billion $3.2 Billion
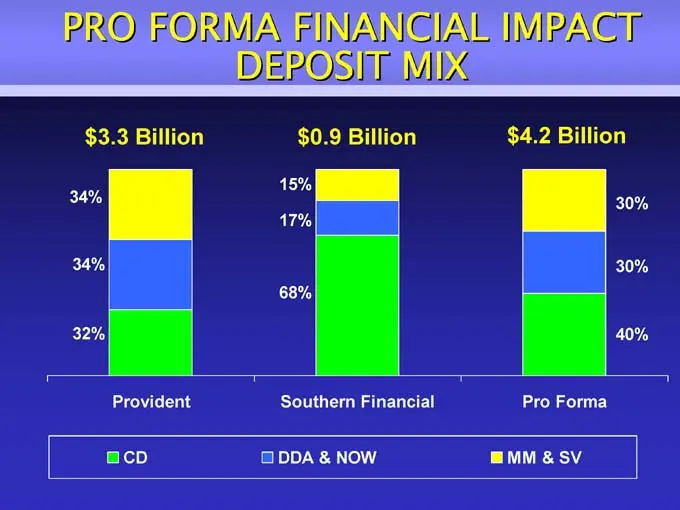
Slide 29: Pro Forma Financial Impact: Deposit Mix
PRO FORMA FINANCIAL IMPACT DEPOSIT MIX $3.3 Billion $0.9 Billion $4.2 Billion
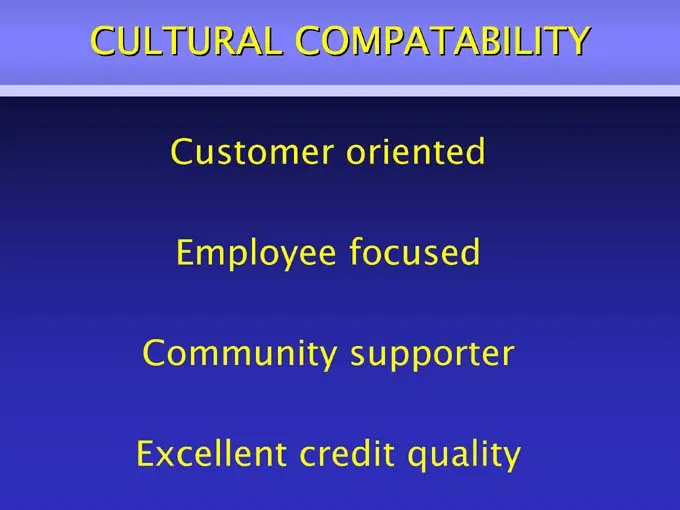
Slide 30: Cultural Compatibility
CULTURAL COMPATABILITY Customer oriented Employee focused Community supporter Excellent credit quality
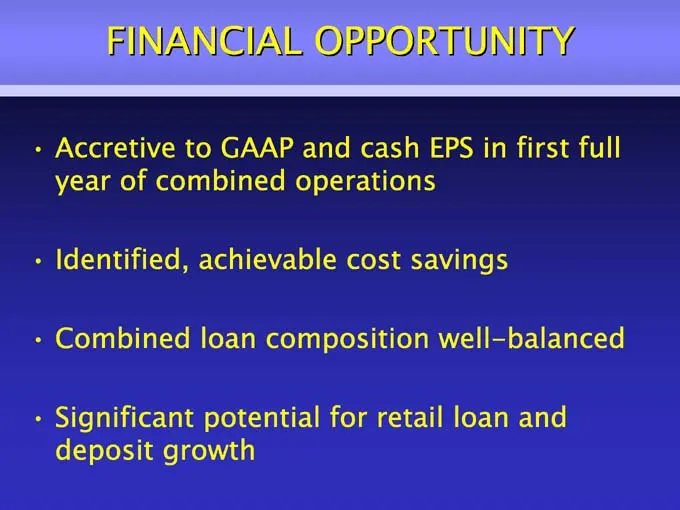
Slide 31: Financial Opportunity
FINANCIAL OPPORTUNITY • Accretive to GAAP and cash EPS in first full year of combined operations • Identified, achievable cost savings • Combined loan composition well-balanced • Significant potential for retail loan and deposit growth
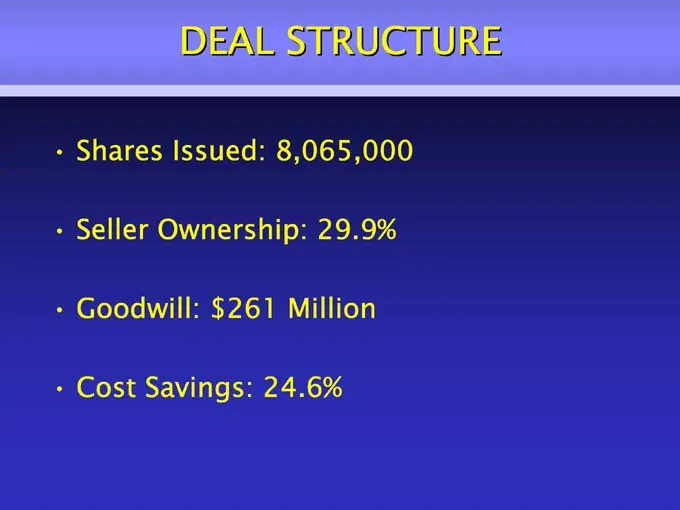
Slide 32: Deal Structure
DEAL STRUCTURE • Shares Issued: 8,065,000 • Seller Ownership: 29.9% • Goodwill: $261 Million • Cost Savings: 24.6%
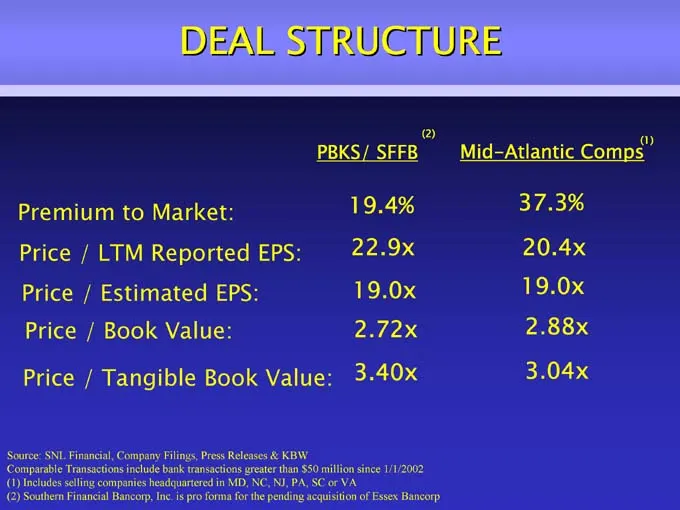
Slide 33: Deal Structure: Transaction Multiples
DEAL STRUCTURE PBKS/ SFFB(2) Mid-Atlantic Comps (1) Premium to Market: 19.4% 37.3% Price / LTM Reported EPS: 22.9x 20.4x Price / Estimated EPS: 19.0x 19.0x Price / Book Value: 2.72x 2.88x Price / Tangible Book Value: 3.40x 3.04x Source: SNL Financial, Company Filings, Press Releases & KBW Comparable
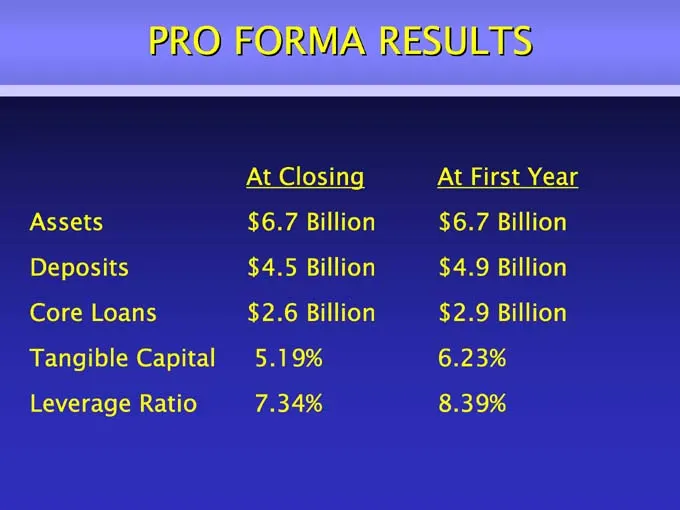
Slide 34: Pro Forma Results
PRO FORMA RESULTS At Closing At First Year Assets $6.7 Billion $6.7 Billion Deposits $4.5 Billion $4.9 Billion Core Loans $2.6 Billion $2.9 Billion Tangible Capital 5.19% 6.23% Leverage Ratio 7.34% 8.39%
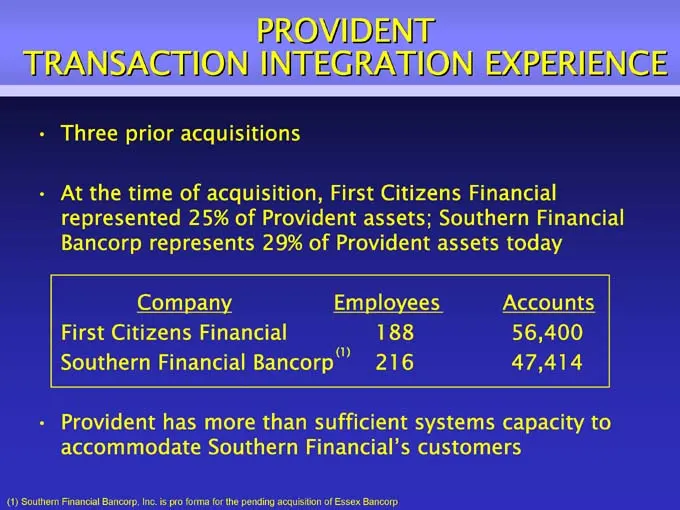
Slide 35: Provident Transaction Integration Experience
PROVIDENT TRANSACTION INTEGRATION EXPERIENCE • Three prior acquisitions • At the time of acquisition, First Citizens Financial represented 25% of Provident assets; Southern Financial Bancorp represents 29% of Provident assets today Company Employees Accounts First Citizens Financial 188 56,400 South
Slide 36: Improve Financial Fundamentals
IMPROVE FINANCIAL FUNDAMENTALS PROVIDENT BANKSHARES CORPORATION
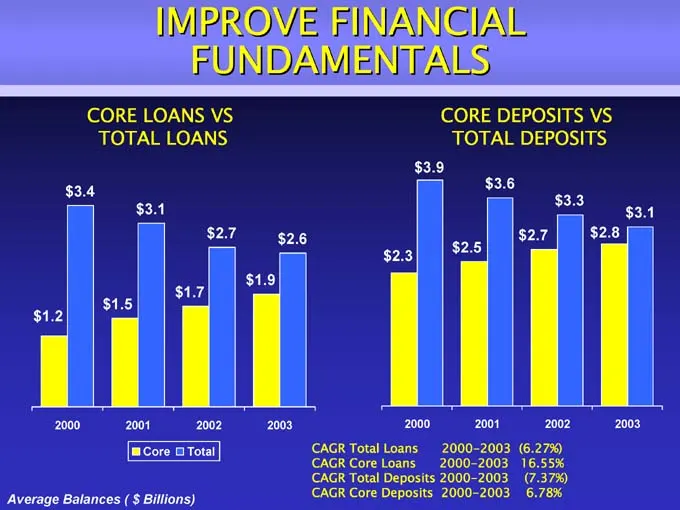
Slide 37: Core Loans vs Total Loans; Core Deposits vs Total Deposits
IMPROVE FINANCIALFUNDAMENTALS CORE LOANS VS TOTAL LOANS CORE DEPOSITS VS TOTAL DEPOSITS CAGR Total Loans 2000-2003 (6.27%) CAGR Core Loans 2000-2003 16.55% CAGR Total Deposits 2000-2003 (7.37%) CAGR Core Deposits 2000-2003 6.78% Average Balances ( $ Billions)
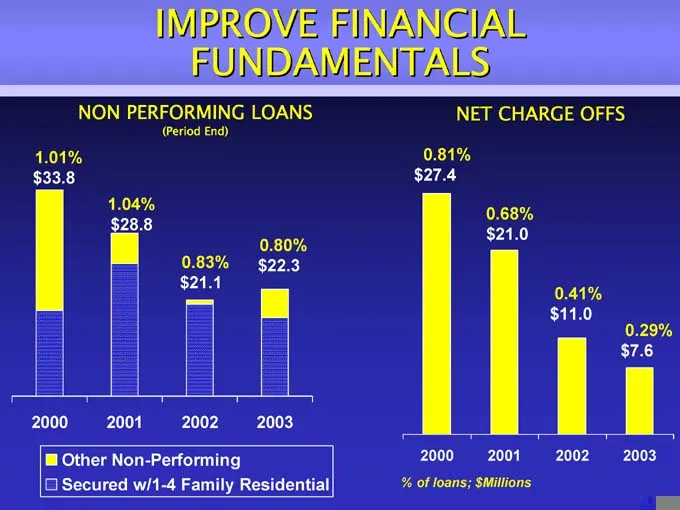
Slide 38: Non Performing Loans and Net Charge Offs
IMPROVE FINANCIALFUNDAMENTALS NON PERFORMING LOANS (Period End) NET CHARGE OFFS % of loans; $Millions
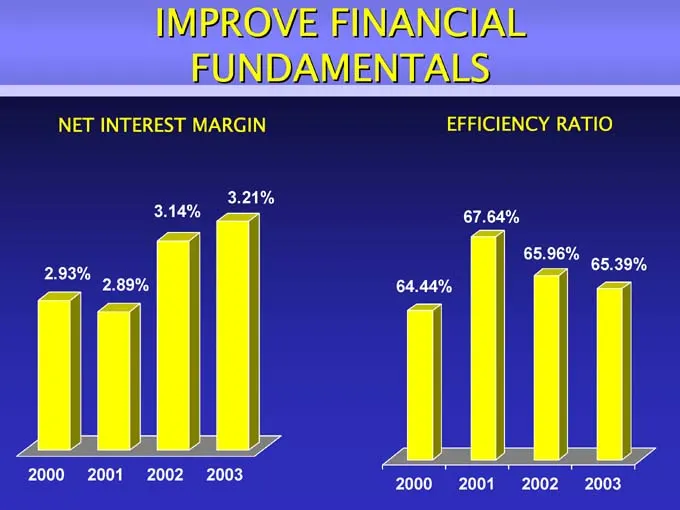
Slide 39: Net Interest Margin and Efficiency Ratio
IMPROVE FINANCIAL FUNDAMENTALS NET INTEREST MARGIN EFFICIENCY RATIO
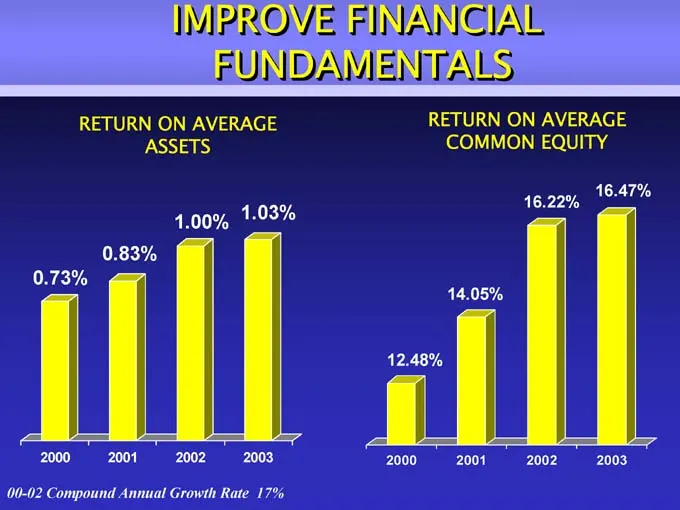
Slide 40: Return on Average Assets and Common Equity
IMPROVE FINANCIAL FUNDAMENTALS RETURN ON AVERAGE ASSETS RETURN ON AVERAGE COMMON EQUITY 00-02 Compound Annual Growth Rate 17%
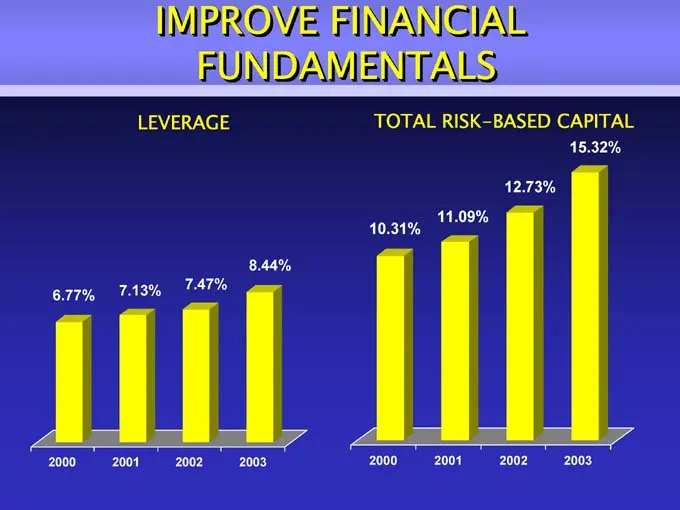
Slide 41: Leverage and Total Risk-Based Capital
IMPROVE FINANCIAL FUNDAMENTALS LEVERAGE TOTAL RISK-BASED CAPITAL
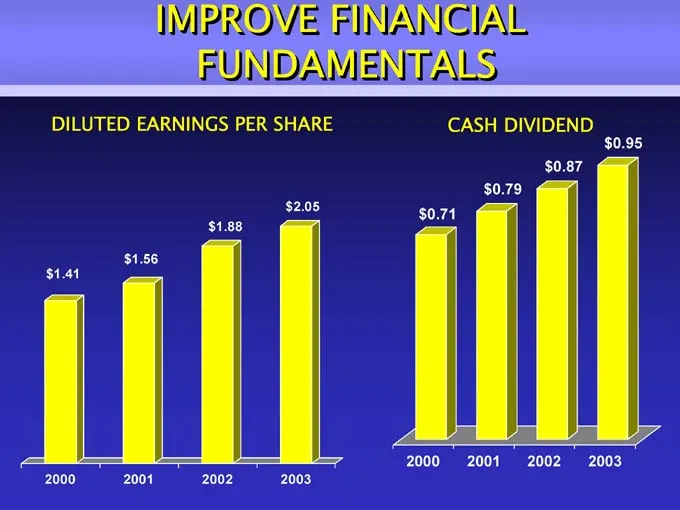
Slide 42: Diluted Earnings Per Share and Cash Dividend
IMPROVE FINANCIAL FUNDAMENTALS DILUTED EARNINGS PER SHARE CASH DIVIDEND
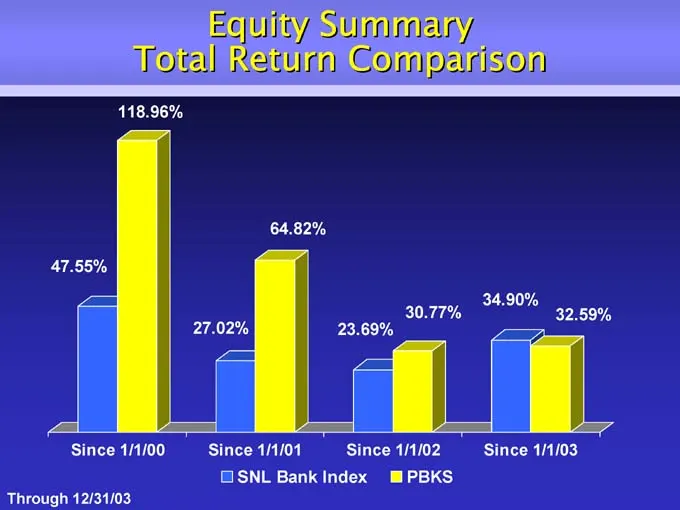
Slide 43: Equity Summary: Total Return Comparison
Equity Summary Total Return Comparison Through 12/31/03
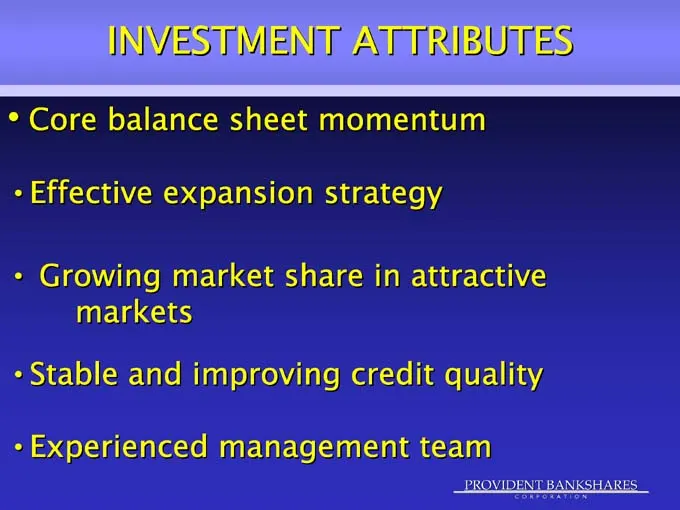
Slide 44: Investment Attributes
INVESTMENT ATTRIBUTES • Core balance sheet momentum • Effective expansion strategy • Growing market share in attractive markets • Stable and improving credit quality • Experienced management team PROVIDENT BANKSHARES CORPORATION

Slide 45: Provident Bankshares Corporation Contact
PROVIDENT BANKSHARES CORPORATION (www.provbank.com) Contact: Media: Lillian Kilroy: (410) 277-2833 Investment Community: Dennis Starliper: (410) 277-2889 PROVIDENT BANKSHARES CORPORATION
Source: SEC EDGAR · 425 filed Feb 4, 2004
More decks from Provident Bankshares Corp
 Merger or Acquisition (December 2008)32 slides · Dec 19, 2008
 2007 Stifel Nicolaus Financial Institutions Investor Conference52 slides · Dec 6, 2007
 Investor Presentation (November 2007)49 slides · Nov 8, 2007
 FTN Midwest Small and Mid Cap Bank Conference 200757 slides · Sep 6, 2007
 Investor Presentation (May 2007)51 slides · May 8, 2007
 KBW Regional Bank Conference 200751 slides · Feb 28, 2007