Transcat, Inc. · NASDAQ:TRNS
Transcat — Investor Presentation (November 2004)
41 slides from Transcat's investor presentation, Nov 17, 2004
Slide 1: Investor Presentation
Transcat, Inc. Investor Presentation November 17, 2004 Carl E. Sassano Chairman, President and CEO and Charles P. Hadeed COO, VP-Finance, and CFO Copyright © 2004 - All Rights Reserved. 1
Slide 2: Forward-Looking Statements
Forward-Looking Statements “Safe Harbor” Statement under the Private Securities Litigation Reform Act of 1995: This presentation contains forward-looking statements, which are subject to various risks and uncertainties. The Company’s actual results could differ from those anticipated in such forward
Slide 3: Business Review
Transcat, Inc. Business Review Carl E. Sassano Chairman, President and CEO Copyright © 2004 - All Rights Reserved. 3
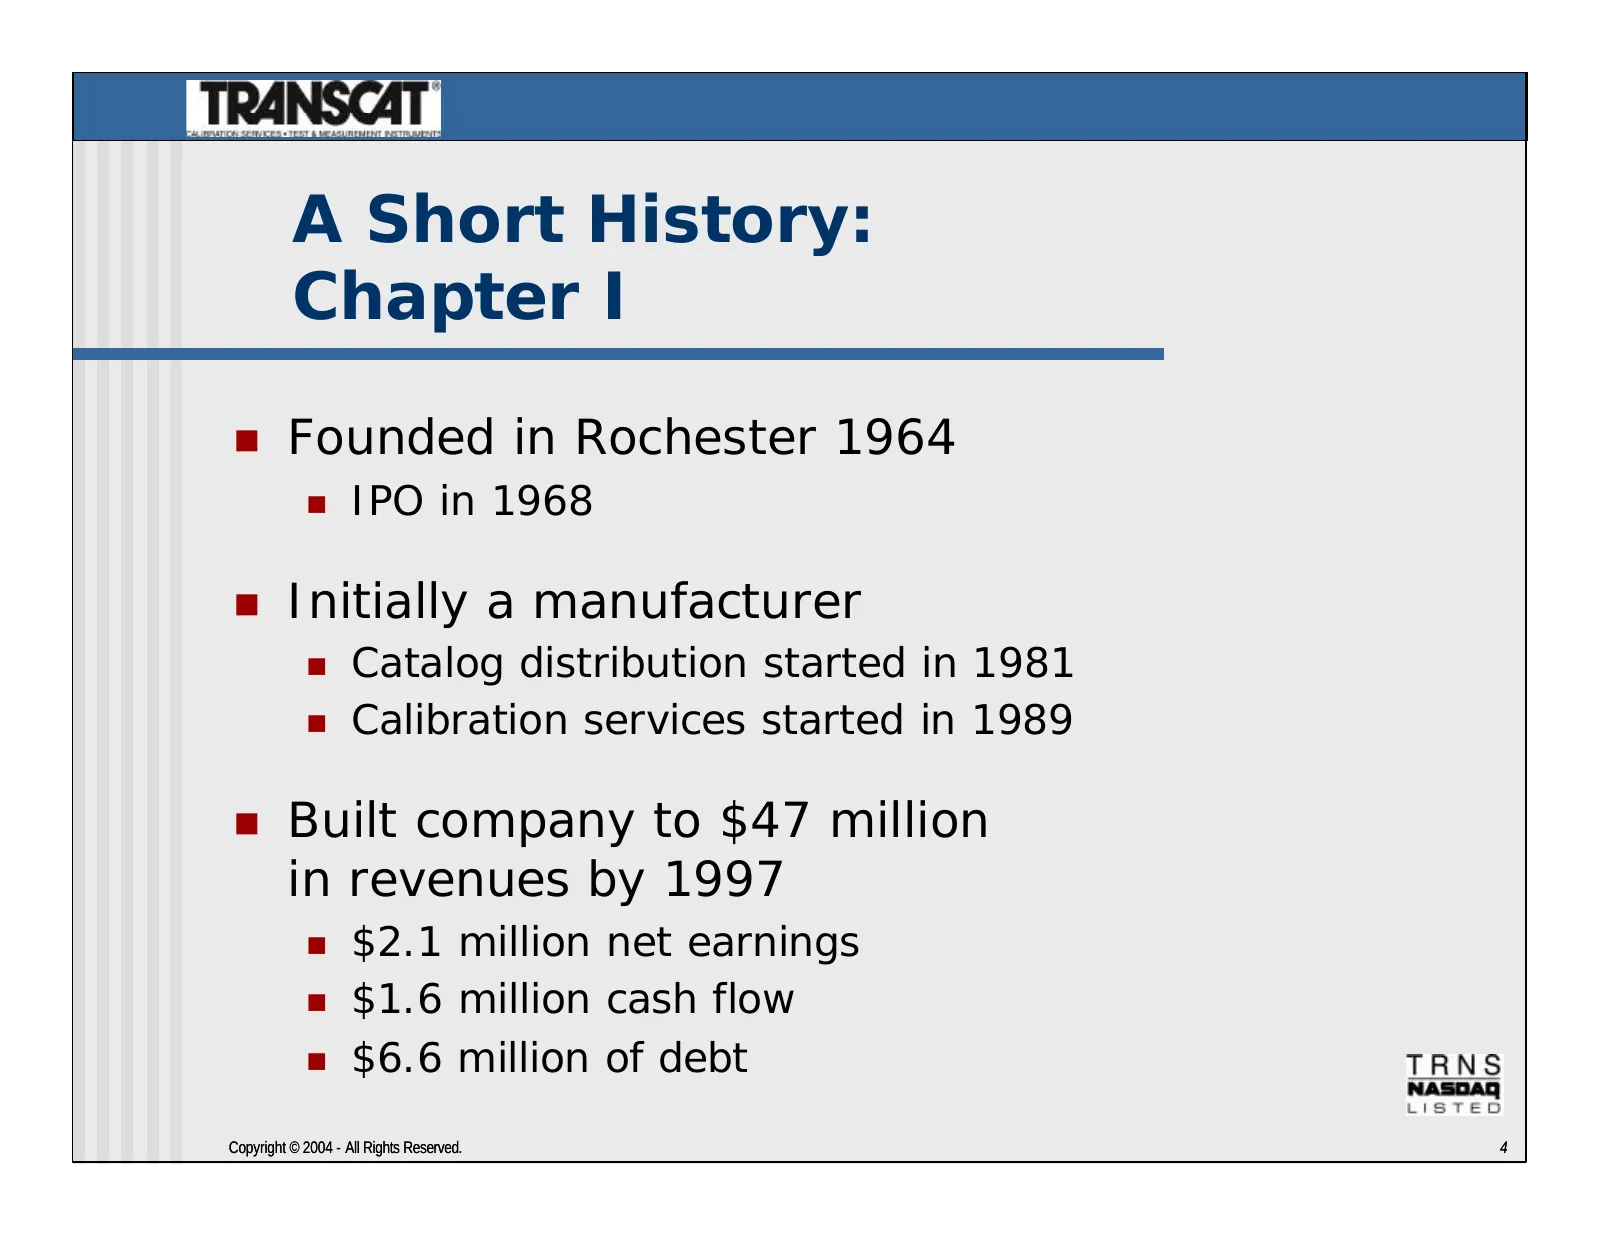
Slide 4: A Short History: Chapter I
A Short History: Chapter I n Founded in Rochester 1964 n IPO in 1968 n Initially a manufacturer n Catalog distribution started in 1981 n Calibration services started in 1989 n Built company to $47 million in revenues by 1997 n $2.1 million net earnings n $1.6 million cash flow n $6.6 million of debt
Slide 5: A Short History: Chapter II
A Short History: Chapter II n Doubled in size, through one acquisition in 1998 n $78 million in revenues n $1.0 million in net earnings n $27 million of debt n Significant integration problems n Lost 30% of acquired revenue in first year n Sold manufacturing operations in December 2001 and January 2
Slide 6: A Short History: Chapter III – Transcat Today
A Short History: Chapter III – Transcat Today n Transcat, Inc. is an accredited provider of calibration and repair services and a leading distributor of professional grade test, measurement and calibration instruments primarily to the process, life science and manufacturing industries n We conduct o
Slide 7: Transcat, Inc. - Why Invest?
Transcat, Inc. - Why Invest? n Profitable business model established n Consistent product gross profit percentage in the mid 20% range n Increasing service gross profit percentage in the high 20% range n Quality service strategy supports competitive yet premium service prices n Operating expenses gr
Slide 8: Calibration Services
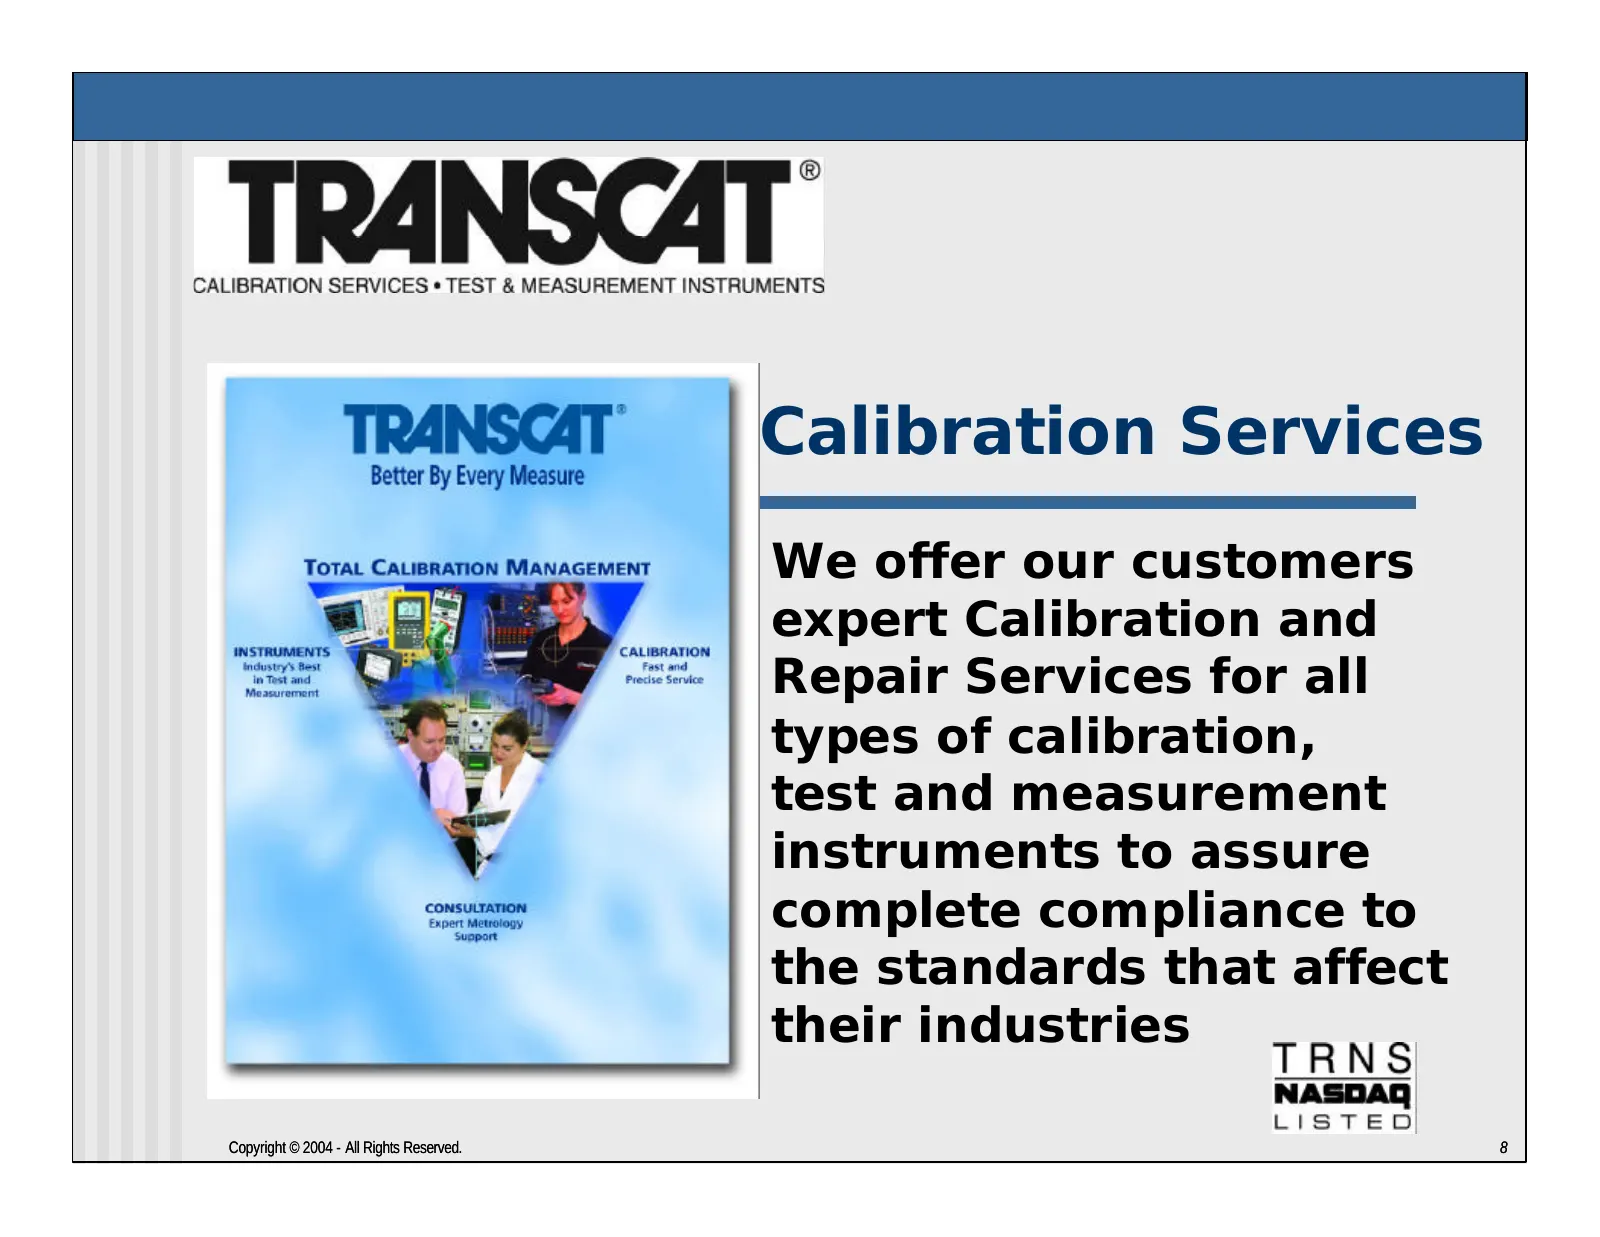
Calibration Services We offer our customers expert Calibration and Repair Services for all types of calibration, test and measurement instruments to assure complete compliance to the standards that affect their industries Copyright © 2004 - All Rights Reserved. 8
Slide 9: Calibration Services: What It Is
Calibration Services: What It Is n Calibration - Determines whether an instrument (temperature probe, pressure gauge, electric meter, etc.) is operating within the manufacturer’s specifications n Calibration Data Services - The verification and documentation of the calibration n Quality calibration
Slide 10: Calibration Services: Why It Is Important
Calibration Services: Why It Is Important Out-of-control processes cannot be tolerated Copyright © 2004 - All Rights Reserved. 10
Slide 11: Calibration Services: Why It Is Important
Calibration Services: Why It Is Important n Pharmaceutical companies’ manufacturing specifications must be followed in making drugs or devices n The manufacturer is responsible for assuring that its process is in control, as measured by temperature probes, pressure gauges, flow meters, etc. n Calibr
Slide 12: Calibration Services: Why It Is Important
Calibration Services: Why It Is Important n Process industry plants n Oil refineries and chemical producers must assure that their manufacturing processes are in control n Utilities n Power plants, natural fuel sources or nuclear, rely on instruments to maintain safety levels in power production Cop
Slide 13: Calibration Services: What We Provide
Calibration Services: What We Provide n Quality Calibration – traceable to NIST n ISO-9001: 2000 registered with UL n Independently audited processes n Certification of work done, data found n Recalibration procedure – usually annual n On-line access to all calibration information via Cal-Trak n Com
Slide 14: Calibration Services: A Large and Growing Market
Calibration Services: A Large and Growing Market n $1+ billion market n 10 Transcat Calibration Services labs cover 83% of total market • 9 in U.S.; 1 in Canada n Over 120,000 calibrations per year and growing n Five biggest providers represent less than 10% of the Calibration Services market n Sypr
Slide 15: Calibration Services: Business Strategy
Calibration Services: Business Strategy n Target companies that value quality and expect documentation of work performed n Pharmaceutical, chemical, oil refining, utility n Identify companies with in-house calibration operations and present benefits of outsourcing to Transcat n Generally less expens
Slide 16: Calibration Services
Calibration Services n Calibration Services is a core competency with significant profit leverage n FY 2004 - focused on laboratory consolidation and efficiency n Increased gross profit ratio 11 points over prior year n FY 2005 - reorganized sales force to focus n Field sales on major customers n In
Slide 17: Distribution Products
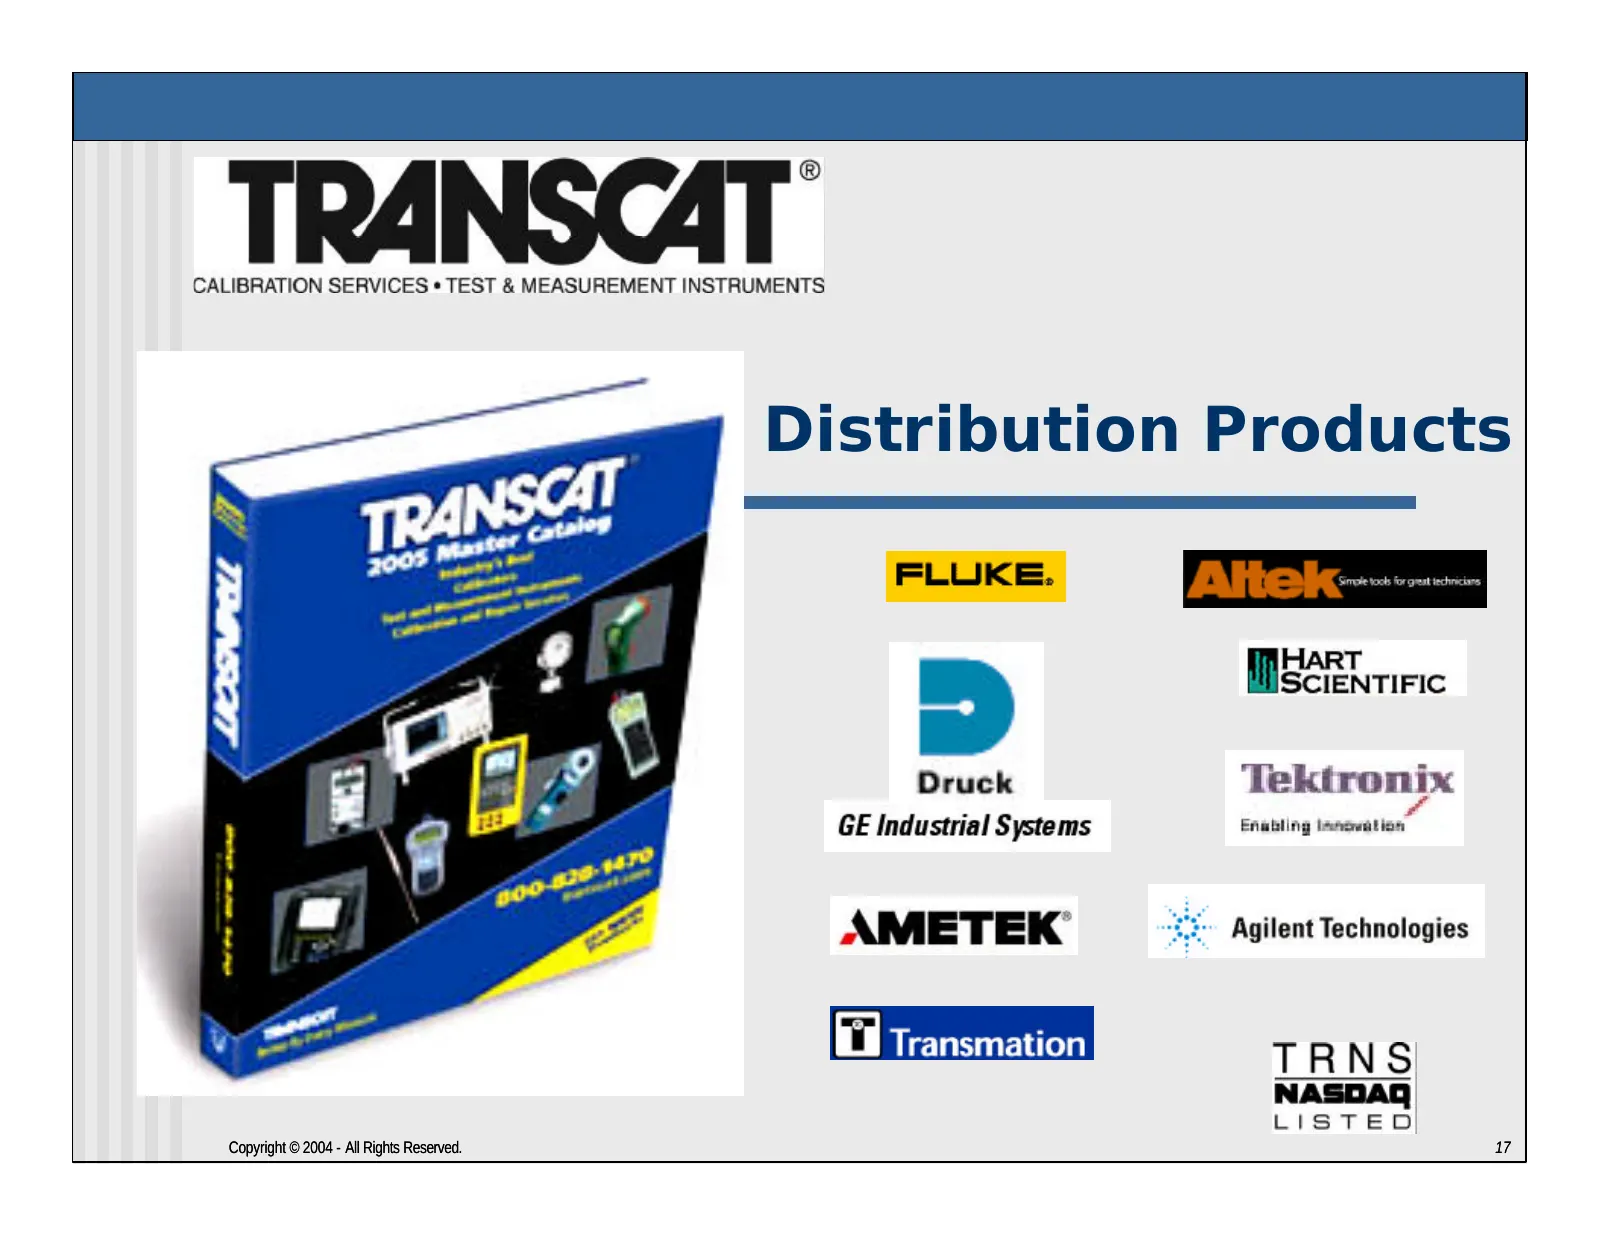
Distribution Products Copyright © 2004 - All Rights Reserved. 17
Slide 18: Distribution Products
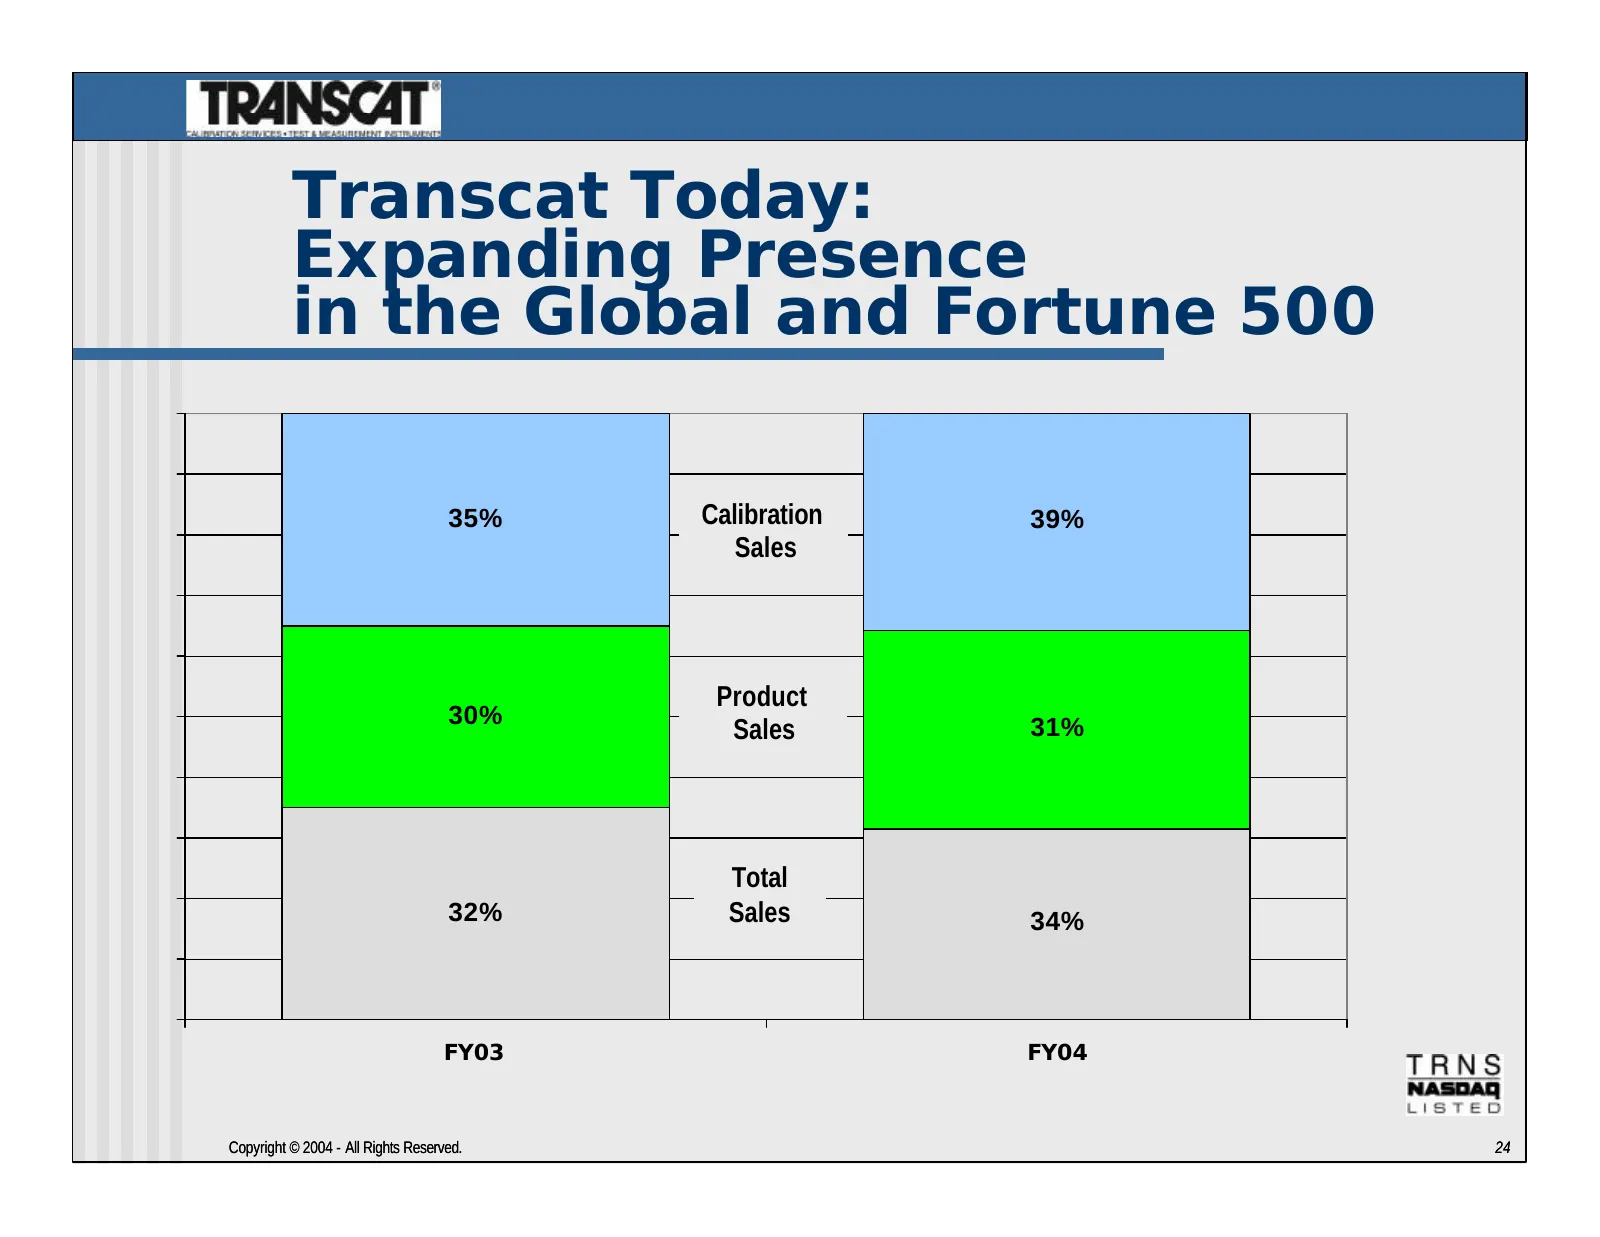
Distribution Products n $1 billion overall market n Global/Fortune 500 customers represented 39% of Transcat’s Distribution Products sales in FY 2004 n 1%-5% growth rate n Maintenance engineer/technician is typical customer n Transcat has: n 30% share of $50 million process calibrator market n <4% s
Slide 19: Distribution Products
Distribution Products n Increases in Distribution Products net sales – 15.6% in FY 2004/Q4 and 10% in the first half of FY 2005 – were due to: n Improved economy n Targeted sales efforts in new distribution channels n Customer responses to marketing programs n Expanded market penetration into govern
Slide 20: Distribution Products Business Strategy
Distribution Products Business Strategy n Carry the best, latest technology and comprehensive range of test and measurement instruments for process, utility and pharmaceutical industries n Competitive prices n Application assistance n Same-day shipping and calibration on most popular instruments n A
Slide 21: Distribution Products
Distribution Products n Customer Direct Mail Programs n Master Catalog n Supplements n Targeted Mailings (e.g., electrical utility products, etc.) n Customer prospecting strategy n Identify potential process/pharmaceutical customers through trade publication mailing lists n Keep customer for five ye
Slide 22: Distribution Products
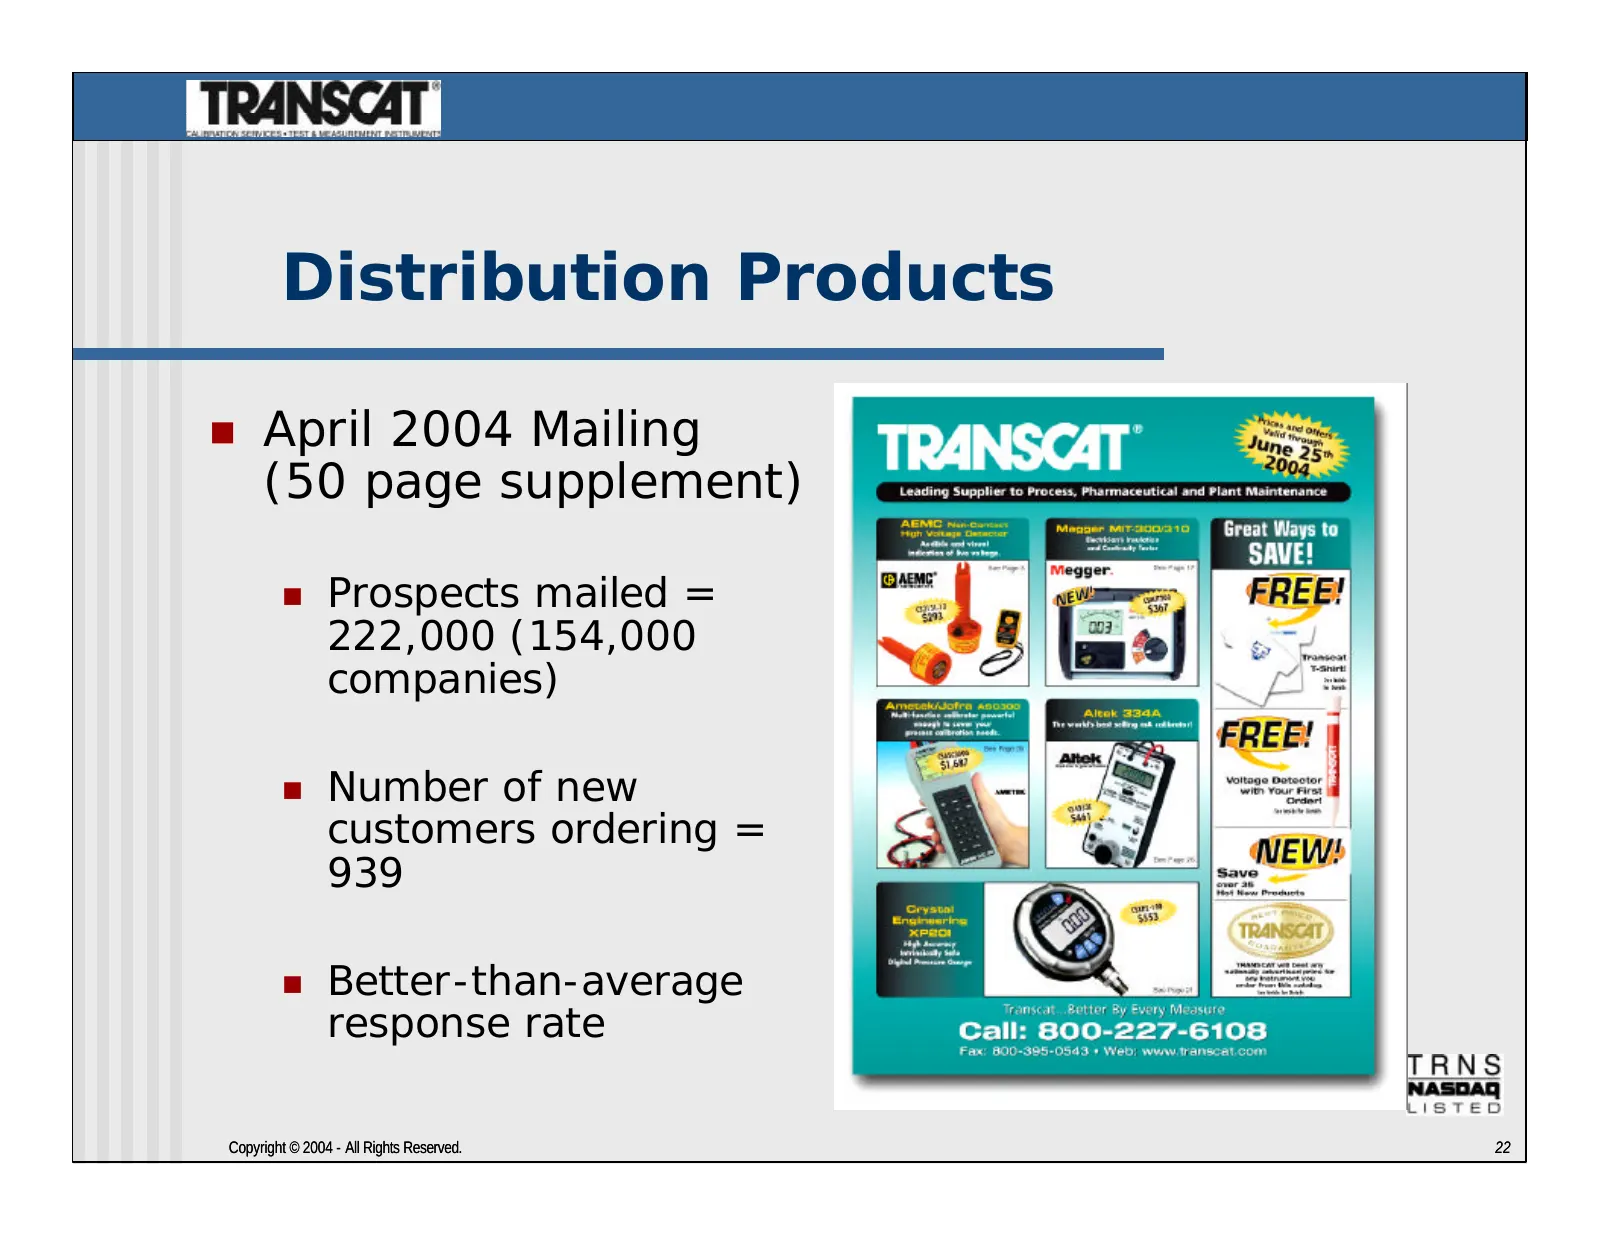
Distribution Products n April 2004 Mailing (50 page supplement) n Prospects mailed = 222,000 (154,000 companies) n Number of new customers ordering = 939 n Better-than-average response rate Copyright © 2004 - All Rights Reserved. 22
Slide 23: Distribution Products Targeted Mailings
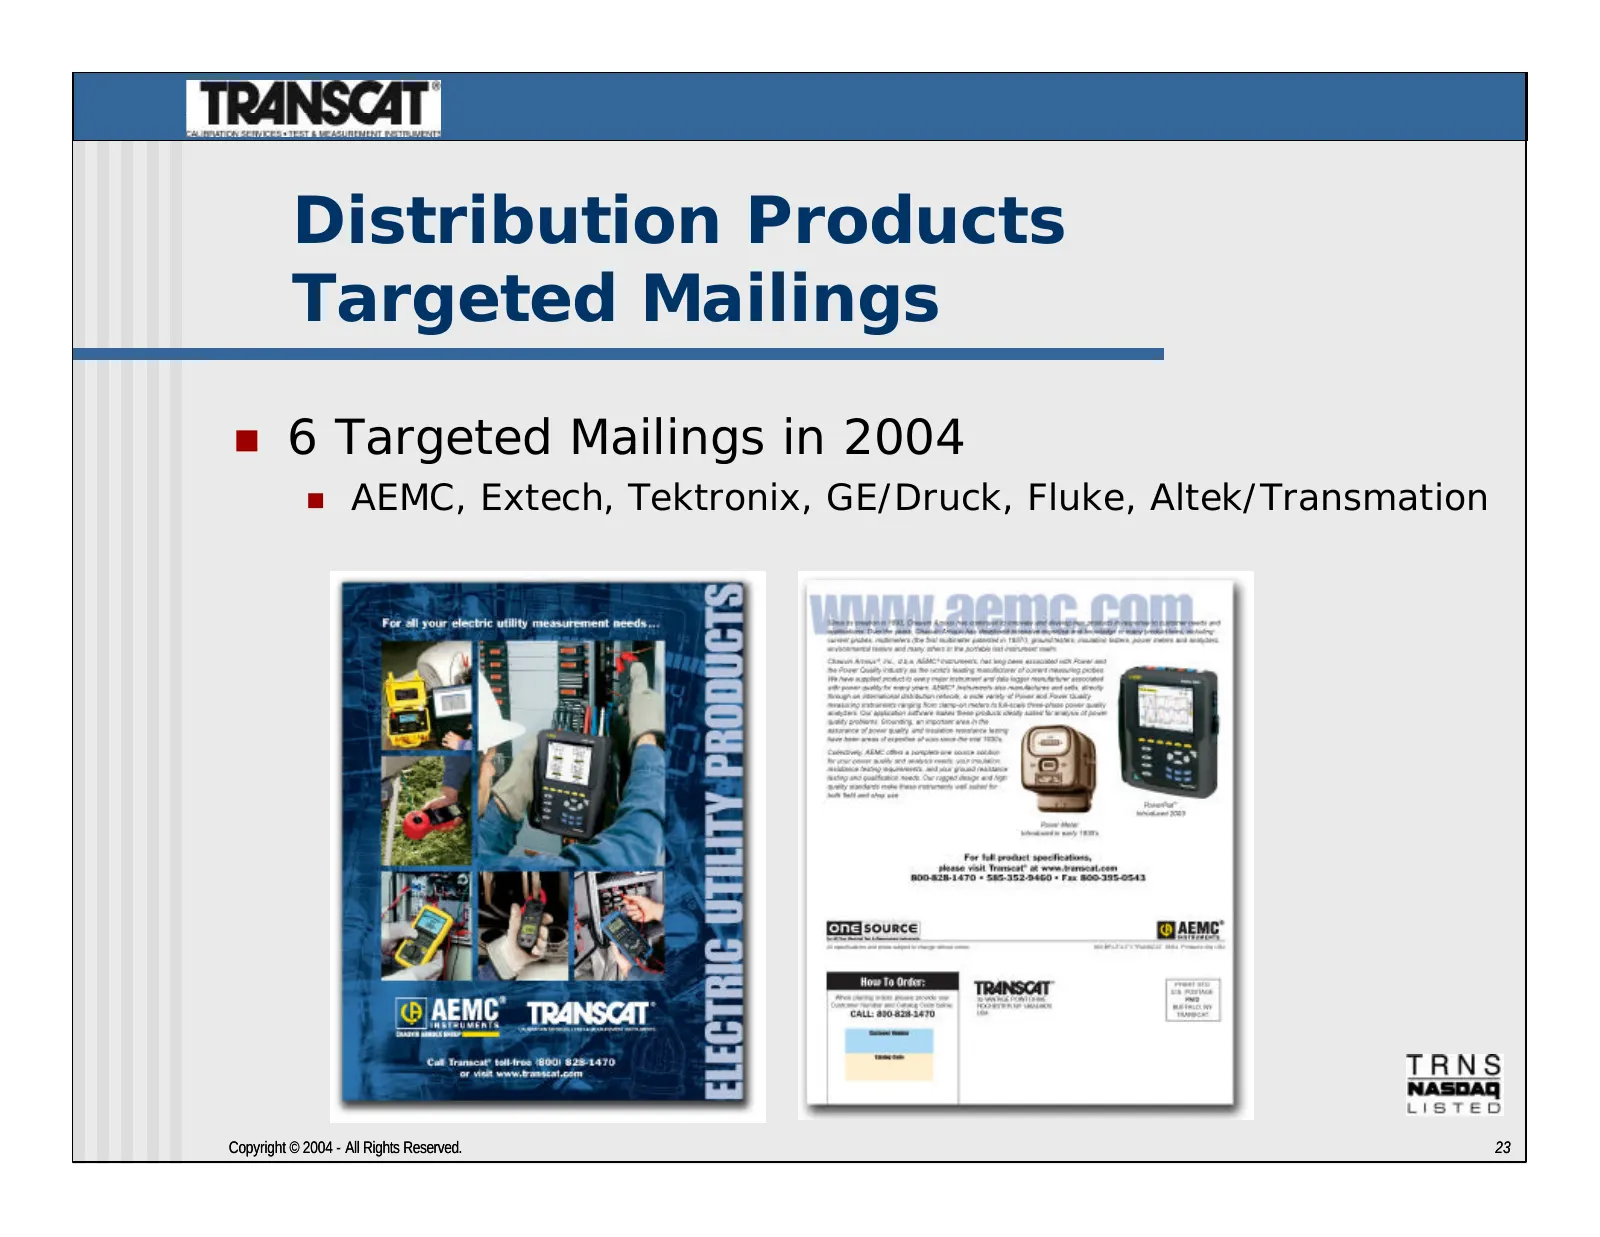
Distribution Products Targeted Mailings n 6 Targeted Mailings in 2004 n AEMC, Extech, Tektronix, GE/Druck, Fluke, Altek/Transmation Copyright © 2004 - All Rights Reserved. 23
Slide 24: Transcat Today: Expanding Presence in the Global and Fortune 500
Transcat Today: Expanding Presence in the Global and Fortune 500 35% Calibration 39% Sales Product 30% Sales 31% Total 32% Sales 34% FY03 FY04 Copyright © 2004 - All Rights Reserved. 24
Slide 25: Financial Review
Transcat, Inc. Financial Review Charles P. Hadeed COO, VP-Finance, and CFO Copyright © 2004 - All Rights Reserved. 25
Slide 26: Fiscal 2004 Financial Review
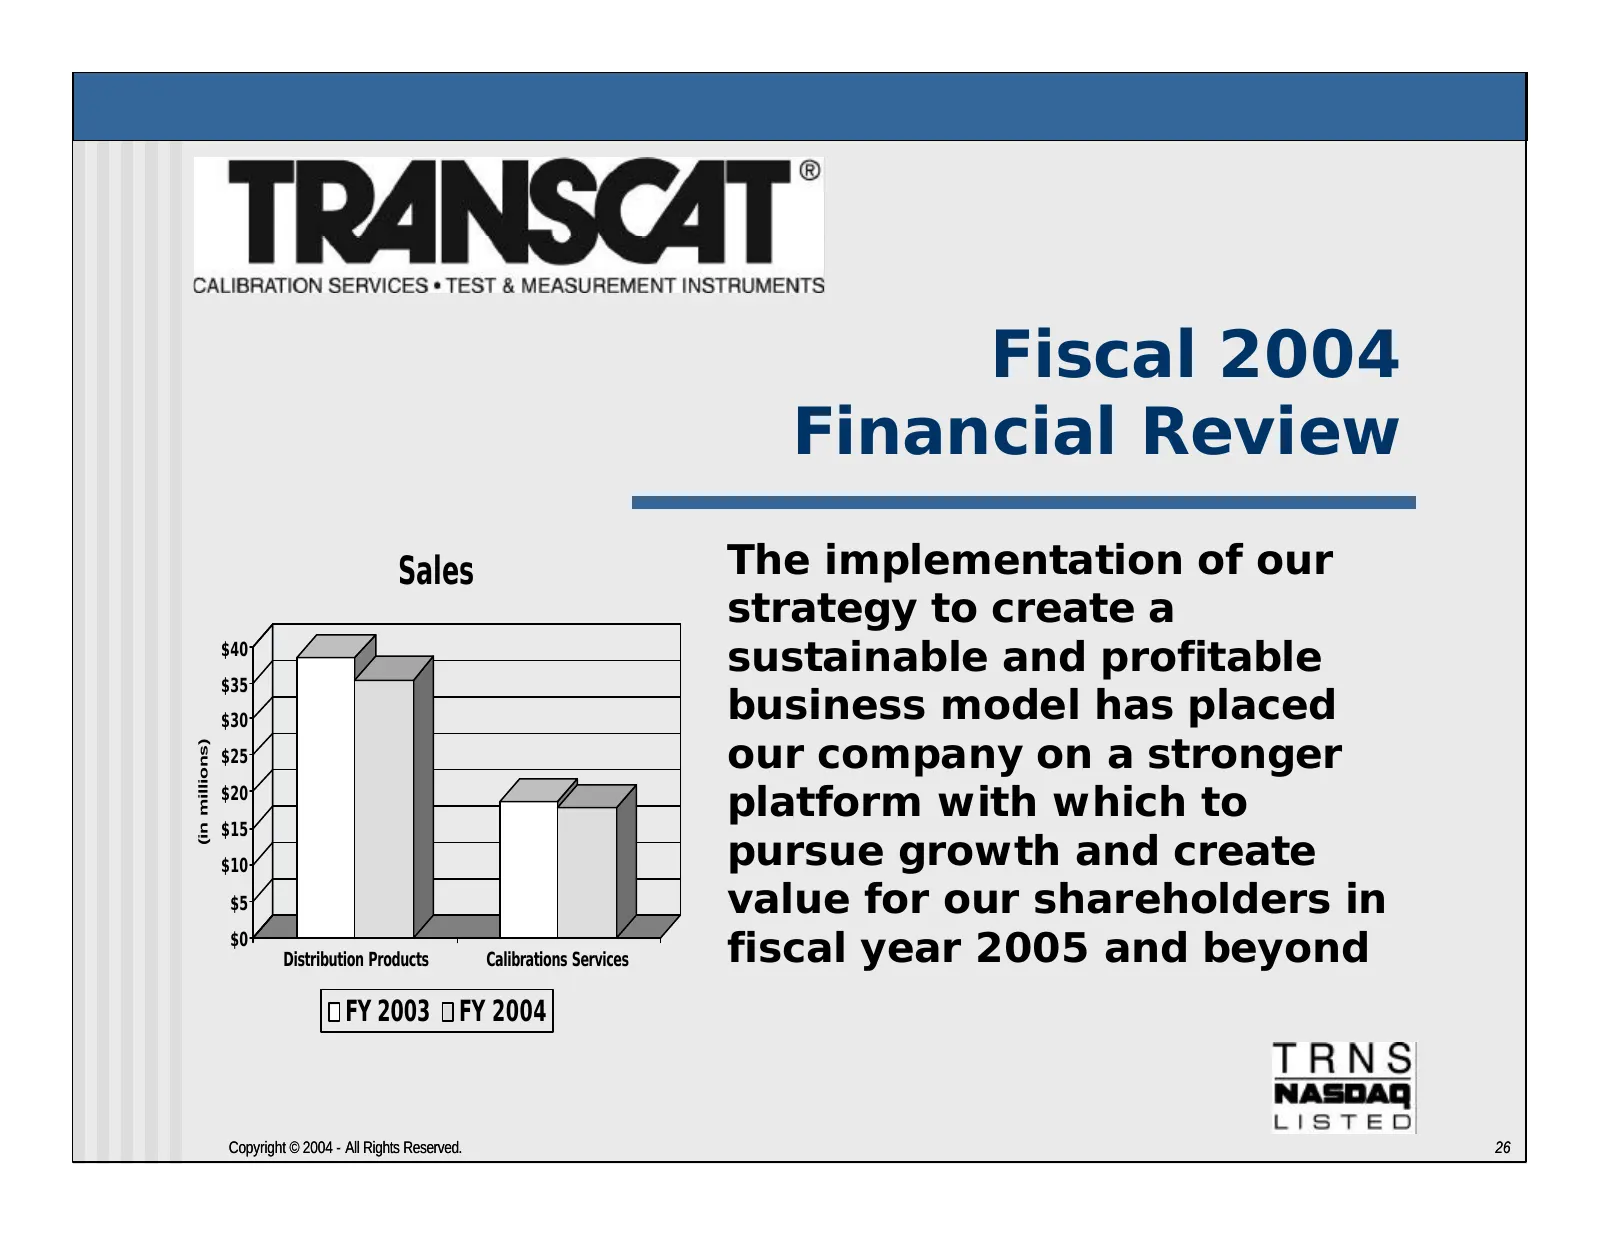
Fiscal 2004 Financial Review Sales The implementation of our strategy to create a $40 sustainable and profitable $35 $30 business model has placed our company on a stronger (in millions) $25 $20 $15 platform with which to $10 pursue growth and create $5 value for our shareholders in $0 Distribution
Slide 27: Financial Review: Summary of Progress
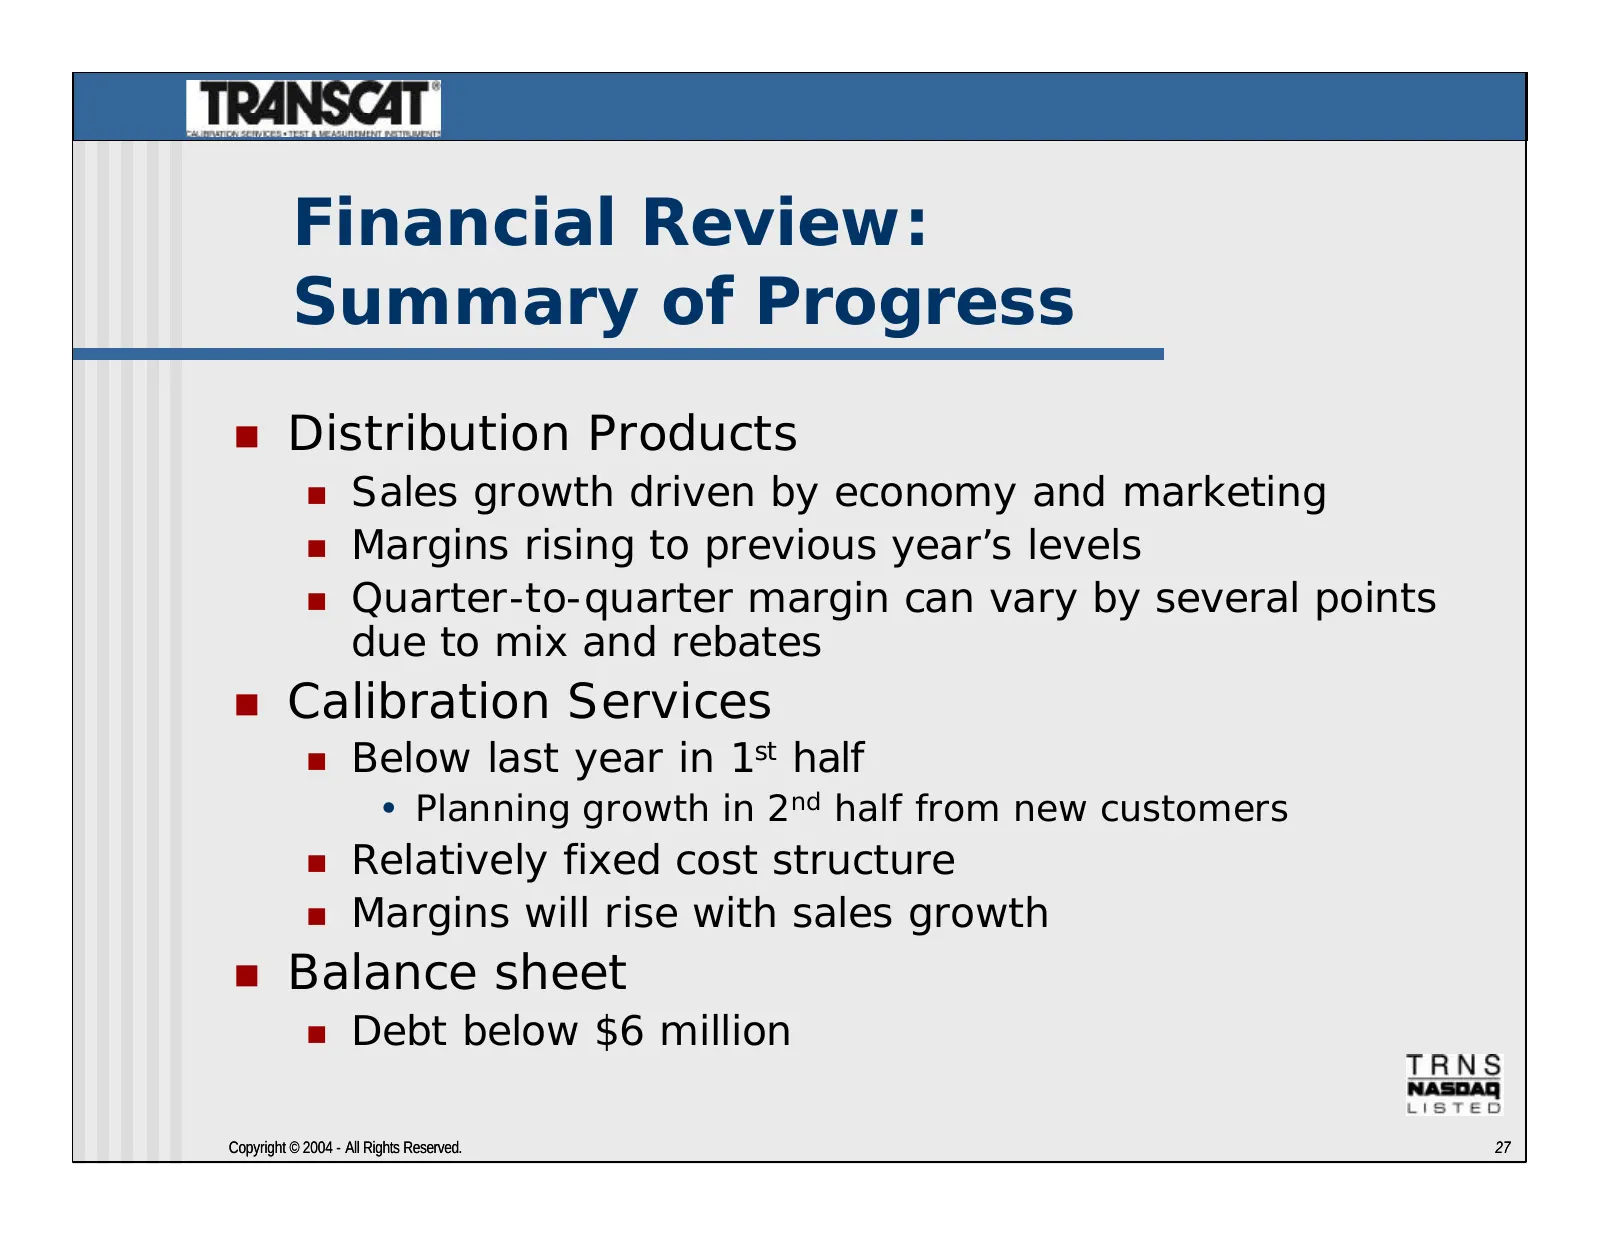
Financial Review: Summary of Progress n Distribution Products n Sales growth driven by economy and marketing n Margins rising to previous year’s levels n Quarter-to-quarter margin can vary by several points due to mix and rebates n Calibration Services n Below last year in 1st half • Planning growth
Slide 28: FY 2004 Financial Highlights
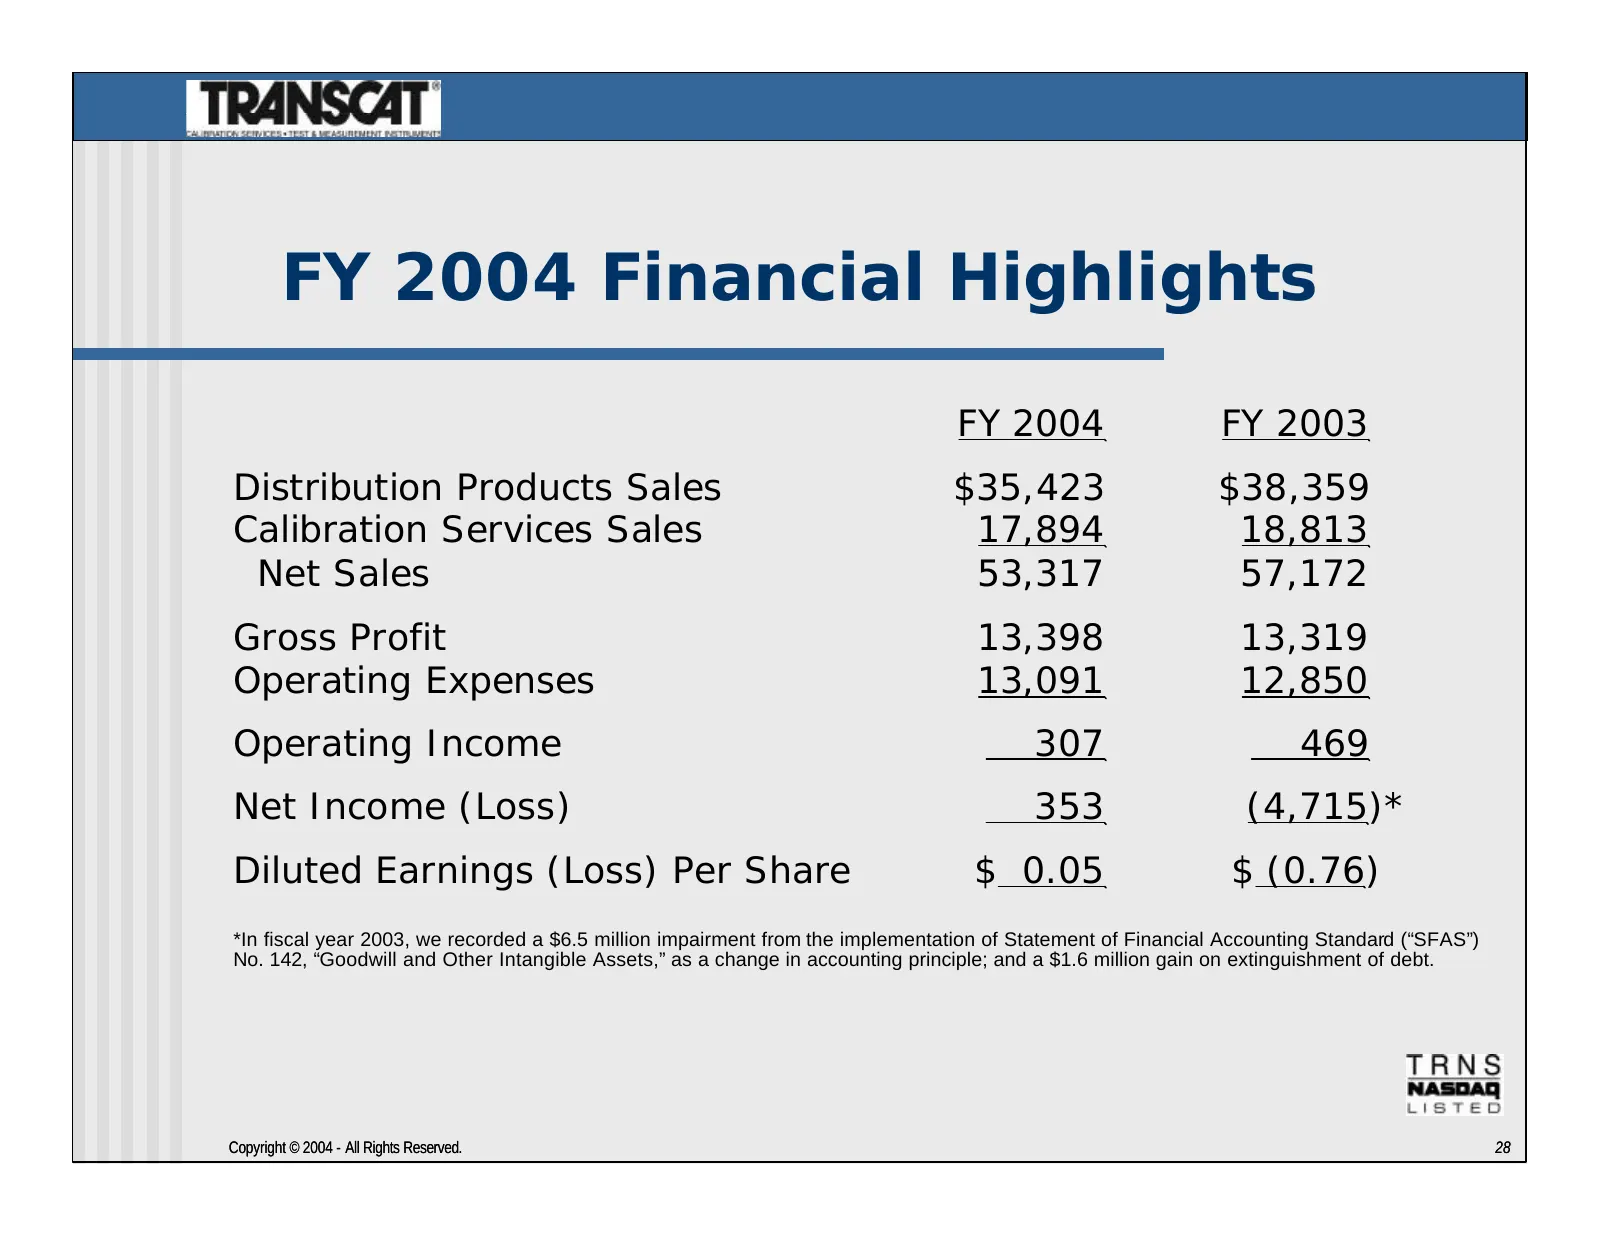
FY 2004 Financial Highlights FY 2004 FY 2003 Distribution Products Sales $35,423 $38,359 Calibration Services Sales 17,894 18,813 Net Sales 53,317 57,172 Gross Profit 13,398 13,319 Operating Expenses 13,091 12,850 Operating Income 307 469 Net Income (Loss) 353 (4,715)* Diluted Earnings (Loss) Per Sh
Slide 29: FY 2005/1H Financial Highlights
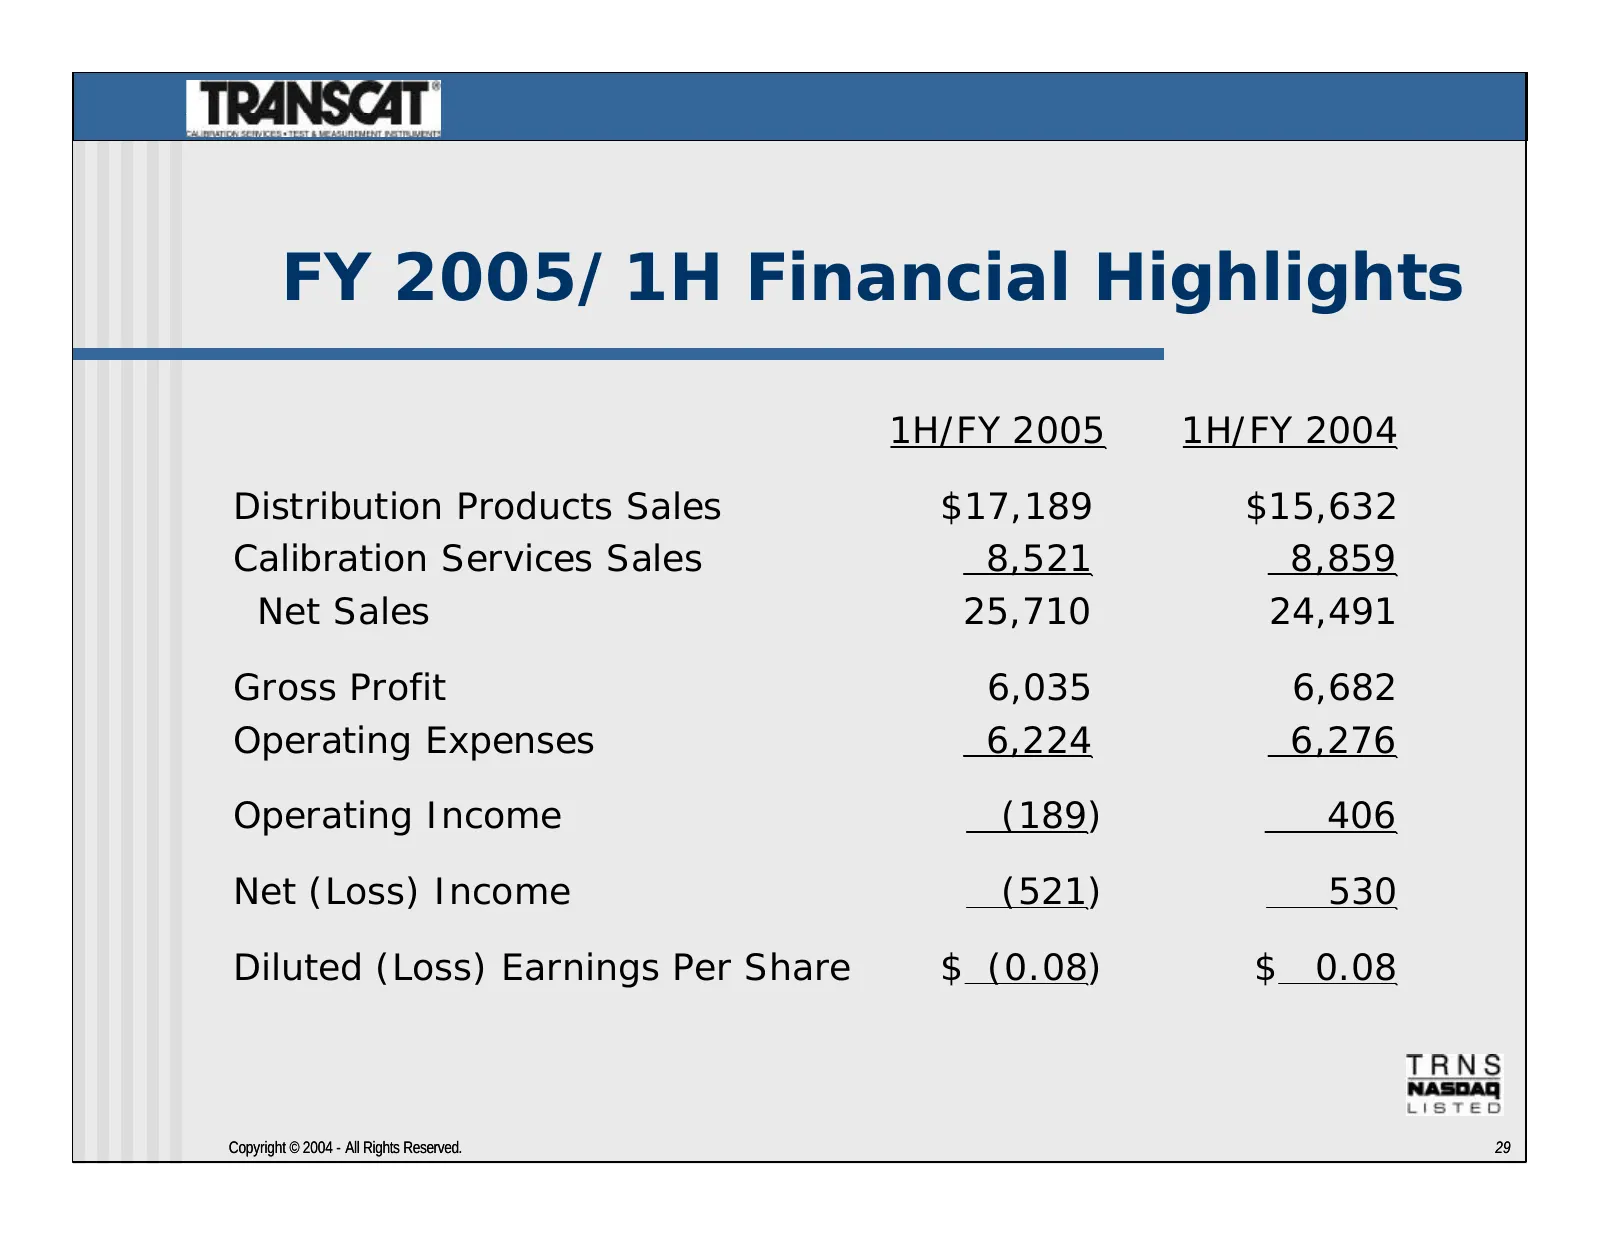
FY 2005/1H Financial Highlights 1H/FY 2005 1H/FY 2004 Distribution Products Sales $17,189 $15,632 Calibration Services Sales 8,521 8,859 Net Sales 25,710 24,491 Gross Profit 6,035 6,682 Operating Expenses 6,224 6,276 Operating Income (189) 406 Net (Loss) Income (521) 530 Diluted (Loss) Earnings Per
Slide 30: Product Trends
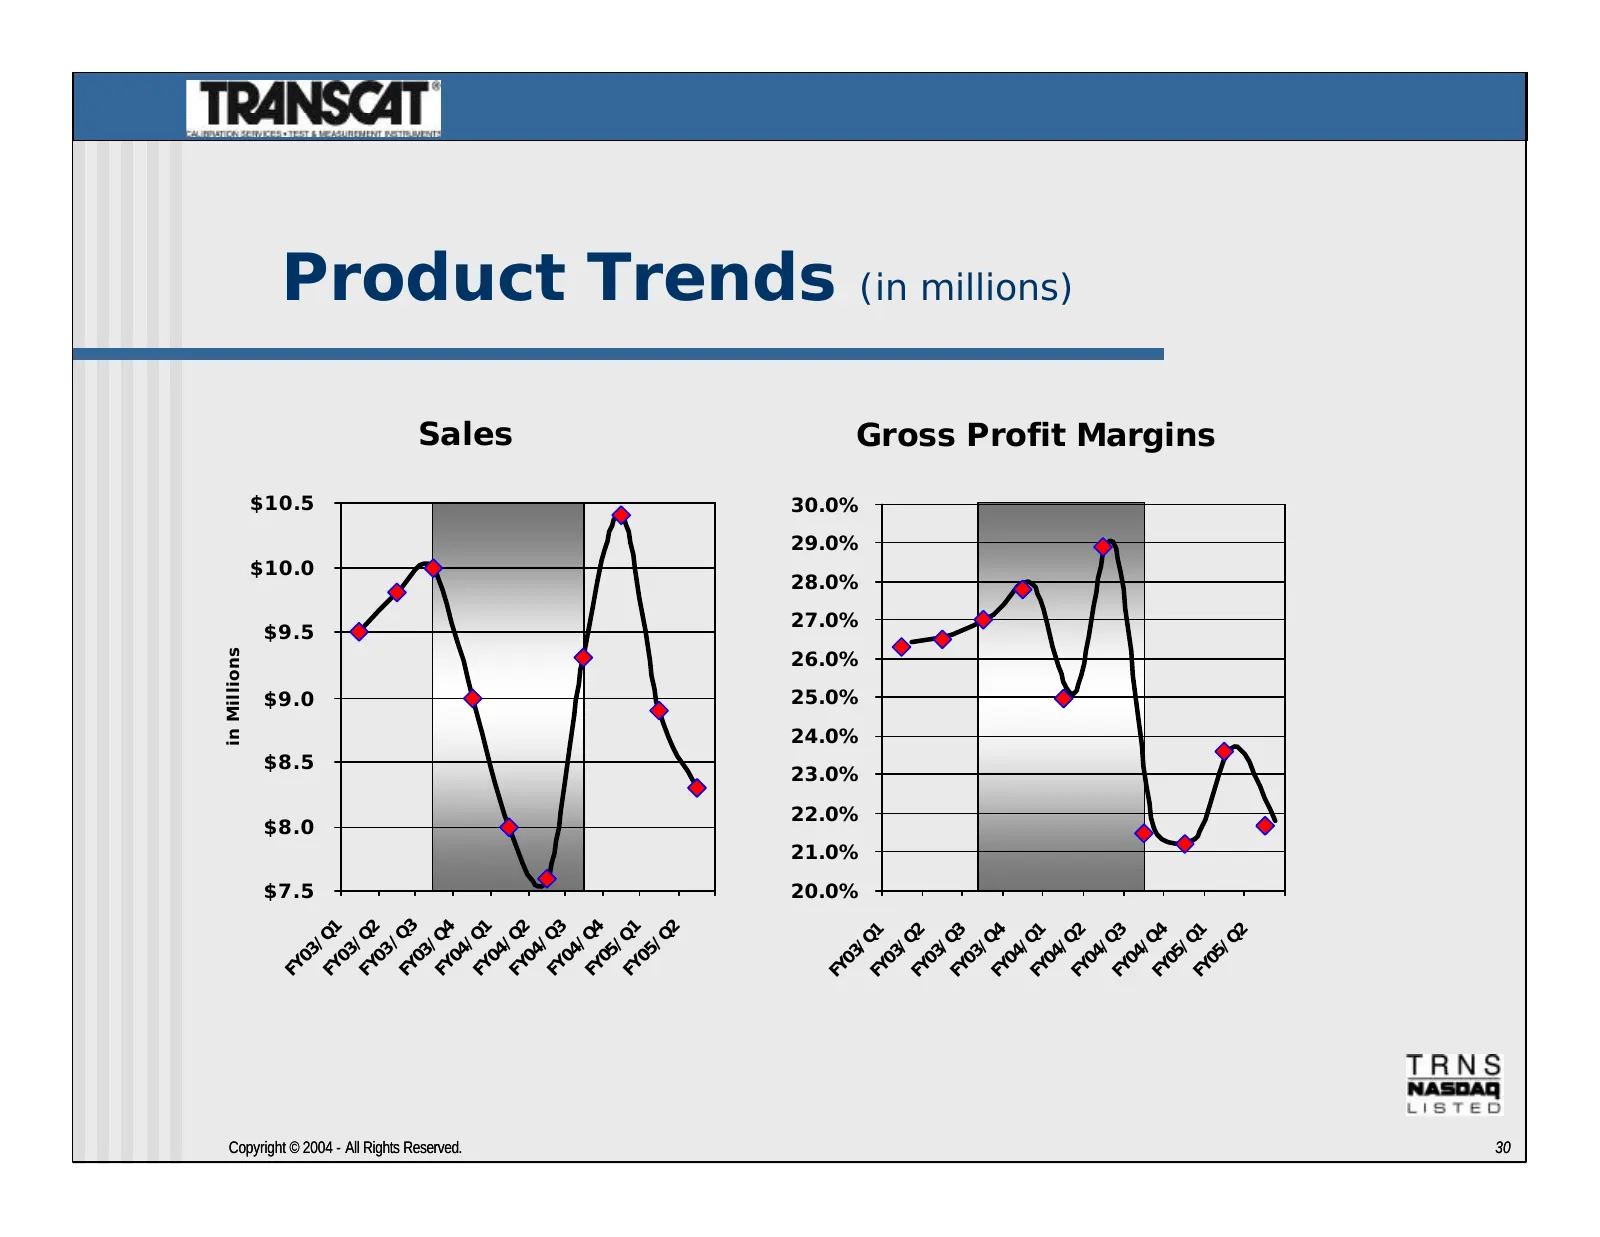
Product Trends (in millions) Sales Gross Profit Margins $10.5 30.0% 29.0% $10.0 28.0% 27.0% $9.5 26.0% in Millions $9.0 25.0% 24.0% $8.5 23.0% 22.0% $8.0 21.0% $7.5 20.0% FY Q3 FY Q1 FY Q2 FY Q1 FY Q2 FY Q3 FY Q4 2 FY Q4 FY Q1 FY Q1 FY Q2 FY Q3 FY Q4 FY Q1 FY Q2 FY Q3 FY Q4 FY Q1 2 /Q /Q / / / / / /
Slide 31: Product Channels/Gross Profit
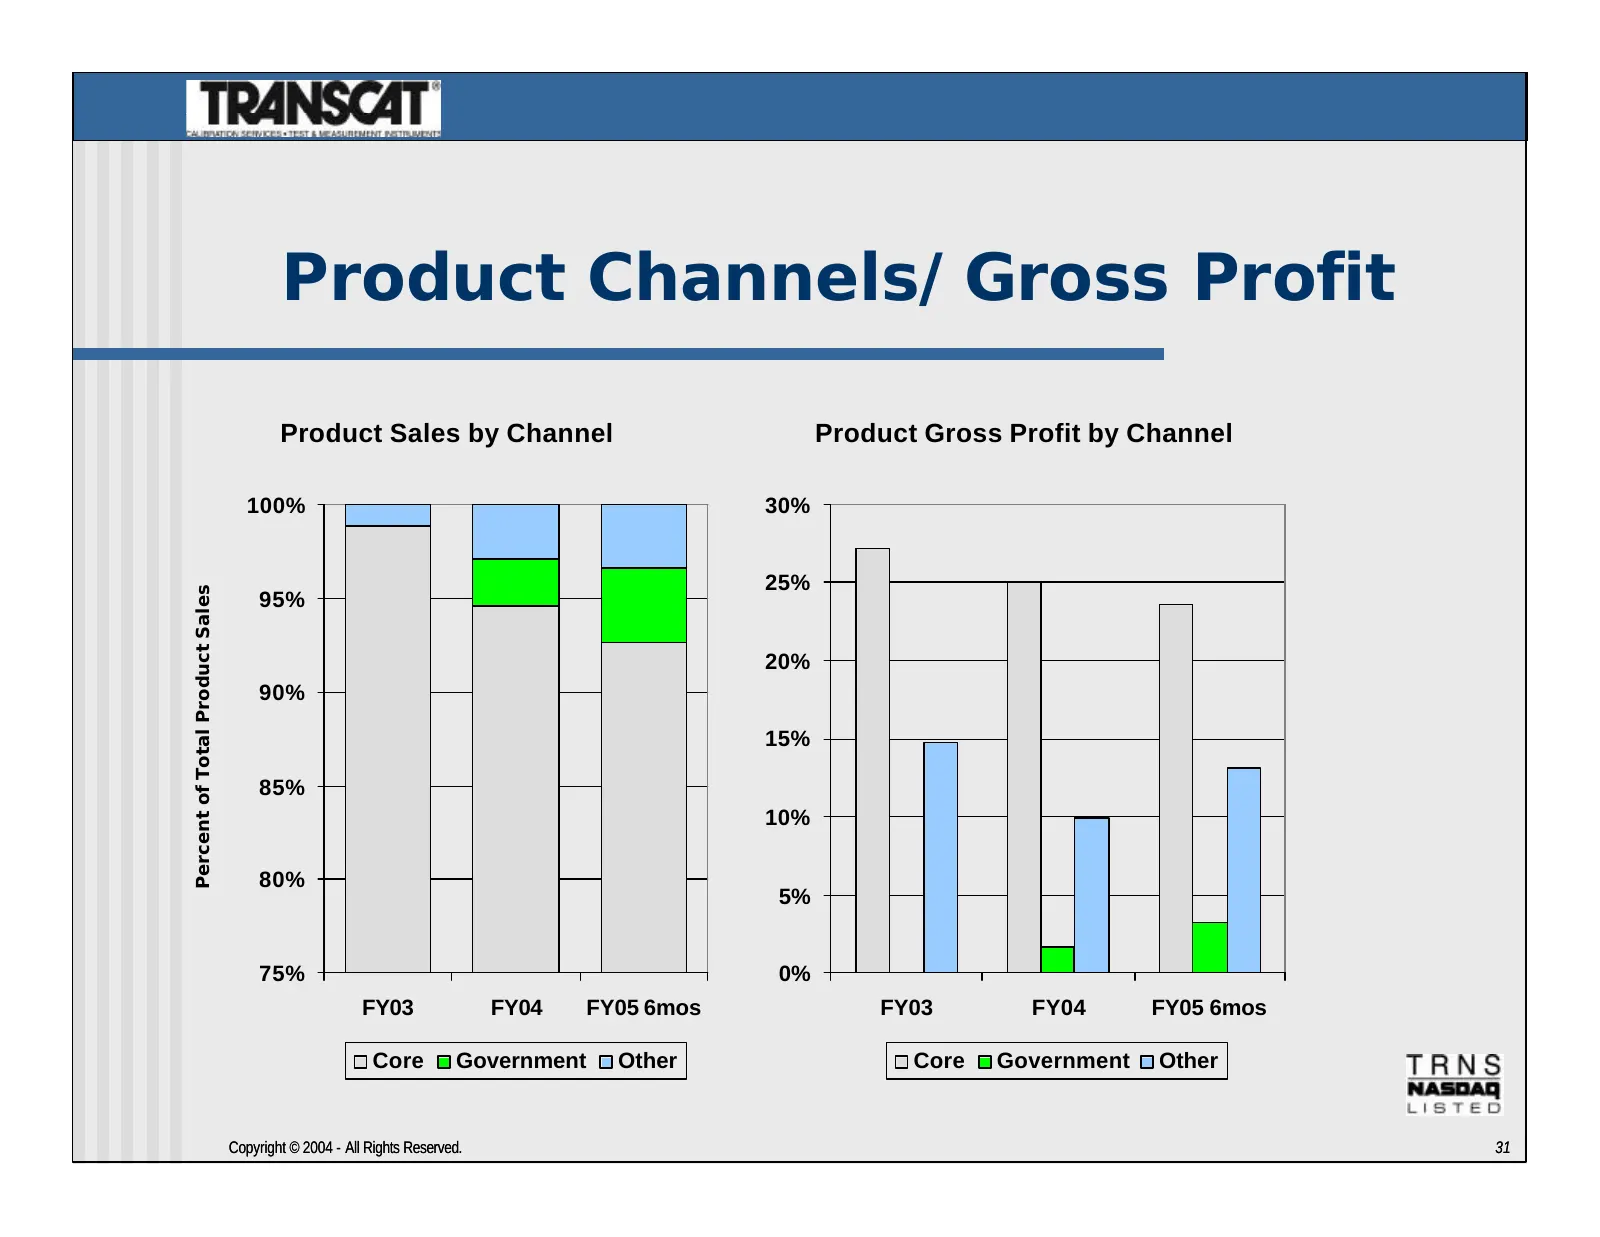
Product Channels/Gross Profit Product Sales by Channel Product Gross Profit by Channel 100% 30% 25% Percent of Total Product Sales 95% 20% 90% 15% 85% 10% 80% 5% 75% 0% FY03 FY04 FY05 6mos FY03 FY04 FY05 6mos Core Government Other Core Government Other Copyright © 2004 - All Rights Reserved. 31
Slide 32: Calibration Trends
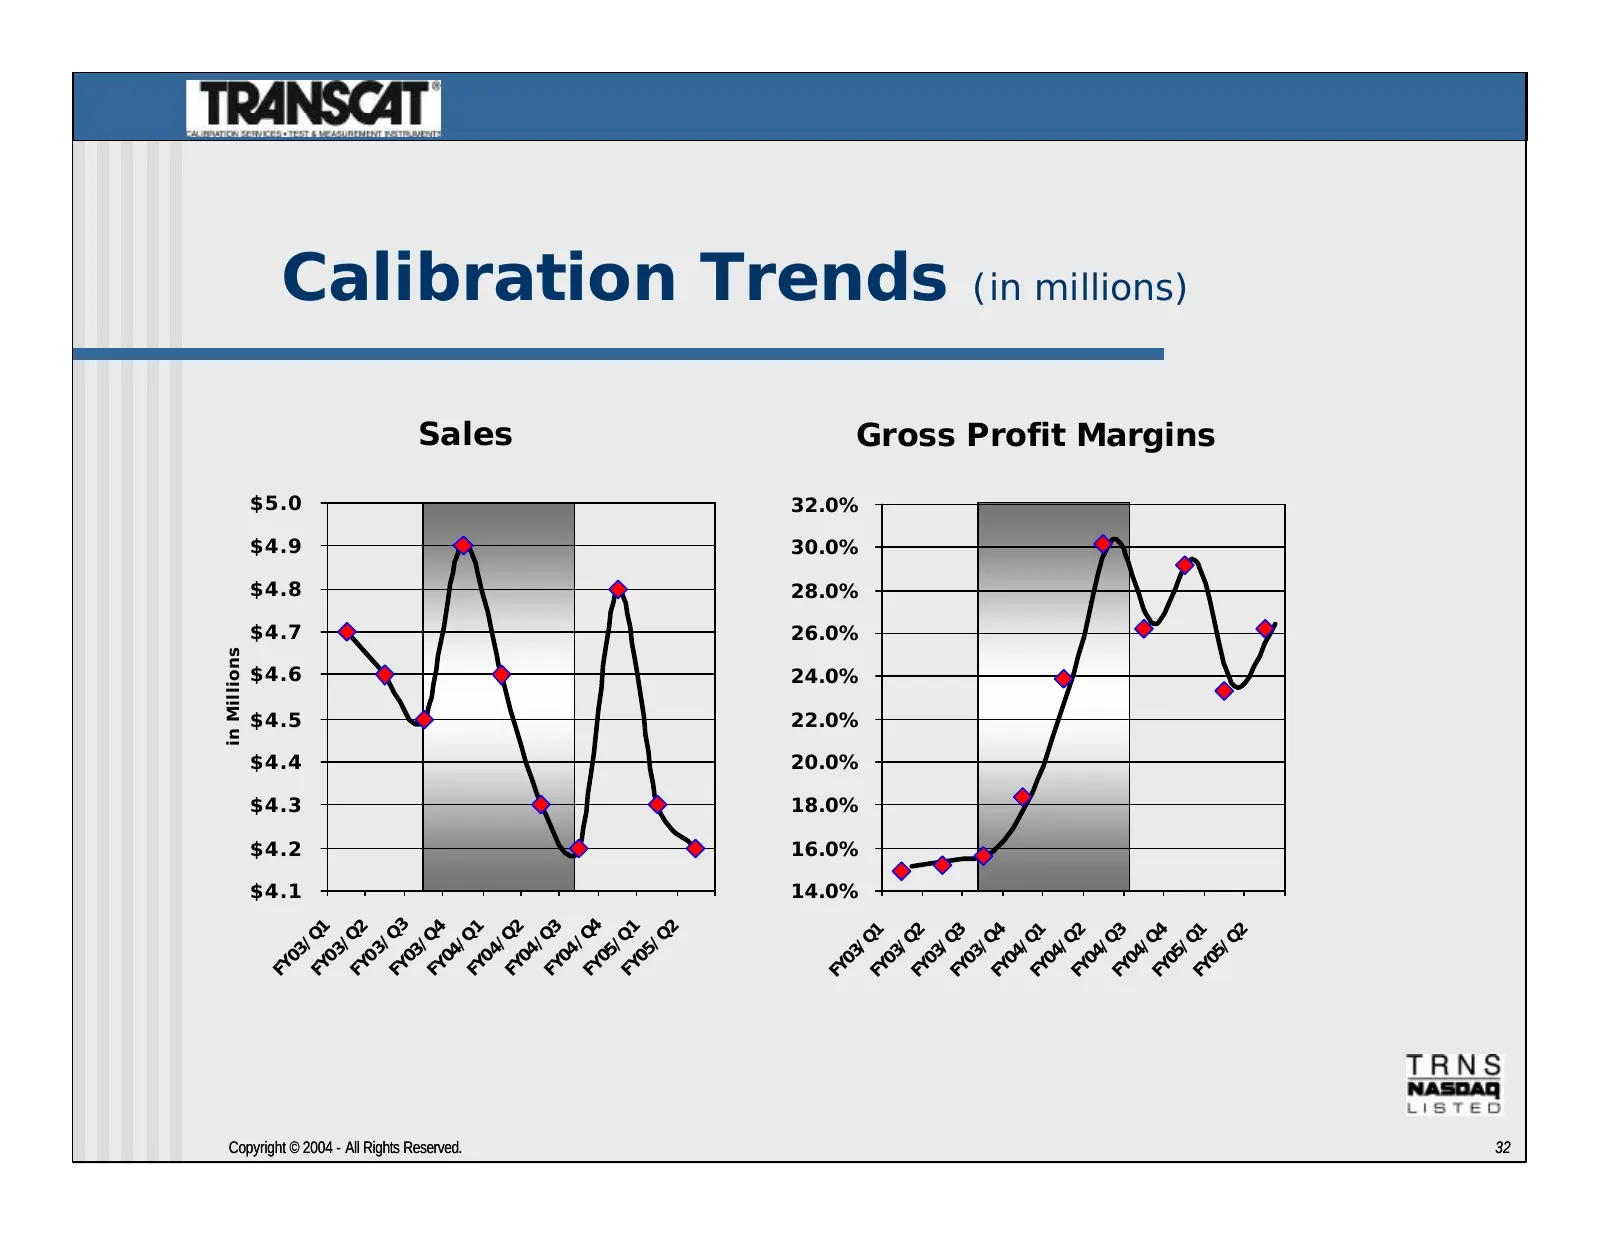
Calibration Trends (in millions) Sales Gross Profit Margins $5.0 32.0% $4.9 30.0% $4.8 28.0% $4.7 26.0% in Millions $4.6 24.0% $4.5 22.0% $4.4 20.0% $4.3 18.0% $4.2 16.0% $4.1 14.0% FY Q3 FY Q4 FY Q1 FY Q2 FY Q2 FY Q3 2 FY Q4 FY Q1 FY Q1 FY Q1 FY Q2 FY Q3 FY Q4 FY Q1 FY Q2 FY Q3 FY Q4 FY Q1 2 /Q /Q
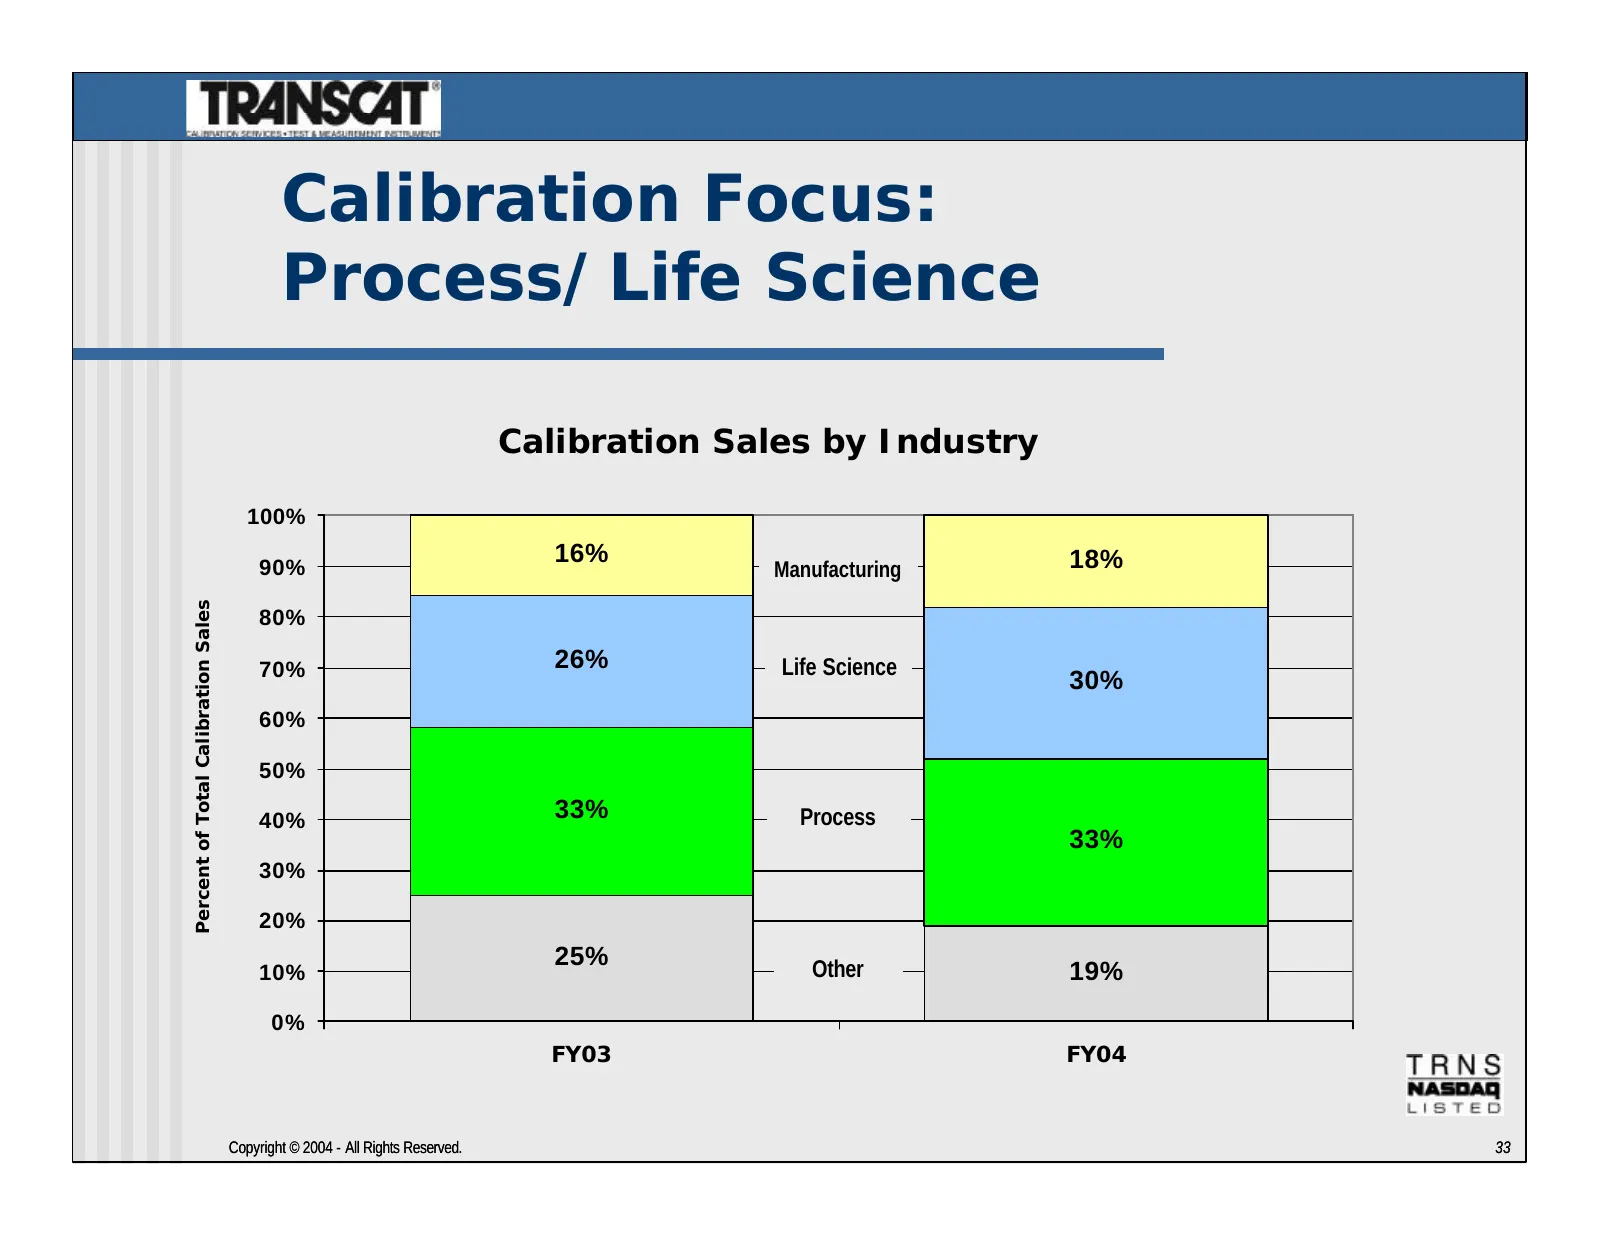
Slide 33: Calibration Focus: Process/Life Science
Calibration Focus: Process/Life Science Calibration Sales by Industry 100% 16% 18% 90% Manufacturing Percent of Total Calibration Sales 80% 70% 26% Life Science 30% 60% 50% 40% 33% Process 33% 30% 20% 25% Other 10% 19% 0% FY03 FY04 Copyright © 2004 - All Rights Reserved. 33
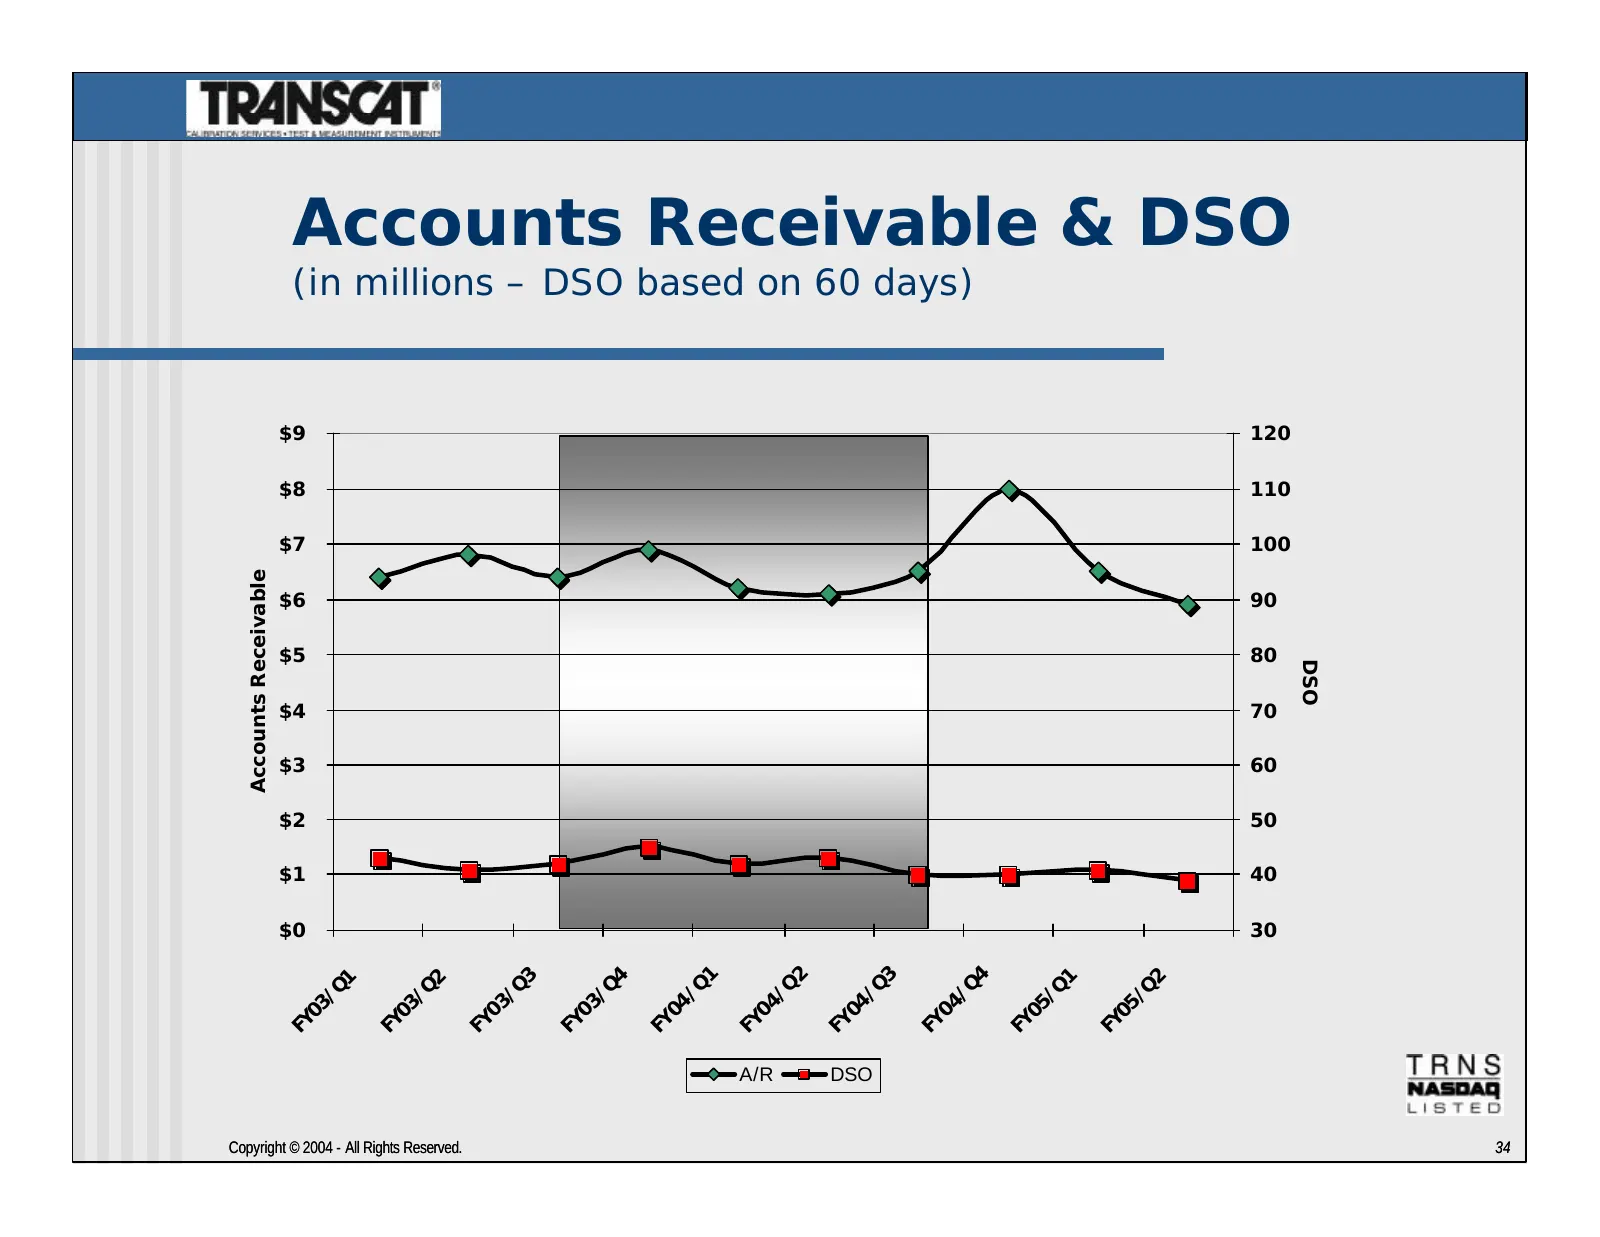
Slide 34: Accounts Receivable & DSO
Accounts Receivable & DSO (in millions – DSO based on 60 days) $9 120 $8 110 $7 100 Accounts Receivable $6 90 $5 80 DSO $4 70 $3 60 $2 50 $1 40 $0 30 1 2 3 4 3 4 1 2 1 2 /Q /Q /Q /Q /Q /Q /Q /Q /Q /Q 04 04 04 04 03 03 05 05 03 03 FY FY FY FY FY FY FY FY FY FY A/R DSO Copyright © 2004 - All Rights Re
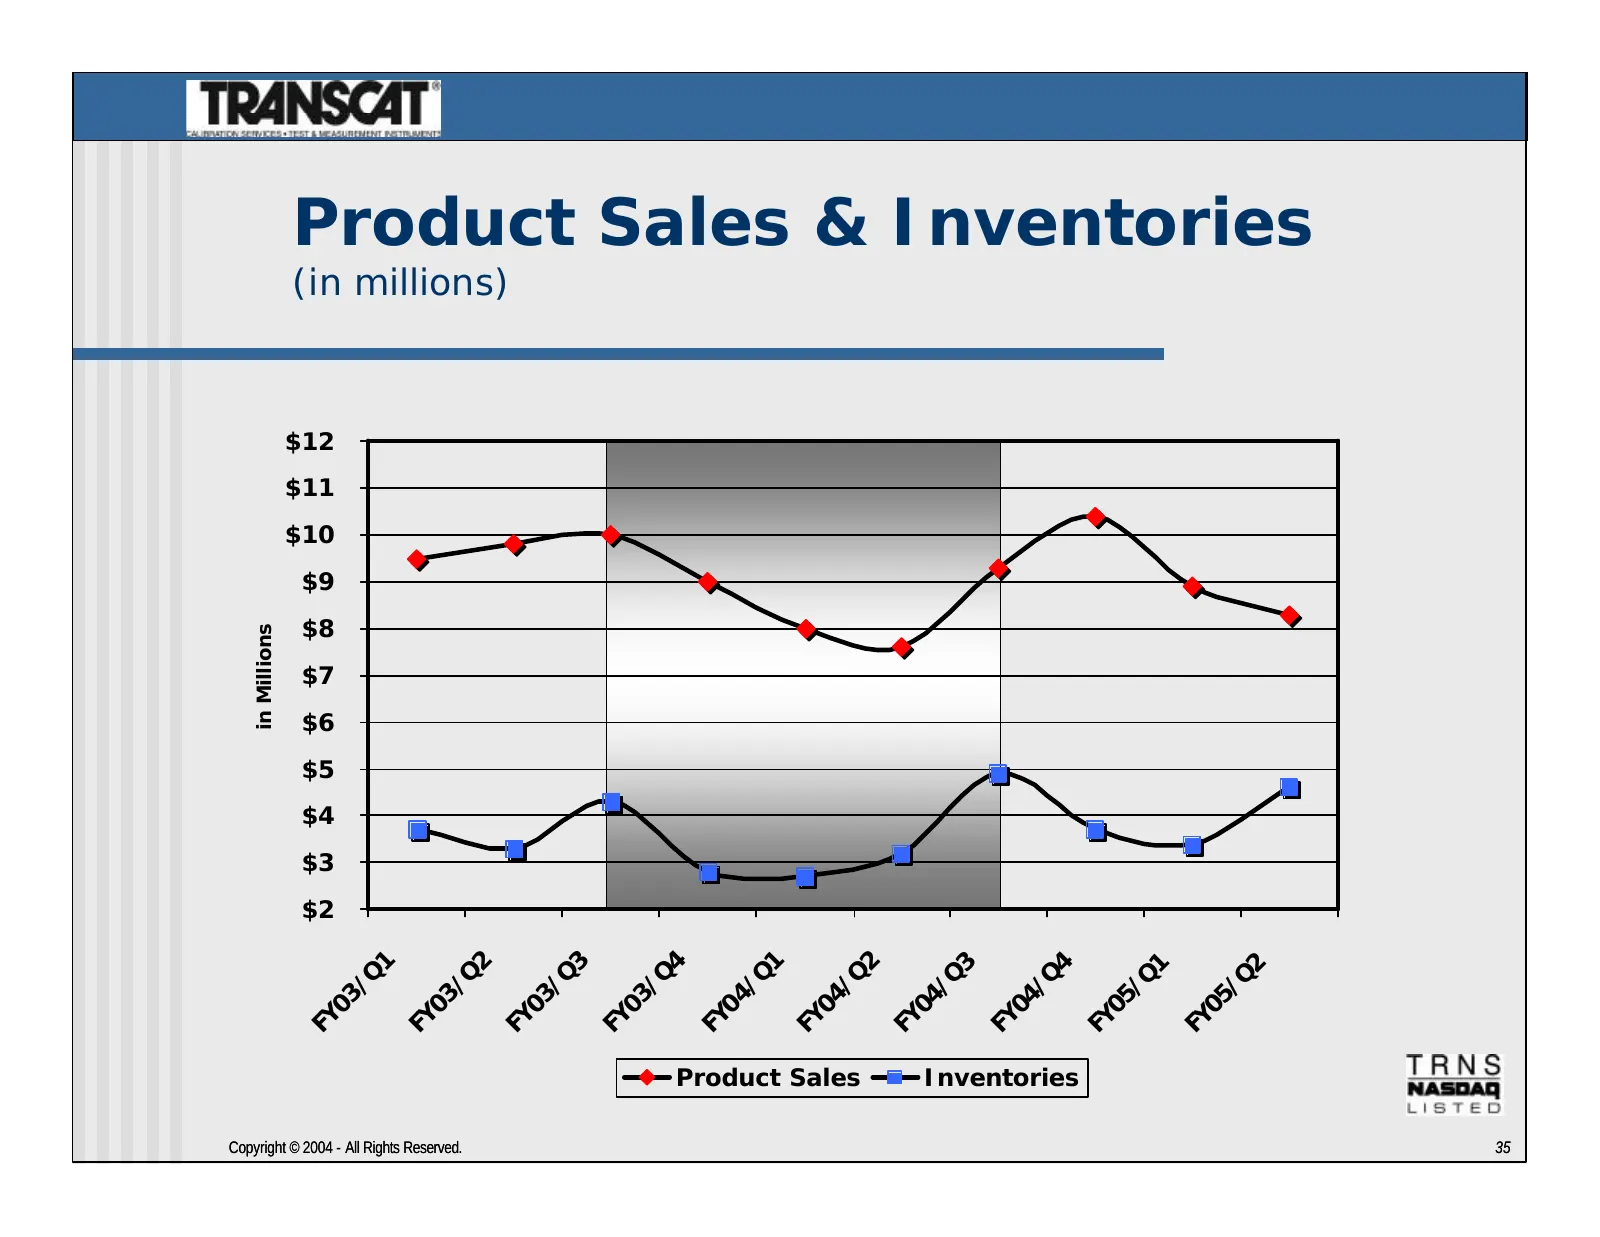
Slide 35: Product Sales & Inventories
Product Sales & Inventories (in millions) $12 $11 $10 $9 $8 in Millions $7 $6 $5 $4 $3 $2 1 2 3 4 1 2 3 4 1 2 /Q /Q /Q /Q /Q /Q /Q /Q /Q /Q 03 03 03 03 04 04 04 04 05 05 FY FY FY FY FY FY FY FY FY FY Product Sales Inventories Copyright © 2004 - All Rights Reserved. 35
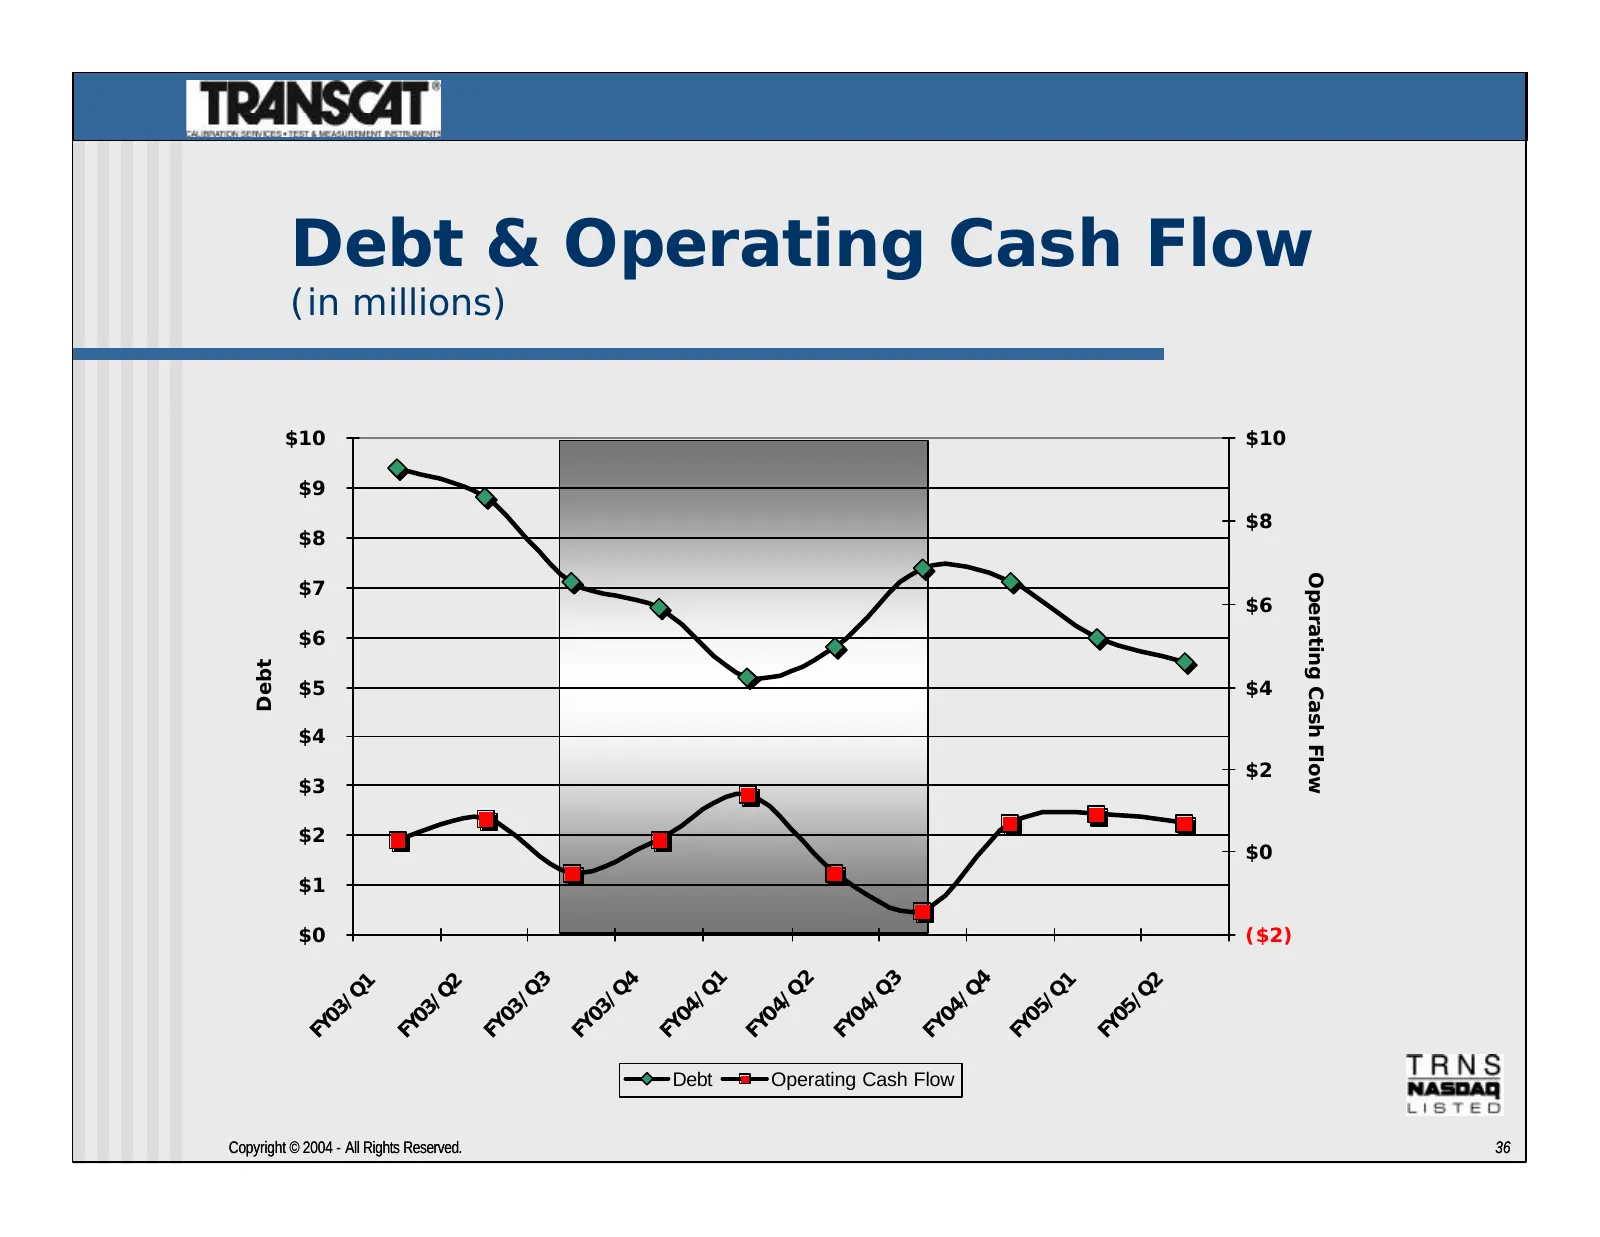
Slide 36: Debt & Operating Cash Flow
Debt & Operating Cash Flow (in millions) $10 $10 $9 $8 $8 Operating Cash Flow $7 $6 $6 Debt $5 $4 $4 $2 $3 $2 $0 $1 $0 ($2) 1 2 3 4 3 4 1 2 1 2 /Q /Q /Q /Q /Q /Q /Q /Q /Q /Q 04 04 04 04 03 03 05 05 03 03 FY FY FY FY FY FY FY FY FY FY Debt Operating Cash Flow Copyright © 2004 - All Rights Reserved. 3
Slide 37: Corporate Governance
Corporate Governance n Transcat is in compliance with all such corporate governance requirements to date n Corporate Governance Guidelines in place n Written charters for Board of Directors’ Audit, Compensation, and Nominating Committees n Code of Ethics for Senior Financial Officers n Code of Busin
Slide 38: FY 2005 Outlook
FY 2005 Outlook n Calibration Services - planning for sales growth driven by sales force efforts to identify and close Calibration Services business leads n Growth in any individual quarter will be based solely on the size of new business in that period n Distribution Products - should benefit from
Slide 39: FY 2005 Outlook
FY 2005 Outlook n Gross margin expected to improve overall in the range of 1-3 points as calibration sales increase n Manpower increases will result only from a need to fulfill new Calibration Services business beyond its current capacity n Second shift operations added as volume dictates n Increase
Slide 40: Transcat, Inc. - Why Invest?
Transcat, Inc. - Why Invest? n Profitable business model established n Enhanced management processes in place n Working the sales and marketing fundamentals of long-term growth n Planning for long-term Calibration Services growth • Single digits; gross profit margins increasing as a percent of sales
Slide 41: For Additional Information
For Additional Information To receive additional information about Transcat, please contact: Charles P. Hadeed Van Negris or COO, VP-Finance & CFO Lexi Terrero Transcat, Inc. Van Negris & Co., Inc. 35 Vantage Point Drive 1120 Avenue of the Rochester, NY 14624 Americas - Suite 4100 Tel: 585-352-777 N
Source: Internet Archive copy of transcat.com
More decks from Transcat, Inc.
 Q2 FY2027 Earnings Presentation16 slides · Nov 3, 2026
 Investor Presentation (September 2026)31 slides · September 2026
 Q1 FY2027 Earnings Presentation15 slides · Aug 4, 2026
 Investor Presentation (June 2026)29 slides · June 2026
 Q4 FY2026 Earnings Presentation15 slides · May 26, 2026
 Q4 2026 Earnings Presentation15 slides · May 26, 2026