First Financial Northwest — Shareholder Meeting (May 2013)
29 slides from First Financial Northwest's shareholder meeting presentation, May 20, 2013
Slide 1: Welcome to the Sixth Annual Meeting of Shareholders
t FIRST FINANCIAL NORTHWEST Welcome to the Sixth Annual Meeting of Shareholders May 15, 2013 Gary F. Kohlwes, Chairman NASDAQ GS: FFNW
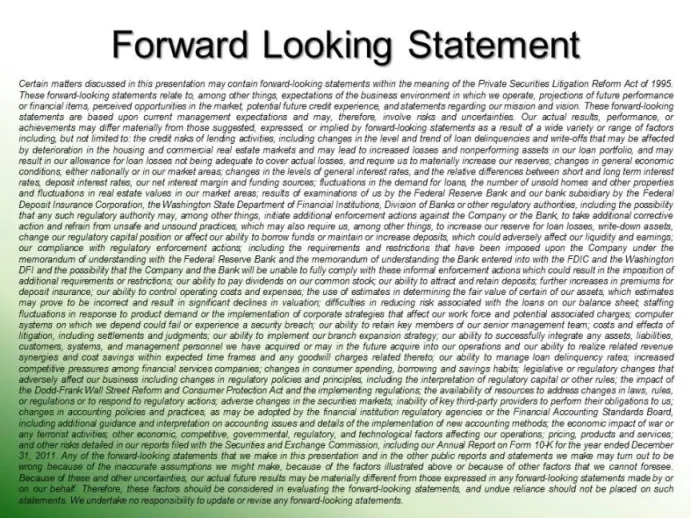
Slide 2: Forward Looking Statement
Forward Looking Statement by including but nc lted othe credéneks of lend actnbes,ncludg changes the lve and rend of oan denquences and wnte-fs that may be affected by deterortion in the housing and commercial realestate makets and may lad fo increased losses and nonpefoming asses in ou" lan porta.
Slide 3: Agenda
Agenda Corporate Overview 2012 and Q2 2013 Results Asset Quality 2013 Outlook, Summary, and 2013 Focus Market Environment a,
Slide 4: Corporate Overview
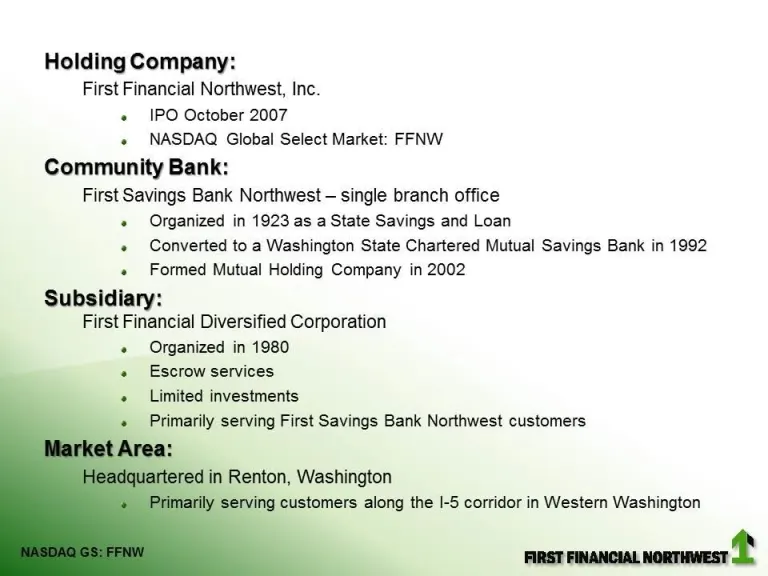
Slide 5: Holding Company
Holding Company: First Financial Northwest, Inc. « IPO October 2007 «+ NASDAQ Global Select Market: FFNW Community Bank: First Savings Bank Northwest — single branch office + Organized in 1923 as a State Savings and Loan + Converted to a Washington State Chartered Mutual Savings Bank in 1992 + Forme
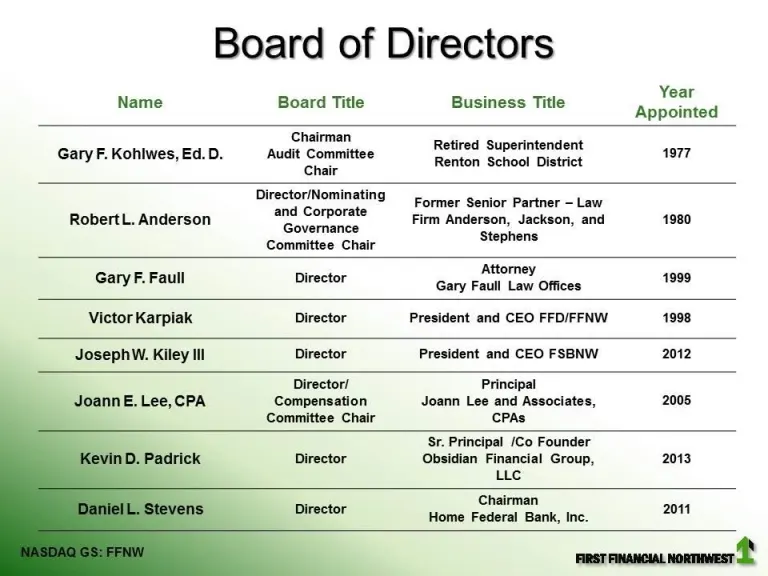
Slide 6: Board of Directors
Board of Directors Name Board Title Business Title Lt Appointed Chairman Retired Superintendent GaryF. Kohiwes,Ed.D. Audit Commitee Tene Scheel Dlctnel 1977 resi tionmeins Former Senior Partner - Law RobertL. Anderson "Govortanes Firm Anderson, Jackson, and 1980 Committee Chair Srna Attorney Gary F.
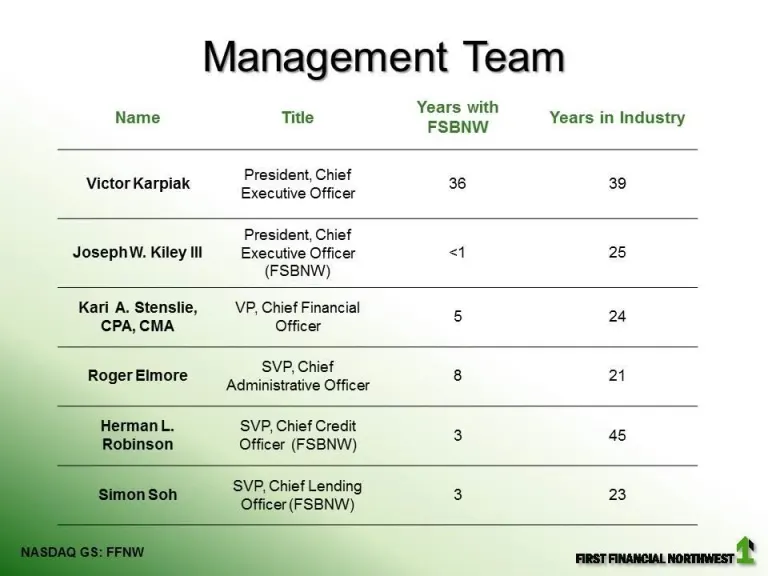
Slide 7: Management Team
Management Team Years with : Name Title petit Years in Industry a President, Chief VictorKarpiak resident. Chief 36 39 President, Chief JosephW. Kiley lll Executive Officer <1 25 (FSBNW) Kari A. Stenslie, VP, Chief Financial 5 4 CPA, CMA Officer SVP, Chief RogerEimore a cministrative Officer 5 44 SV
Slide 8: 2012 and Q1 2013 Results
Slide 9: First Financial Northwest Snapshot
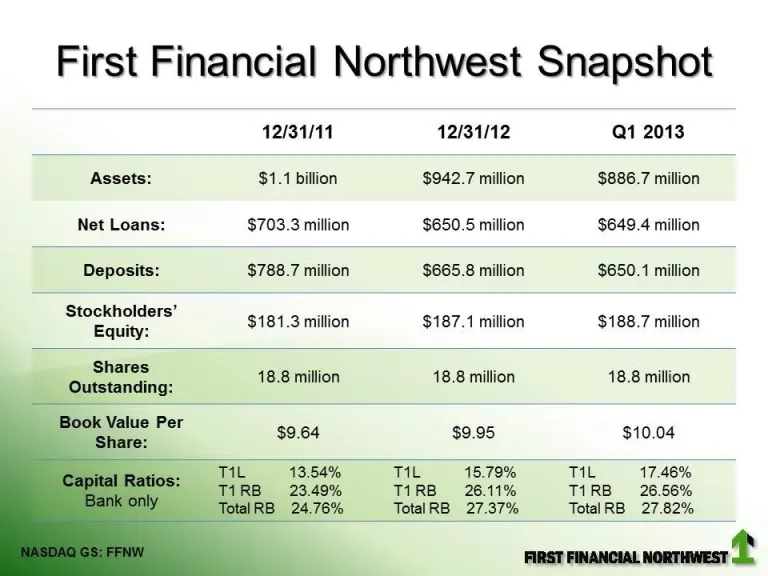
First Financial Northwest Snapshot TIRB 26.11% TotalRB 27.37% 12/31/11 12/31/12 Q1 2013 Assets: $1.1 billion $942.7 million $886.7 million Net Loans: $703.3 million $650.5 million $649.4 million Deposits: $788.7 million $665.8 million $650.1 million Stockholders’ = ” . Equity: $181.3 million $187.1
Slide 10: Income Statement Summary
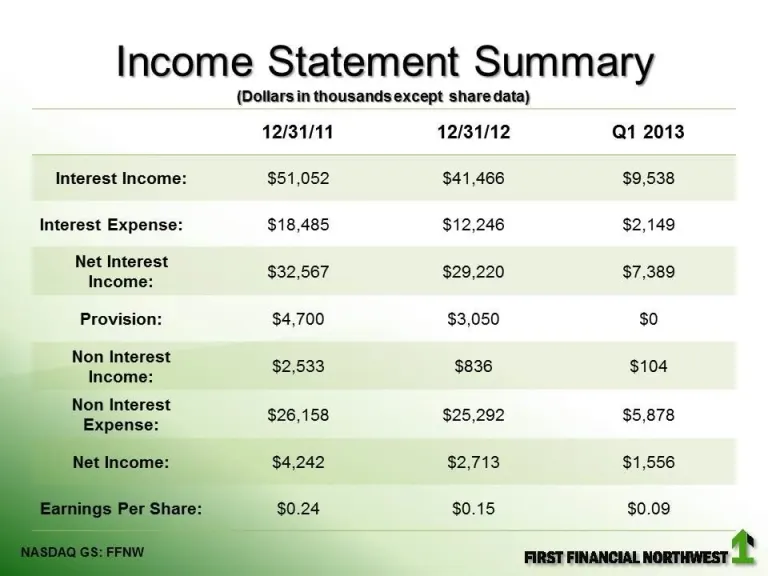
Income Statement Summary (Dollars in thousandsexcept share data) 12/31/11 12/31/12 Q1 2013 Interest Income: $51,052 $41,466 $9,538 Interest Expense: $18,485 $12,246 $2,149 Net Interest een $32,567 $29,220 $7,389 Provision: $4,700 $3,050 $0 Non Interest pal $2,533 $836 $104 Rep interest $26,158 $25,2
Slide 11: Yields
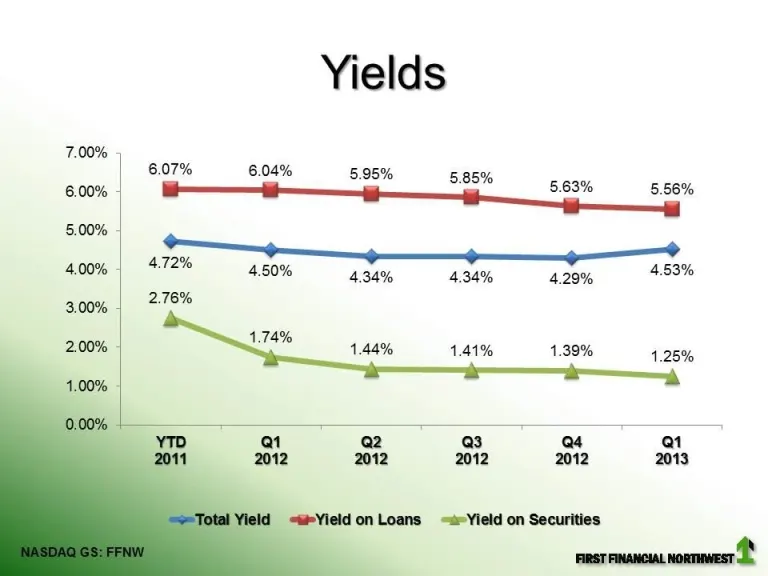
Yields 7.00% 6.07% 6.04% 5.95% 5.85% at a : 5.63% 5.56% 5.00% 6 ~~ 472% 4.00% 4.50% 4.34% 434% 4.29% 483% 276% 1.74% 1.44% 1.41% 1.39% 1.25% a 2 a3 4 at 2012 2012 2012 2012 2013 ‘Yield on Loans ==Yield on Securities |
Slide 12: Cost of Funds
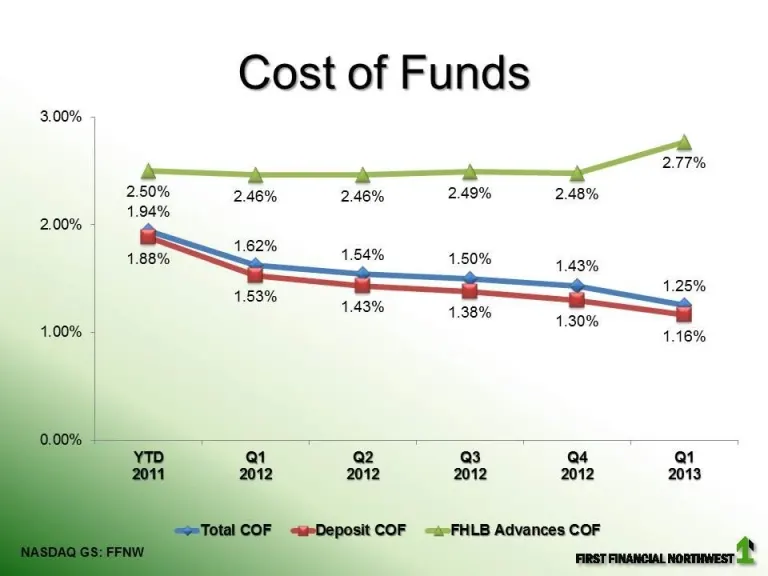
Cost of Funds 3.00% 5 Box 2.46% 2.46% 2.49% 2.48% 2.00% 1.62% 1.25% 1.16%
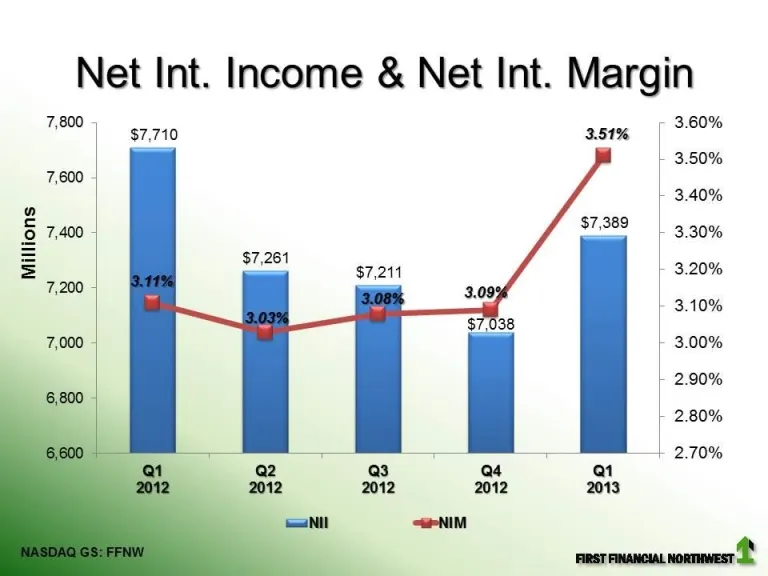
Slide 13: Net Int. Income & Net Int. Margin
Net Int. Income & Net Int. Margin 7,800 A 3.51% 3.60% 3.50% 7,600 3.40% 2 $7,389 § 7,400 : 3.30% = 3.20% 7,200 3.10% 7,000 3.00% 2.90% 2.80% 2.70% Qi 2013
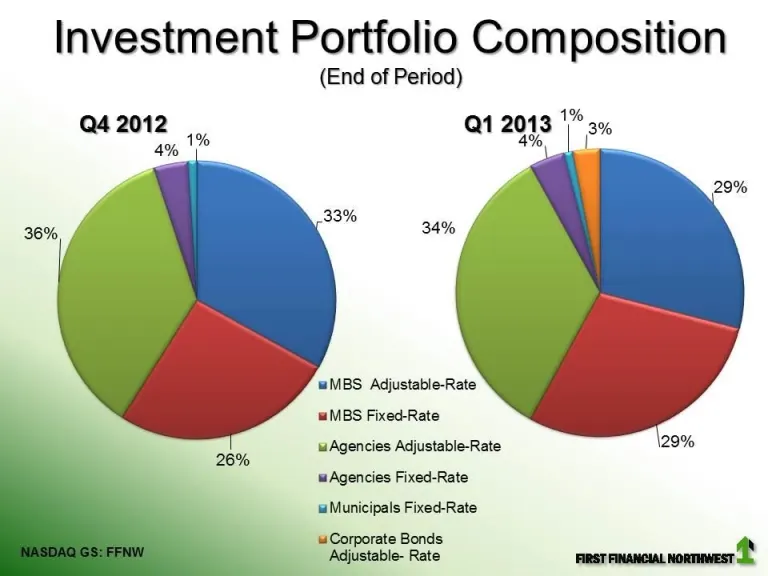
Slide 14: Investment Portfolio Composition
Investment Portfolio Composition (End of Period) Q42012 1% 2 Qi 2013 3% 34% ff = MBS Adjustable-Rate = MBS Fixed-Rate wAgencies Adjustable-Rate wAgencies Fixed-Rate Municipals Fixed-Rate Corporate Bonds Adjustable- Rate Paintin ie
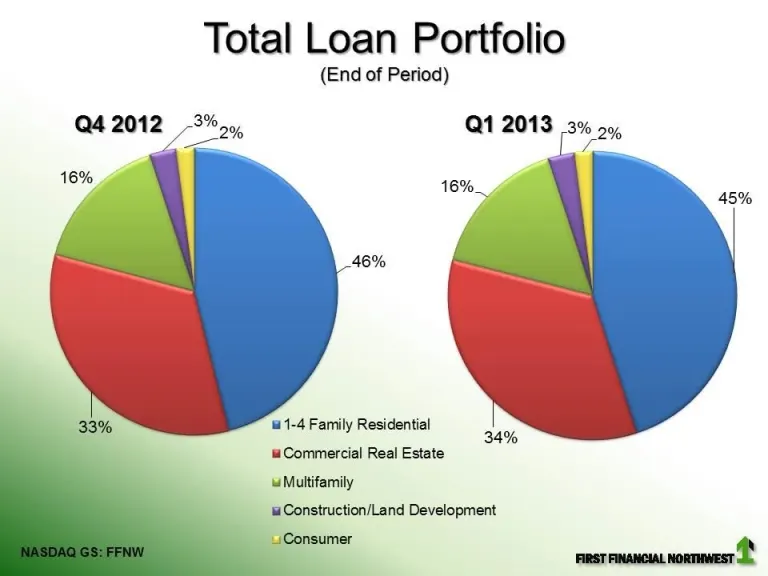
Slide 15: Total Loan Portfolio
Total Loan Portfolio (End of Period) 42012 -% 25, Qt 2013 2% 25 1-4 Family Residential Commercial Real Estate Multifamily ts Construction/Land Development Consumer =a 4
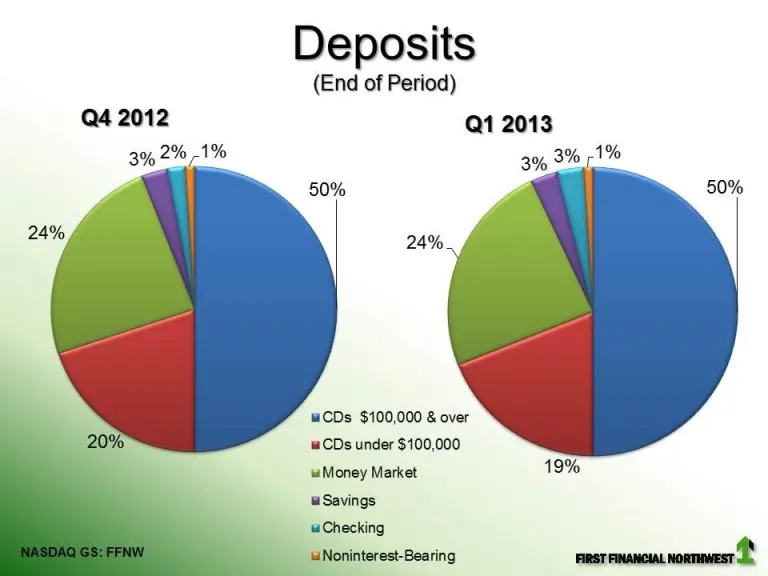
Slide 16: Deposits
Deposits (End of Period) Q4 2012 Q1 2013 3% 3% 1 50% CDs $100,000 & over CDs under $100,000 \Money Market Savings Checking loninterest-Bearing Pmiaasiomeae
Slide 17: Asset Quality
Slide 18: Nonperforming Assets (NPAs)
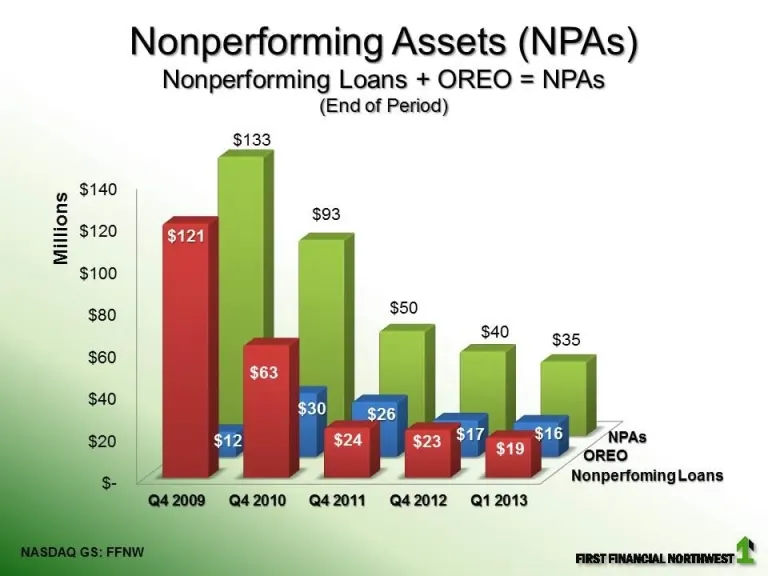
Nonperforming Assets (NPAs) Nonperforming Loans + OREO = NPAs (End of Period) $133 Millions id iS] 8 NPAS OREO | NonperfomingLoans 42009 Q42010 242011 Q42012 Q12013 ee
Slide 19: Delinquent Loans
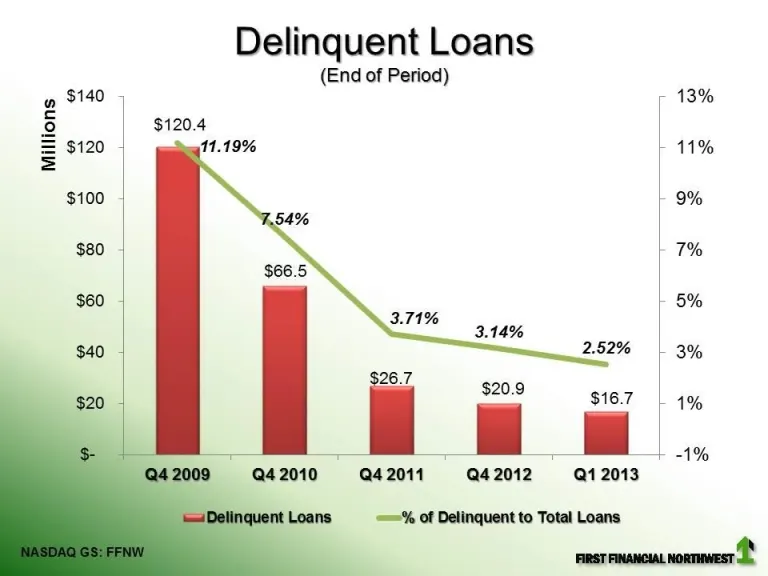
Delinquent Loans (End of Period) & & 6 @ & $120 Millions 2.52% | 3% 26.7 la vu) $16.7 | 40% i Q42010 Q4 2011 Q4 2012 Q1 2013 ===% of Delinquent to Total Loans en
Slide 20: Performing Loans
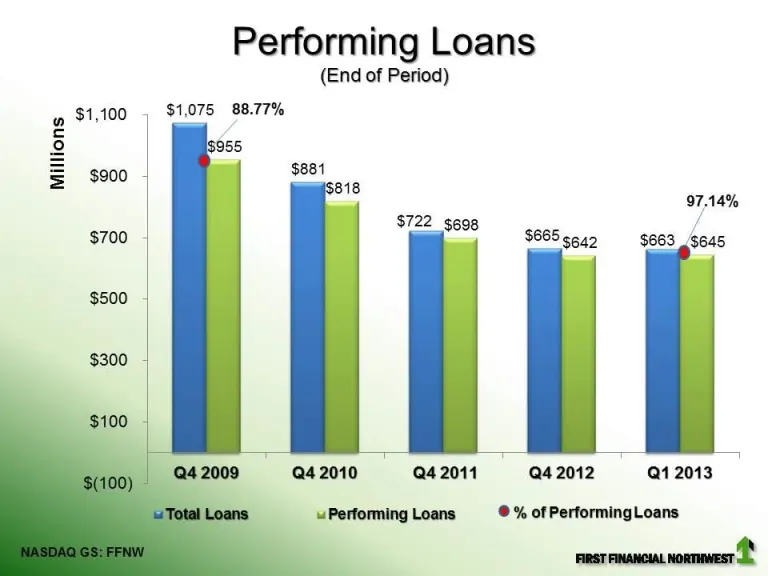
$1,100 $900 Millions Performing Loans (End of Period) $1,075 88.77% 955 $881 a 97.14% $722_ $698 | $665s642 $663 $645 2009 Q4 2010 Q4 2011 Q4 2012 Q1 2013 «Performing Loans © % of PerformingLoans en
Slide 21: 2013 Outlook, Summary, and 2013 Focus
2013 Outlook, Summary, and 2013 Focus ai
Slide 22: 2013 KBW Outlook: Challenges
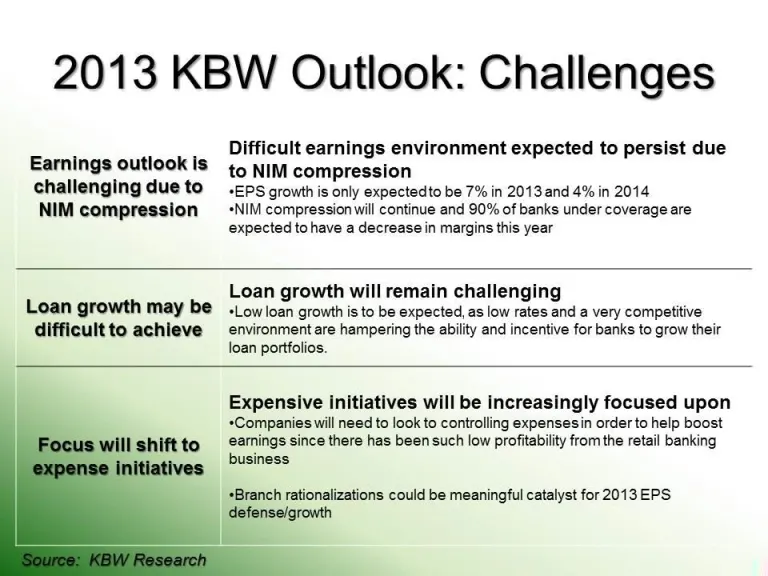
2013 KBW Outlook: Challenges Difficult earnings environment expected to persist due Earnings outlook is to yim compression challenging due to — «Eps growth is only expectedto be 7% in 2013 and 4% in 2014 NIM compression —_-NiM compression will continue and 90% of banks under coverage are expected to
Slide 23: 2013 KBW Outlook: Drivers of Valuation
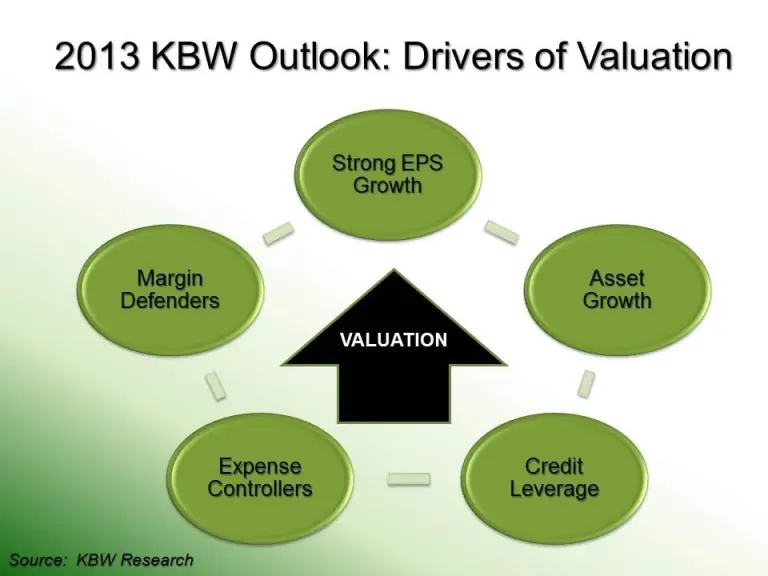
2013 KBW Outlook: Drivers of Valuation
Slide 24: Summary Q1 2013
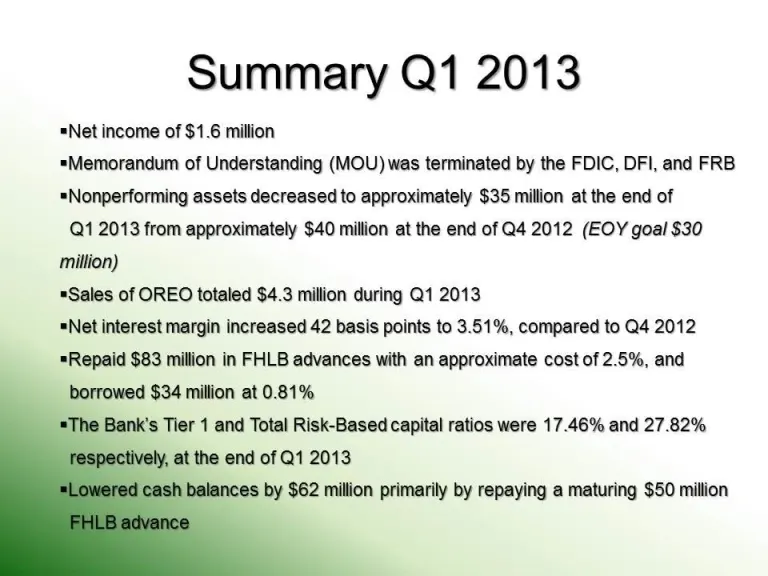
Summary Q1 2013 =Net income of $1.6 million =Memorandum of Understanding (MOU) was terminated by the FDIC, DFl, and FRB =Nonperforming assets decreased to approximately $35 million at the end of Q1 2013 from approximately $40 million at the end of Q4 2012 (EOY goal $30 million) =Sales of OREO totale
Slide 25: 2013 Focus
2013 Focus =Evaluate a modest branch expansion strategy (full service, kiosk, etc) =Continue success in reducing nonperforming assets =“Right size” organization to achieve optimum efficiency =Evaluate allowance against deferred tax asset =Reduce nonbank related costs =Evaluate a payment of dividends
Slide 26: Market Environment
Slide 27: The City of Renton
The City of Renton =5t largest city in King County, 10" in State of Washington - 94,000 residents, representing a 67% growth over 5 years Employment - Total Renton employment is expected to increase by 5,000 jobs, including 2,400 new Boeing and other aerospace jobs, and 2,600 new non-Boeing and othe
Slide 28: Years of Service
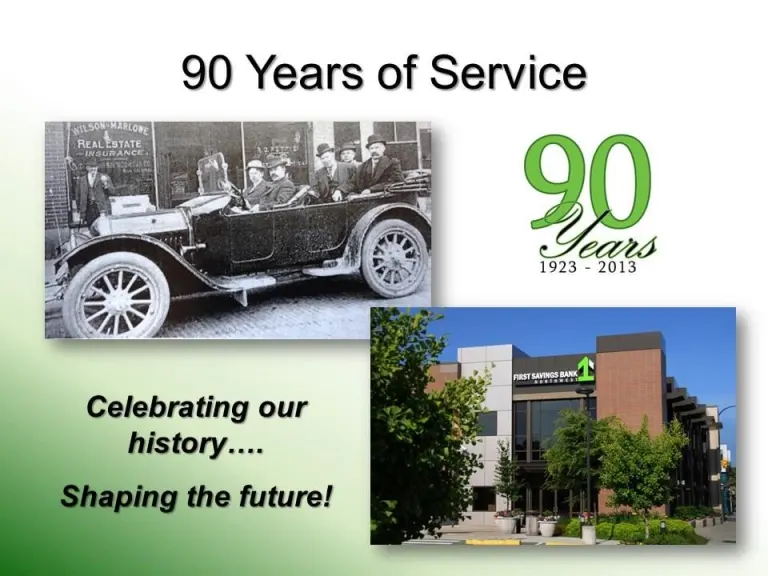
90 Years of Service Celebrating our history....

Slide 29: Thank you
= Thank vol BEEGEE
Source: SEC EDGAR · 8-K filed May 20, 2013
More decks from First Financial Northwest Inc
 Investor Presentation (November 2021)34 slides · Nov 4, 2021
 Investor Presentation (November 2020)34 slides · Nov 2, 2020
 Shareholder Meeting (June 2019)20 slides · Jun 13, 2019
 Investor Presentation (May 2019)27 slides · May 21, 2019
 Investor Presentation (June 2018)25 slides · Jun 14, 2018
 Investor Presentation (June 2017)37 slides · Jun 15, 2017