C&C Group PLC · LSE:CCR
C&C — H1 2014 Earnings Presentation
23 slides from C&C's earnings presentation, Oct 30, 2013
Slide 1: 2014 First Half Results
2014 First Half Results 30 October, 2013
Slide 2: Disclaimer
Disclaimer This presentation should be read in conjunction with the announcement of the financial results of C&C Group plc (the "Company") for the six months ended 31 August 2013, released 30 October 2013 (the “2013 Half Year Announcement”). This presentation does not constitute an invitation to und
Slide 3: H1 2014 Performance Review
H1 2014 Performance Review Integration, Transition & Re-Positioning Summary & Outlook
Slide 4: H1 2014 Highlights
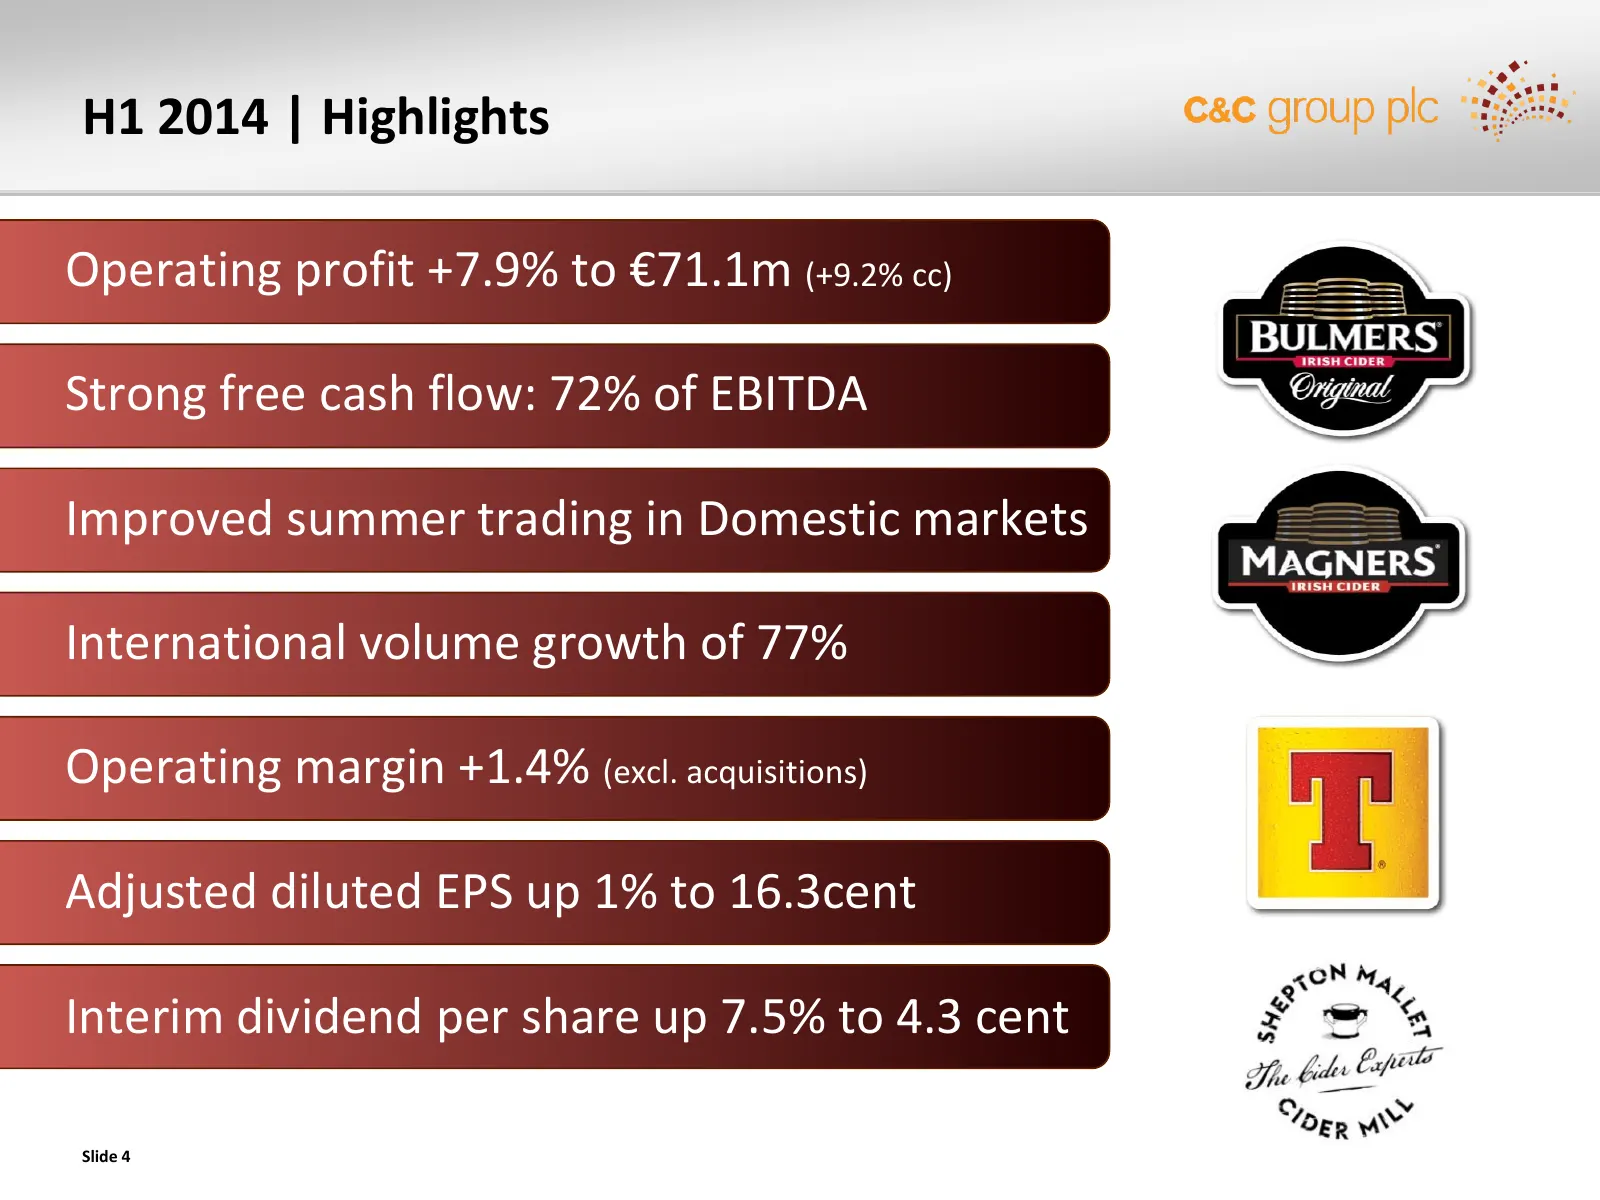
H1 2014 | Highlights Operating profit +7.9% to €71.1m (+9.2% cc) Strong free cash flow: 72% of EBITDA Improved summer trading in Domestic markets International volume growth of 77% Operating margin +1.4% (excl. acquisitions) Adjusted diluted EPS up 1% to 16.3cent Interim dividend per share up 7.5% t
Slide 5: Strategic & Operating Highlights
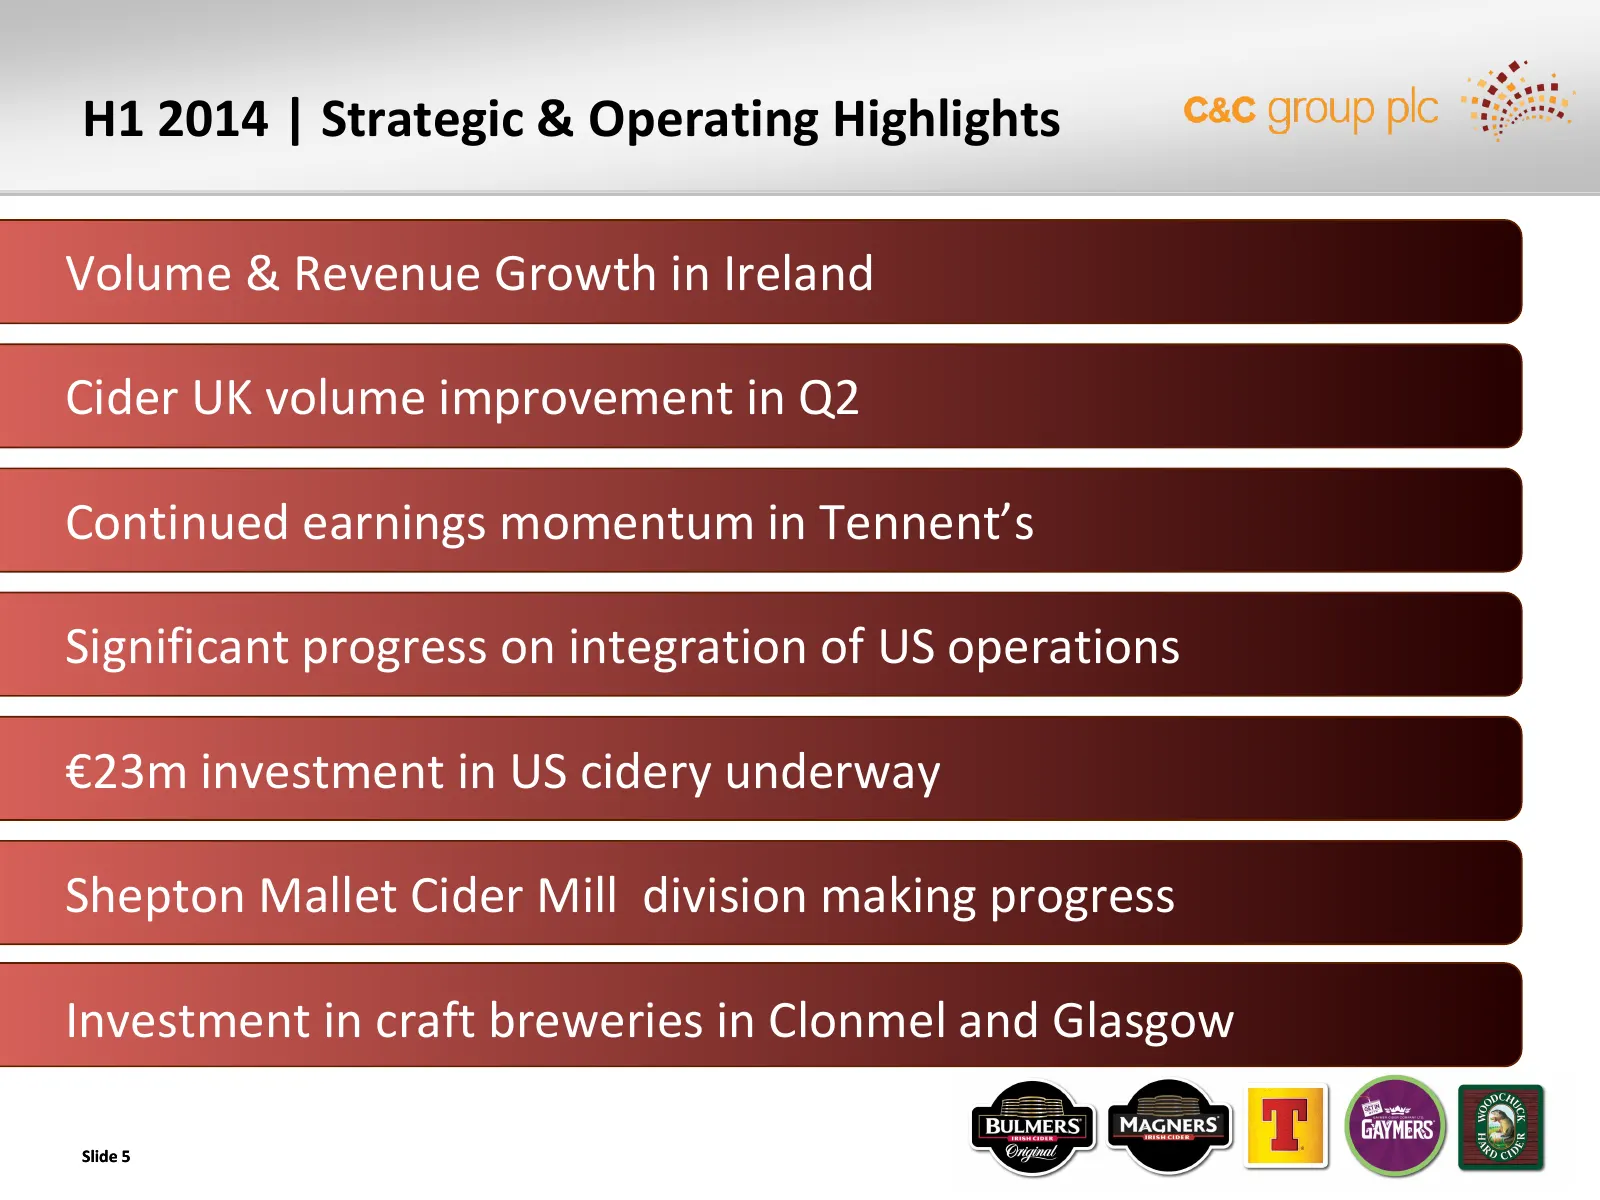
H1 2014 | Strategic & Operating Highlights Volume & Revenue Growth in Ireland Cider UK volume improvement in Q2 Continued earnings momentum in Tennent’s Significant progress on integration of US operations €23m investment in US cidery underway Shepton Mallet Cider Mill division making progress Inves
Slide 6: ROI & UK Performance
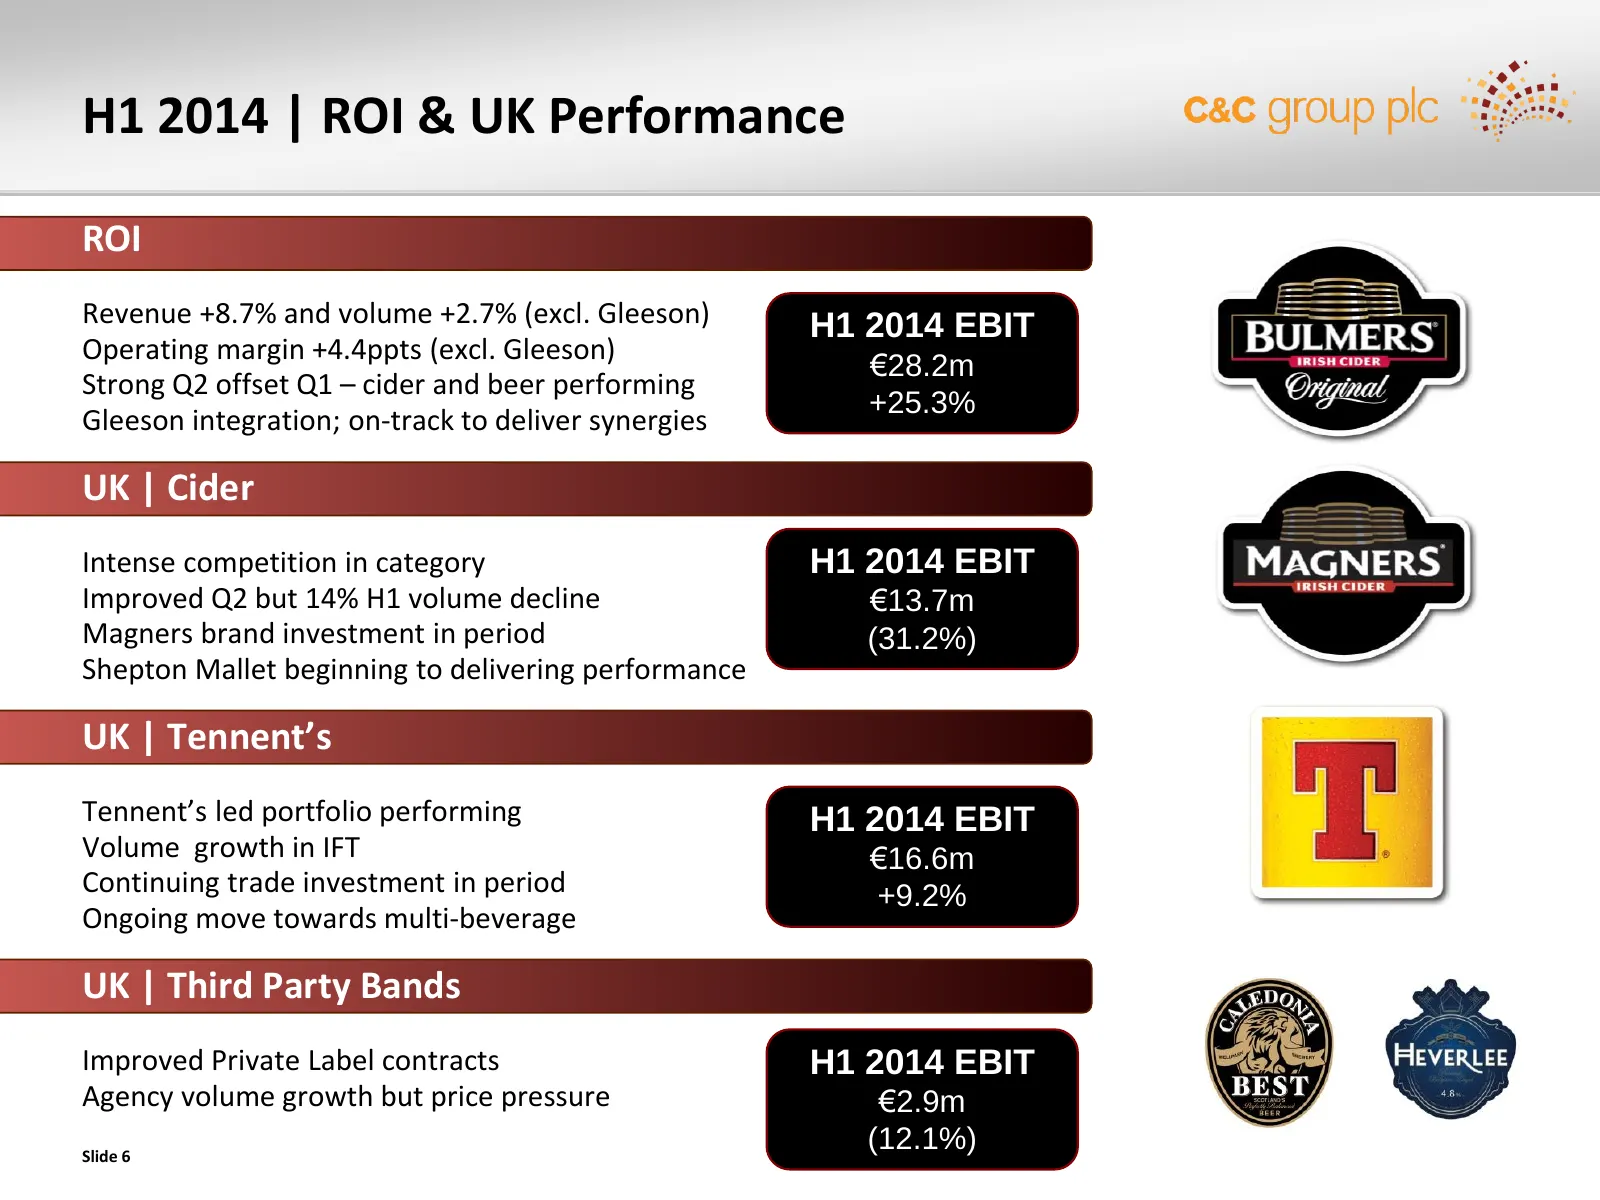
H1 2014 | ROI & UK Performance ROI Revenue +8.7% and volume +2.7% (excl. Gleeson) H1 2014 EBIT Operating margin +4.4ppts (excl. Gleeson) €28.2m Strong Q2 offset Q1 – cider and beer performing +25.3% Gleeson integration; on-track to deliver synergies UK | Cider Intense competition in category H1 2014
Slide 7: International Performance
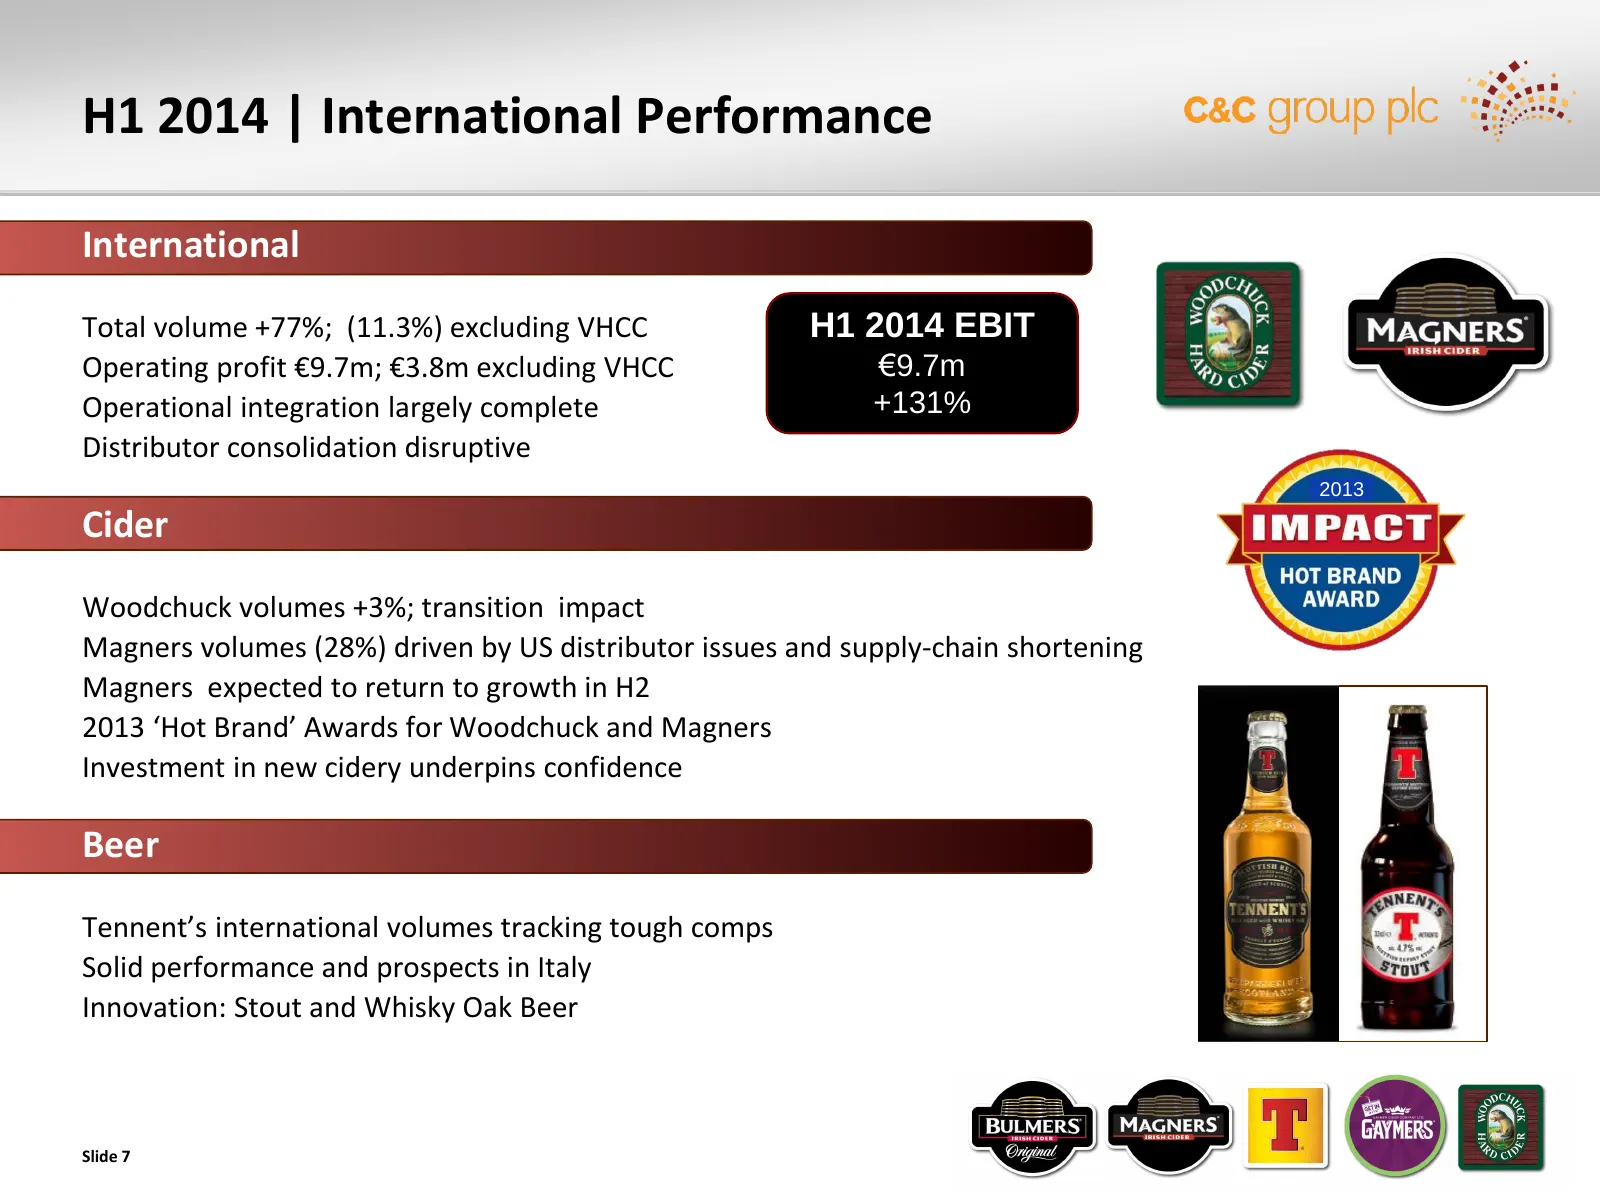
H1 2014 | International Performance International Total volume +77%; (11.3%) excluding VHCC H1 2014 EBIT Operating profit €9.7m; €3.8m excluding VHCC €9.7m Operational integration largely complete +131% Distributor consolidation disruptive 2013 Cider Woodchuck volumes +3%; transition impact Magners
Slide 8: Net Revenue
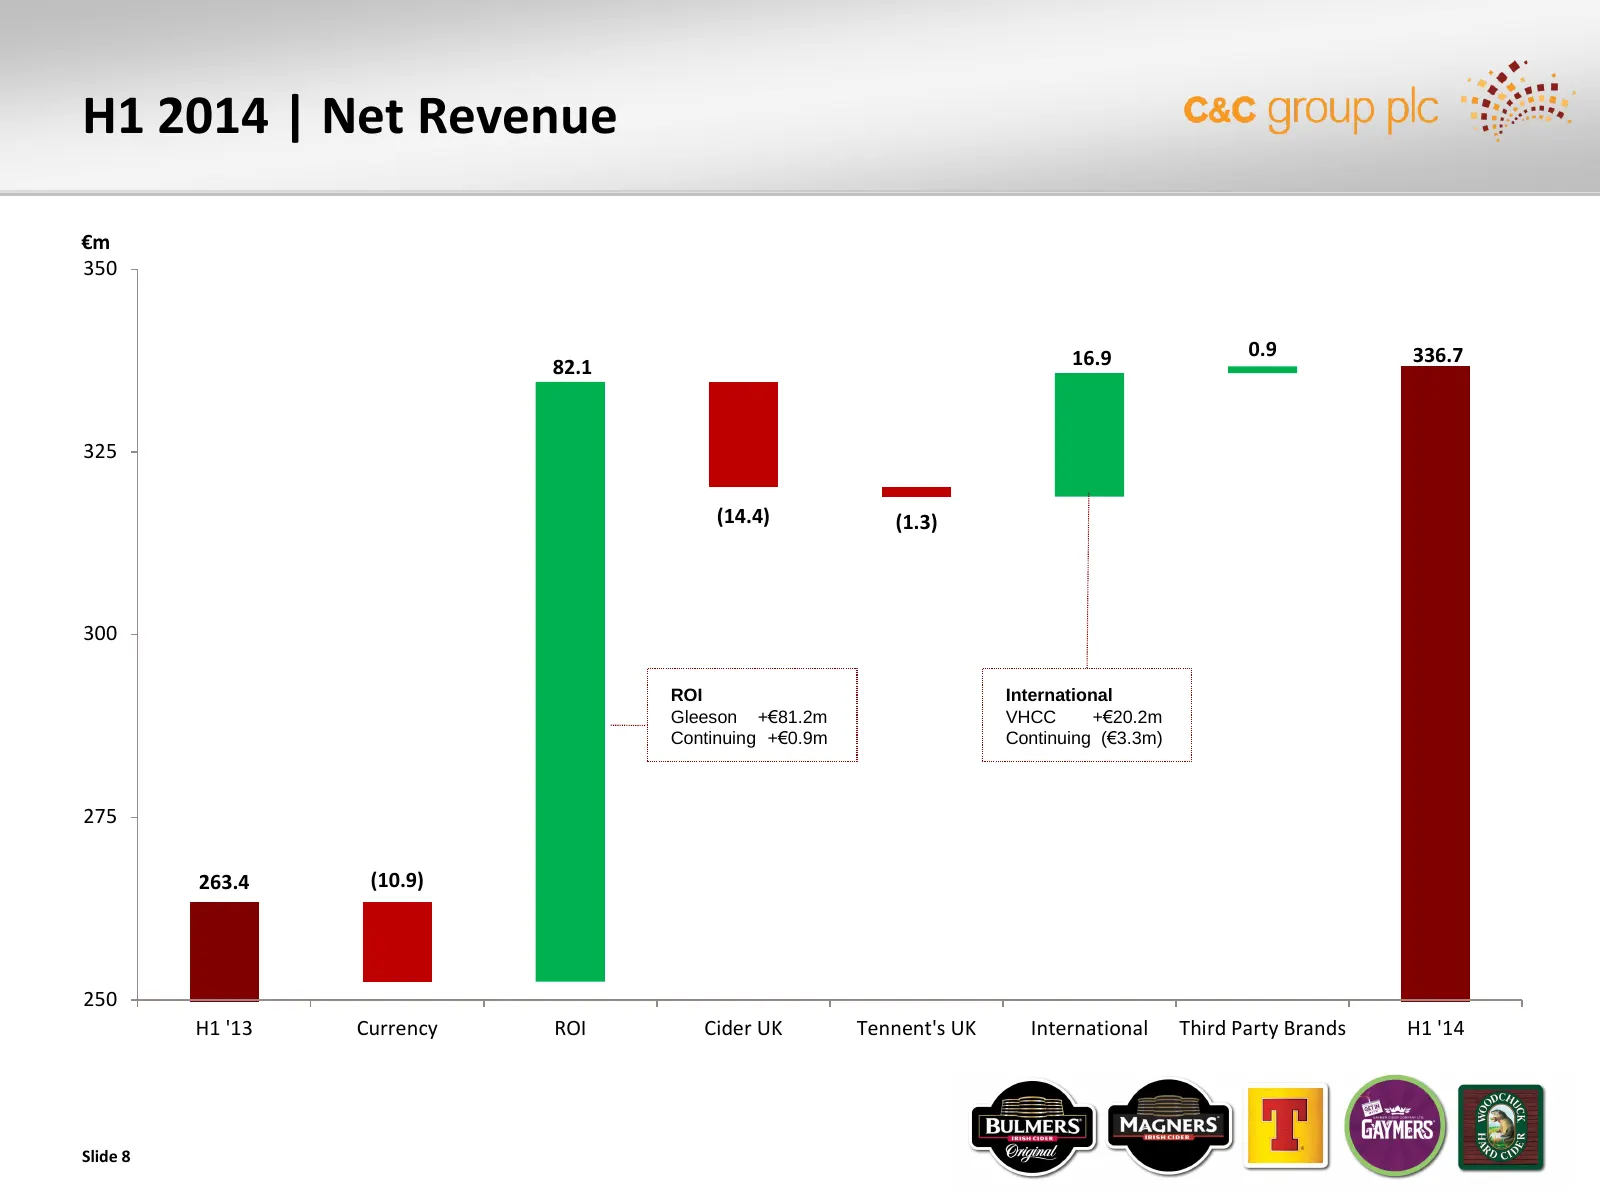
H1 2014 | Net Revenue €m 350 16.9 0.9 336.7 82.1 325 (14.4) (1.3) 300 ROI International Gleeson +€81.2m VHCC +€20.2m Continuing +€0.9m Continuing (€3.3m) 275 263.4 (10.9) 250 H1 '13 Currency ROI Cider UK Tennent's UK International Third Party Brands H1 '14 Slide 8
Slide 9: Operating Profit
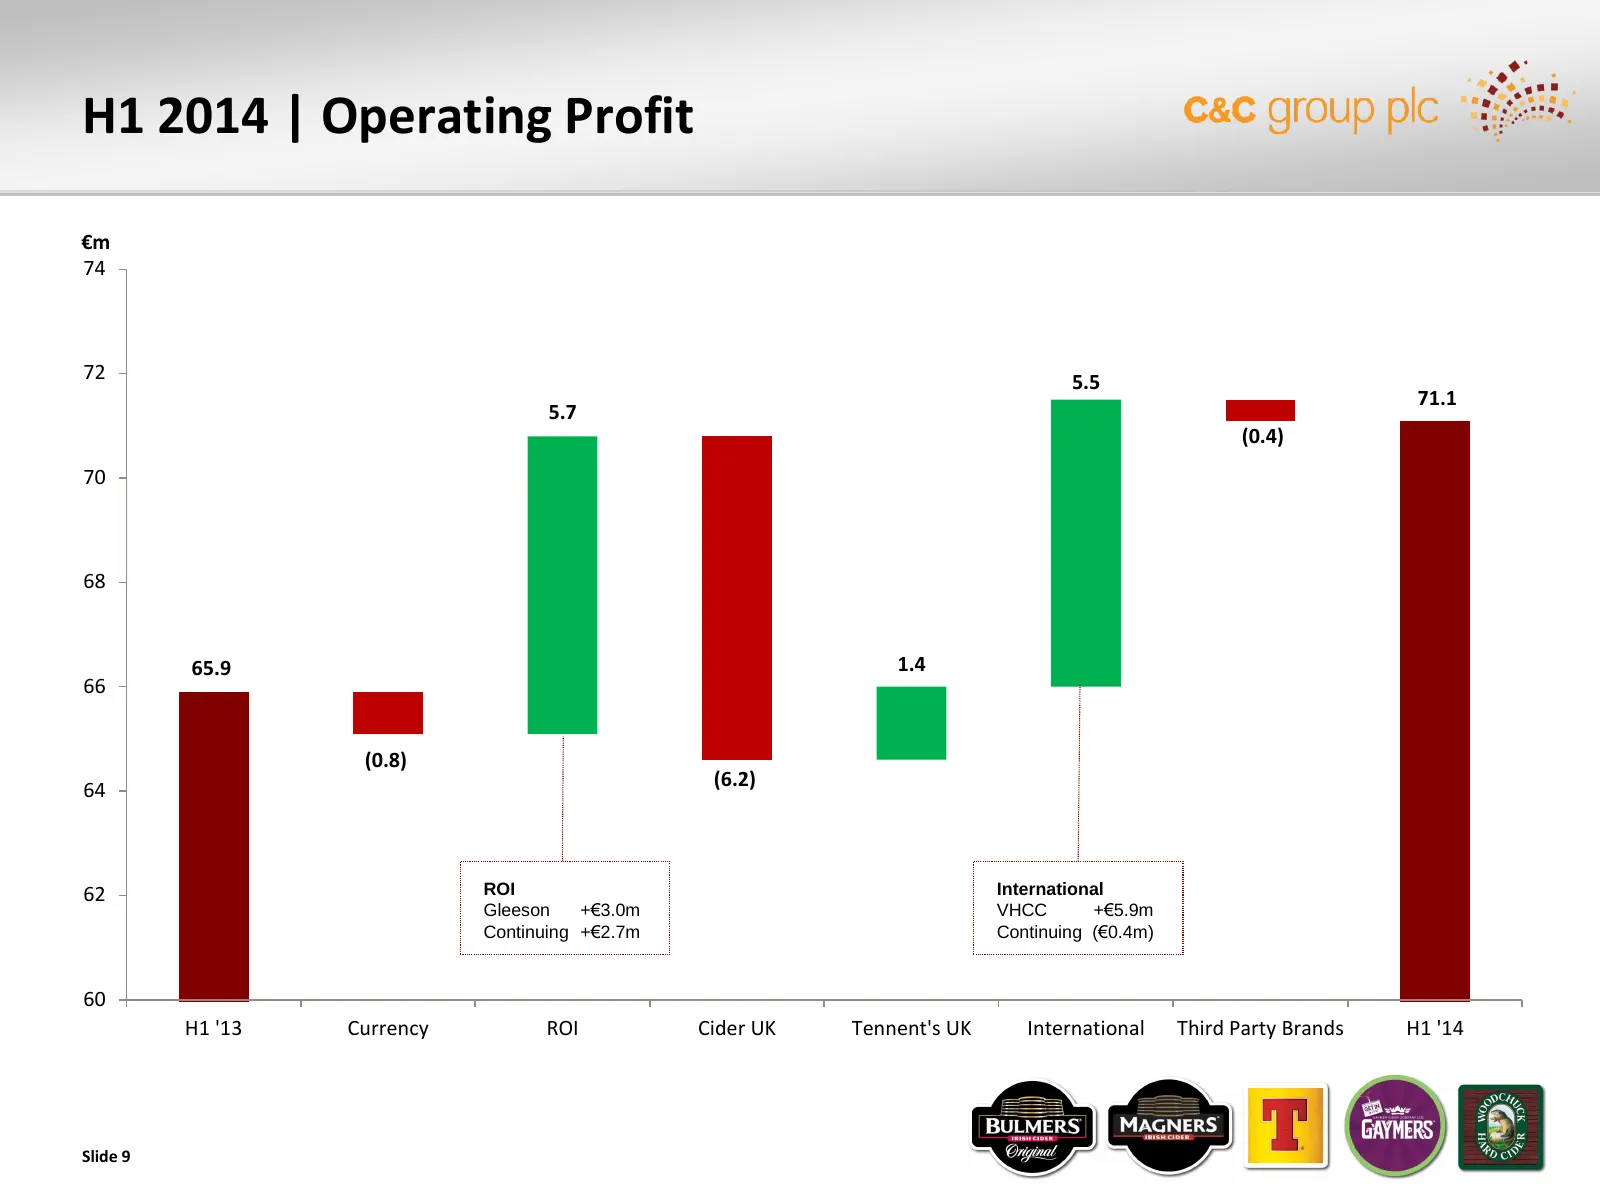
H1 2014 | Operating Profit €m 74 72 5.5 71.1 5.7 (0.4) 70 68 65.9 1.4 66 (0.8) 64 (6.2) 62 ROI International Gleeson +€3.0m VHCC +€5.9m Continuing +€2.7m Continuing (€0.4m) 60 H1 '13 Currency ROI Cider UK Tennent's UK International Third Party Brands H1 '14 Slide 9
Slide 10: Free Cash Flow
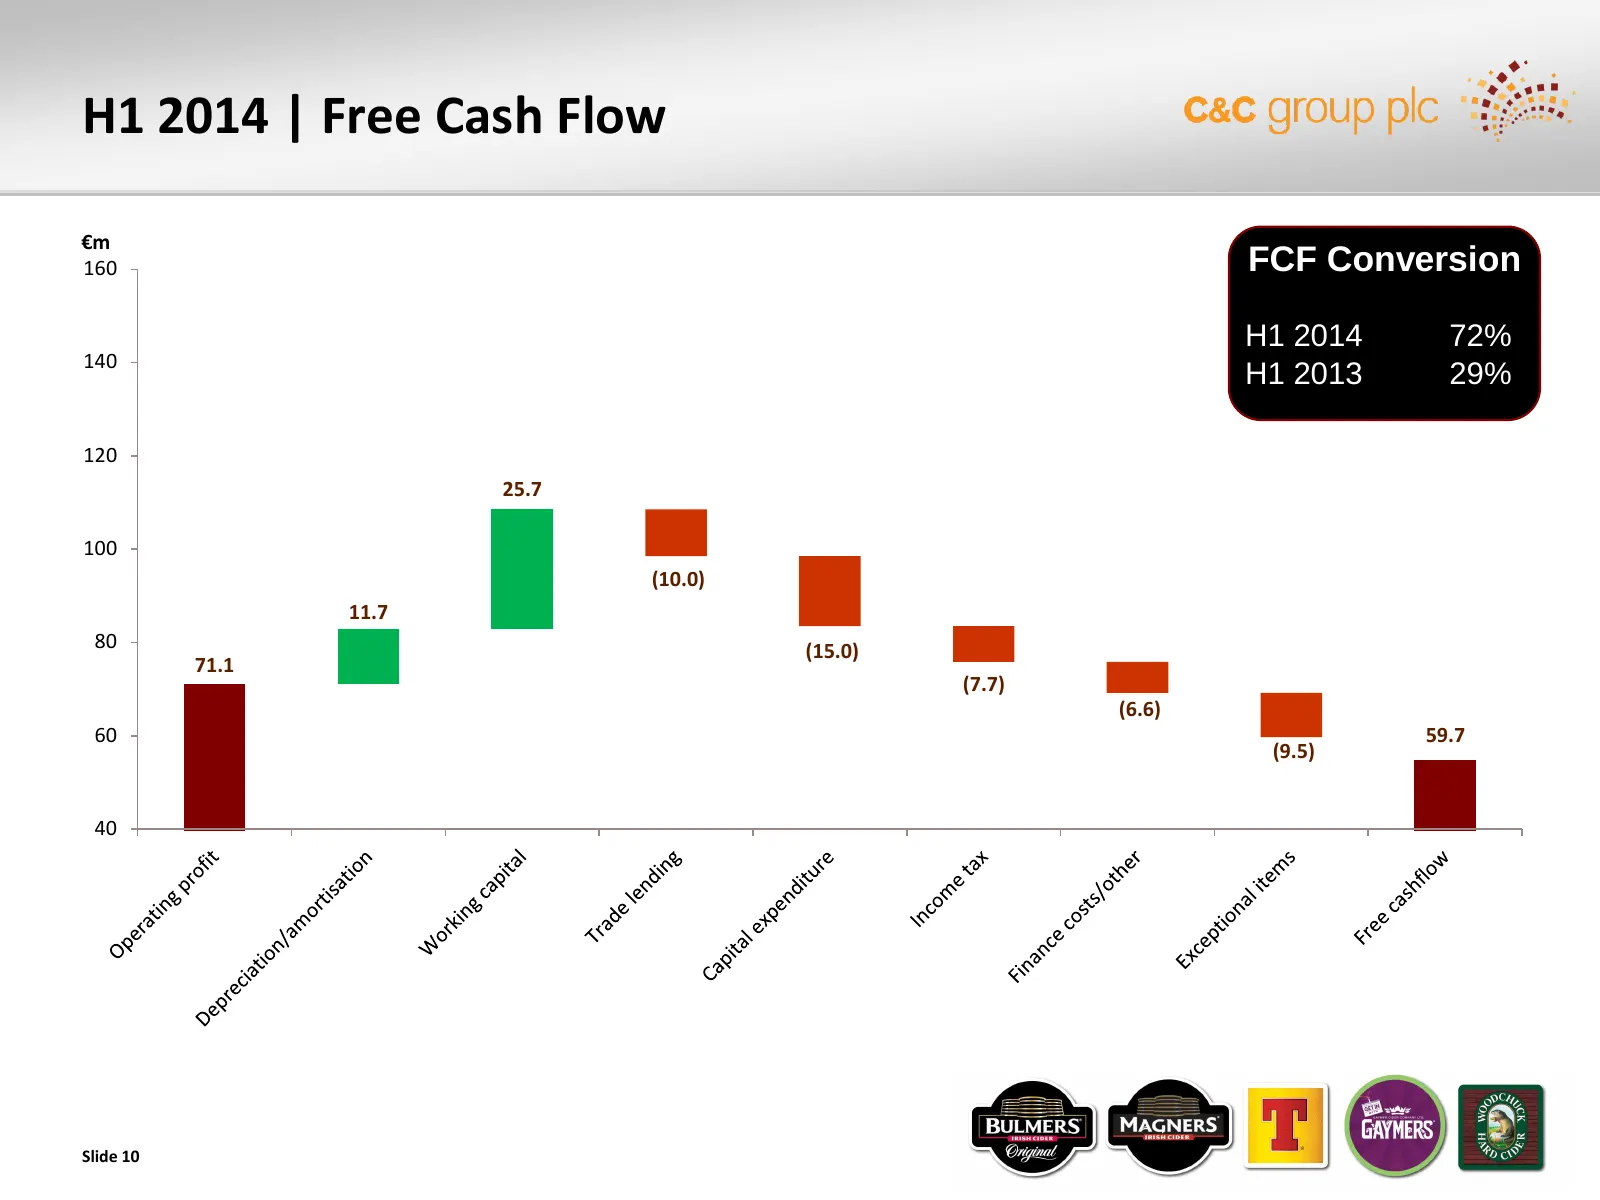
H1 2014 | Free Cash Flow €m 160 FCF Conversion H1 2014 72% 140 H1 2013 29% 120 25.7 100 (10.0) 11.7 80 (15.0) 71.1 (7.7) (6.6) 60 59.7 (9.5) 40 Slide 10
Slide 11: Balance Sheet
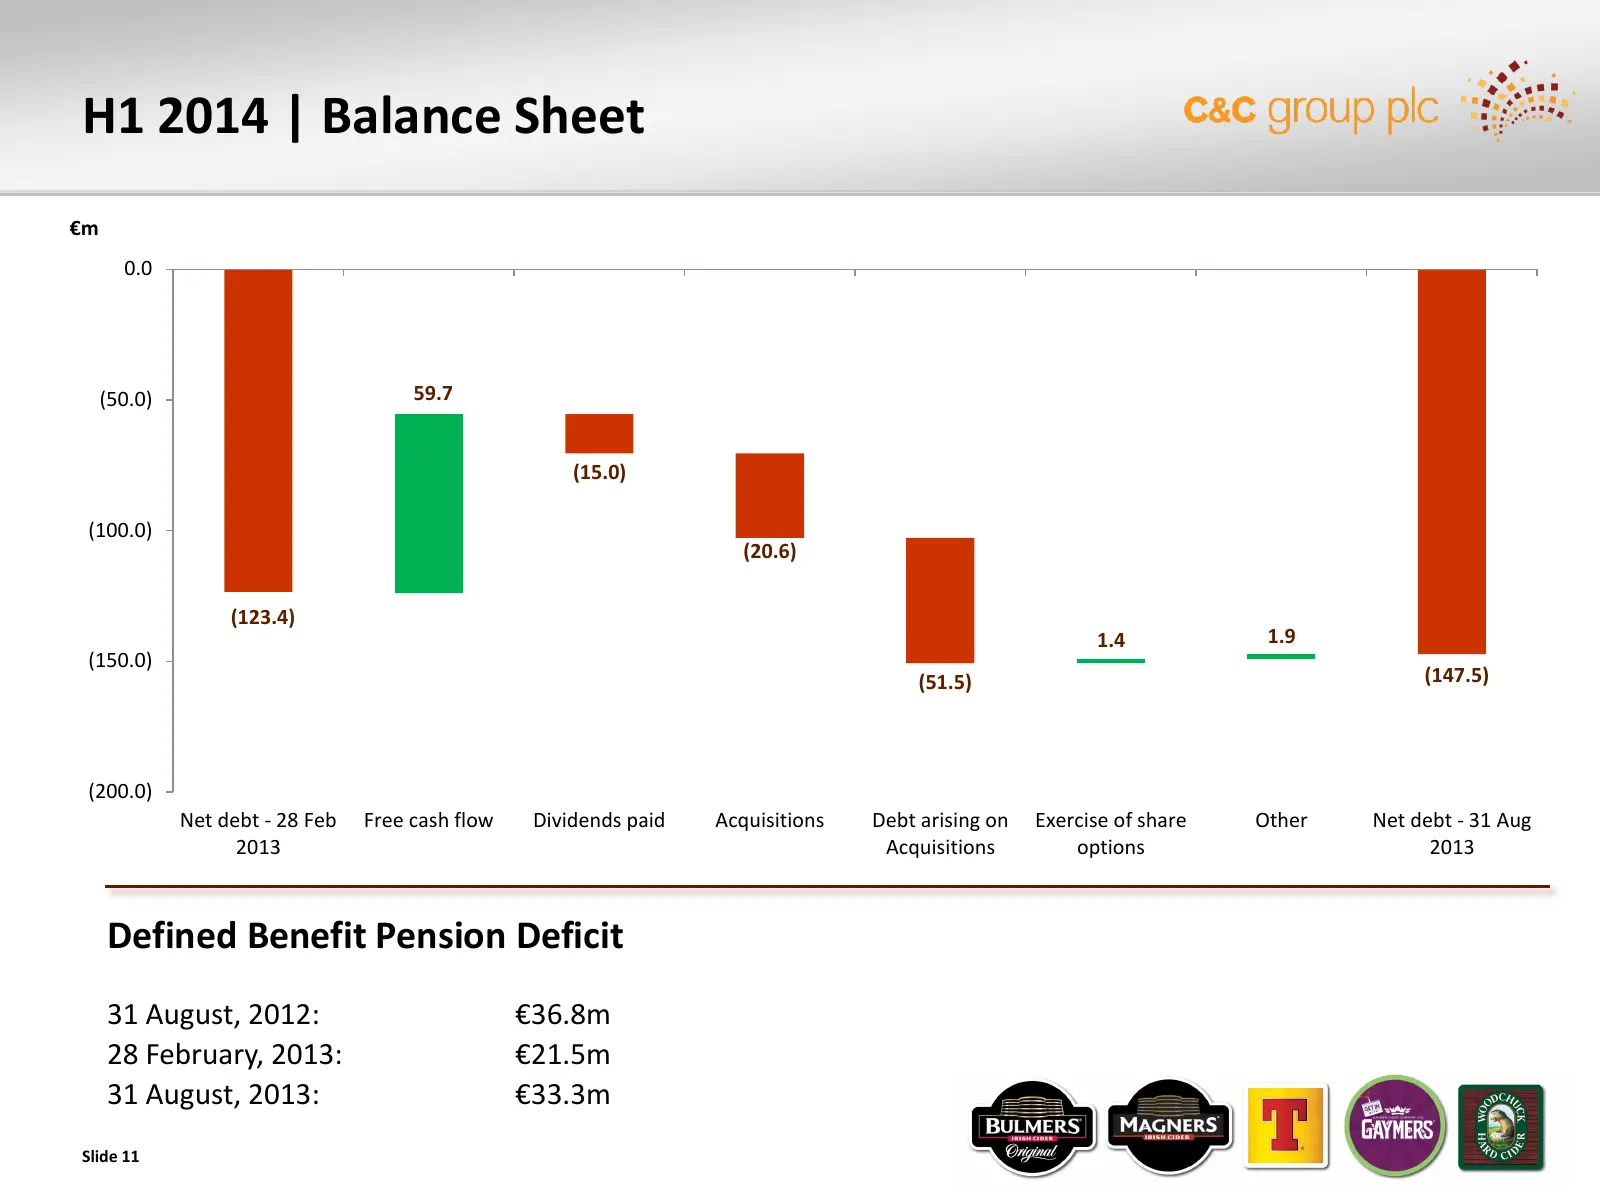
H1 2014 | Balance Sheet €m 0.0 (50.0) 59.7 (15.0) (100.0) (20.6) (123.4) 1.4 1.9 (150.0) (51.5) (147.5) (200.0) Net debt - 28 Feb Free cash flow Dividends paid Acquisitions Debt arising on Exercise of share Other Net debt - 31 Aug 2013 Acquisitions options 2013 Defined Benefit Pension Deficit 31 Aug
Slide 12: FX, Tax & Financing Costs
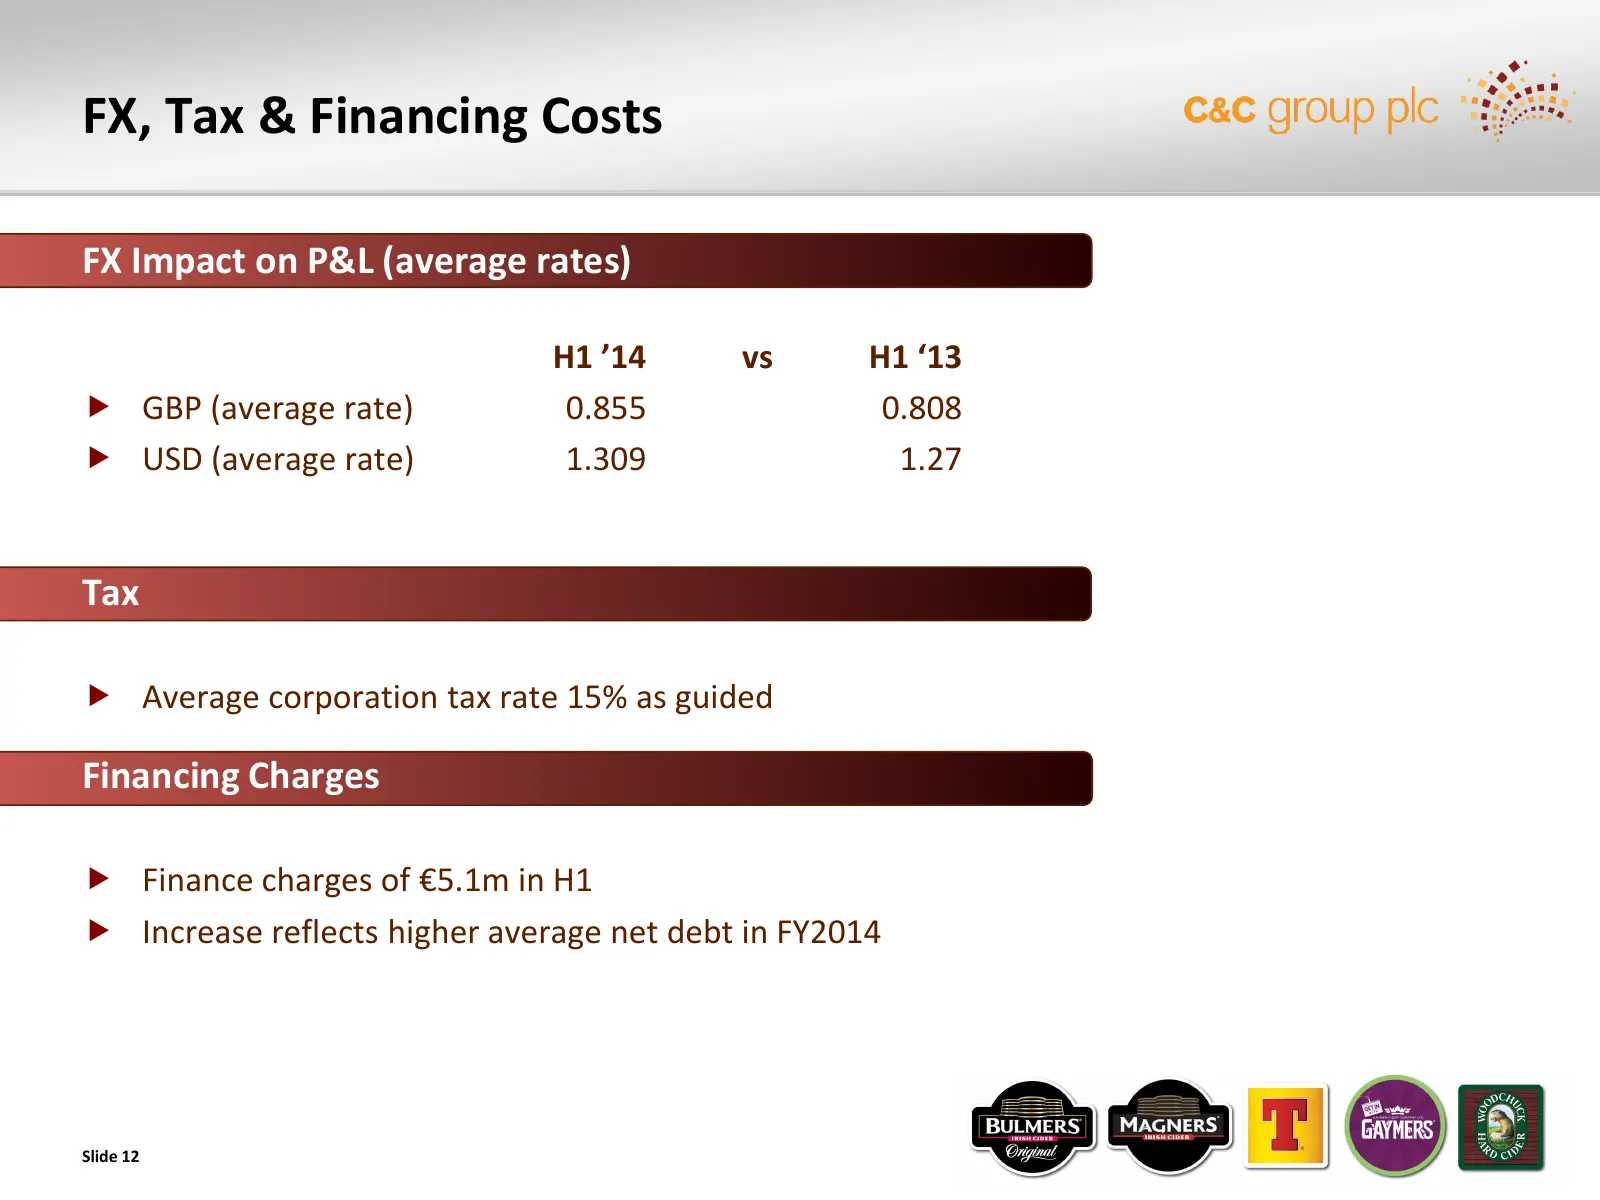
FX, Tax & Financing Costs FX Impact on P&L (average rates) H1 ’14 vs H1 ‘13 GBP (average rate) 0.855 0.808 USD (average rate) 1.309 1.27 Tax Average corporation tax rate 15% as guided Financing Charges Finance charges of €5.1m in H1 Increase reflects higher average net debt in FY2014 Slide
Slide 13: Integration, Transition & Re-Positioning
H1 2014 Performance Review Integration, Transition & Re-Positioning Summary & Outlook
Slide 14: VHCC Integration: Key achievements in H1
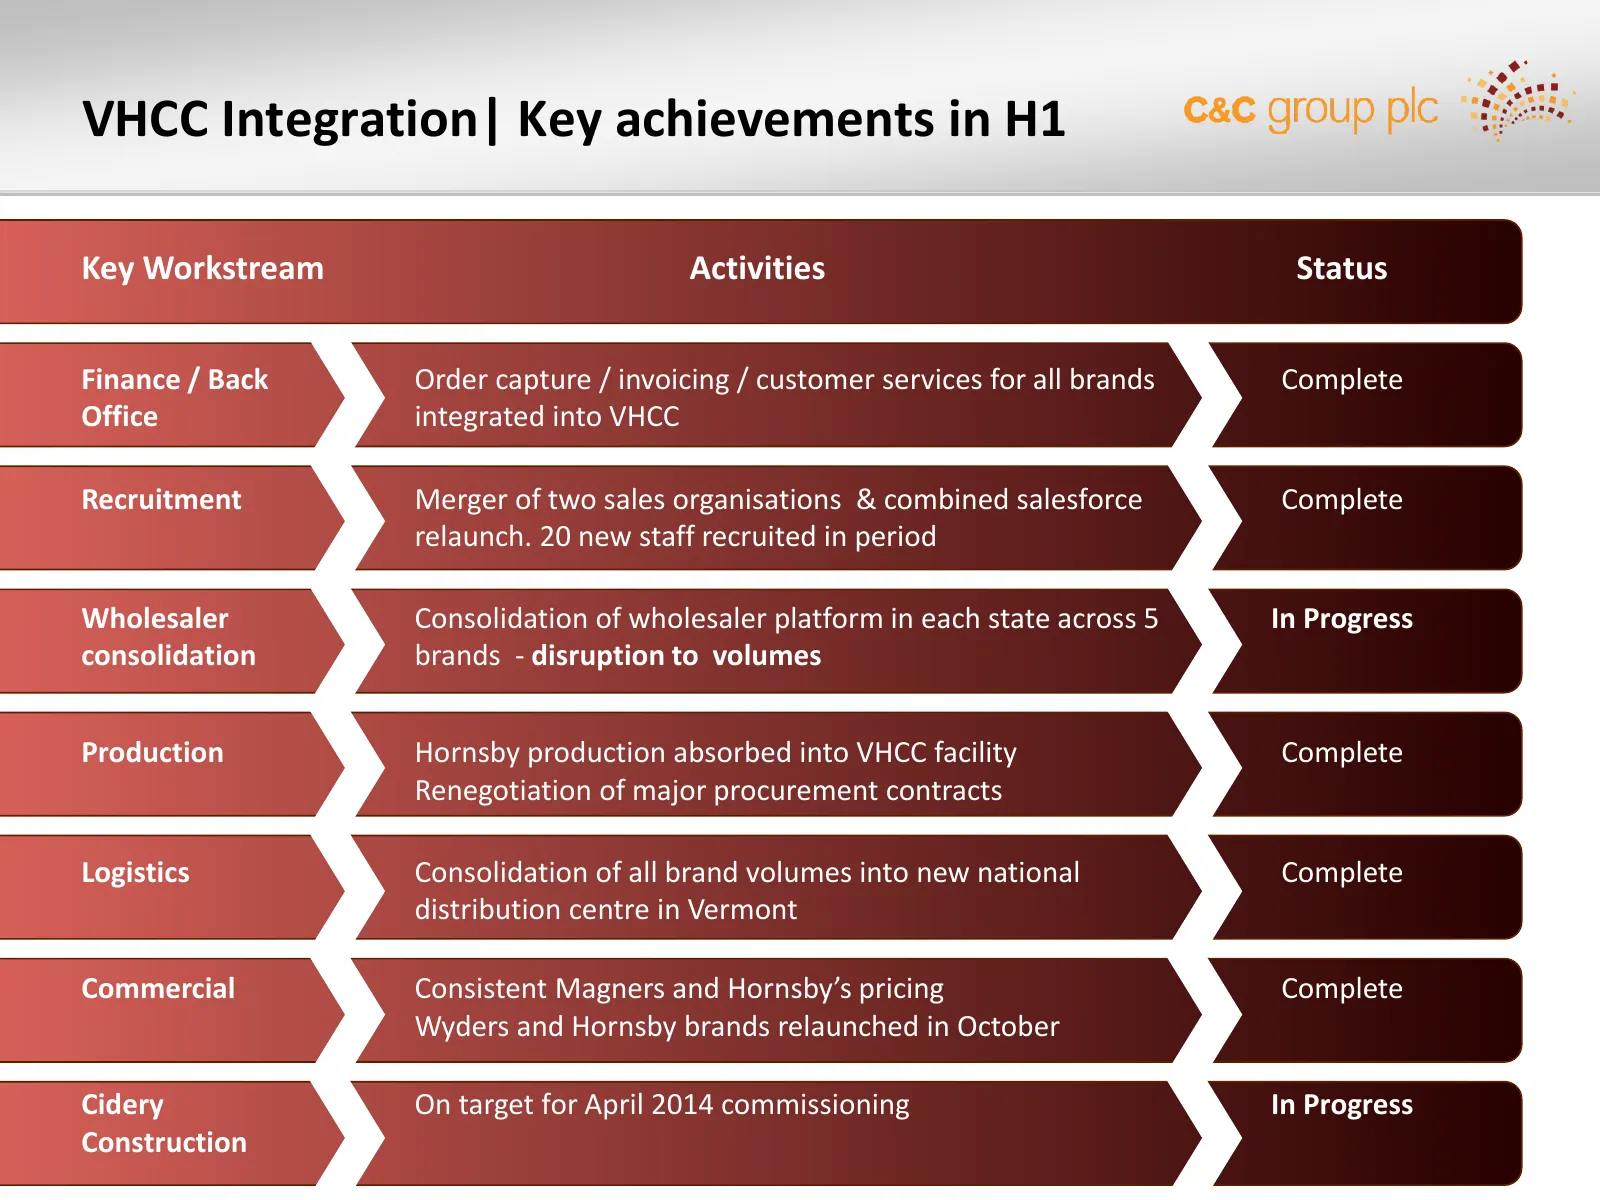
VHCC Integration| Key achievements in H1 Key Workstream Activities Status Finance / Back Order capture / invoicing / customer services for all brands Complete Office integrated into VHCC Recruitment Merger of two sales organisations & combined salesforce Complete relaunch. 20 new staff recruited in
Slide 15: VHCC Integration: Key focus in H2
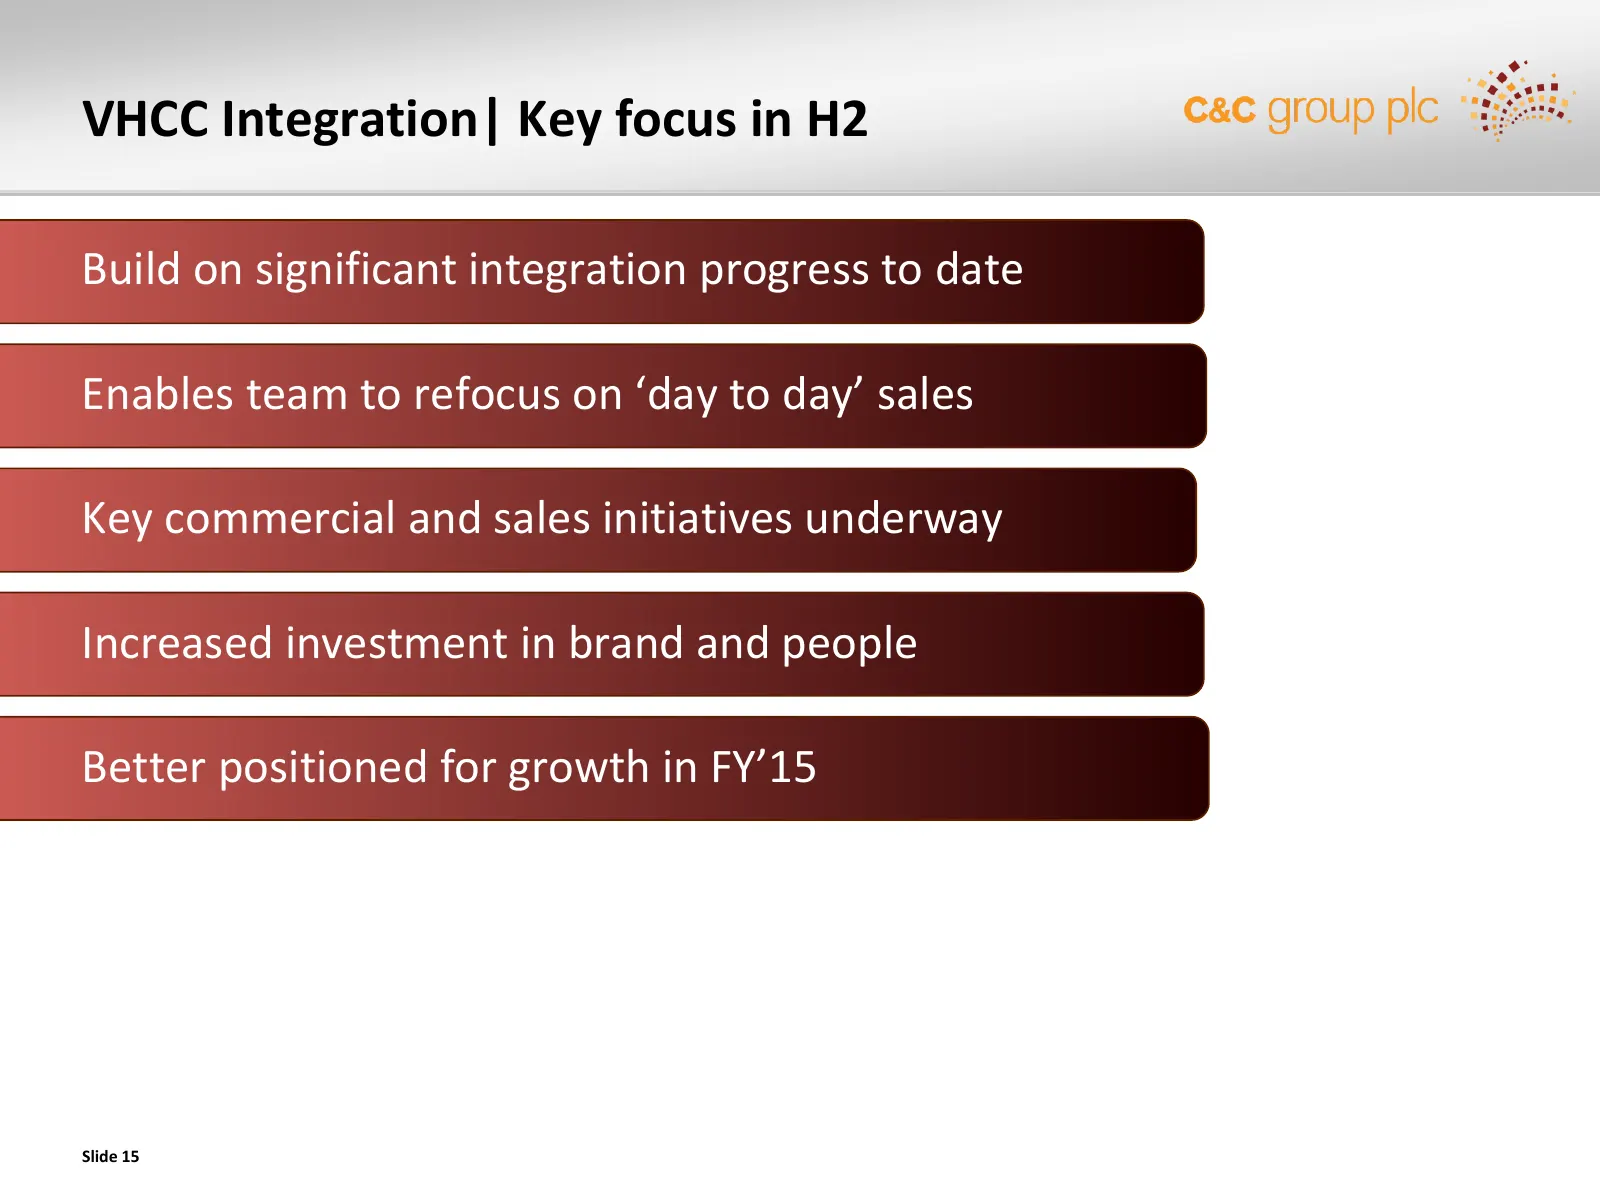
VHCC Integration| Key focus in H2 Build on significant integration progress to date Enables team to refocus on ‘day to day’ sales Key commercial and sales initiatives underway Increased investment in brand and people Better positioned for growth in FY’15 Slide 15
Slide 16: Gleeson Group: Multi-Beverage Model
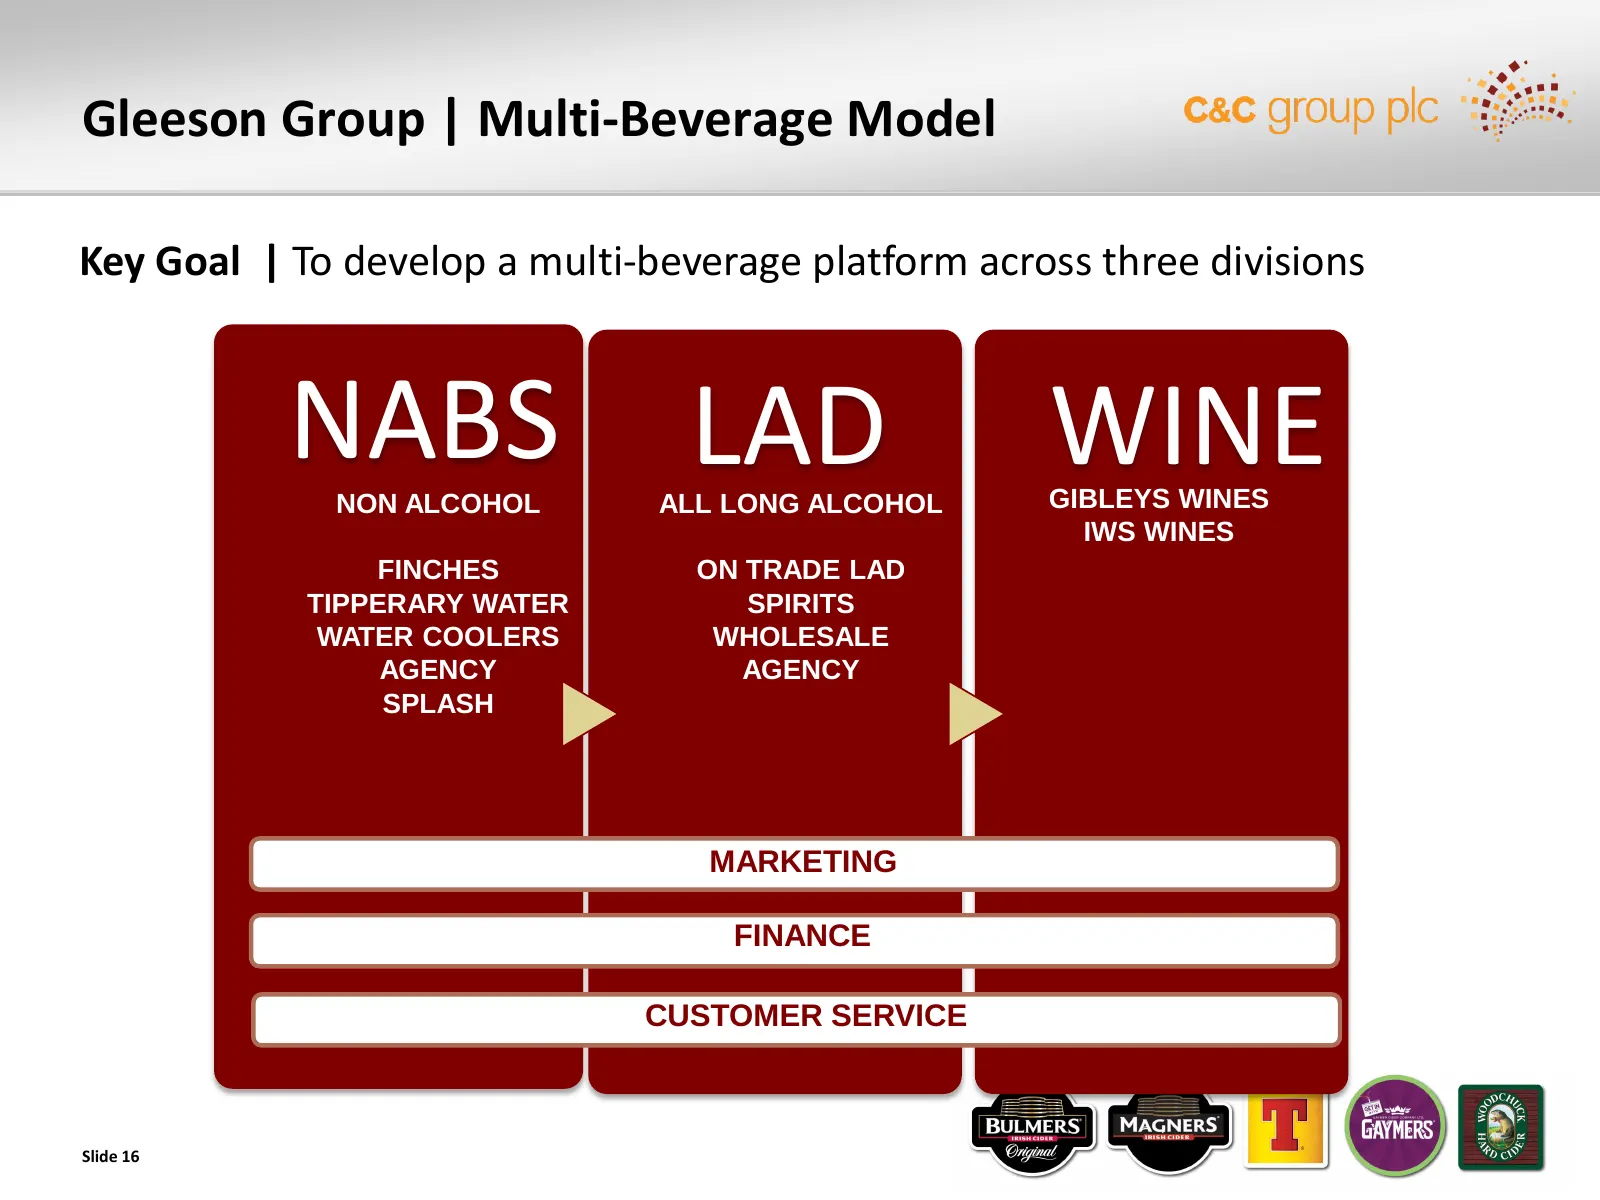
Gleeson Group | Multi-Beverage Model Key Goal | To develop a multi-beverage platform across three divisions NABS NON ALCOHOL LAD ALL LONG ALCOHOL WINE GIBLEYS WINES IWS WINES FINCHES ON TRADE LAD TIPPERARY WATER SPIRITS WATER COOLERS WHOLESALE AGENCY AGENCY SPLASH MARKETING FINANCE CUSTOMER SERVICE
Slide 17: Gleeson Group: Key achievements in H1
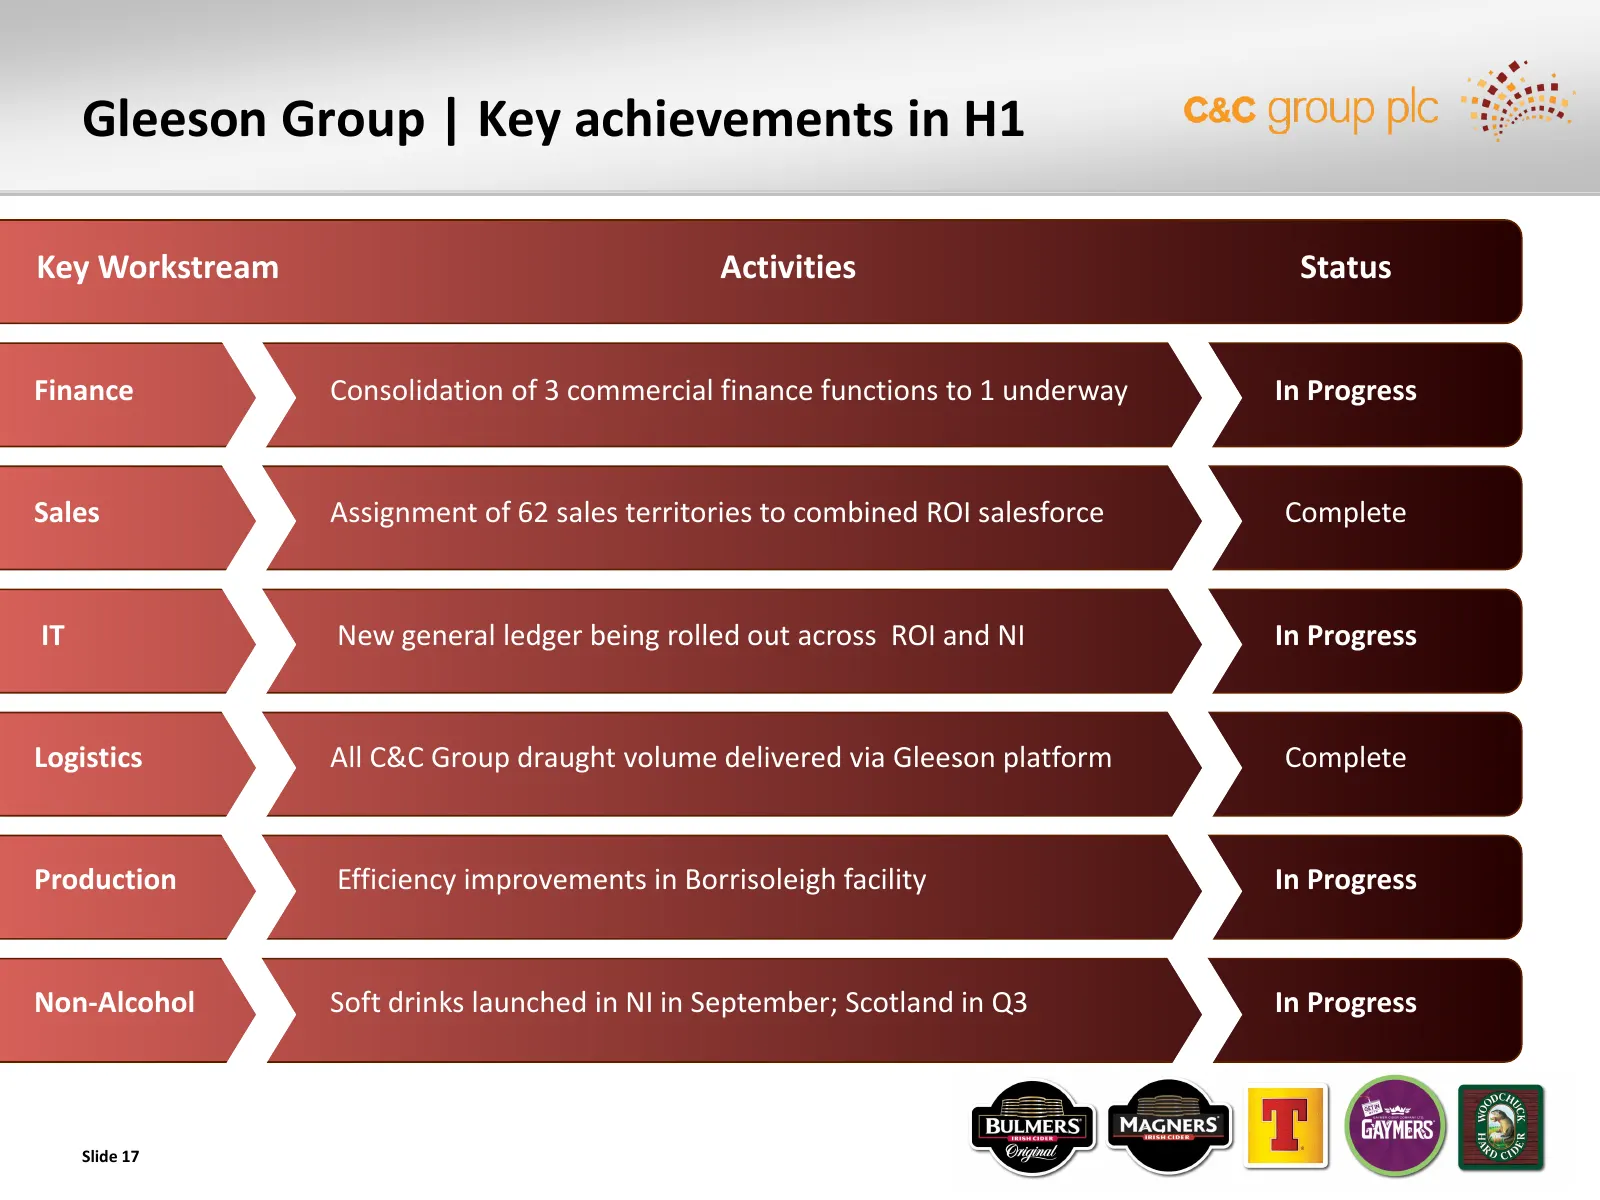
Gleeson Group | Key achievements in H1 Key Workstream Activities Status Finance Consolidation of 3 commercial finance functions to 1 underway In Progress Sales Assignment of 62 sales territories to combined ROI salesforce Complete IT New general ledger being rolled out across ROI and NI In Progress
Slide 18: Summary & Outlook
H1 2014 Performance Review Integration, Transition & Re-Positioning Summary & Outlook
Slide 19: H1 Performance Summary
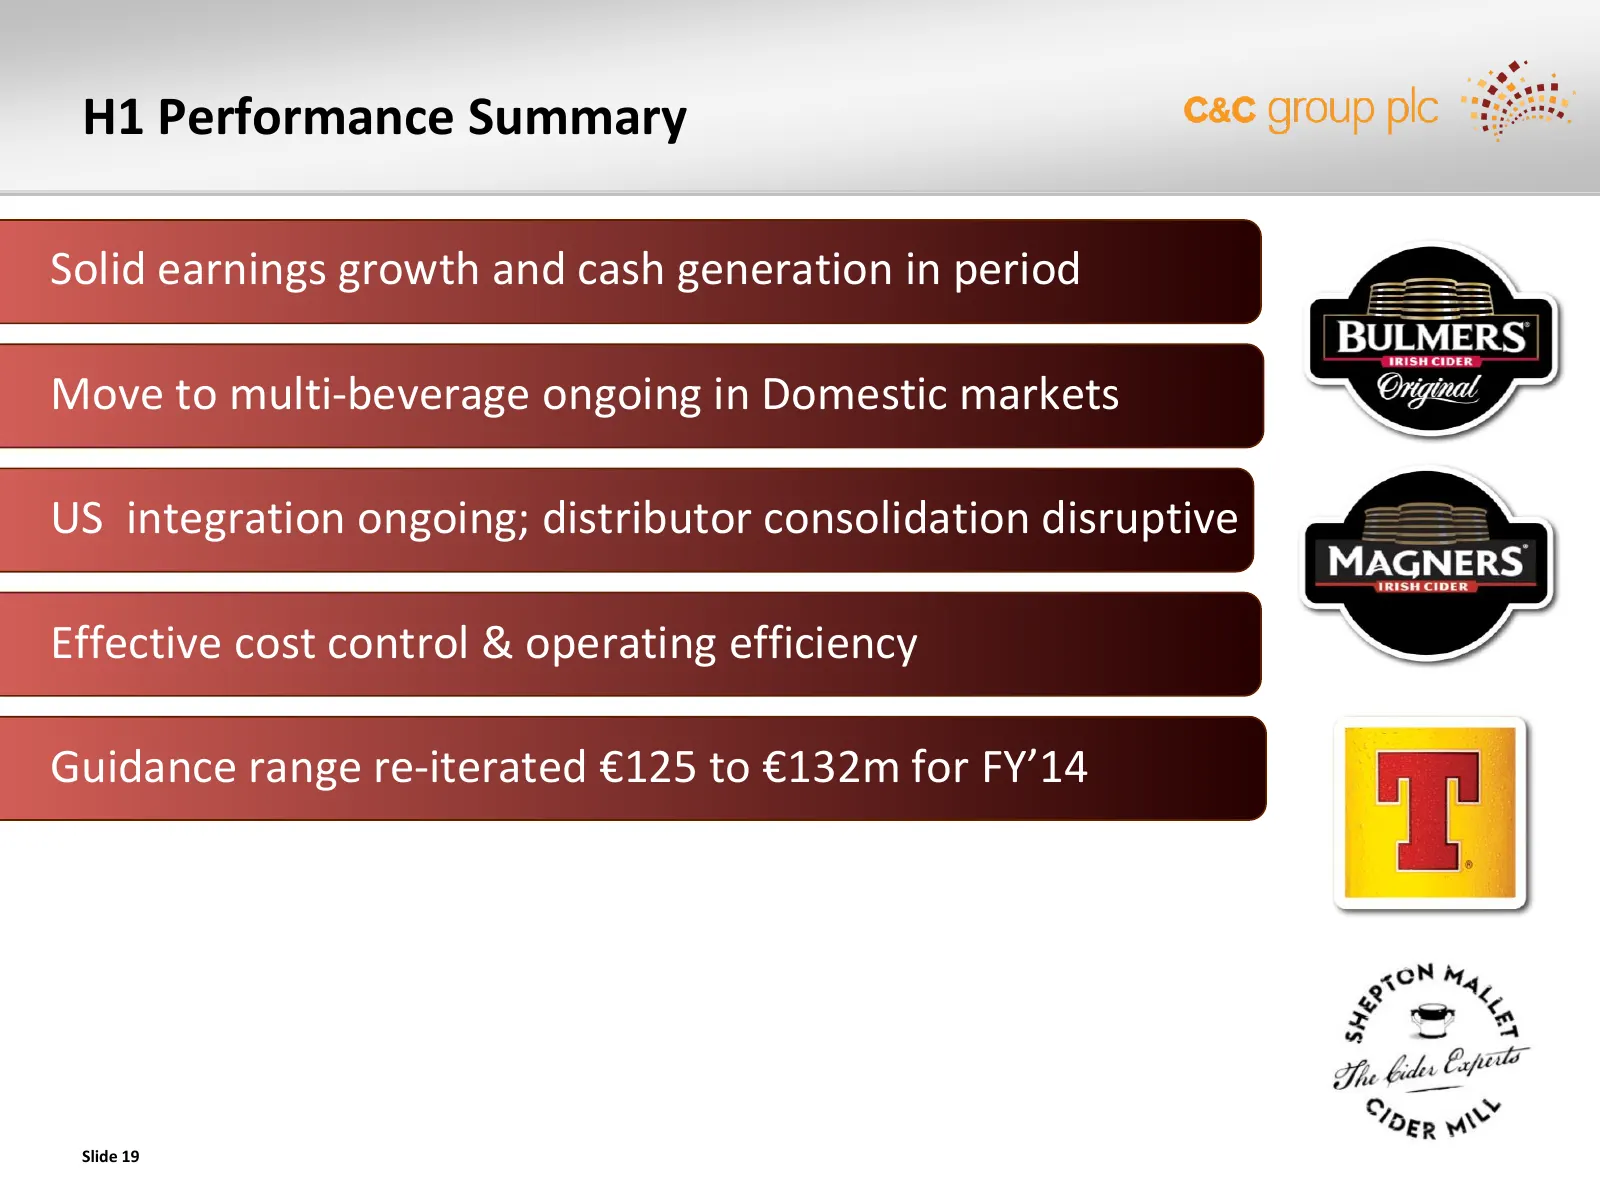
H1 Performance Summary Solid earnings growth and cash generation in period Move to multi-beverage ongoing in Domestic markets US integration ongoing; distributor consolidation disruptive Effective cost control & operating efficiency Guidance range re-iterated €125 to €132m for FY’14 Slide 19
Slide 20: Outlook
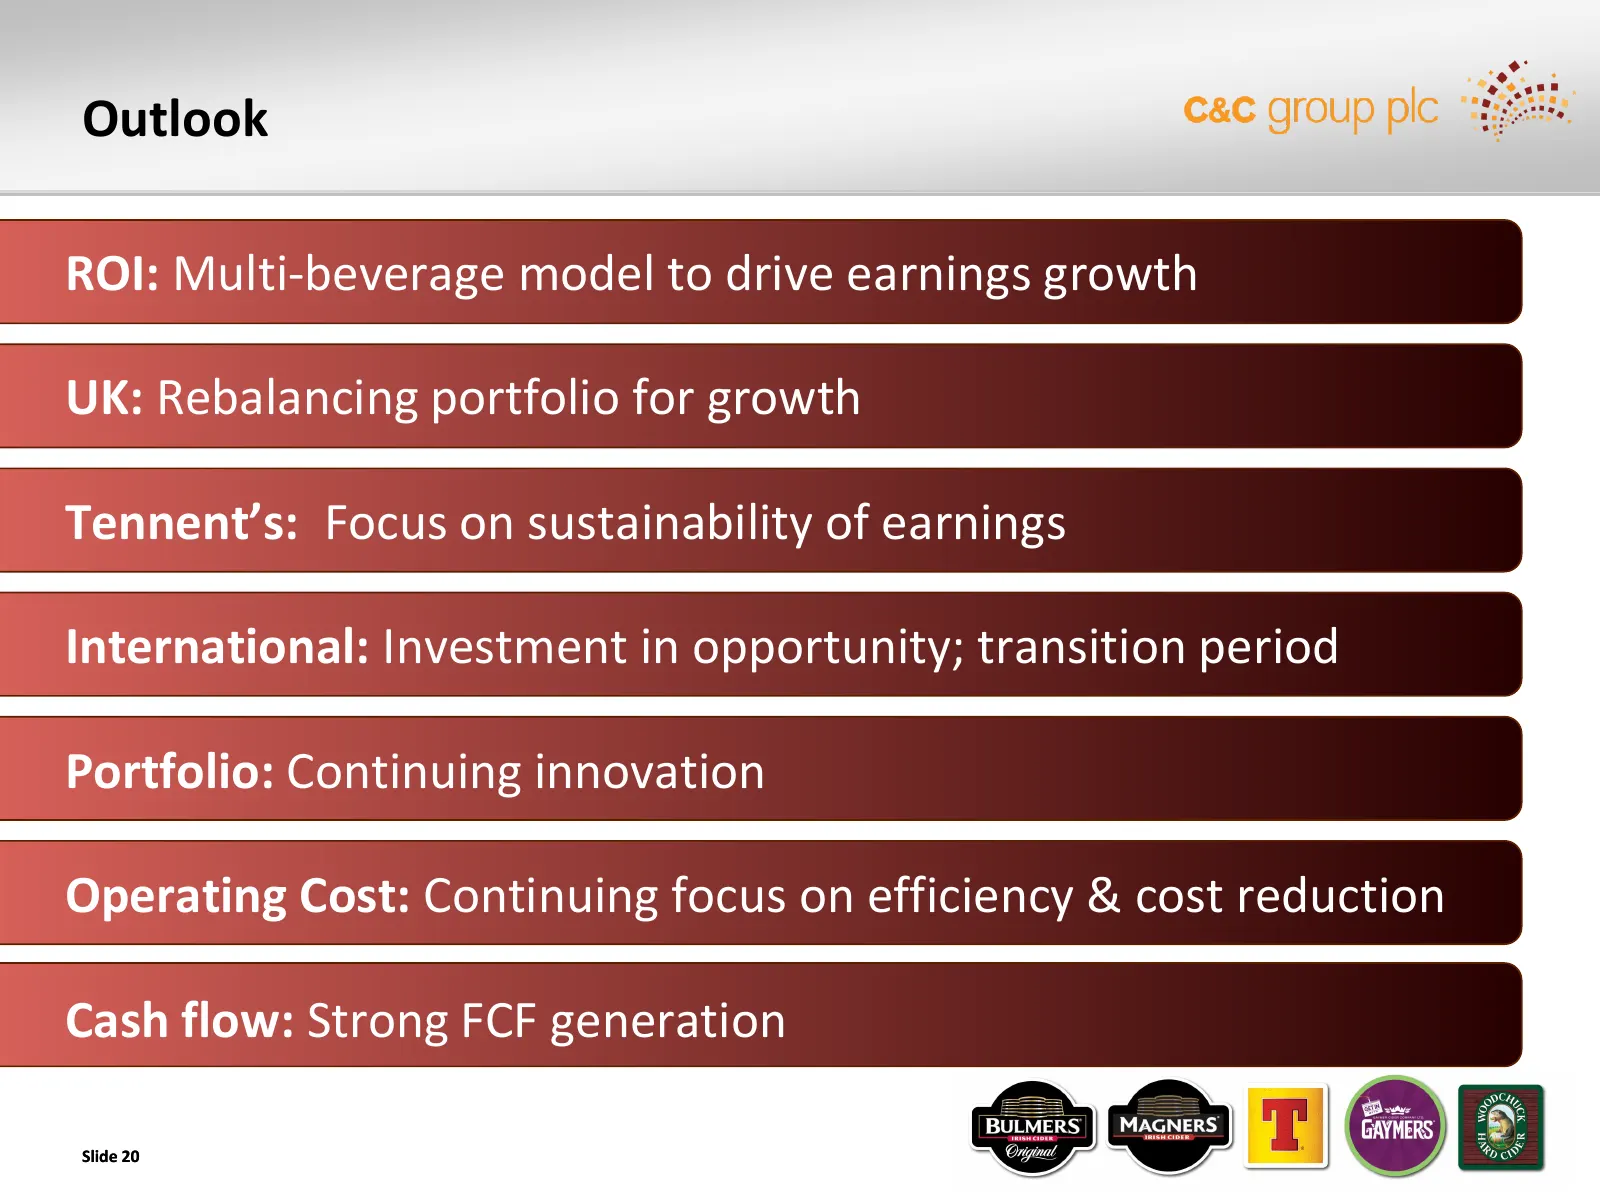
Outlook ROI: Multi-beverage model to drive earnings growth UK: Rebalancing portfolio for growth Tennent’s: Focus on sustainability of earnings International: Investment in opportunity; transition period Portfolio: Continuing innovation Operating Cost: Continuing focus on efficiency & cost reduction
Slide 21: Appendix
Appendix Strategic Developments & Transition Investment Case & Outlook Dividend per share up 10% to 9 cent
Slide 22: Segmental Analysis
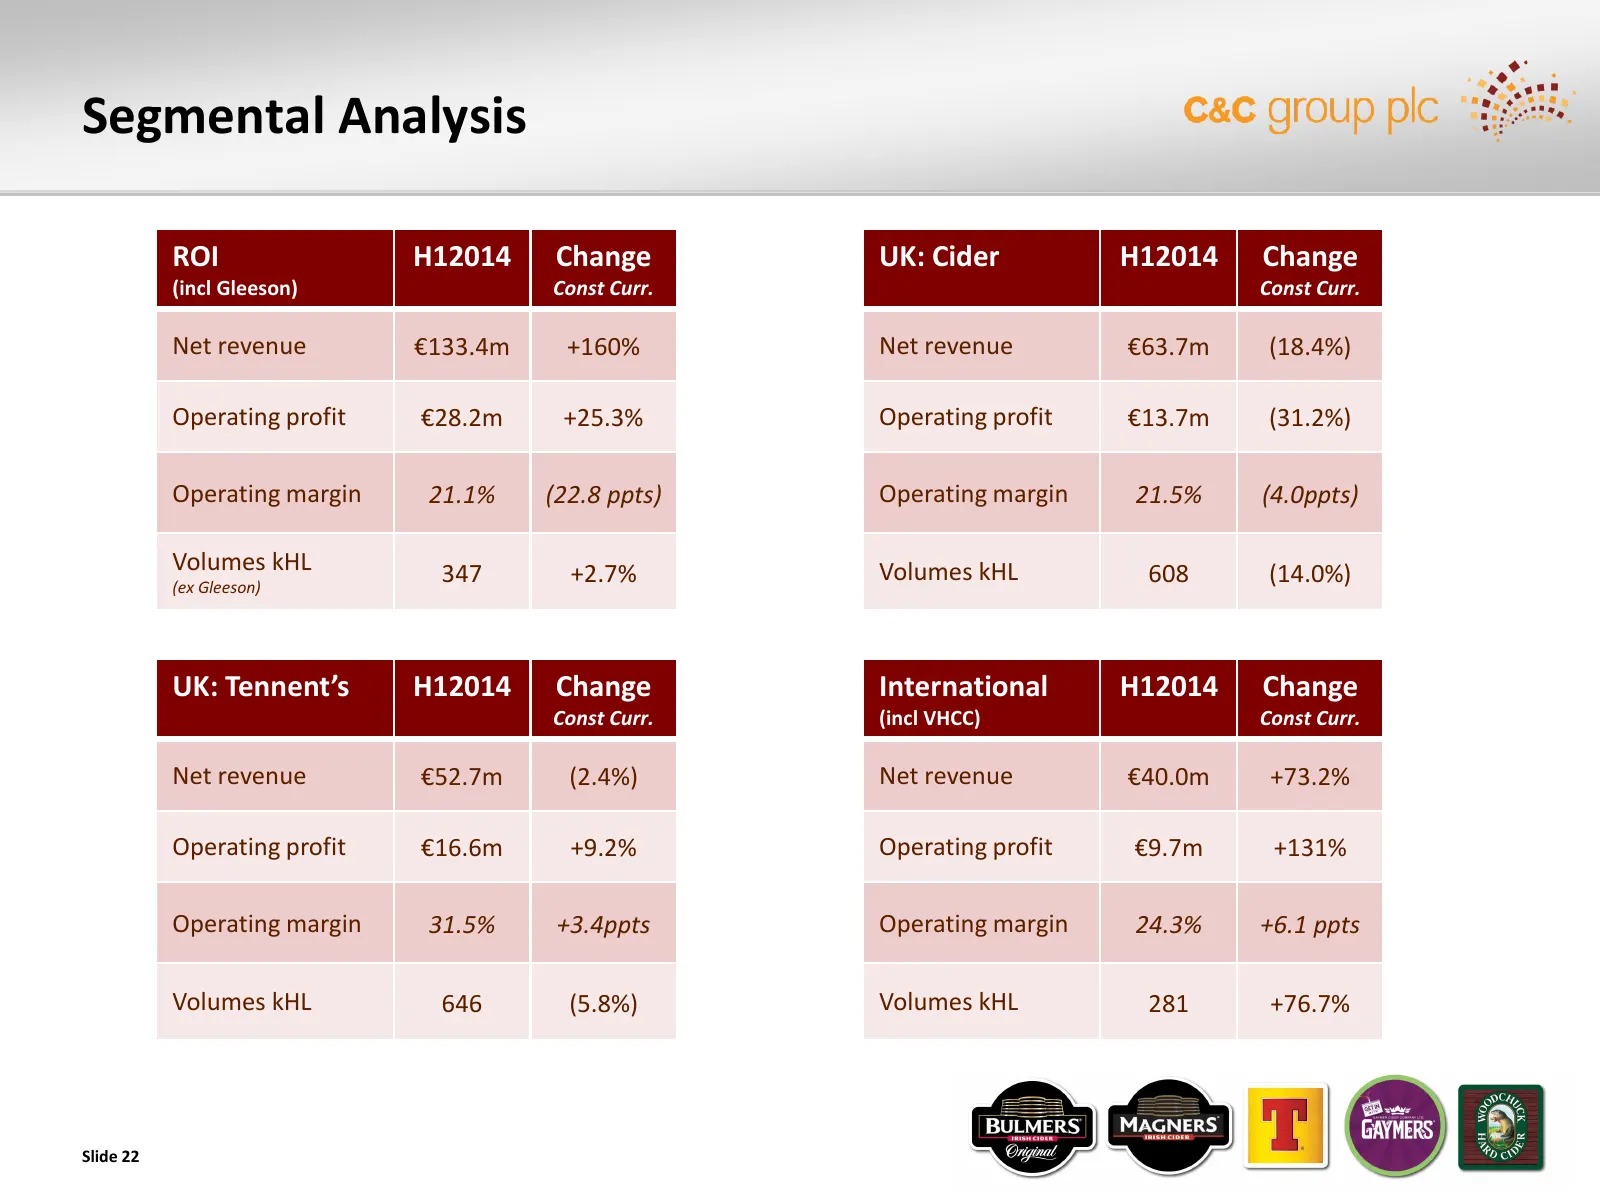
Segmental Analysis ROI H12014 Change UK: Cider H12014 Change (incl Gleeson) Const Curr. Const Curr. Net revenue €133.4m +160% Net revenue €63.7m (18.4%) Operating profit €28.2m +25.3% Operating profit €13.7m (31.2%) Operating margin 21.1% (22.8 ppts) Operating margin 21.5% (4.0ppts) Volumes kHL 347
Slide 23: www.candcgroupplc.com
www.candcgroupplic.com
Source: Internet Archive copy of candcgroupplc.com
More decks from C&C Group PLC
 H1 FY2027 Earnings Presentation28 slides · Oct 28, 2026
 Investor Day (September 2026)65 slides · Sep 24, 2026
 Investor Day (September 2026)39 slides · Sep 24, 2026
 FY2026 Earnings Presentation35 slides · May 19, 2026
 H1 FY2026 Earnings Presentation28 slides · Oct 28, 2025
 FY2025 Earnings Presentation27 slides · May 28, 2025