Subsea 7 S.A. · OSL:SUBC
Subsea 7 — FY2022 Earnings Presentation
26 slides from Subsea 7's earnings presentation, Mar 2, 2023
Slide 1: Fourth Quarter and Full Year 2022 Earnings Presentation
Fourth Quarter and Full Year 2022 Earnings Presentation 2 March 2023 1 © Subsea7 - 2023 subsea7.com
Slide 2: Forward-looking statements
Forward-looking statements This document may contain ‘forward-looking statements’ (within the meaning of the safe harbour provisions of the U.S. Private Securities Litigation Reform Act of 1995). These statements relate to our current expectations, beliefs, intentions, assumptions or strategies rega
Slide 3: 2022 – accelerated pace of recovery
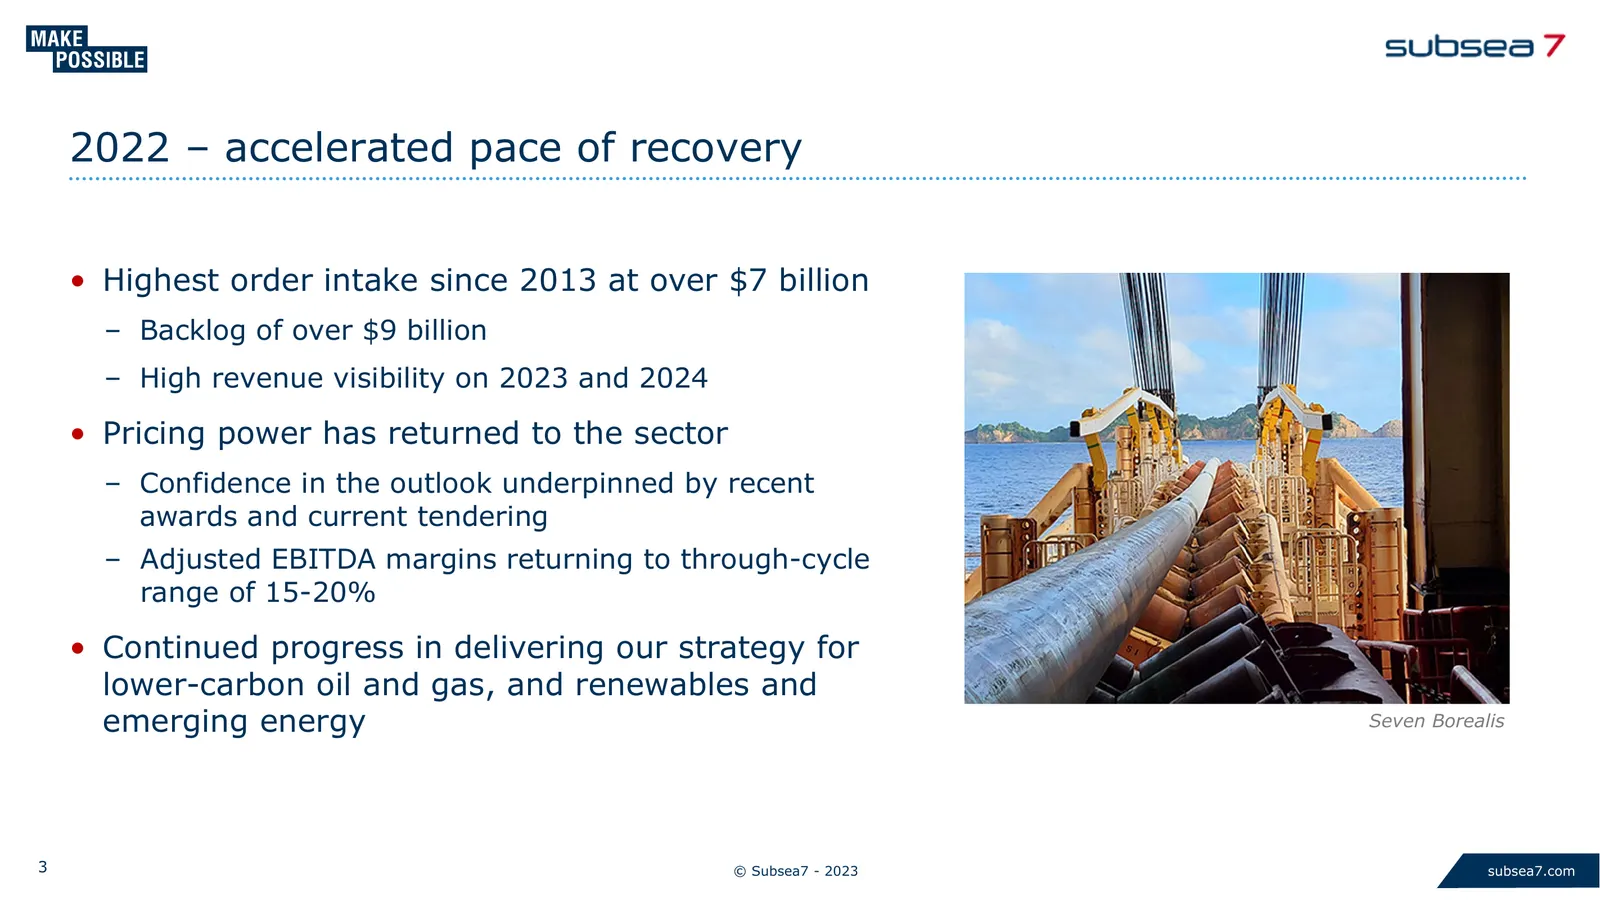
2022 – accelerated pace of recovery • Highest order intake since 2013 at over $7 billion – Backlog of over $9 billion – High revenue visibility on 2023 and 2024 • Pricing power has returned to the sector – Confidence in the outlook underpinned by recent awards and current tendering – Adjusted EBITDA
Slide 4: Major projects – making good progress
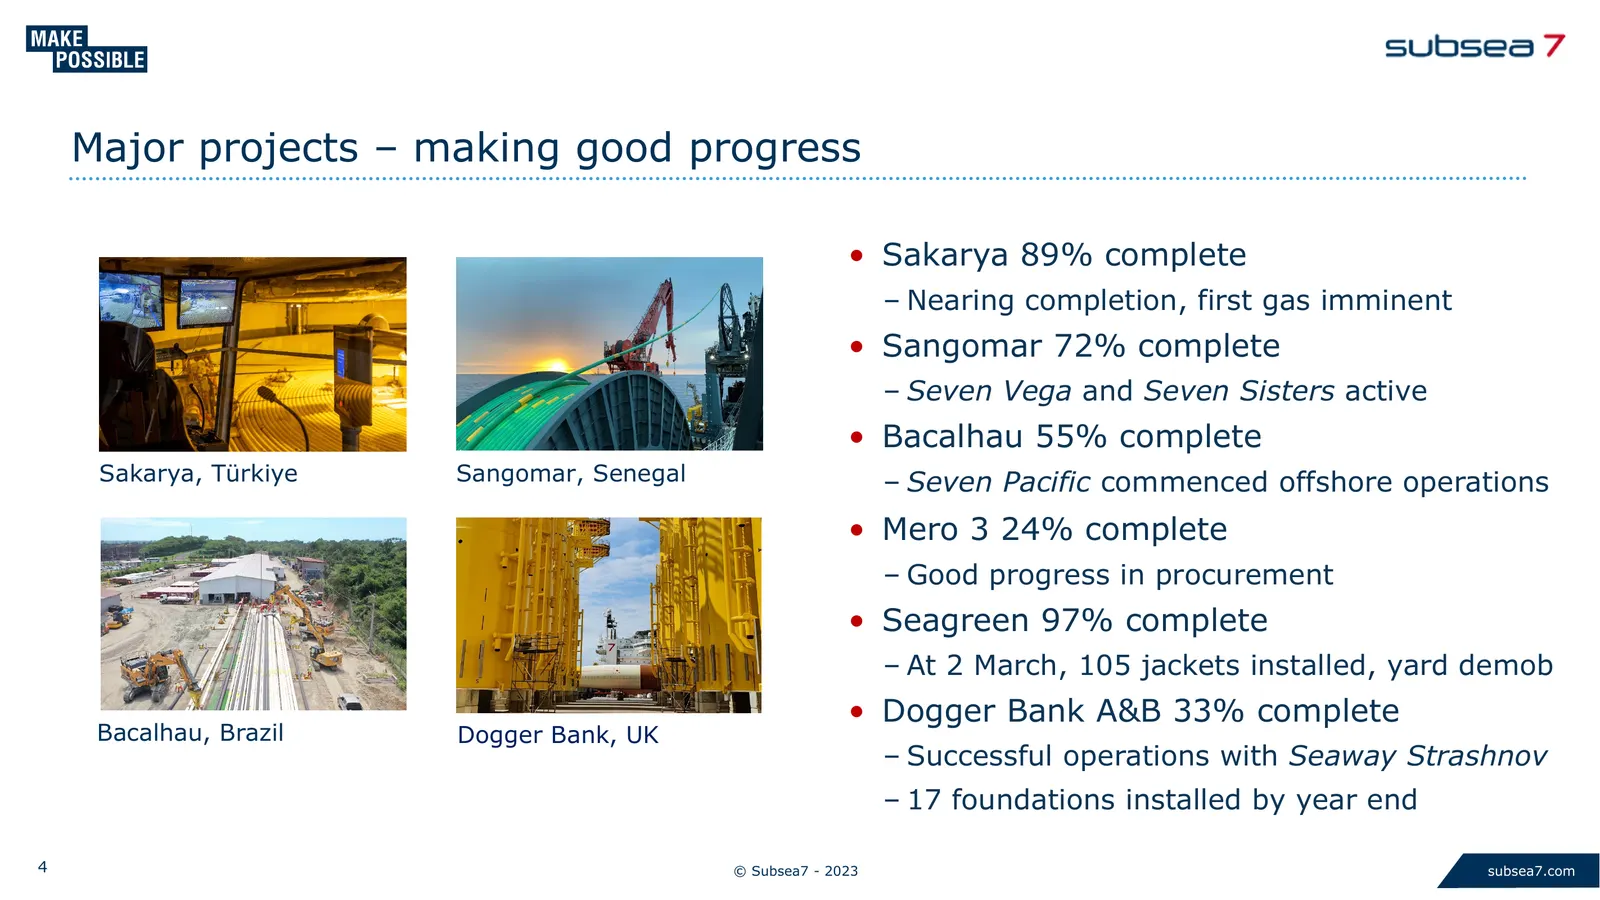
Major projects – making good progress • Sakarya 89% complete – Nearing completion, first gas imminent • Sangomar 72% complete – Seven Vega and Seven Sisters active • Bacalhau 55% complete Sakarya, Türkiye Sangomar, Senegal – Seven Pacific commenced offshore operations • Mero 3 24% complete – Good pr
Slide 5: Backlog – strong growth
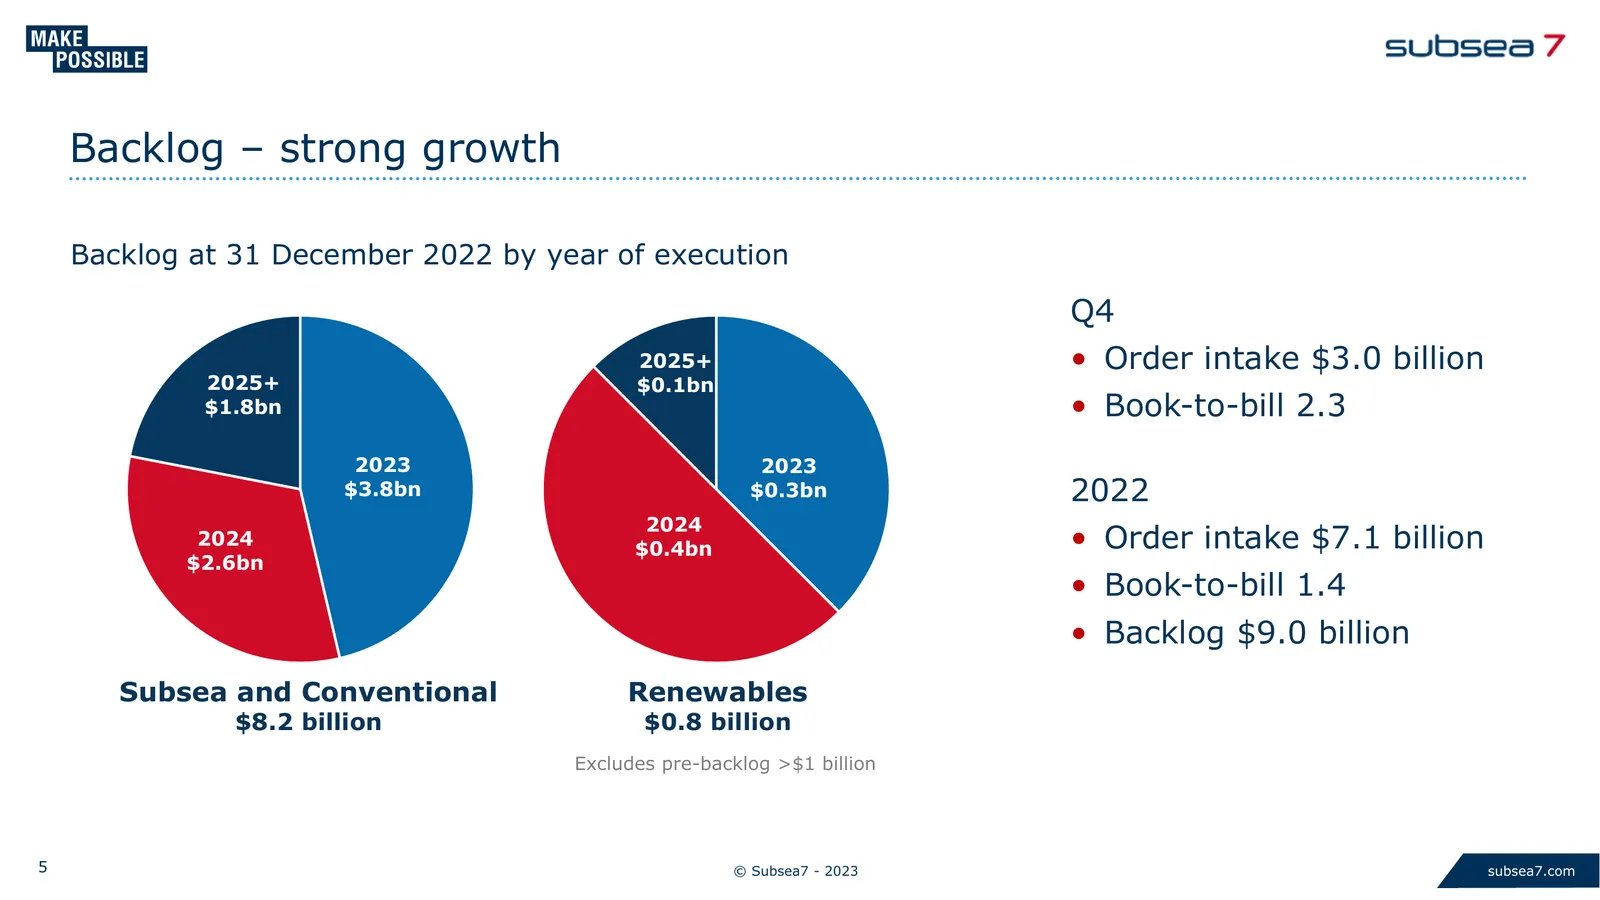
Backlog – strong growth Backlog at 31 December 2022 by year of execution Q4 2025+ • Order intake $3.0 billion 2025+ $0.1bn $1.8bn • Book-to-bill 2.3 2023 2023 $3.8bn $0.3bn 2022 2024 2024 $0.4bn • Order intake $7.1 billion $2.6bn • Book-to-bill 1.4 • Backlog $9.0 billion Subsea and Conventional Rene
Slide 6: Recovering market – highest order intake since 2013
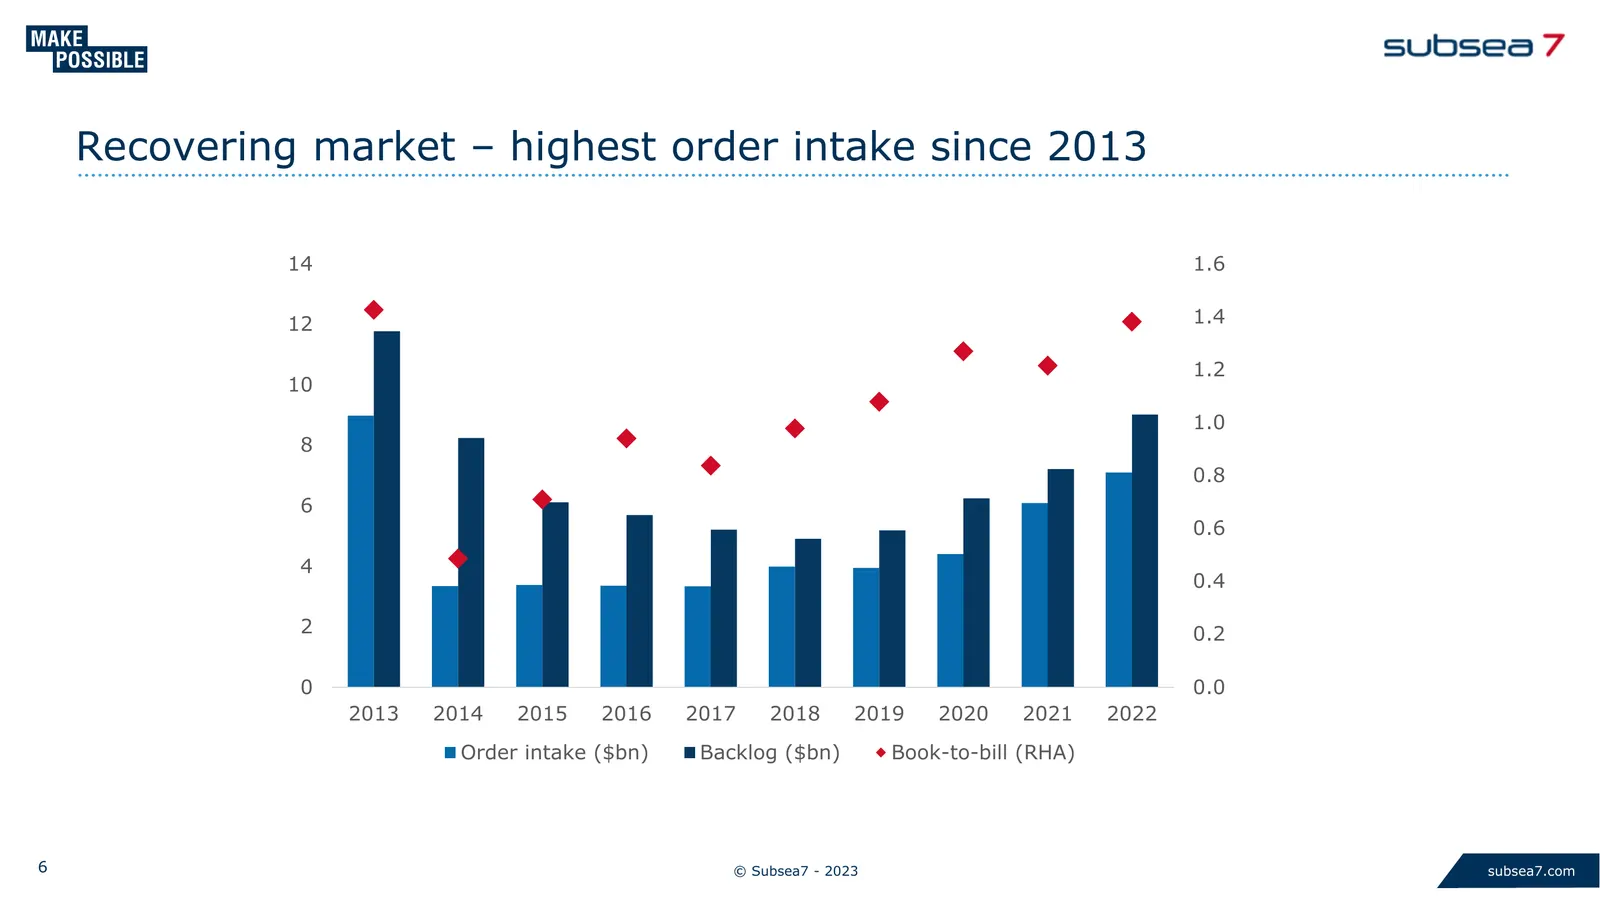
Recovering market – highest order intake since 2013 14 1.6 12 1.4 1.2 10 1.0 8 0.8 6 0.6 4 0.4 2 0.2 0 0.0 2013 2014 2015 2016 2017 2018 2019 2020 2021 2022 Order intake ($bn) Backlog ($bn) Book-to-bill (RHA) 6 © Subsea7 - 2023 subsea7.com
Slide 7: Recovering market – enhanced revenue visibility
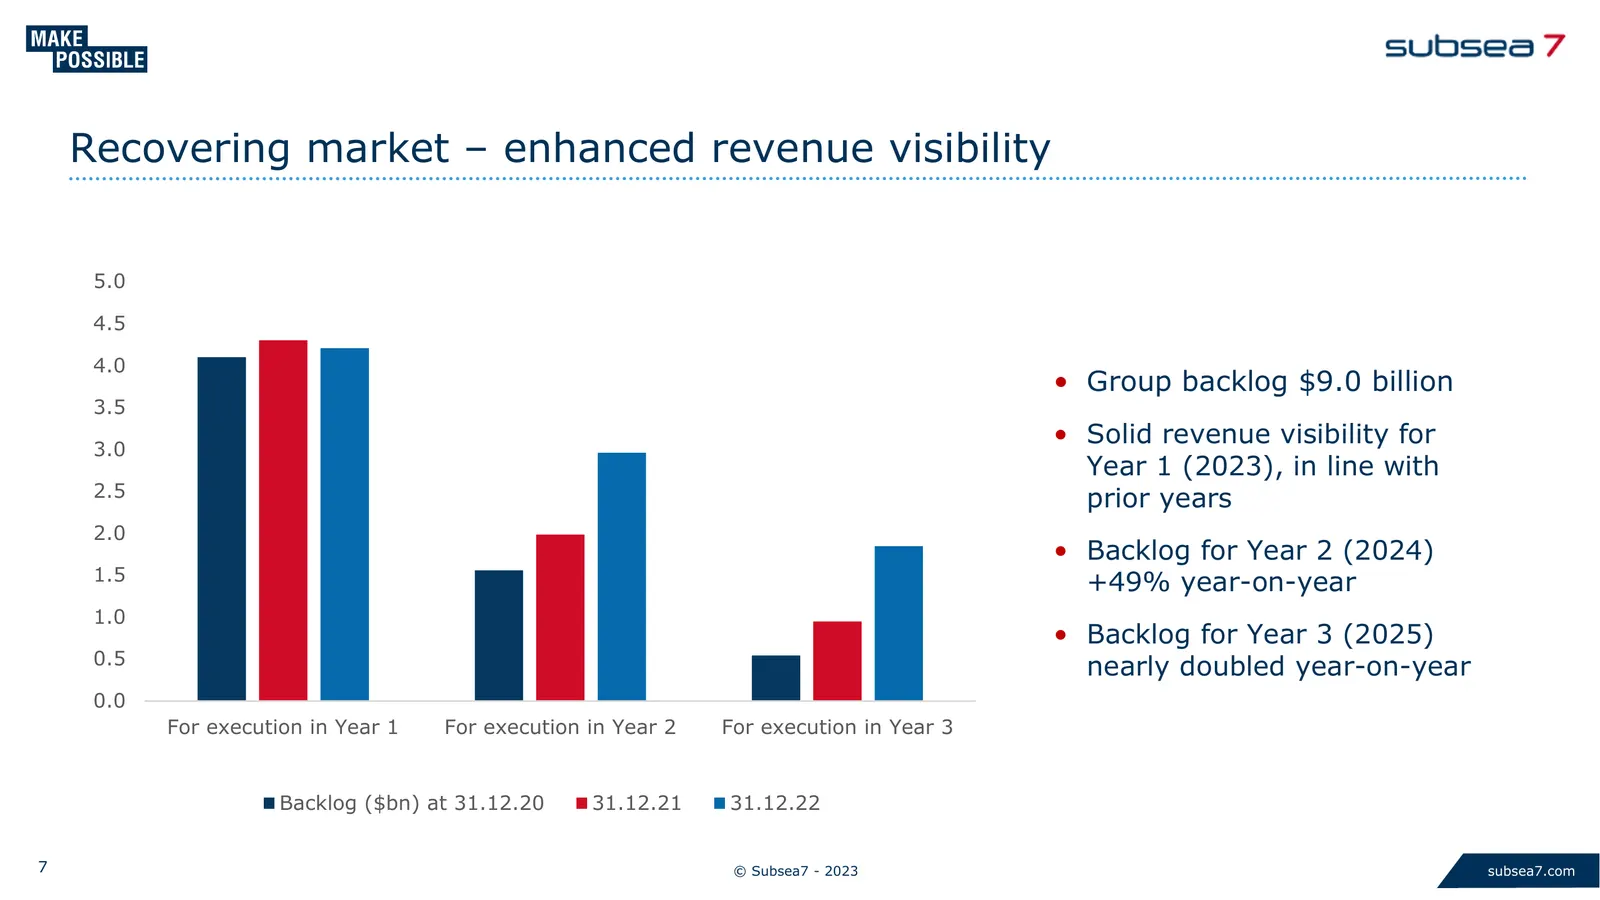
Recovering market – enhanced revenue visibility 5.0 4.5 4.0 • Group backlog $9.0 billion 3.5 3.0 • Solid revenue visibility for Year 1 (2023), in line with 2.5 prior years 2.0 • Backlog for Year 2 (2024) 1.5 +49% year-on-year 1.0 • Backlog for Year 3 (2025) 0.5 nearly doubled year-on-year 0.0 For ex
Slide 8: Recovering market - EBITDA margin expansion
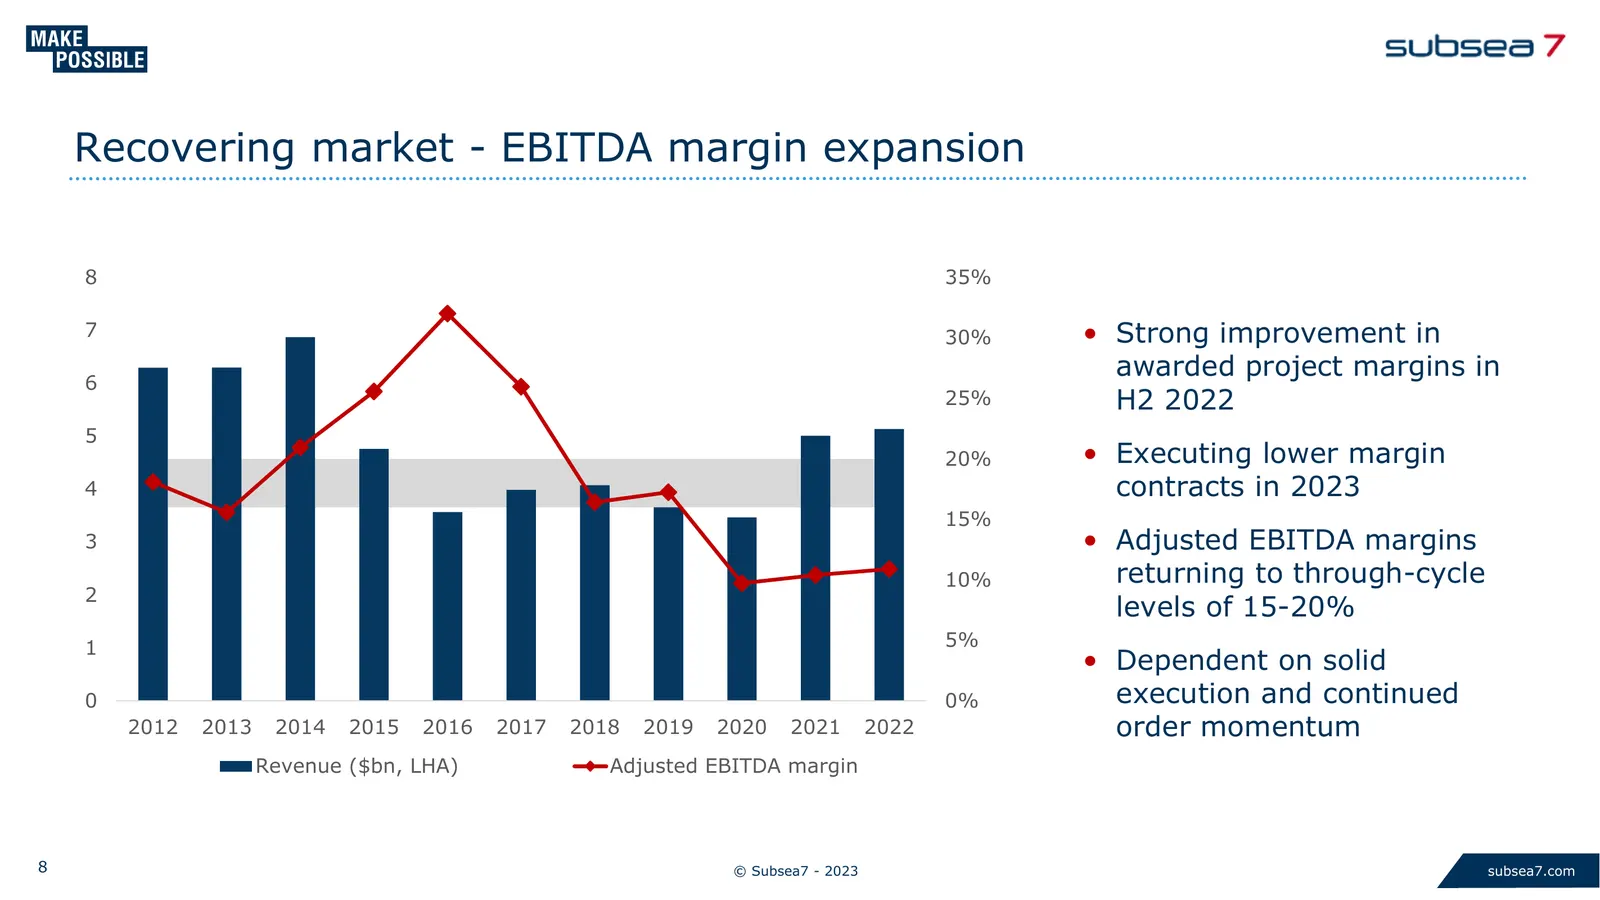
Recovering market - EBITDA margin expansion 8 35% 7 30% • Strong improvement in awarded project margins in 6 25% H2 2022 5 20% • Executing lower margin 4 contracts in 2023 15% 3 • Adjusted EBITDA margins 10% returning to through-cycle 2 levels of 15-20% 1 5% • Dependent on solid 0 0% execution and c
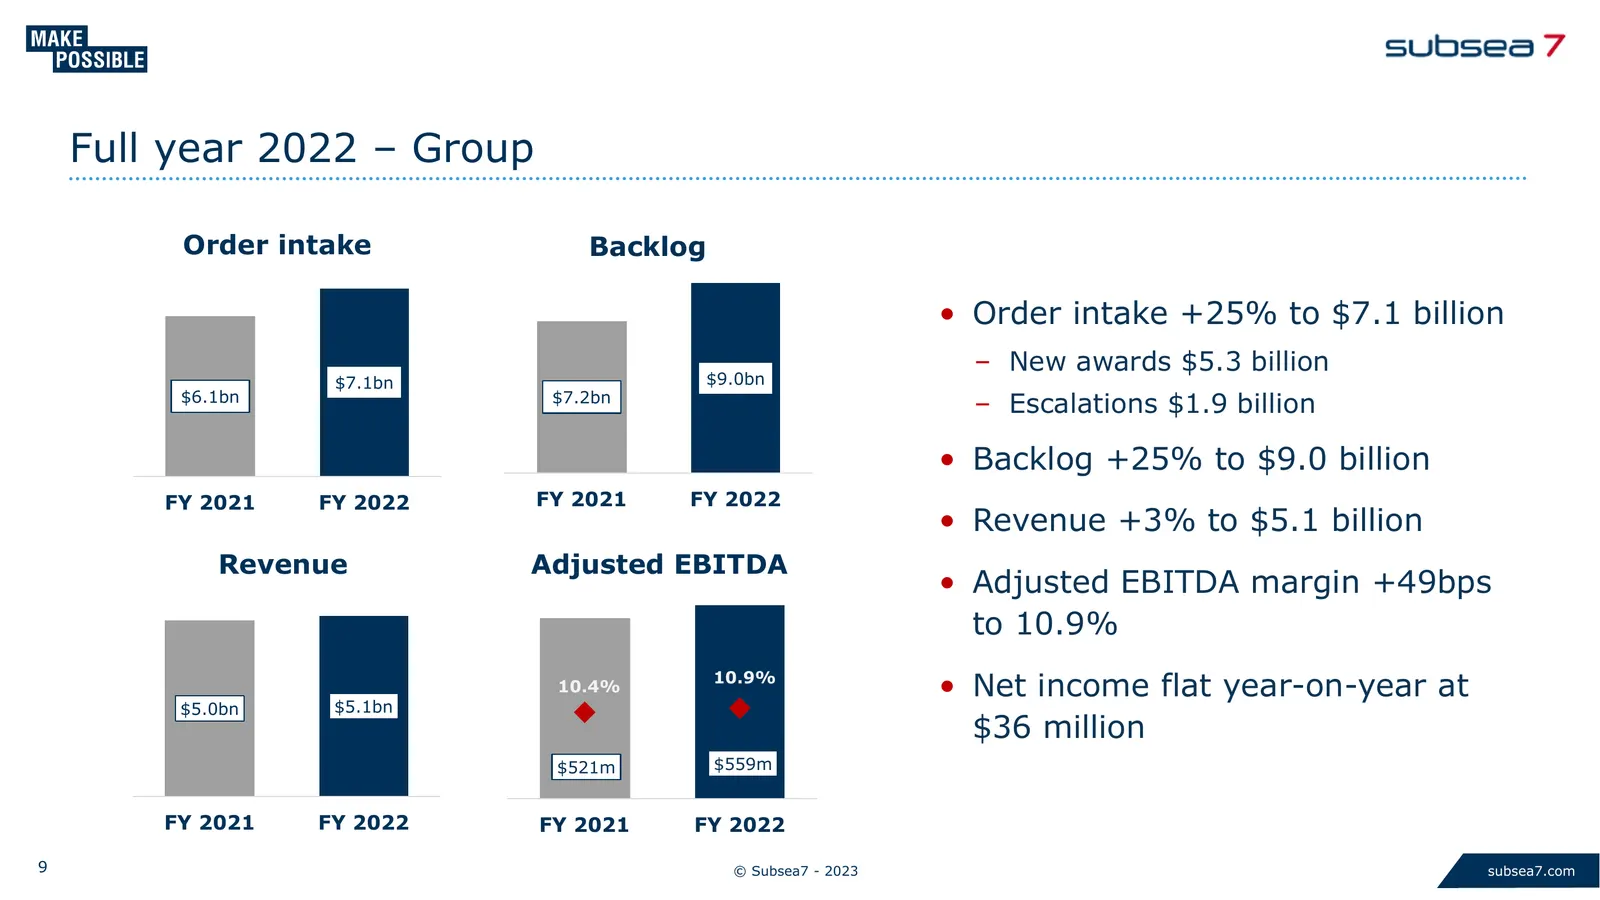
Slide 9: Full year 2022 – Group
Full year 2022 – Group Order intake Backlog • Order intake +25% to $7.1 billion – New awards $5.3 billion $7.1bn $9.0bn $6.1bn $7.2bn – Escalations $1.9 billion • Backlog +25% to $9.0 billion FY 2021 FY 2022 FY 2021 FY 2022 • Revenue +3% to $5.1 billion Revenue Adjusted EBITDA 600 0.25 • Adjusted EB
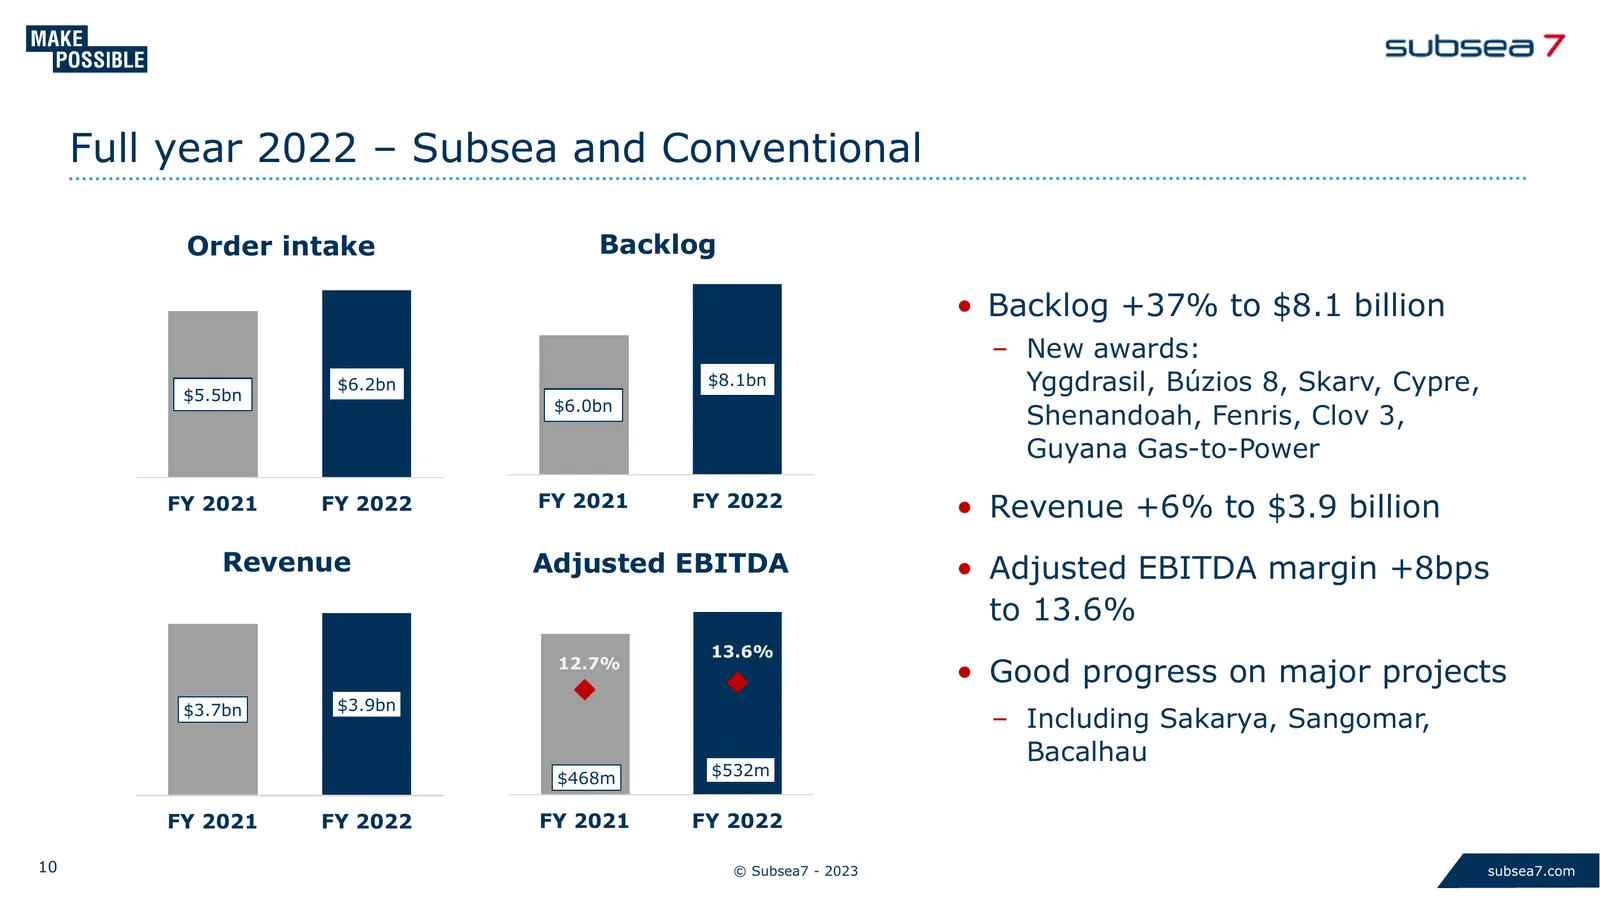
Slide 10: Full year 2022 – Subsea and Conventional
Full year 2022 – Subsea and Conventional Order intake Backlog • Backlog +37% to $8.1 billion – New awards: $5.5bn $6.2bn $8.1bn Yggdrasil, Búzios 8, Skarv, Cypre, $6.0bn Shenandoah, Fenris, Clov 3, Guyana Gas-to-Power FY 2021 FY 2022 FY 2021 FY 2022 • Revenue +6% to $3.9 billion Revenue Adjusted EBI
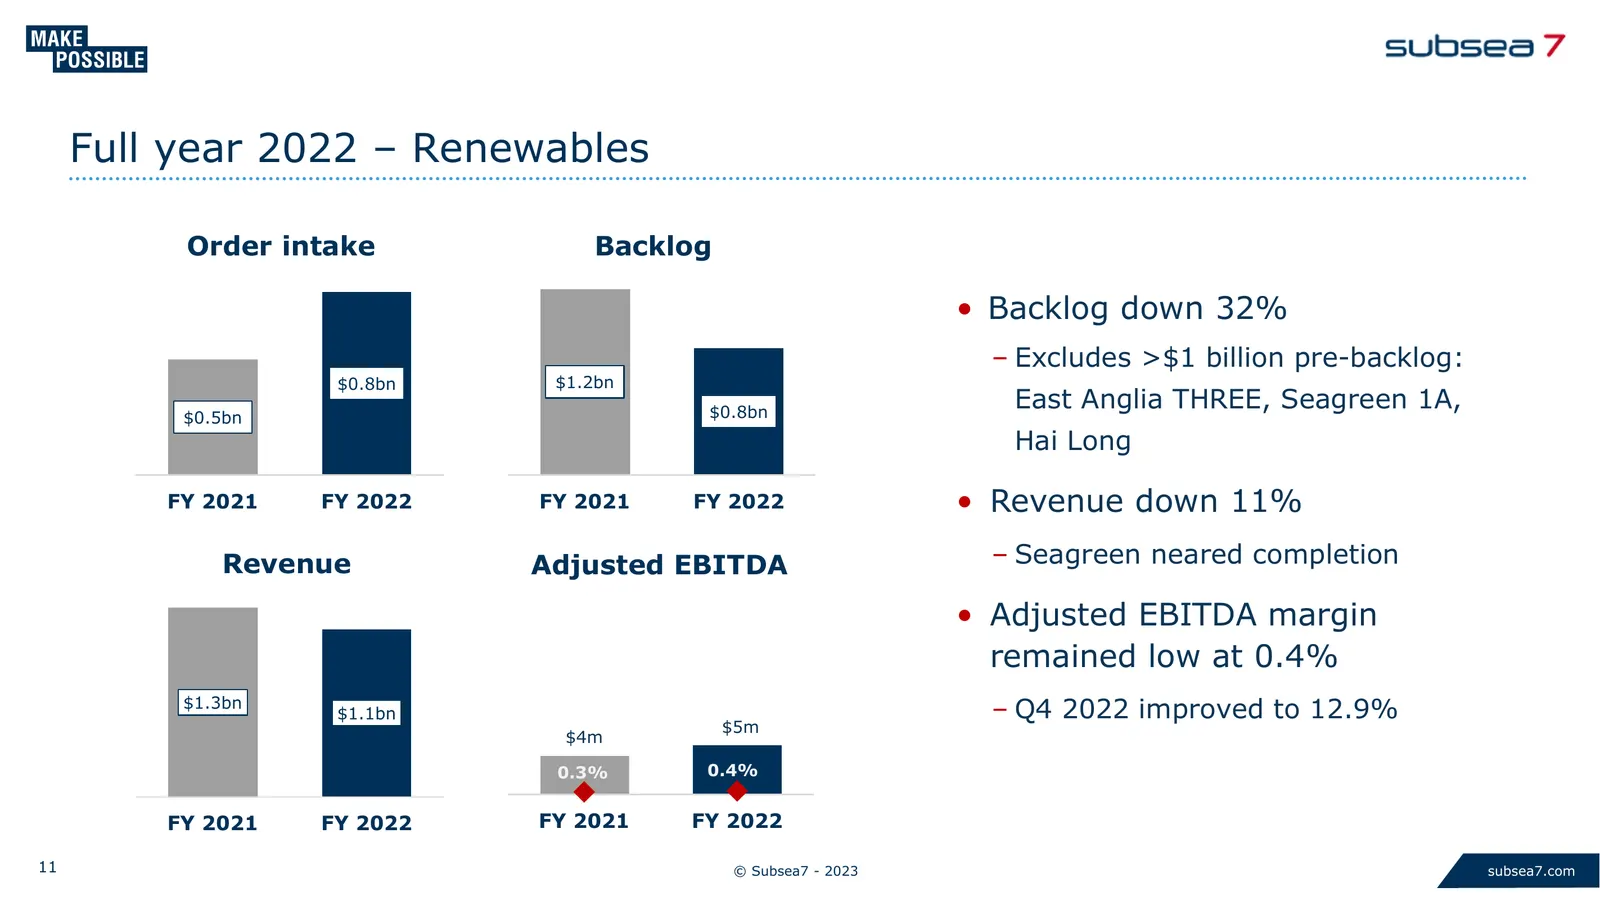
Slide 11: Full year 2022 – Renewables
Full year 2022 – Renewables Order intake Backlog • Backlog down 32% – Excludes >$1 billion pre-backlog: $0.8bn $1.2bn $0.8bn East Anglia THREE, Seagreen 1A, $0.5bn Hai Long FY 2021 FY 2022 FY 2021 FY 2022 • Revenue down 11% Revenue Adjusted EBITDA – Seagreen neared completion 20 0.25 18 16 0.2 • Adj
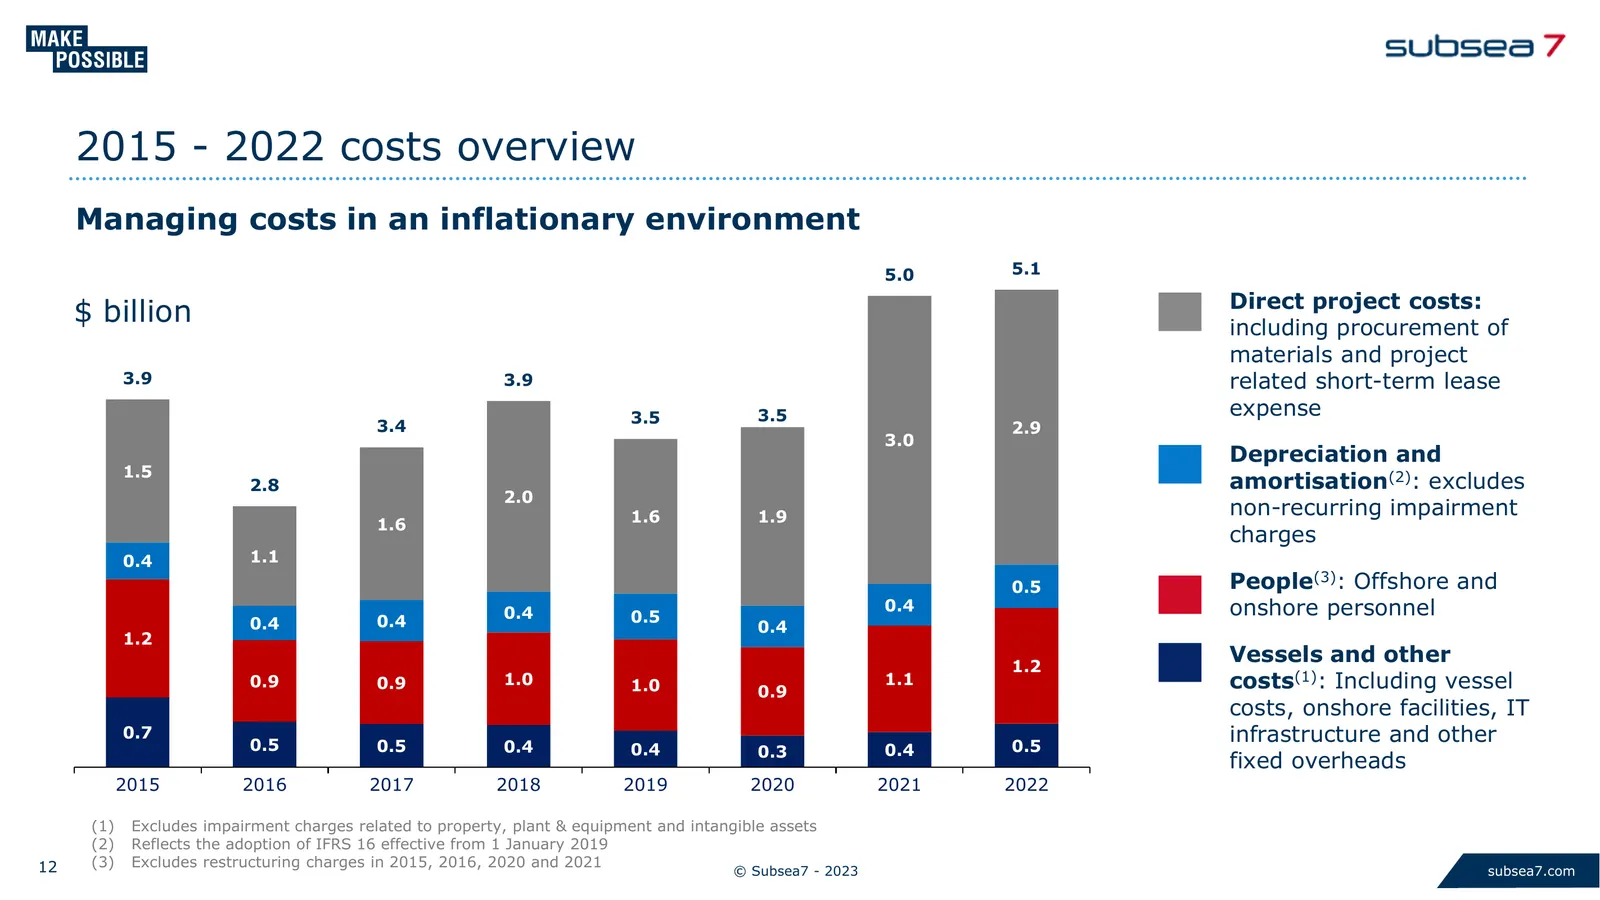
Slide 12: 2015 - 2022 costs overview
2015 - 2022 costs overview Managing costs in an inflationary environment 5.0 5.1 Direct project costs: $ billion including procurement of materials and project 3.9 3.9 related short-term lease 3.5 3.5 expense 3.4 2.9 3.0 Depreciation and 1.5 2.8 amortisation(2): excludes 2.0 1.6 1.9 non-recurring im
Slide 13: Full year 2022 – strong cash flow
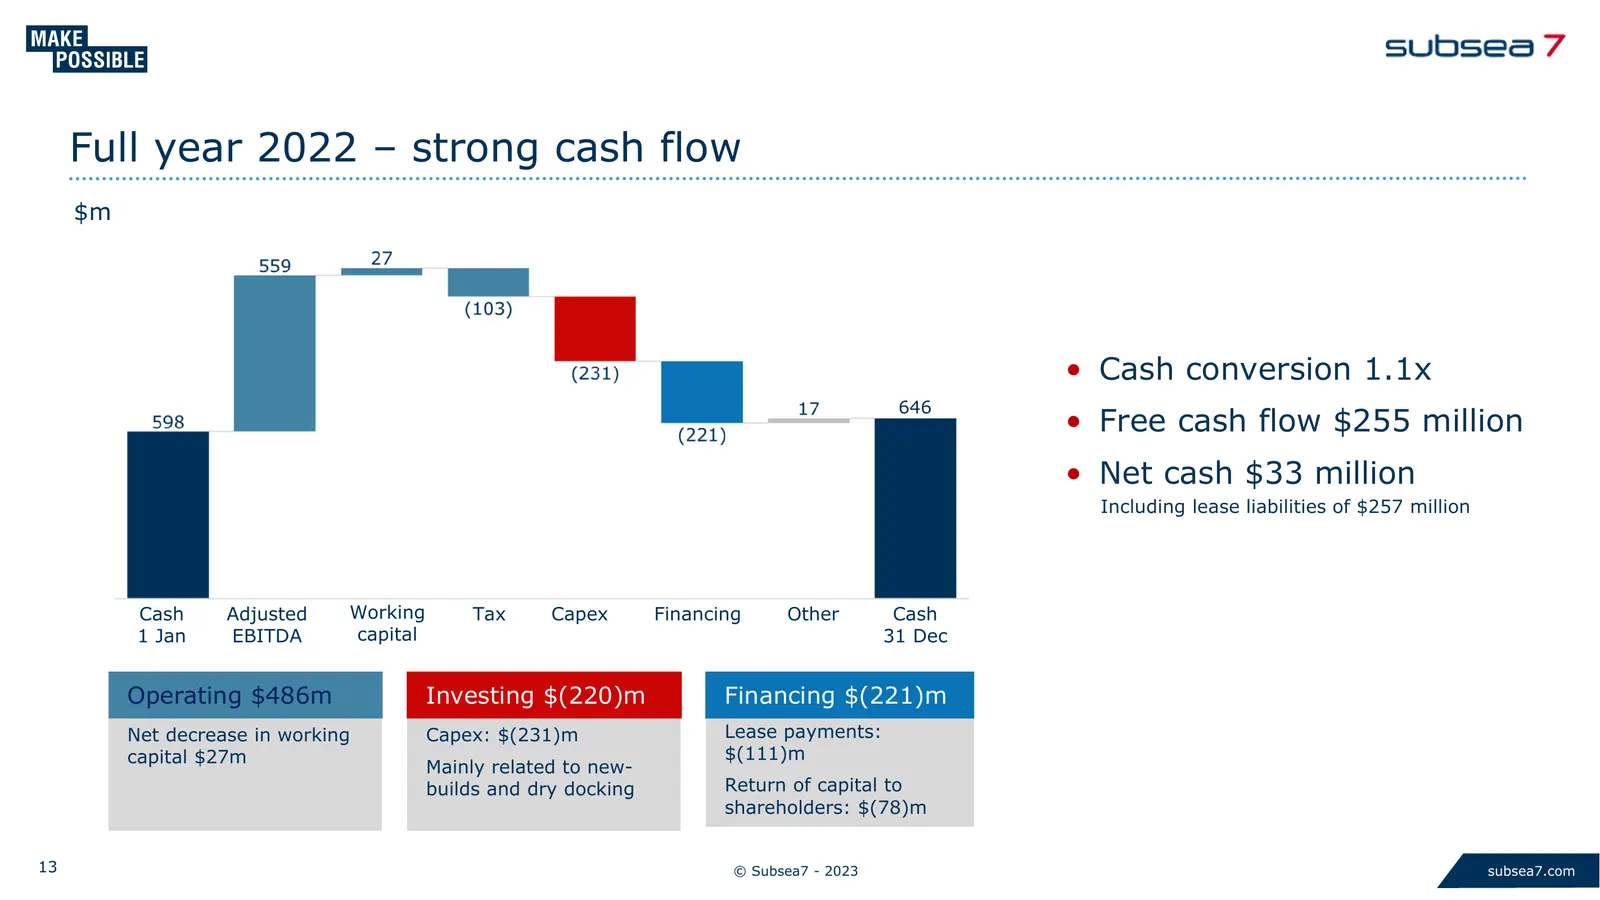
Full year 2022 – strong cash flow $m • Cash conversion 1.1x 646 • Free cash flow $255 million • Net cash $33 million Including lease liabilities of $257 million Cash Adjusted Working Tax Capex Financing Other Cash 1 Jan EBITDA capital 31 Dec Operating $486m Investing $(220)m Financing $(221)m Net de
Slide 14: Group financial guidance for 2023
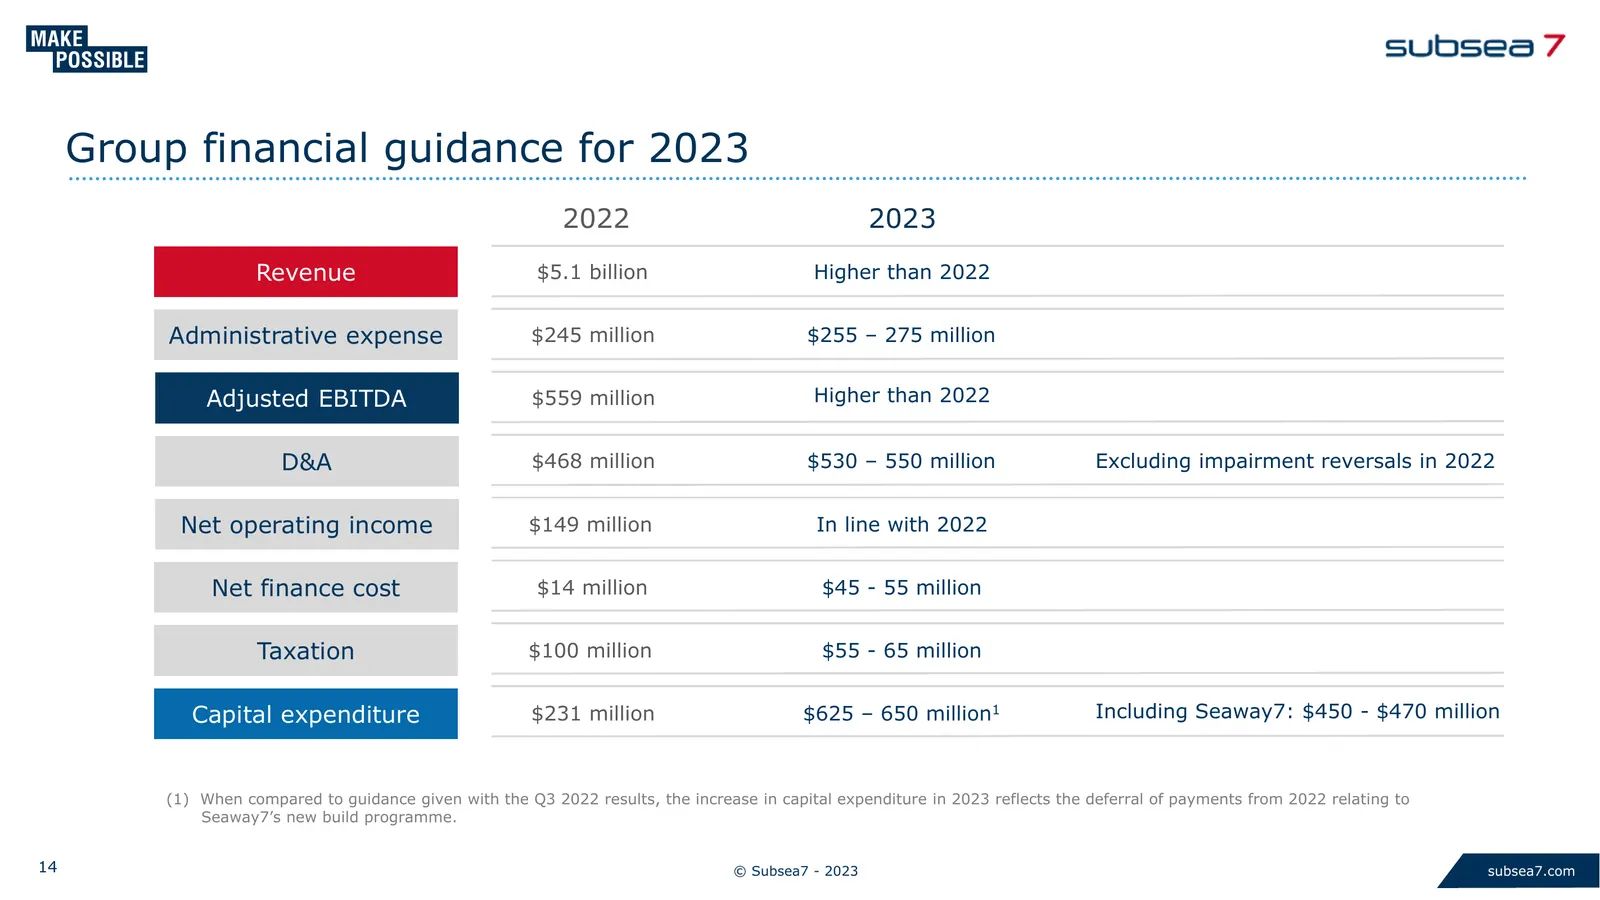
Group financial guidance for 2023 2022 2023 Revenue $5.1 billion Higher than 2022 Administrative expense $245 million $255 – 275 million Adjusted EBITDA $559 million Higher than 2022 D&A $468 million $530 – 550 million Excluding impairment reversals in 2022 Net operating income $149 million In line
Slide 15: Strategic progress in 2022 - communicating our strategy
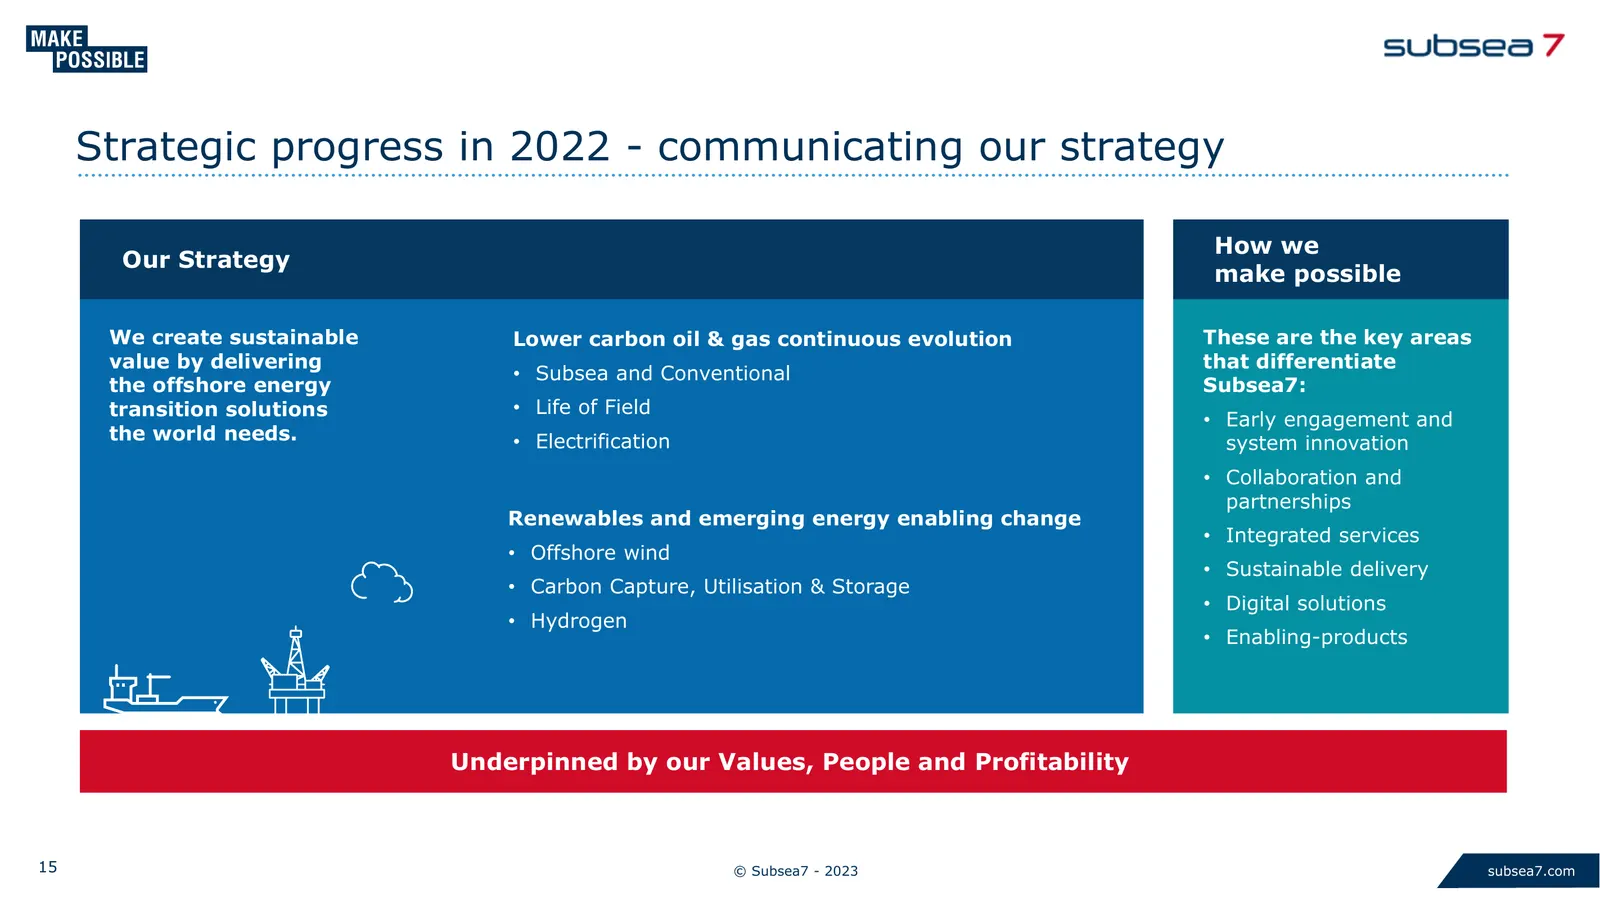
Strategic progress in 2022 - communicating our strategy How we Our Strategy make possible We create sustainable Lower carbon oil & gas continuous evolution These are the key areas value by delivering that differentiate • Subsea and Conventional the offshore energy Subsea7: transition solutions • Lif
Slide 16: Strategic progress
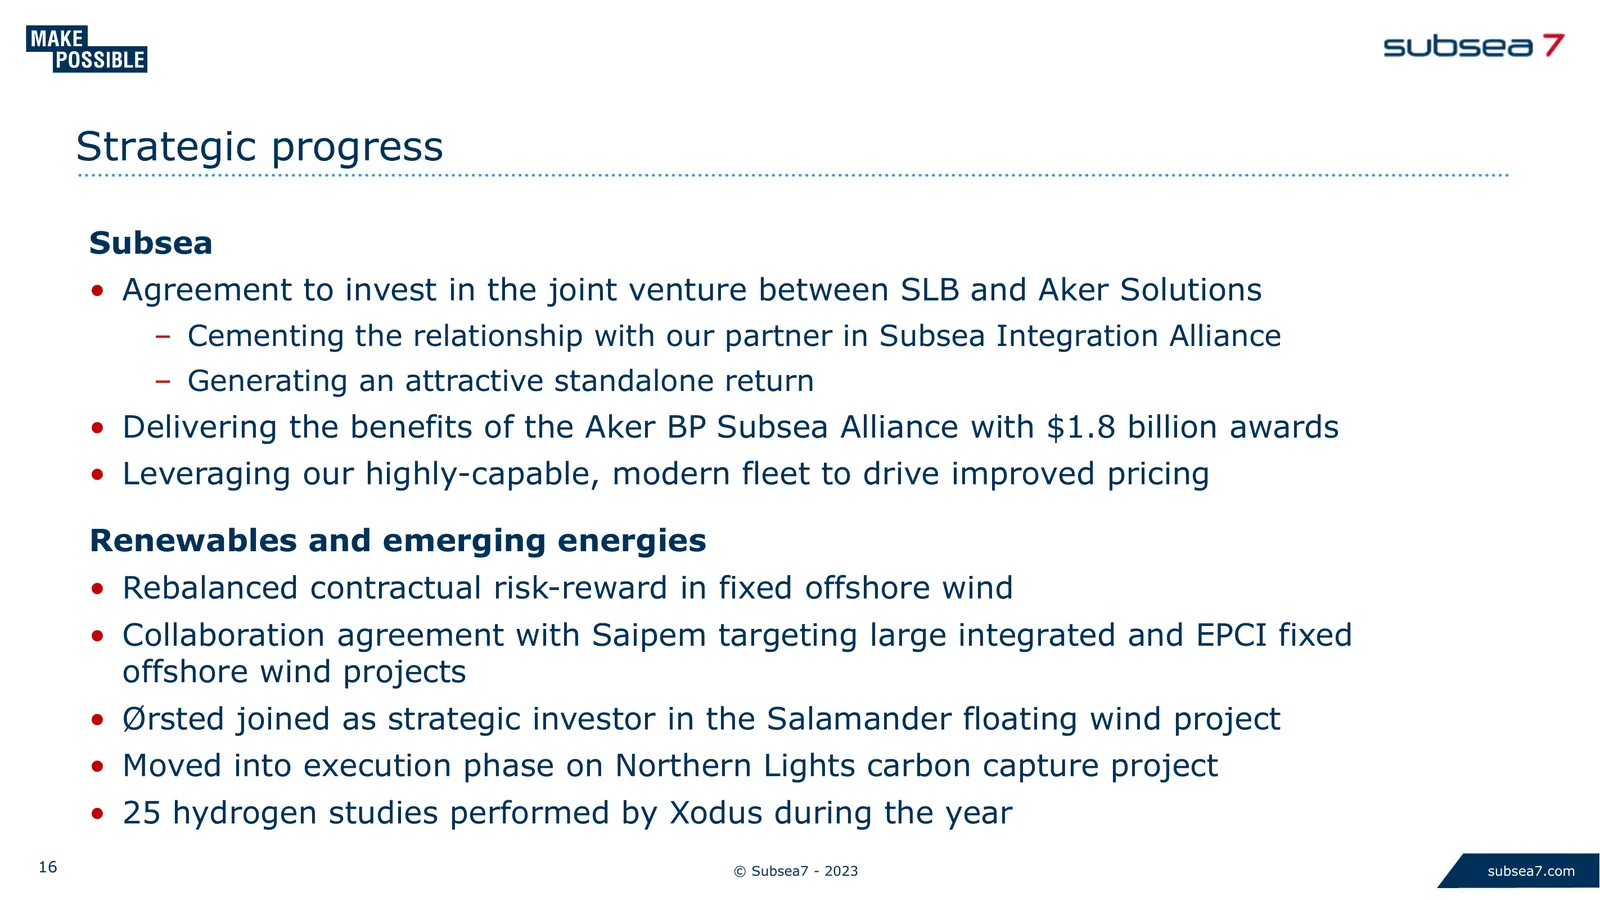
Strategic progress Subsea • Agreement to invest in the joint venture between SLB and Aker Solutions – Cementing the relationship with our partner in Subsea Integration Alliance – Generating an attractive standalone return • Delivering the benefits of the Aker BP Subsea Alliance with $1.8 billion awa
Slide 17: Strategic progress in 2022 - Sustainability
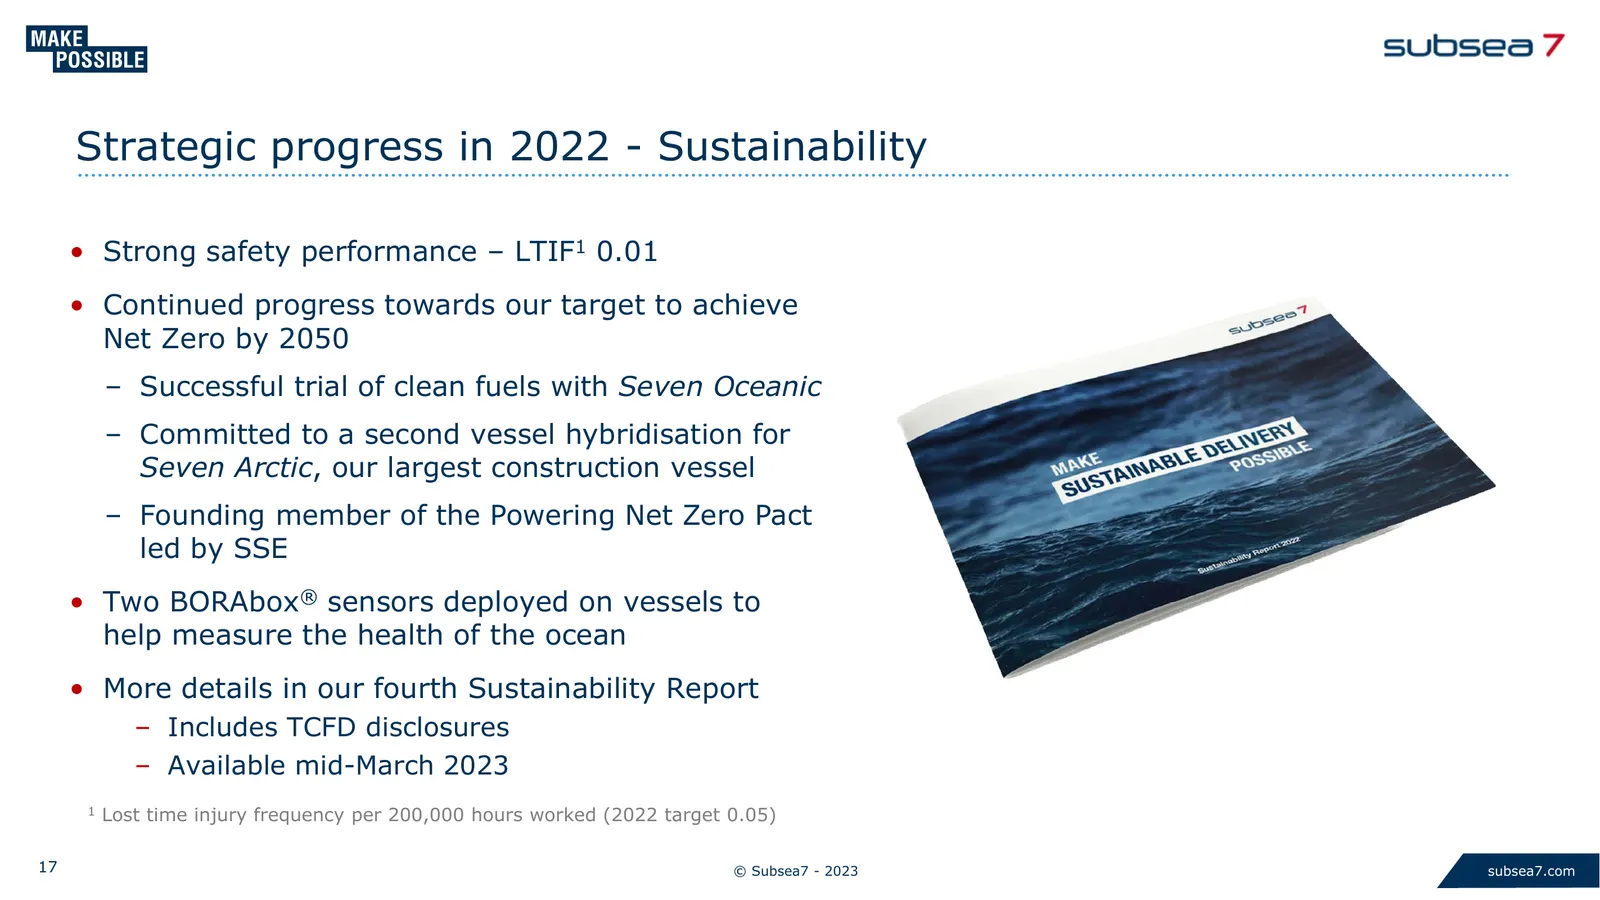
Strategic progress in 2022 - Sustainability • Strong safety performance – LTIF1 0.01 • Continued progress towards our target to achieve Net Zero by 2050 – Successful trial of clean fuels with Seven Oceanic – Committed to a second vessel hybridisation for Seven Arctic, our largest construction vessel
Slide 18: Outlook - subsea prospects
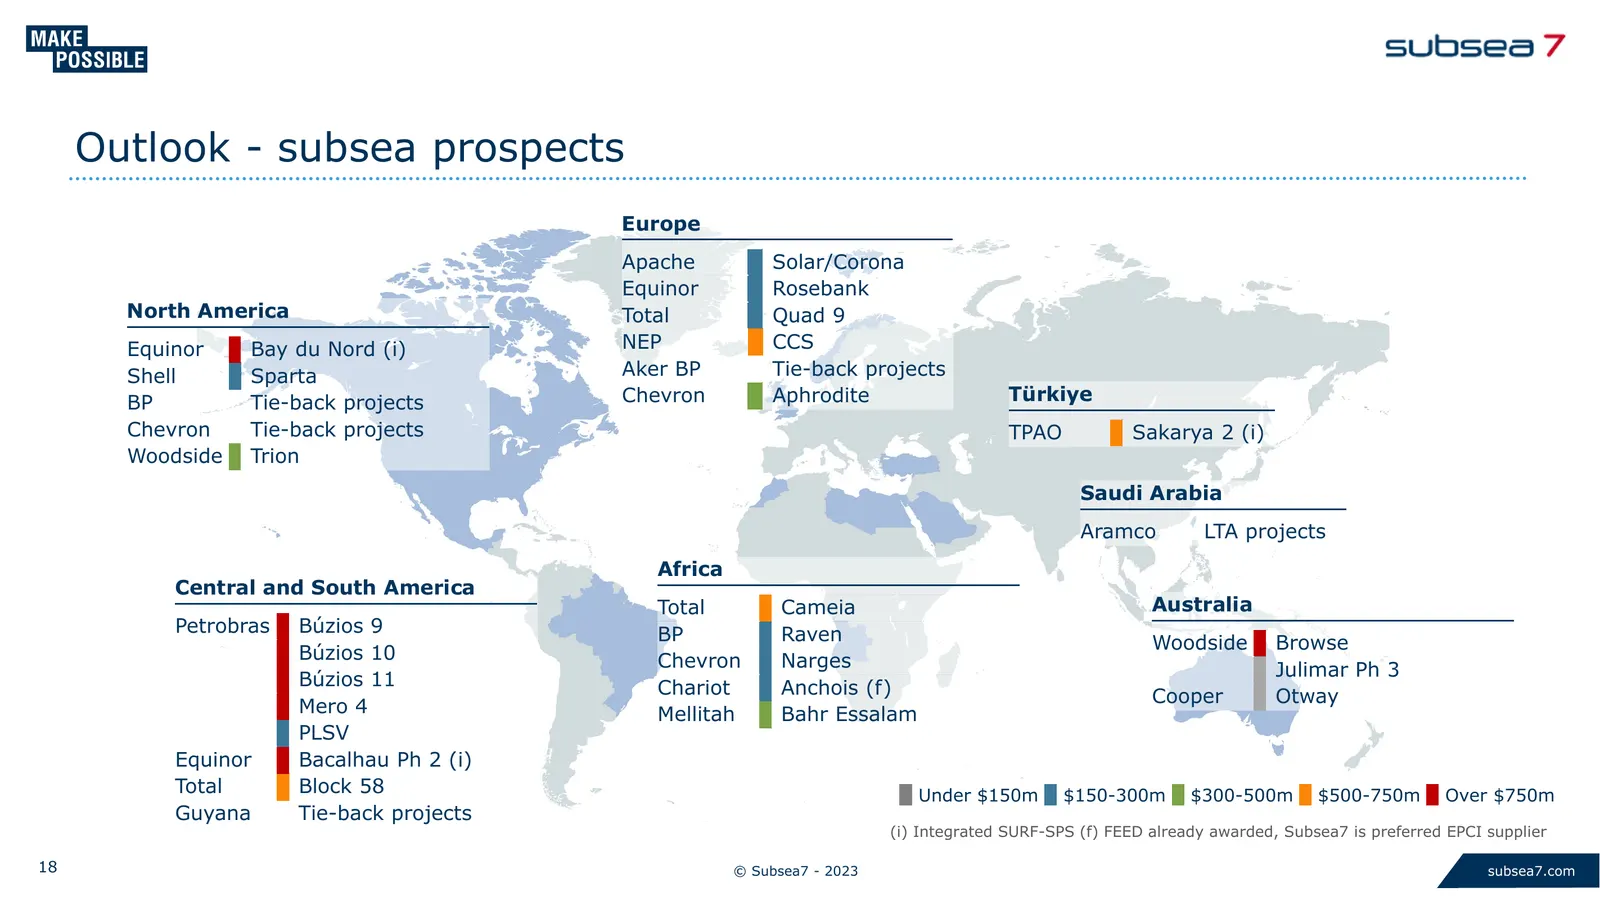
Outlook - subsea prospects Europe Apache Solar/Corona Equinor Rosebank North America Total Quad 9 Equinor Bay du Nord (i) NEP CCS Shell Sparta Aker BP Tie-back projects BP Tie-back projects Chevron Aphrodite Türkiye Chevron Tie-back projects TPAO Sakarya 2 (i) Woodside Trion Saudi Arabia Aramco LTA
Slide 19: Outlook – offshore wind prospects
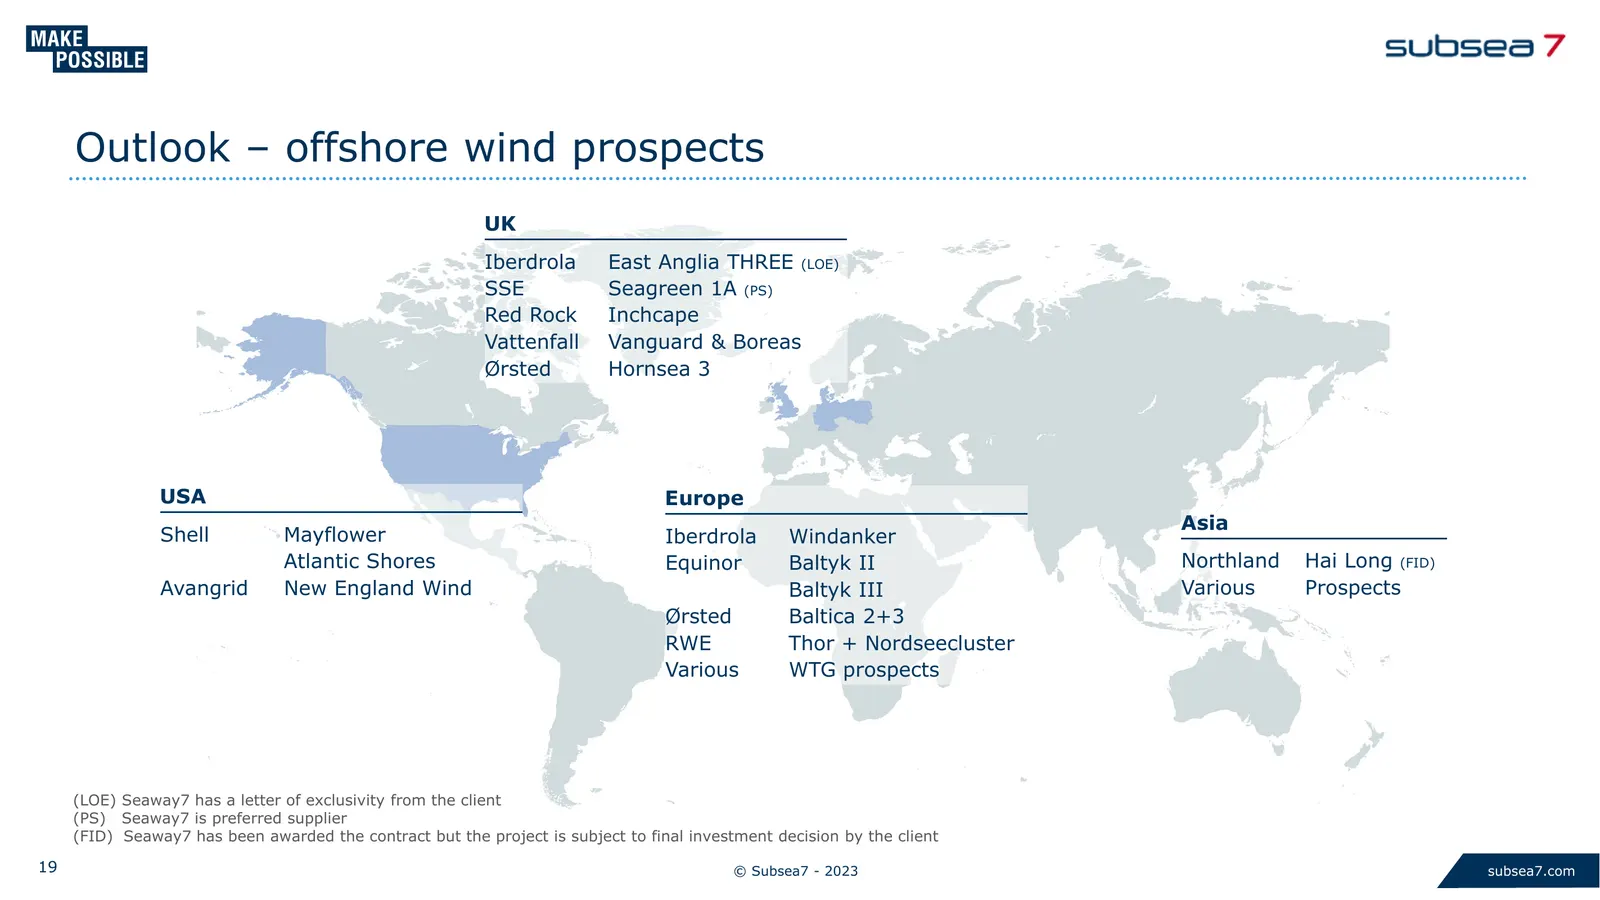
Outlook – offshore wind prospects UK Iberdrola East Anglia THREE (LOE) SSE Seagreen 1A (PS) Red Rock Inchcape Vattenfall Vanguard & Boreas Ørsted Hornsea 3 USA Europe Asia Shell Mayflower Iberdrola Windanker Atlantic Shores Equinor Baltyk II Northland Hai Long (FID) Avangrid New England Wind Baltyk
Slide 20: Stage set for a multi-year upcycle
Stage set for a multi-year upcycle • Subsea strategy delivering – Leveraging strong partnerships – Subsea Integration Alliance relationship will be cemented and extended – AkerBP Subsea Alliance delivering high order intake – Leveraging a market-leading fleet to drive revenue visibility and margin e
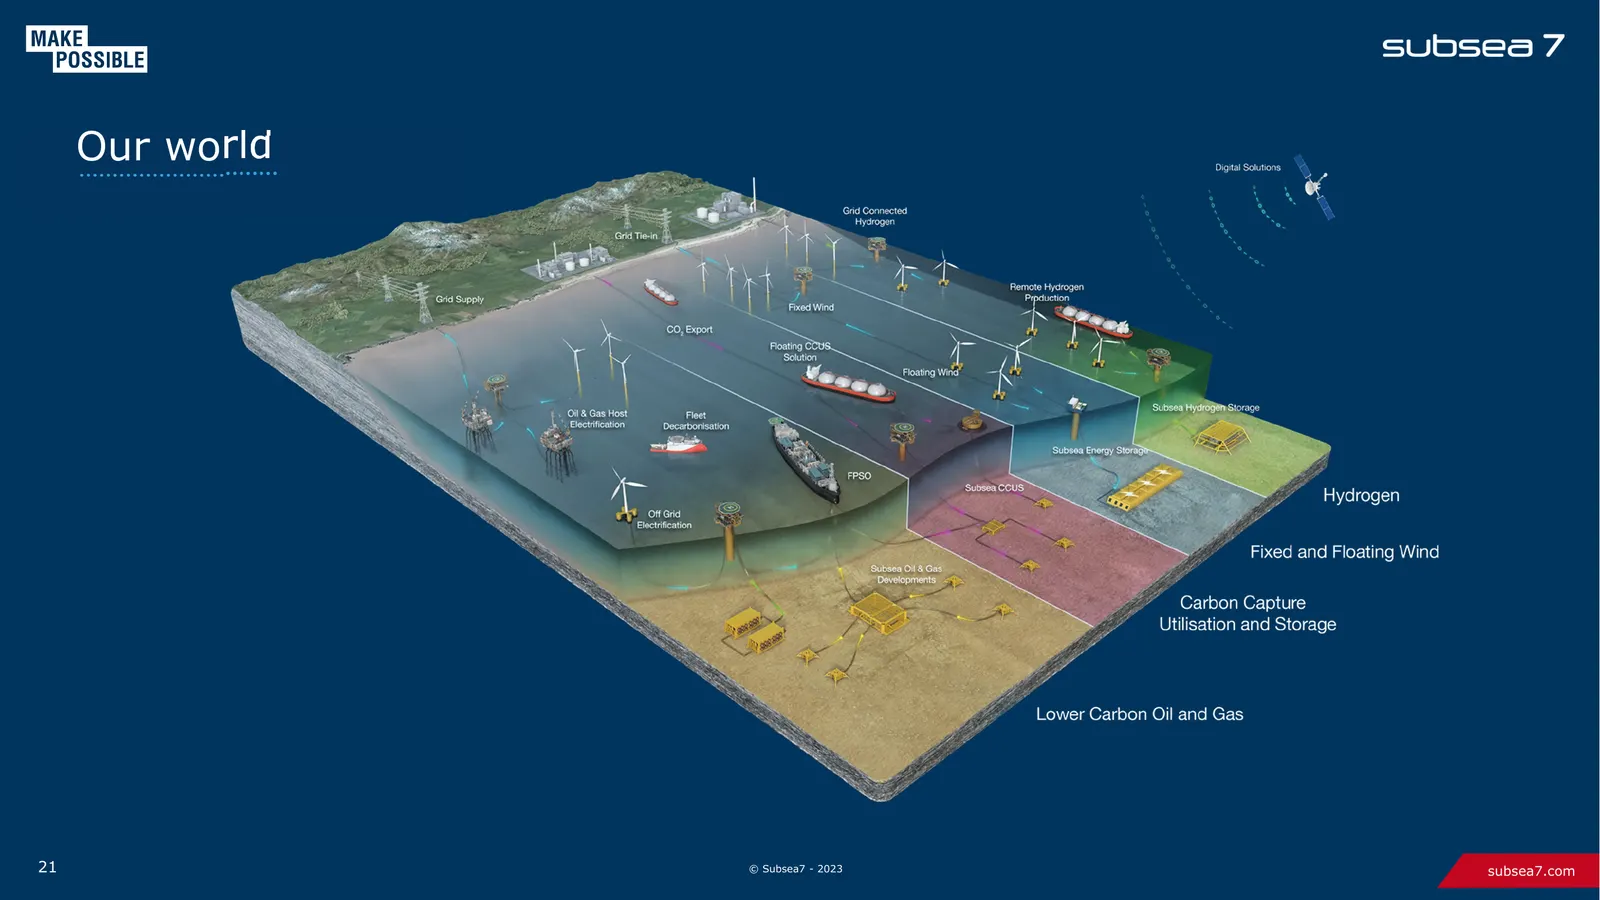
Slide 21: Our world
Our world 21 ©© Subsea7 Subsea7 --2023 2023 subsea7.com
Slide 22: Q&A
Q&A 22 © Subsea7 - 2023 subsea7.com
Slide 23: Appendix
Appendix • Major project progression • Income statement • Supplementary financials • Fleet overview 23 © Subsea7 - 2023 subsea7.com
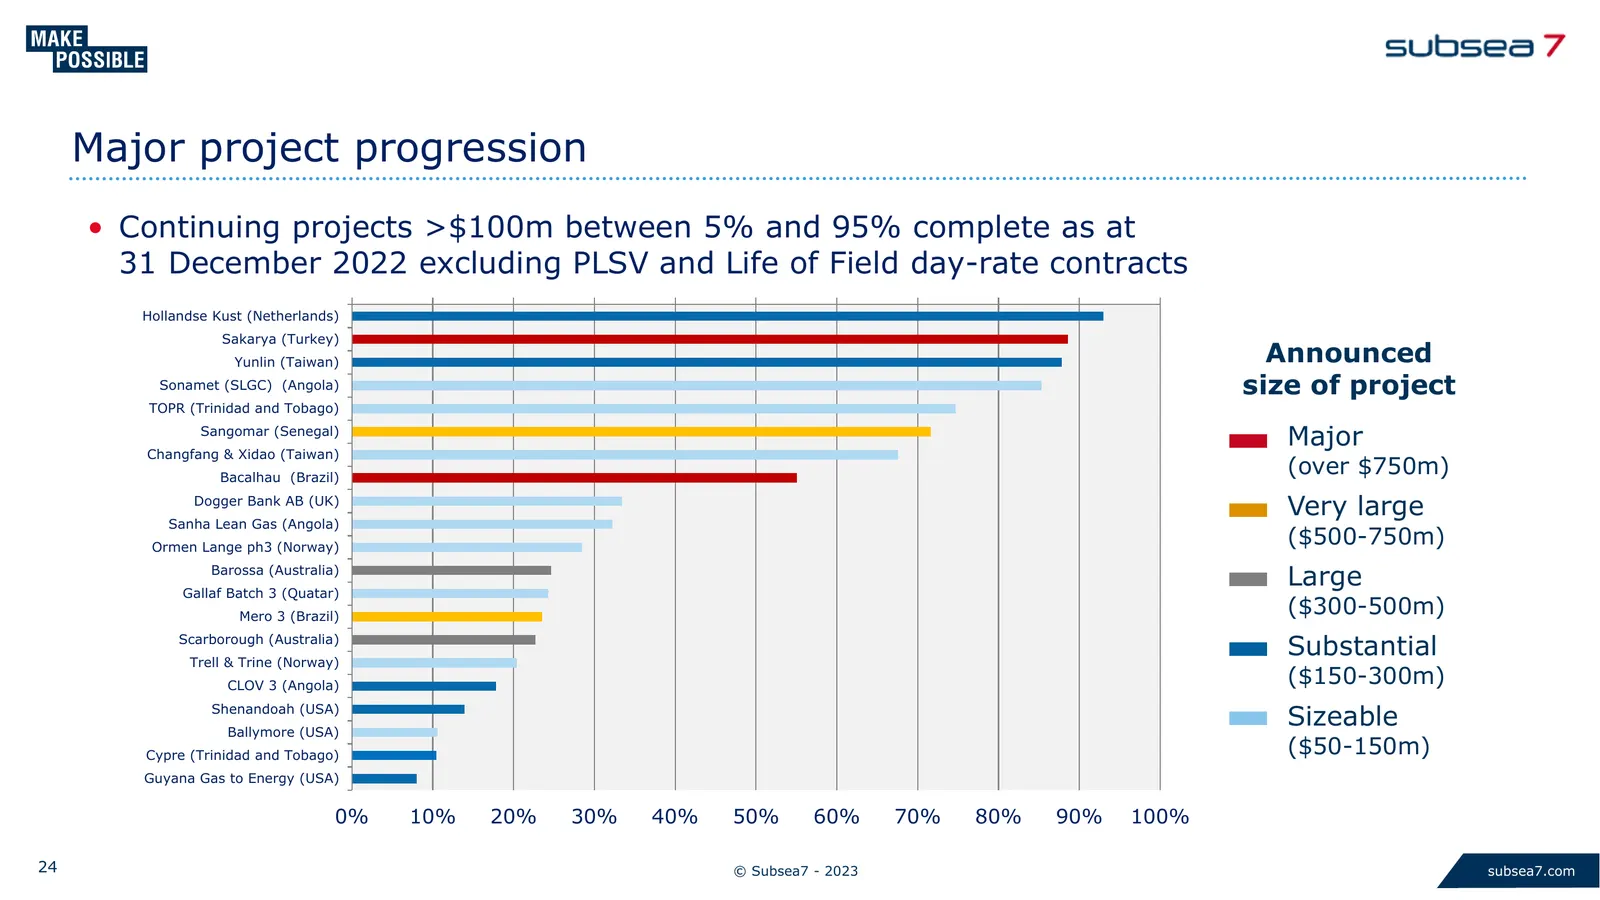
Slide 24: Major project progression
Major project progression • Continuing projects >$100m between 5% and 95% complete as at 31 December 2022 excluding PLSV and Life of Field day-rate contracts Hollandse Kust (Netherlands) Sakarya (Turkey) Yunlin (Taiwan) Announced Sonamet (SLGC) (Angola) size of project TOPR (Trinidad and Tobago) San
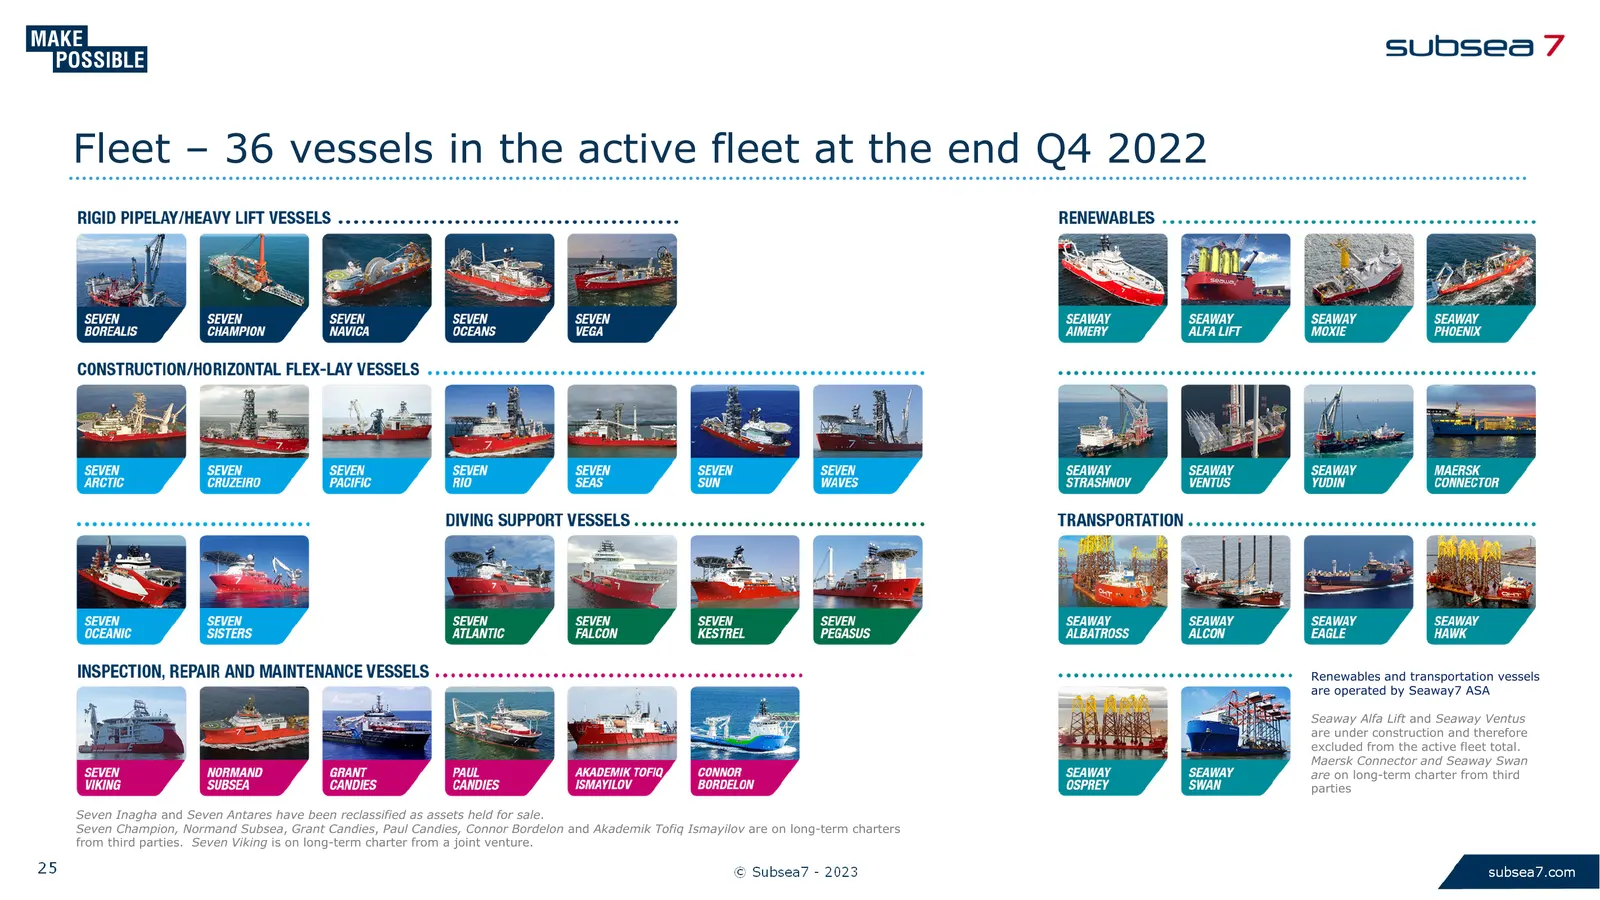
Slide 25: Fleet – vessels in the active fleet at the end Q4 2022
Fleet – 36 vessels in the active fleet at the end Q4 2022 Renewables and transportation vessels are operated by Seaway7 ASA Seaway Alfa Lift and Seaway Ventus are under construction and therefore excluded from the active fleet total. Maersk Connector and Seaway Swan are on long-term charter from thi
Slide 26: © Subsea7 - 2023 subsea7.com
26 © Subsea7 - 2023 subsea7.com
Source: Internet Archive copy of subsea7.com
More decks from Subsea 7 S.A.
 Q2 2026 Earnings Presentation17 slides · Jul 30, 2026
 Q1 2026 Earnings Presentation20 slides · Apr 30, 2026
 Q4 2025 Earnings Presentation17 slides · Feb 26, 2026
 Q3 2025 Earnings Presentation18 slides · Nov 20, 2025
 Q2 2025 Earnings Presentation18 slides · Jul 31, 2025
 Merger or Acquisition (July 2025)21 slides · Jul 24, 2025