Aebi Schmidt Holding AG · NASDAQ:AEBI
Aebi Schmidt — Q3 2026 Earnings Presentation
37 slides from Aebi Schmidt's earnings presentation, Nov 11, 2026

Slide 1: Q3 2026 Earnings Call
Q3 2026 Earnings Call November 11, 2026 public
Slide 2: Today’s presenters and agenda
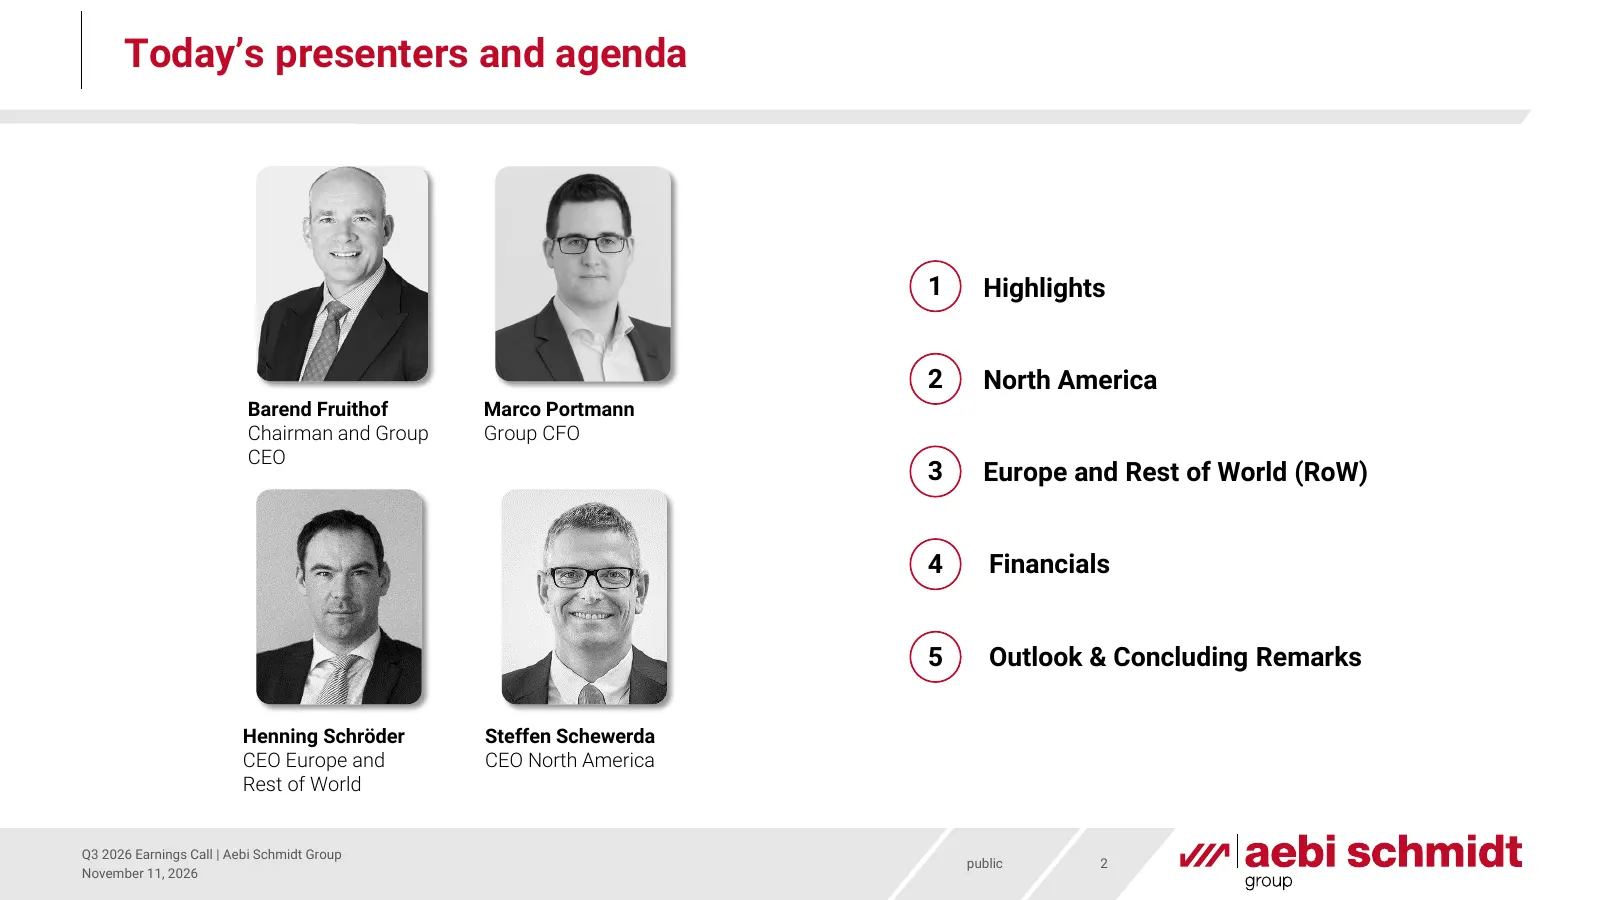
Today’s presenters and agenda 1 Highlights 2 North America Barend Fruithof Marco Portmann Chairman and Group Group CFO CEO 3 Europe and Rest of World (RoW) 4 Financials 5 Outlook & Concluding Remarks Henning Schröder Steffen Schewerda CEO Europe and CEO North America Rest of World Q3 2026 Earnings C
Slide 3: Safe Harbor: Basis of presented financials and forward-looking statements
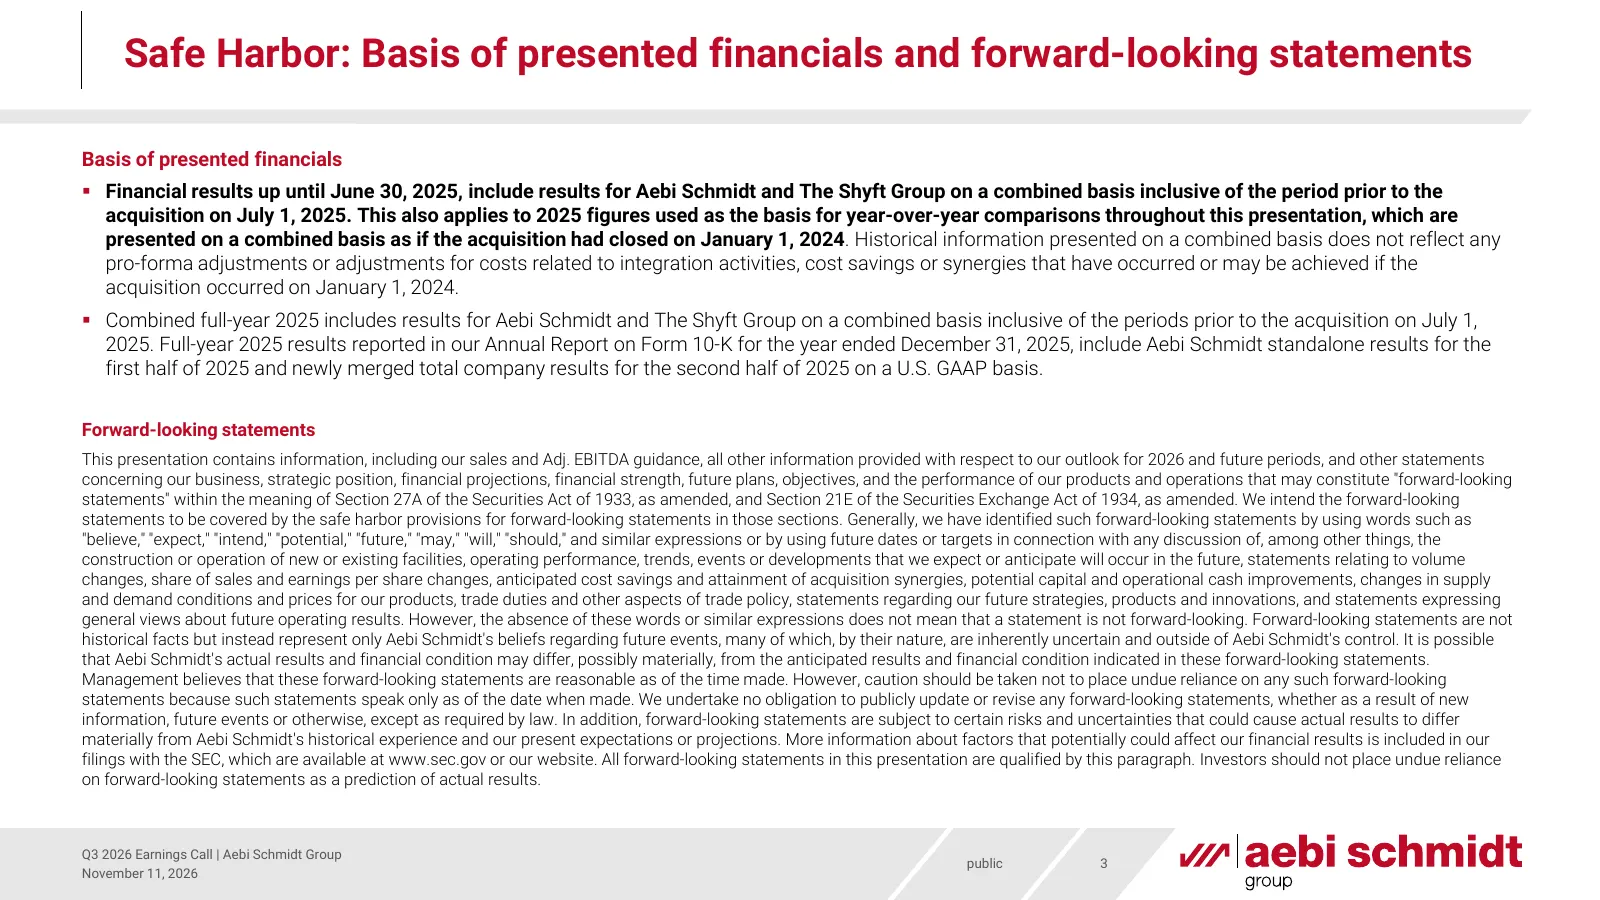
Safe Harbor: Basis of presented financials and forward-looking statements Basis of presented financials Financial results up until June 30, 2025, include results for Aebi Schmidt and The Shyft Group on a combined basis inclusive of the period prior to the acquisition on July 1, 2025. This also app
Slide 4: Highlights
Highlights Barend Fruithof, Chairman and Group CEO public
Slide 5: Continued growth and improved profitability in a challenging market
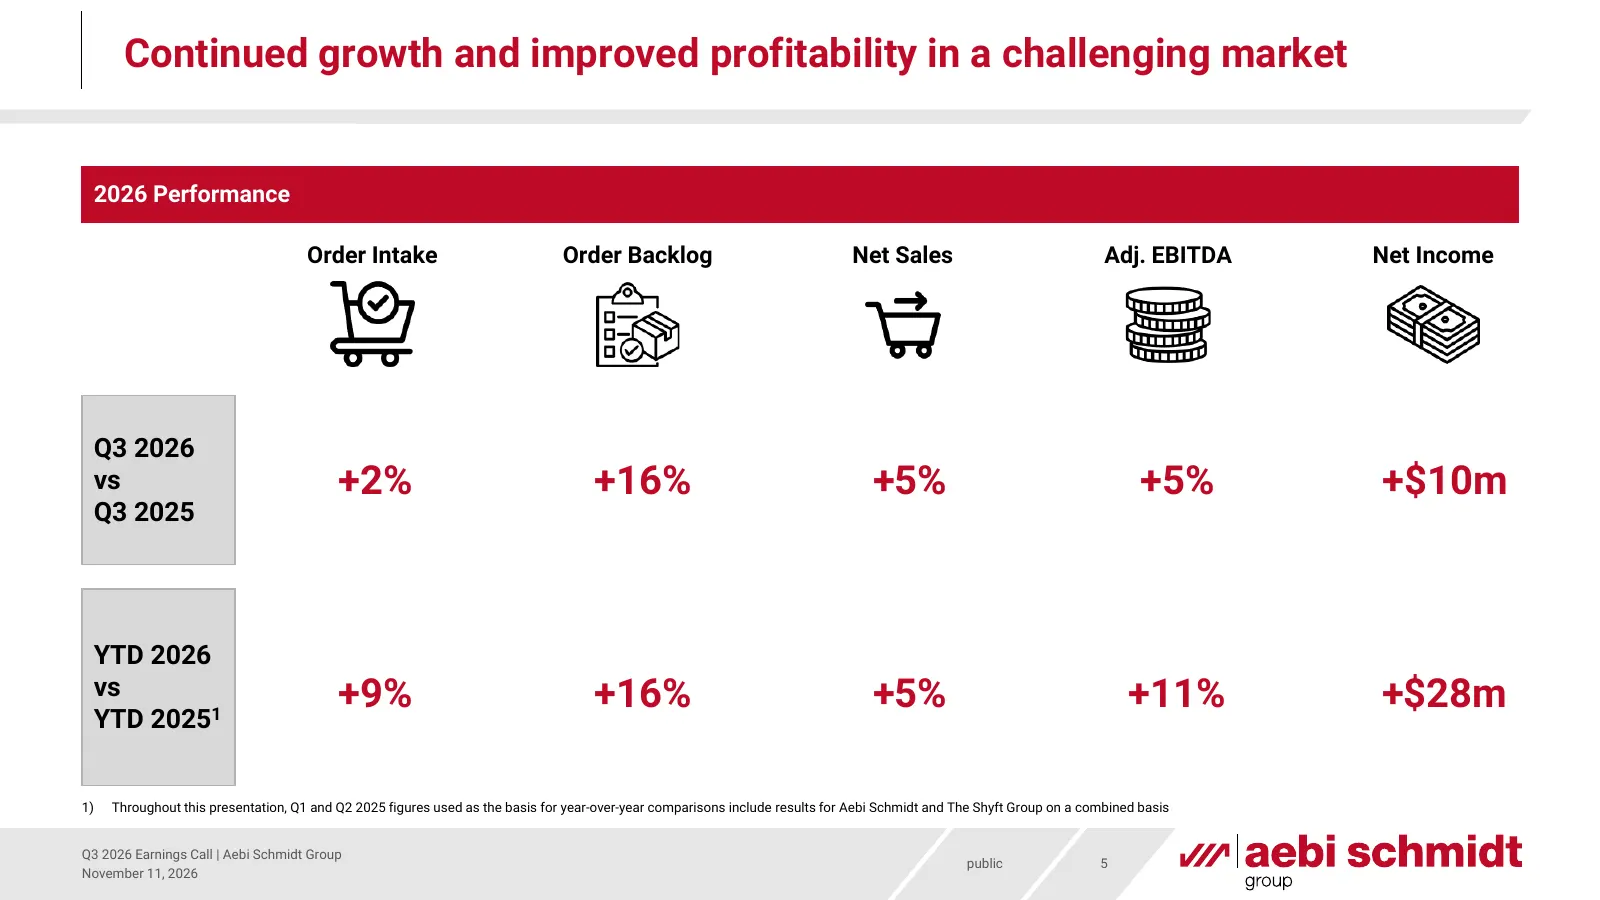
Continued growth and improved profitability in a challenging market 2026 Performance Order Intake Order Backlog Net Sales Adj. EBITDA Net Income Q3 2026 vs +2% +16% +5% +5% +$10m Q3 2025 YTD 2026 vs +9% +16% +5% +11% +$28m YTD 20251 1) Throughout this presentation, Q1 and Q2 2025 figures used as the
Slide 6: Market wins driving quarterly performance with 5% organic Net Sales growth
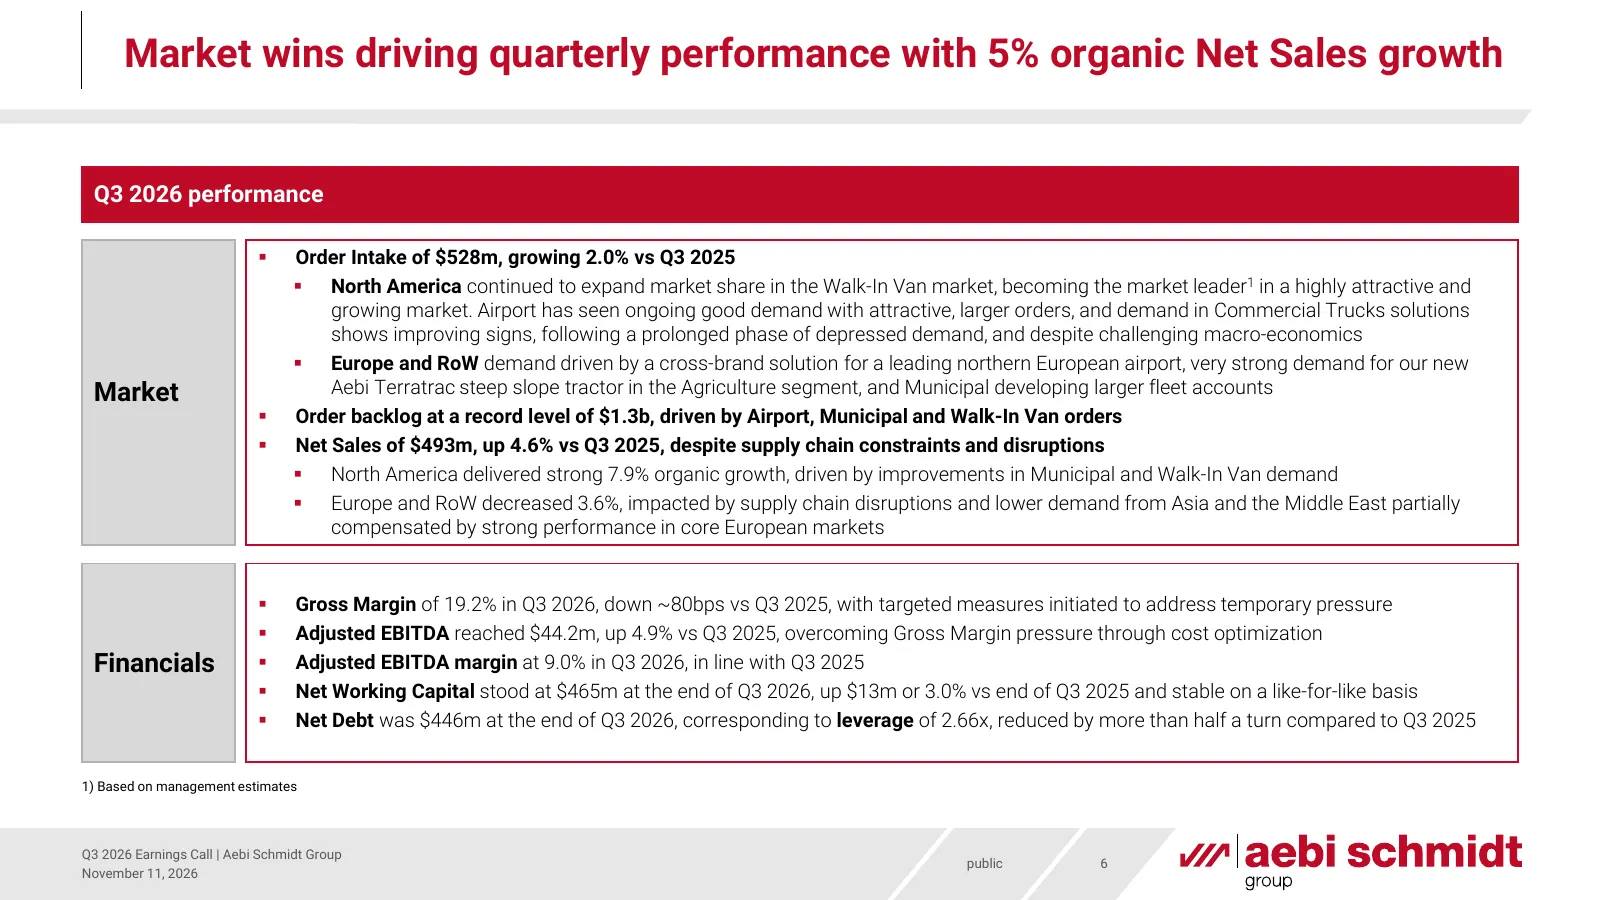
Market wins driving quarterly performance with 5% organic Net Sales growth Q3 2026 performance Order Intake of $528m, growing 2.0% vs Q3 2025 North America continued to expand market share in the Walk-In Van market, becoming the market leader1 in a highly attractive and growing market. Airport h
Slide 7: A remarkable pace of transformation since the Shyft acquisition
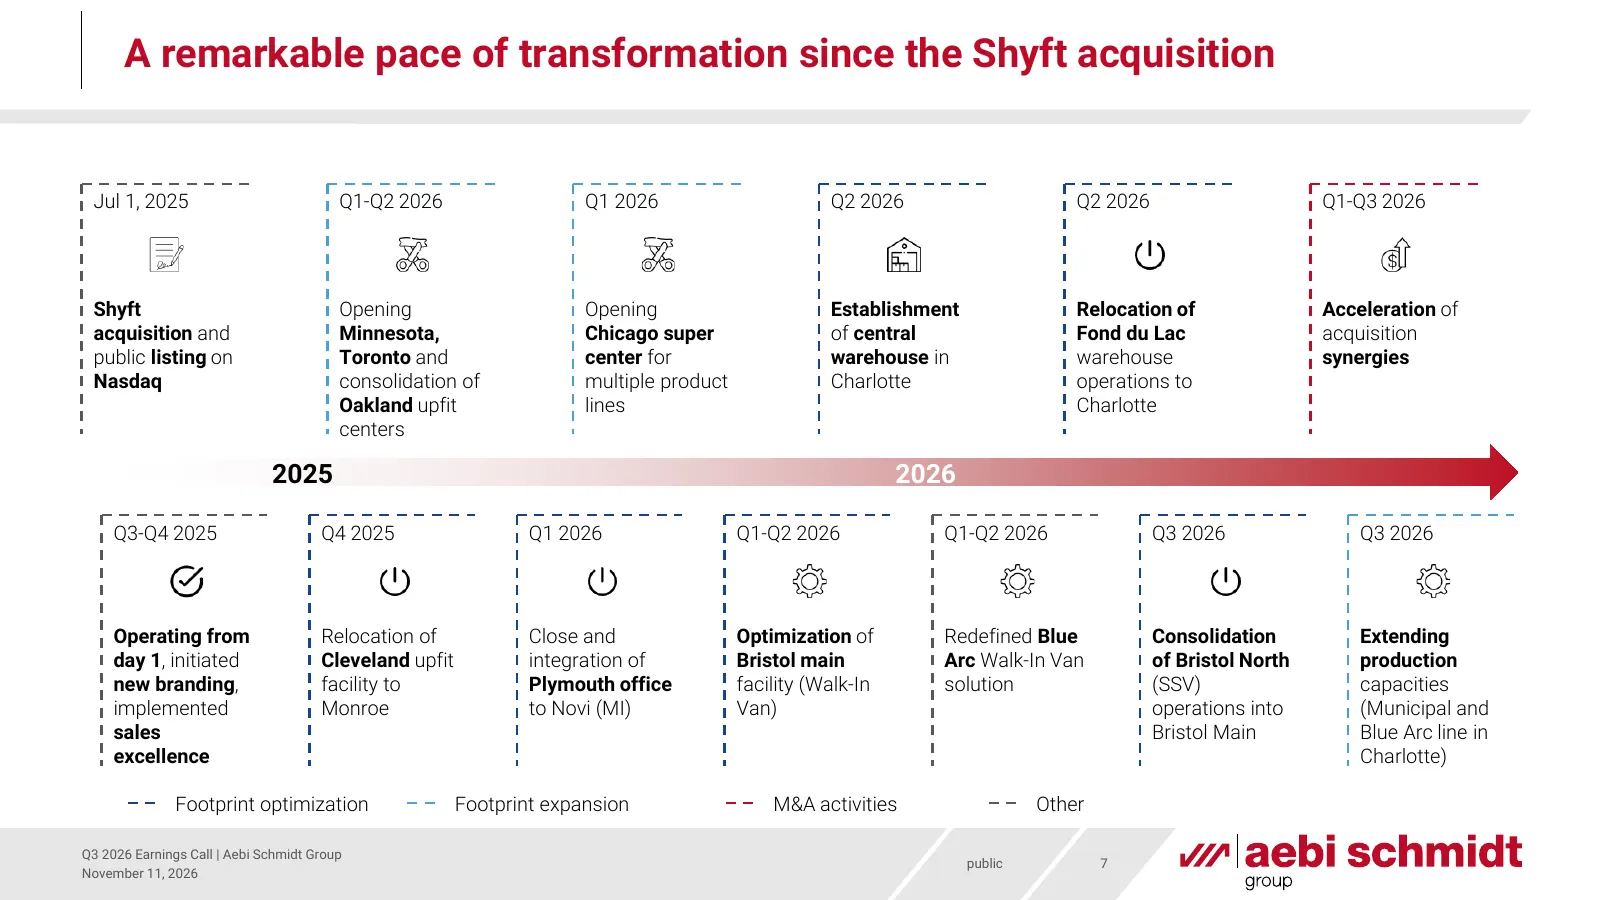
A remarkable pace of transformation since the Shyft acquisition Jul 1, 2025 Q1-Q2 2026 Q1 2026 Q2 2026 Q2 2026 Q1-Q3 2026 Shyft Opening Opening Establishment Relocation of Acceleration of acquisition and Minnesota, Chicago super of central Fond du Lac acquisition public listing on Toronto and center
Slide 8: Building the foundation for sustained growth in the coming years
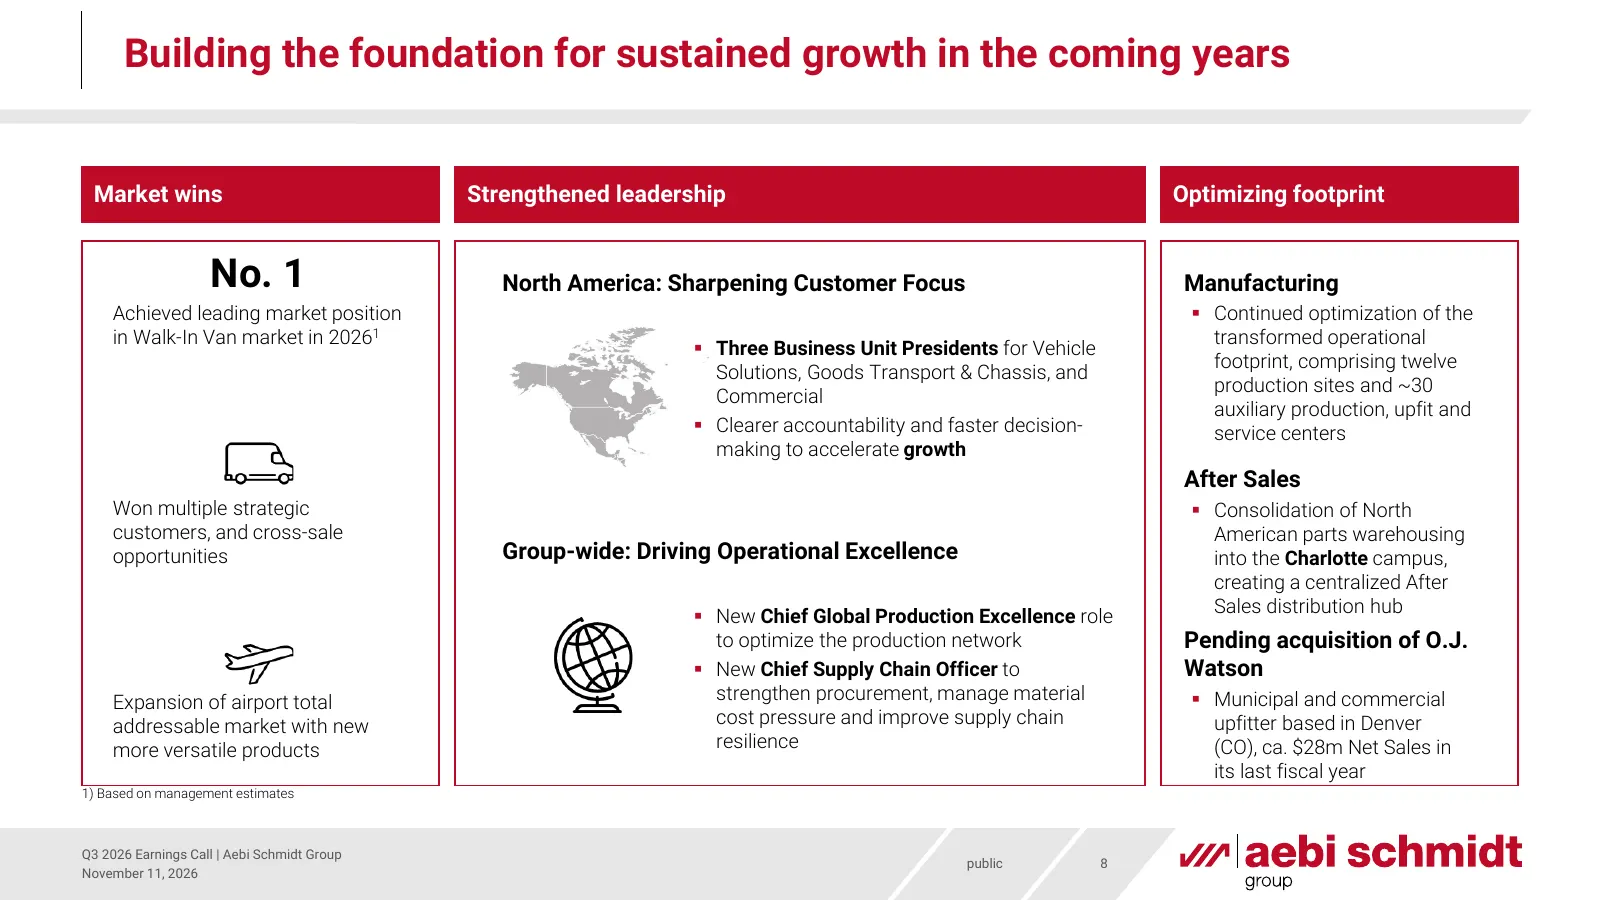
Building the foundation for sustained growth in the coming years Market wins Strengthened leadership Optimizing footprint No. 1 North America: Sharpening Customer Focus Manufacturing Achieved leading market position Continued optimization of the in Walk-In Van market in 20261 transformed operation
Slide 9: North America
North America Steffen Schewerda, CEO North America public
Slide 10: Sales execution reinforcing North American momentum
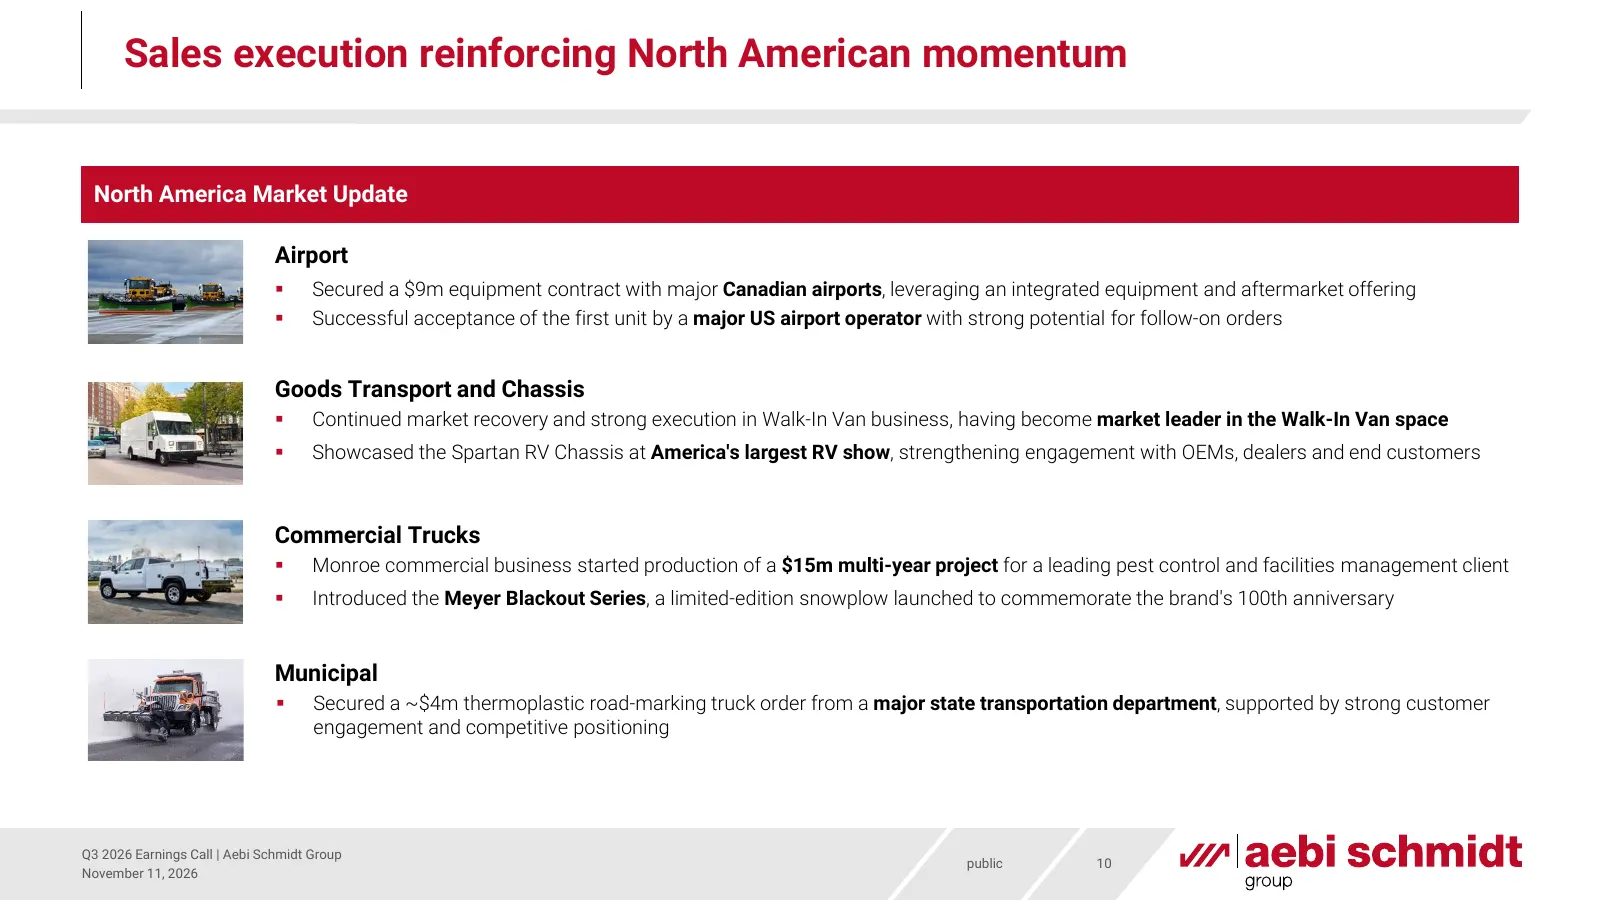
Sales execution reinforcing North American momentum North America Market Update Airport Secured a $9m equipment contract with major Canadian airports, leveraging an integrated equipment and aftermarket offering Successful acceptance of the first unit by a major US airport operator with strong po
Slide 11: Showcase: Aebi Schmidt’s turnaround of the Walk-In Van business
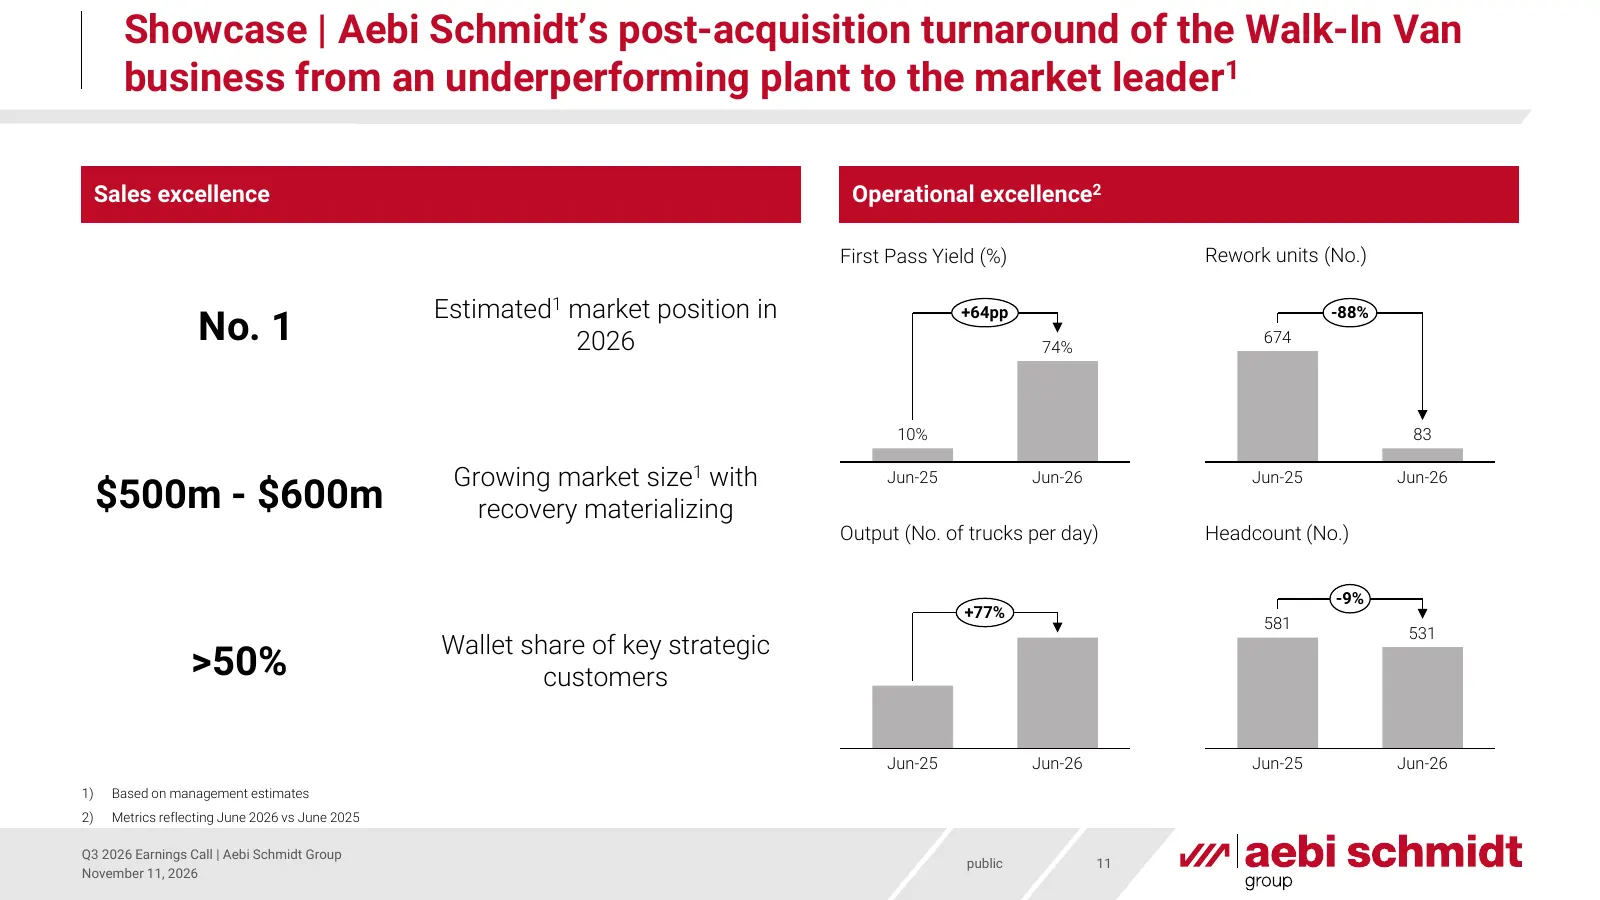
Showcase | Aebi Schmidt’s post-acquisition turnaround of the Walk-In Van business from an underperforming plant to the market leader1 Sales excellence Operational excellence2 First Pass Yield (%) Rework units (No.) Estimated1 market position in No. 1 +64pp -88% 2026 74% 674 10% 83 Growing market siz
Slide 12: Strong Q3 performance with 8% organic growth in Net Sales and adj. EBITDA
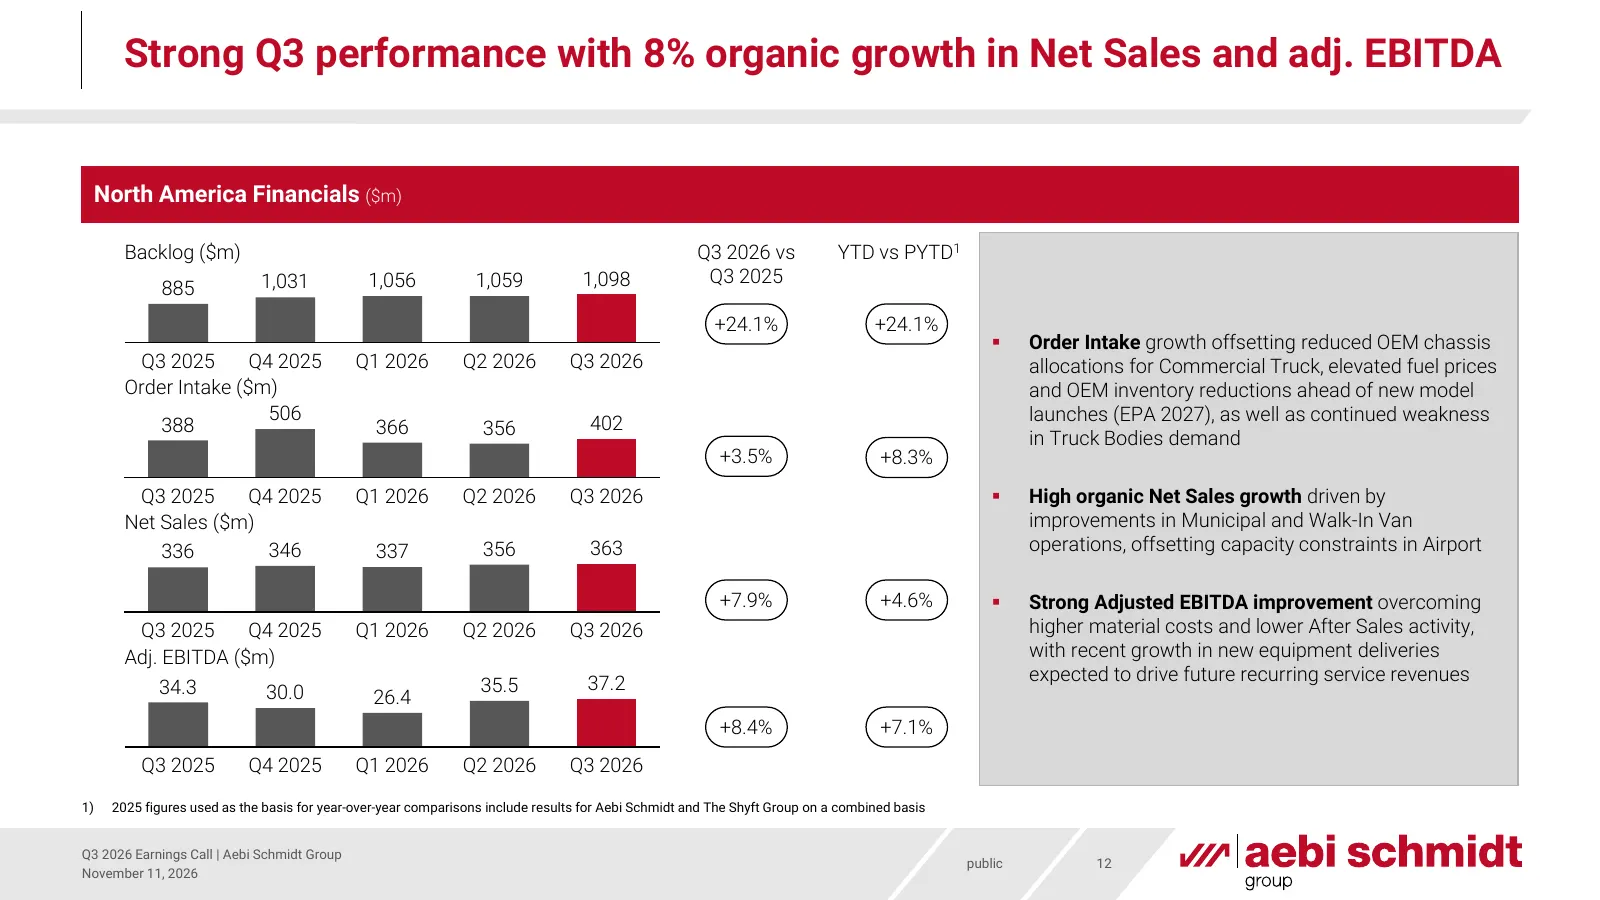
Strong Q3 performance with 8% organic growth in Net Sales and adj. EBITDA North America Financials ($m) Backlog ($m) Q3 2026 vs YTD vs PYTD1 1,031 1,056 1,059 1,098 Q3 2025 885 +24.1% +24.1% Order Intake growth offsetting reduced OEM chassis Q3 2025 Q4 2025 Q1 2026 Q2 2026 Q3 2026 allocations for
Slide 13: Europe and Rest of the World (RoW)
Europe and Rest of the World (RoW) Henning Schröder, CEO Europe and Rest of World public
Slide 14: Europe and RoW Q3 with deal wins across all business lines
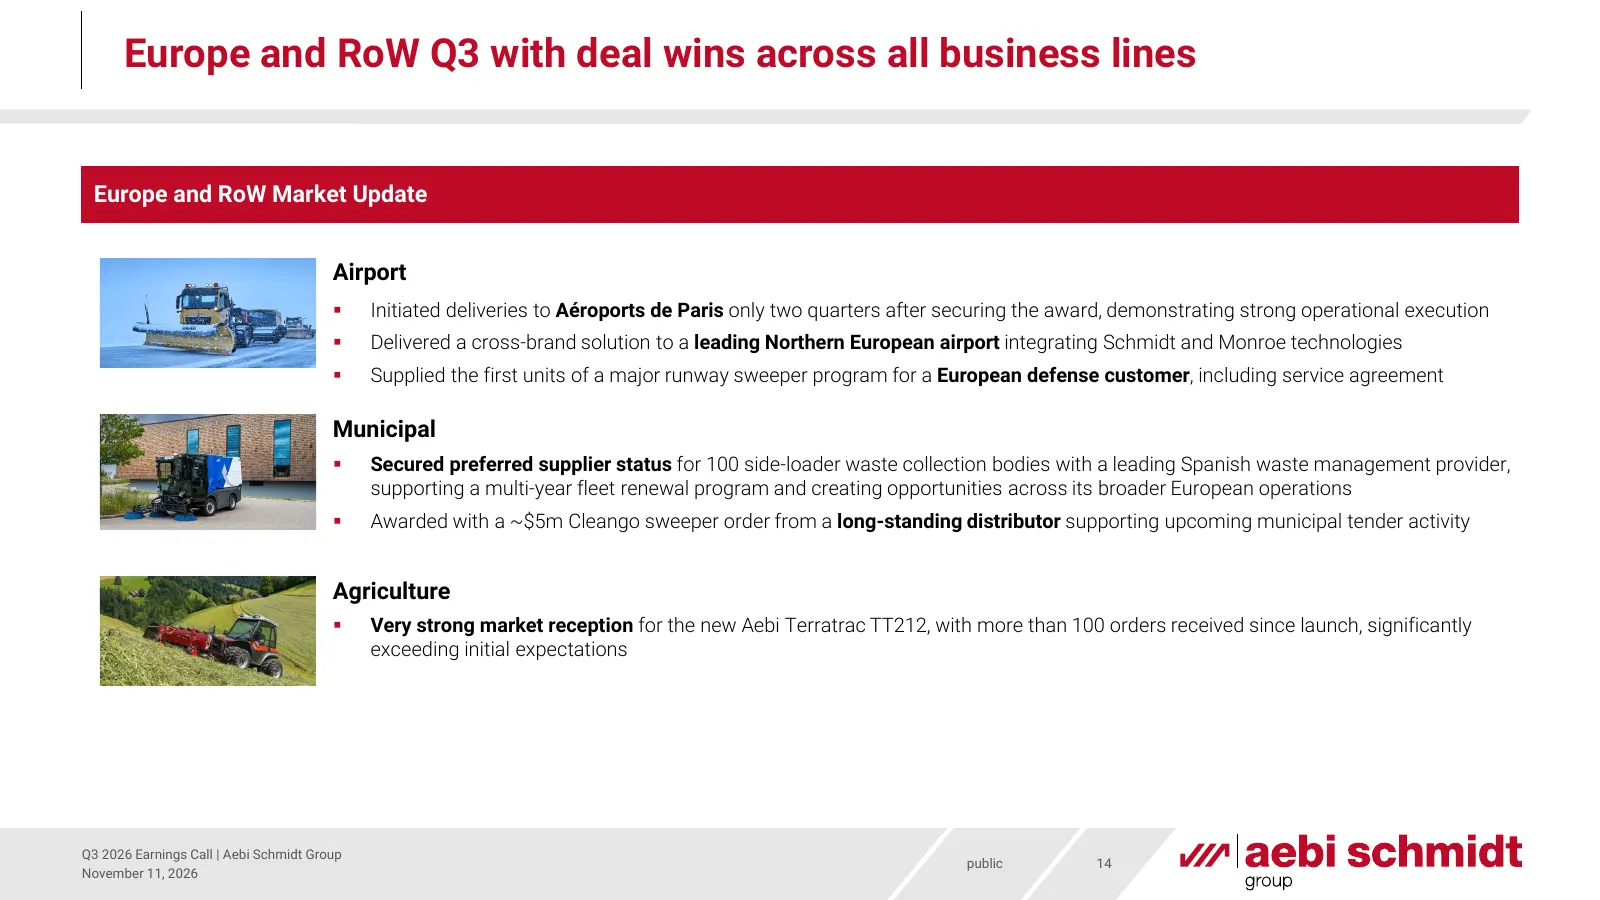
Europe and RoW Q3 with deal wins across all business lines Europe and RoW Market Update Airport Initiated deliveries to Aéroports de Paris only two quarters after securing the award, demonstrating strong operational execution Delivered a cross-brand solution to a leading Northern European airpor
Slide 15: Outstanding growth in Europe, against an almost flat underlying market
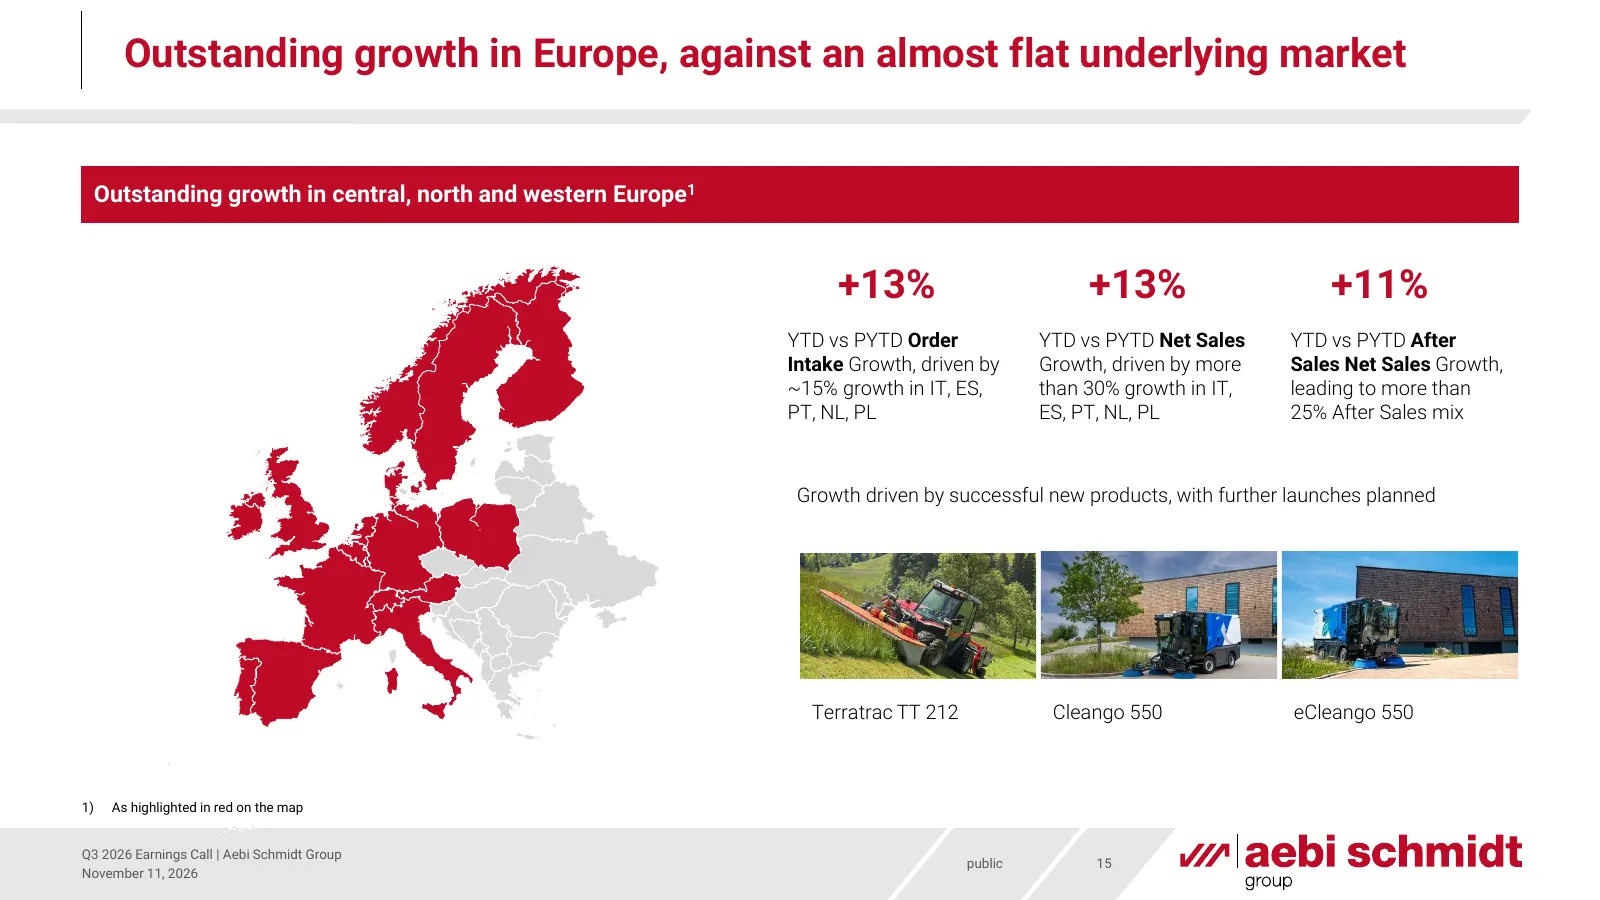
Outstanding growth in Europe, against an almost flat underlying market Outstanding growth in central, north and western Europe1 +13% +13% +11% YTD vs PYTD Order YTD vs PYTD Net Sales YTD vs PYTD After Intake Growth, driven by Growth, driven by more Sales Net Sales Growth, ~15% growth in IT, ES, than
Slide 16: Segment performance impacted by supply chain disruptions and headwinds from China and Middle East
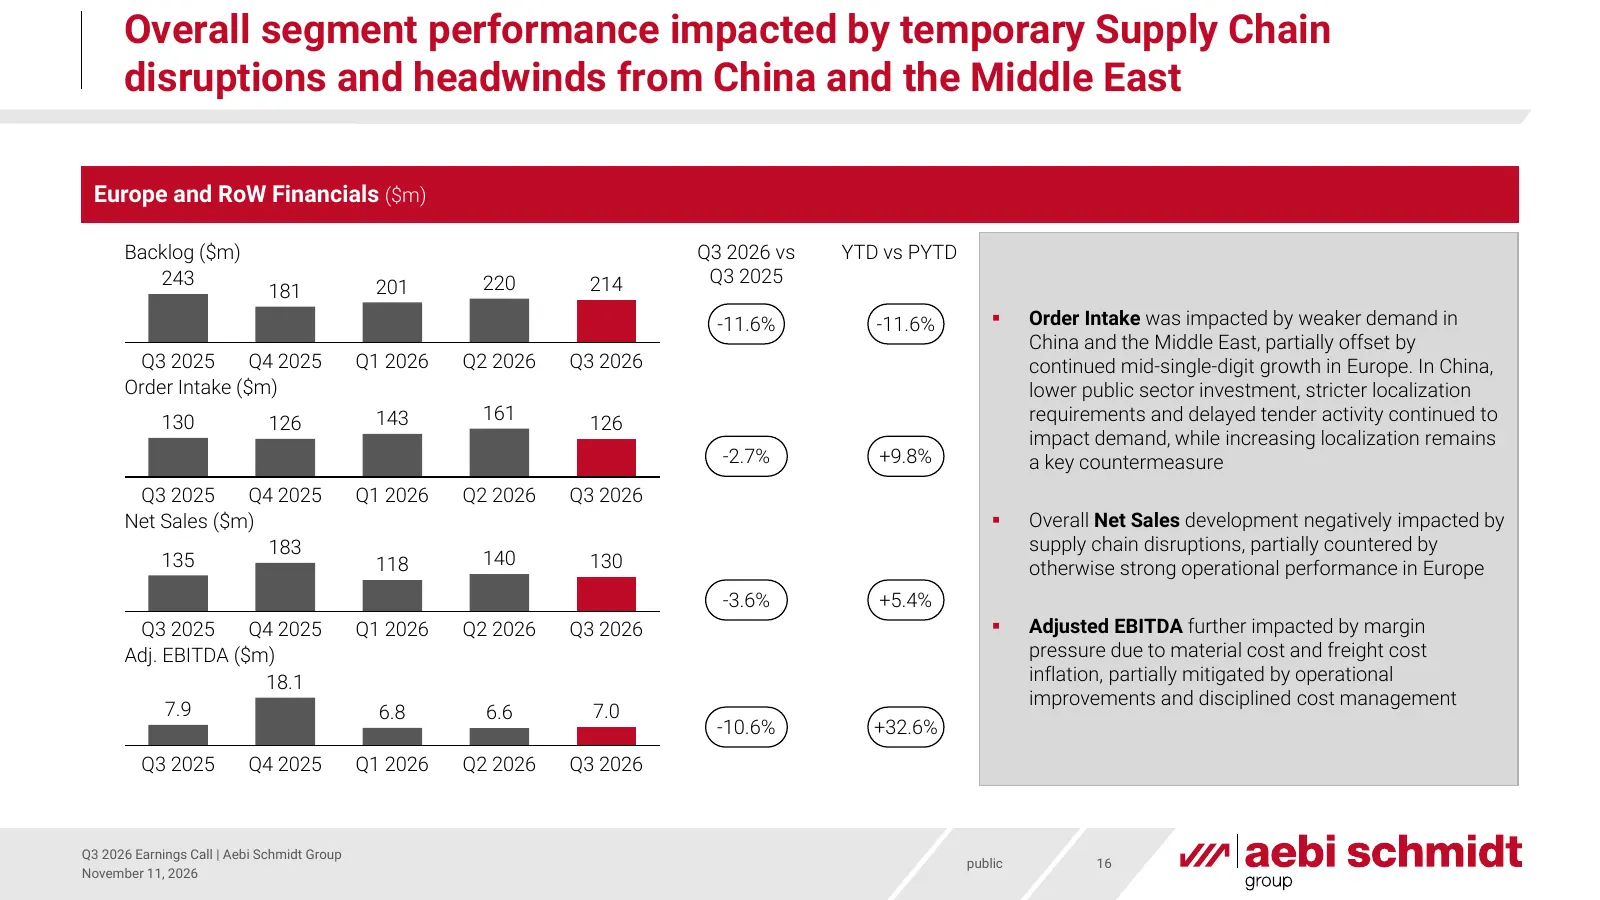
Overall segment performance impacted by temporary Supply Chain disruptions and headwinds from China and the Middle East Europe and RoW Financials ($m) Backlog ($m) Q3 2026 vs YTD vs PYTD 243 220 214 Q3 2025 181 201 -11.6% -11.6% Order Intake was impacted by weaker demand in China and the Middle Ea
Slide 17: Financials
Financials Marco Portmann, Group CFO public
Slide 18: Order momentum driven by Municipal, Airport and Walk-In Van recovery
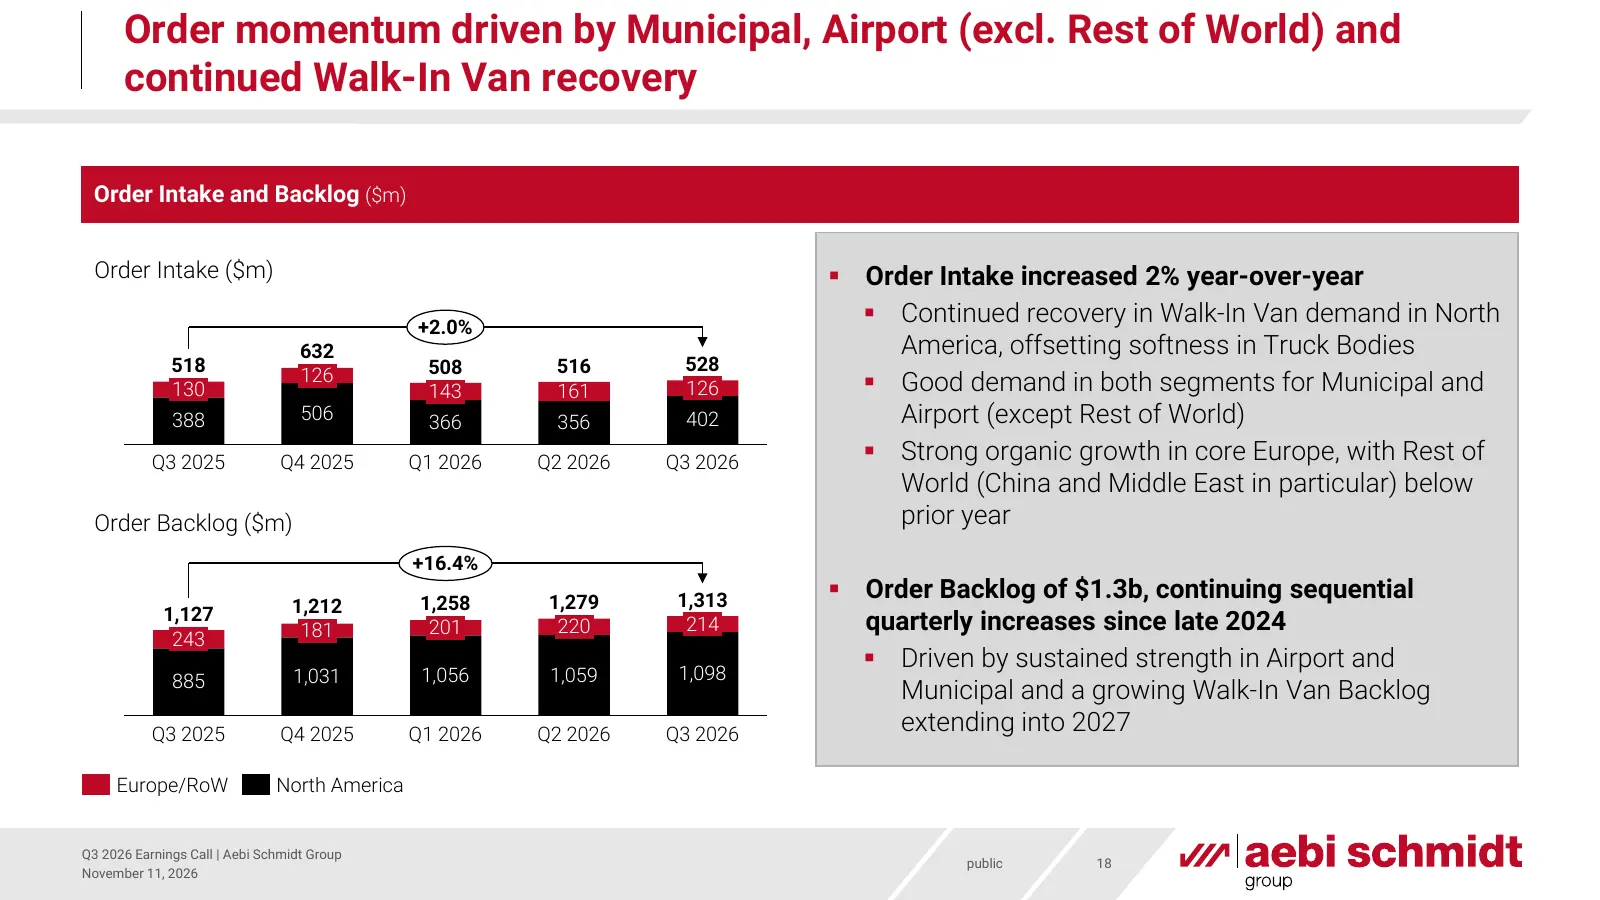
Order momentum driven by Municipal, Airport (excl. Rest of World) and continued Walk-In Van recovery Order Intake and Backlog ($m) Order Intake ($m) Order Intake increased 2% year-over-year +2.0% Continued recovery in Walk-In Van demand in North 632 America, offsetting softness in Truck Bodies 5
Slide 19: Solid Net Sales growth despite supply chain challenges
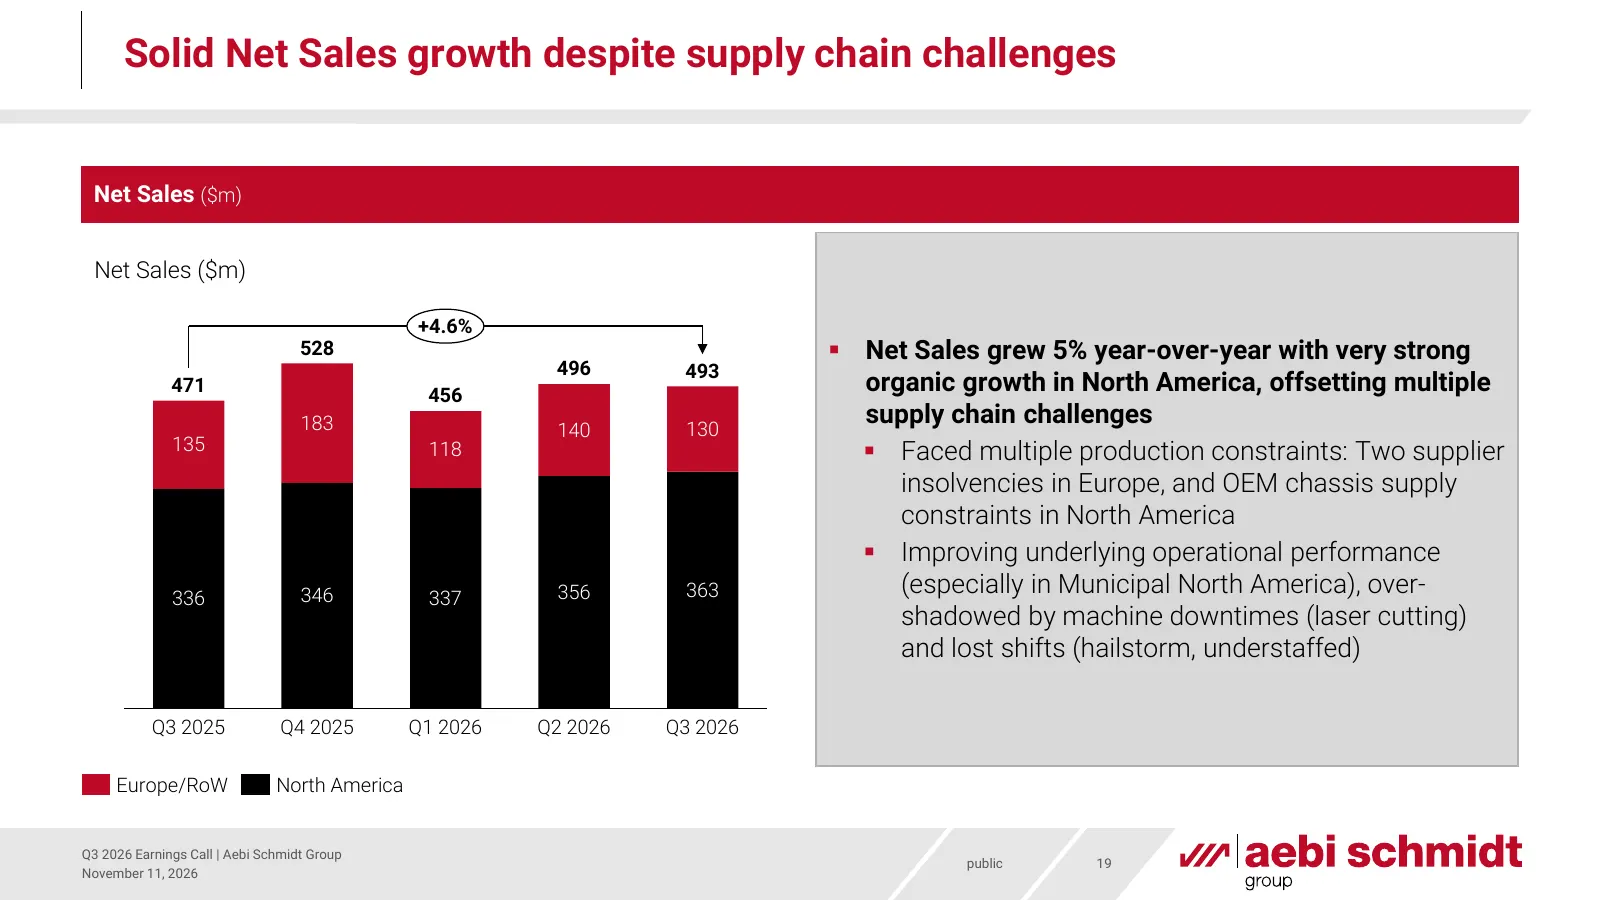
Solid Net Sales growth despite supply chain challenges Net Sales ($m) Net Sales ($m) +4.6% 528 Net Sales grew 5% year-over-year with very strong 496 493 471 456 organic growth in North America, offsetting multiple 183 130 supply chain challenges 140 135 118 Faced multiple production constraints:
Slide 20: Gross Margin recovery plan defined, benefits materializing through 2027
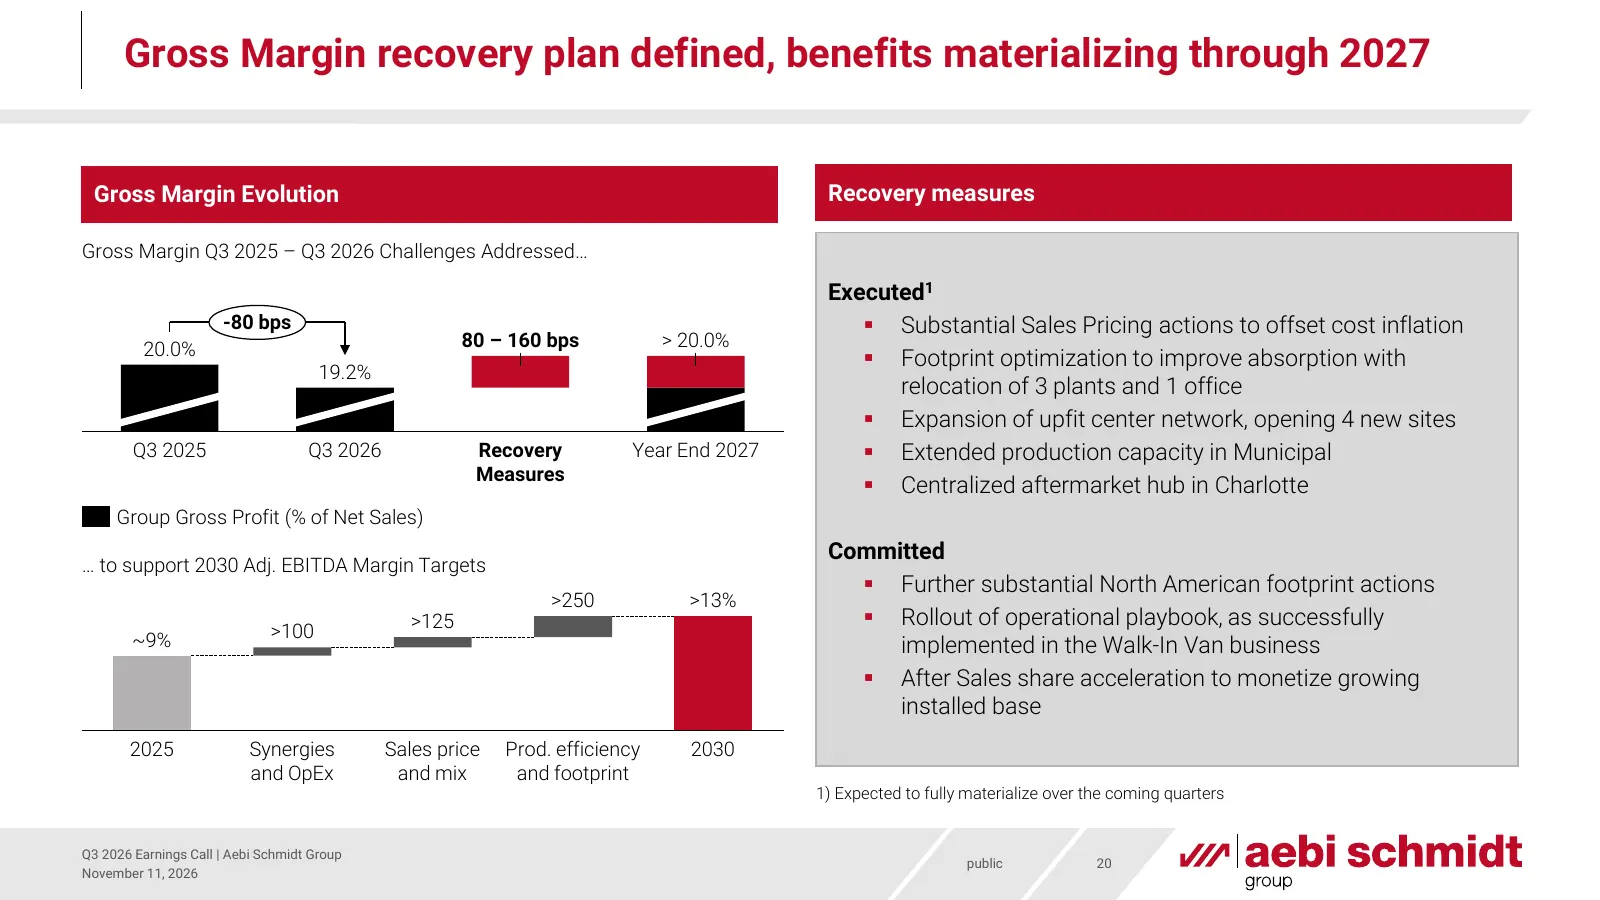
Gross Margin recovery plan defined, benefits materializing through 2027 Gross Margin Evolution Recovery measures Gross Margin Q3 2025 – Q3 2026 Challenges Addressed… Executed1 -80 bps Substantial Sales Pricing actions to offset cost inflation 20.0% 80 – 160 bps > 20.0% Footprint optimization to
Slide 21: Solid Adjusted EBITDA growth in line with Net Sales development
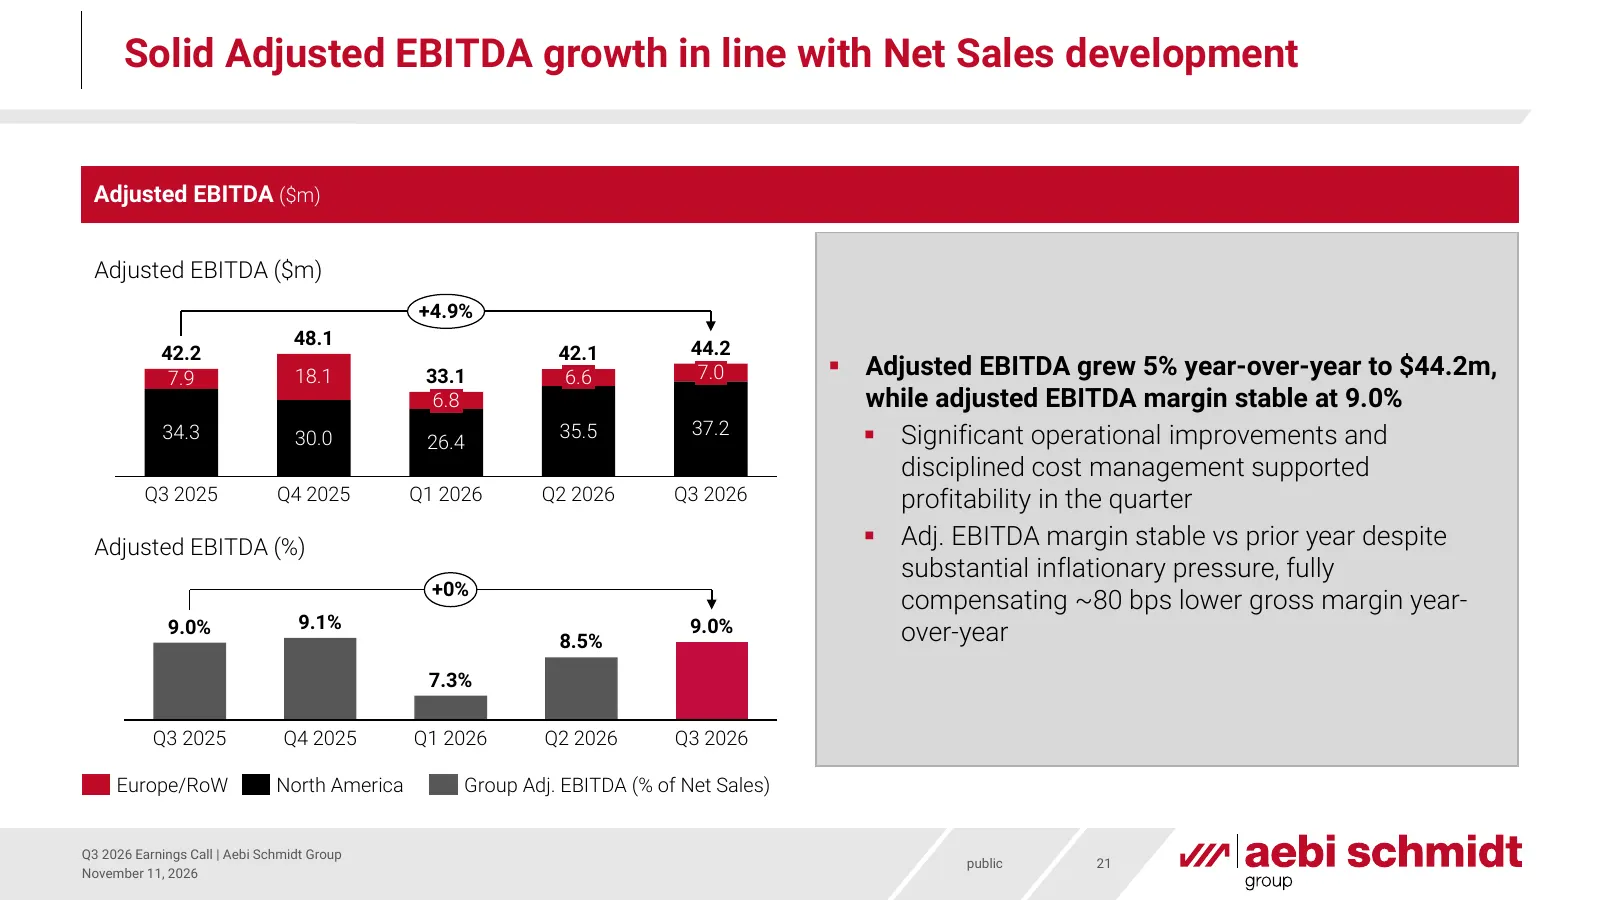
Solid Adjusted EBITDA growth in line with Net Sales development Adjusted EBITDA ($m) Adjusted EBITDA ($m) +4.9% 48.1 44.2 42.2 42.1 7.9 18.1 33.1 6.6 7.0 Adjusted EBITDA grew 5% year-over-year to $44.2m, 6.8 while adjusted EBITDA margin stable at 9.0% 34.3 30.0 35.5 37.2 Significant operational
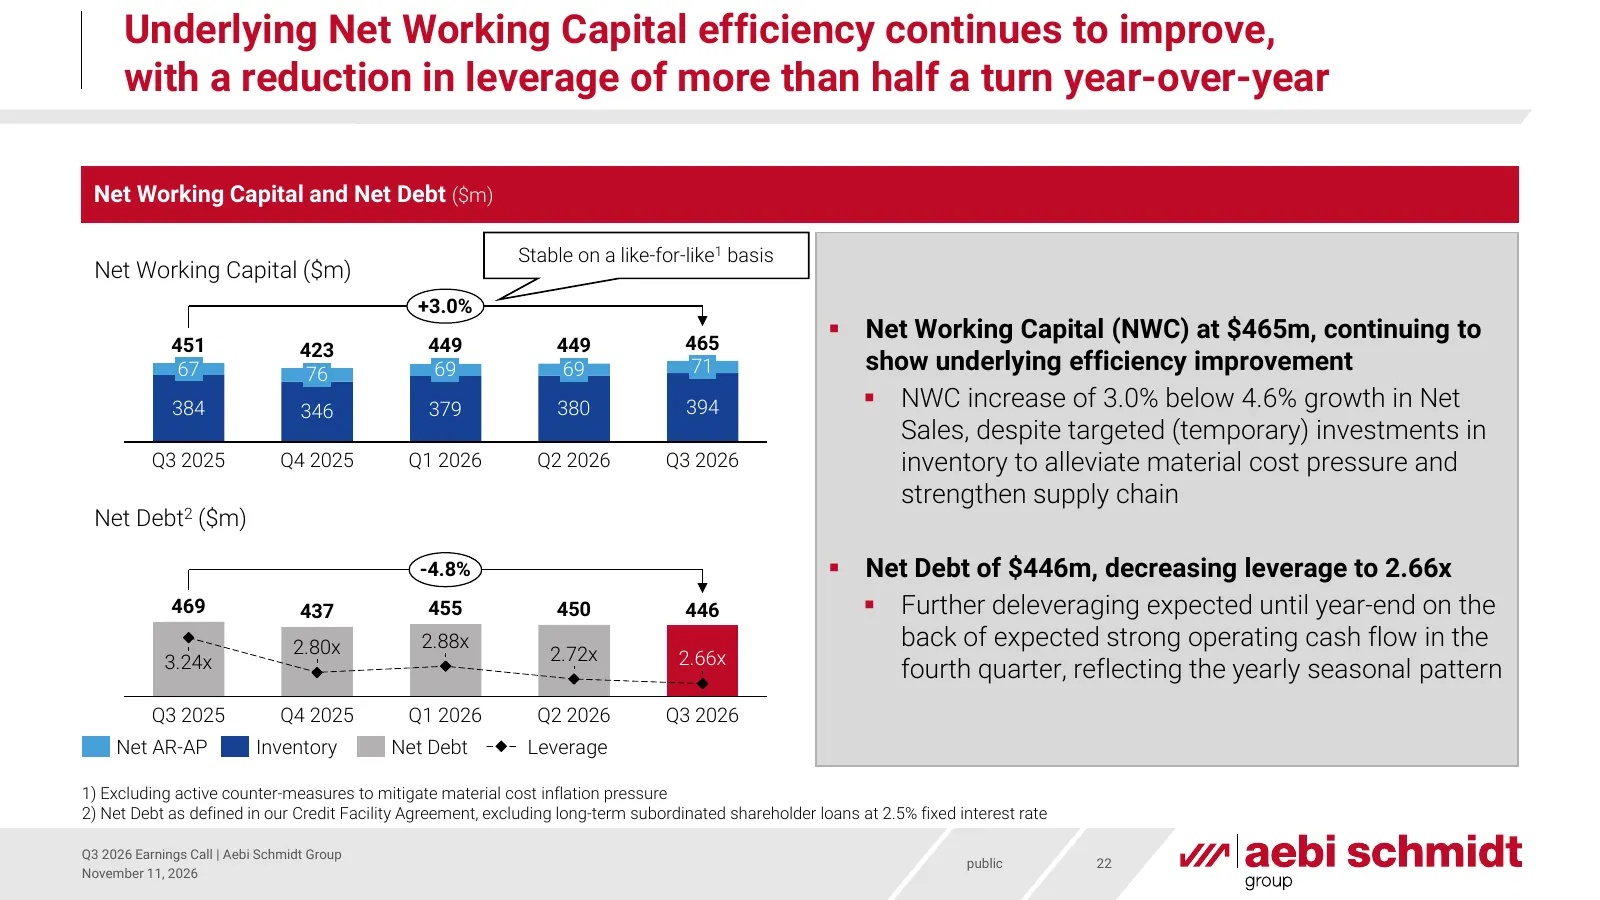
Slide 22: Underlying Net Working Capital efficiency continues to improve
Underlying Net Working Capital efficiency continues to improve, with a reduction in leverage of more than half a turn year-over-year Net Working Capital and Net Debt ($m) Stable on a like-for-like1 basis Net Working Capital ($m) +3.0% 465 Net Working Capital (NWC) at $465m, continuing to 451 423 4
Slide 23: Outlook & Concluding Remarks
Outlook & Concluding Remarks Barend Fruithof, Chairman and Group CEO public
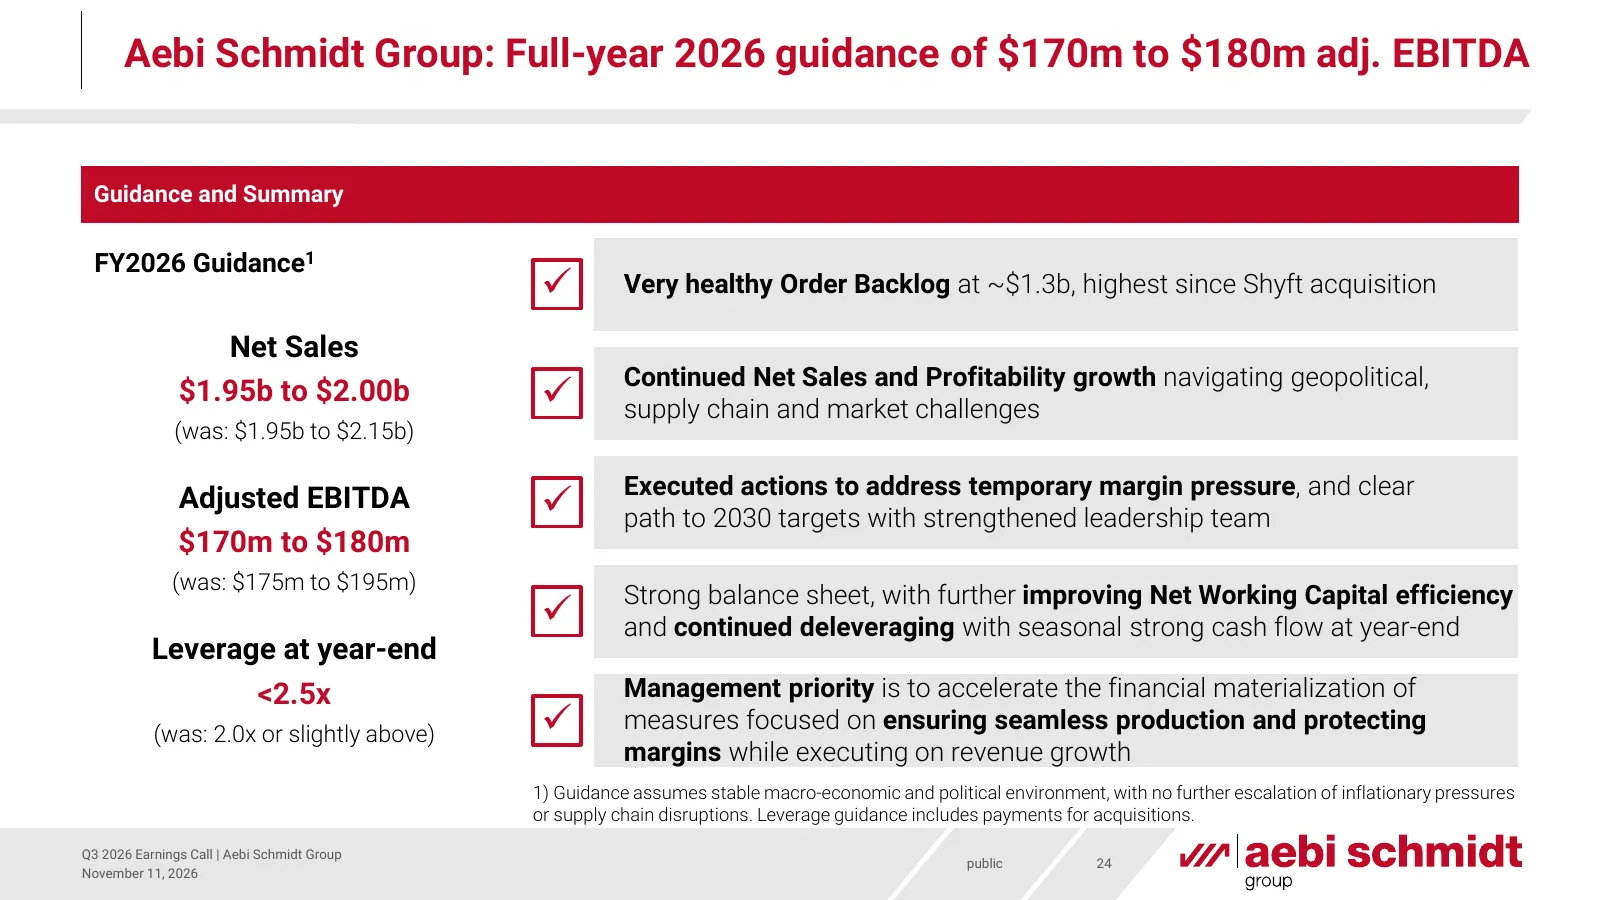
Slide 24: Full-year 2026 guidance of $170m to $180m adj. EBITDA
Aebi Schmidt Group: Full-year 2026 guidance of $170m to $180m adj. EBITDA Guidance and Summary FY2026 Guidance1 Very healthy Order Backlog at ~$1.3b, highest since Shyft acquisition Net Sales Continued Net Sales and Profitability growth navigating geopolitical, $1.95b to $2.00b supply chain and
Slide 25: Thank you for your time and interest!
Thank you for your time and interest!
Slide 26: Appendix: Supplemental Financial Information
Appendix: Supplemental Financial Information public
Slide 27: Aebi Schmidt Group 2030 strategy
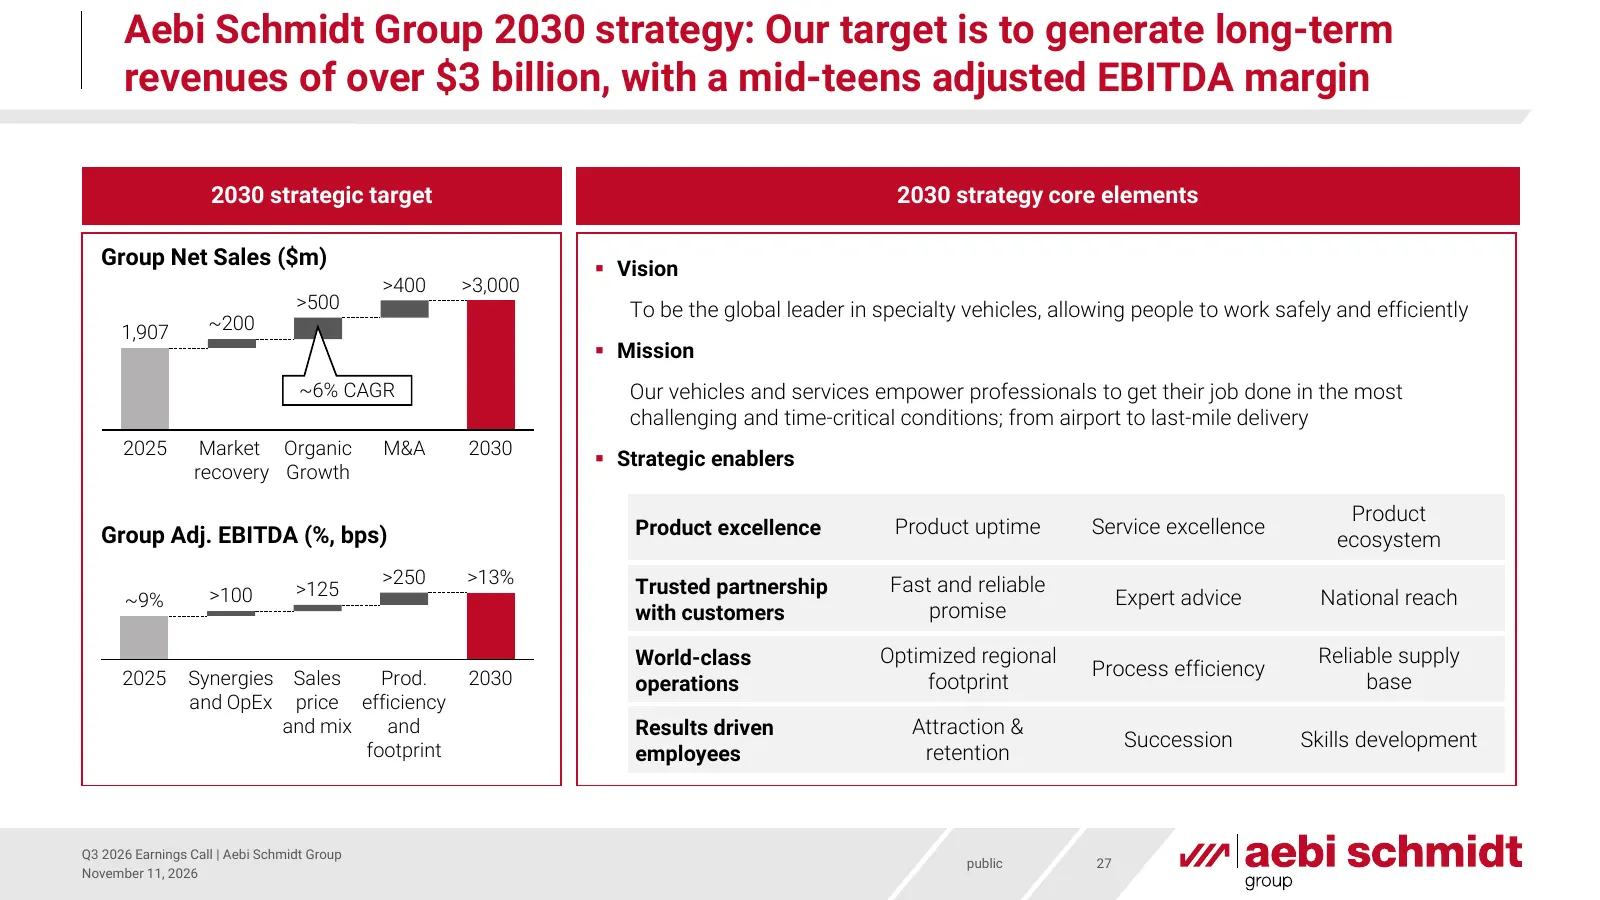
Aebi Schmidt Group 2030 strategy: Our target is to generate long-term revenues of over $3 billion, with a mid-teens adjusted EBITDA margin 2030 strategic target 2030 strategy core elements Group Net Sales ($m) Vision >400 >3,000 >500 To be the global leader in specialty vehicles, allowing people t
Slide 28: Reconciliation of Non-GAAP Financial Measures
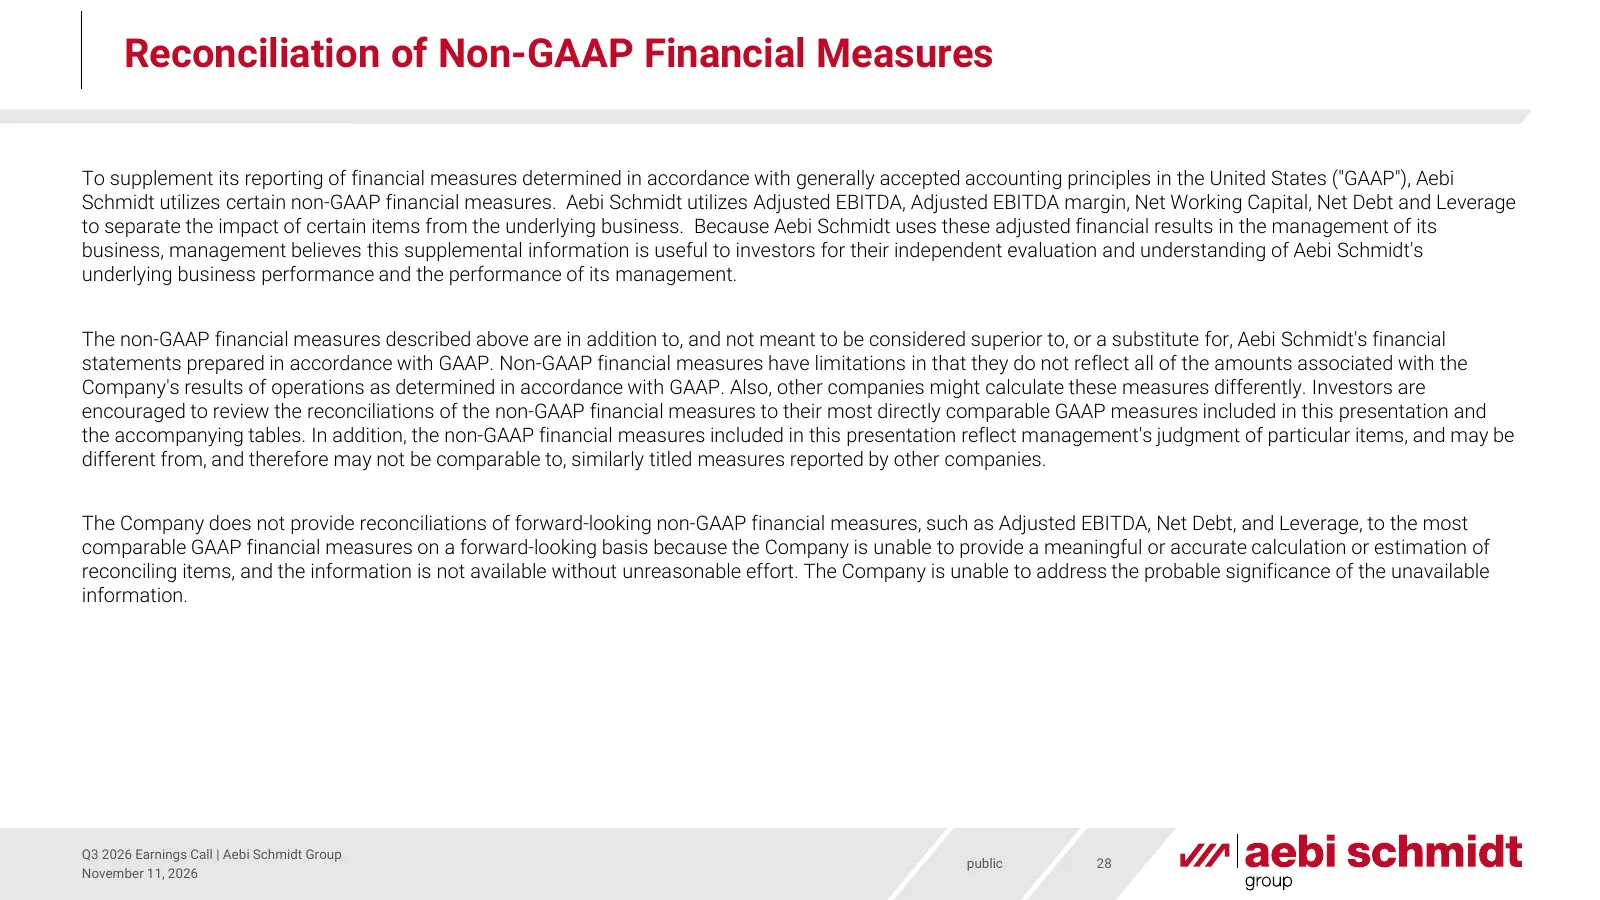
Reconciliation of Non-GAAP Financial Measures To supplement its reporting of financial measures determined in accordance with generally accepted accounting principles in the United States ("GAAP"), Aebi Schmidt utilizes certain non-GAAP financial measures. Aebi Schmidt utilizes Adjusted EBITDA, Adju
Slide 29: Reconciliation of Non-GAAP Financial Measures
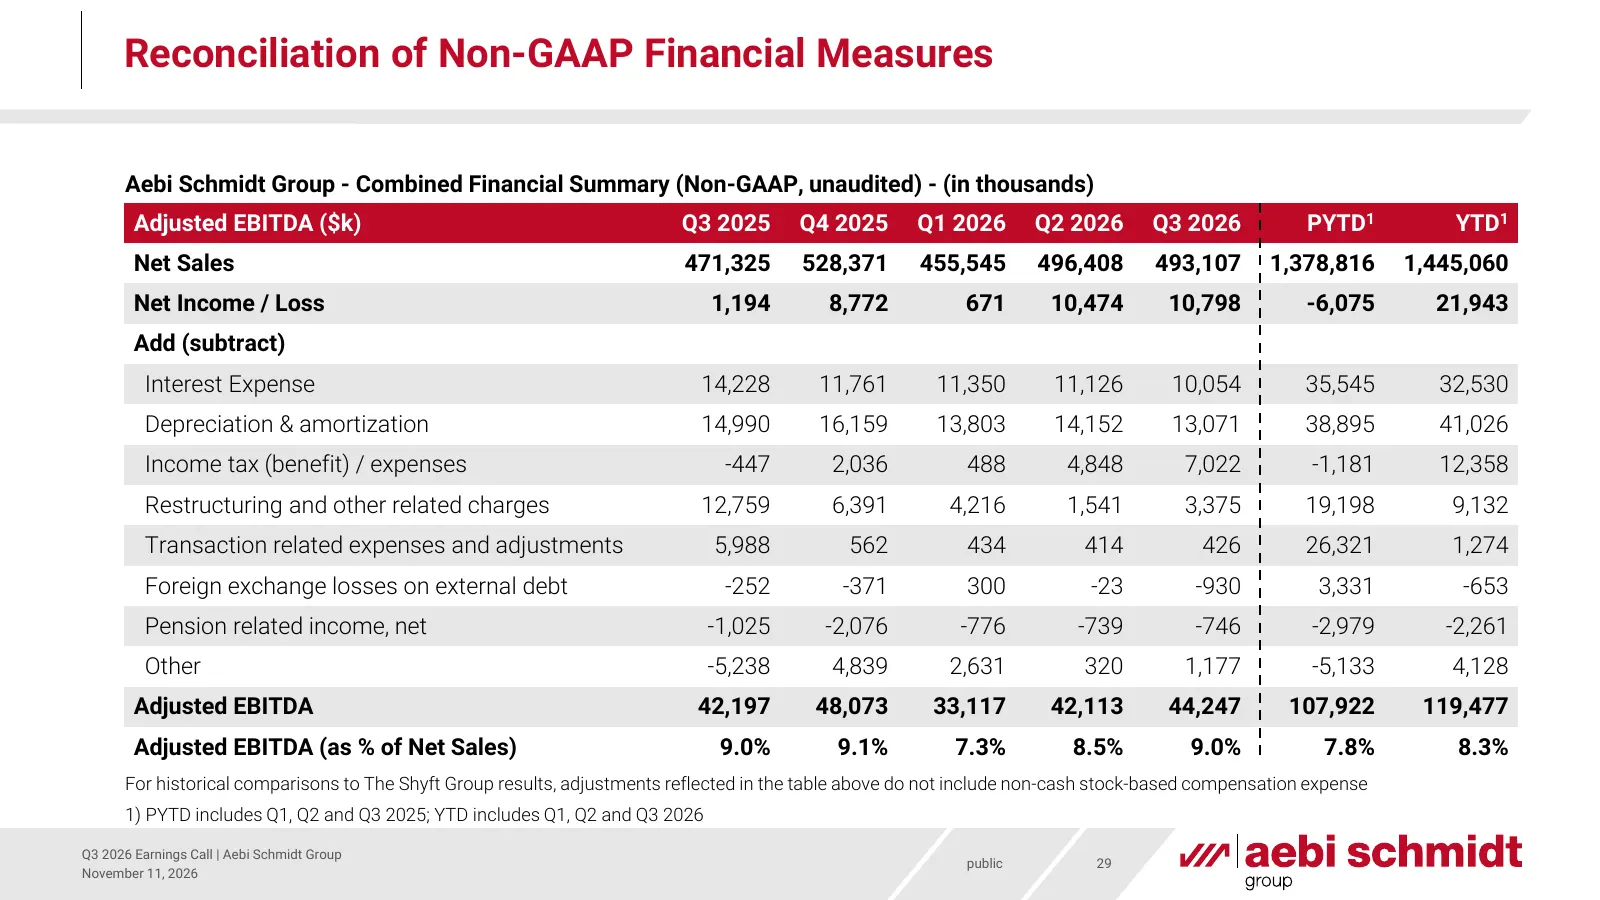
Reconciliation of Non-GAAP Financial Measures Aebi Schmidt Group - Combined Financial Summary (Non-GAAP, unaudited) - (in thousands) Adjusted EBITDA ($k) Q3 2025 Q4 2025 Q1 2026 Q2 2026 Q3 2026 PYTD1 YTD1 Net Sales 471,325 528,371 455,545 496,408 493,107 1,378,816 1,445,060 Net Income / Loss 1,194 8
Slide 30: Reconciliation of Non-GAAP Financial Measures
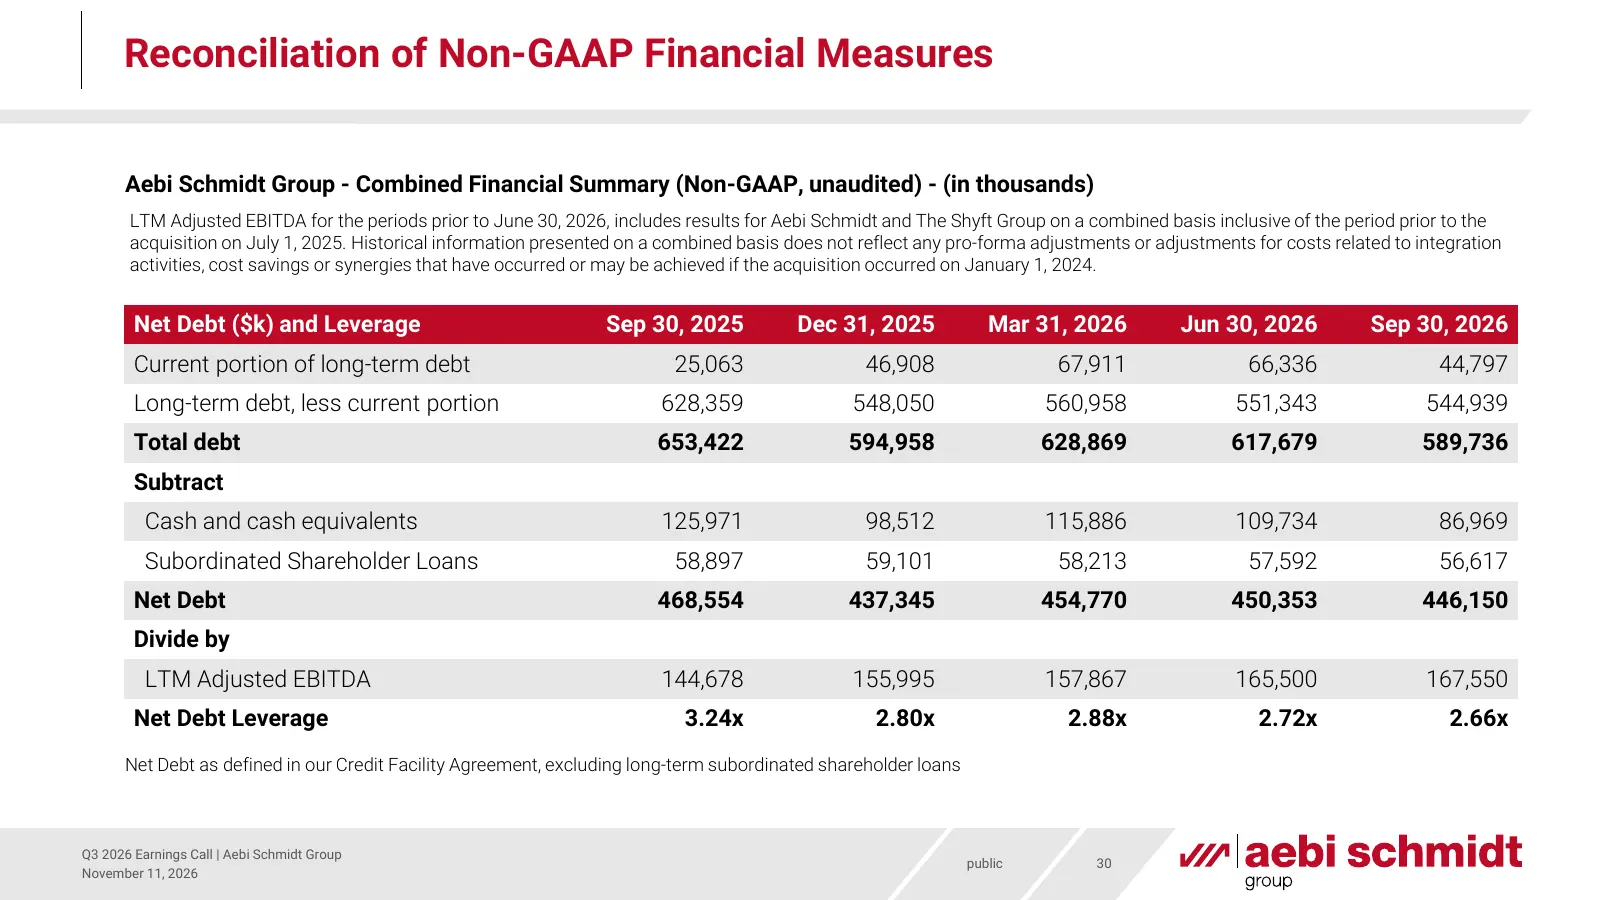
Reconciliation of Non-GAAP Financial Measures Aebi Schmidt Group - Combined Financial Summary (Non-GAAP, unaudited) - (in thousands) LTM Adjusted EBITDA for the periods prior to June 30, 2026, includes results for Aebi Schmidt and The Shyft Group on a combined basis inclusive of the period prior to
Slide 31: Reconciliation of Non-GAAP Financial Measures
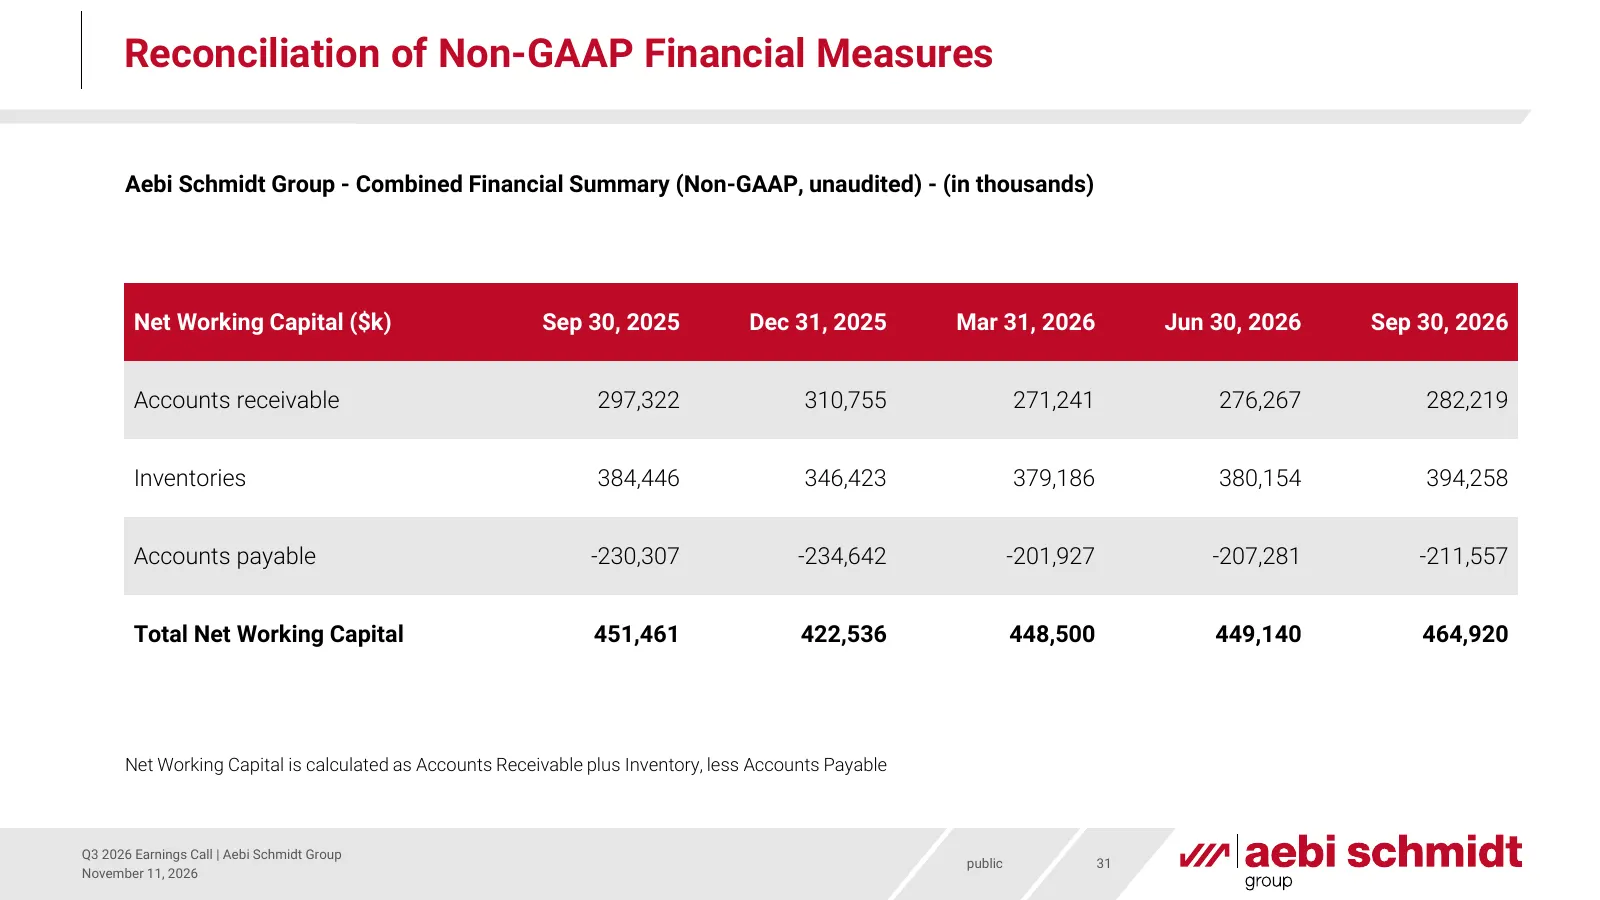
Reconciliation of Non-GAAP Financial Measures Aebi Schmidt Group - Combined Financial Summary (Non-GAAP, unaudited) - (in thousands) Net Working Capital ($k) Sep 30, 2025 Dec 31, 2025 Mar 31, 2026 Jun 30, 2026 Sep 30, 2026 Accounts receivable 297,322 310,755 271,241 276,267 282,219 Inventories 384,4
Slide 32: Condensed Consolidated Statements of Operations (1/2)
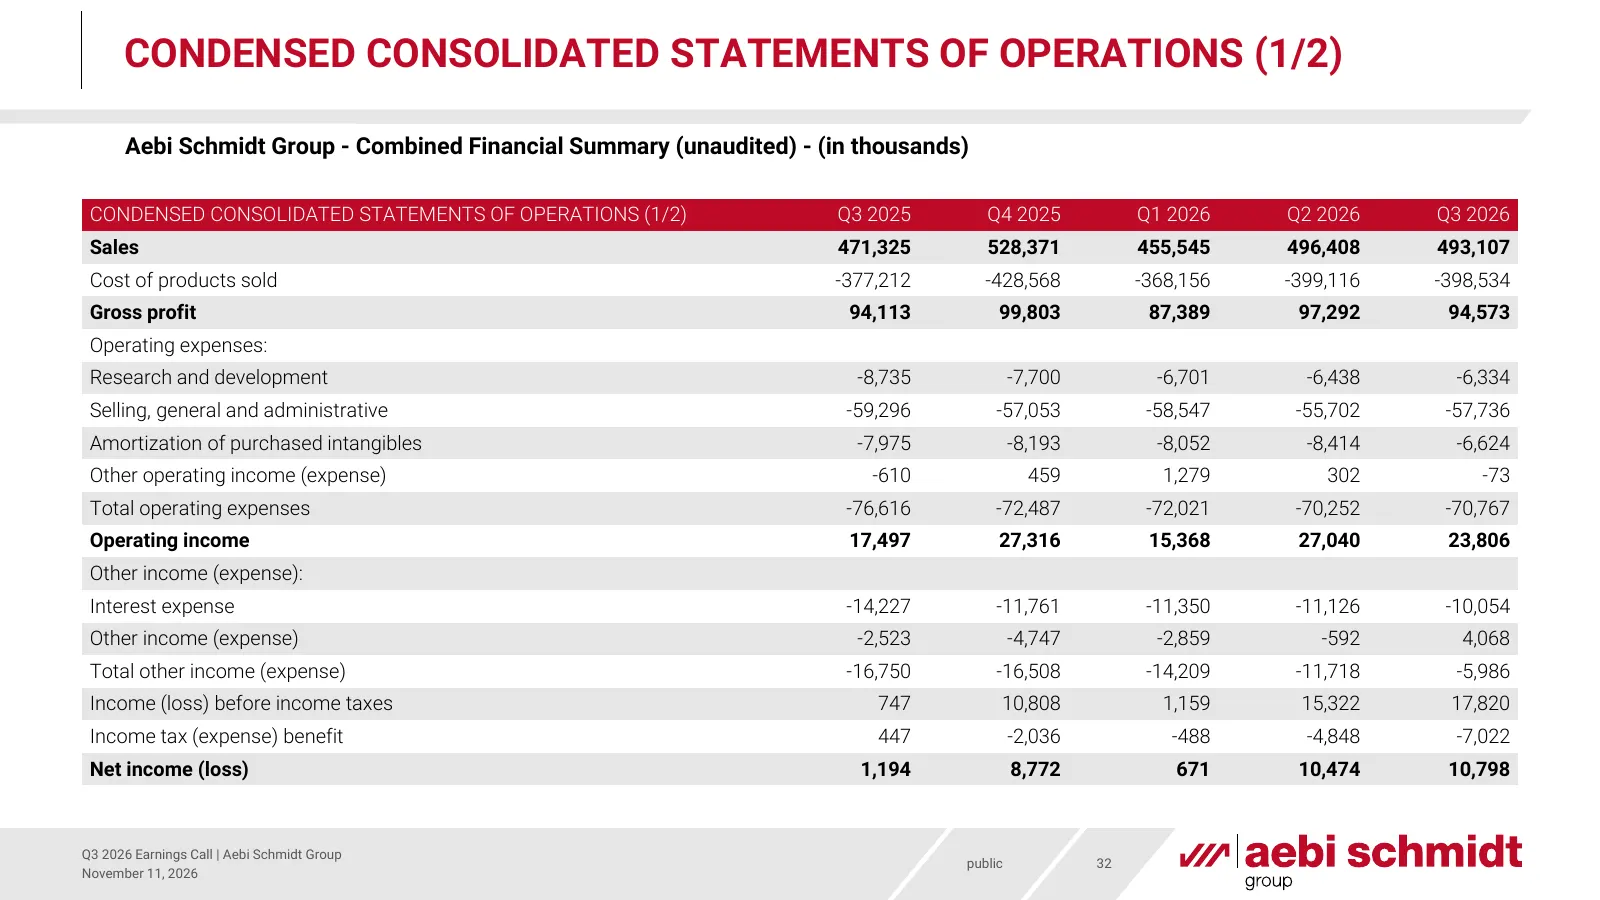
CONDENSED CONSOLIDATED STATEMENTS OF OPERATIONS (1/2) Aebi Schmidt Group - Combined Financial Summary (unaudited) - (in thousands) CONDENSED CONSOLIDATED STATEMENTS OF OPERATIONS (1/2) Q3 2025 Q4 2025 Q1 2026 Q2 2026 Q3 2026 Sales 471,325 528,371 455,545 496,408 493,107 Cost of products sold -377,21
Slide 33: Condensed Consolidated Statements of Operations (2/2)
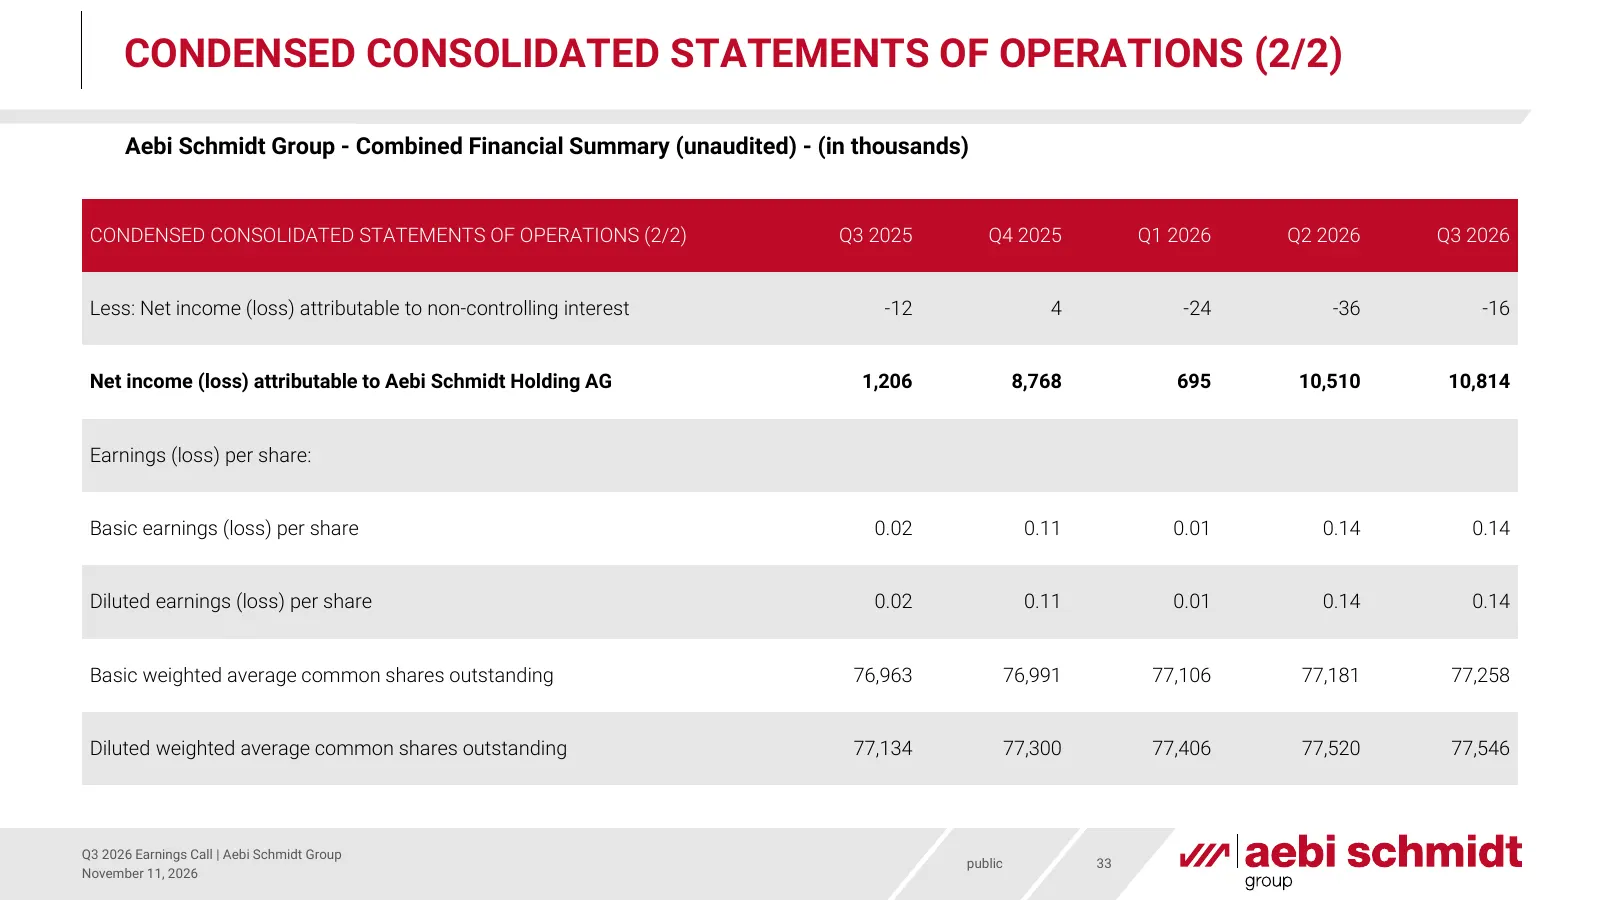
CONDENSED CONSOLIDATED STATEMENTS OF OPERATIONS (2/2) Aebi Schmidt Group - Combined Financial Summary (unaudited) - (in thousands) CONDENSED CONSOLIDATED STATEMENTS OF OPERATIONS (2/2) Q3 2025 Q4 2025 Q1 2026 Q2 2026 Q3 2026 Less: Net income (loss) attributable to non-controlling interest -12 4 -24
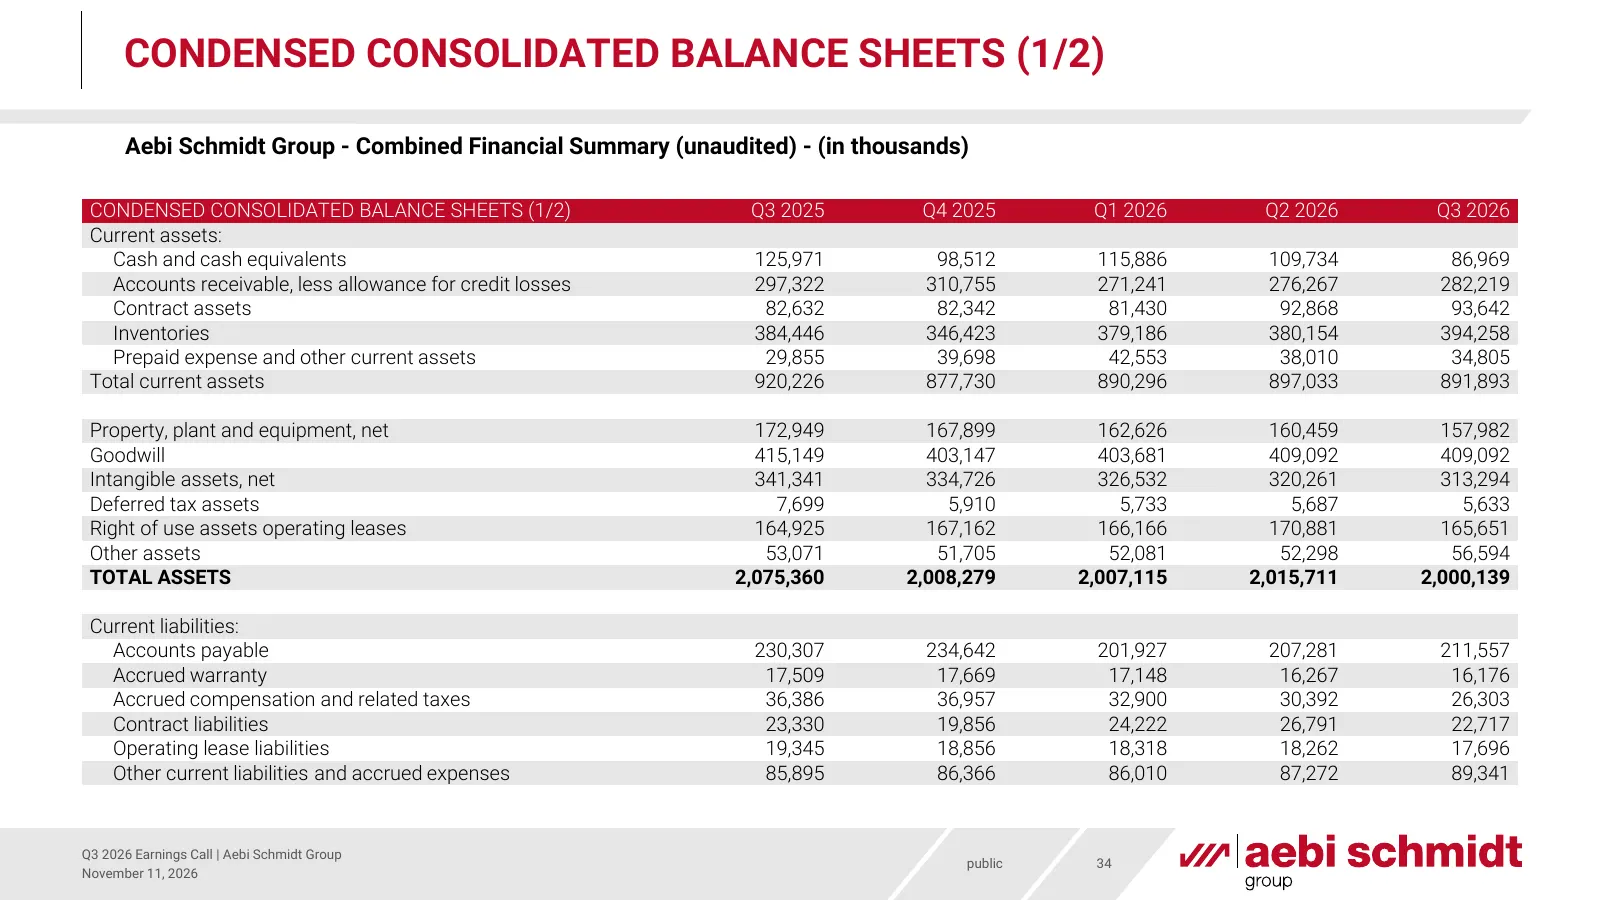
Slide 34: Condensed Consolidated Balance Sheets (1/2)
CONDENSED CONSOLIDATED BALANCE SHEETS (1/2) Aebi Schmidt Group - Combined Financial Summary (unaudited) - (in thousands) CONDENSED CONSOLIDATED BALANCE SHEETS (1/2) Q3 2025 Q4 2025 Q1 2026 Q2 2026 Q3 2026 Current assets: Cash and cash equivalents 125,971 98,512 115,886 109,734 86,969 Accounts receiv
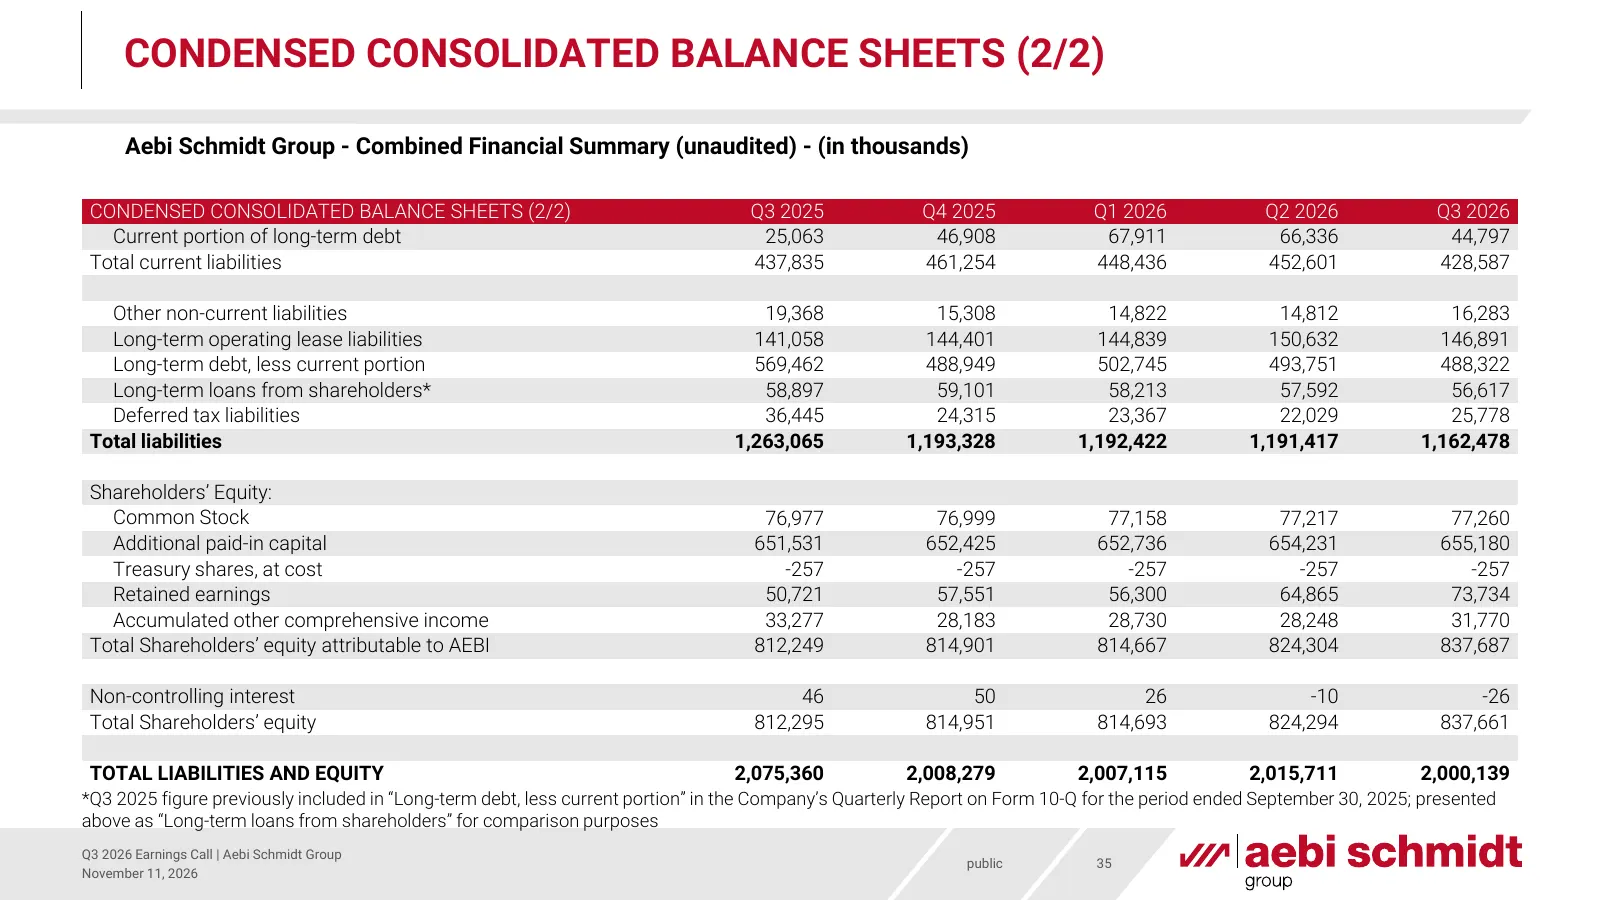
Slide 35: Condensed Consolidated Balance Sheets (2/2)
CONDENSED CONSOLIDATED BALANCE SHEETS (2/2) Aebi Schmidt Group - Combined Financial Summary (unaudited) - (in thousands) CONDENSED CONSOLIDATED BALANCE SHEETS (2/2) Q3 2025 Q4 2025 Q1 2026 Q2 2026 Q3 2026 Current portion of long-term debt 25,063 46,908 67,911 66,336 44,797 Total current liabilities
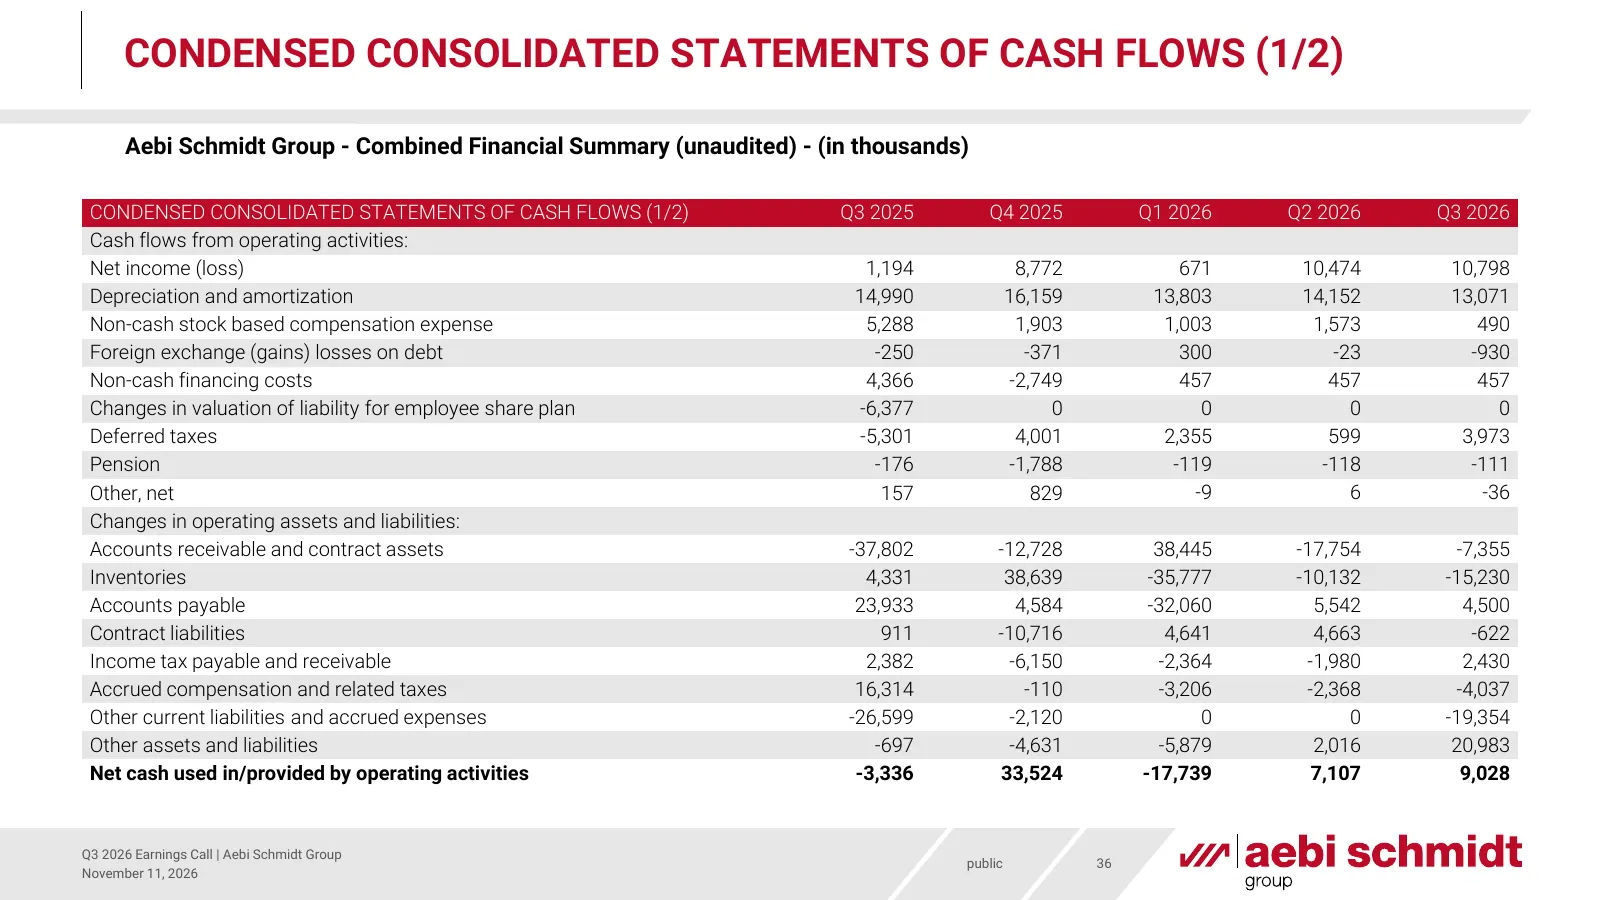
Slide 36: Condensed Consolidated Statements of Cash Flows (1/2)
CONDENSED CONSOLIDATED STATEMENTS OF CASH FLOWS (1/2) Aebi Schmidt Group - Combined Financial Summary (unaudited) - (in thousands) CONDENSED CONSOLIDATED STATEMENTS OF CASH FLOWS (1/2) Q3 2025 Q4 2025 Q1 2026 Q2 2026 Q3 2026 Cash flows from operating activities: Net income (loss) 1,194 8,772 671 10,
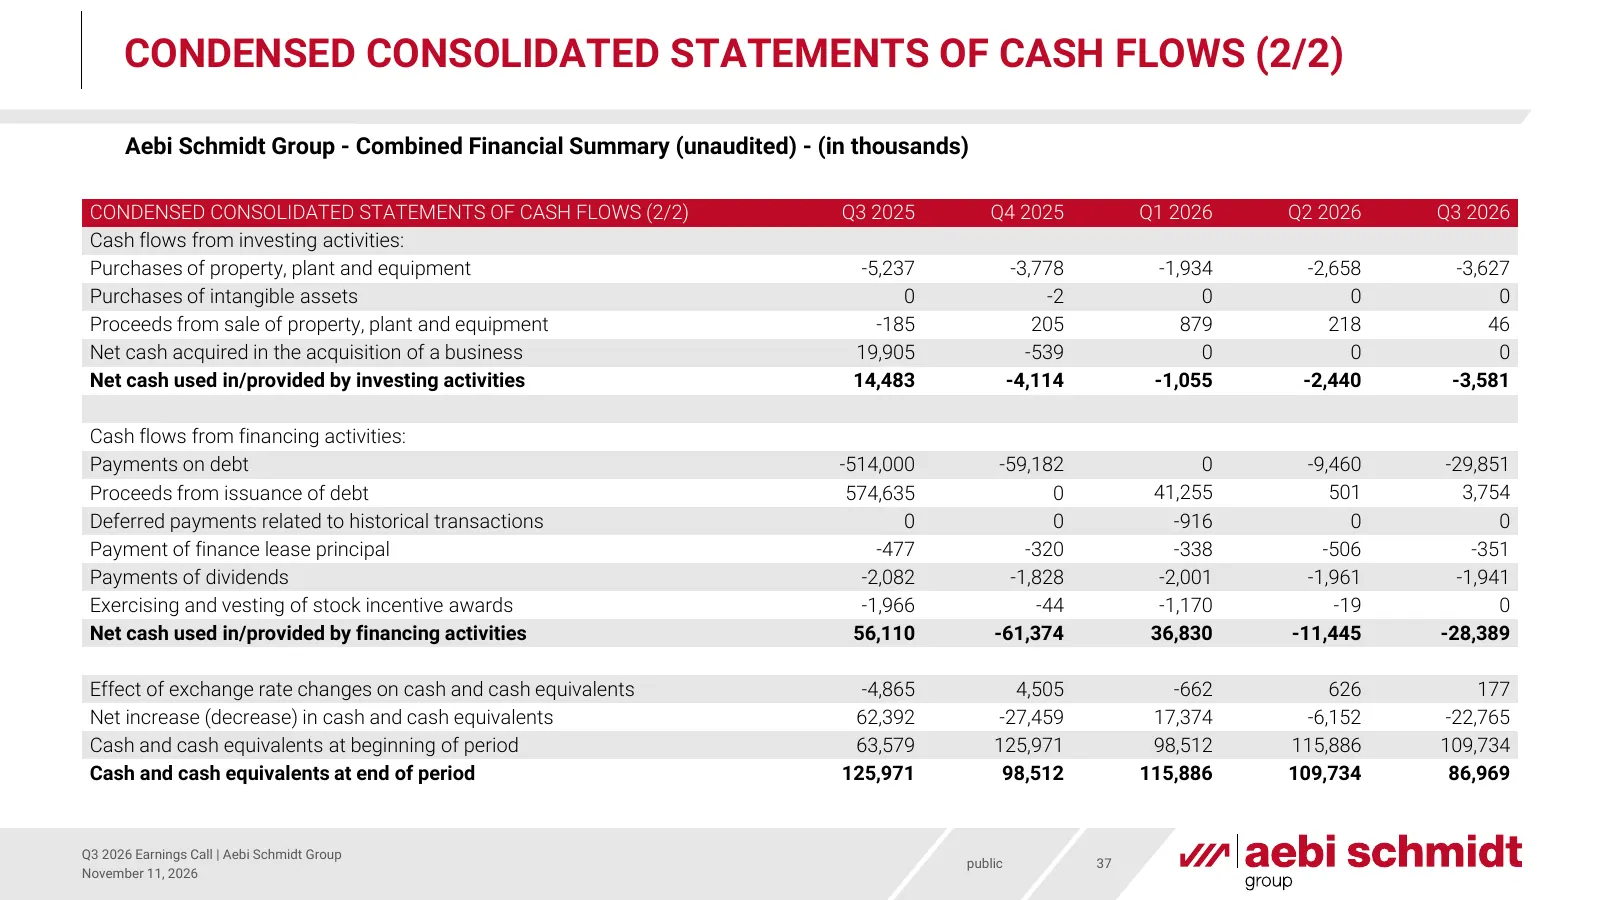
Slide 37: Condensed Consolidated Statements of Cash Flows (2/2)
CONDENSED CONSOLIDATED STATEMENTS OF CASH FLOWS (2/2) Aebi Schmidt Group - Combined Financial Summary (unaudited) - (in thousands) CONDENSED CONSOLIDATED STATEMENTS OF CASH FLOWS (2/2) Q3 2025 Q4 2025 Q1 2026 Q2 2026 Q3 2026 Cash flows from investing activities: Purchases of property, plant and equi
Source: company website
More decks from Aebi Schmidt Holding AG
 Investor Presentation (November 2026)27 slides · Nov 11, 2026
 Investor Presentation (August 2026)21 slides · Aug 13, 2026
 Q2 2026 Earnings Presentation28 slides · Aug 13, 2026
 Investor Presentation (July 2026)20 slides · Jul 13, 2026
 Q1 2026 Earnings Presentation33 slides · May 14, 2026
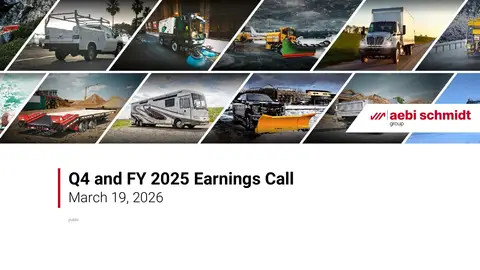 Q4 and FY 2025 Earnings Presentation36 slides · Mar 19, 2026