Evoke plc · LSE:EVOK
Evoke — 888 Holdings — H1 2021 Earnings Presentation
27 slides from Evoke's earnings presentation, Sep 1, 2021

Slide 1: 888 Holdings Plc Interim Results 2021
888 Holdings Plc Interim Results 2021 1 September 2021
Slide 2: Introduction
Introduction Itai Pazner, CEO
Slide 3: Agenda
AGENDA 1 Introduction and H1-2021 highlights 2 Financial review 3 Strategic review 4 Conclusion 5 Q&A 3
Slide 4: H1 2021 Highlights
H1 2021 HIGHLIGHTS Continued momentum and record results ◎ Record half yearly revenues ($528m), Adjusted EBITDA ($97m), and Adjusted EPS (18.3c) ◎ Regulated markets driving growth, with regulated and taxed mix at 75% of revenues ◎ Strategic Sports Illustrated partnership in the US sets a platform fo
Slide 5: Financial review
Financial review Yariv Dafna, CFO
Slide 6: H1 2021 Financial Highlights
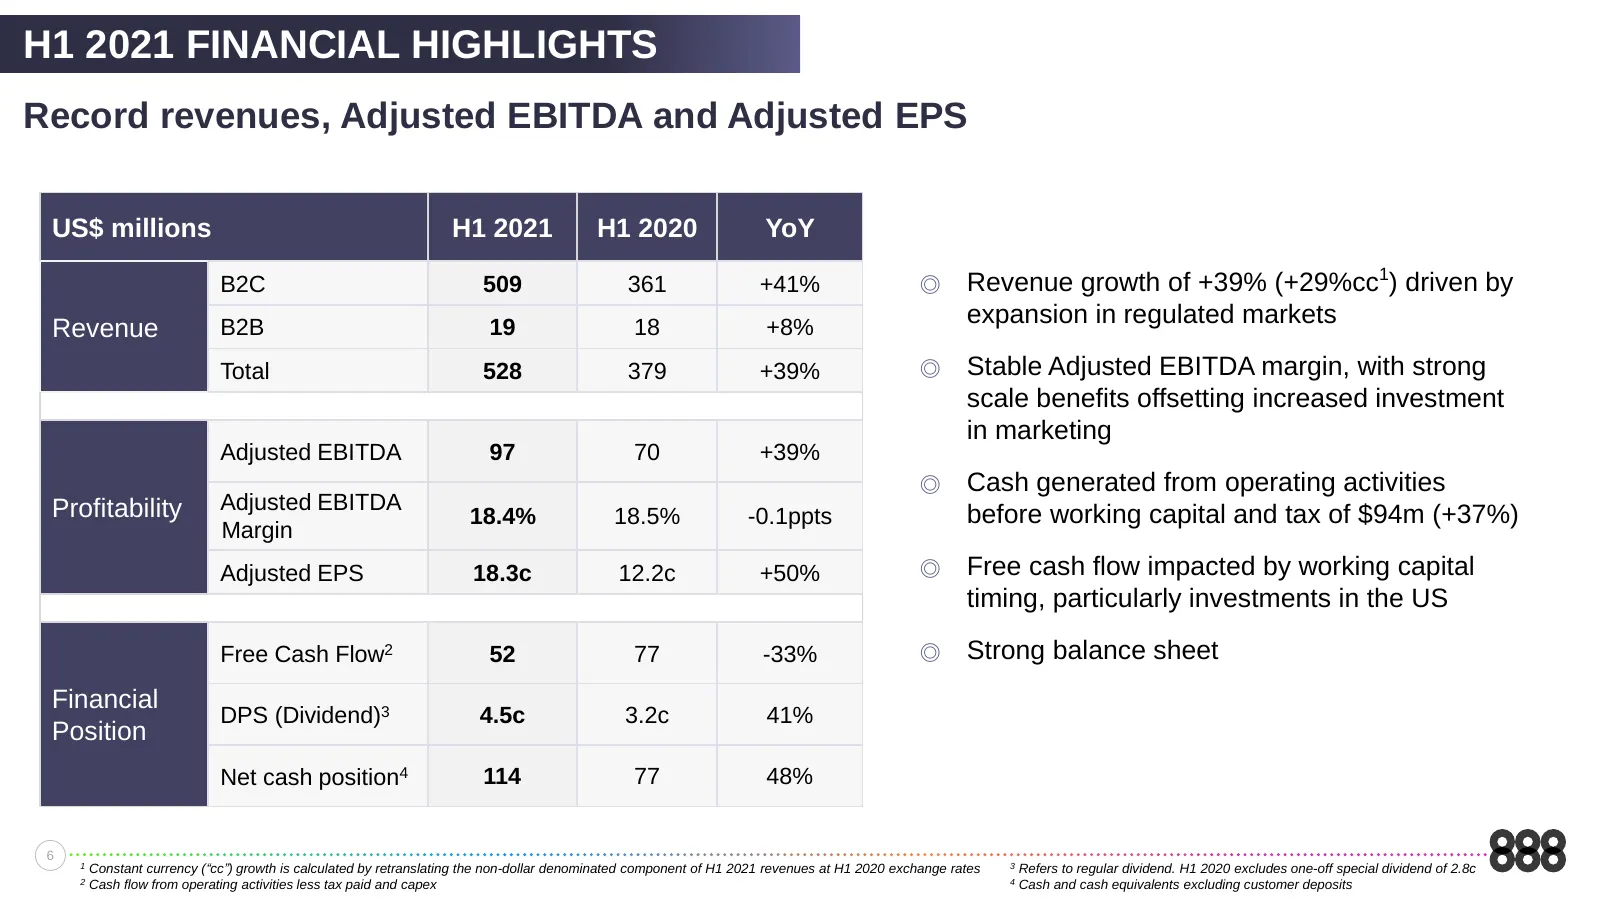
H1 2021 FINANCIAL HIGHLIGHTS Record revenues, Adjusted EBITDA and Adjusted EPS US$ millions H1 2021 H1 2020 YoY B2C 509 361 +41% ◎ Revenue growth of +39% (+29%cc1) driven by expansion in regulated markets Revenue B2B 19 18 +8% Total 528 379 +39% ◎ Stable Adjusted EBITDA margin, with strong scale ben
Slide 7: Revenue Evolution
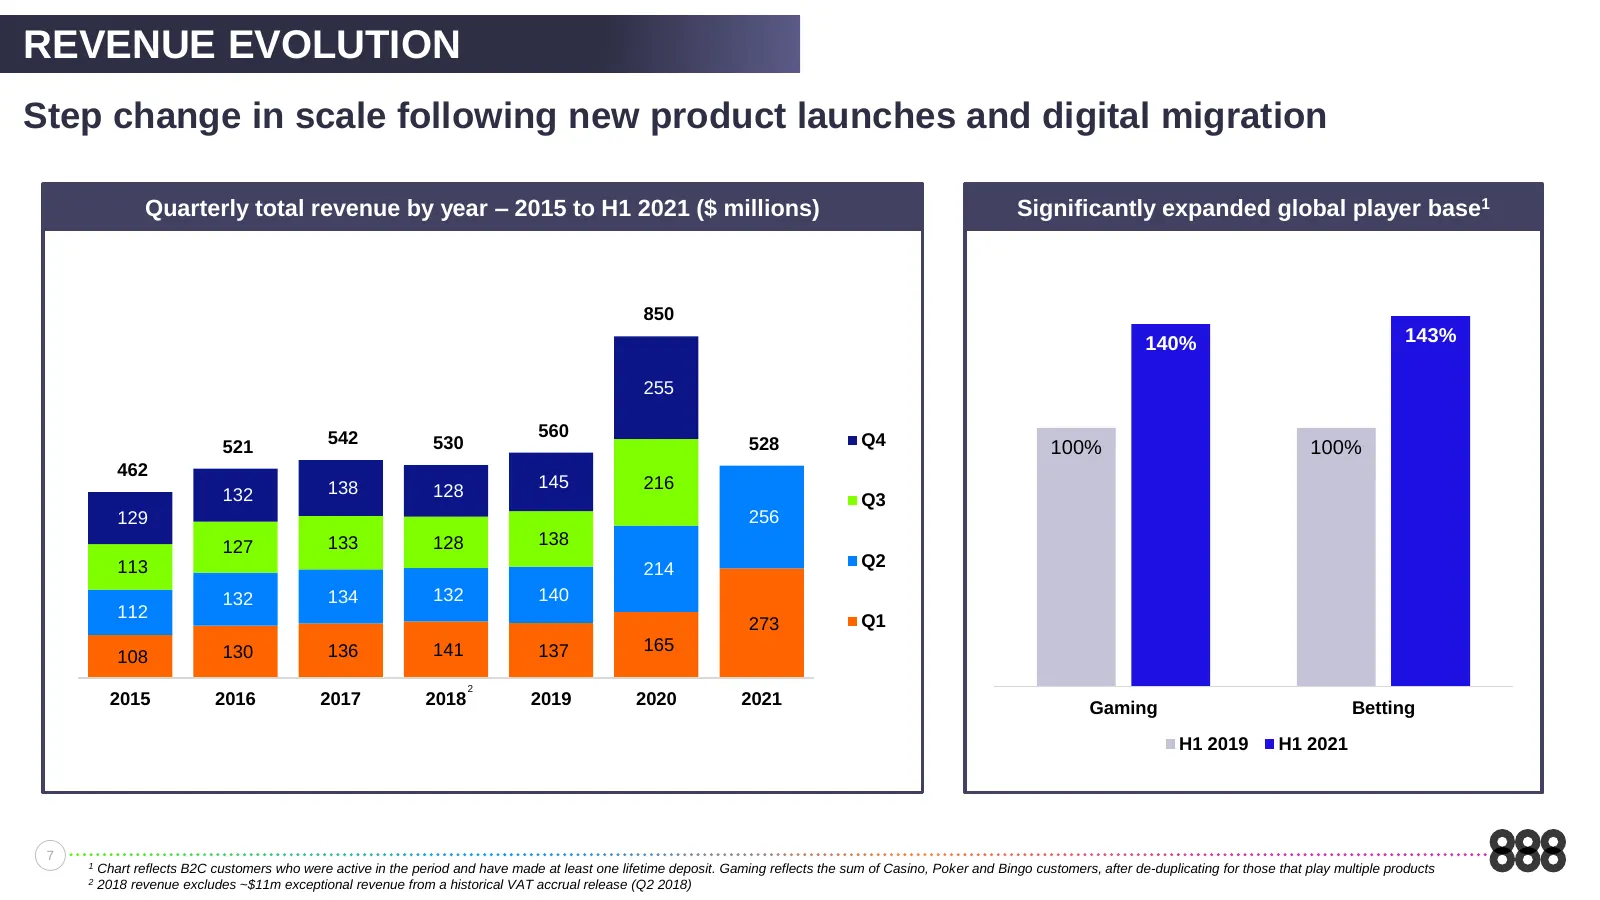
REVENUE EVOLUTION Step change in scale following new product launches and digital migration Quarterly total revenue by year – 2015 to H1 2021 ($ millions) Significantly expanded global player base1 850 140% 143% 255 542 560 Q4 521 530 528 100% 100% 462 138 128 145 216 132 Q3 129 256 127 133 128 138
Slide 8: Revenue by Product
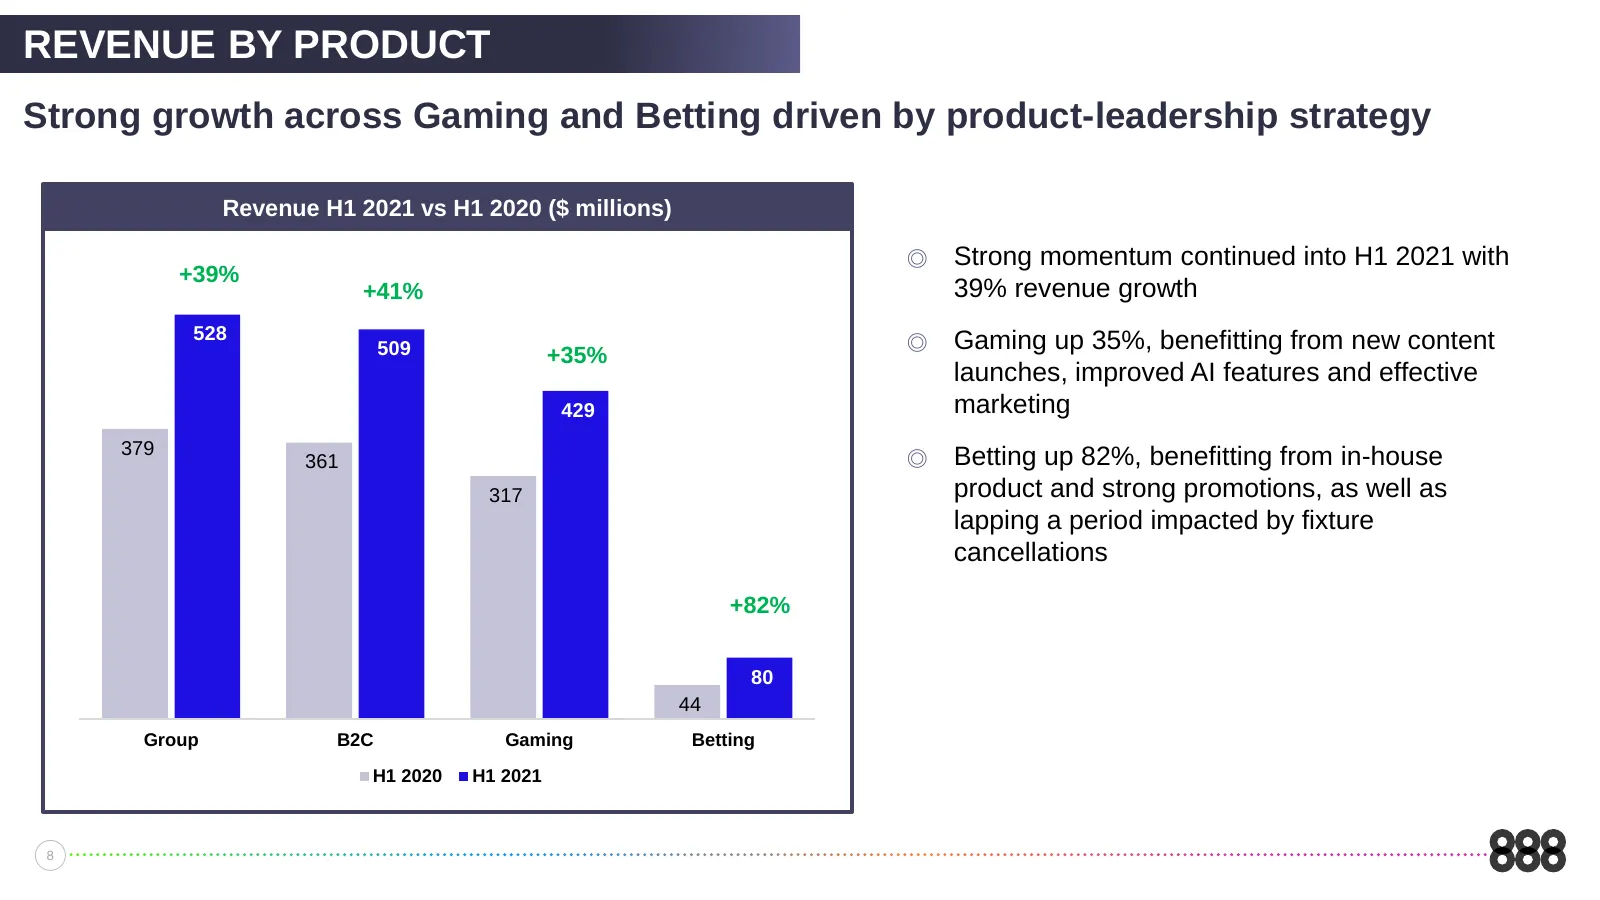
REVENUE BY PRODUCT Strong growth across Gaming and Betting driven by product-leadership strategy Revenue H1 2021 vs H1 2020 ($ millions) ◎ Strong momentum continued into H1 2021 with +39% +41% 39% revenue growth 528 509 ◎ Gaming up 35%, benefitting from new content +35% launches, improved AI feature
Slide 9: Regulated Market Leader
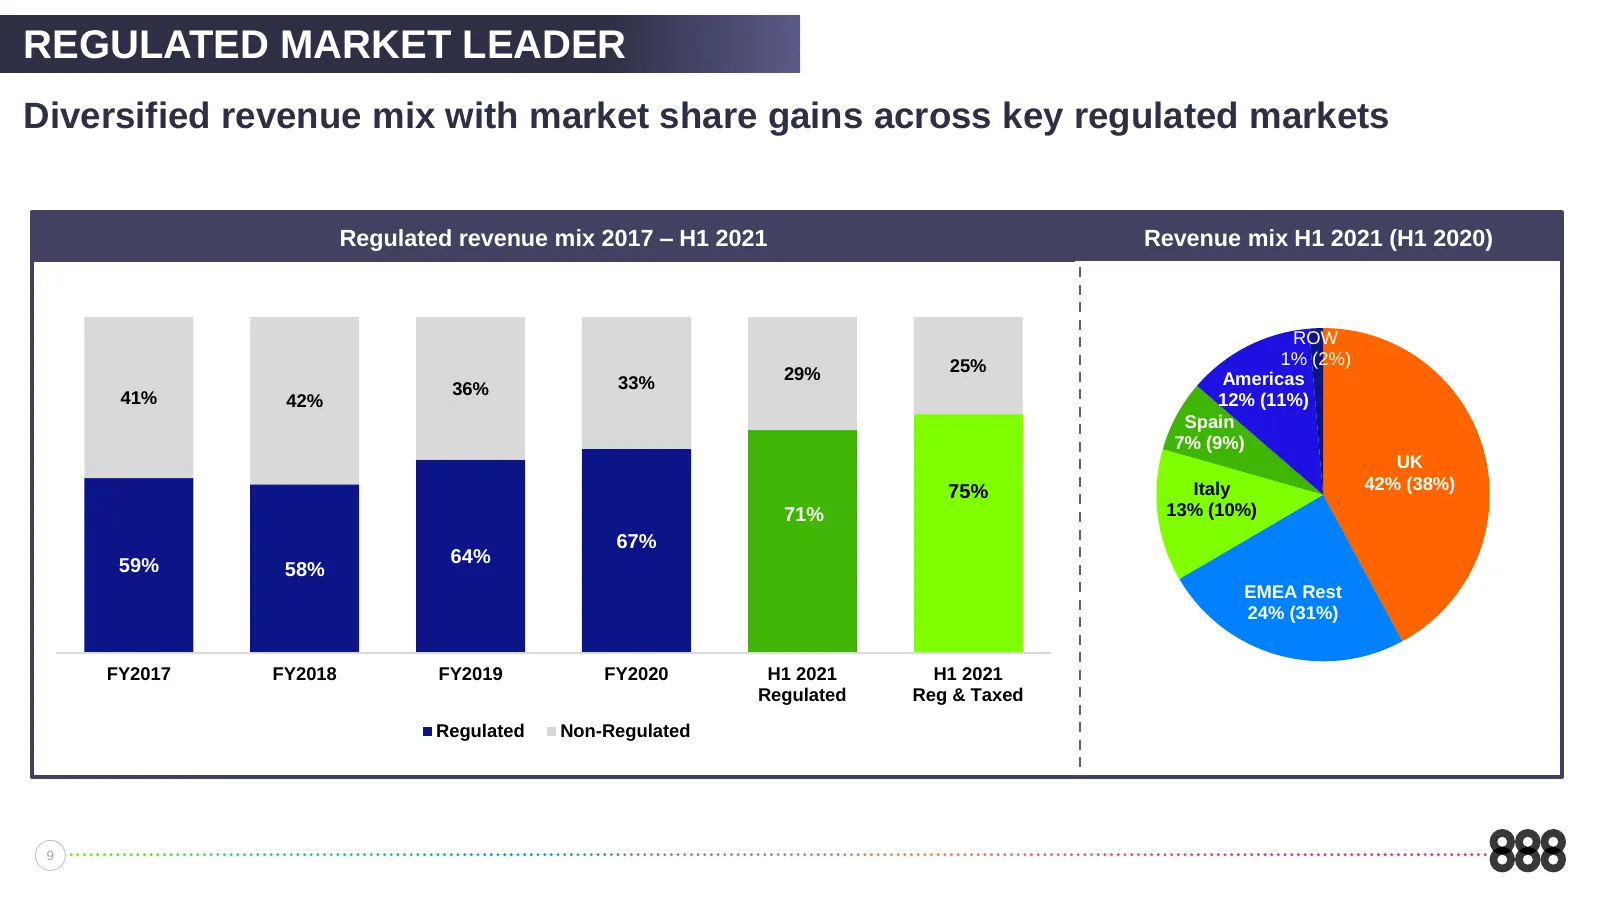
REGULATED MARKET LEADER Diversified revenue mix with market share gains across key regulated markets Regulated revenue mix 2017 – H1 2021 Revenue mix H1 2021 (H1 2020) ROW 25% 1% (2%) 29% Americas 36% 33% 41% 42% 12% (11%) Spain 7% (9%) UK 75% Italy 42% (38%) 71% 13% (10%) 67% 59% 64% 58% EMEA Rest
Slide 10: Adjusted EBITDA
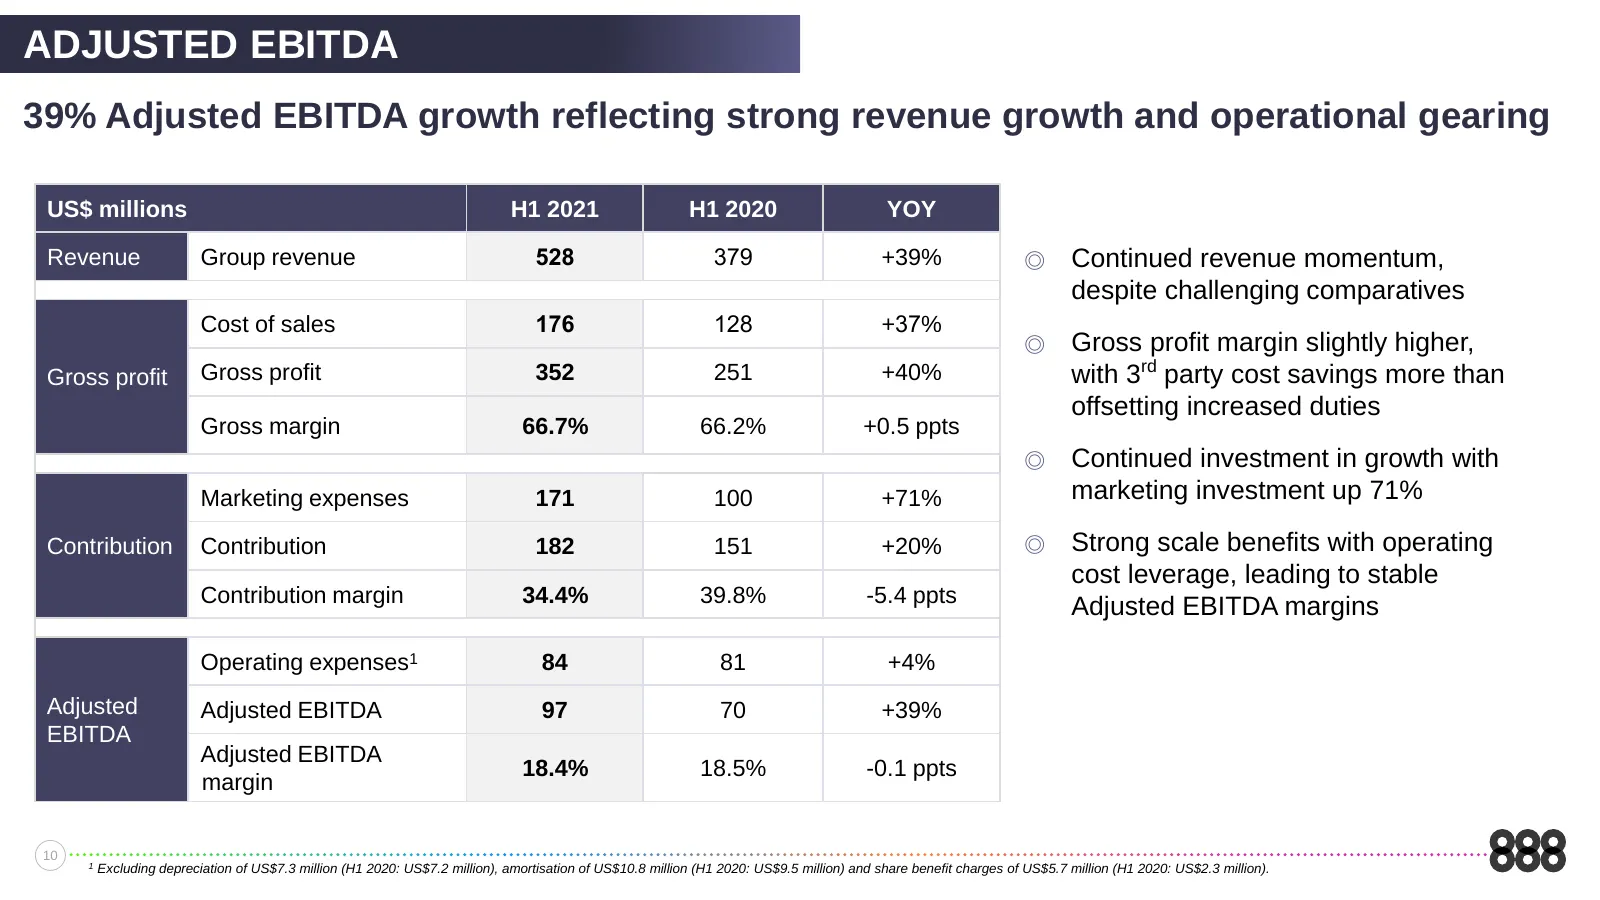
ADJUSTED EBITDA 39% Adjusted EBITDA growth reflecting strong revenue growth and operational gearing US$ millions H1 2021 H1 2020 YOY Revenue Group revenue 528 379 +39% ◎ Continued revenue momentum, despite challenging comparatives Cost of sales 176 128 +37% ◎ Gross profit margin slightly higher, Gro
Slide 11: Free Cash Flow
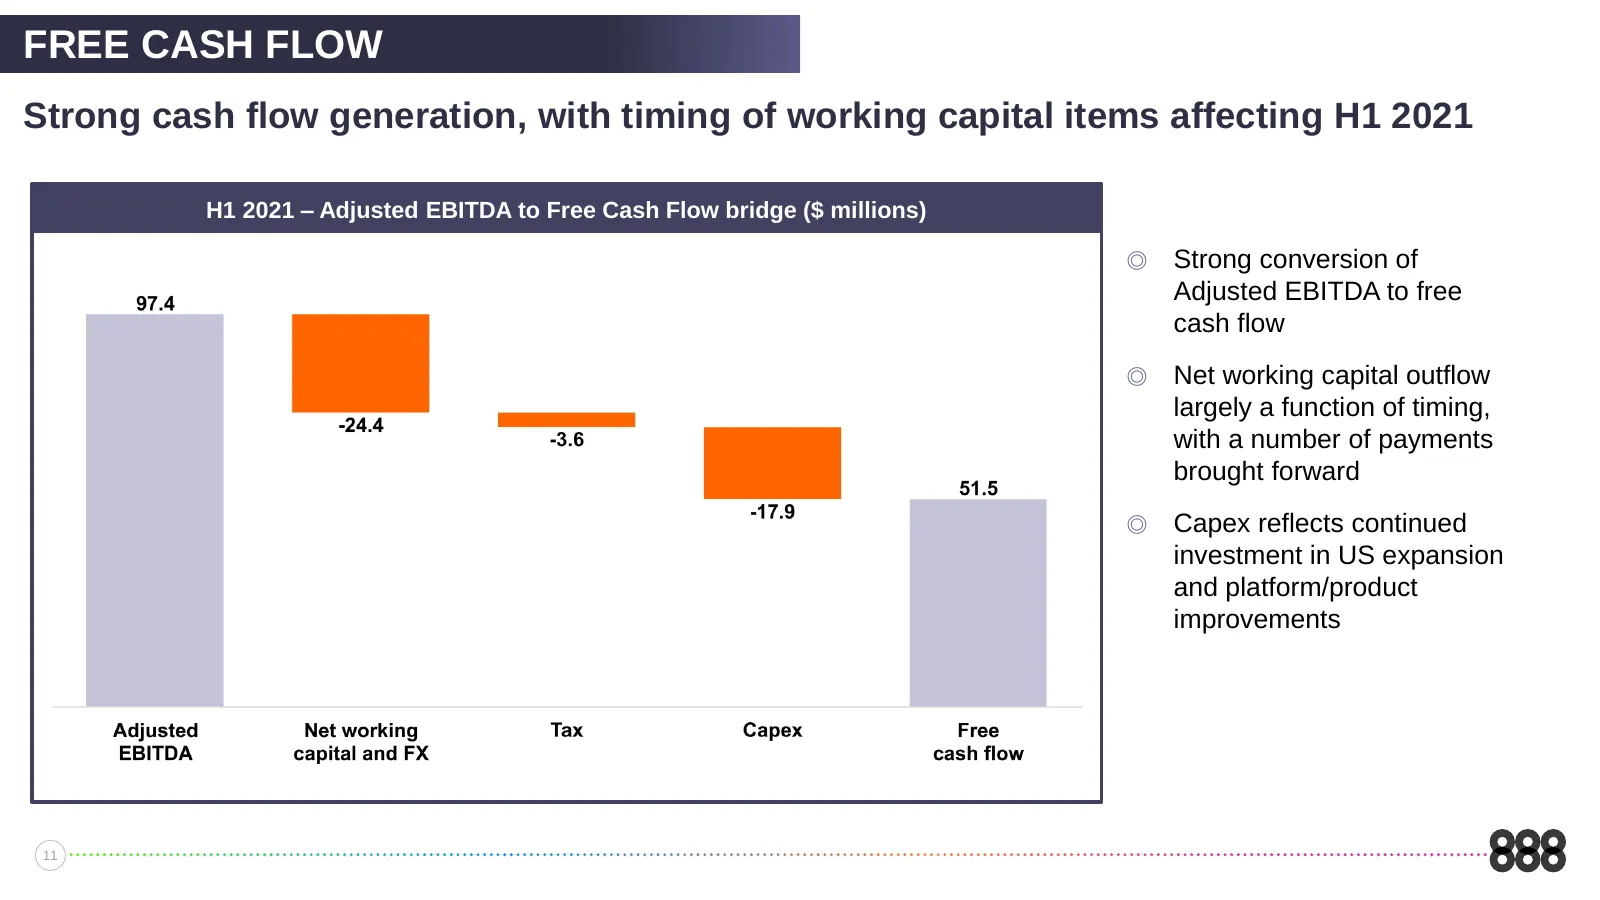
FREE CASH FLOW Strong cash flow generation, with timing of working capital items affecting H1 2021 H1 2021 – Adjusted EBITDA to Free Cash Flow bridge ($ millions) ◎ Strong conversion of Adjusted EBITDA to free cash flow ◎ Net working capital outflow largely a function of timing, with a number of pay
Slide 12: Current Trading and Outlook
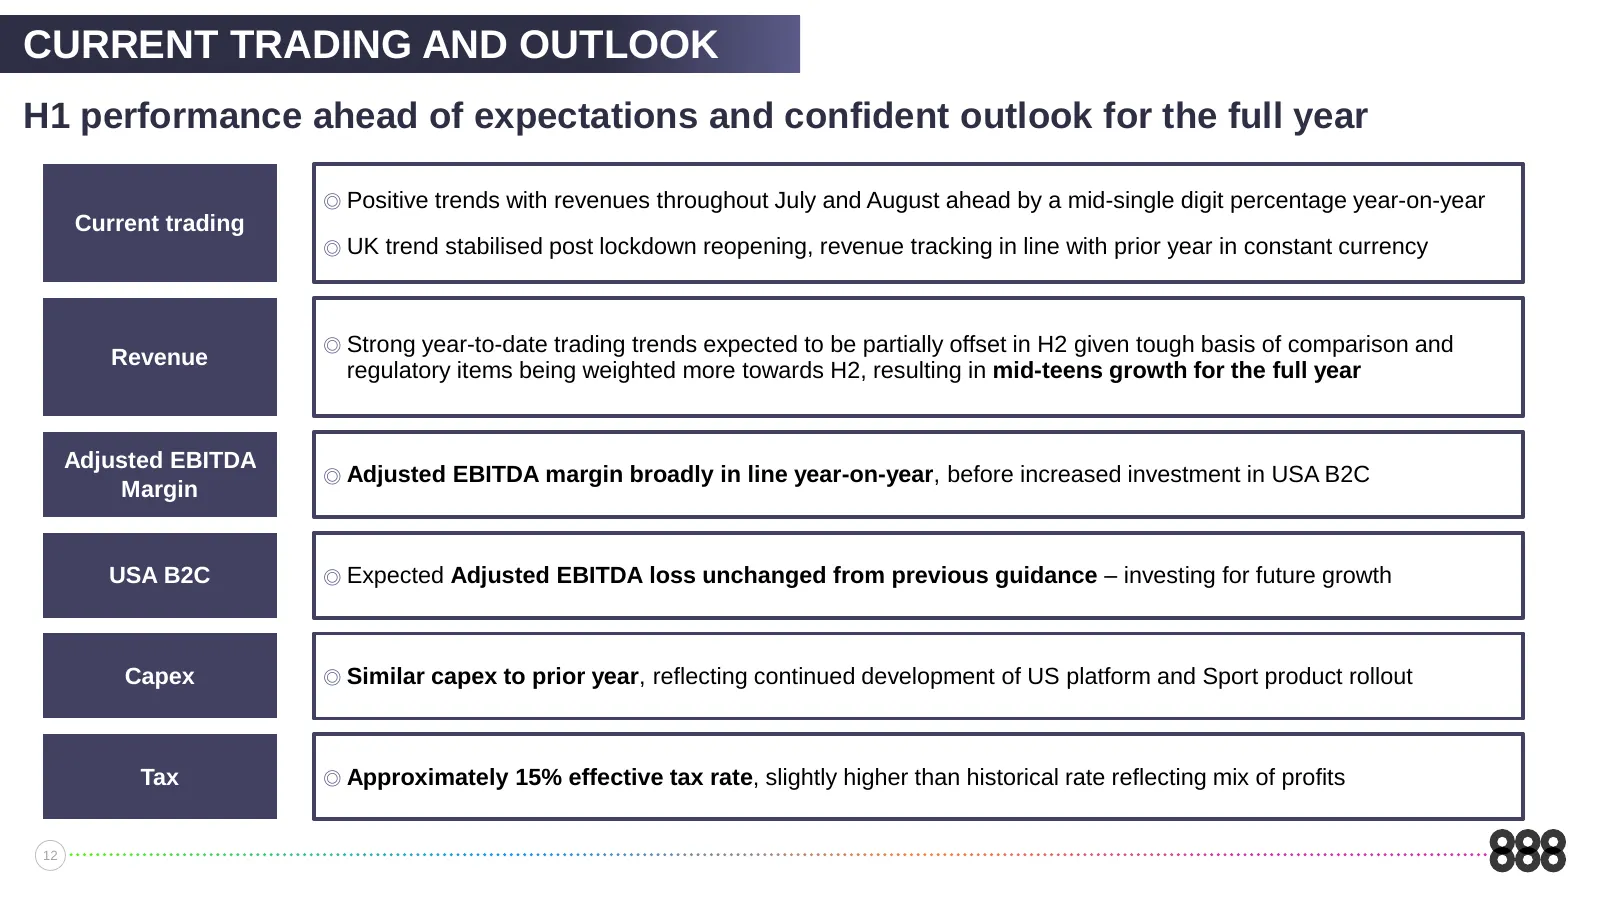
CURRENT TRADING AND OUTLOOK H1 performance ahead of expectations and confident outlook for the full year ◎ Positive trends with revenues throughout July and August ahead by a mid-single digit percentage year-on-year Current trading ◎ UK trend stabilised post lockdown reopening, revenue tracking in l
Slide 13: Strategic review
Strategic review Itai Pazner, CEO
Slide 14: 888: A Global Leader
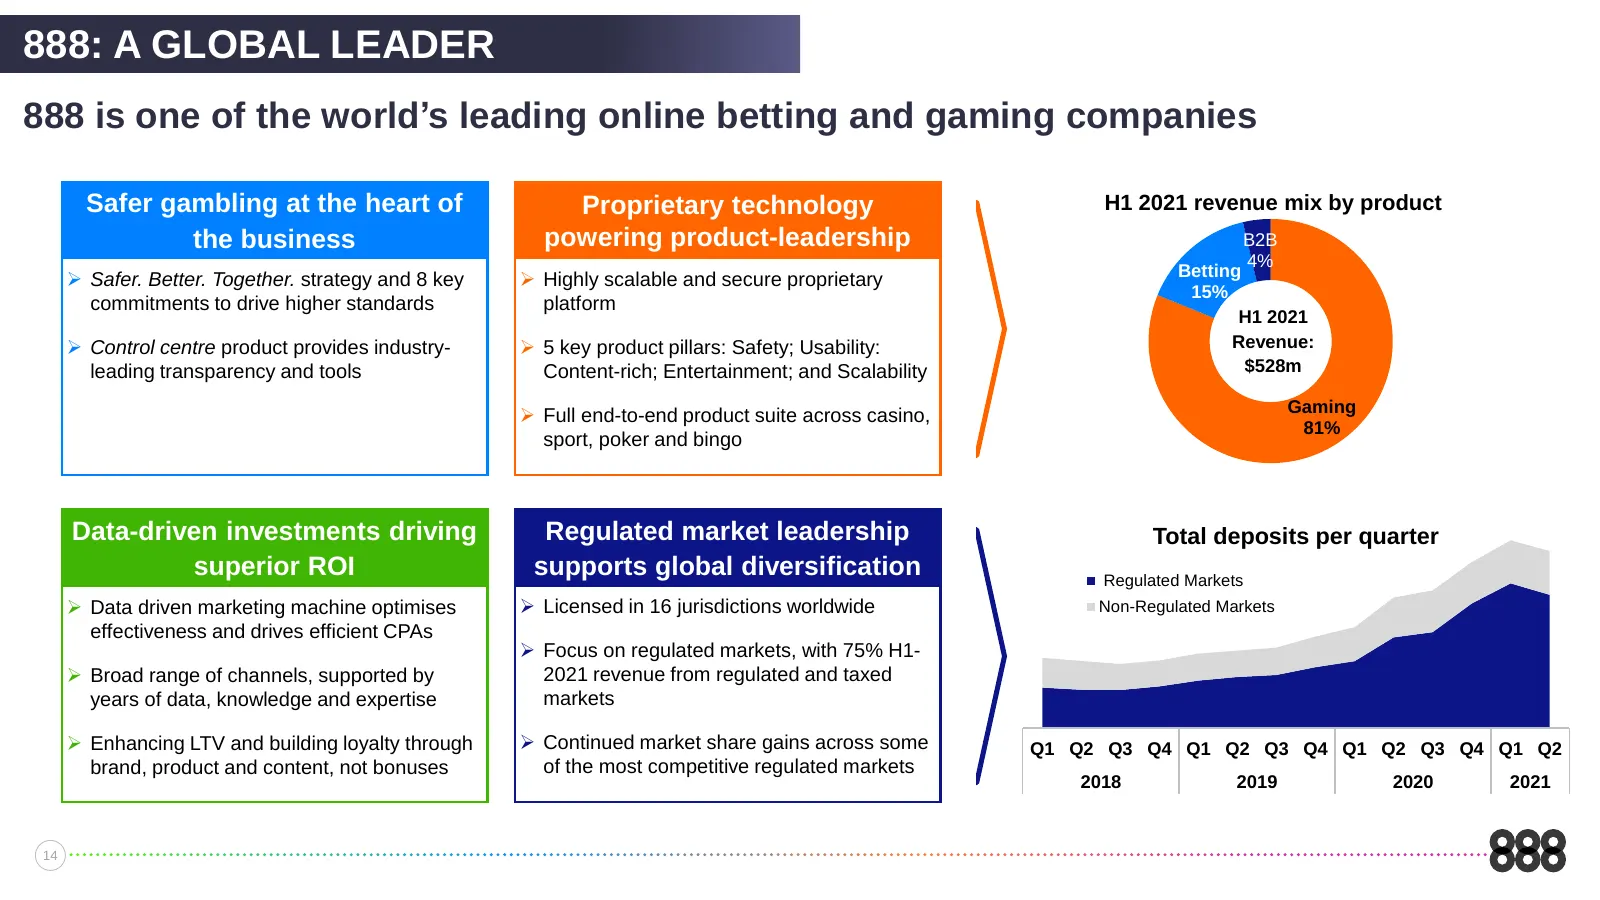
888: A GLOBAL LEADER 888 is one of the world’s leading online betting and gaming companies Safer gambling at the heart of Proprietary technology H1 2021 revenue mix by product the business powering product-leadership B2B 4% ➢ Highly scalable and secure proprietary Betting ➢ Safer. Better. Together.
Slide 15: Strategic Priorities
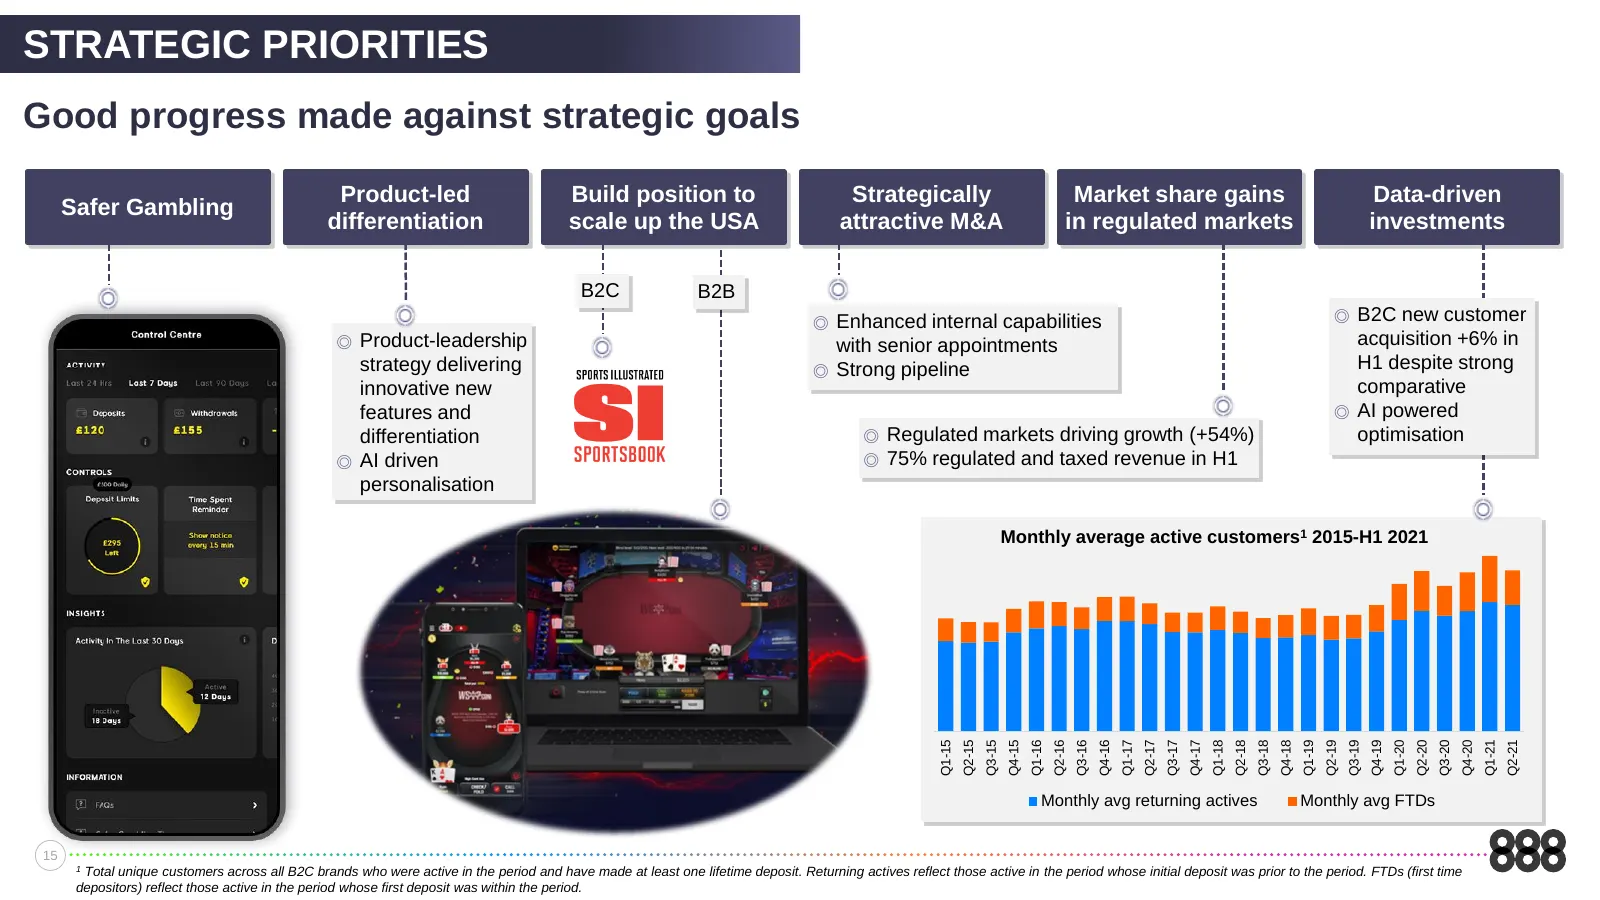
STRATEGIC PRIORITIES Good progress made against strategic goals Product-led Build position to Strategically Market share gains Data-driven Safer Gambling differentiation scale up the USA attractive M&A in regulated markets investments B2C B2B ◎ Enhanced internal capabilities ◎ B2C new customer ◎ Pro
Slide 16: US Brand Partnership
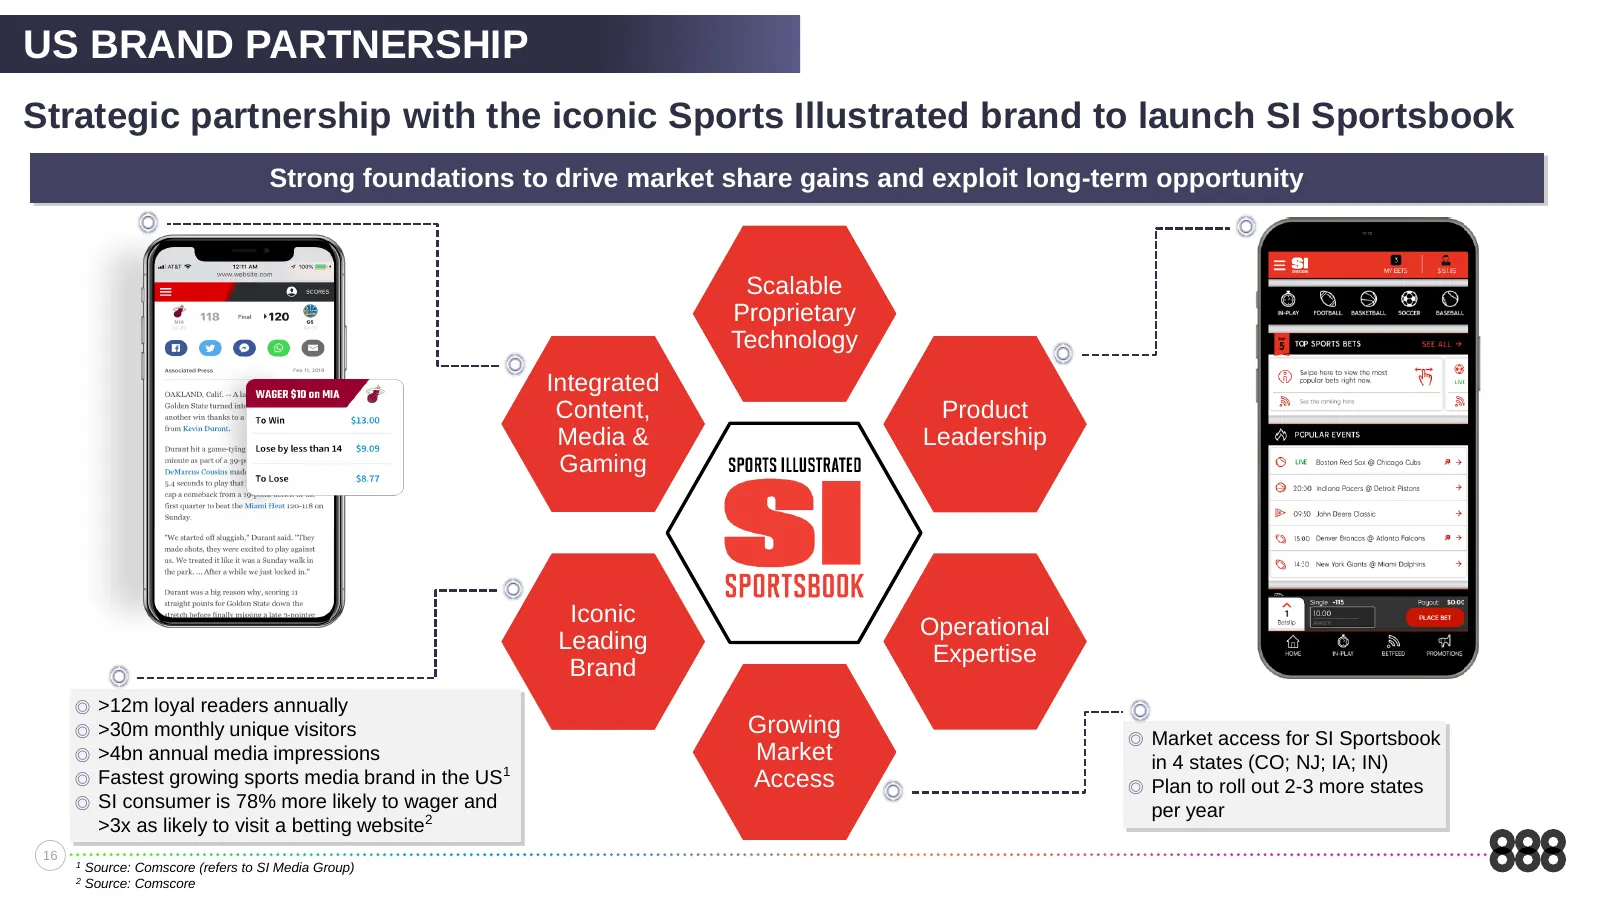
US BRAND PARTNERSHIP Strategic partnership with the iconic Sports Illustrated brand to launch SI Sportsbook Strong foundations to drive market share gains and exploit long-term opportunity Scalable Proprietary Technology Integrated Content, Product Media & Leadership Gaming Iconic Operational Leadin
Slide 17: Regulated Market Footprint
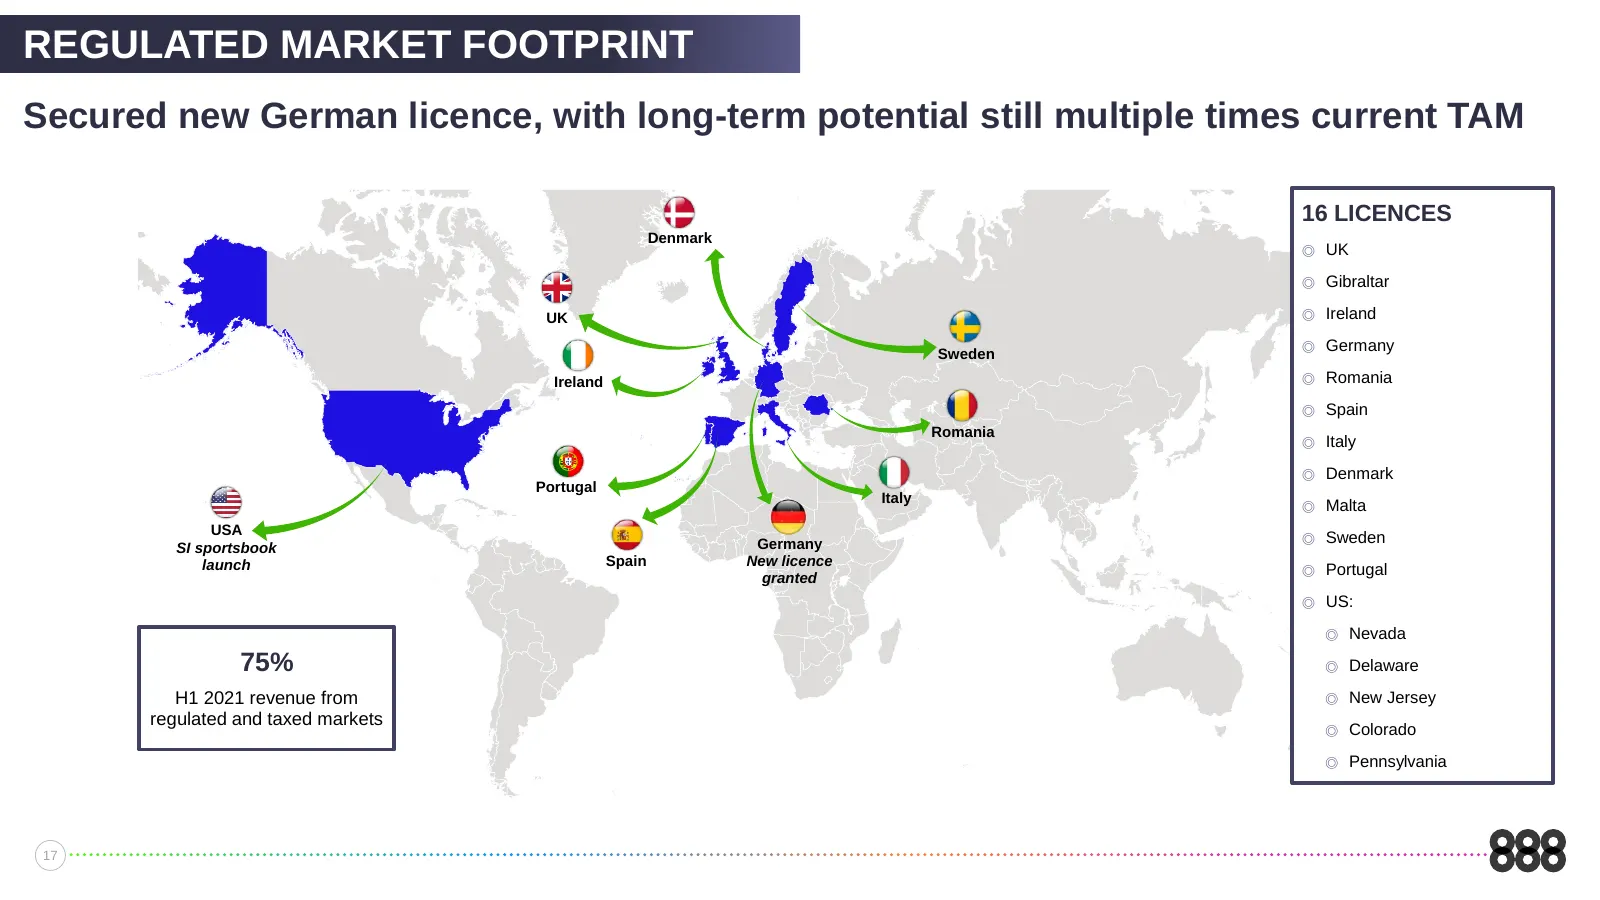
REGULATED MARKET FOOTPRINT Secured new German licence, with long-term potential still multiple times current TAM 16 LICENCES Denmark ◎ UK ◎ Gibraltar UK ◎ Ireland ◎ Germany Sweden Ireland ◎ Romania ◎ Spain Romania ◎ Italy ◎ Denmark Portugal Italy ◎ Malta USA Germany ◎ Sweden SI sportsbook launch Spa
Slide 18: Product Leadership – Betting
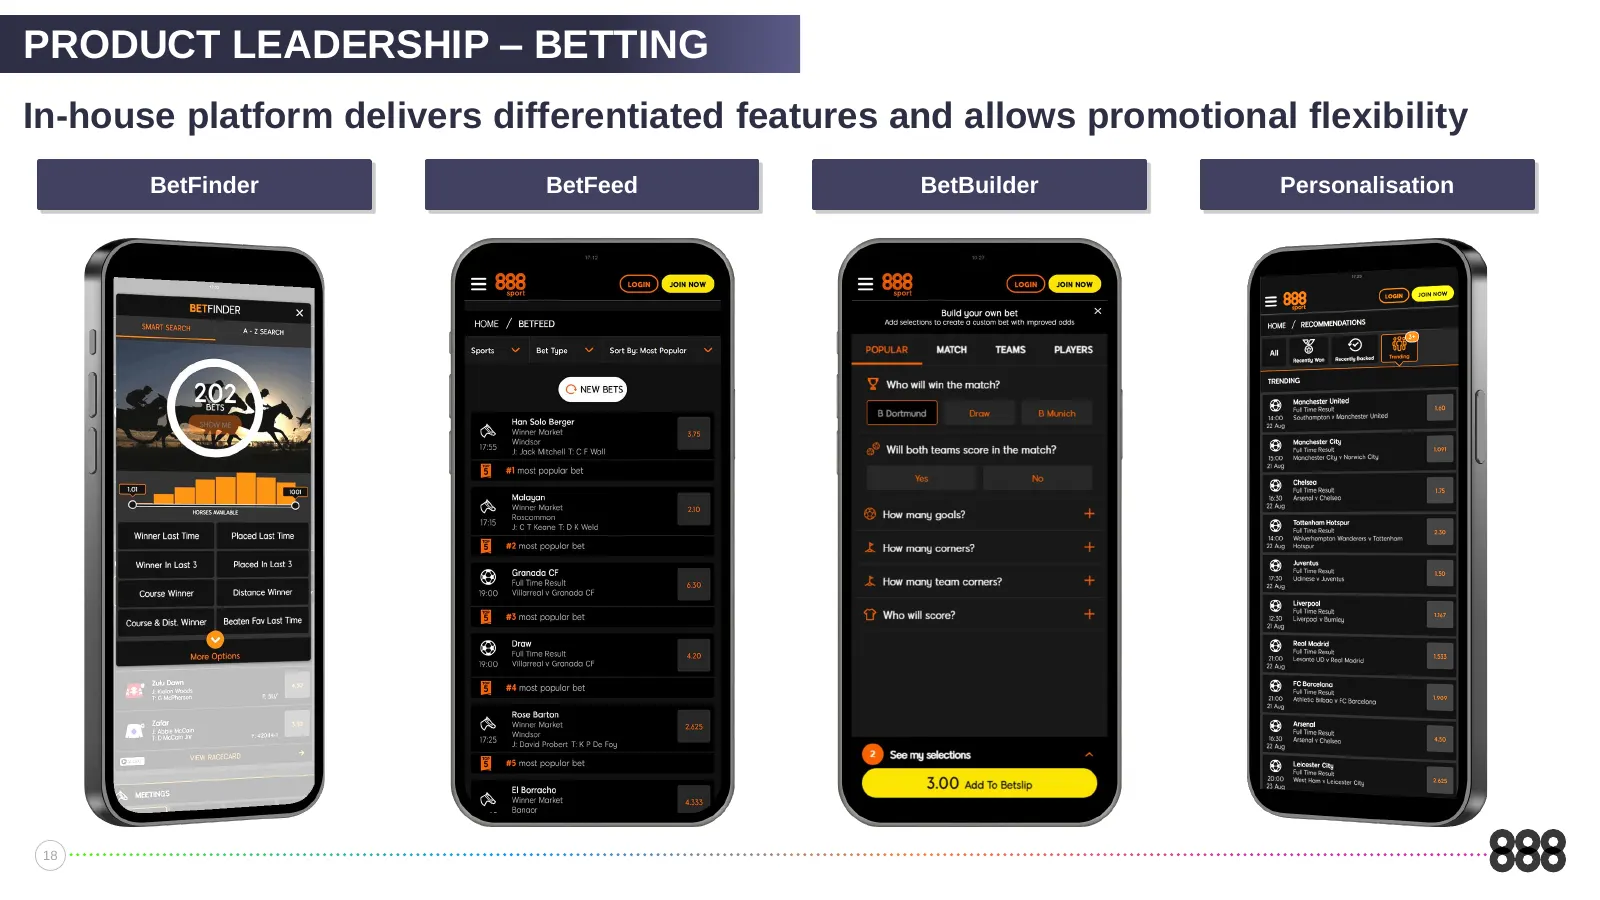
PRODUCT LEADERSHIP – BETTING In-house platform delivers differentiated features and allows promotional flexibility BetFinder BetFeed BetBuilder Personalisation 18
Slide 19: Product Leadership – Betting
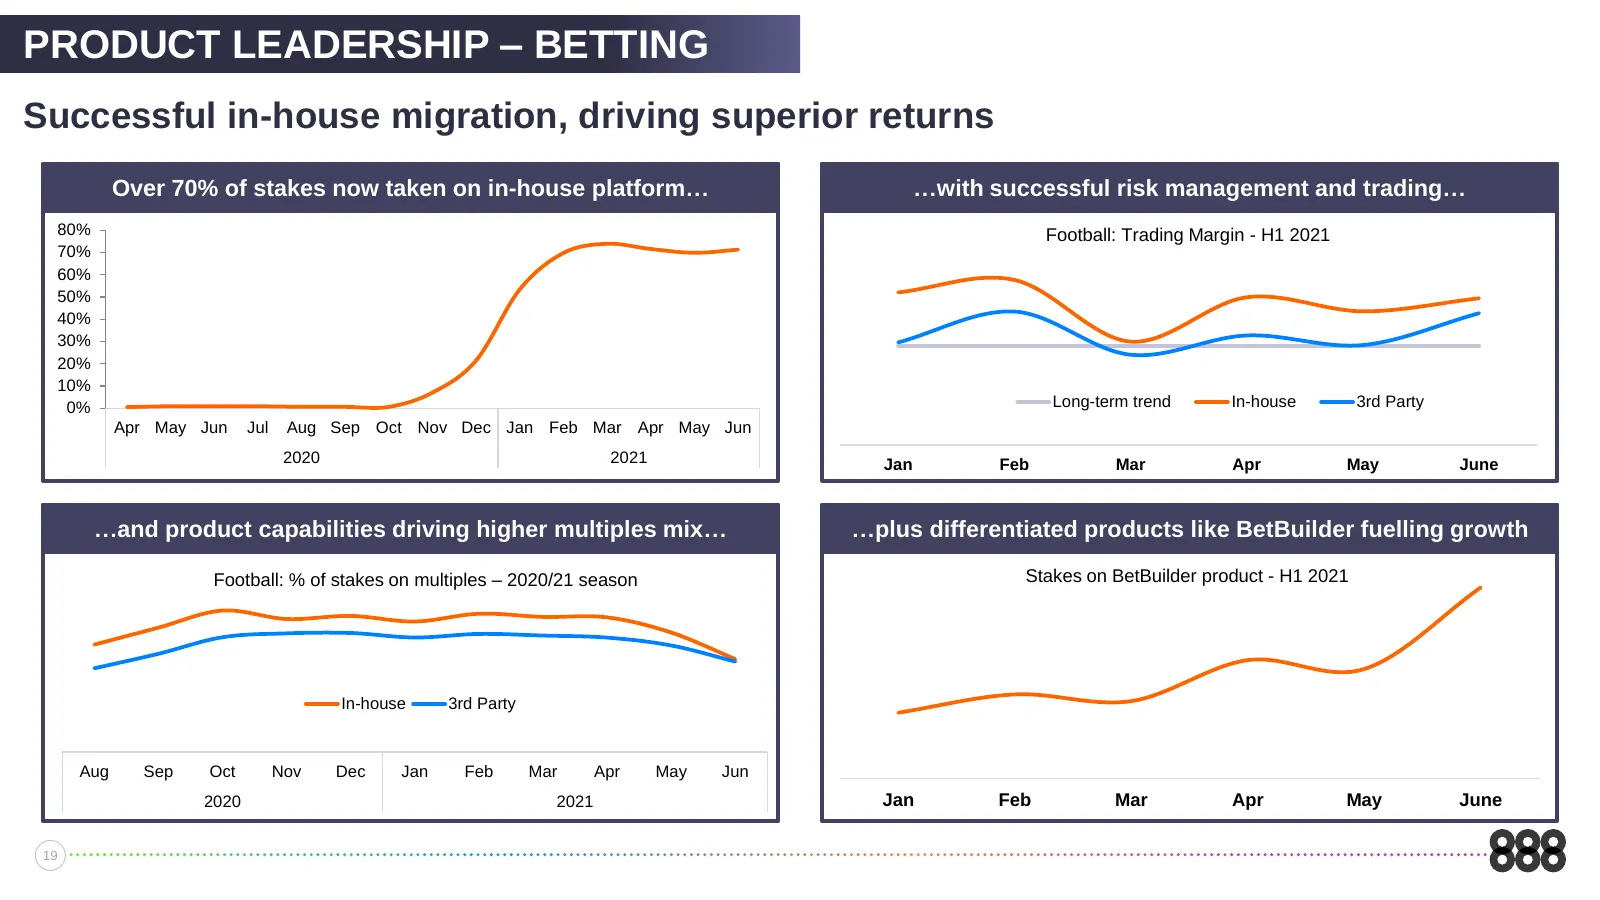
PRODUCT LEADERSHIP – BETTING Successful in-house migration, driving superior returns Over 70% of stakes now taken on in-house platform… …with successful risk management and trading… 80% Football: Trading Margin - H1 2021 70% 60% 50% 40% 30% 20% 10% 0% Long-term trend In-house 3rd Party Apr May Jun J
Slide 20: Product Leadership – Gaming
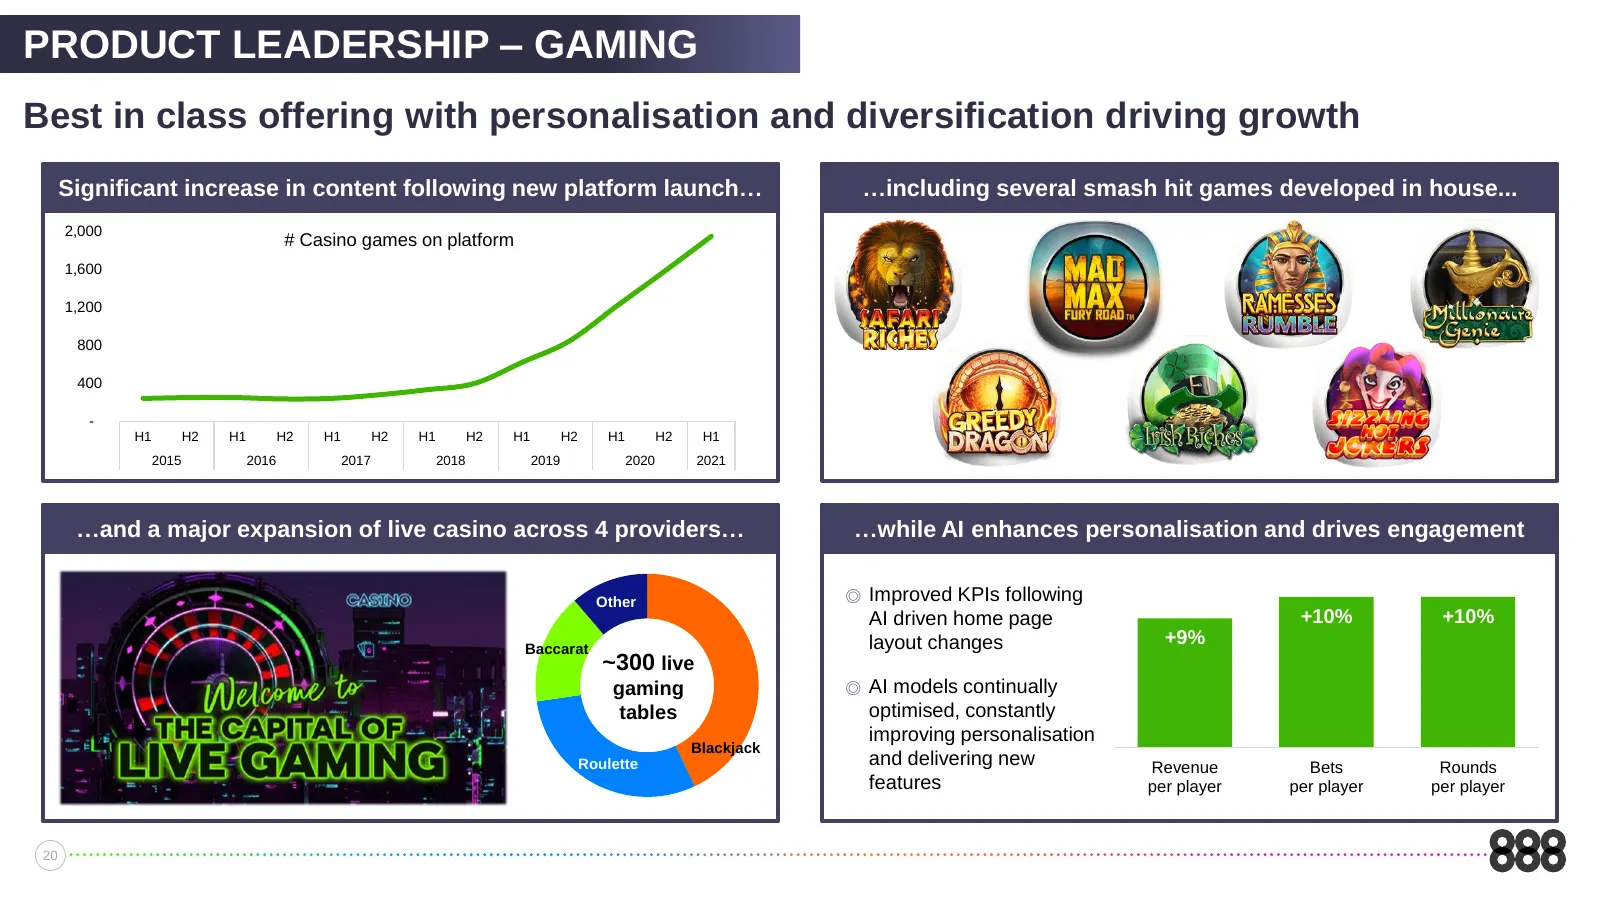
PRODUCT LEADERSHIP – GAMING Best in class offering with personalisation and diversification driving growth Significant increase in content following new platform launch… …including several smash hit games developed in house... 2,000 # Casino games on platform 1,600 1,200 800 400 - H1 H2 H1 H2 H1 H2
Slide 21: Product Leadership – Gaming
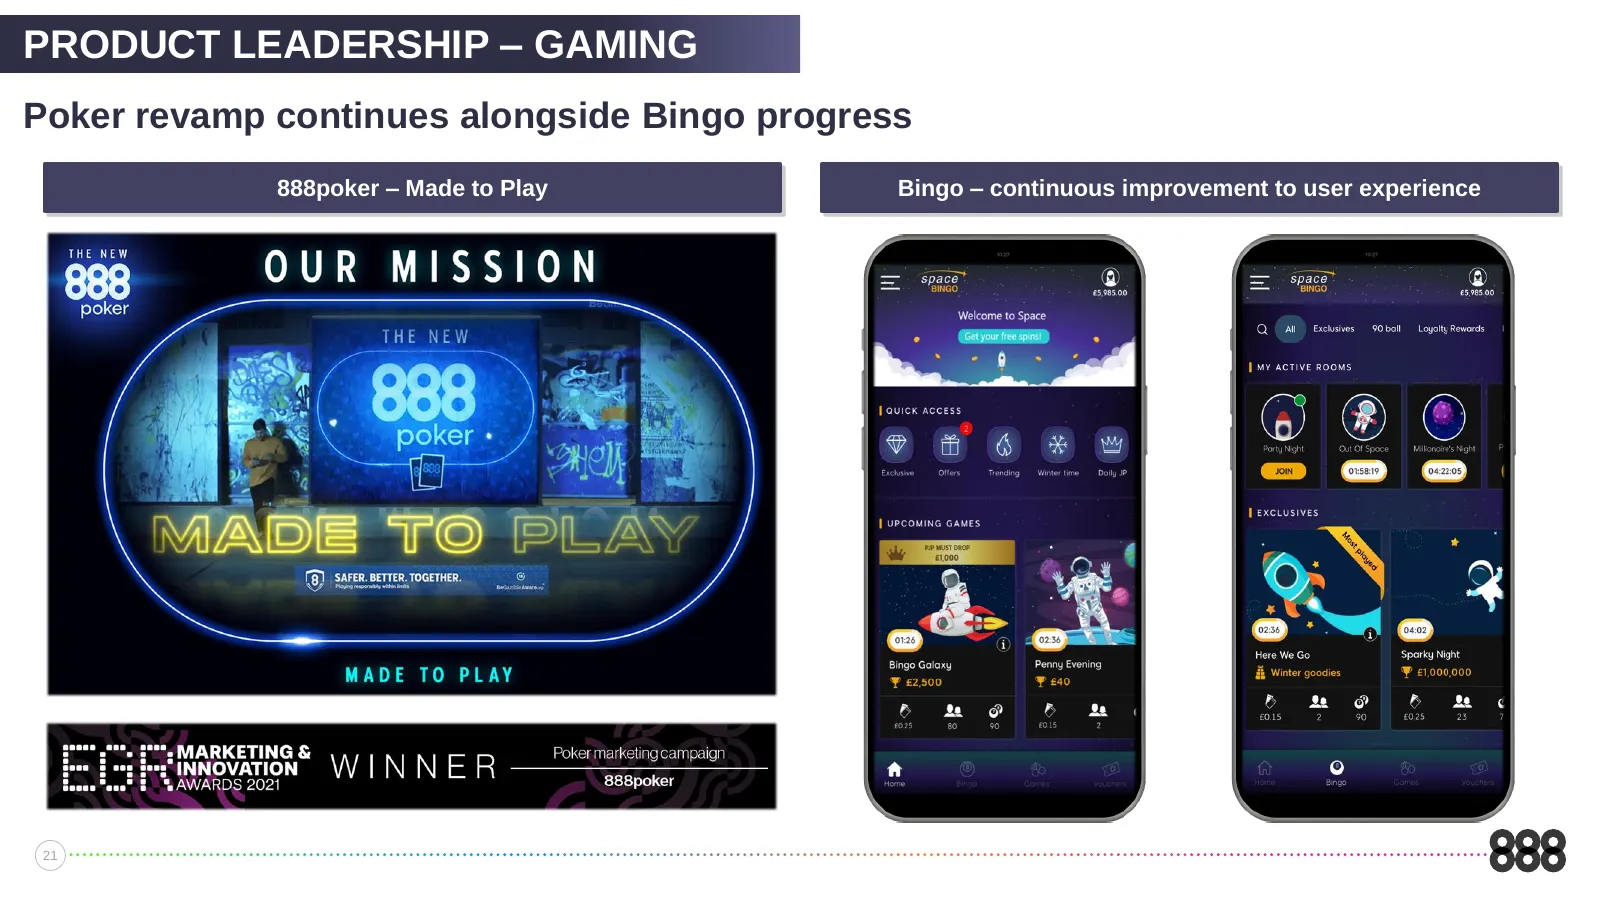
PRODUCT LEADERSHIP – GAMING Poker revamp continues alongside Bingo progress 888poker – Made to Play Bingo – continuous improvement to user experience 21
Slide 22: Summary
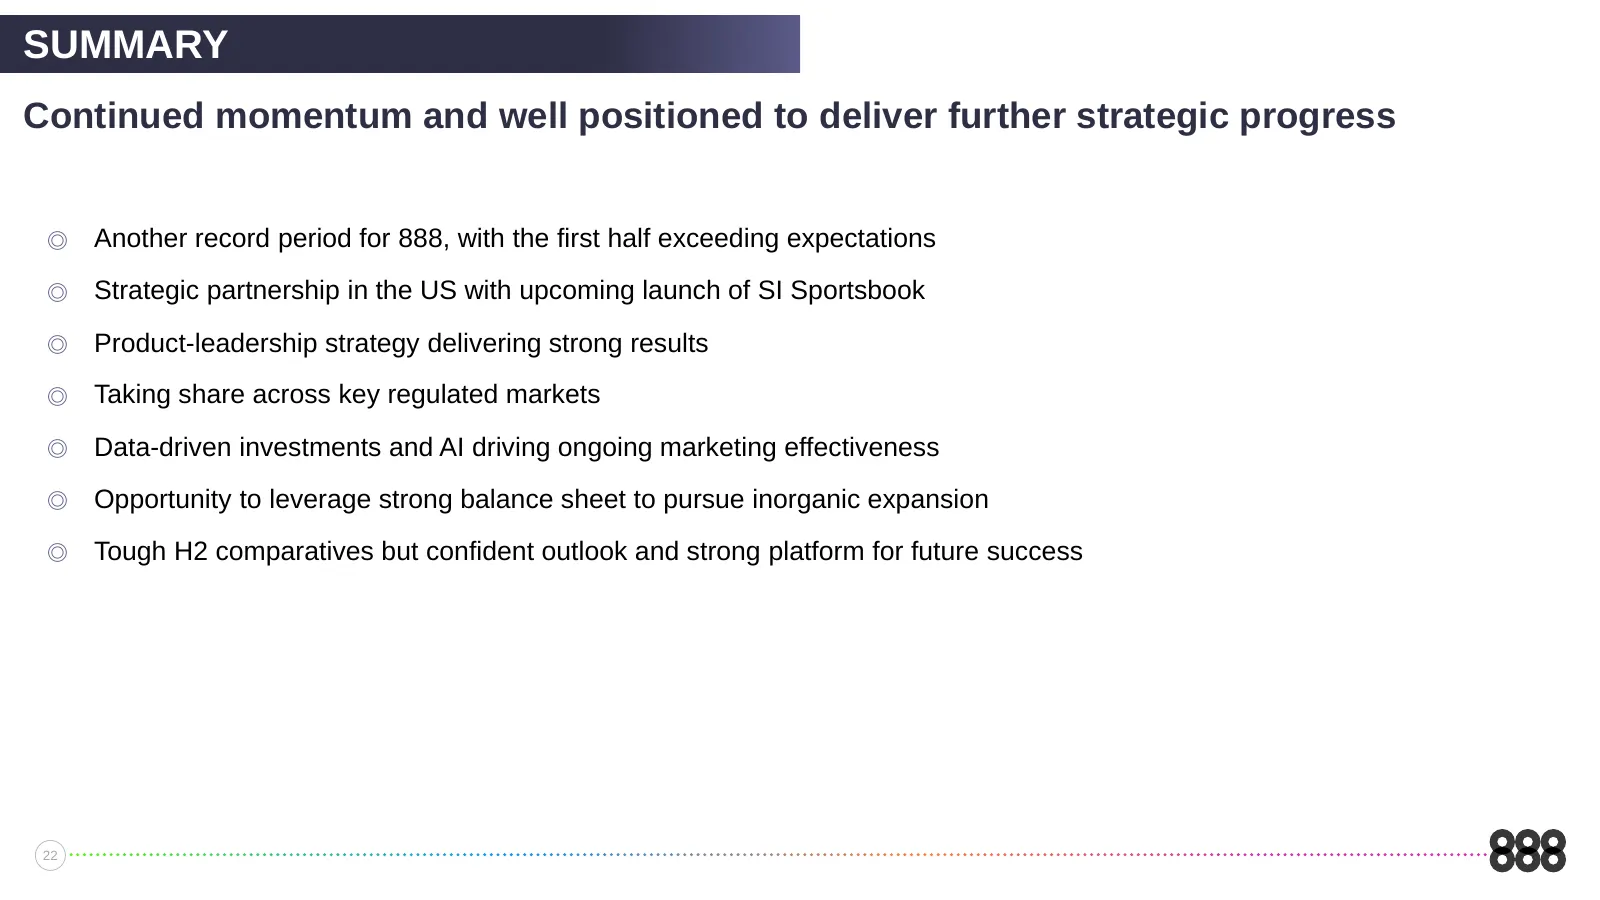
SUMMARY Continued momentum and well positioned to deliver further strategic progress ◎ Another record period for 888, with the first half exceeding expectations ◎ Strategic partnership in the US with upcoming launch of SI Sportsbook ◎ Product-leadership strategy delivering strong results ◎ Taking sh
Slide 23: Q&A
Itai Pazner, CEO Q&A Yariv Dafna, CFO Vaughan Lewis, CSO

Slide 24: Appendix
APPENDIX 24
Slide 25: Quarterly Group Revenue
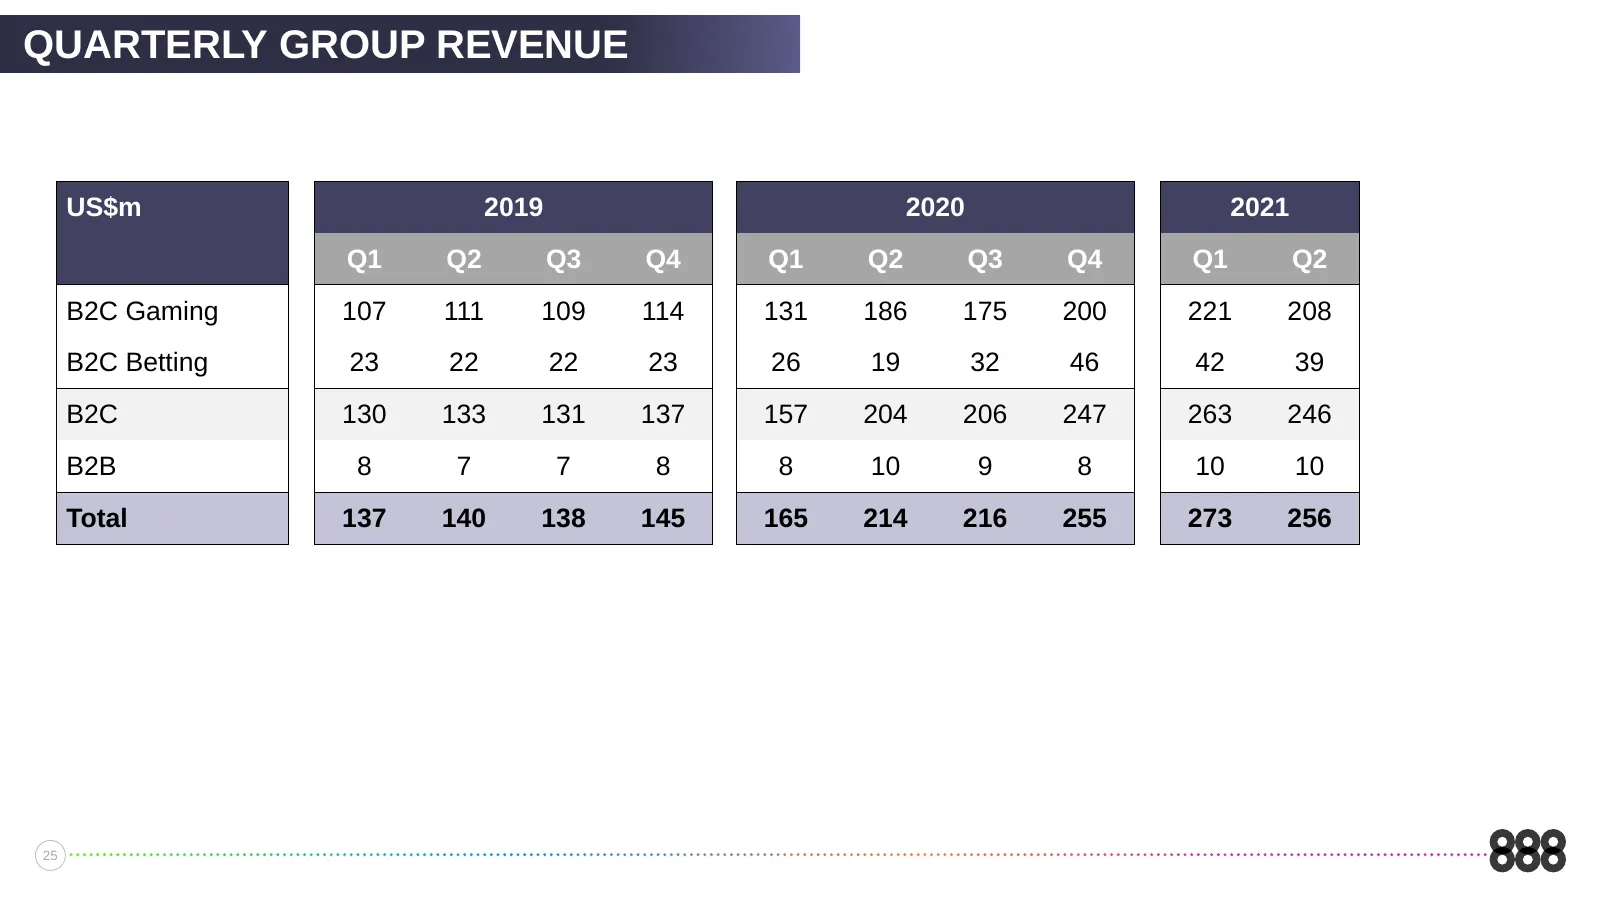
QUARTERLY GROUP REVENUE US$m 2019 2020 2021 Q1 Q2 Q3 Q4 Q1 Q2 Q3 Q4 Q1 Q2 B2C Gaming 107 111 109 114 131 186 175 200 221 208 B2C Betting 23 22 22 23 26 19 32 46 42 39 B2C 130 133 131 137 157 204 206 247 263 246 B2B 8 7 7 8 8 10 9 8 10 10 Total 137 140 138 145 165 214 216 255 273 256 25
Slide 26: Deposits / Revenue by Product
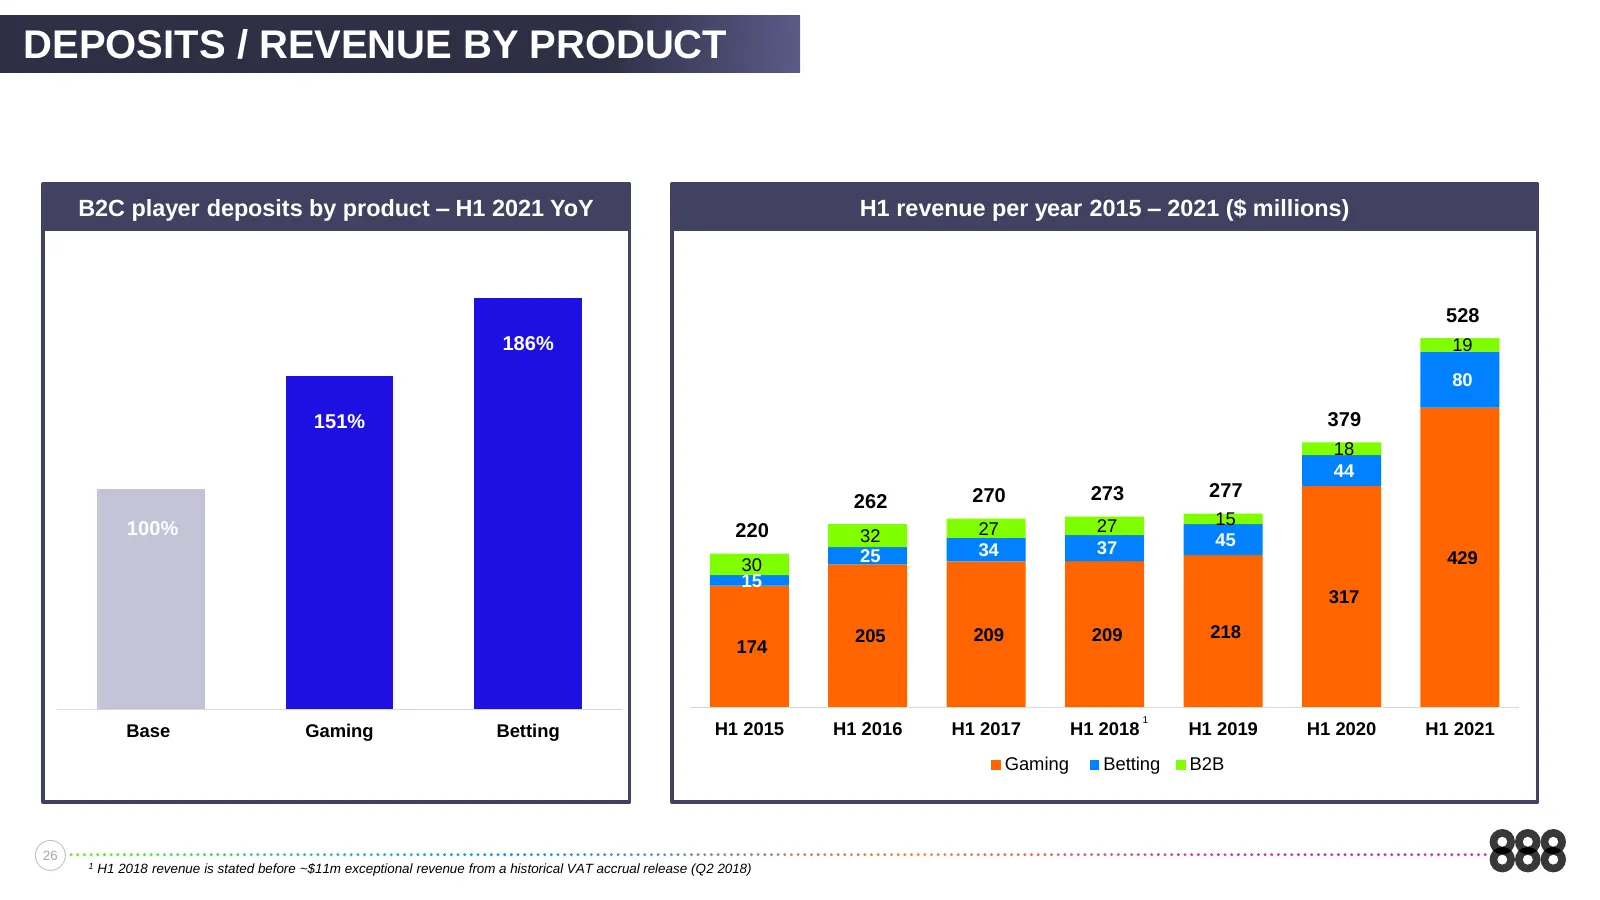
DEPOSITS / REVENUE BY PRODUCT B2C player deposits by product – H1 2021 YoY H1 revenue per year 2015 – 2021 ($ millions) 528 186% 19 80 151% 379 18 44 270 273 277 262 27 15 100% 220 32 27 37 45 25 34 429 30 15 317 205 209 209 218 174 1 Base Gaming Betting H1 2015 H1 2016 H1 2017 H1 2018 H1 2019 H1 20
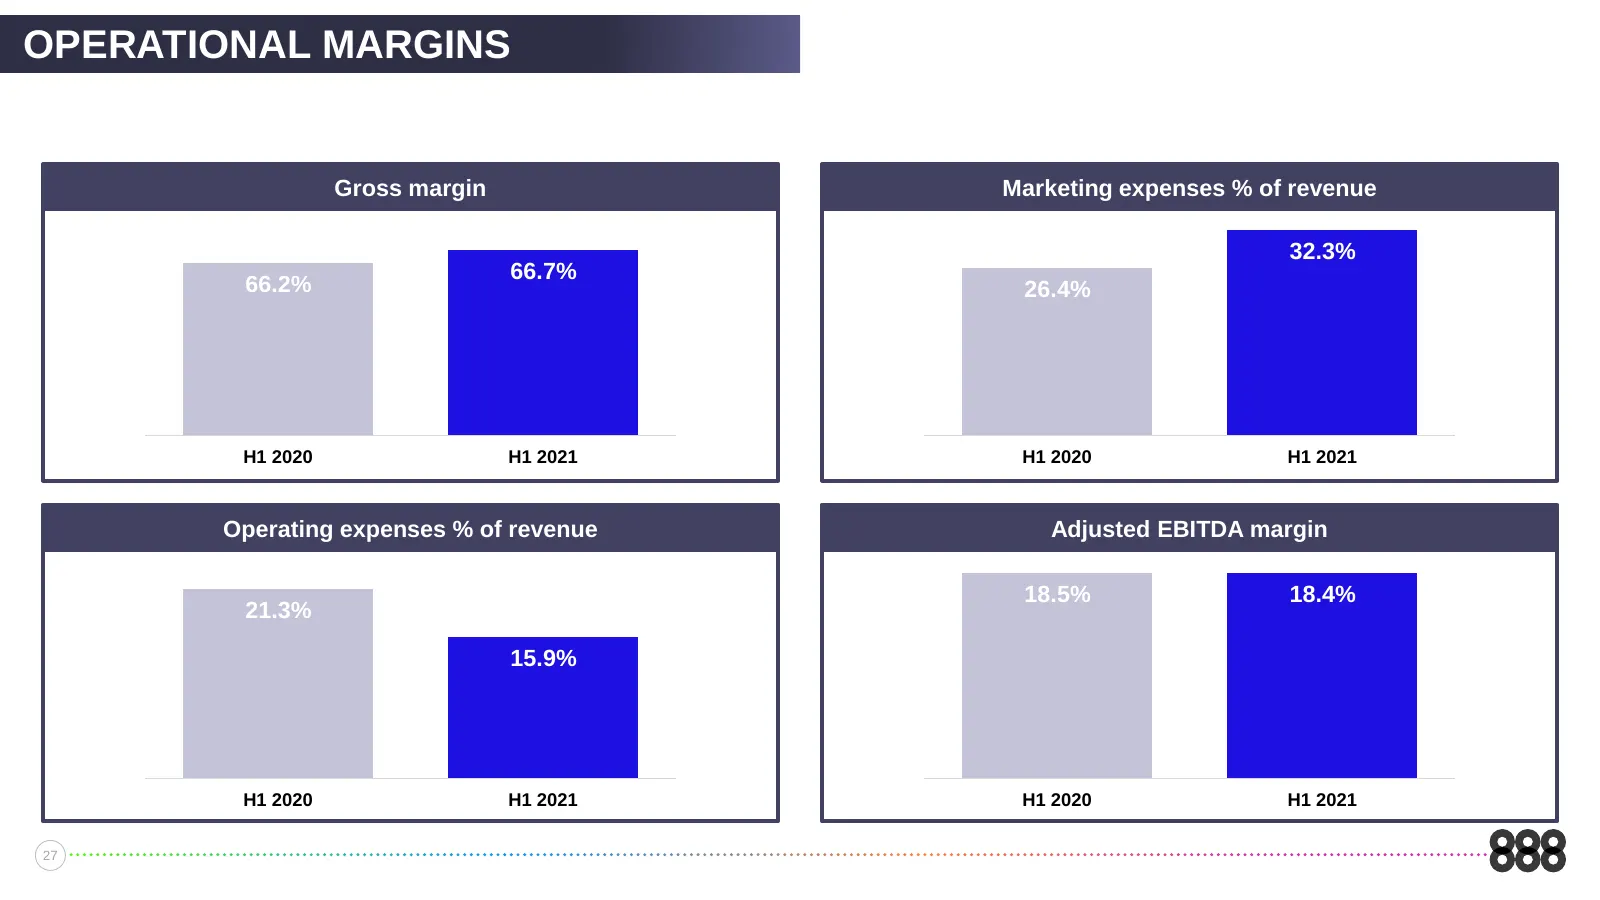
Slide 27: Operational Margins
OPERATIONAL MARGINS Gross margin Marketing expenses % of revenue 32.3% 66.7% 66.2% 26.4% H1 2020 H1 2021 H1 2020 H1 2021 Operating expenses % of revenue Adjusted EBITDA margin 18.5% 18.4% 21.3% 15.9% H1 2020 H1 2021 H1 2020 H1 2021 27
Source: company website
More decks from Evoke plc
 H1 2026 Earnings Presentation15 slides · Aug 12, 2026
 H1 2025 Earnings Presentation17 slides · Aug 13, 2025
 H1 2025 Earnings Presentation29 slides · Aug 13, 2025
 FY2024 Earnings Presentation33 slides · Mar 26, 2025
 H1 2024 Earnings Presentation25 slides · Aug 15, 2024
 H1 2024 Earnings Presentation10 slides · Jul 18, 2024